Priorities for Progress
Update of Public Data &
Post-COVID Check-In on Community Priorities
In March 2020, as the world braced for a shutdown, our team was actively collecting data for Priorities for Progress: Assets and Aspirations in Southern Indiana. This initial study, funded by the Lilly Endowment Inc.'s seventh Giving Indiana Funds for Tomorrow (GIFT VII) initiative, was completed, but we recognized that low- to moderate-income households were underrepresented in our survey research. The shut down had cut short our survey events which were designed to recruit in lower income parts of our community. At that time we did work with nonprofit partners to get surveys to low income families in food pick-up locations at Hope Southern Indiana and the Center for Lay Ministries. That improved representation, but in the wake of the pandemic, we knew that same population was likely experiencing new or different challenges than they were at the time of our 2020 survey. To understand the impacts of the COVID19 pandemic, the Community Foundation of Southern Indiana used a portion of their GIFT VIII funds for an update with an intentional focus on talking with low to moderate income households.
This report is not a comprehensive community assessment. Instead, it offers an important check-in on the well-being of our community postpandemic, highlighting the key assets and opportunities that matter most to working families in Clark and Floyd counties. The Community Foundation of Southern Indiana requested this data update and check-in on priorities at the same time that they commissioned an in-depth study of income and housing in the area. While this update on priorities is a distinct piece of the work, given the priority given to the cost of housing in listening sessions, gallery walks, and on the surveys, this update serves as a companion to Housing: The Affordability Challenge in a Growing Region, and places housing in the context of other community priorities.
experiencing active participation. We recruited households earning $75,000 or less for these events. Attendees received lunch or dinner and a $40 cash incentive for their two-hour commitment. These sessions were promoted through our nonprofit networks, social media, and local library bulletin boards. All participants completed demographic surveys and an informed consent process. The insights gleaned from these sessions helped us identify potential priorities across various areas previously covered in the Priorities for Progress report, including:
• Aging Services
• Basic Needs (food and housing)
• Community Building
• Economic and Financial Well-Being
• Education and Workforce Development
• Health and Wellness
• Youth Development
After completing the demographic survey, participants worked in pairs or groups to complete community asset maps covering all seven forms of community capital noted as vital to community and economic development and resilience (Flora, Flora, Gasteyer 2016). The group discussed identified assets, opportunities, challenges, and “big ideas” for transformational change.
To ensure a broad range of voices were heard, we hosted eight listening sessions, with five
We organized data gallery walks at the two main libraries. Large posters displayed data visualizations and maps of public quantitative data related to the topics covered in listening sessions. After reviewing the data, participants were given lists of potential initiatives for housing, education, and youth development (the “Big Ideas” generated in listening sessions). They used three sets of sticker dots two sets of three and one set of five to indicate their preferences. The sets of three stickers allowed participants to identify their three broad areas of highest priority and three social issues of greatest concern from a list (Figure 2). The set of five stickers was used to select top
priorities from the specific housing, education, and youth development initiatives as potential leverage points.
Findings from the listening sessions informed modifications to our 2020 community priorities survey for the 2025 update. We incorporated specific ideas generated during these sessions, allowing residents to consider these ideas within our existing lists of issues and service areas as they selected their top priorities.
We distributed 494 community surveys to a sample of residents designed to be proportionally representative of each census tract in the twocounty region. Respondents received $20 for completing the 20-minute survey. We sent an initial recruitment post card and four follow-up reminders. We received 47 responses, a 9.5% response rate. While this is considered low for scientific purposes, it aligns with or even exceeds current trends for similar surveys. Still, this is a small sample and while it includes responses from nine different zip codes, it remains insufficiently representative of the region.
The research team is working to identify best strategies to have stronger representative responses for future projects. Our listening sessions achieved strong representation from low- to moderateincome residents. The gallery walks included a mix of backgrounds, but we do not have demographic data for that group. As is common, surveys largely represent individuals with higher income and education levels whether one recruits by email, social media, phone, or mail. We hoped our representative sampling strategy that sent direct
mail to people in every census tract across the twocounty region and the $20 incentive would increase representation of lower-income residents over the snowball and convenience sampling we did in 2020, but it did not have the desired effect.
In our experience, working in partnership with our local service providers helps but does not solve this problem. To increase overall returns and solicit more response from low- to moderate-income residents in the future, we will return to email, ads in the paper, and a partnered strategy with area providers to host events where we can recruit lowto moderate-income participation.
The priorities highlighted in this report for housing, education, workforce development, and youth development are a synthesis of gallery walk participant votes, frequently mentioned concerns from the listening sessions, and survey findings. Priorities outlined in other sections of this report reflect survey results. Priority Opportunities draw from these sources as well as the public data updates.
The report will begin with broad priorities and top issues of greatest concern. We will follow this with a demographic overview providing basic data on the size and composition of the community. With these priorities and the overview of the community composition in mind, we will present data and brief discussion of each assessed priority area, triangulating public data, with data collected from listening sessions, gallery walks, and the update survey.
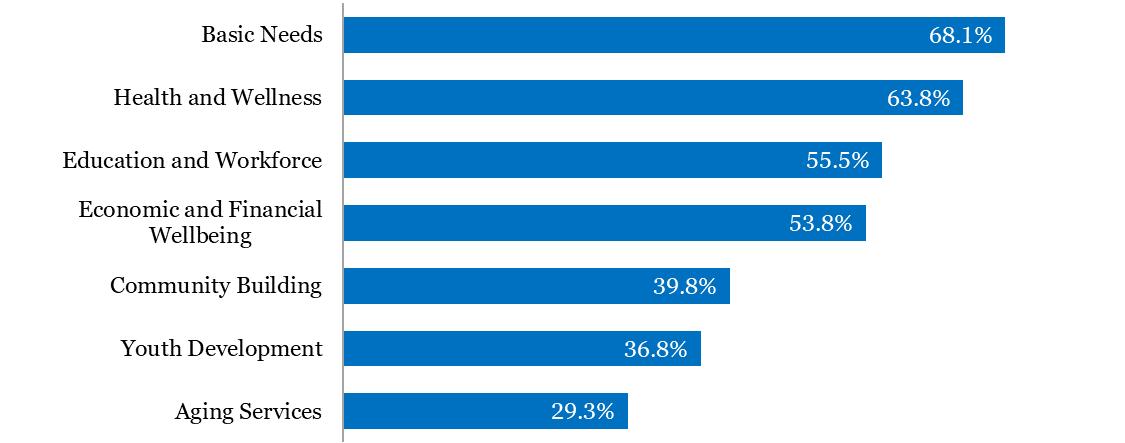

The COVID-19 pandemic vividly exposed economic inequality across the United States, highlighting how it exacerbates vulnerability to disaster. It clarified how inequality shapes health disparities, with Black, Indigenous, and People of Color (BIPOC) communities experiencing disproportionate losses in life, employment, income, and education. The widespread impact of income inequality became undeniable, leading participants in our listening sessions and gallery walks to accurately pinpoint health and economic well-being as central to all other priorities.
Indeed, Health and Wellness and Economic and Financial Well-being both received over 50% of participants' votes as top priorities (Figure 1). Attendees consistently stressed that these two areas are foundational, believing that progress here would drive improvements across all other domains. Our survey respondents mirrored these priorities, ranking basic needs, health and wellness, and education and workforce development among the top three, with economic well-being close behind.
FIGURE 1: OVERALL PRIORITIES
Removed or changed from the 2020 Survey: subsumed suicide under mental health and illness; changed homelessness to housing.
More than a third of both participants and survey respondents prioritized community building and youth development. While aging services was the least frequently selected broad priority, we anticipate its prominence will rise in the next five years, as more Baby Boomers require these services, and their Gen X and Millennial children face the challenge of securing and paying for them. This is speculative, but certainly worth monitoring.
We cannot make direct statistical comparisons between our 2020 and 2024 survey data due to differences in sample size, recruitment methods, and data collection. However, these distinct datasets still offer valuable insights. The 2020 respondents generally reported high income and
educational attainment. In contrast, our 2024 efforts deliberately sought input through listening sessions with households earning less than $75,000, aiming to capture their post-pandemic priorities and concerns. Still our survey drew responses from higher income households.
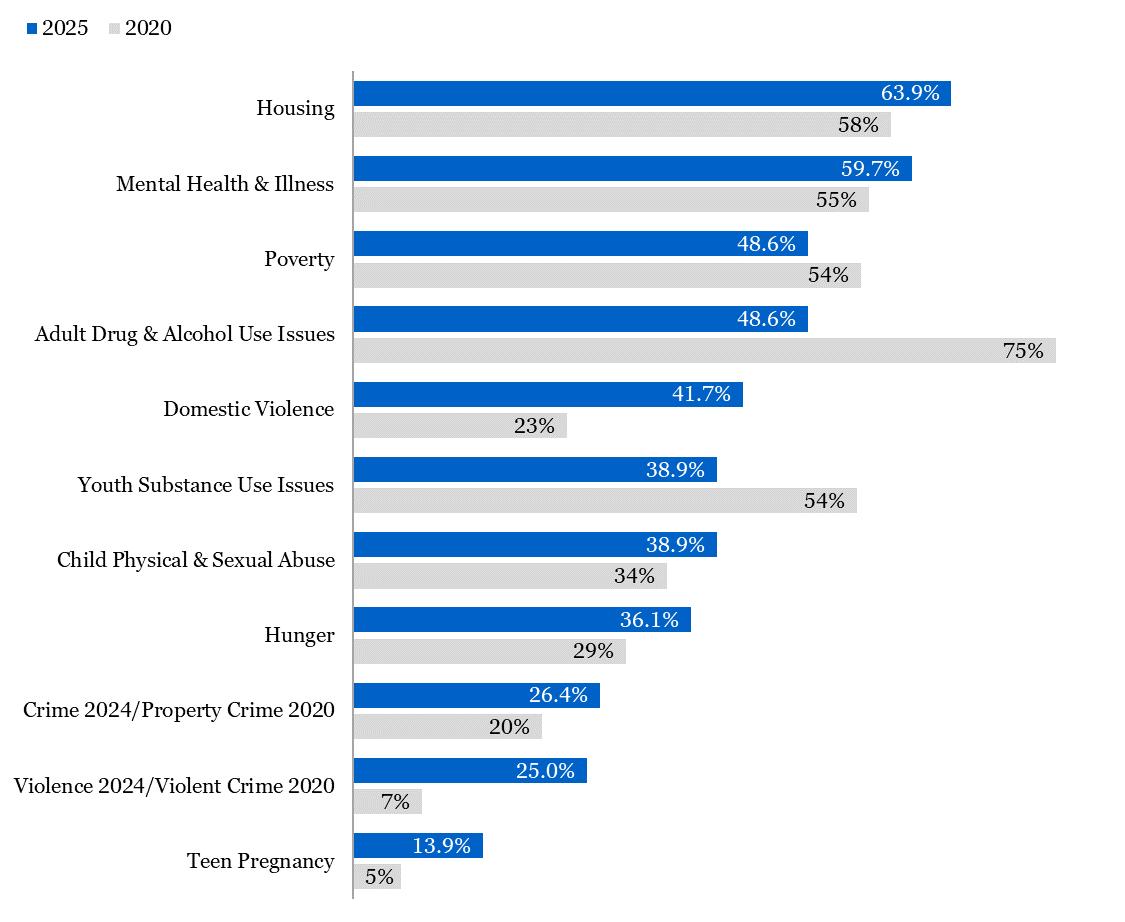
Here are some notable shifts and observations (Figure 2):
• Housing and Hunger: The increased concern about housing in 2024 likely reflects recent spikes in southern Indiana housing prices (for more, see Housing: The Affordability Challenge in a Growing Region). Unlike 2020, where income did not seem to
drive perceptions of hunger, the dramatic rise in grocery inflation since the pandemic significantly impacted low-income households, likely leading to far stronger concern about hunger in 2024.
• Teen Pregnancy: Concerns about teen pregnancy were notably higher in the 2024 sample. This could indicate a perception that youth are struggling more with this issue postpandemic, or it may reflect worries about inflation and how rising costs magnify the challenges of an unplanned early pregnancy. For lower-income families, teen pregnancy is both more common and a significant determinant of life outcomes.
• Mental Health: Mental health and illness remained a concern for over half of respondents in both years, with an even higher rate of identification as a top concern in 2024.
• Poverty: The proportion of respondents identifying poverty as a top concern declined from 2020 to 2024. This might reflect wage increases at the lower end of the income distribution, partly driven by pandemic demand
for essential workers. While over half of participants in our listening sessions and gallery walks identified poverty as a top priority, a smaller proportion selected it as such in the surveys.
• Violence and Abuse: Local providers reported increases in domestic abuse, child abuse and neglect, and violence during the pandemic. Southern Indiana has also seen a recent increase in gun violence. Both are reflected in a higher proportion of respondents selecting these as priority concerns in 2024 compared to 2020.
• Substance Use: The proportion of respondents identifying substance use issues (adult or youth) as top priorities declined from 2020 to 2024. This could indicate progress in this area due to robust recovery supports and prevention programs. However, it might also simply reflect that the pandemic and postpandemic period have elevated other issues, such as health, financial security, and education, as higher priorities issues that could also be underlying drivers of substance use challenges in our region.
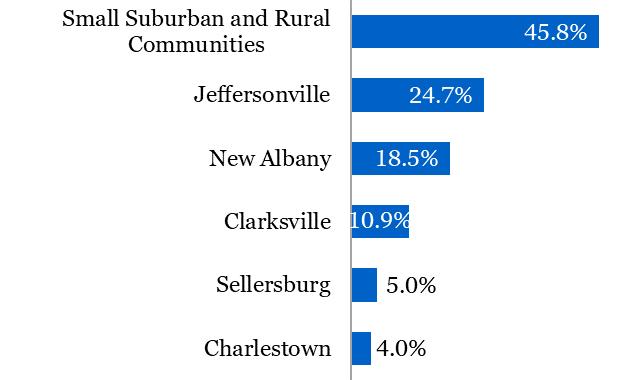
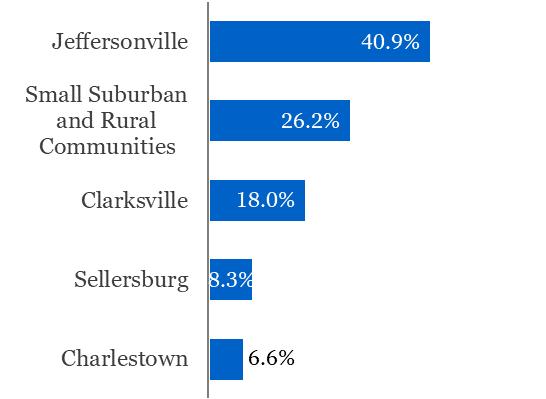
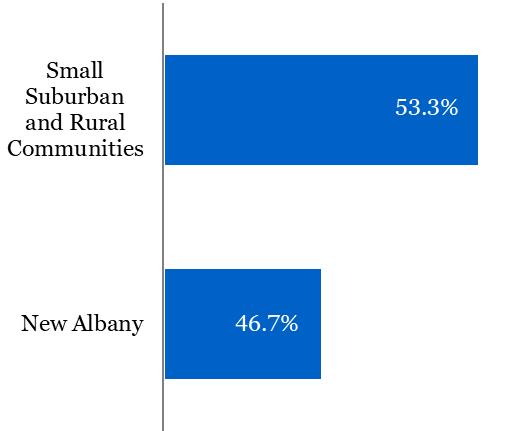
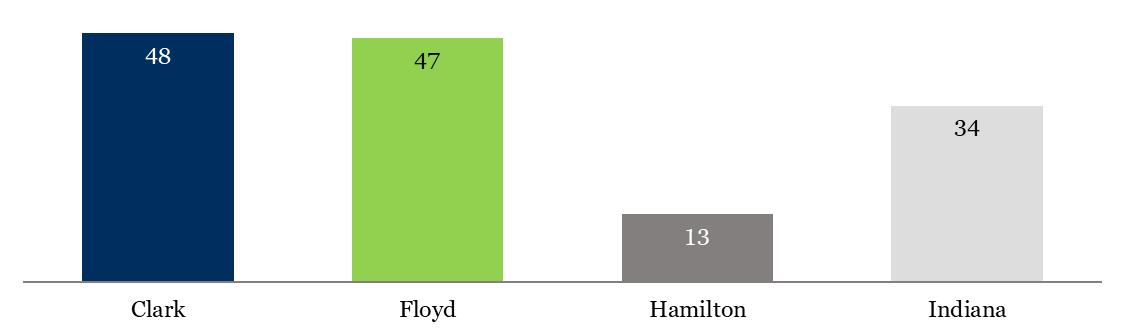
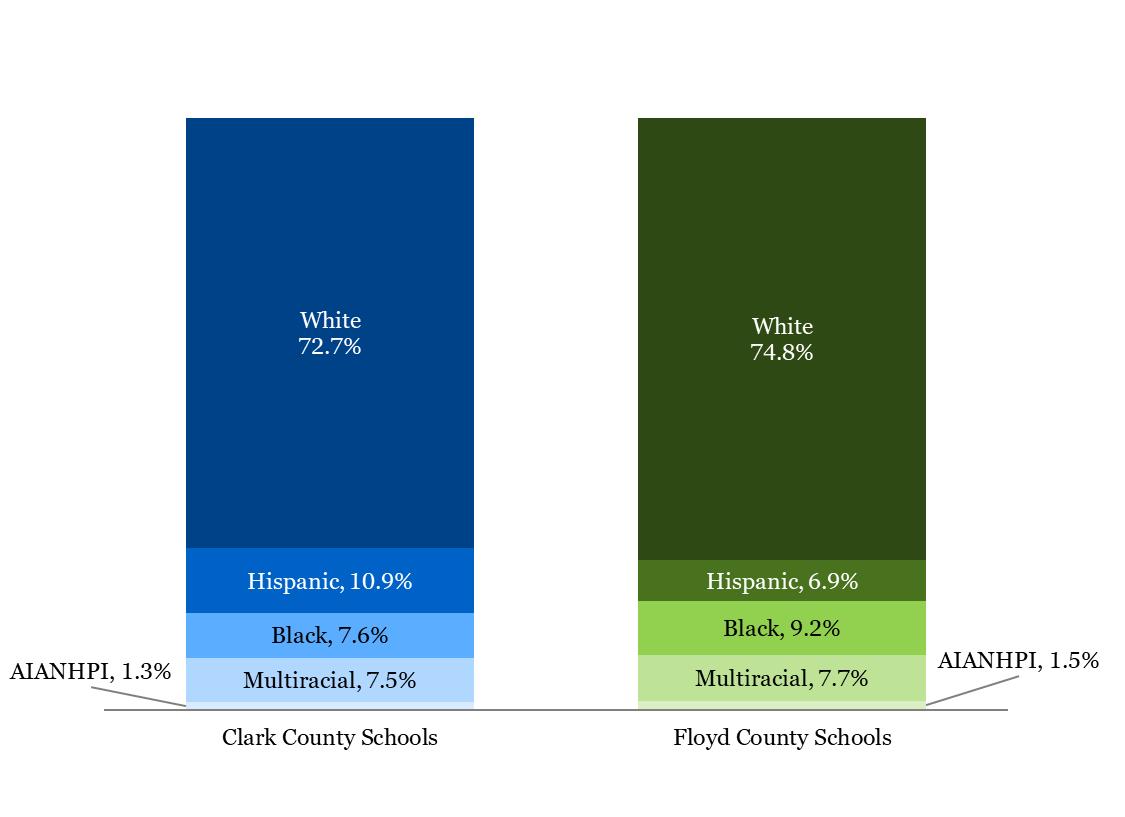
The two-county region remains split between residents of the three major population centers and those living in smaller suburban and rural communities (Figures 3-4). Charlestown and Sellersburg are both growing. Clark County is 83.3% White while Floyd County is 86.9% White.
FIGURE 3: POPULATION DISTRIBUTION
FIGURE 4: POPULATION
BY COUNTY, 2019-2023
Source: United States Census Bureau. 2023. “Table DP05: ACS Demographic and Housing Estimates.” American Community Survey 5-Year Estimates Subject Tables, 2018-2023. Retrieved December 2024.
FIGURE 5: RACE AND ETHNICITY
AIAHPIM includes American Indiana & Alaska Native, Asian, Hawaiian or other Pacific Islander, and Multiracial. Asians are the largest group in the composite. Source: United States Census Bureau. 2024. “Table DP05: ACS Demographic and Housing Estimates.” American Community Survey 5-Year Estimates Subject Tables, 2018-2023. Retrieved December 2024.
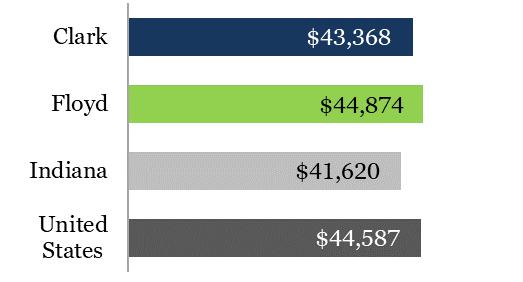
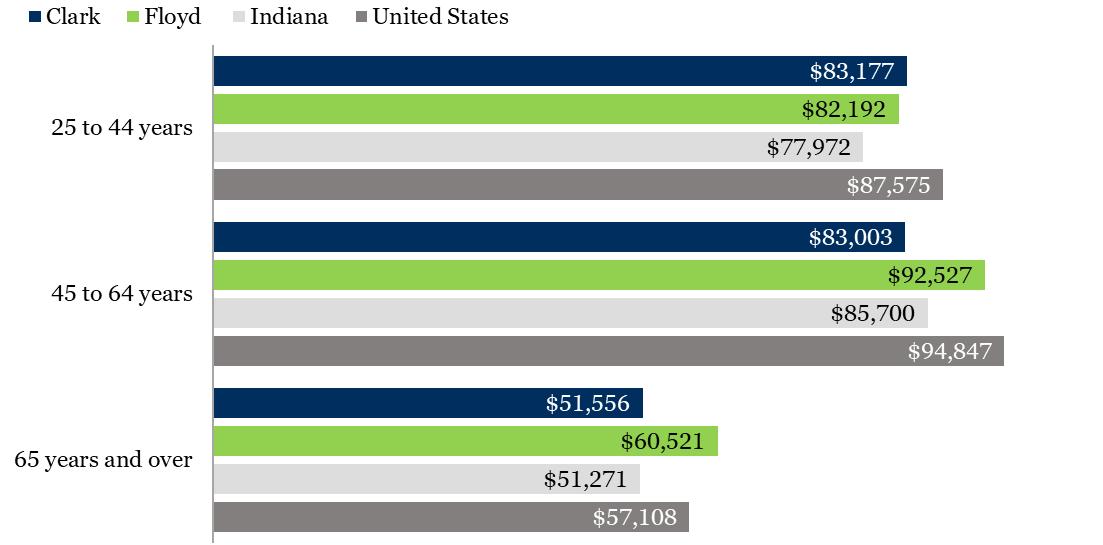
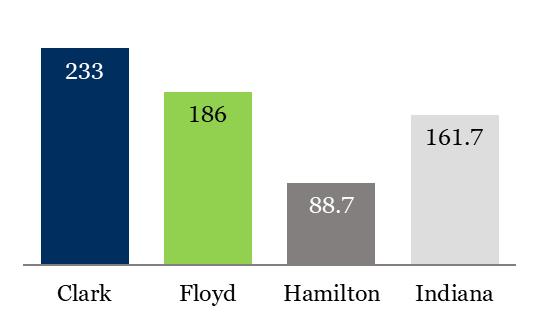
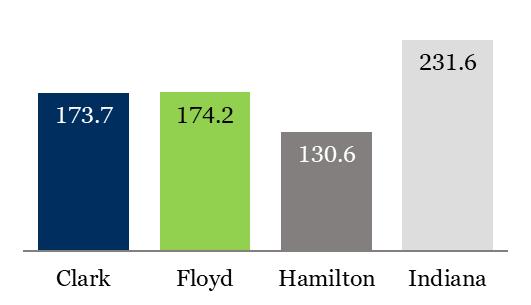
Clark and Floyd counties have experienced growth in median household incomes. This reflects growth at the higher end of the distribution. During the pandemic, wages for some low-end retail and service sector jobs also increased, offering some relief to low-income households. Figures 6-19 update public figures on income, poverty and unemployment.
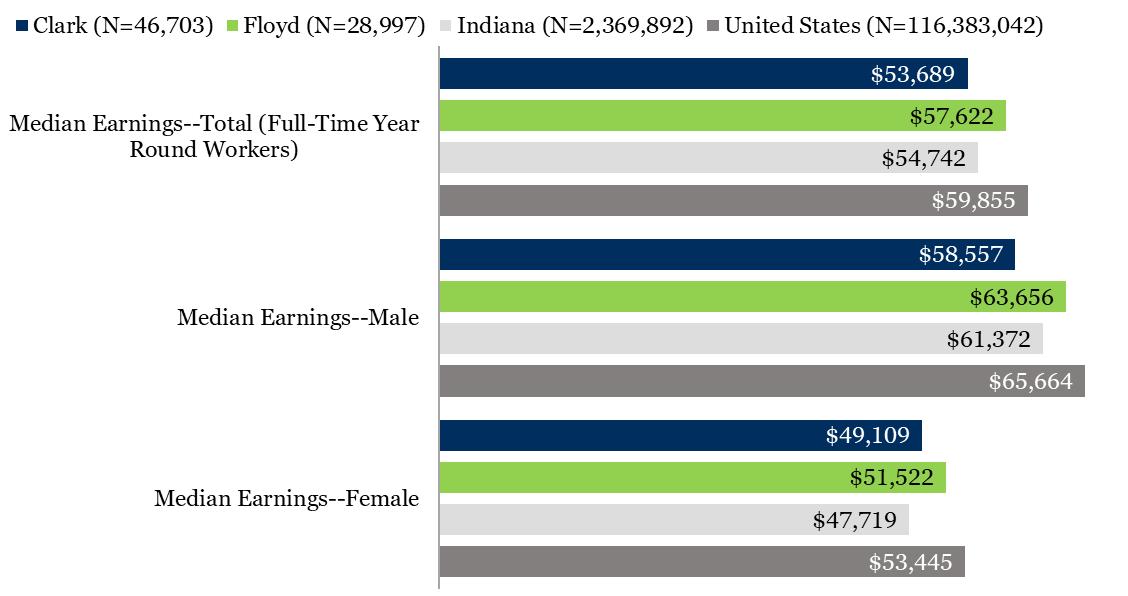
FIGURE 6: MEDIAN EARNINGS
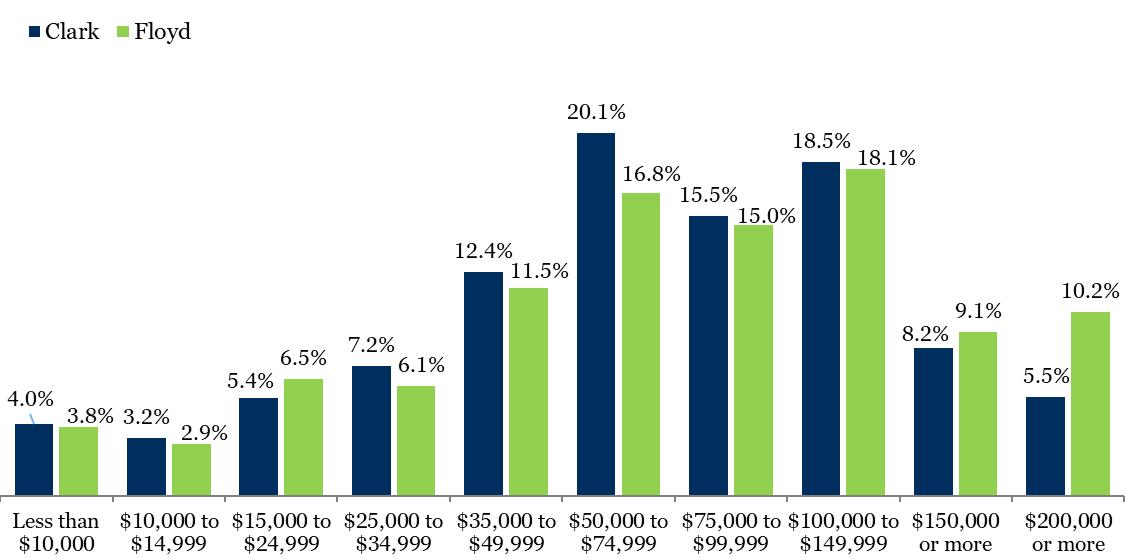
Floyd County continues to exhibit a higher degree of income inequality, with a larger proportion of its population in both the top and bottom income brackets. Clark County is increasingly attracting high-income residents to its new suburban developments and luxury (Continued on page 20)
8: MEDIAN INDIVIDUAL EARNINGS AND MEDIAN EARNINGS BY SEX FOR FULL-TIME YEAR ROUND WORKERS
FIGURE
Source: United States Census Bureau. 2024. "Table S2001: Earnings in the Past 12 Months.” American Community Survey 5-Year Estimates, 2019-2023. Retrieved December, 2024.
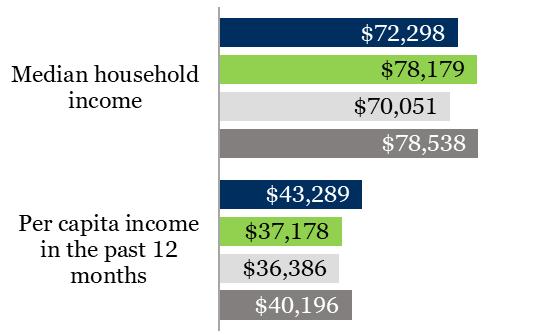
FIGURE 7: MEDIAN HOUSEHOLD & PER CAPITA INCOMES
Figures 7 & 8
Source: United States Census Bureau. 2024. "Table S1903: Median Income in the Past 12 Months." American Community Survey 5Year Estimates, 2019-2023. Retrieved December, 2024. United States Census Bureau. 2024. ___“Table B1903: Per Capita Income in the Past 12 Months (in 2023 Inflation-Adjusted Dollars).”
Source: United States Census Bureau. 2024. "Table S1901: Income in the Past 12 Months (in 2023 Inflation-Adjusted Dollars) ." American Community Survey 5-Year Estimates, 2019-2023. Retrieved December, 2024; and United States Census Bureau. 2023.
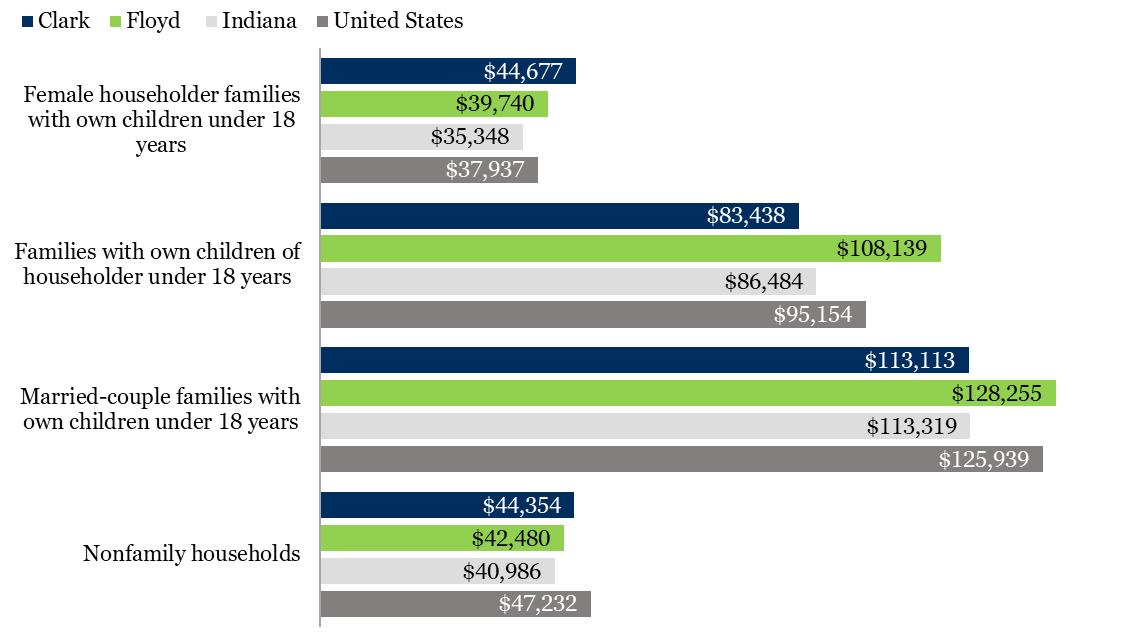
10: MEDIAN HOUSEHOLD INCOME BY FAMILY TYPE
Source: United States Census Bureau. 2023. "Table S1903: Median Income in the Past 12 Months." American Community Survey 5-Year Estimates 2019-2023. Retrieved December, 2024.
FIGURE
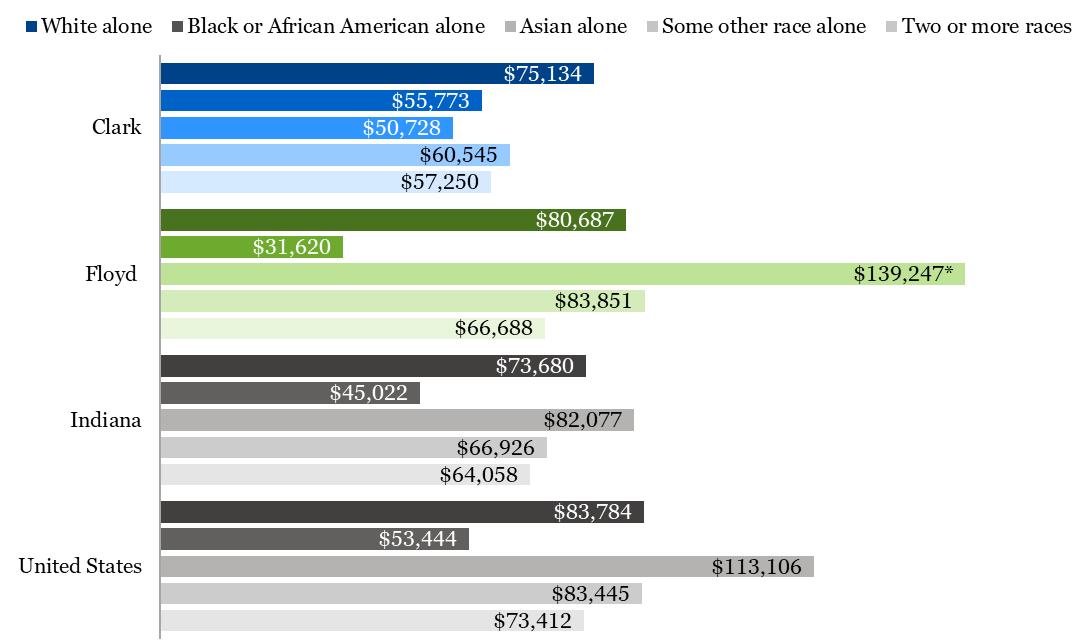
*Note: Data indicate that while Floyd County is home to high income Asian Americans, Clark County is home to a significantly lower income Asian population. Sample sizes are too small to draw any conclusions this may simply be a result of a small sample but this warrants further study.
Source: United States Census Bureau. 2023. "Table S1903: Median Income in the Past 12 Months." American Community Survey 5-Year Estimates 2019-2023. Retrieved December, 2024.
FIGURE
FIGURE 12: MEDIAN HOUSEHOLD INCOME BY AGE OF HOUSEHOLDER
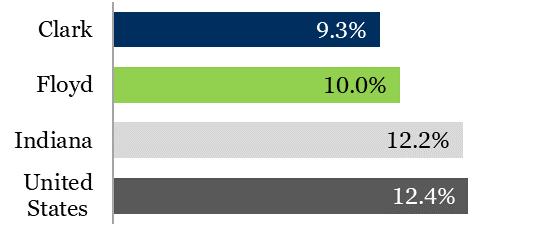
FIGURE 13: POVERTY RATES
Source: United States Census Bureau. 2024. "Table 1701: Poverty Status in the Past 12 Months.” American Community Survey 5-Year Estimates, 2019-2023. Retrieved December, 2024.
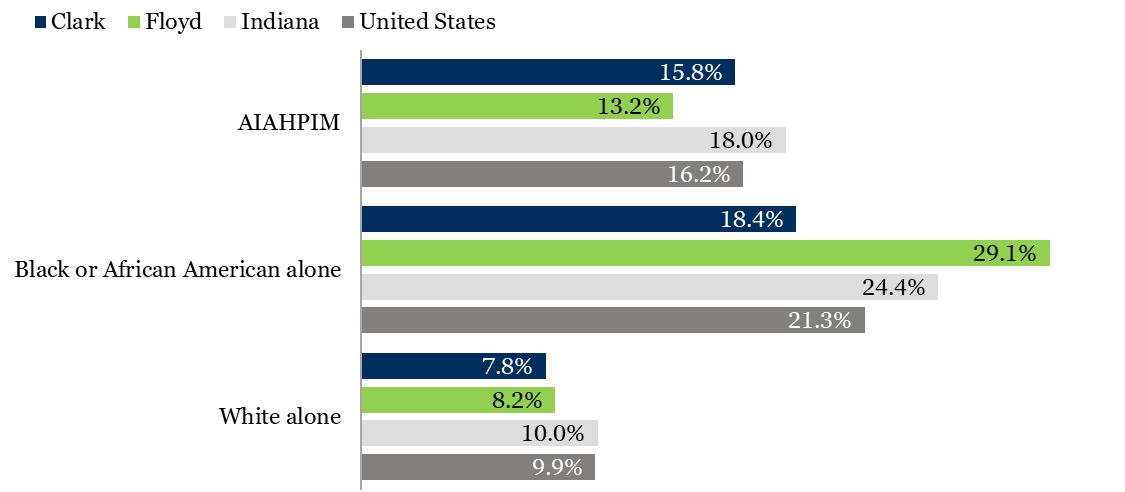
FIGURE 14: PERCENT IN POVERTY BY RACE
Source: United States Census Bureau. 2024. "Table 1701: Poverty Status in the Past 12 Months.” American Community Survey 5-Year Estimates, 2019-2023. Retrieved December, 2024.
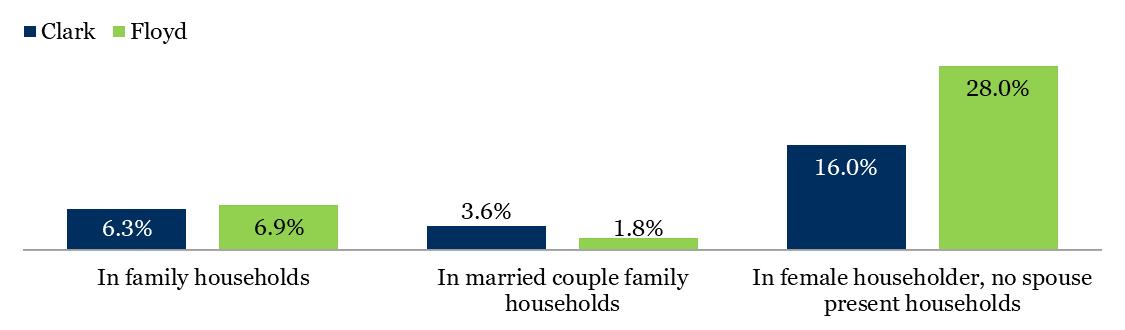
FIGURE 15: PERCENT IN POVERTY BY FAMILY TYPE
Source: United States Census Bureau. 2023. "Table S1702: Poverty Status in the Past 12 Months of Families." American Community Survey 5-Year Estimates, 2019-2023. Retrieved December, 2024.
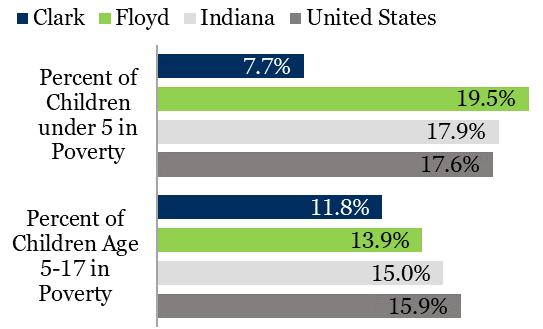
FIGURE 17: CHILDCARE BURDEN FIGURE 16: CHILD POVERTY
Source: Brighter Futures Indiana Data Center. 2024. "Affordability." Retrieved January 2024 from https://brighterfuturesindiana.org/data-center.
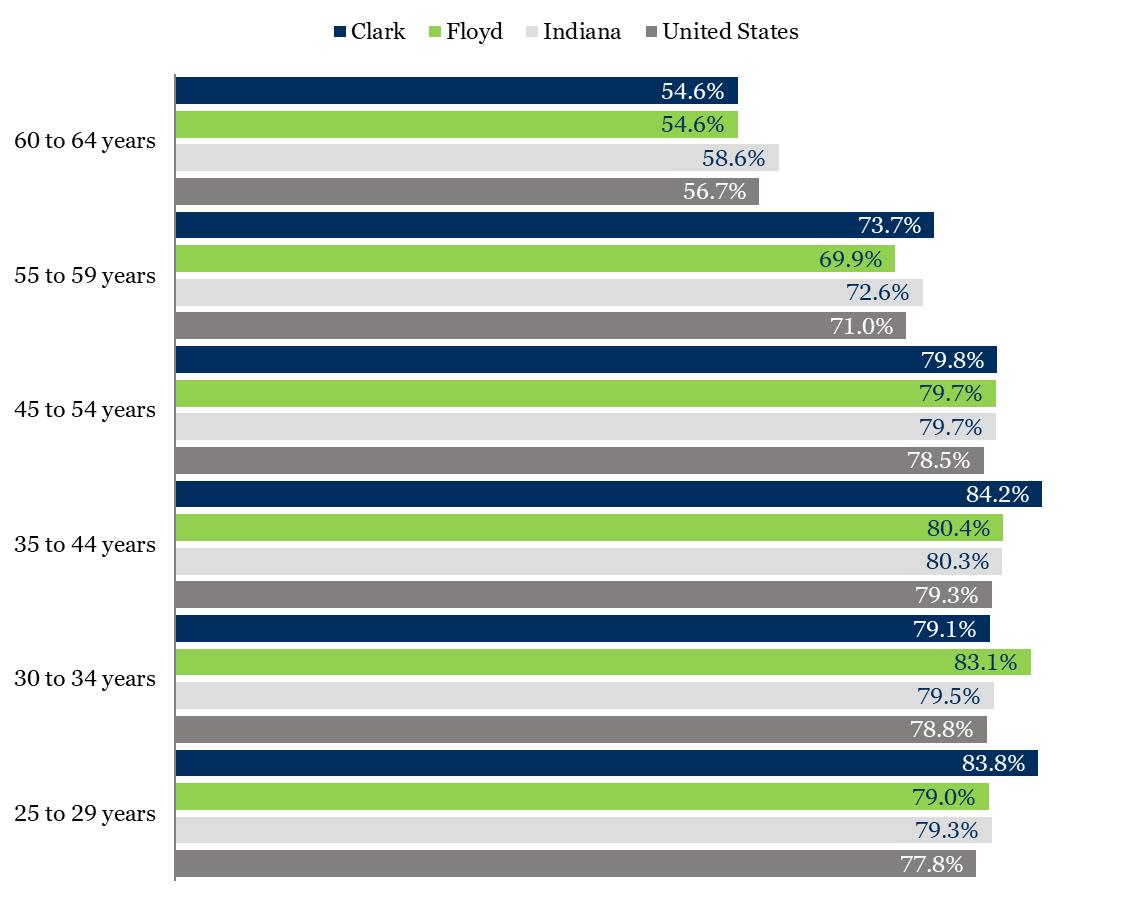
FIGURE 18: PERCENT EMPLOYED BY AGE COHORT FOR PRIME WORKING AGE ADULTS
Source: United States Census Bureau. 2023. "Table S2301: Employment Status." American Community Survey 5-Year Estimates, 2019-2023. Retrieved December, 2024.
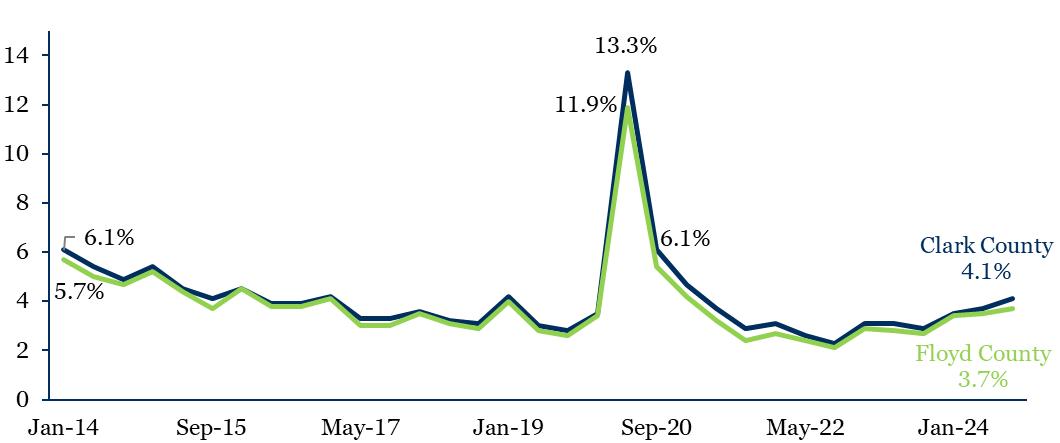
FIGURE 19: UNEMPLOYMENT RATES, 2014-2024
Source: U.S. Bureau of Labor Statistics. 2024. “Local Area Unemployment Statistics.” BLS Data Viewer. Retrieved January 2025 from https:// data.bls.gov/dataViewer/view/timeseries/LAUCN180190000000003.
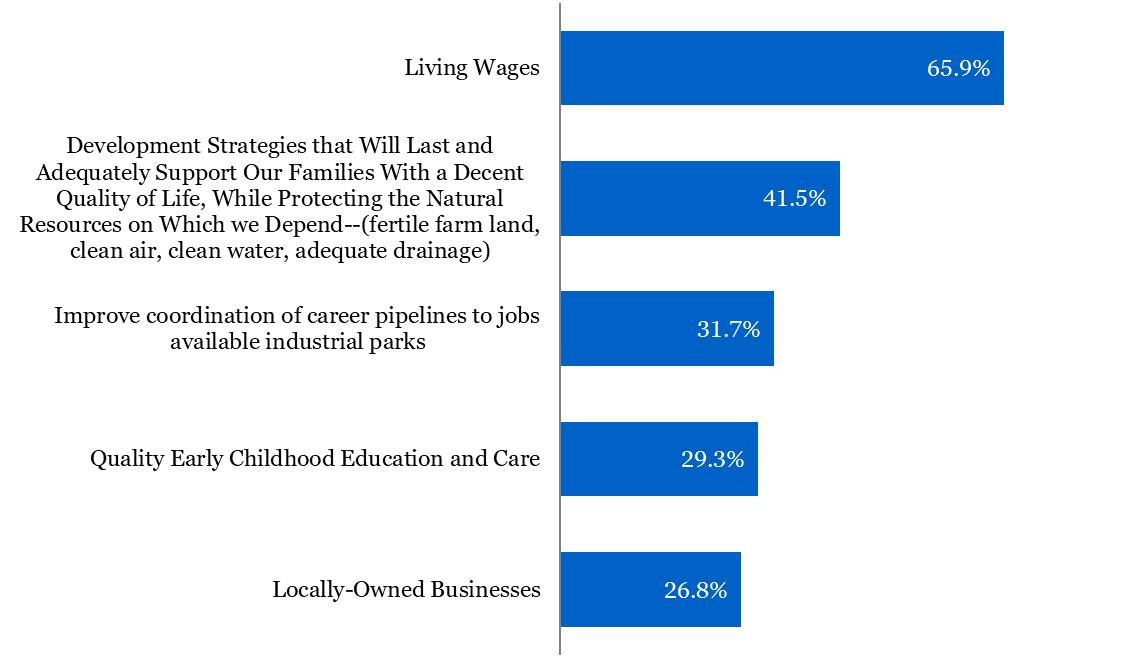
FIGURE 20: TOP 5 ECONOMIC DEVELOPMENT PRIORITIES
(Continued from page 14)
riverfront apartments. Additionally, the development of workforce housing and expanding job opportunities linked to River Ridge continue to drive growth in the area.
Listening session participants envision a future for Clark and Floyd counties where residents have diverse job and career opportunities. In this vision, everyone can live comfortably with wages that meet the cost of living, and individuals facing chronic challenges can still work and contribute their skills.
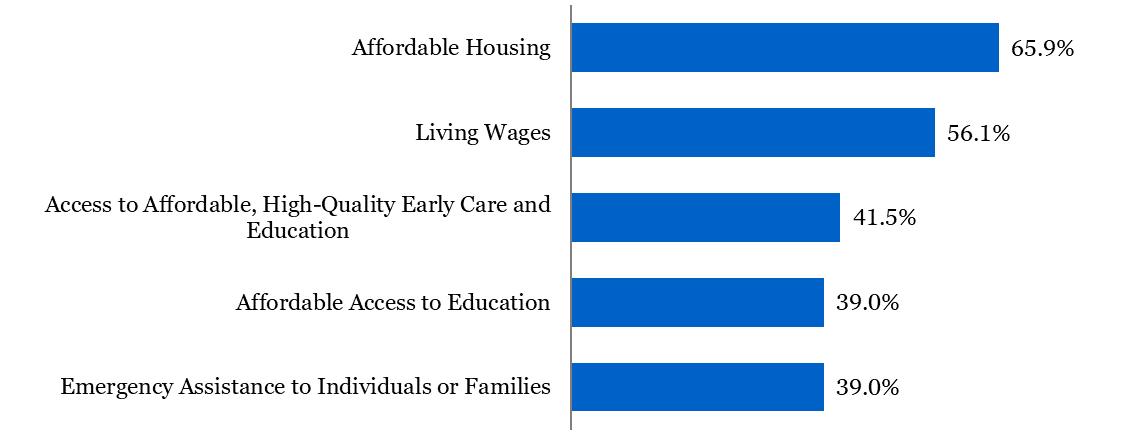
Our survey presented two lists of potential priorities: Economic Development Priorities (Figure 20) and Personal Finance Priorities (Figure 21). Both lists included "living wages" to address both individual concerns and the systemic issue tied to the region's economic development strategies. Living wages garnered the largest share of votes for economic development (65.9%) and the second largest (56.1%) for personal financial wellbeing (Figures 20 and 21).
Consensus was less strong on other economic development concerns. Sustainable development strategies ranked second (41.5%), followed by improving coordination of career pipelines to jobs in industrial parks (31.7%).
For personal financial well-being, the top priorities were affordable housing, living wages, and access to
affordable, high-quality early care and education. These were closely followed by affordable access to education and emergency assistance to individuals or families.
• Strong labor force participation.
• Median incomes above the state median.
• Relatively low or on par with the state in terms of poverty rates.
• Job opportunities.
• Strong chamber of commerce.
• Room for more growth within existing industrial park space.
• Higher wage jobs and incomes for lower and average skilled workers that keep pace with the cost of living.
• More complete transportation services, including an employment Uber for reliable transportation to work.
• Access to affordable high-quality childcare (childcare burden is a greater issue in Clark county, but may affect low-income women’ s labor force participation in Floyd county).
• Social enterprises that engage the unhoused, former felons reentering the community, and those with other barriers to flourishing.
• Listening session participants included some who are unhoused and on disability. They want our community to give people like them opportunities to contribute, work, and thrive.
• Support for small business development.
FIGURE 21: TOP 5 PRIORITIES TO SUPPORT PERSONAL FINANCIAL WELL-BEING
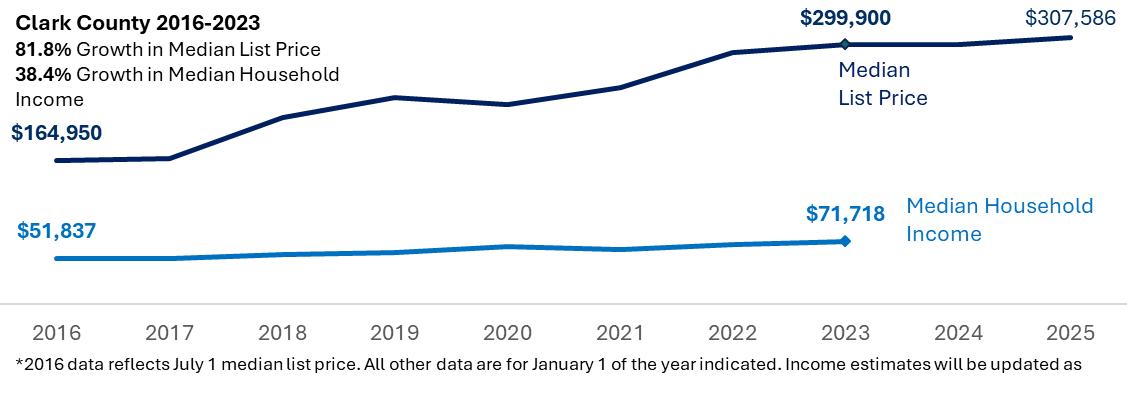
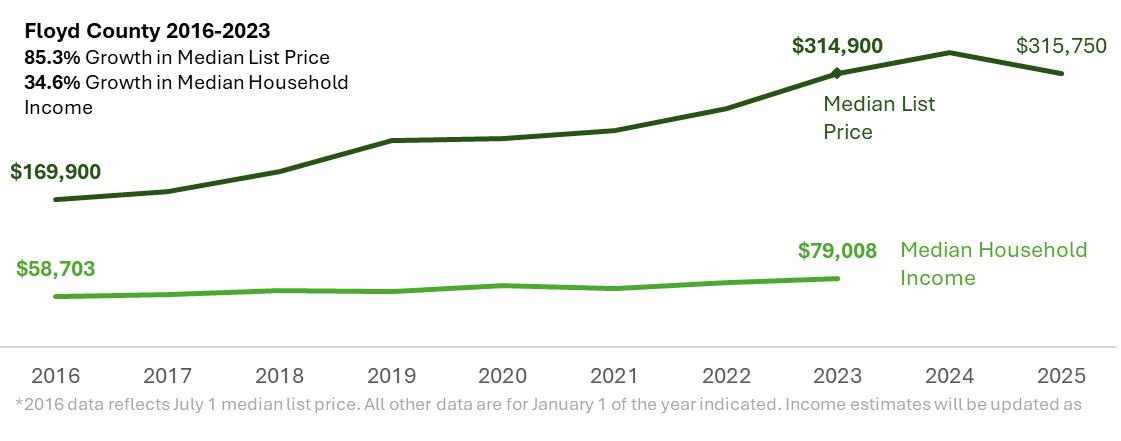
The rising costs of housing and food postpandemic are well-documented nationwide. The Louisville-Metro region, driven by growth in highincome sectors, is experiencing housing price increases that outpace median wage growth (Figure 22), a common trend in expanding regions. The lulls in new home construction following the 2008 housing market collapse, and again during the pandemic, created a tight housing supply and a crowded rental market characterized by high rents. Population growth, fueled by high-wage sectors and migration from Louisville has further driven up home prices despite stagnant or slow wage growth for most workers.
Listening session participants envision a future with housing for all, including safe options for seniors. Discussions of economic and financial well -being were closely linked to concerns about hunger and housing (Figures 22-26 update figures on basic needs).
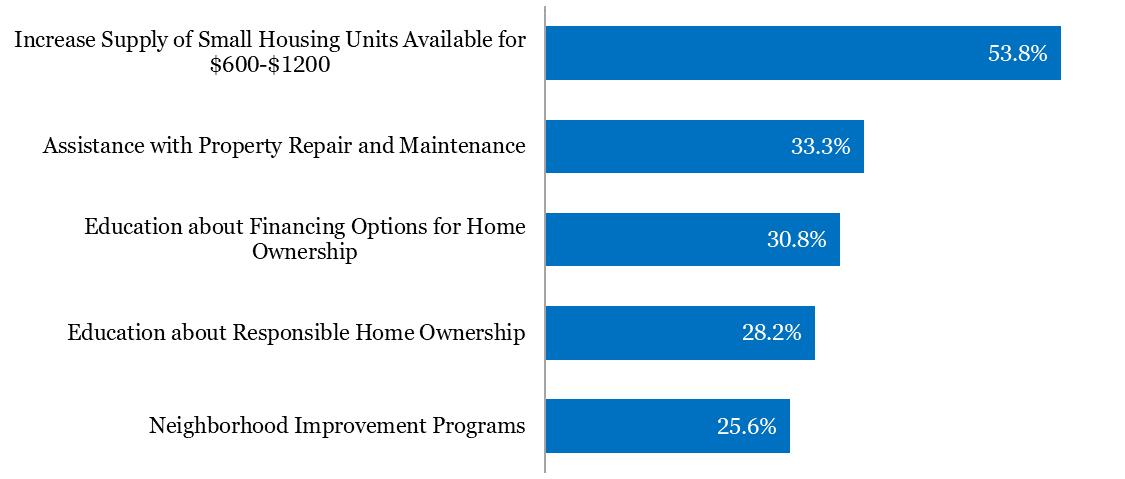
New survey items, based on listening session feedback, focused on education regarding home ownership financing and responsible home ownership–both crucial for increasing home ownership rates. Triangulating these survey results with listening session and gallery walk findings is important, given the varied income distributions
FIGURE 22: CHANGE IN MEDIAN LIST PRICES AND INCOMES, 2016-2023
across data collection methods. Survey respondents prioritized increasing the supply of low-to-moderate income housing units, assistance with home repairs, and the newly added home ownership education, all reinforced by rich discussions in listening sessions (Figure 27).
When asked to prioritize housing for specific needs (Figure 28), the top priority across both groups was to "Increase support for those transitioning from institutional settings or systems into their own housing/independent living." This was followed by permanent supportive housing for individuals with serious mental illness and developmental disabilities.
Listening session and gallery walk discussions yielded discussion of the communities’ many assets as well as priority opportunities for improvement.
• The cost of living remains lower in southern Indiana than in Louisville.
• Southern Indiana has a strong network of churches and other charitable organizations that work to support low-income and unhoused individuals and families.
• Demolition of older public housing units in New Albany improved residents' health and
well-being, and the community.
• Supply of public housing in New Albany.
Food
• Food banks and food pantries.
• Farmers’ markets that accept Electronic Benefits Transfer (EBT) cards.
• Commercial grocery delivery services.
• Nonprofit food delivery services.
Goods and Services
• Consignment shops that facilitate basic needs for low-income individuals.
• Support programs for pregnant women and those with young children.
• Social enterprises that provide food for the poor and employment for former felons.
• Emergency shelter during "white flag" nights.
• Outreach initiatives to locate and assist the unhoused.
• Energy bill assistance programs.
• Accessible assistance programs.
• Financial education and home ownership programs through a local housing authority and nonprofit organizations.
• Case management for accessing various services.
• Veterans’ programs.
(Continued on page 24)
Source: United States Census Bureau. 2023. "Table S2503: Financial Characteristics." American Community Survey 5-Year Estimates, 2019-2023. Retrieved December, 2024.
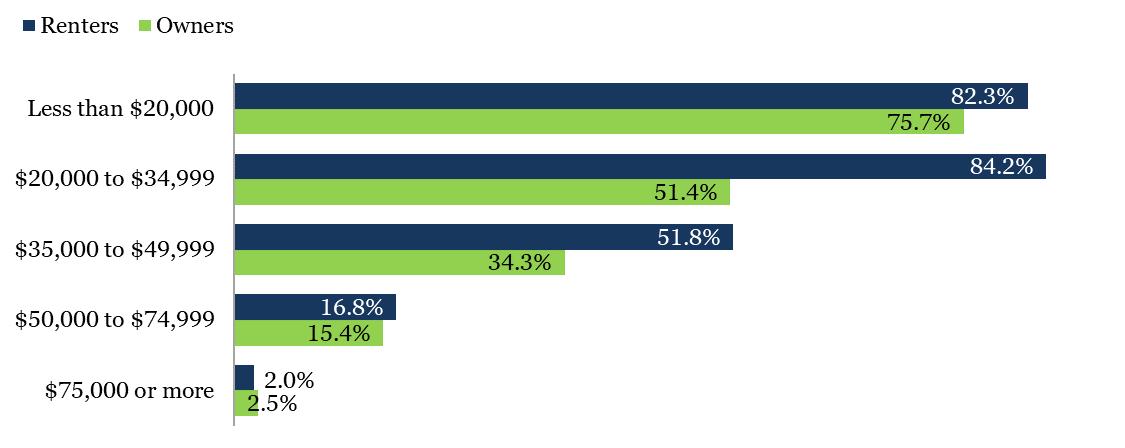
FIGURE 23: PERCENT PAYING 30% OR MORE IN HOUSING COSTS BY INCOME GROUP
Source: United States Census Bureau. 2023. "Table B25077: Median Value.” American Community Survey 5-Year Estimates, 2019-2023 Retrieved January 2025; and United States Census Bureau. 2023. "Table S1101: Households and Families." American Community Survey 5-Year Estimates, 2019-2023. Retrieved January, 2025. FIGURE 24: HOUSING COST BURDEN FOR RENTERS AND OWNERS, 2023
FIGURE 25: HOME OWNERSHIP AND VALUE, 2019-2023
-
Source: United States Census Bureau. 2024. "Table DP04: Selected Housing Characteristics." American Community Survey 5-Year Estimates, 20192023. Retrieved December, 2024.
26: FOOD SECURITY AND ACCESS TO ASSISTANCE
Qualifying for Assistance
Source: Feeding America. 2022. “Food Insecurity among the Overall Population in the United States.” Map the Meal Gap. Retrieved January 2025 from https://map.feedingamerica.org/county/2022/overall.
FIGURE
27: PRIORITIES FOR HOUSING
FIGURE 28: PRIORITIES FOR HOUSING SPECIFIC POPULATIONS
(Continued from page 22)
Listening session participants identified several opportunities for improvement in the area of basic needs:
• Increase supply of small housing units at prices affordable to those earning below 80% AMI (i.e. rent or mortgage at various levels between $600 and $1200 per month).
• Increase supply of support (and awareness of programs) for those transitioning from:
Foster care.
Incarceration.
Hospitalization.
Substance use disorder in-patient treatment.
In-patient mental health care.
• Increase supply of permanent supportive housing for those who suffer from serious mental illness and/or developmental disabilities.
FIGURE
• Increase resources (and awareness of resources) for eviction prevention (specifically, improve the safety net to help people weather temporary setbacks without being evicted or foreclosing on their homes).
• Train youth through youth building projects where young people work with skilled tradesmen to build and refurbish needed housing.
• Permanent sober living housing options (affordable apartments privately rented but designated as sober living).
• Support for financing home maintenance and improvements.
• Until we have housing for all,
A family shelter.
Transitional housing for all who need it including people with disabilities.
A stop and go homeless center with showers, bathrooms, laundry facilities, and charging stations.
• Food pantry delivery.
Clark and Floyd counties are well-equipped with healthcare resources, including two hospitals, a major nonprofit healthcare provider, and various nonprofit and for-profit mental health and substance use treatment providers. Residents also benefit from access to high-quality healthcare in Louisville.
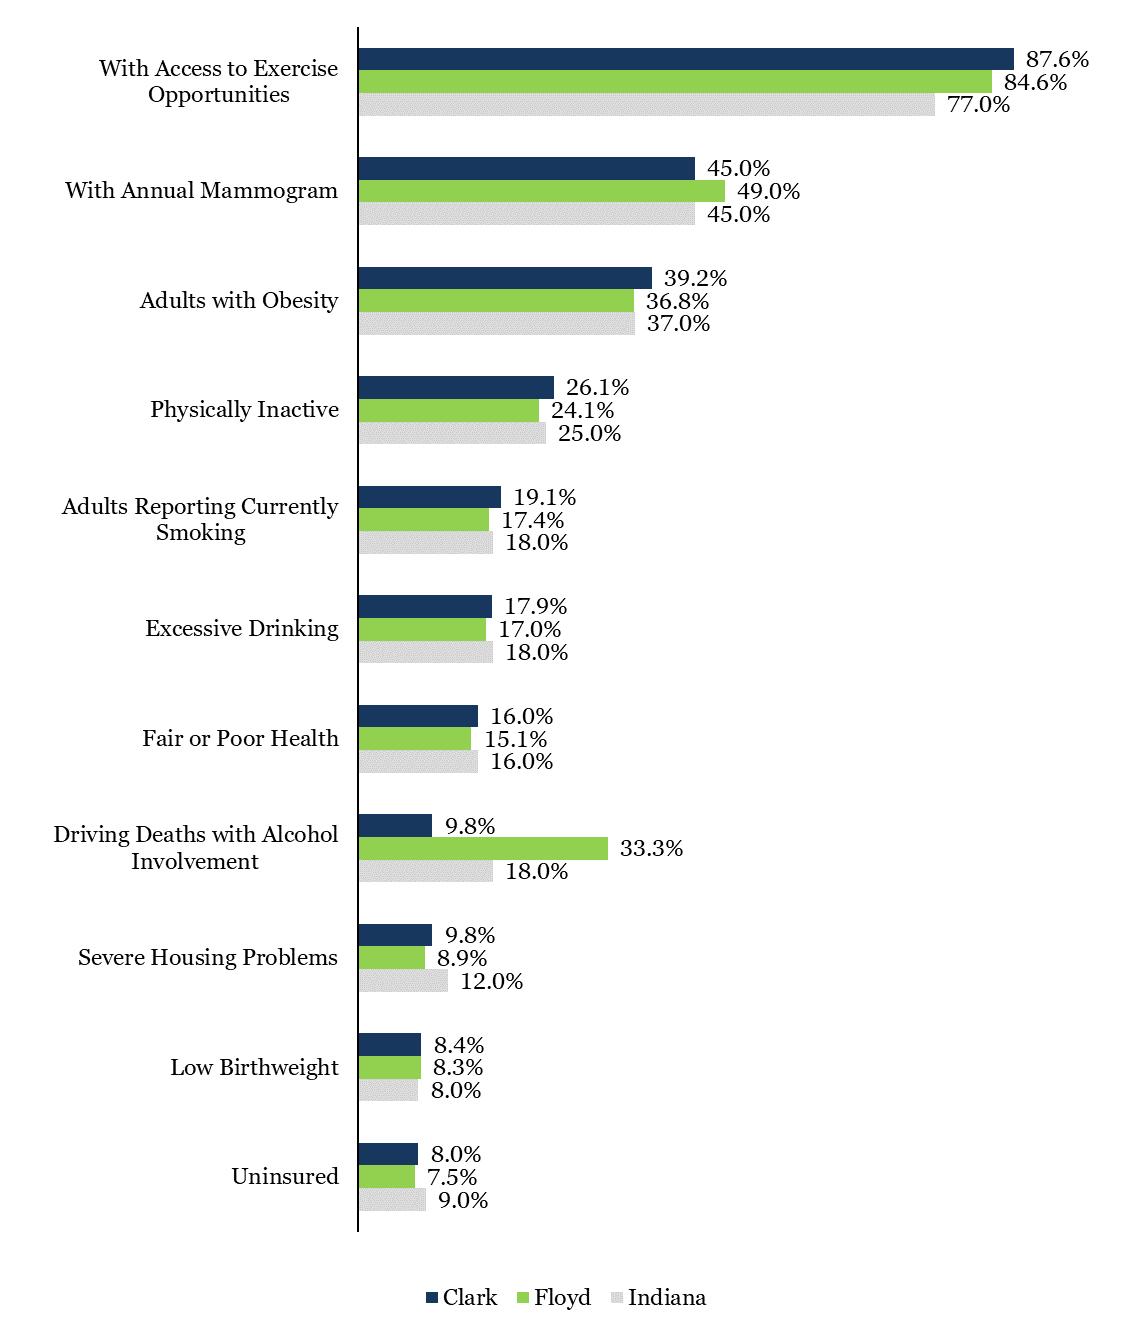
Residents recognize that good health is fundamental to thriving in all aspects of life. Over the past decade, Clark and Floyd counties have made progress: a smaller percentage of residents are physically inactive or smoke cigarettes, and the average number of selfreported physically unhealthy days in the last month has decreased, as has the percentage reporting "fair" or "poor health" (Figure 30). However, a larger share of the population struggles with obesity, and a smaller percentage of Floyd County residents report access to exercise opportunities compared to our 2015 assessment. (Figures 29-34 update indicators of Health and Wellness).
The pandemic exposed stark disparities in chronic disease, making low-income and Black, Indigenous, and People of Color (BIPOC) communities significantly more vulnerable to the COVID-19 virus before vaccines became available. The social isolation that began with stay-at-home orders persisted even after communities reopened. Social isolation across the U.S. is at an all-time high, and residents participating in our listening sessions and gallery walks emphasized the need for mental health support across communities. This includes not only access to care but also fostering community building and re-establishing in-person social connections.
FIGURE 29: HEALTH INDICATORS
FIGURE
Source for Figures 30-34: County Health Rankings and Roadmaps. 2025. "Indiana." Retrieved January, 2025 from https://www.countyhealthrankings.org/explore-health-rankings/indiana.
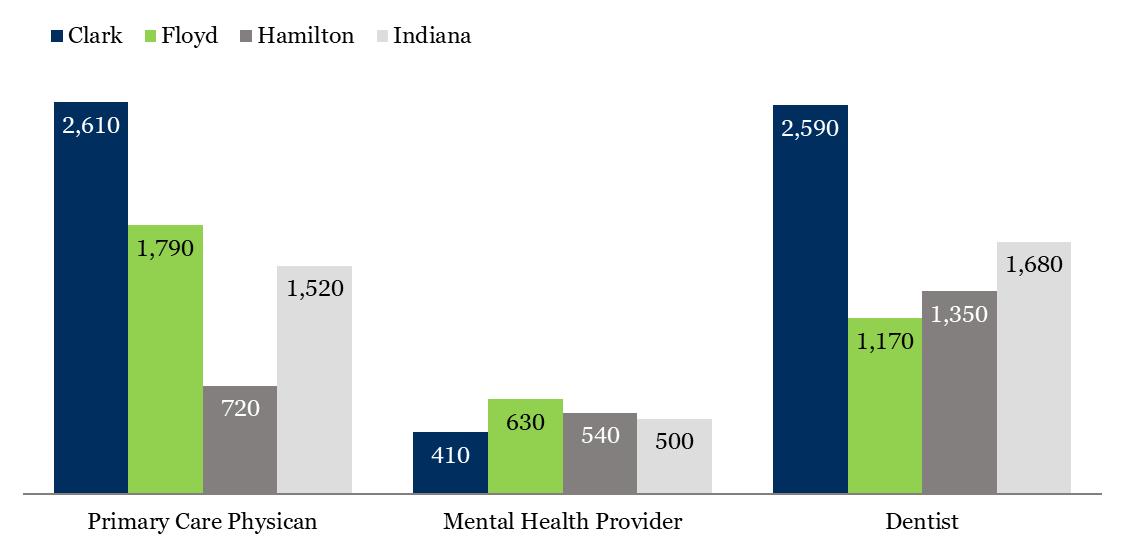
FIGURE 31: RATIO OF POPULATION TO HEALTHCARE PROVIDERS
FIGURE 32: DEATHS BY OVERDOSE PER 100,000, 2024
Source: Indiana Department of Health. 2024. Indiana Drug Overdose Dashboard. Retrieved January 2025 from https:// www.in.gov/health/overdose-prevention/overdose-surveillance/indiana/
FIGURE 33: OPIOID DISPENSATIONS PER 1,000 IN 2022
FIGURE 34: EMERGENCY DEPARTMENT VISITS, PER 100,000 IN 2023
Source: Indiana Department of Health. 2022-2023. “Indiana Drug Overdose Dashboard.” Retrieved January 2025 from https:// www.in.gov/health/overdose-prevention/overdose-surveillance/indiana/.
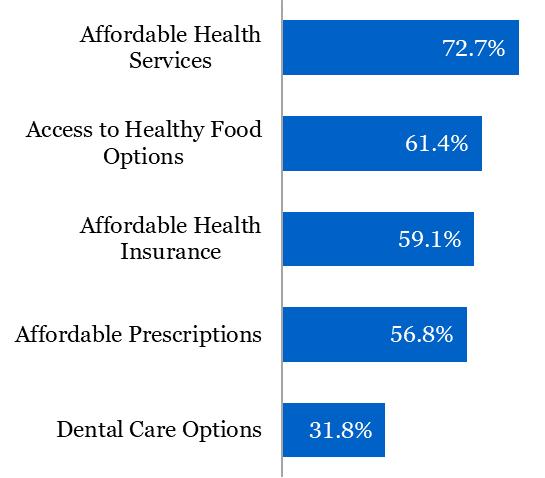
Based on respondent selections, the top five health and wellness priorities show strong consensus (Figure 35):
• Affordable health services was the most favored.
• Healthy food options ranked second, with over 60% of respondents prioritizing it.
These indicate a clear understanding that affordable healthcare and access to nutritious food are essential for maintaining wellness.
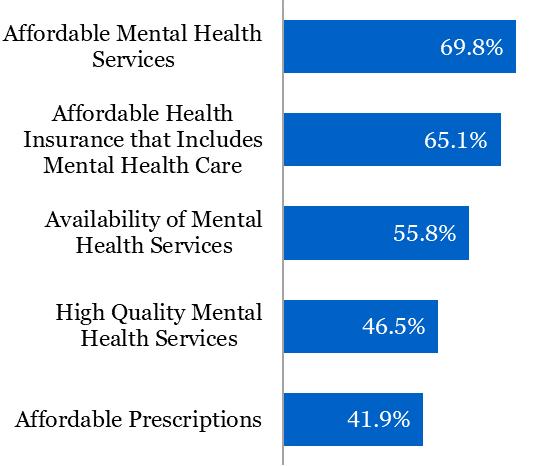
Consensus was equally strong for mental health needs (Figure 36):
• Nearly 70% prioritize affordable mental health services.
• 65% prioritize affordable health insurance that includes coverage for mental health care.
• A full 55.8% identified the availability of mental health services as a priority.
These findings are corroborated by the data on the resident-to-mental health provider ratio, which highlights the need for more services.
• Strong recovery programs–12-step and others.
• Strong recovery community.
• Nonprofit gyms and their programs to support health and wellness.
• Mental health services for low-income, poor, and unhoused residents.
• Physical health services for low-income, poor, and unhoused residents.
• Hospitals in both Clark and Floyd counties and access to Louisville healthcare.
• Access to affordable and healthful foods.
• Improve education about nutrition and components of physical well-being.
• Support for mental health and well-being.
• Increase the supply of mental health care providers.
• Physical activity – increase access to gyms and fitness trails.
FIGURE
FIGURE 36: PRIORITIES FOR MENTAL HEALTH AND WELLNESS
Public schools, training, and education programs in Clark and Floyd counties are strong, but residents perceive a decline in engagement and outcomes across the system in the wake of the pandemic. Participants envision better coordination in the pipeline from training or
education to placement in living wage jobs. In addition, they hope for a future where transportation and childcare no longer act as barriers to labor force participation and employment stability.
(Continued on page 35)
Source for Figures 37-43: United States Census Bureau. 2023. "Table S1501: Educational Attainment." American Community Survey 5-Year Estimates, 2019-2023 Retrieved December, 2024.
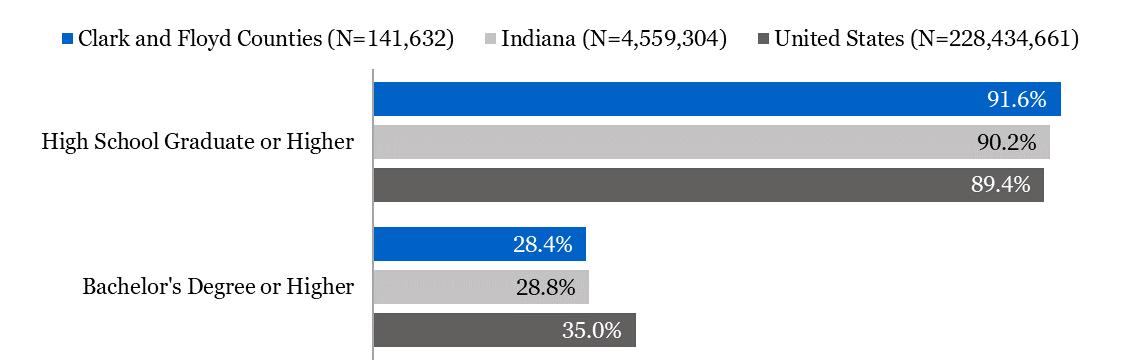
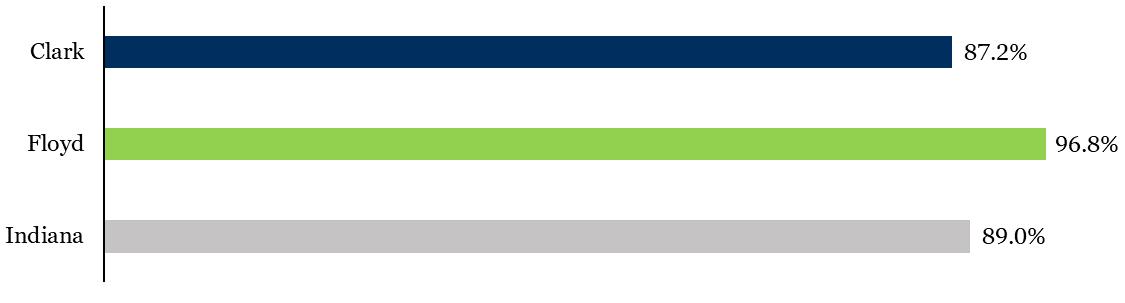
FIGURE 37: OVERALL HIGH SCHOOL AND COLLEGE ATTAINMENT
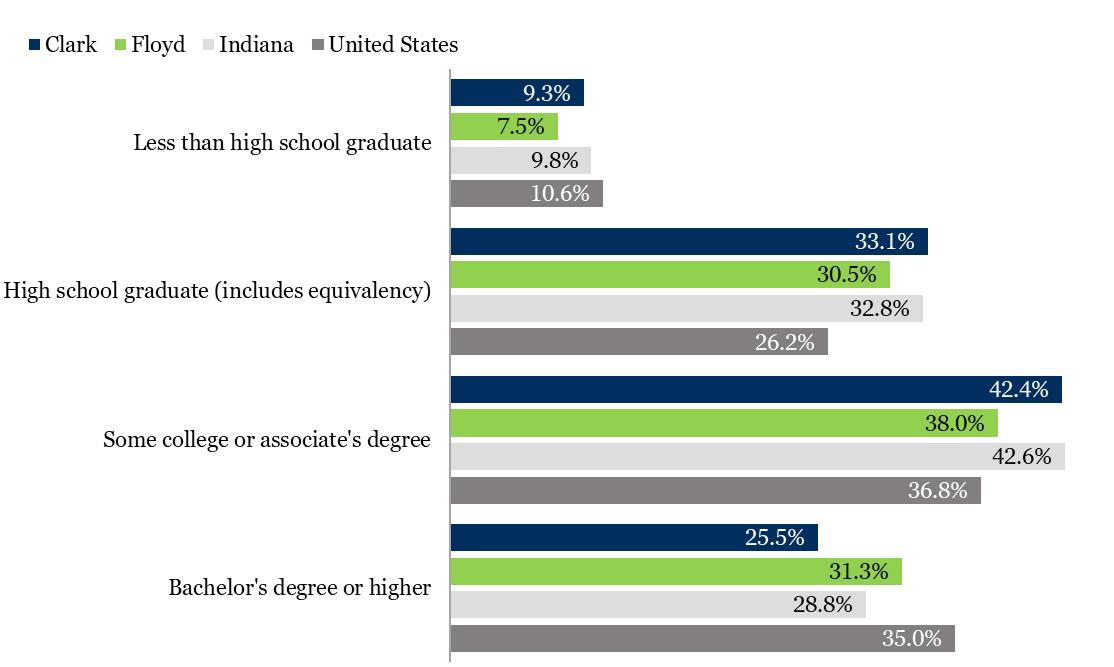
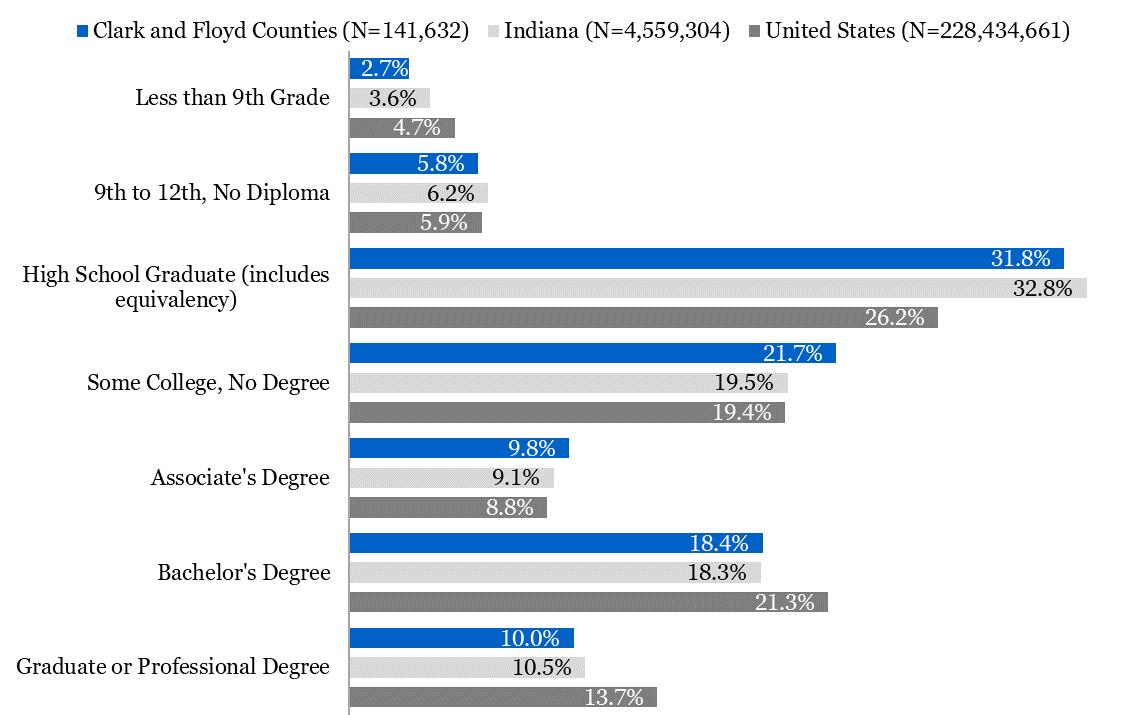
FIGURE 38: EDUCATIONAL ATTAINMENT
Source: United States Census Bureau. 2023. "Table S1701: Poverty Status in the Past 12 Months.” American Community Survey 5Year Estimates, 2019-2023. Retrieved December, 2024.
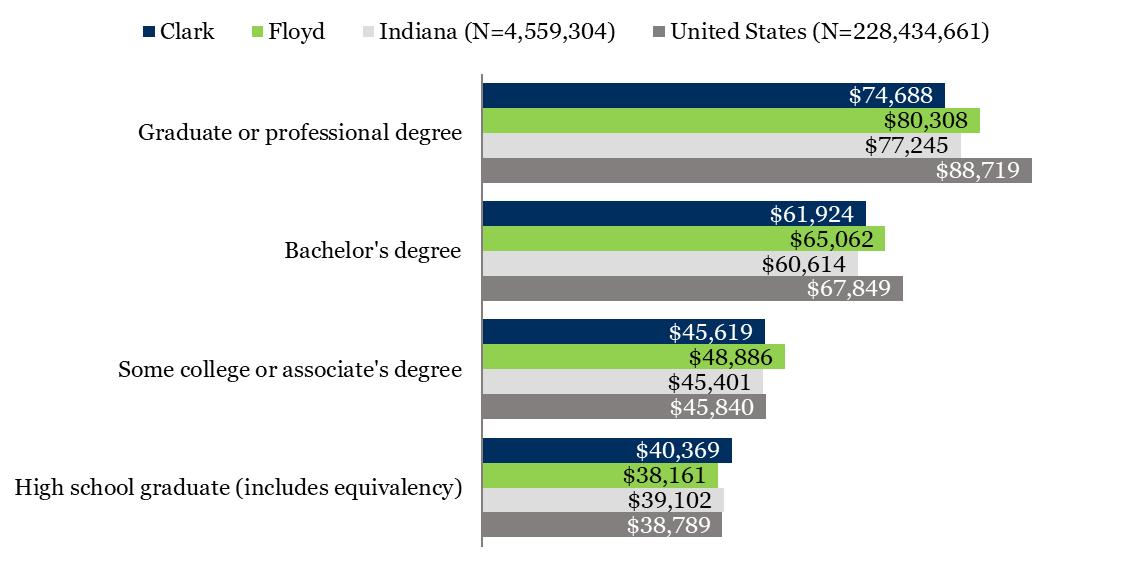
FIGURE 40: MEDIAN INDIVIDUAL EARNINGS BY EDUCATION LEVEL
Source: United States Census Bureau. 2023. “Table S2001: Earnings in the Past 12 Months.” American Community Survey 5-Year Estimates Subject Tables, 2019-2023. Retrieved December, 2024.
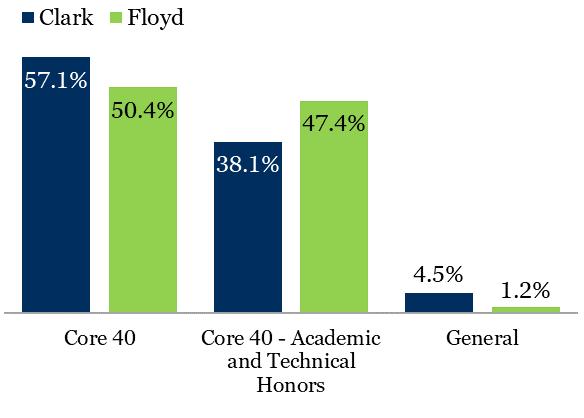
42: PERCENT OF STUDENTS GRADUATING WITH EACH DIPLOMA TYPE
Source: Indiana Department of Education. 2025. “Indiana Graduates Prepared to Succeed.” Retrieved January, 2025 from https:// indianagps.doe.in.gov/.
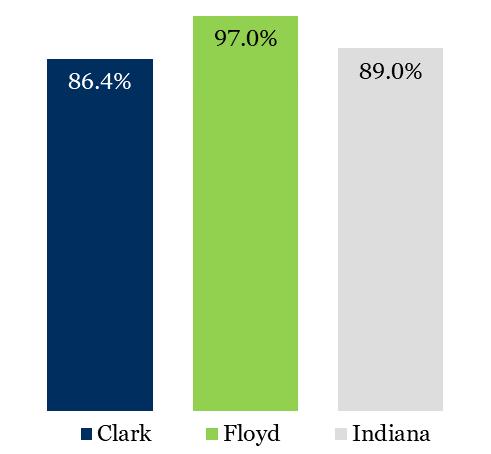
43: OVERALL 4-YEAR GRADUATION RATE
Source: Indiana Department of Education. 2025. “Indiana Graduates Prepared to Succeed.” Retrieved January, 2025 from https:// indianagps.doe.in.gov/.
FIGURE
FIGURE
FIGURE
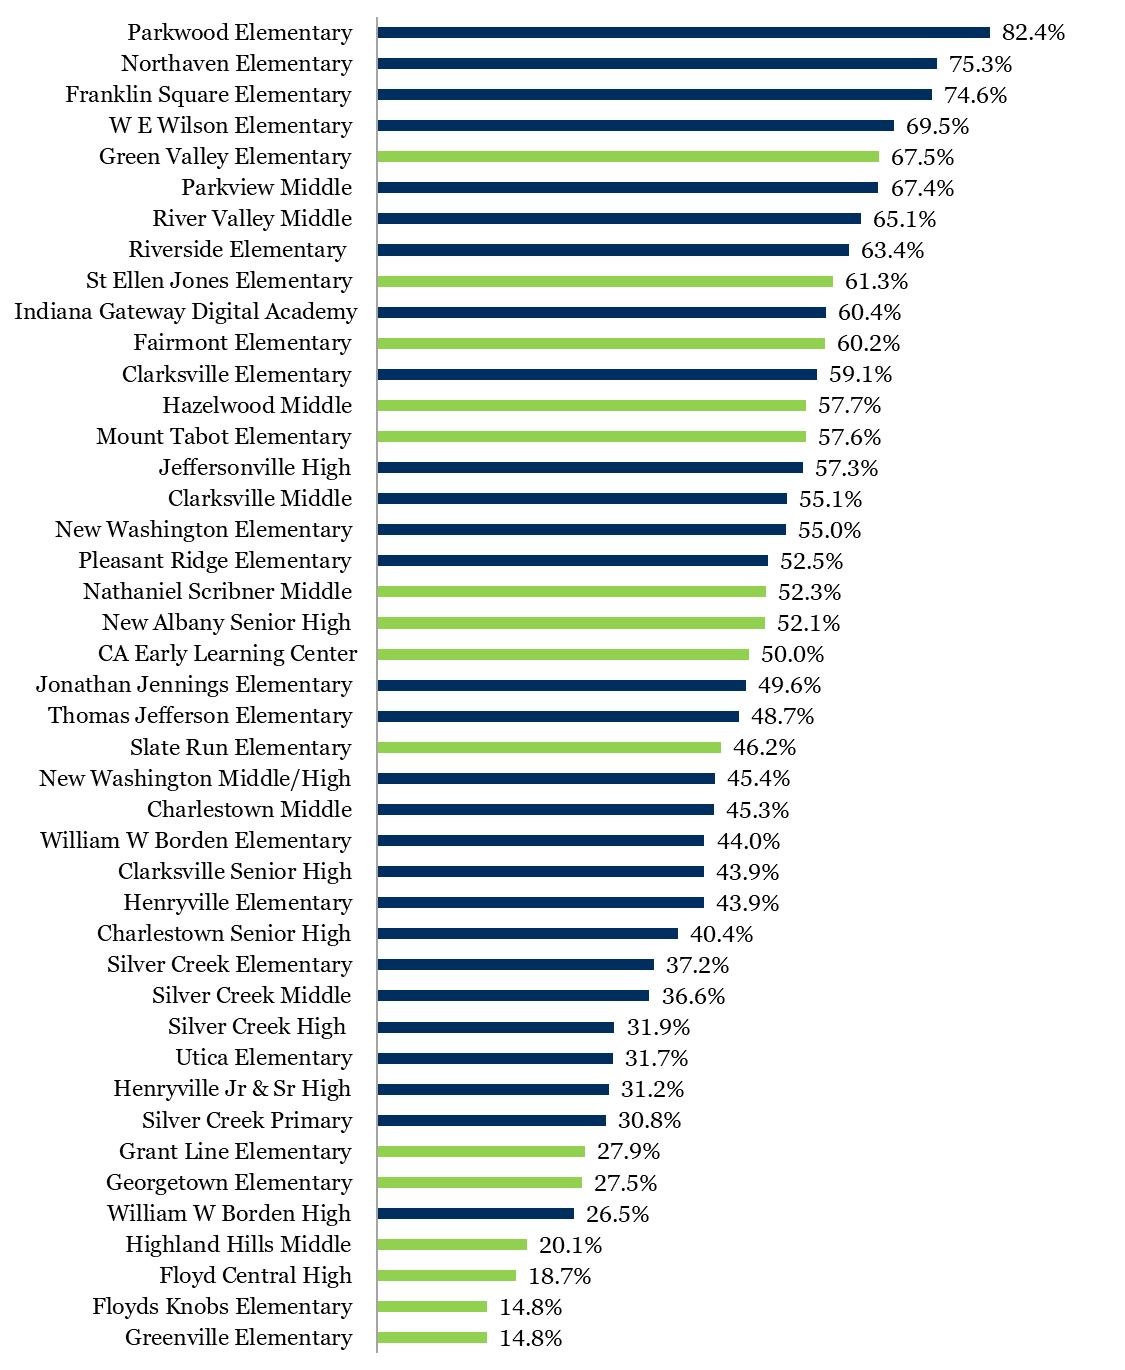
Source: Indiana Department of Education. 2024. “Data Center and Reports, Corporation Enrollment by Ethnicity and Free/Reduced Price Meal Status.” Retrieved January, 2025 from https://www.in.gov/doe/it/data-center-and-reports/.
Source: Indiana Department of Education. 2025. “Indiana Graduates Prepared to Succeed.” Retrieved January, 2025 from https:// indianagps.doe.in.gov/.
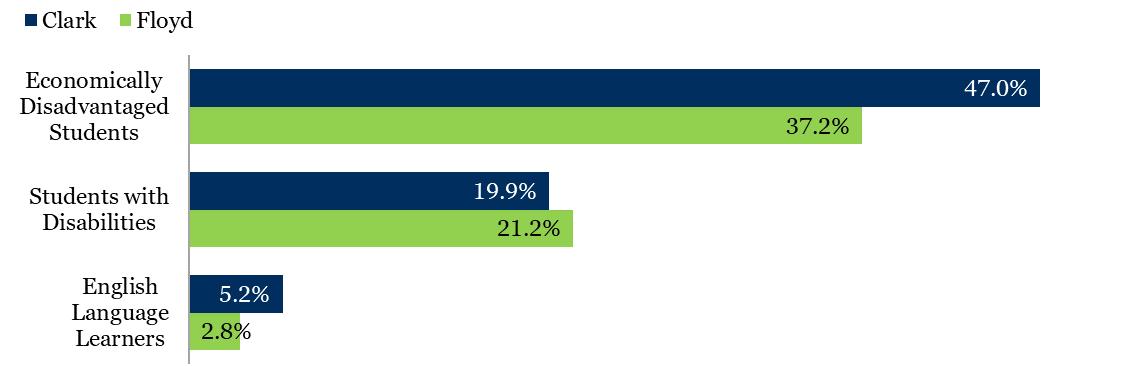
FIGURE 45: SPECIAL STUDENT POPULATIONS
Source: Indiana Department of Education. 2024. “School Enrollment by Ethnicity and Free/Reduced Price Meal Status.” IDOE Data Center and Reports. Retrieved January 2025 from https://www.in.gov/doe/it/data-center-and-reports/.
2023-2024
Students
Source: Indiana Graduates Prepared to Succeed. 2024. Retrieved January 2025 from https://indianagps.doe.in.gov/.
FIGURE 48: PERCENT OF STUDENTS WHO TOOK THE SAT THAT MET COLLEGE AND CAREER READINESS BENCHMARKS ON THE SAT
Source: Indiana Department of Education. 2022. “Data Center and Reports, SAT Grade 11 Corporation Results.” Retrieved January, 2024.
The public data updates provide the latest figures on educational attainment, the connection between attainment, income, and poverty, and the demographics and performance of children in our schools (Figures 37-48). Data for Indiana and the U.S. provide reference points for better understanding where the region stands and the goals the region may want to reach.
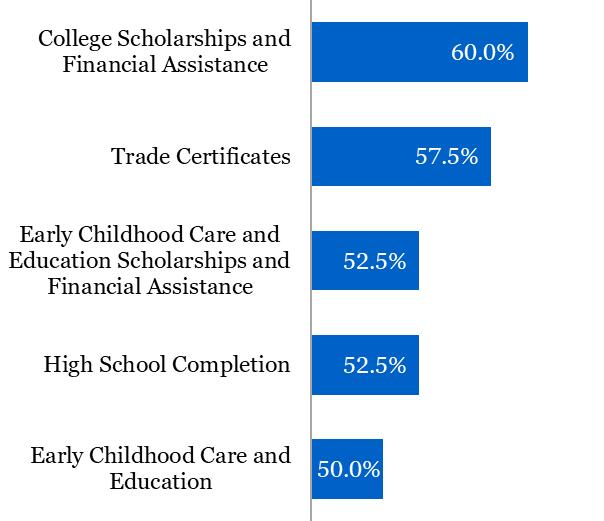
Education priorities reflect challenges around financial access to education from early care and education to college (Figure 49). Trade certificates continue to be an important priority in the region as employers in the trades consistently report shortages of qualified workers for living wage jobs in the trades. Each of the top five education priorities is a potential leverage point for supporting economic development and shared prosperity in the region.
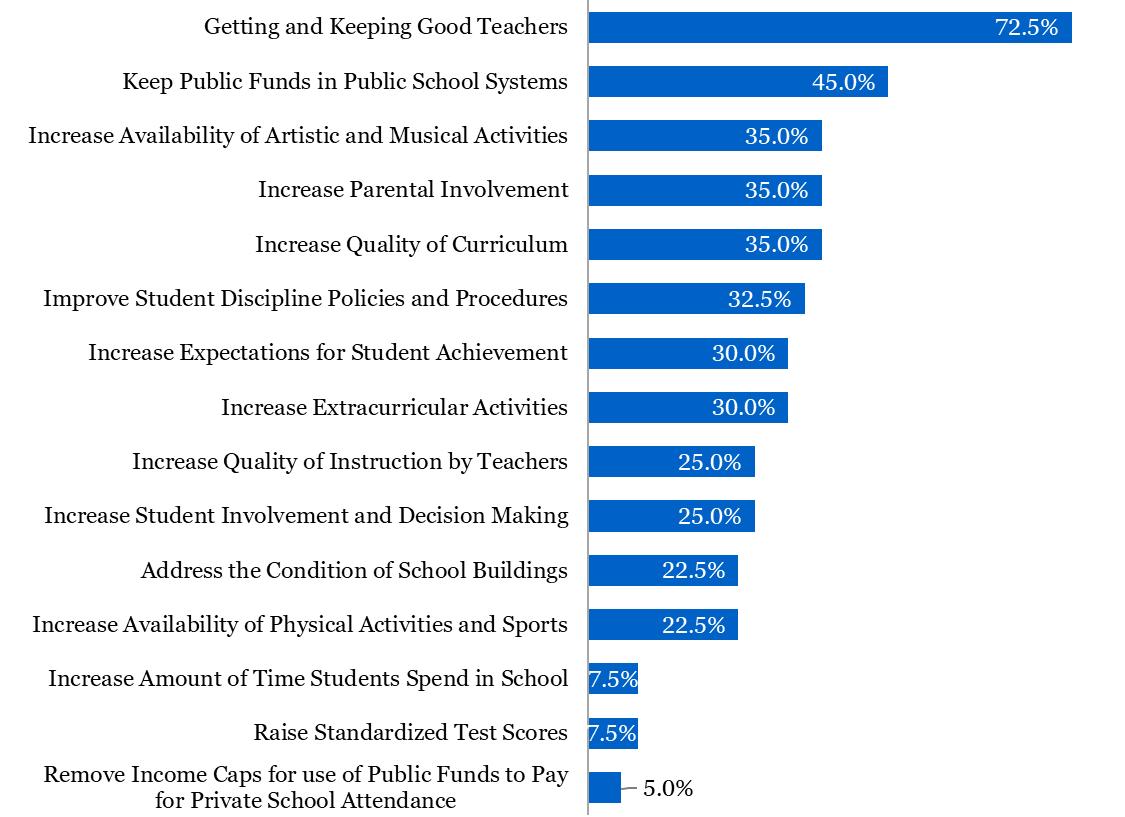
When asked about priorities for schools, the group overwhelmingly prioritized getting and keeping good teachers (Figure 50). However, consensus was considerably lower on all other items, with none selected by more than 50% of respondents.
A couple of new items were added to this year's survey to reflect current policy changes regarding the use of public funds for private schools. The item "keep public funds in public school systems" was the second most frequently prioritized, identified by 45% of respondents. This highlights both the importance of the issue within the community and the lack of strong consensus.
Figure 50 provides the full list of potential priorities and the percentage of respondents who selected them as top priorities. We present the entire list for this item specifically because the notable lack of strong consensus on these priorities reflects important challenges the communities face in making decisions about the school systems.
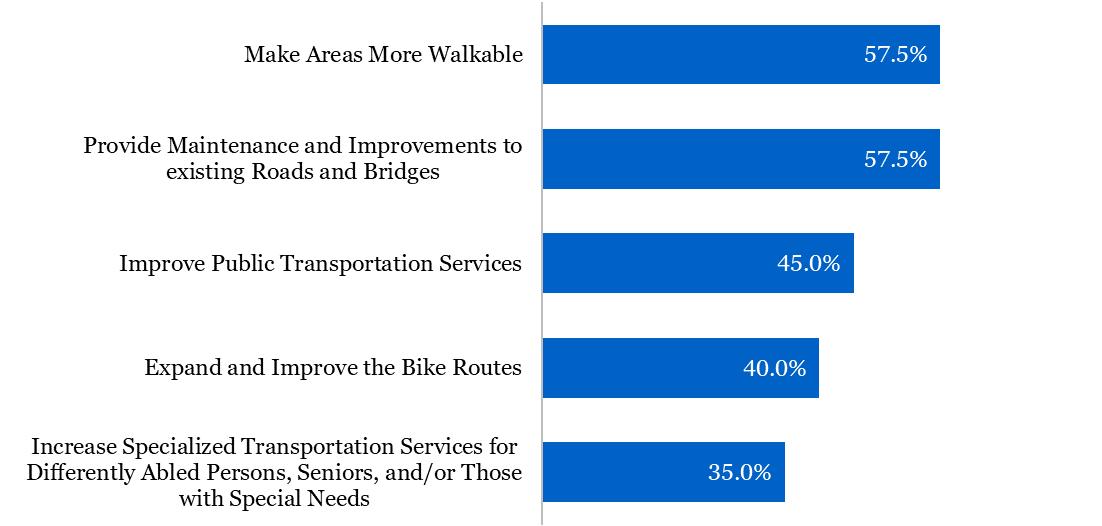
Across every listening session, transportation challenges in the region were a prominent discussion point. The concept of on-demand, lowcost, or free transportation for work arose in multiple listening sessions and gallery walk
conversations. Interestingly, survey respondents showed less consensus on transportation priorities (Figure 51). Over half prioritized walkability and maintenance/improvements on existing roads, while only 45% prioritized public transportation. This disparity likely reflects the differing demographics of our respondents. However, service providers universally agree that transportation is a significant barrier to stable employment, access to healthcare, and training, concerns strongly confirmed by listening session conversations.
Listening session participants highlighted several strong assets in education and workforce development within the community:
• Vocational rehabilitation services.
• Strong public school systems.
• A regional career education center.
• A local university.
• Local community and technical colleges.
Several key opportunities emerged for strengthening the connection between workforce (Continued on page 37)
50: PRIORITIES FOR LOCAL SCHOOLS
FIGURE
FIGURE 51: TRANSPORTATION PRIORITIES
(Continued from page 35)
development, education, and employment in the region.
• Create a system for on-demand transportation for training and employment, a need also identified in the "Economic and Financial WellBeing" section.
• Increase the supply of high-quality, affordable, or no-cost early care and education to better support working families.
• Improve the pipeline connecting Prosser Career Education Center, Ivy Tech Community College, Purdue Polytechnic, WorkOne, and Southern Indiana Works to available jobs at River Ridge and other area industrial parks.
• Develop a program providing access to clothing for job interviews and employment on the Indiana side of the river.
• Offer lifelong job skills training to ensure workers remain current with technical skills, enabling them to achieve and maintain financial well-being.
• Implement a teenage education and safety program for parenting adults to enhance their understanding of challenges teens face and equip them with strategies for keeping young people safe and healthy.
In 2024, residents voiced significant concern about the ongoing impacts of the COVID-19 disruption for the region’s youth as well as the growing population of area seniors.
Social isolation and engagement with technology to the exclusion of face-to-face socializing have not only impacted learning and engagement with school, but also social and emotional development. Thousands of youth missed significant social interaction and development during their time at home.
Area residents see the need to identify effective strategies to engage children and youth. Many voiced concern that parents are also struggling to re-engage after the pandemic and they do not know how best to help their children. They need help and a reduction in barriers to participation.
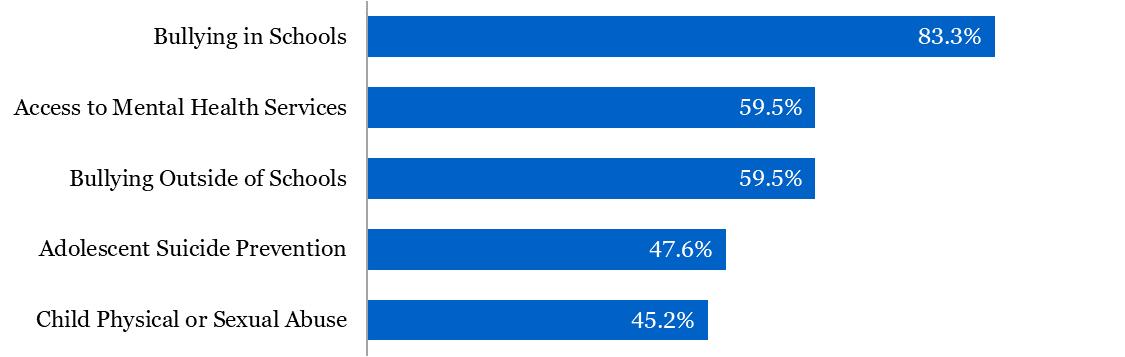
Survey respondents prioritized attention to bullying in and out of school, access to mental health services, suicide prevention and child physical or sexual abuse. (Latest KIDSCOUNT data available in Figure 53).
• Local nonprofit youth development programs.
• Strong public schools.
FIGURE 52: PRIORITIES FOR YOUTH
• Improve support for single parent families throughout youth development activities and community resource systems.
Increase transportation support for out-ofschool activities.
Develop systems for reducing or responding to hidden costs of participation in extracurricular activities.
• Youth programs (school or community-based) designed with attention to parents’ common work hours.
• Increase out-of-school time programs for all ages (including middle and high school youth)
Green = Improved Red = Worsened
Teen Birth Rate (per 1,000 Females, Ages 1519)
Children in Need of Services (CHINS) Newly Opened Cases (20222023)
Single Parent Families (as percent of all families with own children under 18) (2022-2023)
Children Living in Deep Poverty, Ages 0-17
Food Insecure Children (2020-2021)
Students Experiencing Homelessness (20222023)
and increase or improve efforts to engage youth in such programs.
Intergenerational engagement and mentoring.
Build relationship skills.
Programs to develop and support child/ teen aspirations.
• More to support children and families - passes to movies, the YMCA, public pools.
• Build more programs to support the well-being of parents.
• Reestablish and reinvigorate youth community centers and programs.
FIGURE 53: KIDSCOUNT COUNTY PROFILES OF CHILD WELL-BEING, SELECTED VARIABLES
Clark
Floyd
Use closed stores’ spaces to host programs and help kids be involved with each other and other community members.
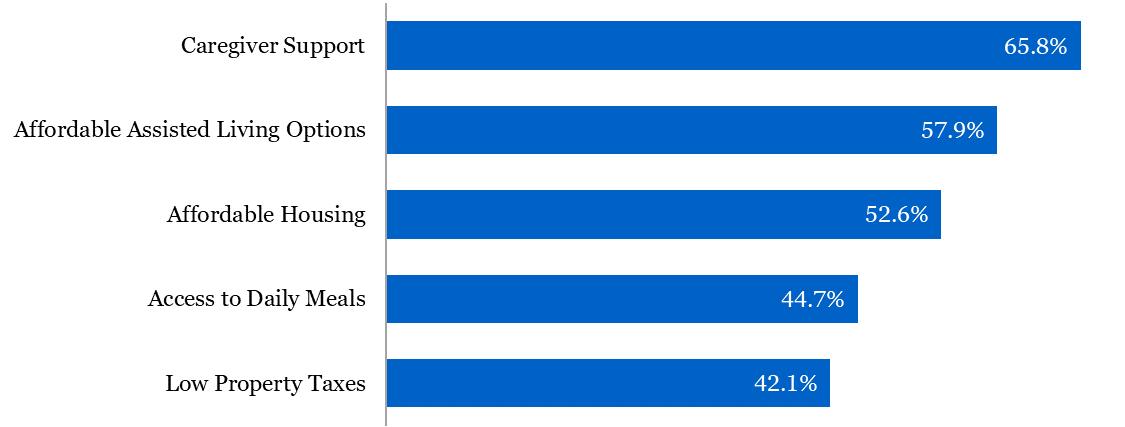
The aging population is growing and will continue to grow as the tail end of the Baby Boom generation reaches age 65 over the next five years. At that point, the senior population will reach its apex. The generation that follows the Boomers is far smaller, but we will continue to feel the impact of the Baby Boom generation for the next 20-30 years.
A large aging population will require the region to increase the workforce of home health aids, the supply of assisted living, and the availability of programs to engage seniors and keep them socially and physically active. Listening session discussions centered again on housing, support for basic
needs, and homebased care for those who cannot afford to pay for it. The largest share of survey respondents identified caregiver support as a priority, followed by affordable assisted living options and affordable housing (Figure 54). Access to daily meals and low property taxes rounded out the top five. Three of the top five items center on the cost of housing and one on the social supports needed to ensure caregivers are equipped to meet the needs of our aging population.
Listening session discussions identified the following assets:
• Senior programs – senior games.
• Area agency on aging is strong.
• Exercise programs for seniors at the local nonprofit gym.
• Senior volunteer program.
• Active faith communities.
that maintain independence as long as it is safe and feasible.
Residents see opportunities to support seniors by focusing on safe affordable housing and by engaging seniors to help address some of our other challenges in ways that benefit all those involved.
• Ensure housing options for seniors are safe.
• Increase diversity of affordable housing options that support phases of aging in ways
• Engage seniors who are able and interested to provide intergenerational social activities and programs for children and youth.
• Capitalize on seniors’ knowledge and experience in educating children and youth on career pathways and opportunities and to help them develop soft skills for success in their work and personal lives.
FIGURE 54: PRIORITIES FOR SUPPORTING AN AGING POPULATION
Source: United States Census Bureau. 2023. “Table DP05: ACS Demographic and Housing Estimates.” American Community Survey 5-Year Estimates Subject Tables, 2019-2023. Retrieved December, 2024.
Source: United States Census Bureau. 2023. “Table S1810: Disability Characteristics.” American Community Survey 5-Year Estimates Subject Tables, 2019-2023. Retrieved December, 2024.
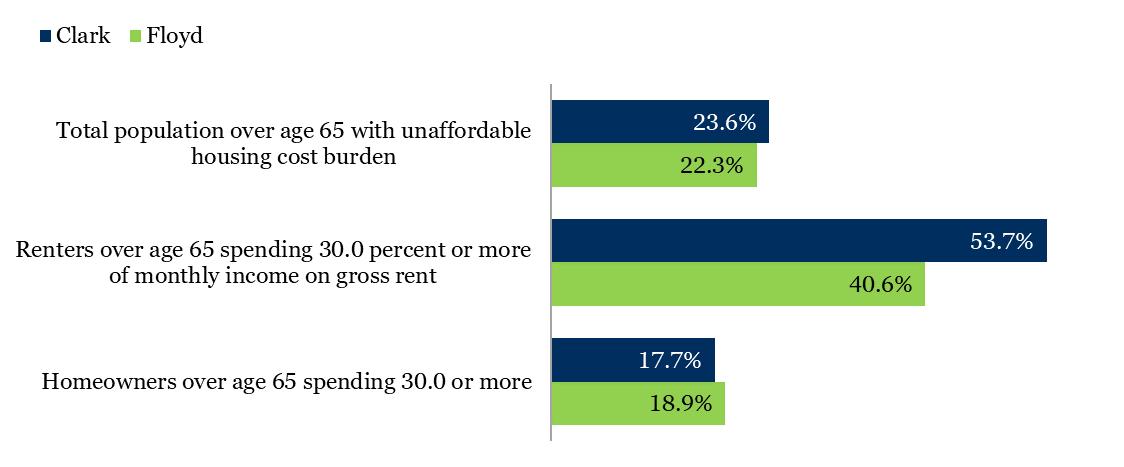
Source: United States Census Bureau. 2023. “Table B2072: Age of Householder by Gross Rent as a Percentage of Household Income in the Past 12 Months.” American Community Survey 5-Year Estimates Subject Tables, 2019-2023. Retrieved January, 2025; and United States Census Bureau. 2023. “Table B25093: Age of Householder by Selected Monthly Owner Costs as a Percentage of Household Income in the Past 12 Months.” American Community Survey 5-Year Estimates Subject Tables, 2019-2023. Retrieved January, 2025.
FIGURE
FIGURE 57: SENIOR HOUSING COST BURDEN
FIGURE 56: SENIOR DISABILITY PREVALENCE
Residents generally enjoy living in Clark and Floyd counties, appreciating local amenities and improvements like new restaurants and increased walkability in urban centers. Many value the opportunity to reside in quiet rural areas or on larger properties while still having easy access to Clarksville, Jeffersonville, New Albany, and Louisville.
While many we spoke with praised the strong sense of community, they also felt it was increasingly difficult to make ends meet. They expressed gratitude for being asked for their input and wished local elected officials would engage more directly with everyday residents to understand their needs.
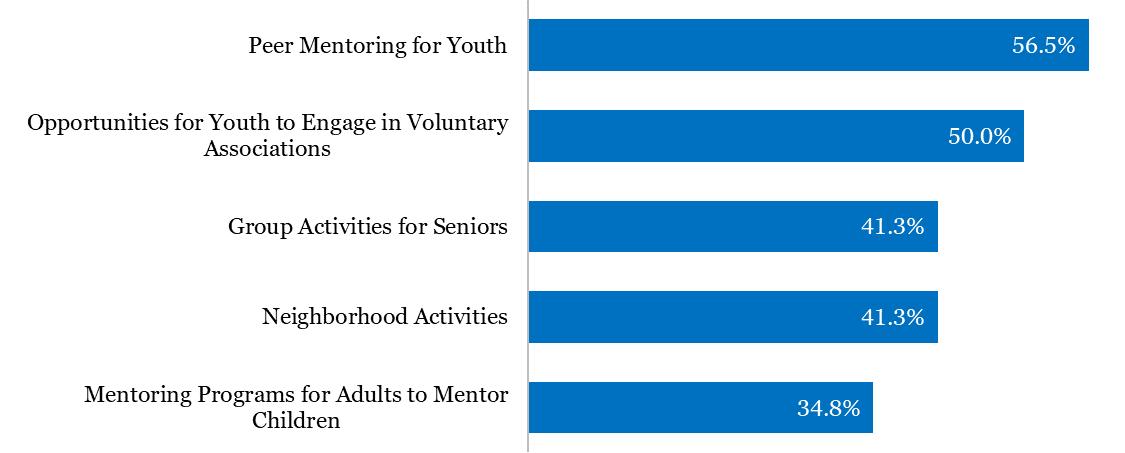
Survey respondents prioritized more intergenerational and neighborhood activities to combat social isolation, build community, and
FIGURE 58: COMMUNITY BUILDING PRIORITIES
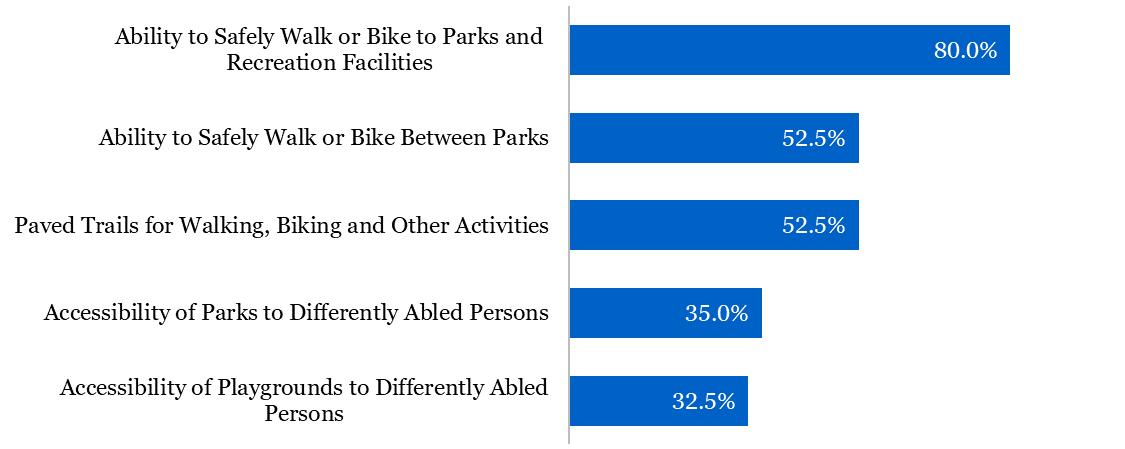
FIGURE 59: QUALITY OF PLACE PRIORITIES
support youth development and healthy aging (Figure 58). When asked to prioritize recreational aspects of quality of place, survey respondents overwhelmingly prioritize walkability and safe bicycle access to parks and recreation facilities (Figure 59). Accessibility of parks and playgrounds to differently abled persons rounded out the top five priorities.
Listening session participants identified key assets for the region and prioritized infrastructure as well as community building and improving the systems of civic life in the region.
• Small town with city feel "access to city vibe without living there.”
• Excellent parks and recreational amenities.
• Faith community.
• Community events like outdoor movie nights, concerts, and festivals.
Infrastructure, Public Services and Utilities
• Public libraries.
• Walkable downtowns in New Albany and Jeffersonville.
• Good sidewalks.
• Amphitheaters.
• Trails.
Safety
• Good place and improving.
• Active neighborhood associations.
• Police are committed and doing a good job.
• Stoplight security.
Natural Resources
• Clean spring water.
• Tree Walk – conservation efforts.
• Ohio River.
• State Park in Clark County.
Listening session participants suggested the following opportunities:
• Increase and improve transportation for the elderly.
• Continue work on sidewalk repair.
• Continue to work on becoming a drug free and crime free community.
• More visibility around elections & candidates. “We need a good voter guide.”
• Community leaders connecting with the community.
• Community building activities – get people interacting with each other.
• Resource guide – update two times each year. Currently available resources are not up-to-date or complete.
This report explores the evolving landscape of Clark and Floyd counties, providing an updated statistical abstract and highlighting key assets and opportunities for growth and improvement. We shared how residents perceive changes since the COVID-19 pandemic, examining shifts in social connection, economic well-being, and access to essential services. This concluding section synthesizes insights from the data and presents the "big ideas" that emerged from our community engagement efforts ideas that offer actionable pathways toward a more resilient and equitable future for all residents.
Economic and Financial Well-Being
Community members want our region to establish a work “Uber” that provides on-demand rides and is subsidized by employers and the public to ensure that transportation is not a barrier to gainful employment.
Basic
Needs
Participants want to see programs to repair and rehabilitate older housing to increase housing supply and affordability. They want to make sure we are housing our veterans, regardless of their eligibility for existing veteran housing programs.
Health and Well-Being
When asked what they think has changed since the COVID-19 shut down, participants noted that people came out at first but have returned to their homes and are staying there. People are more divided and isolated than ever. Community members feel like there are fewer things to do and places to go.
Participants think the quality of jobs available to average people is declining and that incomes simply are not keeping up with the cost of living. For some, they were laid off during COVID and have never gone back to work. They believe that gun violence, domestic violence, health, mental health, substance use, violence in general, and housing availability have all worsened since the pandemic. Young people have fewer opportunities. Use of technology is keeping people apart and people are getting too comfortable with isolation.
When asked for big ideas, participants thought of ways to address the issues they see as the region’s greatest challenges.
Residents want to see veteran healthcare on this side of the river.
Education and Workforce Development
Residents are concerned about school safety and want to see more parent engagement with family nights at schools and more support for parents in those programs.
• Community members envision holistic workforce development programs that include job skill training for today’s jobs (i.e. computer skills), incorporate clothes, personal products, and transportation into the support for accessing and maintaining employment.
Residents envision programs to strengthen the pipeline for River Ridge employees. They want to see technical training that keeps workers upto-date and ensures that people can improve and maintain financial well-being.
• One group suggested we address the affordable housing crisis by developing a program like Youth Build to train young people in the trades while adding affordable housing units to the local market.
Youth Development
Participants want to see programs that will help youth build healthy relationships and strong aspirations so they may avoid some of the challenge and dysfunction we see in our communities.
less socially and academically engaged. Despite local healthcare organizations, these residents encounter long waitlists for therapists and special needs services.
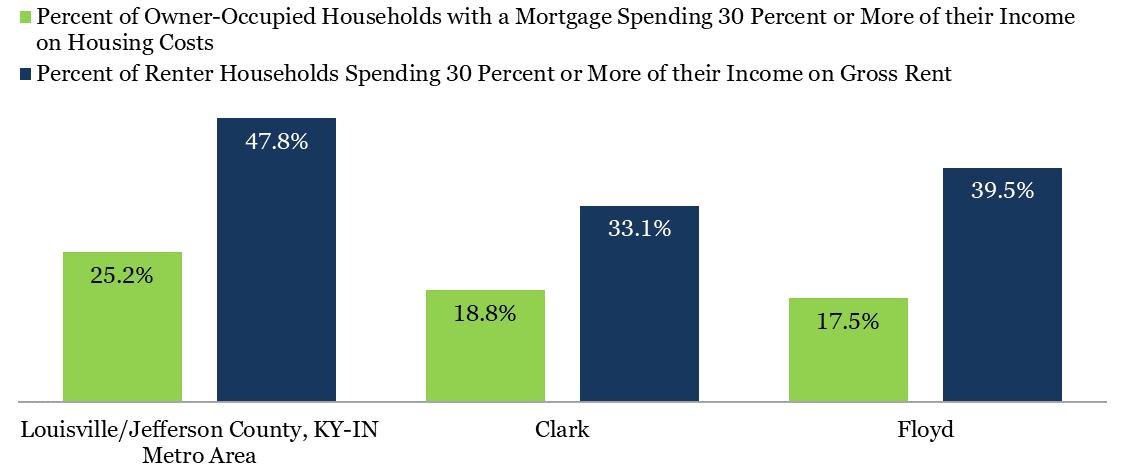
Economic Strain and Housing Affordability
Rental rates are high, and entry-level homeownership is out of reach for most, as even modest home prices have significantly increased. More than half of Clark county renters and one in five homeowners spend over 30% of their monthly income on housing. Furthermore, pandemicrelated inflation has led to far greater concern about hunger than observed in our pre-pandemic studies.
Health Trends
Residents of Clark and Floyd counties express strong community attachment, valuing natural amenities and recent improvements like walkable city centers and enhanced park/trail access. They acknowledge economic development has spurred growth, with new high-end construction signaling prosperity.
However, many, especially households earning under $75,000, face struggles. Their incomes do not keep pace with inflation, and their children are
While some health indicators show improvement, such as lower rates of physical inactivity and smoking, obesity rates have increased, and a smaller percentage of people report having access to exercise opportunities. The average number of poor physical health days reported in the last 30 days has declined, but the average reported days of poor mental health have increased. Opioid deaths remain high, though 2024 saw declines.
Education and Workforce Development
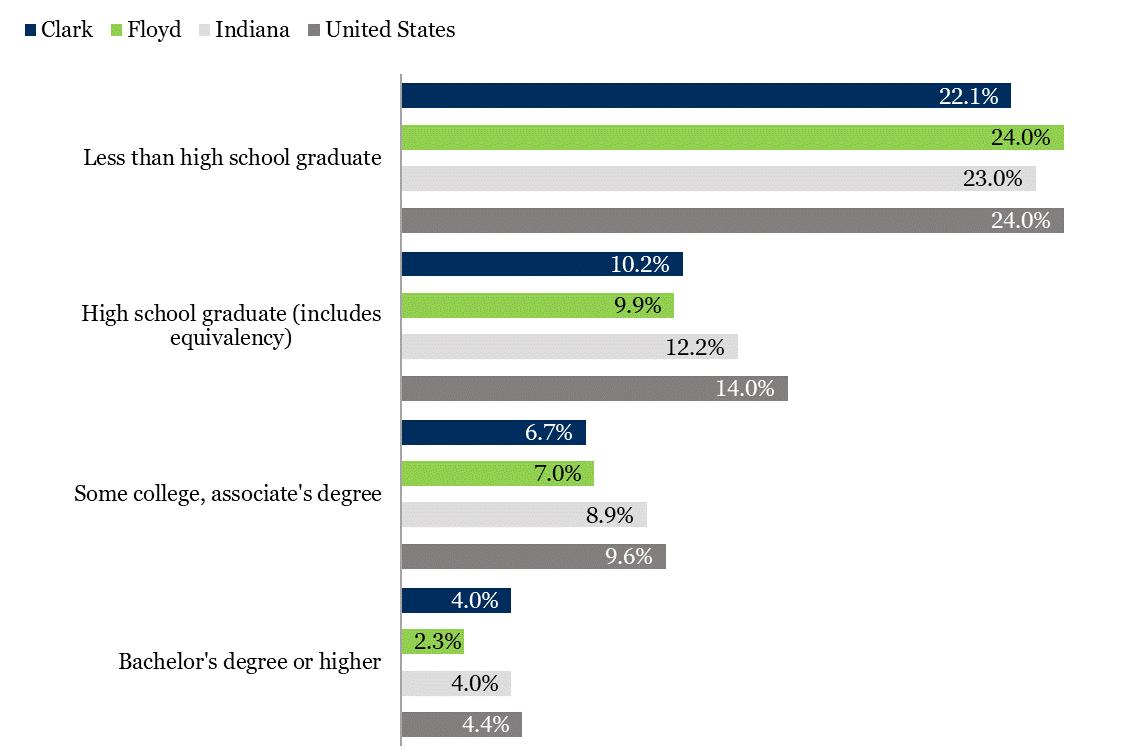
Residents generally feel positive about the quality of local schools and access to technical training and higher education. However, both the region and the state lag behind national college attainment rates. Floyd county's college attainment rate surpasses the state's, but Clark county's falls nearly four percentage points below the state rate.
Local school data indicates increasing racial and ethnic diversity, with Hispanic students comprising 10.9% of Clark county's student population. Nearly half of Clark county students and over a third of Floyd county students are economically disadvantaged, and about one in five has a disability.
Despite these challenges, over a third of Clark county students and nearly half of Floyd county students graduated with Academic and/or Technical Honors in 2023.
This report updates public data from our 2021 publication. While overlapping data samples prevent direct statistical comparisons, this update provides a fresh snapshot of our current standing and highlights areas where we can build on strengths to address challenges.
Conversations with community members underscore the critical need for affordable housing and robust support for children, youth, parents, and families. The shortage of affordable housing for those at or below the median income places immense strain on households. Many of these families require more assistance and fewer barriers to activities that foster resilience and help young people thrive. While single mothers have the greatest need for support, developing programs that benefit working single parents with limited incomes will encourage broader engagement across all income levels and household types. The call for greater engagement extends beyond children and youth, with participants emphasizing the need to build community across differences and focus on healthy relationships to reduce violence and improve mental health.
• Work creatively to increase the supply of affordable housing. This can connect to training disconnected youth in the trades to rehabilitate or build affordable housing. This work will need to cut across sectors and employ multiple strategies to meet the need for more housing at prices affordable to those earning 50%-80% of Area Median Income.
• Monitor access to nutrition. People are concerned about hunger, local food banks have struggled with supply, and recent changes to food assistance may exacerbate the existing challenge.
• Even as we address hunger, obesity rates remain high. Support healthy lifestyles, healthy relationships, and greater access to primary and behavioral health care.
• Explore possibilities for subsidized on-demand transportation to support access to education, training, and work, and senior needs.
• Continue to support and improve youth development, education, and training at all levels (cradle to career).
• Remove barriers to youth engagement in public school extra-curricular activities by providing additional bus service and minimizing or eliminating both explicit and hidden costs of participation.
• Build and attract living wage jobs that can support healthy families.
Across various domains, from employment to youth and senior activities, a consistent need emerges for safe and reliable transportation. Lack of transportation impacts employment, youth extracurricular participation, social engagement, and access to healthcare.
Among the top priority areas, data and resident input suggest the following opportunities:
This update clearly indicates the pandemic disrupted activities and their availability. Local economic development presents significant opportunities, and residents are eager to see these benefits extend to the working poor and working class. While quality of place has improved in many ways in recent years, the region must continue working to ensure shared prosperity for all who live and work here.