Central Highlands | June 2019

Economic profile
Abbreviations
Throughout this profile a series of abbreviations has been utilised. These are summarised below:
ABS
CH
CHDC
CHRC
Central Queensland SA4
GRP
LGA
M2
QGSO
Australian Bureau of Statistics
Central Highlands
Central Highlands Development Corporation
Central Highlands Regional Council
Central Queensland Statistical Area Level 4
Gross Regional Product
Local Government Area
Square metres
Queensland Government Statistician’s Office
QLD Queensland
RTA
SA4
TRA
Residential Tenancies Authority
Statistical Area Level 4
Tourism Research Australia
1 Central Highlands Development Corporation Contents Overview Our region in numbers 2 Regional snapshot 4 Demographics Population 5 Population projections 6 Non-resident population 7 Age 8 Origin 9 Wellbeing 11 Education 13 Income and families 14 Dwelling tenure and structure 15 Employment Industry 16 Occupation 18 Age and qualifications 19 Method of travel to work 20 Industry Output 21 Value-added 22 Local expenditure and regional exports 23 Regional imports and key industry drivers 24 Key industry drivers 25 Summary indicators and gap analysis 27 Gap analysis 28 Major projects 29 Housing Building approvals 30 Residential lot approvals 31 Lot registrations 32 New lot sales and median price 33 Dwelling sales and median price 34 Median weekly rent 35 Tourism Output 36 Employment 37 Distribution of tourist dollar and visitor profile 38 Emerald Airport 39 Trends Business activity 40 Business registrations 42 Employment 43 Appendix: Agribusiness Regional Stocktake Baseline Data to Drive Growth 44 Bibliography 49 Central Highlands Development Corporation 50
Our region in numbers Central Highlands
$ 8.419 bn
$ 3.777 bn
Mining is the largest employer of both the resident (22.2%) and non-resident (63.6%) workforce $ 5.706 bn
Contribution of the Mining sector to the total value-added for the Central

$ 813.163 m
Domestic imports to the region $ 1.436 bn
$ 2.033 bn
Mining is the highest contributor in terms of local expenditure
$ 3.929 bn
2,899 Businesses registered and operating in the Central Highlands ↑41.2 % Increase in number of businesses with turnover of $10 million or more from 2017 to 2018
Legend Capricorn Way Great Inland Way Major Sealed Minor Sealed Part Sealed Willow Gemfields Rubyvale Emerald Capella Upper Bowen Basin Galilee Basin Surat Basin Tieri Comet Bluff Duaringa Blackwater Springsure Rolleston Bauhinia Woorabinda Arcadia Valley Sapphire Bogantungan Oaky Creek Ensham Yarrabee Jellinbah East Kestrel Gregory Crinum Curragh Blackwater Minerva Meteor Downs South Cook Bluff Rolleston 7 7 60 55 55 55 A4 A4 A4 2 Central Highlands QLD 2019 Economic Profile
Output generated
region
The Mining sector comprises 6,079 jobs out of the 17,019 jobs in the
Highlands
Total
Total
GRP
regional export
value-added
for the Central Highlands region
Total local expenditure
Region overview Resources 34.5% 58.0% 22.2% 63.6% $2,190.264 m Source: Economic Profile Central Highlands
2019)
(June
chdc.com.au
$ 839 m
Economic value (2017) compared to $780m (2016)
1,445 Agricultural businesses
1.301 m megalitres
Fairbairn Dam, second largest storage in Queensland
$ 106 m Value of chickpea production
↑90 %
Value increase in wheat ($10m to $19m)
↓ 50 %
Value decrease in sorghum ($40m to $20m)
↑8.62 %
Value increase in cotton ($58m to $63m)
↑112 %
$ 235.556 m Tourism total output
4 nights Average length of stay domestic overnight visitors
Tourism is the 3rd highest employment sector in the Central Highlands
204,073 Annual passengers through Emerald airport 2018–19 FY
$ 56.685 m In wages
Agribusiness 15% 10%+
of national table grape crop
28,645 Population
of national mungbean crop
4.4 % Unemployment rate in the Central Highlands (6.2% in QLD)
33 y.o. Median age vs QLD average of 37
Top five
of Queensland’s mandarin exports
1.37 m
of cattle
of the population live and work in the region
income
Personal CH $843 CH $1,823 QLD $660 QLD $1,402 Median weekly
90% 67.3%
16,190 Labour force
Non-residential
Key drivers in terms of regional exports, employment, value-added and local expenditure on goods and services are: Mining, livestock, grains & other agriculture, accommodation & food services, retail trade, education & training
3 Central Highlands Development Corporation
Value increase in pulses ($50m to $106m) Tourism Community profile
Head
3
Household
4,045
workforce
Largest gemfields in the Southern Hemisphere
Regional snapshot
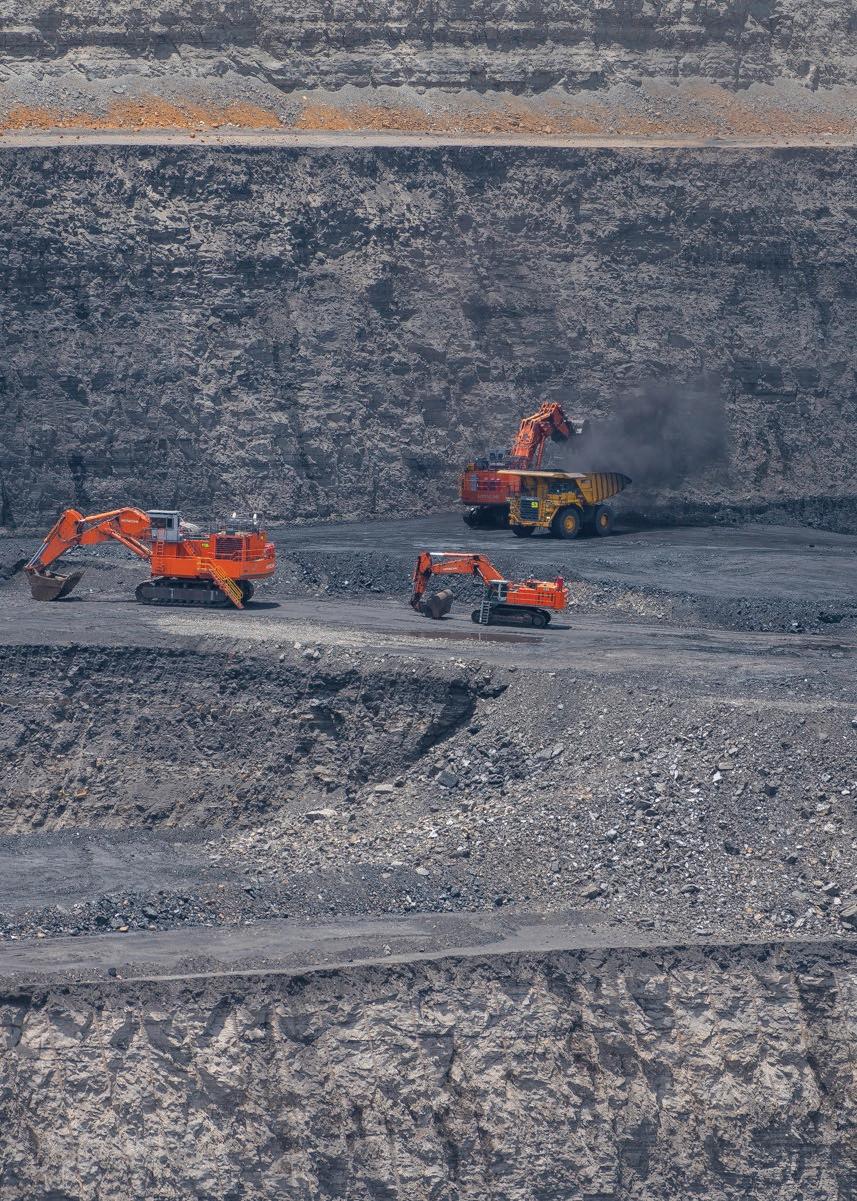
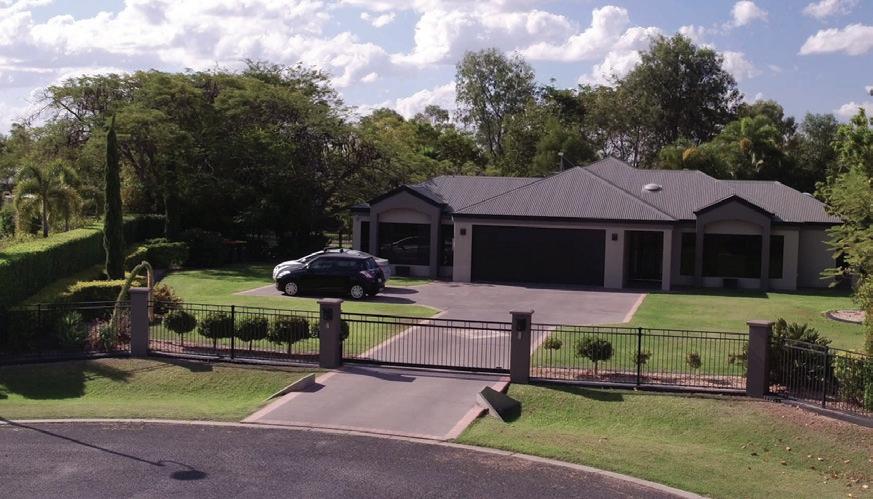
The Central Highlands is a robust region that sits at the heart of Queensland’s resources and agricultural sectors.
Spanning almost 60,000km2, the region includes a significant portion of Australia’s largest coal reserve, the Bowen Basin, and is strategically located to service Australia’s newest mining province, the Galilee Basin.
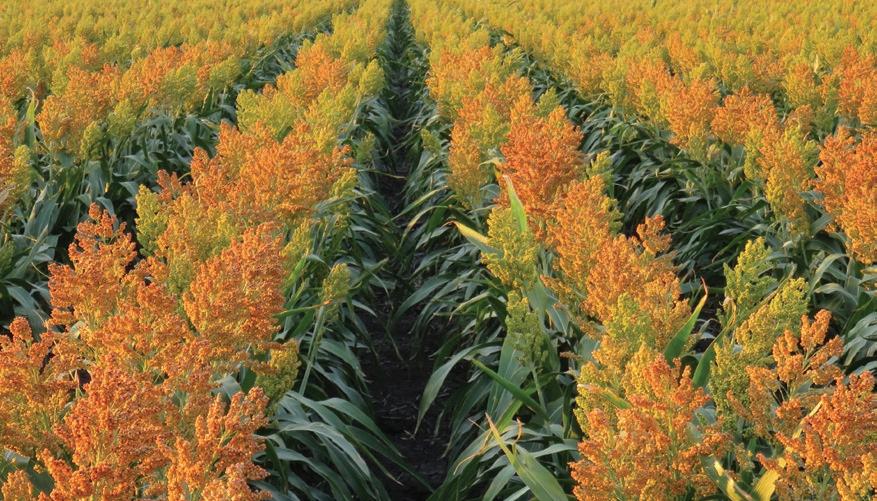
Sustained by irrigation sourced from water storage on the Nogoa and Comet Rivers, the Central Highlands is also characterised by thriving farming industries, including beef, cotton, grapes and citrus.
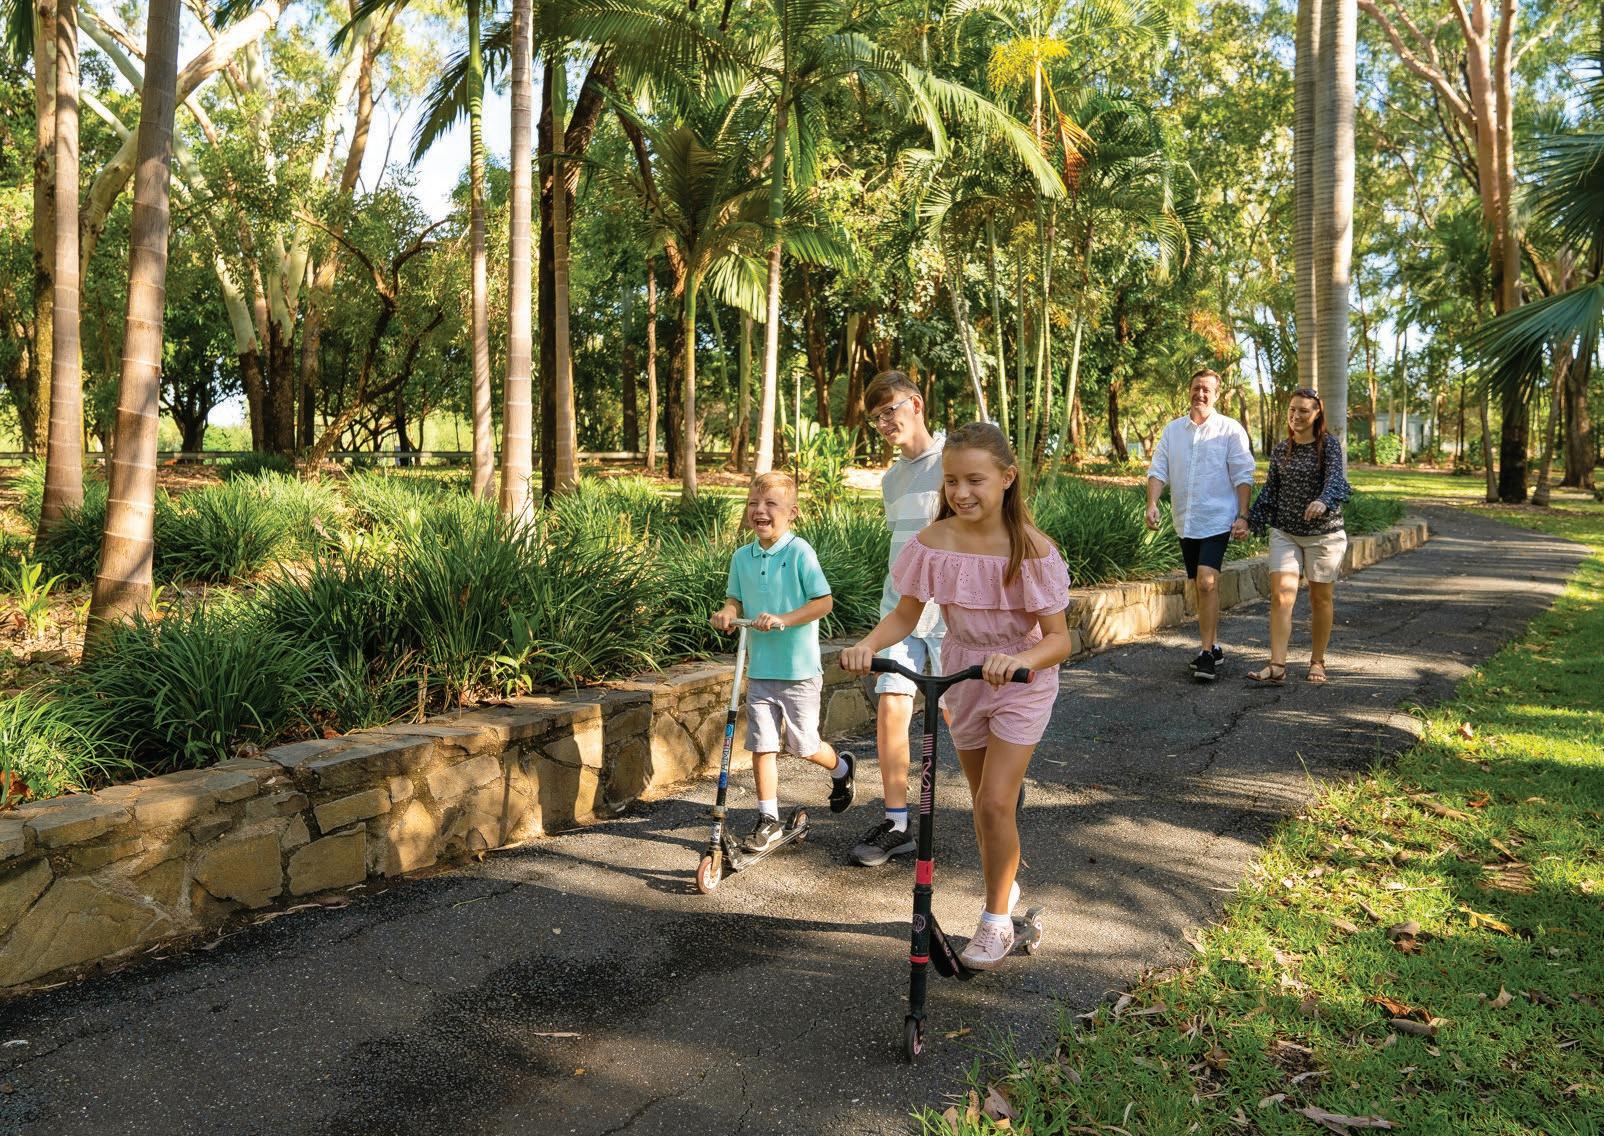
Major freight routes intersect the region, with the Capricorn Highway linking the coast to the outback and the Gregory Highway connecting northern Queensland and New South Wales. Pristine natural attractions, such as Carnarvon Gorge and the Sapphire Gemfields, are driving an emerging tourism market.
A population of more than 28,000 with a median age of 33 helps to underpin the Central Highlands’ economic strength of a skilled, locally-based workforce.
4 Central Highlands QLD 2019 Economic Profile
Indicator Central Highlands Queensland Period Source (year) Demographics Estimated resident population 28,645 5,011,216 2018 ABS (2019a) Projected population 30,133 7,161,661 2041 QGSO (2018b) (Medium series) Resident population growth (annual average) 0.2% 1.6% 2016–2041 QGSO (2018b) (Medium series) Resident and non-resident population growth -0.1% – 2016–2021 QGSO (2018a) (Medium series), QGSO (2018c) & QGSO (2018d) (Series A) Median age 33 37 2016 ABS (2017) Median personal income (weekly) $843 $660 2016 ABS (2017) Median household income (weekly) $1,823 $1,402 2016 ABS (2017) Employment Unemployment rate 4.4% 6.2% 2018 Department of Jobs and Small Business (2019) Labour force 16,190 2,648,089 2018 Department of Jobs and Small Business (2019) Non-residential workforce 4,045 – 2018 QGSO (2018c) Industry Gross regional product $3.93bn $348.97bn 2018 REMPLAN (2019) Passengers Emerald Airport 206,748 – 2017–18 CHRC (2019)
Overview
Demographics
30,133
Population
The Central Highlands population is predicted to remain steady in contrast to the state average
The estimated resident population in the Central Highlands as at 30 June 2018 is 28,645 people. Between 2008 and 2018 the Central Highlands (estimated resident) population increased by 555 people (2.0%), with an average annual compound population growth of 0.2% between 2008 and 2018. The Central Highlands population peaked at 29,782 in 2013 and began to experience a decline thereafter.
Population projections
Queensland Government population projections, 2018 edition (medium series) were released in November 2018. Between 2016 and 2041, the population of the Central Highlands is projected to increase by 1,350 people. This is equivalent to an annual average increase of 0.2% between 2016 and 2041.
Population projections by age cohort – Central Highlands
5 Central Highlands Development Corporation
Population growth per year from 2008 to 2018 Forecast population growth per year from 2016 to 2041 Population by 2041 +0.2% +0.2%
Population
Year 0–14 15–29 30–49 50–64 65–79 80+ Total 2016 7,227 5,743 8,848 4,878 1,775 312 28,783 2021 6,984 5,544 8,395 4,945 2,320 470 28,658 2026 6,616 5,657 8,239 4,808 2,842 682 28,845 2031 6,503 5,743 8,315 4,618 3,181 959 29,319 2036 6,513 5,714 8,309 4,666 3,317 1,236 29,755 2041 6,542 5,603 8,402 4,756 3,315 1,514 30,133 2016–2041 -685 -140 -446 -122 1,540 1,202 1,350 Source: QGSO (2018b) 35,000 30,000 2008 2009 2010 2011 2012 2013 2014 2015 2016 2017 2018 28,090 28,714 29,082 29,541 29,741 29,782 29,598 29,143 28,690 28,604 28,645 25,000 0 Year 5,000 10,000 15,000 20,000 Source: ABS (2019a)
Population projections
65–79 years
Age group projected to experience the largest increase in population from 2016 to 2041 (1,540 people)
The majority of the Central Highlands population sits within the workforce working age demographic of 15–65 Population projections by age cohort – Central Highlands
For each five year period from 2016 to 2041, the annual average population growth in the Central Highlands is projected to gradually increase then remain steady. The annual average population growth in Central Queensland SA4 (comprising the Banana, Central Highlands, Gladstone, Livingstone, Rockhampton and Woorabinda LGAs) and Queensland are projected to gradually decline.
Average annual population growth in the Central Highlands is estimated to be lower than the surrounding Central Queensland SA4 and broader Queensland projections.
6 Central Highlands QLD 2019 Economic Profile
Population growth comparison Central Highlands Central Queensland SA4 Queensland
2016 2026 2036 2041
10,000 0–14 15–29 30–49 50–64 65–79 80+ 7,227 6,616 6,513 6,542 5,743 5,657 5,714 5,603 8,848 8,239 8,309 8,402 4,878 4,808 4,666 4,756 1,775 2,842 3,317 3,315 312 682 1,236 1,514 0 Age 2,000 4,000 6,000 8,000 2.00 1.75 -0.1% 0.4% 1.5% 1.7% 0.9% 0.1% 1.6% 1.1% 0.3% 1.5% 1.0% 0.3% 1.4% 0.9% 0.3% 1.50 -0.25 0 0.50 Year 0.25 0.75 1.00 1.25 2016–2021 2021–2026 2026–2031 2031–2036 2036–2041 Source: QGSO (2018b)
Demographics
Source: QGSO (2018a)
Non-resident population
3.6% vs 0.2% 4,045
Average annual growth of the non-resident population of 3.6% has outpaced resident population growth of 0.2% from 2008 to 2018
Non-resident population
The non-resident population currently sits at 4,045.
The estimated non-resident population in the Central Highlands as at 30 June 2018 is 4,045 people. The average annual non-resident population growth between 2008 and 2018 of 3.6% is significantly higher than the resident population growth over the same period at 0.2%.
Estimated resident population Non-resident workers on shift
Non-resident population projections
Between 2016 and 2021, the non-resident population of the Central Highlands is projected to decrease by 100 people. When combined with the forecasted resident population growth, total full-time equivalent population growth in the Central Highlands between 2016 and 2021 is projected to decrease by 132 people (average annual growth of -0.1%).
7 Central Highlands Development Corporation
40,000 35,000 30,000 2008 2009 2010 2011 2012 2013 2014 2015 2016 2017 2018 25,000 0 Year 5,000 10,000 15,000 20,000 28,090 2,840 2,840 28,714 2,680 29,082 3,225 29,541 4,835 29,741 5,585 29,782 4,740 29,598 3,380 29,143 3,955 3,150 28,690 3,360 28,604 4,045 28,645 3,050 3,110 3,110 3,230 3,360 3,150 4,000 3,500 3,000 2016 2017 2018 2019 2020 2021 2022 2023 2024 3,000 3,000 3,000 2,500 0 Year 500 1,000 1,500 2,000
Source: ABS (2019a) and QGSO (2018c)
Source: QGSO (2018d)
Demographics
Age
60–69 years old 33
Age group has experienced the most growth from 2011 to 2016
Average age compared to the national average of 37
The following demographic section is based on Place of Usual Residence data obtained from the 2016 ABS Census, the latest data available. The 2016 ABS Census was held on 9 August 2016 and data from the 2016 Census was released from mid-2017.
Age distribution
Analysis of the age structure of the Central Highlands residents in 2016 compared to Queensland shows there is a larger proportion of residents aged less than 15 years (24.7%, compared to 19.4% in Queensland). The Central Highlands also comprises a higher proportion of 25 to 54 year olds than Queensland (45.5%, compared to 40.5%). Conversely, the proportion of retirees (those aged 65 years and over) in the Central Highlands (7.6%) is lower than Queensland (15.3%).
Change in age distribution, 2011 to 2016
Between 2011 and 2016, the Central Highlands’ population decreased by 713 people. The largest changes in age structure in this area between 2011 and 2016 were in the age groups:
• 35 to 49 (-473 persons)
• 15 to 19 (-330 persons), and
• 60 to 69 (+264 persons).
8 Central Highlands QLD 2019 Economic Profile
Queensland
Central Highlands
% of population 0–4 5–9 10–14 15–19 20–24 25–34 35–49 50–59 60–69 70–84 85+ 0 5 10 15 20 25 30 9.0% 6.3% 8.9% 6.7% 6.9% 6.4% 5.6% 6.3% 6.1% 6.7% 16.5% 13.8% 21.9% 20.2% 13.0% 12.8% 7.5% 10.7% 4.1% 8.3% 0.5% 1.8% 0–4 5–9 10–14 15–19 20–24 25–34 35–49 50–59 60–69 70–84 85+ -600 -400 -200 0 200 400 -192 -115 -330 17 206 264 146 -473 -182 -227 173 Persons
ABS (2017)
Source:
Source: ABS (2017)
Demographics
The proportion of retirees in the Central Highlands (7.6%) is lower than Queensland (15.3%)
Origin
There is a higher proportion of Aboriginal people in the Central Highlands (4.0%) compared to Queensland (3.2%)
Indigenous status
Analysis of the Indigenous status of Central Highlands’ residents in 2016 compared to Queensland shows that there is a higher proportion of Aboriginals in the Central Highlands (4.0%, compared to 3.2% in Queensland). Overall, the local Indigenous population accounts for 4.3% of the total Central Highlands’ population, which is slightly higher than Queensland (4.0%).
Country of birth
Analysis of the country of birth of Central Highlands’ residents shows a higher proportion of residents born in Australia (76.0%, compared to 71.1% in Queensland). The top 10 countries of birth for Central Highlands’ residents include Australia, New Zealand, England, Philippines, South Africa, India, Zimbabwe, Papua New Guinea, United States of America, and Germany.
9 Central Highlands Development Corporation
% of population Non- Indigenous Aboriginal Torres Strait Islander Both Aboriginal and Torres Strait Islander Not stated 90 0 10 20 30 40 50 60 70 80 6.5% 12.3% 3.2% 4.0% 89.5% 83.4% 0.5% 0.2% 0.4% 0.2% % of population Australia New Zealand England Philippines South Africa India Zimbabwe Papua New Guines United States of America Germany 90 0 10 20 30 40 50 60 70 80 71.1% 76.0% 4.3% 3.7% 3.8% 1.3% 0.8% 1.1% 0.9% 0.8% 1.0% 0.4% 0.2% 0.3% 0.3% 0.2% 0.4% 0.2% 0.4% 0.2% Source: ABS (2017) Source: ABS (2017) Demographics Central Highlands Queensland Central Highlands Queensland
Origin
Population growth in the Central Highlands is being driven by arrivals from overseas, as well as other intrastate locations
Migration
8,635
People migrated to the Central Highlands from outside of Queensland. The second highest group of migrants to the Central Highlands was from overseas
Of the population living in the Central Highlands, 15,749 (56.2%) also lived in the Central Highlands five years ago. The largest migration of residents to the Central Highlands over the five year period from 2011 to 2016 from outside of the LGA was from residents who had previously lived overseas (725 people, or 2.6% of total Central Highlands’ residents), followed by residents from Rockhampton (452 people, or 1.6% of total Central Highlands’ residents). The largest migration of residents to the Central Highlands from outside of Queensland was from Tweed in New South Wales (31 people, or 0.1% of total Central Highlands residents).
10 Central Highlands QLD 2019 Economic Profile
Central Highlands (R) Overseas Rockhampton (R) Brisbane (C) Isaac (R) 376 725 15,749 419 452 Mackay (R) Livingstone (S) Sunshine Coast (R) Moreton Bay (R) State undefined (QLD) 174 246 349 184 217 Persons Gold Coast (C) Townsville (C) Other Bundaberg (R) 0 5,000 2,500 10,000 7,500 15,000 12,500 17,500 8,635 163 158 155 Source: ABS (2017)
Demographics
Wellbeing
Top 28%
The SEIFA Index of Disadvantage for the Central Highlands is 1,006 and is in the top 28% of least disadvantaged LGAs in Australia
Need for assistance
Of the population living in the Central Highlands, 717 people (2.6%) have a need for assistance due to a profound disability, long term health condition or age. This is half the proportion of the population in Queensland with a need for assistance, reflective of a younger population profile in the Central Highlands.
Central Highlands Queensland
Has need for assistance with core activities
Does not have need for assistance with core activities
Not stated
SEIFA (Disadvantage)
Socio Economic Indexes for Areas (SEIFA) is a suite of indexes that has been created by the Australian Bureau of Statistics (ABS) from social and economic Census information. Each index ranks geographic areas across Australia in terms of their relative socioeconomic advantage and disadvantage. This report presents information from the Index of Relative Socio-economic Disadvantage (IRSD), a general socio-economic index that summarises a range of information about the economic and social conditions of people and households within an area. This index includes measures of relative disadvantage only and is not evidence of relative advantage.
The SEIFA index of disadvantage for the Central Highlands (R) is 1,006. The local government area index of the Central Highlands (R):
• Ranks 393 out of 544 local government areas with SEIFA scores in Australia
• There are 151 local government areas which are less disadvantaged, and
• There are 392 local government areas that are more disadvantaged.
11 Central Highlands Development Corporation
% of population
0 20 10 40 30 60 50 80 90 70 100 87.3% 84.3% 5.2% 2.6% 7.6% 13.1% Source: ABS (2017) Demographics SEIFA score 500 1,200
Wellbeing
Tieri The Gemfields
The least disadvantaged locality in the Central Highlands
The most disadvantaged localities are The Gemfields (788) and Willows (828)
Of 60 suburbs and localities located within the Central Highlands with a resident population, the least disadvantaged suburb is Tieri (1,092) and the most disadvantaged suburb is The Gemfields (788) followed by Willows (828). SEIFA Disadvantage
12 Central Highlands QLD 2019 Economic Profile
2016 Localities Score National rank 2016 Localities Score National rank The Gemfields SSC 32819 788 296 / 13,691 Minerva SSC 31869 1,041 9,643 / 13,691 Willows SSC 33110 828 441 / 13,691 Comet SSC 30661 1,052 10,514 / 13,691 Duaringa SSC 30889 931 2,090 / 13,691 Albinia SSC 30023 1,064 11,437 / 13,691 Bingegang SSC 30257 961 3,415 / 13,691 Arcturus SSC 30081 1,064 11,438 / 13,691 Dingo SSC 30852 961 3,417 / 13,691 Cairdbeign SSC 30480 1,064 11,439 / 13,691 Bluff SSC 30296 971 4,005 / 13,691 Orion SSC 32252 1,064 11,443 / 13,691 Balcomba SSC 30122 975 4,262 / 13,691 Carbine Creek SSC 30538 1,072 11,971 / 13,691 Barnard SSC 30168 975 4,263 / 13,691 Chirnside SSC 30608 1,072 11,972 / 13,691 Boolburra SSC 30321 975 4,264 / 13,691 Hibernia SSC 31338 1,072 11,977 / 13,691 Coomoo SSC 30697 975 4,269 / 13,691 Theresa Creek (Qld) SSC 32836 1,072 11,979 / 13,691 Gainsford SSC 31104 975 4,272 / 13,691 Buckland (Qld) SSC 30408 1,075 12,126 / 13,691 Goowarra SSC 31219 975 4,273 / 13,691 Cona Creek SSC 30665 1,075 12,127 / 13,691 Mackenzie SSC 31742 975 4,278 / 13,691 Mantuan Downs SSC 31769 1,075 12,130 / 13,691 Capella SSC 30534 983 4,813 / 13,691 Nandowrie SSC 32120 1,075 12,131 / 13,691 Blackwater SSC 30283 987 5,085 / 13,691 Wealwandangie SSC 33047 1,075 12,133 / 13,691 Springsure SSC 32658 997 5,911 / 13,691 Belcong SSC 30210 1,077 12,243 / 13,691 Central Highlands (R) 1,006 393 / 544 Bundoora (Qld) SSC 30431 1,077 12,244 / 13,691 Arcadia Valley SSC 30078 1,023 8,071 / 13,691 Crinum SSC 30757 1,077 12,245 / 13,691 Consuelo SSC 30672 1,023 8,075 / 13,691 Khosh Bulduk SSC 31535 1,077 12,248 / 13,691 Humboldt SSC 31385 1,023 8,079 / 13,691 Lilyvale SSC 31673 1,077 12,249 / 13,691 Jellinbah SSC 31451 1,023 8,080 / 13,691 Lowestoff SSC 31713 1,077 12,250 / 13,691 Lowesby SSC 31712 1,023 8,081 / 13,691 Mount Macarthur SSC 32006 1,077 12,252 / 13,691 Rewan SSC 32445 1,023 8,082 / 13,691 Retro SSC 32444 1,077 12,254 / 13,691 Stewarton (Qld) SSC 32686 1,023 8,083 / 13,691 Wyuna (Qld) SSC 33220 1,077 12,256 / 13,691 Togara SSC 32867 1,023 8,084 / 13,691 Tieri SSC 32853 1,092 12,929 / 13,691 Argyll SSC 30083 1,025 8,250 / 13,691 Alsace SSC 30046 No score Lochington SSC 31687 1,025 8,256 / 13,691 Blackdown SSC 30277 No score Emerald (Qld) SSC 30982 1,026 8,336 / 13,691 Carnarvon Park SSC 30547 No score Rolleston SSC 32485 1,031 8,775 / 13,691 Cheeseborough SSC 30591 No score Bauhinia SSC 30185 1,040 9,551 / 13,691 Coorumbene SSC 30714 No score Goomally SSC 31203 1,040 9,558 / 13,691 Cotherstone SSC 30735 No score Mimosa (Qld) SSC 31865 1,040 9,560 / 13,691 Dromedary (Qld) SSC 30887 No score Mungabunda SSC 32087 1,040 9,562 / 13,691 Fork Lagoons SSC 31080 No score Oombabeer SSC 32244 1,040 9,563 / 13,691 Gordonstone SSC 31223 No score Rhydding SSC 32446 1,040 9,564 / 13,691 Wallaroo (Qld) SSC 32996 No score Gindie SSC 31137 1,041 9,641 / 13,691 Wooroona SSC 33189 No score
(1,092)
Demographics
Central Highlands’ residents predominantly hold Certificate qualifications
Qualifications
The largest increase in qualifications from 2011 to 2016 was for residents with Graduate Diplomas and Graduate Certificates
31.0%
Analysis of the qualifications of the population in the Central Highlands compared to Queensland shows 7.8% of Central Highlands’ residents with a Bachelor Degree or higher, compared to 14.7% in Queensland. A higher proportion of Central Highlands’ residents hold a Certificate qualification (18.8%) compared to Queensland (17.2%).
Overall, 31.0% of the population hold educational qualifications, and 57.0% hold no qualifications, compared with 38.9% and 52.4%, respectively for Queensland.
Central Highlands Queensland
Change in Qualifications, 2011 to 2016
The largest changes in the qualifications of the population of the Central Highlands between 2011 and 2016 are in those with:
• No Qualifications (-1,363 persons)
• Graduate Diplomas and Graduate Certificates (+53 persons), and
• Postgraduate Degrees (+38 persons).
13 Central Highlands Development Corporation
Education
Inadequately described/ not stated 8.7% 12.1% No qualifications 52.4% 57.0% % of population Postgraduate Degree Graduate Diploma and Graduate Certificate Bachelor Degree Advanced Diploma and Diploma Certificate 0 20 10 40 30 60 50 70 17.2% 18.8% 1.4% 0.8% 2.9% 0.8% 7.0% 4.5% 10.5% 6.2% 20 53 38 18 29 -1,363 Persons -1,400 -1,000 -1,200 -600 -800 0 -400 -200 200 No qualifications Postgraduate Degree Graduate Diploma and Graduate Bachelor Degree Advanced Diploma and Diploma Certificate Source: ABS (2017) Source: ABS (2017) Demographics
of the population hold educational qualifications
Income and families
23.0%
Weekly Individual Income
Analysis of individual income levels in the Central Highlands in 2016 compared to Queensland shows that the median weekly income is higher for local residents when compared to the broader State; $843 vs $660.
Overall, 23.1% of persons earn a low income (less than $400 per week) and 23.0% earn a high income ($1,500 or more per week), compared to 28.4% and 15.1%, respectively in Queensland.
Central Highlands Queensland
Family Composition
Central Highlands comprises a higher proportion of couple families with children (51.1%) when compared with Queensland (42.5%), and a lower proportion of couple families with no children (36.6%) compared with Queensland (39.4%).
Overall, 11.1% of families are one parent families, and 1.2% are other families, compared with 16.5% and 1.6%, respectively for Queensland.
Central Highlands Queensland
14 Central Highlands QLD 2019 Economic Profile
% of population Negative 20 0 5 10 15 0.5% 0.7% Nil income 8.0% 7.9% $1 to $149 4.1% 3.9% $150 to $299 7.1% 5.1% $300 to $399 8.7% 5.6% $400 to $649 16.4% 11.5% $650 to $799 8.0% 6.3% $800 to $999 8.5% 6.8% $1,000 to $1,249 8.5% 7.7% $1,249 to $1,499 5.7% 6.2% $1,500 to $1,999 8.0% 9.4% $2,000 or more 7.1% 13.7% Not stated 9.4% 15.4% One parent family 16.5% 11.1% Other family 1.6% 1.2% % of families Couple family with no children Couple family with children 0 20 10 40 30 50 60 42.5% 51.1% 39.4% 36.6% Source: ABS (2017) Source: ABS (2017) of Central Highlands’ residents earn $1,500 per week or more
Demographics
The Central Highlands comprises a higher proportion of couple families with children than the Queensland average
Dwelling tenure and structure
45.6%
of dwellings are owned outright or with a mortgage
Dwelling Tenure
Analysis of the housing tenure of dwellings in the Central Highlands in 2016 compared to dwellings in Queensland shows there is a larger proportion of rented dwellings or dwellings under other tenure types. This is reflective of the large non-resident workforce in the region, who are renting or living in various short term accommodation arrangements.
Overall, 45.6% of dwellings are owned outright or with a mortgage, 34.6% are being rented and 6.3% are other tenure types, compared to 58.6%, 31.3% and 2.0%, respectively in Queensland.
Dwelling Structure
As at 2016, there are 10,713 separate houses in the Central Highlands; 1,657 medium density dwellings, 6 high density dwellings, 938 caravans, cabins or houseboats; and 38 other dwellings.
There is a significantly higher proportion of ‘Caravan, cabin, houseboat’ dwellings in the Central Highlands (6.8%) compared to Queensland (2.1%). This can be attributed to the large number of non-residents staying in employer-provided accommodation while working in the region.
15 Central Highlands Development Corporation
Central Highlands Queensland
% of dwellings Owned outright 0 20 10 40 30 27.4% 22.0% Owned with a mortgage 31.3% 23.5% Rented 31.3% 34.6% Other tenure type 2.0% 6.3% Not stated 8.2% 13.6% % of dwellings Separate house 0 40 20 100 80 60 73.7% 77.4% Medium density 15.7% 12.0% High density 7.8% 0.0% Caravan, cabin, houseboat 2.1% 6.8% Other 0.2% 0.3% Not stated 0.6% 3.6% Source: ABS (2017) Source: ABS (2017)
Central Highlands Queensland
Demographics
Rented dwellings represent the highest proportion of dwelling tenure in the Central
Highlands
Mining
Within the Central Highlands workforce, the Mining sector comprises the largest number of employees
The Agriculture, forestry & fishing sector experienced the largest increase in jobs from 2011 to 2016
The following graphs illustrate the profile of employed people whose place of work is located within the Central Highlands. This includes residents and non-residents.
Employment by industry
The total employment estimate for the Central Highlands as at the 2016 Census is 17,019 jobs. The ‘Mining’ sector comprises 6,079 jobs, followed by the ‘Agriculture, forestry & fishing’ sector (1,791 jobs) and the ‘Retail trade’ sector (1,184 jobs).
Change in jobs by industry sector, 2011 to 2016
Between the 2011 and 2016 Census periods, there was a net decrease of 2,239 jobs in the Central Highlands.
16 Central Highlands QLD 2019 Economic Profile Industry
6,079 1,791 1,184 1,132 1,010 971 768 660 627 602 469 374 342 325 268 144 126 84 63 Information media & telecommunication Arts & recreation services Financial & insurance services Electricity, gas, water & waste services Rental, hiring & real estate services Manufacturing Wholesale trade Professional, scientific & technical services Administrative & support services Public administration & safety Transport, postal & warehousing Other services Health care & social assistance Construction Accommodation & food services Education & training Retail trade Agriculture, forestry & fishing Mining 7,000 1,000 2,000 3,000 4,000 5,000 6,000 0 Jobs 1 Information media & telecommunication 10 Arts & recreation services -32 Financial & insurance services 31 Electricity, gas, water & waste services -20 Rental, hiring & real estate services -258 Manufacturing -97 Wholesale trade -118 Professional, scientific & technical services 16 Administrative & support services -5 Public administration & safety -130 Transport, postal & warehousing -120 Other services 18 Health care & social assistance -1,112 Construction -125 Accommodation & food services 140 Education & training -54 Retail trade 180 Agriculture, forestry & fishing -564 Mining 200 -1,000 -800 -600 -400 -200 0 -1,200 Jobs Source: ABS (2017) Source: ABS (2017)
Employment
17,019 Mining
The Central Highlands has a total workforce of 17,019, with 67.3% of workers residing locally
is the largest employer of both the resident (22.2%) and non-resident (63.6%) workforce
17 Central Highlands Development Corporation Employment Industry
Industry Sector Total jobs Resident workforce Non-resident workforce No. % Change from 2011 No. % Change from 2011 No. % Change from 2011 Agriculture, forestry & fishing 1,791 11.2% 1,530 7.4% 261 40.0% Mining 6,079 -8.5% 2,545 -24.3% 3,534 7.7% Manufacturing 325 -44.3% 204 -49.4% 121 -32.8% Electricity, gas, water & waste services 144 27.4% 121 32.7% 23 5.6% Construction 971 -53.4% 613 -37.3% 358 -67.6% Wholesale trade 342 -22.1% 266 -20.7% 76 -26.5% Retail trade 1,184 -4.4% 1,073 2.0% 111 -40.4% Accommodation & food services 1,010 -11.0% 831 -7.3% 179 -25.0% Transport, postal & warehousing 627 -17.2% 500 -11.6% 127 -33.7% Information media & telecommunications 63 1.6% 39 -28.1% 24 221.6% Financial & insurance services 126 -20.3% 104 -27.1% 22 40.7% Rental, hiring & real estate services 268 -6.9% 203 -18.2% 65 62.6% Professional, scientific & technical services 374 -24.0% 299 -24.5% 75 -22.0% Administrative & support services 469 3.5% 320 4.2% 149 2.1% Public administration & safety 602 -0.8% 522 -0.8% 80 -0.7% Education & training 1,132 14.1% 1,023 11.6% 109 44.9% Health care & social assistance 768 2.4% 667 3.0% 101 -1.6% Arts & recreation services 84 13.5% 66 7.6% 18 43.2% Other services 660 -15.4% 535 -7.8% 125 -37.3% Total 17,019 -11.6% 11,461 -11.8% 5,558 -11.4%
Source: REMPLAN (2019)
Occupation
4.4%
The unemployment rate has increased from 2.4% in 2009 to 4.4% in 2018
Unemployment rate
The unemployment rate in the Central Highlands in 2018 was 4.4%. From 2009 to 2018, the unemployment rate in the Central Highlands has ranged from a low of 2.4% in 2009 to a peak of 5.0% in 2015.
Central Highlands Central Queensland SA4 Queensland
Occupation
Compared to the Central Queensland SA4 and State averages, the Central Highlands has a higher proportion of ‘Technicians and Trades Workers’ and ‘Machinery Operators and Drivers’.
18 Central Highlands QLD 2019 Economic Profile
Work in the Central Highlands Work in Central Queensland SA4 Work in Queensland 8.0% 7.0% 2009 2010 2011 2012 2013 2014 2015 2016 2017 2018 6.0% 0 Year 1.0% 2.0% 3.0% 4.0% 5.0% % of workers Managers 30 0 5 10 20 25 15 11.3% 12.1% 12.5% 14.6% 20.3% 10.1% 18.3% 14.2% 21.0% 10.2% 11.7% 5.9% 12.0% 13.7% 9.0% 8.7% 9.9% 6.4% 12.1% 6.8% 24.5% 12.2% 10.5% 10.1% 0.8% 0.8% 0.6% Professionals Technicians & trade workers Community & personal service Clerical & administrative workers Sales workers Machinery operators & drivers Labourers Not stated/ inadequately described
Department of Jobs and Small Business (2019); ABS (2019b)
REMPLAN (2019)
Source:
Source:
Employment
The Central Highlands workforce is dominated by Machinery Operators and Drivers and
Technicians
and Trades Workers
Age and qualifications
25–44 yrs
Workers in the Central Highlands are predominantly in the 25 to 44 year age group
Age
The workforce age profile for the Central Highlands shows a higher proportion of workers in the 25 to 44 year age group compared to the Central Queensland SA4 and State benchmarks.
Work in the Central Highlands
Work in Central Queensland SA4
Work in Queensland
Qualifications
Workers in the Central Highlands have a lower representation of graduate qualifications (Bachelor Degree and higher) when compared to the Central Queensland SA4 and State averages. A higher proportion of workers have Certificate or No Qualifications in comparison to these benchmark areas.
Work in the Central Highlands
Work in Central Queensland SA4
Work in Queensland
19 Central Highlands Development Corporation
Employment
55–64 4.7% 6.4% 5.9% 8.4% 9.1% 9.7% 24.1% 21.4% 21.8% 25.0% 21.8% 22.0% 22.1% 22.7% 21.9% 13.1% 15.4% 14.9% 2.3% 2.9% 3.5% 0.2 0.4% 0.4% % of workers 15–19 20–24 25–34 35–44 45–54 65–74 Over 0 20 10 5 25 15 30 No qualifications 42.6% 40.5% 34.6% 36.7% 32.5% 26.4% 6.6% 8.3% 11.0% 10.2% 12.4% 18.1% 0.9% 1.8% 2.5% 1.2% 2.2% 5.0% % of workers Postgraduate Degree Graduate Diploma and Graduate Certificate Bachelor Degree Advanced Diploma and Diploma Certificate 0 30 10 40 20 50 Source:
Source:
REMPLAN (2019)
REMPLAN (2019)
Method of travel to work
65.9% 67.3%
Breakdown of the Central Highlands’ workforce
Of the 17,019 jobs in the Central Highlands, 11,461 workers (67.3%) also live in the region. Approximately 32.7% of workers (5,558 workers) in the Central Highlands live outside of the region. This is significantly higher than Central Queensland SA4 (12.8%) and is indicative of the large proportion of non-resident workers in the region. Central Highlands Central Queensland SA4
Source: REMPLAN (2019)
Method of travel to work
Over 98.7% of the Central Highlands’ workforce use the following methods to travel to work. Approximately 65.9% of workers travel by car (either as driver or passenger), 6.2% work from home and 5.6% of workers use the bus.
20 Central Highlands QLD 2019 Economic Profile
% of workers Work and live in region Work in region, live elsewhere 0 20 10 40 30 60 50 80 90 70 100 87.2% 67.3% 12.8% 32.7% (One method) Car, as driver Did not go to work Worked at home (One method) Bus (One method) Car, as passenger 954 2,321 10,185 1,023 1,047 (One method) Walked only (One method) Other (One method) Truck (Two methods) Car and other (Two methods) Bus and car as driver 96 171 781 107 113 Jobs 0 4,000 2,000 8,000 6,000 10,000 12,000
Source:
(2019) Employment
to work of the population live and work in the region
REMPLAN
of workers travel by car
Output generated 59.9% $8.419 bn
Mining contributes 59.9% of total output in the Central Highlands
Output
Output data represents the gross revenue generated by businesses/organisations in each of the industry sectors in a defined region.
The output generated by the Central Highlands’ regional economy is estimated at $8.419 billion.
The 2016–17 Agribusiness Snapshot identifies that the Central Highlands conservatively delivered approximately $839 million in agricultural value (ACIL Allen based on ABS, 2016–17). Due to the problematic nature of data collected for agriculture in the region, CHDC commissions an annual comprehensive Agribusiness Regional Stocktake which provides accurate information on production and business data trends across key agricultural commodities for the Central Highlands, and is available from the CHDC website.
21 Central Highlands Development Corporation
Industry Output
$5,046.981 $520.966* $490.302 $474.416 $300.006 $207.189 $173.494 $152.760 $138.990 $133.459 $132.216 $116.290 $101.647 $99.031 $98.907 $98.560 $89.871 $31.188 $12.777 Information media & telecommunication Arts & recreation services Financial & insurance services Electricity, gas, water & waste services Rental, hiring & real estate services Manufacturing Wholesale trade Professional, scientific & technical services Administrative & support services Public administration & safety Transport, postal & warehousing Other services Health care & social assistance Construction Accommodation & food services Education & training Retail trade Agriculture, forestry & fishing Mining 6,000 1,000 2,000 3,000 4,000 5,000 0 Output ($m) Source: REMPLAN (2019) *See appendix (p. 45)
Value-added
$3.777 bn 58.0%
Total value-added Mining sector contributes 58.0% of total value-added for the Central Highlands
Value-added
Value-added data represents the marginal economic value that is added by each industry sector in a defined region.
Value-added can be calculated by subtracting local expenditure and expenditure on regional imports from the output generated by an industry sector, or alternatively, by adding the Wages & Salaries paid to local employees, the gross operating surplus and taxes on products and production.
Value-added by industry sector is the major element in the calculation of Gross Regional Product
The total value-added by the Central Highlands’ regional economy is estimated at $3.777 billion.
22 Central Highlands QLD 2019 Economic Profile Industry
$2,190.264 $298.567 $202.060 $163.440 $111.658 $91.284 $84.371 $77.528 $74.930 $69.224 $67.842 $67.831 $66.709 $53.911 $49.066 $46.856 $43.851 $12.795 $4.886 Information media & telecommunication Arts & recreation services Financial & insurance services Electricity, gas, water & waste services Rental, hiring
real estate services Manufacturing Wholesale trade Professional, scientific & technical services Administrative & support services Public administration & safety Transport, postal & warehousing Other services Health care & social assistance Construction Accommodation & food services Education & training Retail trade Agriculture, forestry & fishing Mining 2,500 500 1,000 1,500 2,000 0 Value-added ($m) Source: REMPLAN (2019)
&
Local expenditure and regional exports
Local expenditure
Local Expenditure data represents the value of intermediate goods and services purchased by local industry sectors within the region. A high level of local expenditure on intermediate goods and services proportionate to total output is indicative of well-developed local supply chains and also that any expansion in this sector would typically deliver broad based benefits for the region’s economy.
The total local expenditure estimate for the Central Highlands is $1.436 billion.
Regional exports
Regional Exports data represents the value of goods and services exported outside of the region that have been generated by industry sectors within the region. The following graph depicts the contribution to total regional exports generated by each of the industry sectors ranked from highest to lowest.
The total regional export estimate for the Central Highlands is $5.706 billion.
23 Central Highlands Development Corporation
Source: REMPLAN (2019) Source: REMPLAN (2019) $818.427 $144.289 $132.075 $61.631 $57.351 $33.848 $21.570 $20.933 $20.361 $18.511 $17.940 $16.934 $16.484 $14.142 $14.090 $11.899 $6.125 $5.953 $2.951 Information media & telecommunication Arts & recreation services Financial & insurance services Electricity, gas, water & waste services Rental, hiring & real estate services Manufacturing Wholesale trade Professional, scientific & technical services Administrative & support services Public administration & safety Transport, postal & warehousing Other services Health care & social assistance Construction Accommodation & food services Education & training Retail trade Agriculture, forestry & fishing Mining 1,000 200 400 600 800 0 Local expenditure ($m) $4,763.820 $415.231 $120.794 $79.963 $73.137 $68.311 $62.919 $39.237 $20.243 $18.629 $17.232 $10.292 $5.706 $3.830 $2.135 $1.890 $1.229 $1.043 $0.475 Information media & telecommunication Arts & recreation services Financial & insurance services Electricity, gas, water & waste services Rental, hiring & real estate services Manufacturing Wholesale trade Professional, scientific & technical services Administrative & support services Public administration & safety Transport, postal & warehousing Other services Health care & social assistance Construction Accommodation & food services Education & training Retail trade Agriculture, forestry & fishing Mining 5,000 1,000 2,000 3,000 4,000 0 Regional exports ($m) Industry Total local expenditure Total regional export $1.436 bn $5.706 bn
Regional imports and key industry drivers
Top 5
Key drivers in terms of regional exports, employment, value-added and local expenditure on goods and services are: Mining, livestock, grains & other agriculture, accommodation & food services, retail trade, education & training
Regional imports
Regional Imports data represents the value of goods and services imported into the Central Highlands by businesses/ organisations in each of the industry sectors. Another way of defining imports is as an outflow of money from the Central Highlands. The following graph depicts the contribution to total regional imports generated by each of the industry sectors ranked from highest to lowest.
The total regional imports estimate for the Central Highlands is $3.206 billion.
Key industry drivers
Taking into consideration potential import replacement opportunities as well as current contributions to the regional economy in terms of employment, value-added and local expenditure on goods and services (backward linkages), key industry sectors have been identified. In order to understand the contributions of industry sectors in more detail, the general 19 industry sector classification has been broken down to the 45 industry sub-sector level. The following key industry sub-sectors have been identified as the key drivers of the Central Highlands region’s economy:
24 Central Highlands
2019 Economic Profile
QLD
• Mining • Livestock, Grains & Other Agriculture • Accommodation & Food Services • Retail Trade • Education & Training $2,038.290 $194.787 $184.463 $174.617 $118.498 $82.699 $82.056 $44.574 $38.122 $36.679 $35.570 $35.220 $34.069 $27.218 $27.012 $19.301 $15.904 $12.440 $4.940 Information media & telecommunication Arts & recreation services Financial & insurance services Electricity, gas, water & waste services Rental, hiring & real estate services Manufacturing Wholesale trade Professional, scientific & technical services Administrative & support services Public administration & safety Transport, postal & warehousing Other services Health care & social assistance Construction Accommodation & food services Education & training Retail trade Agriculture, forestry & fishing Mining 2,500 500 1,000 1,500 2,000 0 Regional imports ($m) Source: REMPLAN (2019)
Industry
regional imports
Total
$3.206 bn
Key industry drivers
Total jobs estimate for the Central Highlands
Employment data refers to employed people whose place of work is located within the Central Highlands, which includes residents and non-residents. It is based on the ABS 2016 Census Place of Work data.
Employment
Employment is a key social outcome of economic development; employment data represents the number of people employed by businesses/ organisations in each of the industry sectors in the Central Highlands. The total employment estimate for the Central Highlands is 17,019 jobs. The key industries contribute 10,859 jobs or 63.8% of total jobs in the Central Highlands.
Livestock, grains & other agriculture (1,662)
Mining (5,871)
Retail trade (1,184)
Accommodation & Food Services (1,010)
Education & training (1,132)
Other (6,160)
Source: REMPLAN (2019)
Regional Exports
Regional Exports represents the value of goods and services exported outside of the Central Highlands region that have been generated by local businesses/organisations. Another way of defining exports is as an inflow of money into the region.
The total regional export estimate for the region is $5.706 billion. The selected sectors contribute $5.265 billion (92.3%) of total regional exports.
Livestock, grains & other agriculture ($398.52 million)
Mining ($4,753.62 million)
Retail trade ($5.71 million)
Accommodation & Food Services ($68.31 million)
Education & training ($39.24 million)
Other ($440.72 million)
Source: REMPLAN (2019)
25 Central Highlands Development Corporation
34.5% 83.3% 9.8% 7.0% 7.0% 6.7% 36.2% 7.7% 5.9%
0.7% 0.1% 1.2%
17,019 Industry
Key industry drivers
$111.66 m
Education & training contribution of total value-added
Value-added
$813.163 m
Mining is the highest contributor in terms of local expenditure (45 industry sector level)
The total value-added estimate for the Central Highlands is $3.777 billion. The selected sectors contribute $2.614 billion (69.2%) of total value-added.
Livestock, grains & other agriculture ($181.21 million)
Mining ($2,168.02 million)
Retail trade ($84.37 million)
Accommodation & Food Services ($69.22 million)
Education & training ($111.66 million)
Other ($1,162.59 million)
Source: REMPLAN (2019)
Local expenditure
The following graph shows the value of intermediate goods and services purchased by industry sectors within the Central Highlands. The total local expenditure estimate for the Central Highlands is $1.436 billion. The selected sectors contribute $994.424 million (69.3%) of total local expenditure.
Livestock, grains & other agriculture ($127.66 million)
Mining ($813.16 million)
Retail trade ($17.94 million)
Accommodation & Food Services ($21.57 million)
Education & training ($14.09 million)
Other ($441.09 million)
Source: REMPLAN (2019)
The industry sectors may not necessarily make the largest contributions to the region’s economy at present, however due to well-developed local supply chains these sectors have a significant capacity to deliver broad based economic benefits for the region.
26
Central Highlands QLD 2019 Economic Profile
57.4% 56.7% 4.8% 8.9% 2.2% 3.0% 30.8% 30.7% 1.8% 1.0% 1.3% 1.5%
Industry
Summary indicators and gap analysis
$3.929 bn
21.5% $2.944 bn GRP for the Central Highlands region
The Central Highlands accounts for 21.5% of the Central Queensland SA4 GRP
The Central Highlands accounts for:
• 21.5% of Central Queensland SA4 and 1.1% of Queensland’s GRP
• 20.5% of Central Queensland SA4 and 1.2% of Queensland’s output
• 22.0% of Central Queensland SA4 and 1.2% of Queensland’s value-added
• 32.3% of Central Queensland SA4 and 5.2% of Queensland’s regional exports
• 26.3% of Central Queensland SA4 and 3.1% of Queensland’s regional imports.
Import Replacement Opportunities
Imports reflect demand in the area’s economy for goods and services not supplied locally and therefore represent ‘Gaps’ in local supply chains. Imports from the rest of Australia may indicate opportunities for import replacement, increased value-adding and supply chain development. Supply of these goods and services is currently feasible in the Australian context and may provide a guide to realistic, high value strategic opportunities to further develop the local economy. The total replacement of imports with local production is improbable however it may be possible to capture a proportion of this escape expenditure.
Total imports by industry sectors in the Central Highlands from the rest of Australia are estimated at $2.944 billion.
Total imports by industry sectors
Domestic imports – demand (from rest of Australia)
27 Central Highlands Development Corporation
Indicator GRP ($m) Output ($m) Value-added ($m) Regional exports ($m) Regional imports ($m) Central Highlands $3,929.301 $8,419.049 $3,777.075 $5,706.115 $3,206.459 Central Queensland SA4 $18,234.285 $41,109.946 $17,175.415 $17,662.483 $12,175.192 Queensland $348,969.000 $705,670.707 $325,534.292 $109,808.957 $104,900.706
Source: REMPLAN (2019)
($m) $2,033.183 $178.303 $170.652 $101.187 $71.130 $59.823 $44.143 $43.479 $37.613 $36.679 $34.007 $31.588 $30.434 $27.213 $26.848 $18.652 $14.550 $9.666 $4.406 Information media & telecommunication Arts & recreation services Financial & insurance services Electricity, gas, water & waste services Rental, hiring & real estate services Manufacturing Wholesale trade Professional, scientific & technical services Administrative & support services Public administration & safety Transport, postal & warehousing Other services Health care & social assistance Construction Accommodation & food services Education & training Retail trade Agriculture, forestry & fishing Mining 2,500 500 1,000 1,500 2,000 0 Value of domestic imports ($m) Source: REMPLAN (2019) Industry
Gap analysis
$473.615m $285.454 m
Exploration & Mining Support Services have the largest imports from the ‘rest of Australia’
External Industry Sectors Supplying to the Region
In order to identify potential gaps within the region, REMPLAN data has been applied at the 45 industry sector level. The local industry sectors import a total of $2.944 billion of goods and services from the rest of Australia, conversely industry sectors in the rest of Australia supply $2.944 billion of goods and services to the local industries as part of the process of production.
Professional, Scientific & Technical Services in imports from the ‘rest of Australia’
What are the selected local demand sector(s) importing from rest of Australia? ($m)
Exploration & mining support services Professional, scientific & technical services Financial & insurance services
equipment & appliance manufacturing
& coal product manufacturing
support services & storage
& metal product manufacturing
trade
services
services
& food services
maintenance & other services
Public admin., regulatory services, order & safety Information media & telecommunication
Basic chemical, cleaning & polymer manufacturing Transport equipment & parts manufacturing Retail trade
Food product manufacturing
Livestock, grains & other agriculture
Administrative & support services
Apparel manufacturing
Non-metallic mineral product manufacturing
Saw mill, wood & paper product manufacturing
Pharmaceutical product manufacturing
Gas, water & waste services
Sports, recreation & gambling
Printing (incl. the reproduction of recorded media)
Education & training
Postal & courier pick-up & delivery service
Beverage product manufacturing
Agriculture, forestry & fishing support services
Forestry, fishing & hunting
Furniture manufacturing
Other manufactured products
Heritage, creative & performing arts
Aquaculture Personal services
Defence Residential care & social assistance services
Rental & hiring services (except real estate) Health care services
Source: REMPLAN (2019)
28 Central Highlands
2019 Economic Profile
QLD
$473.615 $285.454 $268.102 $176.353 $166.629 $145.701 $140.751 $130.653 $130.596 $110.722 $104.034 $79.971 $79.810 $71.816 $68.887 $63.419 $55.932 $48.957 $42.300 $38.636 $38.290 $37.368 $28.625 $21.612 $21.104 $21.101 $15.494 $15.274 $10.200 $9.285 $8.727 $8.558 $8.172 $5.241 $3.295 $2.680 $1.919 $1.578 $0.938 $0.765 $0.733 $0.131 $0.128 $0.000 $0.000
Petroleum
Transport
Metal
Wholesale
Transport Construction
Construction Property
Accommodation
Mining Electricity
Technical
Repair,
500 100 200 300 400 0 ($m)
Industry
Major projects
The 2018 Development Register profiles $7.1bn of projects in progress in the region
bn $50.5 bn
Based on available information, there is currently $7.1 billion in known major project investment currently underway or planned for short term development in the Central Highlands.
Moreover, known projects of significance that are located outside of the Central Highlands region that will still have substantial economic benefits to the region approximate $43.3 billion.
29 Central Highlands Development Corporation
Mining investment projects account for $5.9 billion of total investment projects in the Central Highlands Current total project investment, including projects of significance outside of the Central Highlands region $5.9
Category Not started ($m) In progress ($m) Completed ($m) Total ($m) Community Infrastructure $5.18 $6.87 $19.88 $31.93 Retail Construction Industrial Construction $18.50 $15.20 $33.70 Residential Construction $37.95 $37.95 Workforce Accommodation Construction Road $55.10 $27.60 $82.70 Flood Restoration and Mitigation $5.00 $3.60 $8.60 Tourism $0.59 $0.59 Mining $5,824.00 $46.00 $5,870.00 Energy $500.00 $415.00 $915.00 Water and Sewerage $3.00 $117.00 $6.79 $126.79 CH Subtotal $6,355.68 $647.12 $104.46 $7,107.27 Rail (outside the Central Highlands) $2,200.00 $2,200.00 Mining (outside the Central Highlands) $38,349.00 $1,900.00 $40,249.00 Energy (outside the Central Highlands) $900.00 $900.00 Outside CH Subtotal $39,249.00 $4,100.00 $43,349.00 Grand total $45,604.68 $4,747.12 $104.46 $50,456.27
Source: CHDC (2018)
Industry
Building approvals
70.8%
Separate house approvals have accounted for approximately 70.8% of total dwelling approvals from 2007–08 to 2017–18
Number of dwelling approvals
47%
The value of non-residential approvals has generally accounted for approximately 47% of the total value of building approvals
There were 22 new dwelling approvals in 2017–18, an increase of 5 dwellings over the previous 12 months, comprising 22 houses and no “other” (unit) dwellings. Dwelling approvals peaked in 2012–13 at 422 approvals. Since then the volume of approvals have experienced a significant decrease caused by trends in global mineral prices that affected the economy of the Central Highlands. Over the 10 year period from 2007–08 to 2017–18, separate house approvals have accounted for approximately 70.8% of total dwelling approvals. The highest levels of unit approvals occurred in 2011–12 (46% of total approvals).
Houses Other
Value of building approvals
The total value of building approvals during 2017–18 is $18.4 million. The value of residential building approvals peaked in 2012–13 at $235.9 million. The value of ‘non-residential’ approvals has generally accounted for approximately 47% of the value of total building approvals.
30 Central Highlands
2019 Economic Profile
QLD
Residential Non-residential 500 146 0 100 200 300 400 50 149 47 285 75 198 65 186 158 251 171 155 34 37 2 11 17 22 2007–08 2008–09 2009–10 2010–11 2011–12 2012–13 2013–14 2014–15 2015–16 2016–17 2017–18 Year $250m 2007–08 2008–09 2009–10 2010–11 2011–12 2012–13 2013–14 2014–15 2015–16 2016–17 2017–18 51.6 0 Year $50m $100m $150m $200m 14.9 50.0 38.2 88.9 92.7 65.7 98.7 84.6 32.9 116.7 119.3 55.5 19.8 17.7 14.9 5.8 6.4 9.8 38.5 3.7 8.6
Source: ABS (2019c)
Source: ABS (2019c)
Housing
Residential lot approvals
50+ lots
Before 2015, larger projects of more than 50 lots have generally accounted for the majority of approvals
580
Between 2008 and 2018 the highest number of annual approvals occurred in 2008 at 879, with 80% of the lot approvals being in larger projects of more than 50 lots. Due to the fall in global mineral prices, the housing market has slowed in the Central Highlands leading to no new lot approvals from 2016.
31 Central Highlands Development Corporation
Lots were approved between 2011 and 2013
Lot approvals Year ending June <10 11–20 21–50 >50 Total 2008 50 41 81 707 879 2009 26 0 27 80 133 2010 10 20 22 0 52 2011 9 36 24 69 138 2012 44 0 0 182 226 2013 25 0 29 162 216 2014 24 16 0 94 134 2015 1 0 0 0 1 2016 0 0 0 0 0 2017 0 0 0 0 0 2018 0 0 0 0 0 Source: QGSO (2019) Lot approvals by project size <10 11–20 21–50 >50 Source: QGSO (2019) 1,000 900 2008 2009 2010 2011 2012 2013 2014 2015 2016 2017 2018 800 0 Year 100 200 300 400 500 600 700 Housing
Lot registrations
443
Number of lot registrations peaked in 2012 with 443 registrations
4
2018 saw the lowest number of lot registrations, with only 4 total lot registrations recorded
Lot registrations is the final stage of development of new lots. There is generally a time lag between lots being approved and lots being registered. The total number of lot registrations in the Central Highlands has decreased between 2017 and 2018. Since 2014, the volume of registrations has significantly declined.
Lot
a Lots on a standard format plan intended for detached dwellings, including lots intended for detached dwellings in a community title scheme.
b Lots on a building format plan or standard format plan that represent attached dwellings within a community title scheme.
Source: QGSO (2019)
Urban lots (60m2 to <2,500m2) have consistently accounted for the majority of standard residential lot registrations from 2008 to 2018. Unit & Townhouse lot registrations have on average represented 24.2% of residential lot registrations.
32
2019
Central Highlands QLD
Economic Profile
approvals Year ending September Standard residential lot registrations Unit & townhouse lotsb Total lot registrations Urbana (60m2 to <2,500m2) Urbana (2,500m2 to 5 ha) Total standard lots 2008 261 19 280 25 305 2009 135 11 146 52 198 2010 99 21 120 59 179 2011 155 6 161 62 223 2012 294 45 339 104 443 2013 285 14 299 124 423 2014 183 24 207 86 293 2015 5 6 11 0 11 2016 1 7 8 0 8 2017 13 25 38 2 40 2018 2 2 4 0 4
Housing
New lot sales and median price
85
Total number of lot sales peaked in 2014 with 85 sales
New lot sales
$70,000
Median price for vacant land was $70,000 in 2018
There were a total of 38 new lot sales in the year to September 2018 within the Central Highlands, of which 71% were vacant land sales. Vacant land sales have traditionally accounted for the majority of new lot sales within the region, with house and land package lots generally accounting for approximately 31.5% of sales.
Vacant land House & land package
Median price
The median sales price of vacant land has been decreasing since 2014. The median value of packaged house and land sales has also decreased since 2014. Vacant
a May include resales of vacant land. Excludes intermediate vacant land transactions relating to developer house and land package sales.
b Includes lots as a component of a developer house and land package in addition to subdivided lots containing an existing dwelling. Source: QGSO (2019)
33 Central Highlands Development Corporation
land House
land package 100 65 0 20 40 60 80 20 14 5 7 7 22 19 27 11 2014 2015 2016 2017 2018 Year $400,000 $350,000 2014 2015 2016 2017 2018 $300,000 $0 Year $50,000 $100,000 $150,000 $200,000 $250,000
&
Source: QGSO (2019)
Year ending September New lot sales (140m2 to 2,500m2) Median sales price Median $/m2 Vacant landa House & land packageb Total sales Vacant landa House & land packageb Vacant landa 2014 65 20 85 $157,500 $380,000 $187 2015 14 5 19 $120,000 N/A $166 2016 7 7 14 N/A N/A N/A 2017 22 19 41 $66,500 $148,000 $95 2018 27 11 38 $70,000 $140,000 $96
Source: QGSO (2019)
Housing
Dwelling sales and median price
$185,000
Median sales price for the year ending September 2018 for detached houses was $185,000 and $170,000 for units and townhouses
Dwelling sales
There were a total of 382 new and established detached and attached dwelling sales in the year to September 2018 within the Central Highlands, of which 91% were detached house sales. Detached housing sales have accounted for the majority of dwelling sales activity within the region, accounting for approximately 88% of all dwelling sales over the last five years.
Detached houses
Units and townhouses
Median price
Both the detached and attached dwelling markets experienced a peak in median sales price in 2014, at $350,000 and $320,000, respectively. While the median sales price for both detached and attached dwelling markets have been in a state of decline, the year to September 2018 saw prices increase to 2016 levels.
382
Dwelling sales peaked in the year ending September 2018, with a total of 382 sales
34 Central Highlands
Profile
QLD 2019 Economic
Detached houses Units and townhouses 400 191 0 100 200 300 28 205 19 155 42 325 43 347 35 2014 2015 2016 2017 2018 Year $400,000 $350,000 2014 2015 2016 2017 2018 $300,000 $0 Year $50,000 $100,000 $150,000 $200,000 $250,000
Source:
Year ending September Number of dwelling sales Median sales price Detached houses Units and townhouses Total sales Detached houses Units and townhouses 2014 191 28 219 $350,000 $320,000 2015 205 19 224 $215,000 $200,000 2016 155 42 197 $180,000 $175,000 2017 325 43 368 $165,000 $130,000 2018 347 35 382 $185,000 $170,000 Source: QGSO (2019) Housing
Source: QGSO (2019)
QGSO (2019)
Median weekly rent
25.5%
Three bedroom townhouses experienced the largest increase in median weekly rent of 25.5% from December 2017 to December 2018
Regional data has been sourced from the Queensland Residential Tenancies Authority for median rental data from the June Quarter 2014 to December Quarter 2018 for:
• Units/Flats – two and three bedroom
• Houses – three and four bedroom, and
• Townhouses – three bedroom.
After a period of decline from June 2014 to June 2017, median rents in the Central Highlands started to steadily increase from December 2017.
35 Central Highlands Development Corporation
↑
Two bed units/flats Three bed units/flats Three bed houses Four bed houses Three bed townhouses Jun ’14 Dec ’14 Jun ’15 Dec ’15 Jun ’16 Dec ’16 Jun ’17 Dec ’17 Jun ’18 Dec ’18 Two bed units/flats Central Highlands $220 $190 $190 $175 $180 $165 $165 $185 $180 $200 Rockhampton $240 $230 $230 $220 $200 $200 $195 $200 $210 $210 Gladstone $280 $250 $240 $200 $160 $130 $130 $140 $150 $170 Three bed units/flats Central Highlands $275 $240 $220 $220 $220 $200 $250 $250 $250 $260 Rockhampton $295 $290 $285 $265 $275 $260 $260 $270 $262.50 $270 Gladstone $350 $320 $300 $275 $230 $180 $190 $190 $210 $220 Three bed houses Central Highlands $270 $250 $220 $200 $200 $200 $210 $220 $250 Rockhampton $300 $295 $290 $290 $280 $278 $270 $270 $280 Gladstone $330 $300 $300 $260 $220 $180 $190 $190 $220 Four bed houses Central Highlands $350 $325 $300 $300 $300 $300 $300 $300 $350 $350 Rockhampton $380 $370 $380 $380 $360 $350 $350 $340 $370 $380 Gladstone $400 $390 $380 $320 $260 $235 $240 $240 $260 $270 Three bed townhouses Central Highlands $320 $270 $270 $250 $250 $250 $235 $295 Rockhampton N/A $345 $120 $300 $340 $280 $290 $300 $330 $330 Gladstone $360 $360 $325 $280 $215 $180 $200 $190 $210 $215 Source: RTA (2019) $400 $350 Jun ’14 Dec ’14 Jun ’15 Dec ’15 Jun ’16 Dec ’16 Jun ’17 Dec ’17 Jun ’18 Dec ’18 $300 $0 Year $50 $100 $150 $200 $250 Housing
Output
69.3%
Accommodation & food services sector contributes 69.3% of total tourism related output
Tourism is not identified as a separate industry sector in the National Accounts data, instead tourism is an amalgam of activities across various industry sectors such as retail, accommodation, cafés & restaurants, and cultural & recreational services. The Tourism Module in REMPLAN estimates the total value of tourism for the local economy.
Tourism output
The estimated output generated by tourism for each industry sector has been deducted and consolidated into a separate tourism sector. The Central Highlands’ total output estimate is $8.419 billion, with Tourism contributing $235.556 million. Output (with separate Tourism sector)
Output attributable to tourism
Tourism output has been estimated to be $235.556 million. The following graph shows the gross revenue generated by businesses and organisations in the Central Highlands to service demand generated by tourists to the area.
36 Central Highlands QLD 2019 Economic Profile
$5,046.981 $520.081 $490.302 $296.194 $288.245 $235.556 $187.153 $164.994 $149.718 $131.979 $128.995 $125.158 $116.290 $101.647 $98.560 $98.544 $97.901 $89.871 $10.175 $30.669 $10.219 Information media & telecommunication Arts & recreation services Financial & insurance services Electricity, gas, water & waste services Rental, hiring & real estate services Manufacturing Tourism Wholesale trade Professional, scientific & technical services Administrative & support services Public administration & safety Transport, postal & warehousing Ownership of dwellings Other services Health care & social assistance Construction Accommodation & food services Education & training Retail trade Agriculture, forestry & fishing Mining 6,000 1,000 2,000 3,000 4,000 5,000 0 $m $163.275 $20.036 $19.012 $13.832 $3.812 $3.221 $3.042 $2.602 $2.165 $1.662 $1.006 $0.885 $0.519 $0.487 Information media & telecommunication Arts & recreation services Rental, hiring & real estate services Manufacturing Wholesale trade Administrative & support services Transport, postal & warehousing Ownership of dwellings Other services Health care & social assistance Accommodation & food services Education & training Retail trade Agriculture, forestry & fishing 200 50 100 150 0 $m Source: REMPLAN (2019) Source: REMPLAN (2019) Tourism Tourism total output $235.556m
Employment
7.1% 78.8%
Tourism sector contributes 7.1% to total Central Highlands’ employment
Tourism employment
Accommodation & food services sector contributes 78.8% to total tourism related employment
The employment generated to service demand from visitors for each industry sector has been estimated through applying industry profiles from the Australian Bureau of Statistics Tourism Satellite Account and consolidated into a separate tourism sector. Tourism is estimated to account for 1,207 jobs (7.1%) of the total 17,019 jobs in the Central Highlands.
Employment (with separate Tourism sector)
Employment attributable to tourism
The total tourism related employment estimate for the Central Highlands is 1,207 jobs. The following graph shows the number of jobs in each industry sector in the region which service demand generated by tourists to the area.
37 Central Highlands Development Corporation
6,079 1,788 1,207 1,109 1,066 971 764 653 602 566 463 374 334 321 256 144 126 67 8 62 59 Information media & telecommunication Arts & recreation services Financial & insurance services Electricity, gas, water & waste services Rental, hiring & real estate services Manufacturing Tourism Wholesale trade Professional, scientific & technical services Administrative & support services Public administration & safety Transport, postal & warehousing Ownership of dwellings Other services Health care & social assistance Construction Accommodation & food services Education & training Retail trade Agriculture, forestry & fishing Mining 7,000 1,000 2,000 3,000 4,000 5,000 6,000 0 Jobs Source: REMPLAN (2019) Source: REMPLAN (2019) 951 118 61 23 17 8 7 6 4 4 3 3 1 1 Information media & telecommunication Arts & recreation services Rental, hiring & real estate services Manufacturing Wholesale trade Administrative & support services Transport, postal & warehousing Ownership of dwellings Other services Health care & social assistance Accommodation & food services Education & training Retail trade Agriculture, forestry & fishing 1,000 400 200 600 800 0 Jobs Tourism
Distribution of tourist dollar and visitor profile
$0.69/$1
For each dollar spent by a tourist in the Central Highlands, it is estimated that typically $0.69 is spent on accommodation & food services
Distribution of tourist dollar
The average length of stay of domestic overnight visitors is 4 nights while international visitors is 23 nights
Average spend per trip for domestic overnight visitors is $449 while international visitors is $682
For each dollar spent by a tourist in the Central Highlands, it is estimated that typically $0.69 is spent on ‘Accommodation & Food Services’, $0.09 is spent on ‘Transport, Postal & Warehousing’, and $0.06 is spent on ‘Retail Trade’.
Visitor profile
The visitor profile provides data for the Central Highlands for a four year average to 2017.
Average length of stay
The following data has been sourced from Tourism Research Australia, Local Government Area Profile, 2017 for the Central Highlands. Within the Central Highlands, the average length of stay for international visitors is 23 nights, while the average length of stay of domestic overnight visitors is 4 nights. Domestic overnight visitors spend an average of $449 per trip and $115 per night, compared to $682 and $30, respectively for international visitors.
38 Central Highlands
2019
QLD
Economic Profile
Source:
(2019) Accommodation & food services Transport, postal & warehousing Ownership of dwellings Manufacturing Retail trade $0.02 $0.09 $0.69 $0.06 $0.08 Wholesale trade Education & training Arts & recreation services Administrative & support services Rental, hiring & real estate services $0.01 $0.01 $0.01 $0.01 $0.01 0 $0.20 $0.60 $0.40 $0.80
REMPLAN
Visitors Nights Domestic day (‘000) 365 Domestic overnight (‘000) 315 1,232 International (‘000) 8 194 Source: TRA (2018)
Domestic day Domestic overnight International Average stay (nights) 4 23 Average spend per trip $174 $449 $682 Average spend per night $115 $30 Source: TRA (2018) Tourism
Emerald Airport
Passengers through Emerald Airport have typically peaked in the June/July period
Passengers
204,073
Passengers through the airport for the 2018–19 FY
In 2018–19 there were a total of 204,073 passengers recorded through Emerald Airport. The number of passengers through Emerald Airport peaked in 2012–13 with a total of 310,640 passengers. While the number of passengers through the airport has been decreasing since 2012–13, this decrease has lessened, from -15% from 2012–13 to 2013–14 to -1% from 2017–18 to 2018–19.
39 Central Highlands Development Corporation
2011–12 2012–13 2013–14 2014–15 2015–16 2016–17 2017–18 2018–19 30,000 Jul Aug Sep Oct Nov Dec Jan Feb Mar Apr May Jun 10,000 15,000 20,000 25,000
Tourism
Source: CHRC (2019)
Business activity
2,899 35%
Businesses registered and operating in the Central Highlands
Business activity
of registered businesses are in the Agriculture, Forestry and Fishing sector
As at June 2018, there are 2,899 businesses operating in the Central Highlands. The largest number of registered businesses are in the ‘Agriculture, Forestry and Fishing’ sector (1,011), followed by ‘Construction’ (385).
Change in businesses, 2016 to 2018
Between 2016 and 2018, the number of registered businesses in the Central Highlands has decreased by 41 businesses. The ‘Construction’ sector experienced the largest decline in business numbers (-20), followed by the ‘Manufacturing’ sector (-13). The ‘Financial and Insurance Services’ sector experienced the largest increase in business numbers from 2016 to 2018 (19).
40 Central Highlands QLD 2019 Economic Profile
1,011 385 286 197 137 129 123 119 90 84 73 65 63 56 27 20 15 9 7 Arts & recreation services 3 Information media & telecommunication Financial & insurance services Electricity, gas, water & waste services Rental, hiring & real estate services Manufacturing Wholesale trade Professional, scientific & technical services Administrative & support services Public administration & safety Transport, postal & warehousing Other services Not classified Health care & social assistance Construction Accommodation & food services Education & training Retail trade Agriculture, forestry & fishing Mining 1,200 200 400 600 800 1,000 0 Businesses 19 13 6 6 5 2 1 0 0 -1 -2 -2 -3 -5 -7 -7 -11 -12 -13 Arts & recreation services -30 Information media & telecommunication Financial & insurance services Electricity, gas, water & waste services Rental, hiring & real estate services Manufacturing Wholesale trade Professional, scientific & technical services Administrative & support services Public administration & safety Transport, postal & warehousing Other services Not classified Health care & social assistance Construction Accommodation & food services Education & training Retail trade Agriculture, forestry & fishing Mining 20 -20 -10 0 10 -30 Businesses Source: ABS (2019d) Source: ABS (2019d) Trends
Business activity
Owner/operator businesses account for the highest proportion of registered businesses in the Central Highlands
Workforce size
$200,000 – $2m
Businesses with a turnover of $200,000 to less than $2 million account for the highest proportion of Central Highlands’ registered businesses
Between 2016 and 2018, the largest change occurred for businesses that employ 200 or more staff, decreasing 100% from 3 in 2016 to no businesses in 2018. Businesses which do not employ any staff (i.e. owner/operator) account for the highest proportion (61.9%) of Central Highlands’ registered businesses.
2018 2017 2016
Turnover
From 2016 to 2018, the largest change in businesses by turnover was for businesses turning over between $200,000 and $2 million, increasing from 1,161 in 2016 to 1,207 in 2018, an increase of 4.0%. The largest proportion of businesses by turnover is businesses turning over $200,000 to less than $2 million, accounting for 41.6% of Central Highlands’ businesses in 2018. The $50,000 to less than $200,000 range accounts for the second highest proportion of businesses (29.7%).
2017 2016
41 Central Highlands Development Corporation
2018
1,829 1,818 1,795 1,054 1,072 1,064 38 47 40 3 0 3 2,000 0 500 1,000 1,500 Owner/operator 1–19 staff 20–199 staff 200+ staff 663 634 647 877 860 921 1,168 1,207 1,161 162 129 142 37 45 46 17 24 23 1,500 0 300 600 900 1,200 $0 to less than $50k $50k to less than $200k $200k to less than $2m $2m to less than $5m $5m to less than $10m $10m or more Source: ABS (2019d) Source: ABS (2019c) Trends
Business registrations
1.4% ↑41.2%
Number of businesses with turnover of $10 million or more increased by 41.2% between 2017 and 2018
Total number of registered businesses in the Central Highlands decreased by 1.4% from 2016 to 2018
Business registrations by industry
Registered businesses with turnover $200,000 to less than $2m has grown
Business registrations by workforce size and turnover
42 Central Highlands QLD 2019 Economic Profile
↓
2016 2017 2018 No. % No. % No. % Agriculture 1,005 34.2% 1,029 35.2% 1,011 34.9% Mining 59 2.0% 59 2.0% 65 2.2% Manufacturing 86 2.9% 73 2.5% 73 2.5% Electricity, gas, water and waste services 5 0.2% 7 0.2% 7 0.2% Construction 415 14.1% 392 13.4% 385 13.3% Wholesale trade 59 2.0% 61 2.1% 56 1.9% Retail trade 130 4.4% 121 4.1% 119 4.1% Accommodation and food services 91 3.1% 84 2.9% 84 2.9% Transport, postal and warehousing 125 4.3% 132 4.5% 123 4.2% Information media and telecommunications 3 0.1% 3 0.1% 3 0.1% Financial and insurance services 110 3.7% 120 4.1% 129 4.4% Rental, hiring and real estate services 287 9.8% 290 9.9% 286 9.9% Professional, scientific and technical services 144 4.9% 137 4.7% 137 4.7% Administrative and support services 77 2.6% 78 2.7% 90 3.1% Public administration and safety 11 0.4% 8 0.3% 9 0.3% Education and training 39 1.3% 30 1.0% 27 0.9% Health care and social assistance 58 2.0% 60 2.1% 63 2.2% Arts and recreation services 14 0.5% 13 0.4% 15 0.5% Other services 202 6.9% 208 7.1% 197 6.8% Not classified 20 0.7% 19 0.6% 20 0.7% Total 2,940 100% 2,924 100% 2,899 100%
Source: ABS (2019d)
2016 2017 2018 Change 2017–2018 Workforce size No. % No. % No. % Non-employing 1,818 61.8% 1,829 62.6% 1,795 61.9% -1.9% 1–19 staff 1,072 36.5% 1,054 36.0% 1,064 36.7% 0.9% 20–199 staff 47 1.6% 38 1.3% 40 1.4% 5.3% 200+ staff 3 0.1% 3 0.1% 0 0.0% -100.0% Total 2,940 100% 2,924 100% 2,899 100% -0.9% Turnover ranges Zero to less than $50k 647 22.0% 663 22.7% 634 21.9% -4.4% $50k to less than $200k 921 31.3% 877 30.0% 860 29.7% -1.9% $200k to less than $2m 1,161 39.5% 1,168 39.9% 1,207 41.6% 3.3% $2m to less than $5m 142 4.8% 162 5.5% 129 4.4% -20.4% $5m to less than $10m 46 1.6% 37 1.3% 45 1.6% 21.6% $10m or more 23 0.8% 17 0.6% 24 0.8% 41.2% Total 2,940 100% 2,924 100% 2,899 100% -0.9% Source: ABS (2019d) Trends
4.4%
Unemployment rate in the Central Highlands has remained steady from 2016 with 718 unemployed people
Labour force
The estimated number of people employed in the Central Highlands in 2018 is 15,472 people. Since 2009, the labour force has decreased by 2,056 people; the number of employed people has decreased by 2,337 people and the number of unemployed people has increased by 282 people.
Source: Department of Jobs and Small Business (2019)
Annual Employment Change
The annual change in the number of people employed within the Central Highlands peaked between 2013 and 2014 with a growth of 533 people employed. Between 2017 and 2018 the number of people employed in the Central Highlands has remained at 15,472 people.
43 Central Highlands Development Corporation
Employment
Employed Unemployed Annual change 20,000 2009 2010 2011 2012 2013 2014 2015 2016 2017 2018 16,000 0 Year 4,000 8,000 12,000 28,090 17,809 17,195 16,821 16,878 16,355 16,888 16,323 16,134 15,472 15,472 437 501 664 603 799 718 860 772 724 718 -615 -374 +57 -523 +533 -565 -190 -662 0
Employed Unemployed Labour force Unemployment rate Job growth rate 2009 17,809 437 18,246 2.4% –2010 17,195 501 17,695 2.8% -615 2011 16,821 664 17,485 3.8% -374 2012 16,878 603 17,480 3.4% 57 2013 16,355 799 17,154 4.7% -523 2014 16,888 718 17,606 4.1% 533 2015 16,323 860 17,183 5.0% -565 2016 16,134 772 16,906 4.6% -190 2017 15,472 724 16,196 4.5% -662 2018 15,472 718 16,190 4.4% 0 Source: Department of Jobs and Small Business (2019) Trends
Agribusiness Regional Stocktake Baseline Data To Drive Growth
November 2018 – update
This report presents a snapshot of the Central Highlands’ agribusiness sector, showcases the opportunities in the Central Highlands and can inform future analysis and policy development.
The Central Highlands delivers approximately $839 million in agricultural value (ACIL Allen based on ABS, 2016–17). Cattle grazing is the largest agricultural activity generating $530 million. Cotton is another key driver of value. According to official data, the value of production of wheat and sorghum is $39 million while pulses (chickpeas) have an economic value of $106 million. The region also boasts a thriving table grape sector ($17 million). Changes over the last two financial years are summarised in Table 1 on page 47. The region continues to perform strongly in agricultural production regardless of a dryer than usual climate in recent times.
The Central Highlands Accelerate Agribusiness Strategic Advisory Group (CHAA) identified five key pillars that underpin their agribusiness development strategy:
• Production Excellence
• Connected, Competitive Supply Chains
• Revered Regional Brands
• Ready for Business, and
• Fearless Invention
The stocktake is constructed to explore the evidence base that underpins each of the five key pillars.
Production Excellence
The Central Highlands outperforms its peers in terms of agricultural area and agricultural GVP per capita. On the contrary, the region shows less strength in the measures of agribusiness per capita and diversification performance. Recently, the region has also outperformed its peers in terms of growth. According to ABS data cumulative annual growth rate on value per hectare of agricultural land has increased at a higher rate in the Central Highlands than in other comparable regions (refer Figure 1).
The Central Highlands is not the primary grain growing region for Queensland, however, the natural soil fertility and ideal climate for growing a variety of summer and winter crops provides producers with opportunities to diversify their enterprise mix in order to spread the risk of a highly variable climate. Producers utilise modern farming practices to maximise the return on investment of assets managed. The comparably lower land prices to the Darling Downs present a good value proposition for long term investors in the region.
44 Central Highlands
2019
Profile
QLD
Economic
Appendix
50% 40% 11% 5% 8% 5% 30% -20% -10% 0% 10% 20% 2011–12 2012–13 2013–14 2014–15 2015–16 2016–17 Cumulative annual growth rate
Figure 1 Value generated from a hectare of agricultural land – selected locations – growth per annum Australia Central Highlands Darling Downs New England & NW
Note: Increased value is driven by a combination of higher market prices and improved yields. From 2016–17, ABS data only includes data from businesses with an estimated value of agriculture operations of $40,000 and above. Prior years included all above $5,000. Non-ABS data on the value of citrus in the Central Highlands has been included in the calculations for 2015–16 and 2016–17 only. The value of citrus was derived as a proportion of total Queensland exports (90%).
Source:
Acil Allen based on Australian Bureau of Statistics
Connected Competitive Supply Chains
Over 40 per cent of the inputs purchased by Central Highlands’ agribusinesses are sourced from inside the region in 2017 (REMPLAN). The remainder is mostly sourced from other regions and a small percentage comes from overseas. Most of these imports were of manufactured goods and professional and technical services, industries in which the Central Highlands is seeking to grow and improve capability.
Agricultural freight is predominantly moved by road as rail haulage is mostly composed of mining products and agriculture is a secondary priority. The Federal Government confirmed an investment of $2.9 million in the Yamala intermodal rail freight hub which will connect the rail and the Capricorn Highway and “provide better logistical options for the farmers of this district”.1 The intermodal hub will be built in conjunction with GrainCorp, the Central Highlands Regional Council and the Federal Government. The intermodal hub is designed to improve supply chain efficiency and incentivise a greater utilisation of rail.
Despite the region being a strong performer in several primary industries, a considerable amount of the processing of the output of these industries is done outside the region. Indeed, the Central Highlands’ processing of primary products include cotton gins, packing facilities and grain storage and handling facilities where some initial processing of the grain is undertaken.
The Emerald saleyards are important to the Australian cattle markets. Besides serving the State and national markets, the region is an important primary exporter. ACIL Allen has estimated that the value of exports from the Central Highlands would have amounted to approximately $800 million in 2016–17. Cattle exports (mainly beef) explains 46 per cent of this figure. India, Japan and China were the three top export markets for regional produce and explained almost half of the total sales (Figure 2).
Revered Regional Brands
A survey of members of the local community was conducted in mid-2018 (Central Highlands Development Corporation, 2018).2 The aim of this research was to assist in building the regional brand by developing and refining communication strategies, materials, activities so as to create a ‘revered regional brand’ (Central Highlands Development Corporation, 2018).
A total of 344 surveys were completed (143 online and 201 via telephone). The respondents were broadly categorised as ‘dedicated’ and ‘interested’ buyers. The respondents in the ‘dedicated’ group (n=108) were those most likely to already be buying local fresh food, whilst the ‘interested’ group (n=211) were willing to purchase local fresh food but currently do so to a lesser degree than the ‘dedicated’ group (Central Highlands Development Corporation, 2018).
45 Central Highlands Development Corporation Appendix
2 Report is available at: https://chdc.com.au/media/2018/10/Community-attitudes-and-purchasing-behaviours-Oct18.pdf
1 The Hon Michael McCormack MP Deputy Prime Minister Minister for Infrastructure, Transport and Regional Development Leader of The Nationals Federal Member for Riverina – Press conference with Ken O’Dowd MP, Member for Flynn, Emerald, 18 November 2018.
Source:
Cattle Cereal crops Cotton
Non-cereal crops Mandarins
$300 $350 $400 $0 $50 $100 $200 $250 $150 $374 $32 $102 $1 $238 $55 $1 $0 India Japan South Korea China United States Pakistan Bangladesh Vietnam $200 $250 $0 $50 $100 $150 $120 $61 $77 $87 $16 $1 $17 $18 $38 $18 $204 Taiwan Indonesia Other
Figure 2 Central Highlands (R) – Exports in 2016–17 (E) by commodity (left) and by market (right) – in $ million
Acil Allen based on Queensland Government Statician’s Office
Table grapes
Melons Pasture cut
Overall, only 24 per cent of the Central Highlands fresh food buyers were aware of branding that told them that they were buying food grown in the Central Highlands – this increased to 36 per cent for those consumers segmented as ‘dedicated’ (Central Highlands Development Corporation, 2018). This is not dissimilar to the results from the workshop in 2017 where few brands (6) were mentioned three or more times and only two actually were mentioned more than three times.
Further work needs to be done to improve awareness of local produce, awareness of local brands and where the community can purchase them through the development of a regional communication and marketing strategy aimed at creating an enduring revered brand.
Ready for Business
Agribusinesses are a key value and employment driver in the region. Over 40 per cent of registered firms in the region are agribusinesses. Seventy per cent of these businesses employ less than five employees and 40 per cent of them are owner-operator businesses. (ABS, 2016). These firms are benefitting from the region’s abundance of cropping land, robust water availability and high reliability, and low land prices.
Under the Nogoa-Mackenzie Water Supply Scheme the region has 232 GL of allocated water and is supported by the Fairbairn Dam which is the second largest water storage in Queensland. The scheme is competitively priced in comparison to other regional schemes such as Burdekin, Bundaberg, Mareeba Dimbulah and St. George. The region has approximately two million hectares of strategic cropping land (i.e. land with high agriculture potential). The region boasts one of the lowest average farm land rental prices in the country. The availability of irrigation, large endowment of strategic cropping land and low land prices has drawn the attention of several intensive horticulture businesses.
The Federal Government has announced $3 million in funding towards the modernisation of Fairbairn Dam.3 The project will add a 6500 megalitre storage capacity. This will provide distinct opportunity for irrigated agriculture in the region. It’s expected that the dam modernisation will include an additional 50 jobs and 115 additional indirect jobs.4
The Central Highlands compares well to other similar regions in terms of the efficiency of the labour market, having a relatively young population and the endowment of natural resources (refer Figure 3). However, it lags in terms of economic diversification and business sophistication.5
46 Central Highlands QLD 2019 Economic Profile Appendix
4 Ibid. 5
3 The Hon Michael McCormack MP Deputy Prime Minister Minister for Infrastructure, Transport and Regional Development Leader of The Nationals Federal Member for Riverina – Press conference with Ken O’Dowd MP, Member for Flynn, Emerald, 18 November 2018.
This
analysis is based on the Regional
Australia
Institute [in]Sight indicator. For details please refer to the full Stocktake document.
Comparative
Central Highlands Moree Plains Western Downs Source: Regional Australia Institute, 2018 100 200 300 400 Institutional Foundations Rank:1 Infrastructure & Essential Services Demography Economic Fundamentals Natural Resources Labour Market Efficiency Research & Development – Science Technological Readiness Business Sophistication Human Capital Business Dynamo
Figure 3
Central
Highlands (R) –
ranking on the [in]Sight Index
Fearless Invention
The Central Highlands shows a mixed picture in terms of invention/ innovation indicators. While the number of employees in knowledge intensive firms and the creation of businesses remains adequate, the region is trailing in terms of trademark applications and R&D activity.
According to the ABS the region does not have any registered research service providers. However, data provided by CHDC shows that the region has two of such facilities (CQ University and Emerald Grain Research and Development Corporation). Also, according to official data, the proportion of professional service firms with a turnover in excess of $2 million is just 2 per cent. This small share indicates that the region is trailing in terms of value generation in the sector, and presumably explains why professional services is one of the key imports from outside the region.
47 Central Highlands Development Corporation
Data November 2017 (2015–16) November 2018 (2016–17) Change ABS Standard Error Agricultural value ($) 780 million 839 million Increase –Number of agricultural businesses 1,336 1,445 Increase 25% – 50% Number of industries producing per cent of economic value 5 industries; 99 per cent 2 industries; 70 per cent Consolidation –Beef Beef grazing value ($) 540 million 530 million Decrease –Cattle head (number) 1,373,281 No new data available – –Cotton Value ($) 58 million 63 million Increase –Production (tonnes) 23,000 29,000 Increase 10% – 25% Area (ha) 16,000 19,000 Increase 10% – 25% Table grapes Value ($) 20 million 17 million Decrease –Production (tonnes) 6,000 4,000 Decrease 10% – 25% Area (ha) 980 880 Decrease 10% – 25% Sorghum Value ($) 40 million 20 million Decrease –Production (tonnes) 145,000 84,000 Decrease 10% – 25% Area (ha) 62,000 35,000 Decrease 10% – 25% Wheat Value ($) 10 million 19 million Increase –Production (tonnes) 38,000 80,000 Increase 10% – 25% Area (ha) 23,000 40,000 Increase 10% – 25% Pulses* Value ($) 50 million 106 million Increase –Production (tonnes) 54,000 120,000 Increase 10% – 50% Area (ha) 52,000 68,000 Increase 10% – 50% Appendix
Table 1 Update from the previous version of this report
* There may be double counting between cereals and pulses due to changes in ABS data categories between 2015–16 and 2016–17.
** Assuming 90% of Queensland exports of Mandarins are attributable to production in Central Highlands.
Note: All data is rounded.
Source: ACIL Allen based on Australian Bureau of Statistics
For more information
Liz Alexander
Agribusiness Development Coordinator
Central Highlands Development Corporation
Postal Address: PO Box 1425, Emerald Qld 4720
Office Address: 31 Ruby Street, Emerald Qld 4720
T 07 4982 4386
F 07 4982 4068
M 0429 471 511
E ealexander@chdc.com.au
W www.chdc.com.au | www.centralhighlands.com.au
48 Central Highlands QLD 2019 Economic Profile Data November 2017 (2015–16) November 2018 (2016–17) Change ABS Standard Error Mandarins Value ($)** 40 million 55 million Increase –Production (tonnes) 644,612 396,308 Decrease –Area (ha) 76,500 35,656 Decrease –Melons Value ($) 3 million 3 million No change –Production (tonnes) 3,000 3,000 No change –Area (ha) 50 70 Increase –Pasture cut hay Value ($) 1 million 1 million No change –Production (tonnes) 5,000 7,000 Increase 10% – 50% Area (ha) 800 900 Increase 10% – 50%
Appendix
Bibliography
ACIL Allen (2018) “Central Highlands Accelerating Agribusiness Stocktake – November 2018 Update” Central Highlands Development Corporation, Emerald
Australian Bureau of Statistics (2017) “Australian Census of Population and Housing 2016” Australian Bureau of Statistics, Canberra
Australian Bureau of Statistics (2019a) “Regional Population Growth, Australia, 2017–18” Australian Bureau of Statistics, Canberra
Australian Bureau of Statistics (2019b) “Labour Force, Australia, Detailed – Electronic Delivery, Cat. No. 6291.0.55.001, Feb 2019” Australian Bureau of Statistics, Canberra
Australian Bureau of Statistics (2019c) “Building Approvals, Australia, February 2019, Cat. No. 8731.0” Australian Bureau of Statistics, Canberra
Australian Bureau of Statistics (2019d) “Counts of Australian Businesses, including Entries and Exits, June 2014 to Jun 2018” Australian Bureau of Statistics, Canberra
Central Highlands Development Corporation (2018) “Development Register Central Highlands region, August 2018” Central Highlands Development Corporation, Emerald
Central Highlands Regional Council (2019) “Emerald Airport Traffic Data July 2010 to March 2019” Central Highlands Regional Council, Emerald
Department of Jobs and Small Business (2019) “Small Area Labour Markets publication – December Quarter 2018”
Australian Government, Canberra
Queensland Government Statistician’s Office (2018a) “Projected Population (Medium Series), by Local Government Area, Queensland, 2016 to 2041” Queensland Government, Brisbane
Queensland Government Statistician’s Office (2018b) “Projected Population (Medium Series), by Five-Year Age Group, Persons, by Local Government Area, Queensland, 2016 to 2041” Queensland Government, Brisbane
Queensland Government Statistician’s Office (2018c) “Bowen Basin: Non-Resident Workers On-Shift, by Local Government Area (LGA), 2006 to 2018” Queensland Government, Brisbane
Queensland Government Statistician’s Office (2018d) “Bowen Basin: Non-resident Population Projections, by Local Government Area (LGA) (Series A), 2018 to 2024” Queensland Government, Brisbane
Queensland Government Statistician’s Office (2019) “Residential Land Development Activity Profile, Central Highlands (R) Local Government Area (LGA)” (accessed 19 March 2019), Queensland Government, Brisbane
REMPLAN (2019) “REMPLAN Modelling and Analysis System” REMPLAN, Bendigo – REMPLAN utilises the following sources:
ABS 2016 Census Place of Work Employment (Scaled)
ABS 2015 / 2016 National Input Output Tables, and
ABS June 2018 Gross State Product.
Residential Tenancies Authority (2019) “Median Rents Quarterly Data” Queensland Government, Brisbane
Tourism Research Australia (2018) “Local Government Area Profiles, 2017 – Central Highlands (R) (QLD), Queensland”
Australian Government, Canberra
49 Central Highlands Development Corporation
Central Highlands Development Corporation
The Central Highlands Development Corporation is the lead economic and tourism development agency in the Central Highlands.


CHDC is a not-for-profit organisation and the lead regional development agency for the Central Highlands region of Queensland, Australia. Underpinned by robust and innovative industries including resources, mining, agriculture, tourism, small business and start-ups, we advocate for sustainable regional and economic growth by enhancing our workforces, promoting our region and supporting our businesses.
Work, Play, Discover the Central Highlands https://youtu.be/PA9-BfAFiAQ
Central Highlands Agriculture – more than you expect! https://youtu.be/jKM9PA811lc
Our primary role is to facilitate, coordinate and promote regional development initiatives and opportunities in the Central Highlands region.
This role is further reflected in the CHDC’s core business goals:
1 Advocate for sustainable regional and economic growth
2 Proactively market and promote the Central Highlands as a “region of choice”
3 Enhance workforce development
4 Support business development, innovation and capacity
5 Support community organisations to develop skills and knowledge
6 Sustain, refresh and grow our organisation
Business and community partnerships are critical to the delivery of these goals. If you have any queries about the economic profile, the Central Highlands region, or any issues related to regional economic growth, do not hesitate to contact the CHDC via the details below.
Central Highlands Development Corporation
PO Box 1425, Emerald QLD 4720
T (07) 4982 4386
F (07) 4982 4068
E enquiries@chdc.com.au
W www.chdc.com.au | www.centralhighlands.com.au
This economic profile has been prepared by REMPLAN in partnership with the CHDC. All figures and data presented in this document are based on data sourced from the Australian Bureau of Statistics (ABS), and other government agencies. Using ABS datasets, the regional economic modelling software ‘REMPLAN Economy’, has been applied to generate industrial economic data estimates. This document is provided in good faith with every effort made to provide accurate data and apply comprehensive knowledge. However, REMPLAN does not guarantee the accuracy of the data nor the conclusions drawn from this information.
REMPLAN

T (07) 5689 1499 / (03) 5444 4788
W www.remplan.com.au
50 Central Highlands
2019 Economic Profile
QLD
Notes
Notes
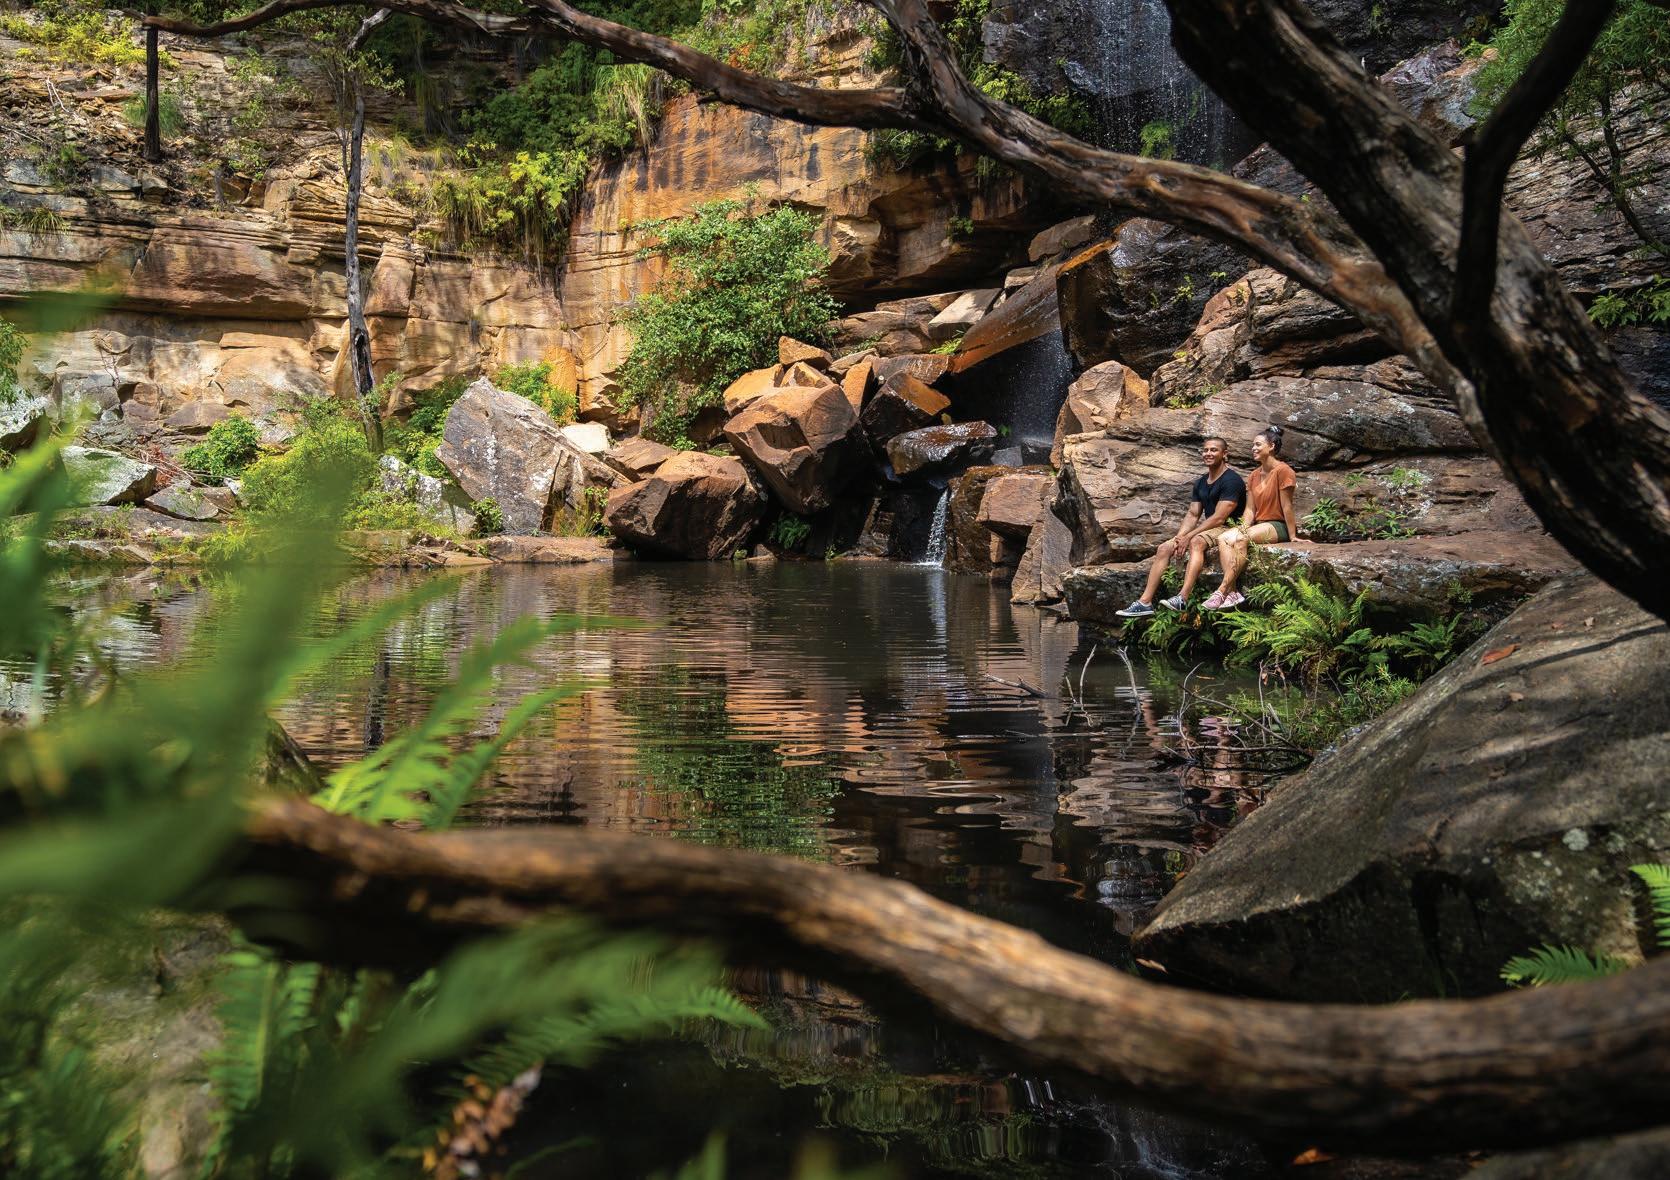
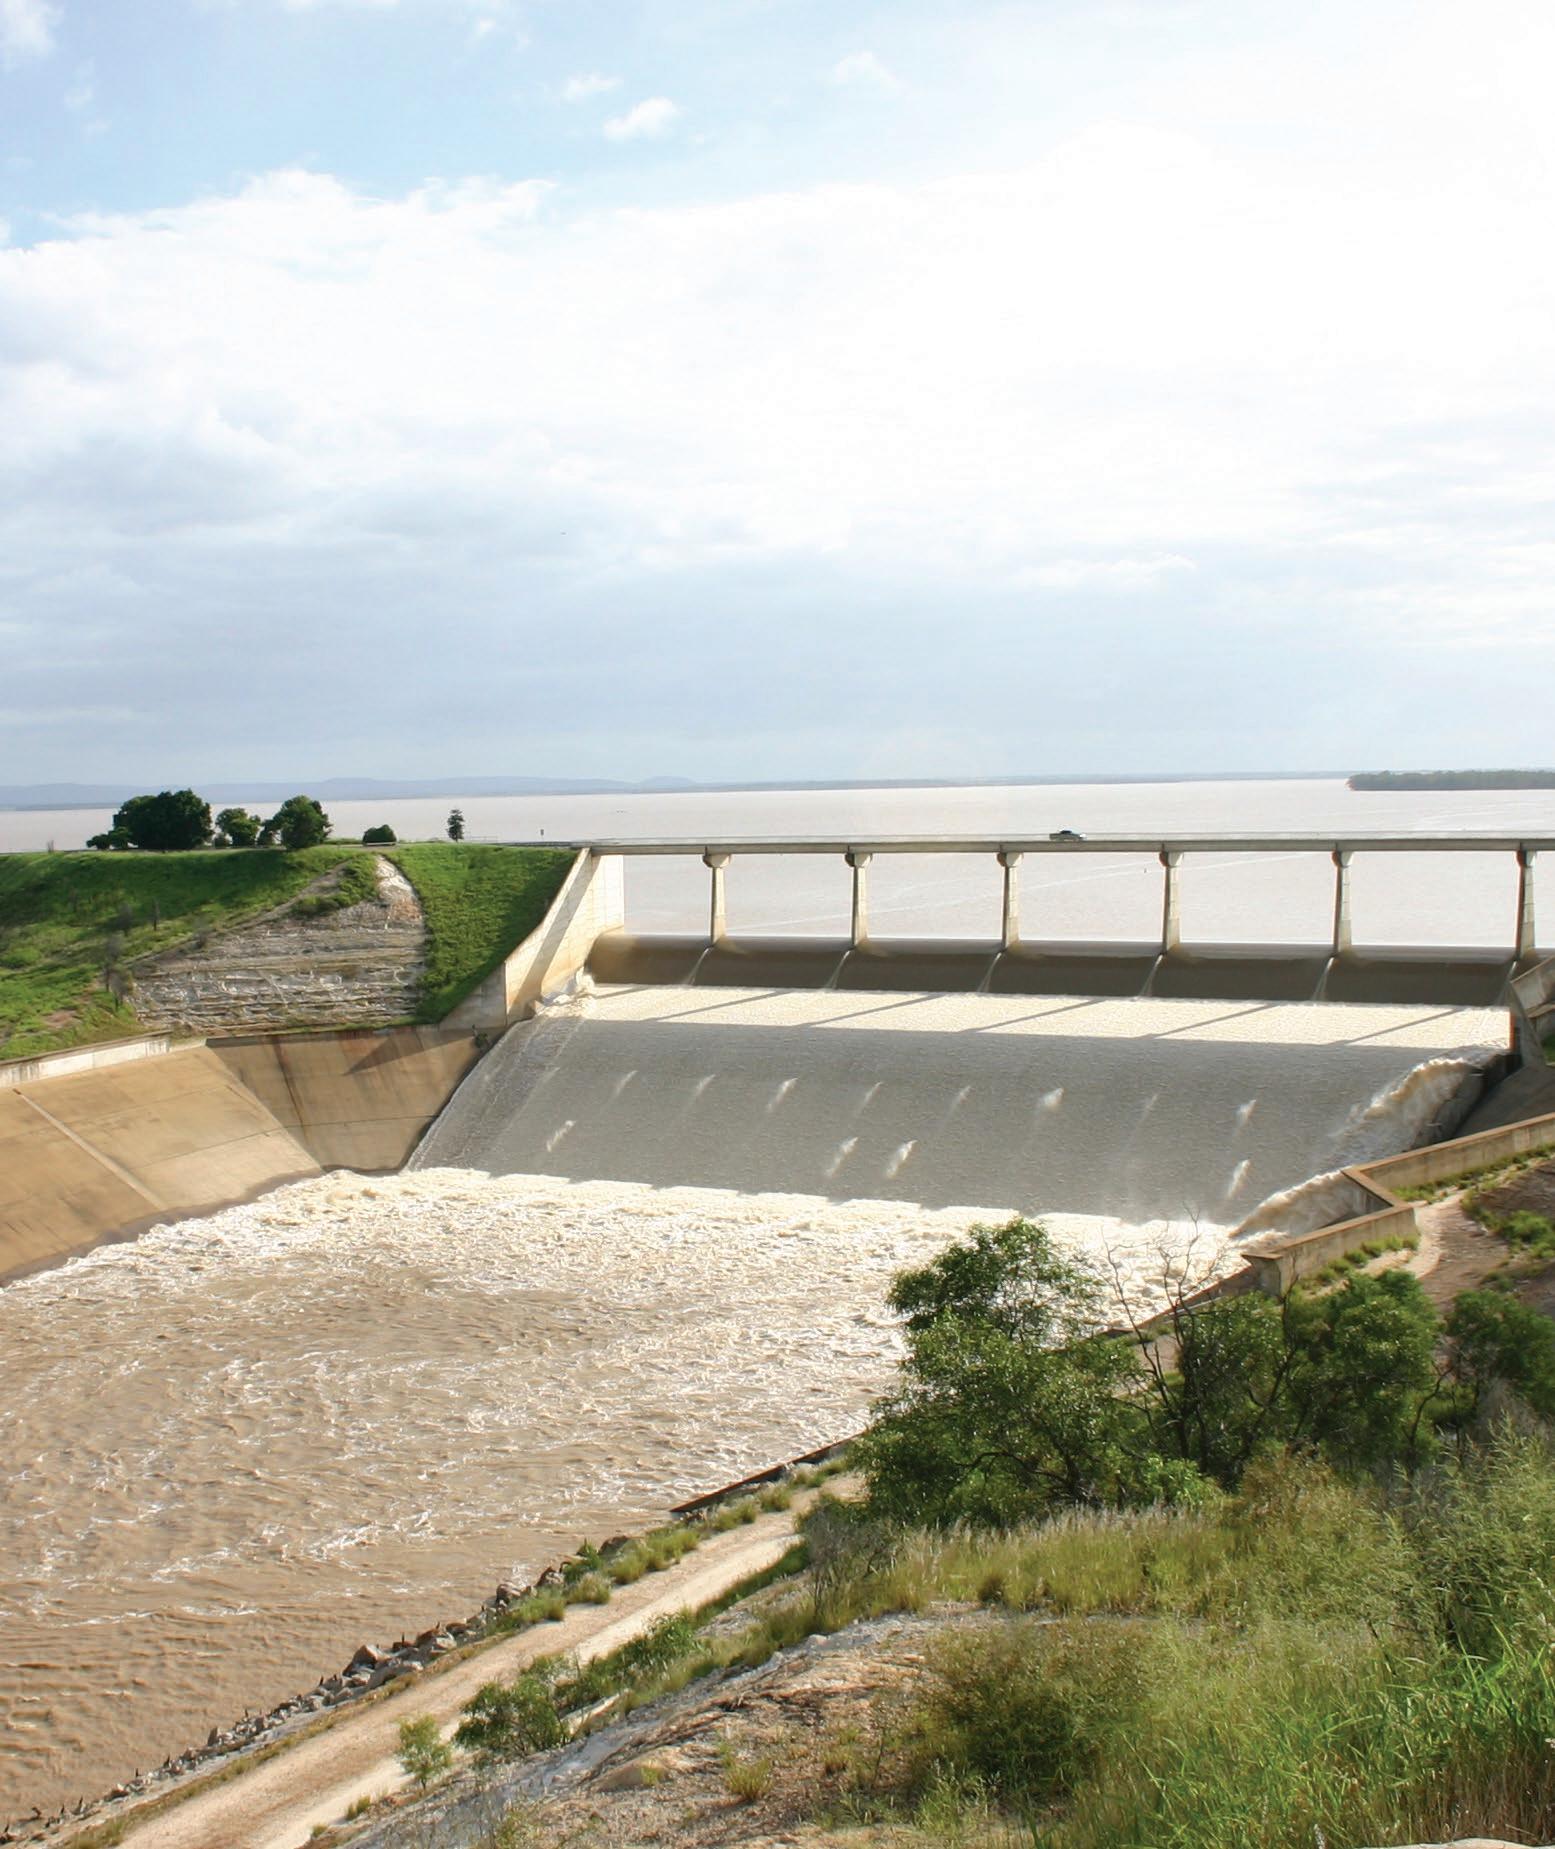
Central Highlands Development Corporation 31 Ruby Street Emerald QLD 4720 chdc.com.au T 07 4982 4386 F 07 4982 4068 E enquiries@chdc.com.au
