
Economic Profile April 2018 Central Highlands

Contents OVERVIEW 3 Region Overview 4 Snapshot 5 DEMOGRAPHICS 6 Population 7 Population Projections 8 Non-Resident Population 9 Age 10 Origin 11 Wellbeing 13 Education 15 Income and Families 16 Dwelling Tenure and Structure 17 EMPLOYMENT 18 Industry 19 Occupation 21 Age and Qualifications 22 Method of Travel to Work 23 INDUSTRY 24 Output and Value-Added 25 Local Expenditure and Regional Exports 26 Regional Imports and Key Propulsive Industries 27 Key Propulsive Industries 28 Summary Indicators and Gap Analysis 30 Gap Analysis 31 Major Projects 32 Top Five Major Projects Per Sector 33 HOUSING 35 Building Approvals 36 Residential Lot Approvals 37 Lot Registrations 38 New Lot Sales and Median Price 39 Dwelling Sales and Median Price 40 Median Weekly Rent 41 TOURISM 42 Output 43 Employment 44 Distribution of Tourist Dollar and Visitor Profile 45 Emerald Airport 46 TRENDS 47 Business Activity 48 Business Registrations 49 Employment 51 CENTRAL HIGHLANDS DEVELOPMENT CORPORATION 52 ABBREVIATIONS 54 BIBLIOGRAPHY 56
Overview

Overview
Region Overview Location
The Central Highlands is a robust region that sits at the heart of Queensland’s resources and agricultural sectors.
Spanning almost 60,000km2 , the Central Highlands region is just short of the size of Tasmania.
It includes a significant portion of Australia’s largest coal reserve, the Bowen Basin and is strategically located to service Australia’s newest mining province, the Galilee Basin Coal mining is a staple ingredient in the region’s economy, even during softer global markets
Sustained by irrigation sourced from water storage on the Nogoa and Comet rivers, the Central Highlands is also characterised by thriving farming industries, including beef, cotton, grapes and citrus
Major freight routes intersect the region, including the northsouth link between Charters Towers and northern New South Wales, identified as the inland transport alternative between Cairns and Melbourne.
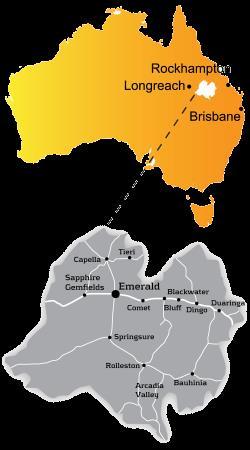
Pristine natural attractions, such as Carnarvon Gorge and the Sapphire Gemfields, are driving an emerging tourism market.
A population of just under 29,000 with a median age of 33 help underpin the Central Highlands’ economic strength of a skilled, locally-based workforce
Overview Snapshot
Indicator Period Source (Year) Demographics Estimated Resident Population 28,783 2016 ABS (2017c) Projected Population 39,364 2036 QGSO (2016) (Medium Series ) Resident Population Growth (Annual Average) 1.0% 2016-2036 QGSO (2016) (Medium Series) Resident and Non-Resident Population Growth 0.9% 2016-2021 QGSO (2016) (Medium Series) & QGSO (2018b) (Series A) Median Age 33 2016 ABS (2017a) Median Personal Income (Weekly) $843 2016 ABS (2017a) Median Household Income (Weekly) $1,823 2016 ABS (2017a) Employment Unemployment Rate 4.5% 2017 Department of Jobs and Small Business (2018) Labour Force 16,263 2017 Department of Jobs and Small Business (2018) Non-Residential Workforce 3,150 2016 QGSO (2018a) Industry Gross Regional Product $3.66bn 2017 REMPLAN (2017) Passengers Emerald Airport 208,284 2016-17 CHRC (2018)
Demographics
Demographics Population

Highlights
▪ Population growth of 0.5% per year from 2006 to 2016
▪ Forecast population growth of 1.1% per year from 2016 to 2026
▪ A population of 39,364 people by 2036
Population
The estimated resident population in Central Highlands as at 30 June, 2016 is 28,783 people Between 2006 and 2016 the Central Highlands (estimated resident) population increased by 1,518 people (5 6%), with an average annual compound population growth of 0 5% between 2006 and 2016 Central Highlands population peaked at 29,820 in 2013 and began to experience a decline thereafter
Population Projections
Queensland Government population projections, 2015 edition (medium series) were released in April 2016
Between 2016 and 2036, the population of Central Highlands is projected to increase by 7,211 people The average annual projected population growth between 2016 and 2026 of 1 1% is lower than the average growth rates experienced over the previous 10 years (1 7%)
Source: ABS (2017c)
Population Projections byAge Cohort - Central Highlands Year 0-14 15-29 30-49 50-64 65-79 80+ Total 2016 7,658 6,917 9,938 5,217 2,043 380 32,153 2021 7,944 7,057 10,426 5,571 2,530 544 34,073 2026 8,129 7,357 10,880 5,777 2,990 757 35,890 2031 8,347 7,697 11,353 5,918 3,284 1,030 37,630 2036 8,623 8,030 11,646 6,247 3,517 1,301 39,364 2016-2036 965 1,113 1,708 1,030 1,474 921 7,211 Source:QGSO(2016a)
Demographics Population Projections
Highlights
▪ The 30 to 49 year age group is projected to experience the largest increase in population from 2016 to 2036 (1,708 people)
▪ A lower rate of population growth than the broader Central Queensland SA4 region and Queensland
Source: QGSO (2016a)
Population Growth Comparison
Source: QGSO (2016)
For each five year period from 2016 to 2036, the annual average population growth in Central Highlands is projected to gradually decline The annual average population growth in Central Queensland SA4 (comprising the Banana, Central Highlands, Gladstone, Livingstone, Rockhampton and Woorabinda Local Government Areas) and Queensland are projected to remain steady
Average annual population growth in Central Highlands is estimated to be lower than the surrounding Central Queensland SA4 and broader Queensland projections
Population Projections by Age Cohort – Central Highlands
Demographics
Non-Resident Population
Highlights
▪ Average annual growth of the nonresident population of 3.1% has outpaced resident population growth of 0.5% from 2006 to 2016
▪ The non-resident population is expected to fall and stabilise at 3,000 by 2022
Non-Resident Population
The estimated non-resident population in Central Highlands as at 30 June, 2016 is 3,150 people The average annual non-resident population growth between 2006 and 2016 of 3.1% is significantly higher than the resident population growth over the same period at 0 5%
Non-Resident Population Projections
Between 2016 and 2021, the non-resident population of Central Highlands is projected to decrease by 340 people When combined with the forecasted resident population growth, total full-time equivalent population growth in Central Highlands between 2016 and 2021 is projected to increase by 1,580 people (average annual growth of 0.9%).
Source: ABS (2017b) and QGSO (2018a)
Source: QGSO (2018b)
Demographics Age
Highlights
▪ Central Highlands comprises a younger population when compared to Queensland
▪ The 60 to 69 year old age group has experienced the most growth from 2011 to 2016
The following demographic section is based on Place of Usual Residence data obtained from the 2016 ABS Census, the latest data available The 2016 ABS Census was held on 9 August 2016 and data from the 2016 Census was from mid-2017
Age Distribution
Analysis of the age structure of Central Highlands residents in 2016 compared to Queensland shows there is a larger proportion of residents aged less than 15 years (24.7%, compared to 19 4% in Queensland) Central Highlands also comprises a higher proportion of 25 to 59 year olds than Queensland (51.5%, compared to 46.8%). Conversely, the proportion of retirees (those aged 60 years and over) in Central Highlands (12 1%) is lower than Queensland (20 8%)
Source: ABS (2017a)
Change in Age Distribution, 2011 to 2016
Between 2011 and 2016, the Central Highlands population decreased by 713 people. The largest changes in age structure in this area between 2011 and 2016 were in the age groups:
• 35 to 49 (-473 persons);
• 15 to 19 (-330 persons); and
• 60 to 69 (+264 persons)
Source: ABS (2017a)
Demographics Origin
Highlights
▪ When compared to Queensland, Central Highlands comprises a larger proportion of Aboriginal residents, as well as a higher proportion of residents born in Australia
Indigenous Status
Analysis of the Indigenous status of Central Highlands residents in 2016 compared to Queensland shows that there is a higher proportion of Aboriginals in Central Highlands (4 0%, compared to 3 2% in Queensland) Overall, the local Indigenous population accounts for 4 3% of the total Central Highlands population, which is slightly higher than Queensland (4 0%)
Source: ABS (2017a)
Country of Birth
Analysis of the country of birth of Central Highlands residents shows a higher proportion of residents born in Australia (76.0%, compared to 71.1% in Queensland). The top 10 countries of birth for Central Highlands residents include Australia, New Zealand, England, Philippines, South Africa, India, Zimbabwe, Papua New Guinea, United States of America, and Germany
Source: ABS (2017a)
Demographics Origin
Highlights
▪ Population growth in Central Highlands is being driven by arrivals from overseas, as well as other intrastate locations such as Rockhampton and Isaac
Migration
Of the 28,002 people living in Central Highlands, 15,749 (56 2%) also lived in Central Highlands five years ago. The largest migration of residents to Central Highlands over the five year period from 2011 to 2016 from outside of the LGA were from residents who had previously lived overseas (724 people, or 2 6% of total Central Highlands residents), followed by residents from Rockhampton (452 people, or 1 6% of total Central Highlands residents) The largest migration of residents to Central Highlands from outside of Queensland were from Tweed in New South Wales (31 people, or 0 1% of total Central Highlands residents)
Source: ABS (2017a)
Demographics Wellbeing
Highlights
▪ Central Highlands has half the proportion with a need for assistance as Queensland (2.6% vs 5.2%)
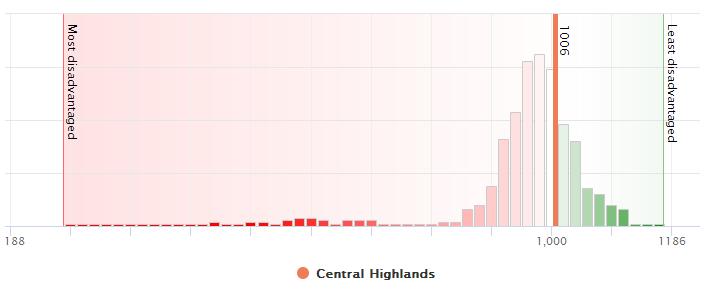
▪ The SEIFA Index of Disadvantage for Central Highlands is 1,006 and is in the top 28% of least disadvantaged LGAs in Australia.
Need for Assistance
Of the 28,002 people living in Central Highlands, 717 people (2 6%) have a need for assistance due to a profound disability, long term health condition or age. This is half the proportion of the population in Queensland with a need for assistance reflective of a younger population profile in Central Highlands
SEIFA (Disadvantage)
Socio Economic Indexes for Areas (SEIFA) is a suite of indexes that have been created by the Australian Bureau of Statistics (ABS) from social and economic Census information Each index ranks geographic areas across Australia in terms of their relative socio-economic advantage and disadvantage This report presents information from the Index of Relative Socio-economic Disadvantage (IRSD), a general socio-economic index that summarises a range of information about the economic and social conditions of people and households within an area This index includes measures of relative disadvantage only and is not evidence of relative advantage
The SEIFA index of disadvantage for Central Highlands (R) is 1,006 The local government area index of Central Highlands (R):
• Ranks 393 out of 544 local government areas with SEIFA scores in Australia
• There are 151 local government areas which are less disadvantaged, and
• There are 392 local government areas that are more disadvantaged
Source: ABS (2017a)
Demographics Wellbeing
Highlights
▪ ‘Tieri’ is the least disadvantaged locality in Central Highlands (1,092)
▪ The most disadvantaged localities are ‘The Gemfields’ (788) and ‘Willows’ (828)
Of 60 suburbs and localities located within Central Highlands with a resident population, the least disadvantaged suburb is Tieri (1,092) and the most disadvantaged suburb is The Gemfields (788) followed by Willows (828).
2016 Localities Score NationalRank 2016 Localities Score NationalRank The Gemfields SSC 32819 788 296 /13,691 Minerva SSC 31869 1,041 9,643 /13,691 Willows SSC 33110 828 441 /13,691 Comet SSC 30661 1,052 10,514 /13,691 Duaringa SSC 30889 931 2,090 /13,691 Albinia SSC 30023 1,064 11,437 /13,691 Bingegang SSC 30257 961 3,415 /13,691 Arcturus SSC 30081 1,064 11,438 /13,691 Dingo SSC 30852 961 3,417 /13,691 Cairdbeign SSC 30480 1,064 11,439 /13,691 Bluff SSC 30296 971 4,005 /13,691 Orion SSC 32252 1,064 11,443 /13,691 Balcomba SSC 30122 975 4,262 /13,691 Carbine Creek SSC 30538 1,072 11,971 /13,691 Barnard SSC 30168 975 4,263 /13,691 Chirnside SSC 30608 1,072 11,972 /13,691 Boolburra SSC 30321 975 4,264 /13,691 Hibernia SSC 31338 1,072 11,977 /13,691 Coomoo SSC 30697 975 4,269 /13,691 Theresa Creek (Qld) SSC 32836 1,072 11,979 /13,691 Gainsford SSC 31104 975 4,272 /13,691 Buckland (Qld) SSC 30408 1,075 12,126 /13,691 Goowarra SSC 31219 975 4,273 /13,691 Cona Creek SSC 30665 1,075 12,127 /13,691 Mackenzie SSC 31742 975 4,278 /13,691 Mantuan Downs SSC 31769 1,075 12,130 /13,691 Capella SSC 30534 983 4,813 /13,691 Nandowrie SSC 32120 1,075 12,131 /13,691 Blackwater SSC 30283 987 5,085 /13,691 Wealwandangie SSC 33047 1,075 12,133 /13,691 Springsure SSC 32658 997 5,911 /13,691 Belcong SSC 30210 1,077 12,243 /13,691 Central Highlands (R) 1,006 393 / 544 Bundoora (Qld) SSC 30431 1,077 12,244 /13,691 Arcadia Valley SSC 30078 1,023 8,071 /13,691 Crinum SSC 30757 1,077 12,245 /13,691 Consuelo SSC 30672 1,023 8,075 /13,691 Khosh Bulduk SSC 31535 1,077 12,248 /13,691 Humboldt SSC 31385 1,023 8,079 /13,691 Lilyvale SSC 31673 1,077 12,249 /13,691 Jellinbah SSC 31451 1,023 8,080 /13,691 Lowestoff SSC 31713 1,077 12,250 /13,691 Lowesby SSC 31712 1,023 8,081 /13,691 MountMacarthur SSC 32006 1,077 12,252 /13,691 Rewan SSC 32445 1,023 8,082 /13,691 Retro SSC 32444 1,077 12,254 /13,691 Stewarton (Qld) SSC 32686 1,023 8,083 /13,691 Wyuna (Qld) SSC 33220 1,077 12,256 /13,691 Togara SSC 32867 1,023 8,084 /13,691 Tieri SSC 32853 1,092 12,929 /13,691 Argyll SSC 30083 1,025 8,250 /13,691 Alsace SSC 30046 No score Lochington SSC 31687 1,025 8,256 /13,691 Blackdown SSC 30277 No score Emerald (Qld) SSC 30982 1,026 8,336 /13,691 Carnarvon Park SSC 30547 No score Rolleston SSC 32485 1,031 8,775 /13,691 Cheeseborough SSC 30591 No score Bauhinia SSC 30185 1,040 9,551 /13,691 Coorumbene SSC 30714 No score Goomally SSC 31203 1,040 9,558 /13,691 Cotherstone SSC 30735 No score Mimosa (Qld) SSC 31865 1,040 9,560 /13,691 Dromedary(Qld) SSC 30887 No score Mungabunda SSC 32087 1,040 9,562 /13,691 Fork Lagoons SSC 31080 No score Oombabeer SSC 32244 1,040 9,563 /13,691 Gordonstone SSC 31223 No score Rhydding SSC 32446 1,040 9,564 /13,691 Wallaroo (Qld) SSC 32996 No score Gindie SSC 31137 1,041 9,641 /13,691 Wooroona SSC 33189 No score
SEIFADisadvantage
Demographics Education
Qualifications
Highlights
▪ Central Highlands residents predominantly hold Certificate qualifications
▪ The largest increase in qualifications from 2011 to 2016 was for residents with Graduate Diplomas and Graduate Certificates
▪ A greater proportion of Central Highlands residents do not hold qualifications when compared to Queensland
Analysis of the qualifications of the population in Central Highlands compared to Queensland shows 7 8% of Central Highlands residents with a Bachelor degree or higher, compared to 14.7% in Queensland. A higher proportion of Central Highlands residents hold a Certificate qualification (18 8%) compared to Queensland (17 2%)
Overall, 31.0% of the population hold educational qualifications, and 57.0% hold no qualifications, compared with 38 9% and 52 4%, respectively for Queensland
Source: ABS (2017a)
Change in Qualifications, 2011 to 2016
The largest changes in the qualifications of the population of Central Highlands between 2011 and 2016 are in those with:
• No Qualifications (-1,363 persons);
• Graduate Diplomas and Graduate Certificates (+53 persons); and
• Postgraduate Degrees (+38 persons).
Source: ABS (2017a)
Demographics
Income and Families
Weekly Individual Income
Highlights
▪ Approximately 23.0% of Central Highlands residents earn $1,500 per week or more
▪ Central Highlands comprises a higher proportion of couple families with children than the Queensland average
Analysis of individual income levels in Central Highlands in 2016 compared to Queensland shows that the median weekly income is higher for local residents when compared to the broader state; $843 vs $660.
Overall, 23 1% of persons earn a low income (less than $400 per week) and 23 0% earn a high income ($1,500 or more per week), compared to 28.4% and 15.1%, respectively in Queensland
Source: ABS (2017a)
Family Composition
Central Highlands comprises a higher proportion of couple families with children (51 1%) when compared with Queensland (42 5%), and a lower proportion of couple families with no children (36 6%) compared with Queensland (39 4%)
Overall, 11 1% of families are one parent families, and 1 2% are other families, compared with 16 5% and 1 6%, respectively for Queensland
Source: ABS (2017a)
Dwelling Tenure and Structure
Dwelling Tenure
Highlights
▪ Rented dwellings represent the highest proportion of dwelling tenure in Central Highlands
▪ While ‘Caravan, cabin, houseboat’ dwellings comprise a significantly higher proportion of dwellings in Central Highlands than Queensland, separate houses are still the dominant dwelling type in the region
Analysis of the housing tenure of dwellings in Central Highlands in 2016 compared to dwellings in Queensland shows there is a larger proportion of rented dwellings or dwellings under other tenure types This is reflective of the large non-resident workforce in the region, who are renting or living in various short term accommodation arrangements
Overall, 45 6% of dwellings are owned outright or with a mortgage, 34 6% are being rented and 6 3% are other tenure types, compared to 58 6%, 31 3% and 2 0%, respectively in Queensland
Source: ABS (2017a)
Dwelling Structure
As at 2016, there are 10,713 separate houses in Central Highlands; 1,657 medium density dwellings, 6 high density dwellings, 938 caravans, cabins or houseboats and; and 38 other dwellings
There is a significantly higher proportion of ‘Caravan, Cabin, Houseboat’ dwellings in Central Highlands (6 8%) compared to Queensland (2 1%) This can be attributed to the large number of non-residents staying in employer-provided accommodation while working in the region
Source: ABS (2017a)
Demographics
Employment
Employment Industry
Highlights
▪ Within the Central Highlands workforce, the Mining sector comprises the largest number of employees
▪ The Mining sector experienced the largest increase in jobs from 2011 to 2016
▪ The Construction sector experienced the largest decrease in jobs from 2011 to 2016 and as a result dropped from being the second largest employing sector in 2011 to sixth largest in 2016
The following graphs illustrate the profile of employed people whose place of work is located within Central Highlands This includes residents and non-residents
Employment by Industry
The total employment estimate for Central Highlands as at the 2016 Census is 17,019 jobs The ‘Mining’ sector comprises 6,079 jobs, followed by the ‘Agriculture, Forestry & Fishing’ sector (1,791 jobs) and the ‘Retail Trade’ sector (1,184 jobs)
Source: REMPLAN (2017)
Change in Jobs by Industry Sector, 2011 to 2016
Between the 2011 and 2016 Census periods, there was a net increase of 309 jobs in Central Highlands, building on the 16,710 jobs in 2011
Source: REMPLAN (2017)
Employment Industry
▪ The Central Highlands has a total workforce of 17,019, with 68.1% of workers residing locally
▪ Mining is the largest employer of both the resident (21.9%) and nonresident (65.2%)
Industry Sector Total Jobs Resident Workforce Non-Resident Workforce Agriculture, Forestry & Fishing 1,791 1,550 241 Mining 6,079 2,543 3,536 Manufacturing 325 215 110 Electricity, Gas, Water & Waste Services 144 121 23 Construction 971 616 355 Wholesale Trade 342 284 58 Retail Trade 1,184 1,084 100 Accommodation & Food Services 1,010 833 177 Transport, Postal & Warehousing 627 514 113 Information Media & Telecommunications 63 39 24 Financial & Insurance Services 126 106 20 Rental, Hiring & Real Estate Services 268 206 62 Professional, Scientific & Technical Services 374 316 58 Administrative & Support Services 469 329 140 Public Administration & Safety 602 526 76 Education & Training 1132 1030 102 Health Care & Social Assistance 768 676 92 Arts & Recreation Services 84 69 15 Other Services 660 539 121 Total 17,019 11,598 5,421 Source: REMPLAN (2017)
Highlights
workforce
Employment Occupation
Highlights
▪ The unemployment rate has increased from 2.4% in 2009 to 4.5% in 2017
▪ The Central Highlands workforce is dominated by Machinery Operators and Drivers and Technicians and Trades Workers
Unemployment Rate
The unemployment rate in Central Highlands in 2017 was 4.5%. From 2009 to 2017, the unemployment rate in Central Highlands has ranged from a low of 2 4% in 2009 to a peak of 5.0% in 2015.
Occupation
Compared to the Central Queensland SA4 and State averages, Central Highlands has a higher proportion of ‘Technicians and Trades Workers’ and ‘Machinery Operators and Drivers’
0.0% 1.0% 2.0% 3.0% 4.0% 5.0% 6.0% 7.0% 8.0% 2009 2010 2011 2012 2013 2014 2015 2016 2017 Central Highlands Central Queensland SA4 Queensland
Source: Department of Jobs and Small Business (2018); ABS (2018b)
Source: ABS (2017)
Employment Age and Qualifications
Highlights
▪ Workers in Central Highlands are predominantly in the 25 to 44 year age group
▪ As with residents, Central Highlands workers typically hold Certificate qualifications
▪ A larger proportion of the Central Highlands workforce hold no qualifications when compared to the Central Queensland SA4 and Queensland
Age
The workforce age profile for Central Highlands shows a higher proportion of workers in the 25 to 44 year age group compared to the Central Queensland SA4 and State benchmarks
Qualifications
Workers in Central Highlands have a lower representation of graduate qualifications (Bachelor Degree and higher) when compared to the Central Queensland SA4 and State averages A higher proportion of workers have Certificate or No Qualifications in comparison to these benchmark areas
Source: ABS (2017)
Source: ABS (2017)
Employment Method of Travel to Work
Breakdown of Central Highlands Workforce
Highlights
▪ A large proportion of the Central Highlands workforce are nonresident workers
▪ The Central Highlands workforce generally travels by car (either as driver or passenger) to work
Of the 17,019 jobs in Central Highlands, 11,598 workers (68.1%) also live in the region. Approximately 31 9% of workers (5,421 workers) in Central Highlands live outside of the region. This is significantly higher than the Central Queensland SA4 (12.5%) and is indicative of the large proportion of non-resident workers in the region
Source: ABS (2017)
Method of Travel to Work
Over 98 7% of the Central Highlands workforce use the following methods to travel to work Approximately 65 9% of workers travel by car (either as driver or passenger), 6 2% work from home and 5 6% of workers use the bus
Source: ABS (2017)
Industry
Industry Output and Value-Added
Output
Output data represents the gross revenue generated by businesses / organisations in each of the industry sectors in a defined region
Highlights
▪ Mining contributes 61.2% of total output in Central Highlands
▪ The Mining sector contributes 57.6% of total valueadded for Central Highlands
The output generated by the Central Highlands regional economy is estimated at $8 191 billion
Source: REMPLAN (2017)
Value-Added
Value-added data represents the marginal economic value that is added by each industry sector in a defined region. Value-added can be calculated by subtracting local expenditure and expenditure on regional imports from the output generated by an industry sector, or alternatively, by adding the Wages & Salaries paid to local employees, the gross operating surplus and taxes on products and production Value-added by industry sector is the major element in the calculation of Gross Regional Product
The total value-added by the Central Highlands regional economy is estimated at $3 524 billion
Source: REMPLAN (2017)
Industry Local Expenditure and Regional Exports
Local Expenditure
Highlights
▪ Of the total $1.362 billion of local expenditure in Central Highlands, the Mining sector contributes 59.9%
▪ The Mining sector contributes 84.6% of total regional exports in Central Highlands
Local Expenditure data represents the value of intermediate goods and services purchased by local industry sectors within the region A high level of local expenditure on intermediate goods and services proportionate to total output is indicative of well-developed local supply chains and also that any expansion in this sector would typically deliver broad based benefits for the region’s economy
The total local expenditure estimate for Central Highlands is $1 362 billion
Source: REMPLAN (2017)
Regional Exports
Regional Exports data represents the value of goods and services exported outside of the region that have been generated by industry sectors within the region The following graph depicts the contribution to total regional exports generated by each of the industry sectors ranked from highest to lowest
The total regional export estimate for Central Highlands is $5 620 billion
Source: REMPLAN (2017)
Industry Regional Imports and Key Propulsive Industries
Highlights
▪ The Mining sector contributes 65.7% of total Central Highlands regional imports
▪ At the 45 industry sub-sector level, the top five key drivers in terms of regional exports, employment, valueadded and local expenditure on goods and services are:
– Livestock, Grains & Other Agriculture
– Mining
– Education & Training
– Accommodation & Food Services
– Construction
Regional Imports
Regional Imports data represents the value of goods and services imported into the defined region by businesses / organisations in each of the industry sectors. Another way of defining imports is as an outflow of money from the region The following graph depicts the contribution to total regional imports generated by each of the industry sectors ranked from highest to lowest
The total regional imports estimate for Central Highlands is $3 305 billion
Source: REMPLAN (2017)
Key Propulsive Industry Characteristics
Taking into consideration potential import replacement opportunities as well as current contributions to the regional economy in terms of employment, value-added and local expenditure on goods and services (backward linkages), key propulsive industries sectors have been identified In order to understand the contributions of industry sectors in more detail, the general 19 industry sector classification has been broken down to the 45 industry sub-sector level The following key propulsive industry sub-sectors have been identified as the key drivers of the Central Highland region’s economy:
• Livestock, Grains & Other Agriculture
• Mining
• Education & Training
• Accommodation & Food Services
• Construction
Industry
Key Propulsive Industries
Highlights
▪ Employment data refers to employed people whose place of work is located within Central Highlands, which includes residents and nonresidents. It is based on the ABS 2016 Census Place of Work data
▪ At the 45 industry sector level, the largest employer in the region is ‘Mining’ comprising 5,871 jobs, accounting for 34.5% of total Central Highlands jobs, followed by ‘Livestock, Grains & Other Agriculture’ (1,662 jobs), with the third largest employer being ‘Retail Trade’ (1,184 jobs)
▪ At the 45 industry sector level, the largest exporter in the region is the ‘Mining’ sector ($5.268 billion).
Employment
Employment is a key social outcome of economic development; employment data represents the number of people employed by businesses/organisations in each of the industry sectors in Central Highlands The total employment estimate for Central Highlands is 17,019 jobs The key propulsive industries contribute 10,012 jobs or 58 8% of total jobs in Central Highlands
Livestock, Grains & Other Agriculture (1,662)
Mining (5,871)
Education & Training (1,132)
Accommodation & Food Services (1,010)
Construction (337)
Other (7,007)
Regional Exports
Regional Exports represents the value of goods and services exported outside of the Central Highlands region that have been generated by local businesses/organisations Another way of defining exports is as an inflow of money into the region
The total regional export estimate for the region is $5.620 billion. The selected sectors contribute $5 268 billion (93 7%) of total regional exports
Livestock, Grains & Other Agriculture ($365.061 Million)
Mining ($4,735.696 Million)
Education & Training ($35.410 Million)
Accommodation & Food Services ($58.119 Million)
Construction ($73.651 Million)
Other ($351.613 Million)
Source: ABS (2017)
41.2% 9.8% 34.5% 6.7% 2.0% 0.6% 1.0% 6.3% 1.3% 84.3%
5.9% 6.5%
Source: REMPLAN (2017)
Industry
Key Propulsive Industries
Highlights
▪ At the 45 industry sector level, the largest industry sector in terms of value-added is the ‘Mining’ sector ($2,002.867 billion), followed by ‘Property Services’ ($252.876 million), with the third largest sector being the ‘Livestock, Grains & Other Agriculture’ sector ($171.317 million)
▪ At the 45 industry sector level, ‘Mining’ is the highest contributor in terms of local expenditure ($810.949 million), followed by ‘Livestock, Grains & Other Agriculture’ ($109.879 million) and ‘Construction’ ($63.632 million), with the ‘Construction Services’ sector ($56.334 million) the next highest contributor
The total value-added estimate for Central Highlands is $3 524 billion The selected sectors contribute $2.430 billion (69.0%) of total value-added.
Value-Added Backward Linkages (Local Expenditure)
Livestock, Grains & Other Agriculture ($171.317 Million)
Mining ($2,002.867 Million)
Education & Training ($102.442 Million)
Accommodation & Food Services ($65.624 Million)
Construction ($87.441 Million)
Other ($1,094.060 Million)
The following graph shows the value of intermediate goods and services purchased by industry sectors within Central Highlands The total local expenditure estimate for Central Highlands is $1 362 billion The selected sectors contribute $1 014 billion (74 5%) of total local expenditure.
Livestock, Grains & Other Agriculture ($109.879 Million)
Mining ($810.949 Million)
Education & Training ($10.218 Million)
Accommodation & Food Services ($19.313 Million)
Construction ($63.632 Million)
Other ($347.619 Million)
The industry sectors may not necessarily make the largest contributions to the region’s economy at present, however due to well-developed local supply chains these sectors have a significant capacity to deliver broad based economic benefits for the region.
Source: REMPLAN (2017)
4.9% 59.6% 2.9% 31.0% 1.9% 8.1% 0.8% 25.5% 4.7% 59.6%
Source: REMPLAN (2017)
2.5% 1.4%
Industry Summary Indicators and Gap Analysis
Summary Indicators
Highlights
▪ Central Highlands accounts for 21.1% of the Central Queensland SA4 GRP
▪ The region accounts for 1.1% of Queensland’s GRP
▪ The ‘Mining’ sector imports $2.131 billion (69.3%) of goods and services for input to production from the rest of Australia, the ‘Construction’ sector imports $196.112 million, accounting for 6.4% of industry imports, and the ‘Agriculture, Forestry & Fishing’ sector imports $165.443 million from outside of Central Highlands
Source:REMPLAN (2017)
Central Highlands accounts for:
• 21.1% of Central Queensland SA4 and 1.1% of Queensland’s GRP
• 21.0% of Central Queensland SA4 and 1.2% of Queensland’s output
• 21.5% of Central Queensland SA4 and 1.2% of Queensland’s value-added
• 33.0% of Central Queensland SA4 and 5.3% of Queensland’s regional exports
• 30.0% of Central Queensland SA4 and 3.3% of Queensland’s regional imports.
Import Replacement Opportunities
Imports reflect demand in the area’s economy for goods and services not supplied locally and therefore represent ‘Gaps’ in local supply chains Imports from the rest of Australia may indicate opportunities for import replacement, increased value-adding and supply chain development Supply of these goods and services is currently feasible in the Australian context and may provide a guide to realistic, high value strategic opportunities to further develop the local economy The total replacement of imports with local production is improbably however it may be possible to capture a proportion of this escape expenditure
Total imports by industry sectors in Central Highlands from the rest of Australia are estimated at $3 073 billion
Source: REMPLAN (2017)
GRP Output Value-Added Regional Regional ($M) ($M) ($M) Exports ($M) Imports ($M) Central Highlands $3,664.243 $8,190.665 $3,523.750 $5,619.551 $3,305.304 Central Queensland SA4 $177,373.026 $39,012.759 $16,391.320 $17,027.786 $11,003.805 Queensland $326,995.000 $661,089.887 $305,603.214 $105,697.239 $99,261.172
Industry Gap Analysis
Highlights
▪ Industry sectors within Central Highlands import
$453.942 million from the ‘Exploration & Mining Support Services’ sector, $306.893 million from the ‘Professional, Scientific & Technical Services’ sector, and $233.343 million from the ‘Financial & Insurance Services’ sector from the ‘rest of Australia’
External Industry Sectors Supplying to the Region
In order to identify potential gaps within the region, REMPLAN data has been applied at the 45 industry sector level. The local industry sectors import a total of $3.073 billion of goods and services from the rest of Australia, conversely industry sectors in the rest of Australia supply $3 073 billion of goods and services to the local industries as part of the process of production
Source: REMPLAN (2017)
Industry Major Projects
Highlights
▪ The Development Register outlines projects that can be sourced. As such, it does not capture all of the investment in the region.
▪ Mining investment projects account for $7.6 billion of total investment projects in the Central Highlands
▪ Total project investment, including projects outside of the Central Highlands Region of Significance, currently stands at $69 billion
Based on available information, there is currently $8.8 billion in known major project investment currently underway or planned for short term development in Central Highlands
Mining and energy projects account for $8.5 billion of known projects, while roads account for $88 7 million
Moreover, known projects that are located outside of the Central Highlands Region of Significance that will still have significant economic benefits to the region approximate $69 billion
Not Started In Progress Completed Total ($M) ($M) ($M) ($M) Community Infrastructure $3.81 $7.15 $20.80 $31.76 Retail Construction $0.00 $0.00 $0.00 $0.00 Industrial Construction $9.40 $0.00 $0.00 $9.40 Residential Construction $0.00 $37.95 $0.00 $37.95 Workforce Accommodation Construction $0.00 $0.00 $0.00 $0.00 Roads $51.80 $30.40 $6.50 $88.70 Flood Restoration and Mitigation $0.00 $0.00 $3.60 $3.60 Tourism $0.00 $0.00 $0.59 $0.59 Mining $7,554.00 $46.00 $0.00 $7,600.00 Energy $900.00 $0.00 $0.00 $900.00 Water and Sewerage $2.30 $121.39 $2.50 $126.19 CH Subtotal $8,521.31 $242.89 $33.99 $8,798.19 Rail (Outside Central Highlands) $2,000.00 $2,200.00 $0.00 $4,200.00 Mining (Outside Central Highlands) $59,774.00 $2,293.00 $0.00 $62,067.00 Energy (Outside Central Highlands) $2,750.00 $0.00 $0.00 $2,750.00 Outside CH Subtotal $64,524.00 $4,493.00 $0.00 $69,017.00 Grand Total $73,045.31 $4,735.89 $33.99 $77,815.19 Source: CHDC (2017) Category
Top Five Major Projects Per Sector
▪ Investment in road infrastructure is a major component of project investment
▪ CHRC is playing an active role in community infrastructure development, particularly in supporting the upgrade to Emerald Airport
Major rail investment projects include the new $15 million Blackwater Aquatic Centre
The 2017 NDRRA or Natural Disaster Relief and Recovery Arrangements is a joint funding initiative between Commonwealth and State Governments to provide disaster relief to communities affected by natural disasters Central Highlands is spending $50 million under this initiative on affected roads in the LGA
Estimated Cost ($M) CommunityInfrastructure NewBlackwater Aquatic Centre Blackwater CHRC & BMA $15.00 2015-2017 Emerald Airport Runway Treatment Emerald CHRC $5.30 2017-2018 Emerald Airport General Aviation (GA) Upgrade Emerald CHRC $2.80 TBA Cycleways and active transport infrasture Emerald CHRC & Qld Govt. $1.80 2016-2017 Concrete Floodways Region Wide CHRC $1.27 2017-2018 Total CommunityInfrastructure Investment $31.76 Industrial Construction The Yamala Rail Siding Project Emerald (Yamala) GrainCorp $5.20 2017-2018 Emerald Saleyards Emerald (Yamala) CQIP, GrainCorp & CHRC $4.20 2017-2018 Total Industrial Construction Investment $9.40 Residential Construction Villas on Rivergum Emerald GBK Developers / Devcon Building $37.95 Subject to demand Total Residential Construction Investment $37.95 Road 2017 NDRRA Restoration Region Wide CHRC, Qld & Federal Govt. $50.00 2017-2019 Gregory Highway (EmeraldClemont) Emerald TMR $21.90 2015-2019 Carnarvon Gorge Road Rolleston CHRC, Qld & Federal Govt. $8.50 2015-2018 Blackwater - Rolleston Road Blackwater / Rolleston CHRC, TMR & Qld Govt. $4.40 2015-2017 CHRC Bikeways Emerald TMR & CHRC $1.80 2017-2018 Total Road Investment $88.70 Flood Restoration and Mitigation NewStreet Evacuation Route Emerald CHRC $2.10 2016-2017 Nogoa River Excavation Works Emerald CHRC $1.50 2016-2017 Total Flood Restoration and Mitigation Investment $3.60 Tourism Interpretive Trail Sapphire Gemfields CHRC / State Govt. $0.59 2016-2017 Total Tourim Investment $0.59 Source:CHDC (2017) Timing Proponent Location Project Name Industry
Highlights
Industry
Top Five Major Projects Per Sector
Highlights
▪ The three largest mining projects account for $2.909 billion
▪ The two key energy projects in the LGA total $900 million
In addition to the projects within the region there are a number of major projects at various stages of development in the adjoining regions to Central Highlands that have the capability of providing added benefit to the LGA These include $62 1 billion in mining, $4.2 billion in roads and $2.8 billion in rail. The largest of these projects is the Carmichael Mine valued at $16 5 billion followed by China Stone Coal Project ($6 7 billion), Kevin’s Corner ($6 billion) and South Galilee Coal Project ($4.2 billion). There is also the Galilee IGCC Power Station valued at $1 250 billion
Estimated Cost ($M) Mining Springsure Creek Underground Springsure Adamelia Resources Pty Ltd $1,180.00 Subject to market conditions BelviewProject Blackwater Stanmore Coal $869.00 2022-2023 Mackenzie Project Blackwater Moreton Resources Ltd $860.00 TBA Togara North Springsure Glencore Coal $800.00 2017 Minyango Underground Blackwater Bounty Mining Ltd $750.00 2020 Total Mining Investment $7,600.00 Energy Bowen Basin Gas Pipeline Moranbah JV: Blue Energy 7 APA Group $500.00 TBC Lilyvale Solar Farm Tieri FRV Australia $400.00 2017-2018 Total EnergyInvestment $900.00 Water and Sewerage Fairbairn DamSafety Improvement Project Emerald SunWater $95.00 2016-2017 Sewerage Major Capital Works Emerald CHRC $22.00 2016-2018 Park Avenue Sewage Treatment Plant Emerald CHRC $2.99 2017-2018 Water Utilities Blackwater CHRC $2.50 2014-2017 Water Utilities Blackwater CHRC $2.30 2017-2018 Total Water and Sewerage Investment $126.19 Source:CHDC (2017) Project Name Location Proponent Timing
Housing
Housing Building Approvals
Highlights
▪ Separate house approvals have accounted for approximately 69.6% of total dwelling approvals from 2006-07 to 2016-17
▪ The value of nonresidential approvals has generally accounted for approximately 44% of the value of total building approvals
There were 17 new dwelling approvals in 2016-17, an increase of 6 dwellings over the previous 12 months, comprising 17 houses and no “other” (unit) dwellings Dwelling approvals peaked in 2012-13 at 422 approvals Since then the volume of approvals have experienced a significant decrease caused by trends in global mineral prices that affected the economy of Central Highlands Over the 10 year period from 2006-07 to 2016-17, separate house approvals have accounted for approximately 69.6% of total dwelling approvals. The highest levels of unit approvals occurred in 2011-12 (46% of total approvals)
The total value of building approvals during 2016-17 is $44 3 million The value of residential building approvals peaked in 2012-13 at $235 9 million The value of ‘non-residential’ approvals has generally accounted for approximately 44% of the value of total building approvals
Source: ABS (2017)
Source: ABS (2017)
0
$5.8
0
$6.4
Housing Residential Lot Approvals
Highlights
▪ Before 2015, larger projects of more than 50 lots have generally accounted for the majority of approvals
▪ The largest number of lot approvals occurred in 2008 with a total of 879 approvals
Between 2008 and 2017 the highest number of annual approvals occurred in 2008 at 879, with 80% of the lot approvals being in larger projects of more than 50 lots Due a the fall in global mineral prices, the housing market has slowed in Central Highlands leading to next to no new lot approvals from 2015.
Lot Approvals
<10 11-20 21-50 >50 Total 2008 50 41 81 707 879 2009 26 0 27 80 133 2010 10 20 22 0 52 2011 9 36 24 69 138 2012 44 0 0 182 226 2013 25 0 29 162 216 2014 24 16 0 94 134 2015 1 0 0 0 1 2016 0 0 0 0 0 2017 0 0 0 0 0
Source: QGSO(2018c)
June
Year Ending
Source: QGSO (2018c)
Housing
Lot Registrations
Highlights
▪ The number of lot registrations peaked in 2013 with 648 registrations
▪ 2016 saw the lowest number of lot registrations, with only 13 total lot registrations recorded
Lot registrations is the final stage of development of new lots There is generally a time lag between lots being approved and lots being registered The total number of lot registrations in Central Highlands has increased between 2016 to 2017 Since 2014, the volume of registrations has significantly declined.
aLots on a standard formatplan intended for detached dwellings,including lots intended for detached dwellings in a communitytitle scheme.
b Lots on a building formatplan or standard formatplan thatrepresentattached dwellings within a communitytitle scheme.
Urban lots (60m2 to <2,500m2) have consistently accounted for the majority of standard residential lot registrations from 2008 to 2017 Unit & Townhouse lot registrations have on average represented 24 7% of residential lot registrations
Urbana (60m2 to <2,500m2) Lower Density 2,500m2 to 5 ha Total Urban Lots 2008 222 40 262 45 307 2009 123 11 134 48 182 2010 107 23 130 35 165 2011 158 4 162 72 234 2012 87 46 133 74 207 2013 491 13 504 144 648 2014 185 20 205 96 301 2015 5 7 12 2 14 2016 1 12 13 0 13 2017 13 6 19 0 19
Source:QGSO(2018c)
Year Ending June Standard Residential Lot Registrations Unit & Townhouse Lotsb Total Lot Registrations
New Lot Sales and Median Price
New Lot Sales
▪ The total number of lot sales peaked in 2010 with 342 sales
▪ The median price for vacant land was $66,500 and for house & land packages was $255,000 as at June 2017
There were a total of 34 new lot sales in the year to June 2017 within Central Highlands, of which 65% were vacant land sales Vacant land sales have traditionally accounted for the majority of new lot sales within the region, with house and land package lots generally accounting for approximately 25.8% of sales.
The median sales price of vacant land has been decreasing since 2014 after peaking in 2013 at $160,000. The median value of packaged house and land sales has also decreased since 2013.
1Mayinclude resales ofvacantland.Excludes intermediate vacantland transactions relating to developer house and land package sales.
2 Includes lots as a componentofa developer house and land package in addition to subdivided lots containing an existing dwelling.
Source:QGSO(2018c)
Median $/m2 Vacant Land1 House & Land Package2 Total Sales Vacant Land1 House & Land Package2 Vacant Land1 2008 118 36 154 $105,000 $392,250 $111 2009 152 50 202 $105,000 $380,000 $144 2010 256 86 342 $122,000 $400,000 $140 2011 170 53 223 $128,000 $412,000 $156 2012 211 112 323 $150,000 $458,000 $190 2013 239 55 294 $160,000 $458,000 $225 2014 86 29 115 $154,500 $400,000 $192 2015 20 5 25 $126,000 N/A $166 2016 7 7 14 N/A N/A N/A 2017 22 12 34 $66,500 $255,000 $95
Year Ending June New Lot Sales (140m2 to 2,500m2) Median Sales Price
$0 $50,000 $100,000 $150,000 $200,000 $250,000 $300,000 $350,000 $400,000 $450,000 $500,000 2008 2009 2010 2011 2012 2013 2014 2015 2016 2017 VacantLand House&LandPackage
Housing
Highlights
Source: QGSO (2018c)
Median Price
20 7 22
Housing Dwelling Sales and Median Price
There were a total of 342 new and established detached and attached dwelling sales in the year to June 2017 within Central Highlands, of which 88% were detached house sales Detached housing sales have accounted for the majority of dwelling sales activity within the region, accounting for approximately 83% of all dwelling sales over the last decade.
Both the detached and attached dwelling markets experienced a peak in median sales price in 2013, at $440,000 and $370,000, respectively. The median sales price for both detached and attached dwelling markets have since been in a state of decline
Detached Houses Units and Townhouses Total Sales Detached Houses Units and Townhouses 2008 560 87 647 $315,000 $305,000 2009 609 86 695 $325,000 $287,000 2010 545 76 621 $342,000 $285,000 2011 587 103 690 $365,000 $300,000 2012 798 262 1,060 $415,000 $345,000 2013 350 95 445 $440,000 $370,000 2014 217 39 256 $360,000 $325,000 2015 181 19 200 $240,000 $265,000 2016 155 42 197 $192,500 $175,000 2017 300 42 342 $172,500 $139,900 Source:QGSO(2018c) Year Ending June Number of Dwelling Sales Median Sales Price $0 $50,000 $100,000 $150,000 $200,000 $250,000 $300,000 $350,000 $400,000 $450,000 $500,000 2008 2009 2010 2011 2012 2013 2014 2015 2016 2017 Detached Houses Units and Townhouses
Highlights ▪ The median sales price as at June 2017 for detached houses was $172,500 and $139,900 for units and townhouses ▪ Dwelling sales peaked in 2012, with a total of 1,060 sales
Dwelling Sales Median Price
Source: QGSO (2018c)
Housing Median Weekly Rent
Highlights
▪ Within Central Highlands, four bedroom houses are experiencing the highest rental rates, followed by three bedroom product for all dwelling types (houses, units/flats and townhouses). Two bedroom units/flats provide the lowest rental option.
▪ Rents dropped alongside the Rockhampton and Gladstone Regions from June 2012 to December 2016; this can be attributed to a reduction in demand for short term accommodation in Central Highlands.
Regional data has been sourced from the Queensland Residential Tenancies Authority for median rental data from June Quarter 2012 to December Quarter 2017 for:
• Units/Flats – two and three bedroom;
• Houses – three and four bedroom; and
• Townhouses – three bedroom
Median rents in Central Highlands declined continuously before stabilising by June 2015
Since June 2017, there has been minor evidence of recovery occurring in unit and flat rental prices
Jun-12 Dec-12 Jun-13 Dec-13 Jun-14 Dec-14 Jun-15 Dec-15 Jun-16 Dec-16 Jun-17 Dec-17 Two Bed Units / Flats Central Highlands $400 $400 $300 $250 $220 $190 $190 $175 $180 $165 $165 $185 Rockhampton $260 $260 $270 $230 $240 $230 $230 $220 $200 $200 $195 $200 Gladstone $400 $400 $420 $330 $280 $250 $240 $200 $160 $130 $130 $140 Three Bed Units / Flats Central Highlands $600 $500 $380 $300 $275 $240 $220 $220 $220 $220 $200 $250 Rockhampton $325 $340 $335 $330 $295 $290 $285 $265 $275 $260 $260 $270 Gladstone $550 $550 $460 $425 $350 $320 $300 $275 $230 $180 $190 $190 Three Bed Houses Central Highlands $700 $500 $400 $300 $270 $250 $220 $200 $200 $200 $210 $220 Rockhampton $340 $350 $350 $330 $300 $295 $290 $290 $280 $278 $270 $270 Gladstone $500 $500 $480 $395 $330 $300 $300 $260 $220 $180 $190 $190 Four Bed Houses Central Highlands $850 $600 $470 $400 $350 $325 $300 $300 $300 $300 $300 $300 Rockhampton $400 $400 $400 $370 $380 $370 $380 $380 $360 $350 $350 $340 Gladstone $650 $630 $600 $480 $400 $390 $380 $320 $260 $235 $240 $240 Three Bed Townhouses Central Highlands $750 $575 $430 $350 $320 $270 $270 $250 $250 $250 - $235 Rockhampton n.a. $340 $360 $420 n.a. $345 $120 $300 $340 $280 $290 $300 Gladstone $580 $560 $520 $480 $360 $360 $325 $280 $215 $180 $200 $190
Source:RTA(2018)
$0 $100 $200 $300 $400 $500 $600 $700 $800 $900 Two Bed Units / Flats Three Bed Units / Flats Three Bed Houses Four Bed Houses Three Bed Townhouses
Tourism
Tourism Output
Highlights
▪ The Tourism sector contributes 2.5% of total Central Highlands output
▪ The ‘Accommodation & Food Services’ sector contributes 66.8% of total tourism related output
Tourism is not identified as a separate industry sector in the National Accounts data, instead tourism is an amalgam of activities across various industry sectors such as retail, accommodation, cafes & restaurants, and cultural & recreational services The Tourism Module in REMPLAN estimates the total value of tourism for the local economy
Tourism Output
The estimated output generated by tourism for each industry sector has been deducted and consolidated into a separate tourism sector The total output estimate for Central Highlands is $8.191 billion, with Tourism contributing $202.415 million.
Source: REMPLAN (2017)
Output Attributable to Tourism
Tourism output has been estimated to be $202.415 million. The following graph shows the gross revenue generated by businesses and organisations in Central Highlands to service demand generated by tourists to the area.
Source: REMPLAN (2017)
Tourism Employment
Highlights
▪ The Tourism sector contributes 6.6% to total Central Highlands employment
▪ The ‘Accommodation & Food Services’ sector contributes 77.8% to total tourism related employment
Tourism Employment
The employment generated to service demand from visitors for each industry sector has been estimated through applying industry profiles from the Australian Bureau of Statistics Tourism Satellite Account and consolidated into a separate tourism sector Tourism is estimated to account for 1,117 jobs (6 6%) of the total 17,019 jobs in Central Highlands
Source: REMPLAN (2017)
Employment Attributable to Tourism
The total tourism related employment estimate for Central Highlands is 1,117 jobs. The following graph shows the number of jobs in each industry sector in the region which service demand generated by tourists to the area.
Source: REMPLAN (2017)
Tourism Distribution of Tourist Dollar and Visitor Profile
Distribution of Tourist Dollar
Highlights
▪ For each dollar spent by a tourist in Central Highlands, it is estimated that typically $0.67 is spent on ‘Accommodation & Food Services’
▪ Central Highlands typically has more domestic day visitors to the region than domestic overnight and international visitors.
For each dollar spent by a tourist in Central Highlands, it is estimated that typically $0.67 is spent on ‘Accommodation & Food Services’, $0 09 is spent on ‘Transport, Postal & Warehousing’, and $0.09 is spent on ‘Ownership of Dwellings’.
Source: REMPLAN (2017)
Visitor Profile
The visitor profile provides data for Central Highlands for a four year average to 2016.
Average Length of Stay
The following data has been sourced from Tourism Research Australia, Local Government Area Profile, 2016 for Central Highlands. Within Central Highlands, the average length of stay for international visitors is 23 nights, while the average length of stay of domestic overnight visitors is 4 nights Domestic overnight visitors spend an average of $450 per trip and $113 per night, compared to $712 and $31, respectively for international visitors
Domestic Day Domestic Overnight International Average Stay (Nights) - 4.0 23.0 Average Spend per Trip $173 $450 $712 Average Spend per Night - $113 $31 Source:TRA(2017) Visitors Nights Domestic Day ('000) 339Domestic Overnight ('000) 297 1,187 International ('000) 9 202 Source:TRA(2017)
Emerald Airport
Highlights
▪ During each year from 2010-11 to 2015-16, passenger numbers through Emerald Airport have typically peaked in the June/July period
▪ The six months to December 2017 has seen a total of 105,742 passengers through the airport
Passengers
Source: CHRC (2018)
*July
Tourism
10,000 15,000 20,000 25,000 30,000 Jul Aug Sep Oct Nov Dec Jan Feb Mar Apr May Jun 2010-11 2011-12 2012-13 2013-14 2014-15 2015-16 2016-17 2017-18
From 2010-11 to 2017-18*, the number of passengers through Emerald Airport peaked in 201213 with a total of 310,640 passengers Since 2012-13, the number of passengers through the airport has been decreasing, by -15% to 2013-14, then -12% to 2014-15, -7% to 2015-16 and then -4% to 2016-17 The six months to December 2017 has seen 105,742 passengers through Emerald Airport; this is less than the same period in 2016 (107,281 people) and 2015 (113,128 people) 2017 to Feb 2018 only
Trends
Business Activity
Highlights
▪ 3,144 businesses operating in Central Highlands
▪ The largest number of registered businesses are in the ‘Agriculture, Forestry & Fishing’ sector
▪ The total number of ‘Agriculture, Forestry & Fishing’ businesses grew by 14 from 2015 to 2017.
Business Activity
As at June 2017, there are 3,144 businesses operating in Central Highlands The largest number of registered businesses are in the ‘Agriculture, Forestry and Fishing’ sector (1,229), followed by ‘Construction’ (388)
Source: ABS (2018a)
Change in Businesses, 2015 to 2017
Between 2015 and 2017, the number of registered businesses in Central Highlands has decreased by 95 registered businesses The ‘Construction’ sector experienced the largest decline in business numbers (-54), followed by the ‘Other services’ sector (-21) The ‘Agriculture, Forestry and Fishing’ and ‘Transport, Postal and Warehousing’ sectors both experienced the (equal) largest increase in business numbers from 2014 to 2016 (14 each)
Source: ABS (2018a)
Trends
Business Activity
Highlights
▪ Owner/operator businesses account for the highest proportion of Central Highlands registered businesses
▪ Businesses with a turnover of less than $50,000 account for the highest proportion of Central Highlands registered businesses
Workforce Size
Between 2015 and 2017, the largest change occurred for businesses that employ 5 to 19 staff, increasing 6.3% from 313 in 2015 to 320 in 2017. Businesses which do not employ any staff (i e owner/operator) account for the highest proportion (63 1%) of Central Highlands registered businesses
Source: ABS (2018a)
Turnover
From 2015 to 2017, the largest change in businesses by turnover was for businesses turning over between $50,000 and $100,000, decreasing from 474 in 2015 to 393 in 2017, a decrease of 17 1% The largest proportion of businesses by turnover is businesses turning over less than $50,000, accounting for 22 5% of Central Highlands businesses in 2017 The $200,000 to less than $500,000 range accounts for the second highest proportion of businesses (20 6%)
Source: ABS (2018a)
Trends
Business Registrations
Highlights
▪ The total number of registered businesses in Central Highlands decreased by 2.9% from 2015 to 2017.
▪ No registered businesses in Central Highlands employ 200 staff or more
▪ The number of businesses with turnover of between $2 million and $5 million increased by 11.7% between 2016 and 2017
Business Registrations by Industry
Business Registrations by Workforce Size and Turnover
Change No. % No. % No. % 2016-2017 Non-Employing 2,055 63.4% 1,988 63.0% 1,984 63.1% -0.2% 1-4 Staff 796 24.6% 821 26.0% 796 25.3% -3.0% 5-19 Staff 313 9.7% 301 9.5% 320 10.2% 6.3% 20-199 Staff 75 2.3% 44 1.4% 44 1.4% 0.0% 200+ Staff 0 0.0% 0 0.0% 0 0.0%Total 3,239 100.0% 3,154 100.0% 3,144 100.0% -0.3% Change No. % No. % No. % 2016-2017 Zero to less than $50k 757 23.5% 691 21.9% 702 22.5% 1.6% $50k to less than $100k 474 14.7% 437 13.8% 393 12.6% -10.1% $100k to less than $200K 548 17.0% 519 16.4% 516 16.5% -0.6% $200k to less than $500k 659 20.4% 661 20.9% 643 20.6% -2.7% $500k to less than $2m 575 17.8% 629 19.9% 627 20.1% -0.3% $2m to less then $5m 156 4.8% 162 5.1% 181 5.8% 11.7% $5m to less then $10m 38 1.2% 45 1.4% 40 1.3% -11.1% $10m or more 21 0.7% 17 0.5% 21 0.7% 23.5% Total 3,228 100.0% 3,161 100.0% 3,123 100.0% -1.2% Source:ABS (2018a) Workforce Size 2015 2016 2017 Turnover Ranges 2015 2016 2017 No. % No. % No. % Agriculture, Forestry and Fishing 1,215 37.5% 1,212 38.4% 1,229 39.1% Mining 67 2.1% 54 1.7% 59 1.9% Manufacturing 83 2.6% 93 2.9% 74 2.4% Electricity, Gas, Water and Waste Services 6 0.2% 9 0.3% 6 0.2% Construction 442 13.6% 417 13.2% 388 12.3% Wholesale Trade 46 1.4% 45 1.4% 54 1.7% Retail Trade 137 4.2% 136 4.3% 132 4.2% Accommodation and Food Services 94 2.9% 84 2.7% 100 3.2% Transport, Postal and Warehousing 124 3.8% 123 3.9% 138 4.4% Information Media and Telecommunications 0 0.0% 0 0.0% 3 0.1% Financial and Insurance Services 118 3.6% 121 3.8% 114 3.6% Rental, Hiring and Real Estate Services 305 9.4% 306 9.7% 303 9.6% Professional, Scientific and Technical Services 150 4.6% 150 4.8% 135 4.3% Administrative and Support Services 82 2.5% 73 2.3% 77 2.4% Public Administration and Safety 9 0.3% 6 0.2% 6 0.2% Education and Training 34 1.0% 26 0.8% 25 0.8% Health Care and Social Assistance 57 1.8% 55 1.7% 61 1.9% Arts and Recreation Services 11 0.3% 10 0.3% 13 0.4% Other Services 225 6.9% 208 6.6% 204 6.5% Not Classified 34 1.0% 26 0.8% 23 0.7% Total 3,239 100.0% 3,154 100.0% 3,144 100.0% Source:ABS (2018a) 2015 2016 2017 Trends
Trends Employment
Highlights
▪ The increase in labour force from 2013 to 2014 can be attributed to an increase in employed people (586 people) and a decrease in unemployed people (-80 people)
Labour Force
The estimated number of people employed in Central Highlands in 2017 is 15,540 people Since 2009, the labour force has decreased by 1,983 people; the number of employed people has decreased by 2,270 people and the number of unemployed people has increased by 287 people
Source: Department of Jobs and Small Business (2018)
Jobs Growth Rate
Source: Department of Employment (2016)
Jobs growth rate identifies the annual change in the number of people employed within the region Employment growth since 2008/09 peaked between 2013/14 and 2014/15 at an increase of 586 jobs
Employed Unemployed Labour Force Unemployment Rate Job Growth Rate 2009 17,809 437 18,246 2.4%2010 17,195 501 17,695 2.8% -615 2011 16,821 664 17,485 3.8% -374 2012 16,880 603 17,482 3.4% 58 2013 16,359 799 17,158 4.7% -521 2014 16,945 720 17,664 4.1% 586 2015 16,415 863 17,277 5.0% -530 2016 16,232 775 17,007 4.6% -183 2017 15,540 724 16,263 4.5% -693 Source: Department of Jobs and Small Business (2018)
Central Highlands Development Corporation
Central Highlands Development Corporation
The Central Highlands Development Corporation is the lead economic and tourism development agency in the Central Highlands.
Central Highlands Development Corporation (CHDC) is a not-for-profit organisation, proactively supporting regional economic growth and tourism. Our primary role is to facilitate, coordinate and promote economic and tourism development initiatives and opportunities in the Central Highlands region

This role is further reflected in the CHDC’s core business goals:
1. Advocate for sustainable regional and economic growth
2. Proactively market and promote the Central Highlands as a “region of choice”
3. Enhance workforce development
4. Support business development, innovation and capacity
5. Support community organisations to develop skills and knowledge
6. Sustain, refresh and grow our organisation
Business and community partnerships are critical to the delivery of these goals If you have any queries about the economic profile, the Central Highlands region, or any issues related to regional economic growth, do not hesitate to contact the CHDC via the details below
Central Highlands Development Corporation

PO Box 1425, Emerald QLD 4720
T (07) 4982 4386
F (07) 4982 4068
E enquiries@chdc com au
W www.chdc.com.au
This economic profile has been prepared by REMPLAN in partnership with the CHDC All figures and data presented in this document are based on data sourced from the Australian Bureau of Statistics (ABS), and other government agencies Using ABS datasets, the regional economic modelling software ‘REMPLAN Economy’, has been applied to generate industrial economic data estimates This document is provided in good faith with every effort made to provide accurate data and apply comprehensive knowledge However, REMPLAN does not guarantee the accuracy of the data nor the conclusions drawn from this information
(07) 5689 1499 / (03) 5444 4788
www remplan com au

Abbreviations
Abbreviations
Throughout this profile a series of abbreviations has been utilised These are summarised below
ABS Australian Bureau of Statistics
CH
CHDC
CHRC
Central Queensland SA4
GRP
Central Highlands
Central Highlands Development Corporation
Central Highlands Regional Council
Central Queensland Statistical Area Level 4
Gross Regional Product
LGA Local Government Area
M2
Square Metres
QGSO Queensland Government Statistician’s Office
QLD Queensland
RTA Residential Tenancies Authority
TRA Tourism Research Australia
Bibliography
Bibliography
Australian Bureau of Statistics (2017a) “Australian Census of Population and Housing 2016” Australian Bureau of Statistics, Canberra
Australian Bureau of Statistics (2017b) “Building Approvals, Australia, August 2017” Australian Bureau of Statistics, Canberra
Australian Bureau of Statistics (2017c) “Regional Population Growth, Australia, 2015-16” Australian Bureau of Statistics, Canberra
Australian Bureau of Statistics (2018a) “Counts of Australian Businesses, including Entries and Exits, Jun 2015 to Jun 2017” Australian Bureau of Statistics, Canberra
Australian Bureau of Statistics (2018b) “Labour Force, Australia, Detailed – Electronic Delivery, Cat. No. 6291.0.55.001, Dec 2017” Australian Bureau of Statistics, Canberra
Central Highlands Development Corporation (2017) “Central Highlands Development Register – December 2017” Central Highlands Development Corporation, Emerald
Central Highlands Regional Council (2018) “Emerald Airport Traffic Data July 2010 to February 2018”
Central Highlands Regional Council, Emerald
Department of Jobs and Small Business (2018) “Small Area Labour Markets publication – December Quarter 2017” Australian Government, Canberra
Queensland Government Statistician’s Office (2016a) “Projected Population (Medium Series), by Local Government Area, Queensland, 2011 to 2036” Queensland Government, Brisbane
Queensland Government Statistician’s Office (2016b) “Projected Population (Medium Series), by Five-Year Age Group and Sex, by Local Government Area, Queensland, 2011 to 2036” Queensland Government, Brisbane
Queensland Government Statistician’s Office (2018a) “Bowen Basin: Full-time Equivalent (FTE) Population Estimates, by Local Government Area (LGA) and Selected Urban Centres and Localities (UC/Ls), 2017”
Queensland Government, Brisbane
Queensland Government Statistician’s Office (2018b) “Bowen Basin: Non-resident Population Projections, by Local Government Area (LGA), 2017 to 2024” Queensland Government, Brisbane
Queensland Government Statistician’s Office (2018c) “Residential Land Development Activity Profile, accessed March 2018 – Central Highlands Regional Council” Queensland Government, Brisbane REMPLAN (2017) “REMPLAN Modelling and Analysis System” REMPLAN, Bendigo – REMPLAN utilises the following sources:
• 2016 ABS Census Journey to Work Employment Data;
• 2014/2015 ABS National Input Output Tables; and
• June 2017 ABS Gross State Product.
Residential Tenancies Authority (2018) “Median Rents Quarterly Data” Queensland Government, Brisbane
Tourism Research Australia (2017) “Local Government Area Profiles, 2016 – Central Highlands” Australian Government, Canberra
