
State of Center City Philadelphia
Center

State of Center City Philadelphia
Center
by Prema Katari Gupta
A decade ago, following a substantial overnight snowfall, my toddler son Ren and I looked out at our neighborhood from a third-floor window. The familiar streetscape had been transformed—blanketed in white, quiet and pristine. I asked Ren what he saw in this winter wonderland. Without hesitation, he exclaimed, “Cars!”
This moment revealed a truth about human perception: we first see what reinforces our preexisting worldview. I saw a transformed landscape, but Ren immediately focused on the everyday objects of his fascination.
Selective awareness isn't limited to toddlers—it shapes how we all experience our surroundings, including our downtown. Our brains, constantly filtering an overwhelming amount of information, prioritize what aligns with our preexisting interests, concerns, and experiences. And it doesn't just influence individual experiences—it calcifies into collective narratives about places, narratives that can persist long after conditions have changed.
Five long years ago, when pandemic lockdowns emptied Center City seemingly overnight, crisis narratives quickly took hold to make sense of the disruption: downtowns were “dead,” offices were “over,” dense urban living had lost its appeal in a vast, work-from-anywhere world. Significantly, the temporary increase in crime during the summer of 2020 calcified these narratives. Relentless local news coverage highlighting isolated incidents and social media algorithms designed to engage and enrage spread these perceptions widely. These crisis narratives have shown remarkable staying power and continue to inform individual choices about where to live, work, invest, and spend leisure time, despite data telling a different story.
The lingering gap between perception and reality is particularly evident in discussions about public safety. Research from Brookings Metro demonstrates that across major cities, while fear of crime downtown is a dominant narrative affecting urban recovery, actual crime data tells a different story.
As shown in the graph below, violent crime in Center City has remained relatively stable between 2019 and 2024, with a slight decrease from pre-pandemic levels. However, perceptions of safety fell dramatically in 2020 and have not fully recovered to pre-pandemic levels, despite crime rates returning to or falling below 2019 figures. This visual representation perfectly illustrates the lingering perception gap—while actual violent crime has decreased or stabilized, the percentage of people who feel safe downtown has not correspondingly increased.
Source: Philadelphia Police Department and Center City District
The adage "if all you have is a hammer, everything looks like a nail" applies powerfully here: those primed to see urban decline often conflate visible homelessness and quality of life challenges with crime rates, despite the lack of statistical correlation between these phenomena.
In the State of Center City 2025 report, we invite you to discover the multifaceted downtown that exists today. Overall, Center City has recaptured 90% of its pre-pandemic foot traffic, with workers steadily returning to offices, patrons filling restaurants and cultural venues, and visitors filling the streets, students attending downtown schools, tourists exploring historic sites, patients accessing medical facilities, and shoppers visiting retail streets all contribute to the daily ebb and flow of people in the urban core, creating the vibrant street life that defines successful downtowns.
Center City is Philadelphia's most concentrated employment hub, with 42% of city jobs, more than half of which do not require a college degree. Job recovery has been robust, with the City of Philadelphia's total employment now exceeding 1980 levels for the first time in 45 years, with Greater Center City (river to river, Vine to Pine) adding 22,000 jobs year-over-year.
Tellingly, Center City's residential population hasn’t just recovered but has grown beyond prepandemic levels. Some downtown ZIP codes have seen population increases of more than 50% since 2000, while Center City experienced an 81% population increase between 1990 and 2020. More people than ever before are now choosing to make downtown their home. More apartments have been occupied in the four years since 2020 (9,500 units) than in the four years leading up to it (7,100).
Workers living within two miles of Center City are returning to offices at rates approaching 90% and Philadelphia ranks seventh among major downtowns in pedestrian recovery rates. Across 26 large downtowns analyzed, Philadelphia is among the top markets for non-resident worker return with a rate of 74%, equivalent to Boston and outpacing Lower Manhattan. Ridership across the SEPTA system has surged 71% in just three years, while trips made by bike into Center City specifically are up 67% from 2019 levels.
This report is organized to reflect the Center City District's organizational vision that "Center City is Philadelphia's heart of commerce, culture, and connection, generating opportunity and prosperity for the entire city and region." These three pillars—commerce, culture, and connection—provide the framework for understanding Center City's current state and future potential:
The Commerce section examines the economic foundations of downtown, beginning with Center City's job market before exploring the evolving office market, return-to-office trends, building conversions, and major development projects.
The Culture section delves into the social and experiential dimensions of Center City, from population growth and retail to restaurants, arts institutions, and tourism.
The Connection section focuses on the physical environment and infrastructure that binds Center City together—examining our public realm, mobility patterns, climate impacts, and quality-of-life indicators.
Challenges and vulnerabilities remain, requiring collaborative solutions. While Trophy office buildings maintain a healthy 12% vacancy rate, Class A buildings face a concerning 25% vacancy—highlighting the need for strategic repositioning. Center City District will work with property owners and city officials to facilitate conversions to retain and attract tenants. Transit funding uncertainty threatens the critical mobility network that is the lifeblood of Center City, requiring regional advocacy and sustainable funding solutions. Meanwhile, the lingering perception gap between actual safety data and public sentiment requires persistent attention.
There is significant work to do on quality-of-life challenges, including addressing the interconnected citywide fentanyl and homelessness crises that impact our downtown environment. In 2024 alone, our dedicated homeless outreach teams successfully assisted 136 unsheltered people into housing and support services suited to their needs. By tackling these issues through coordinated public-private partnerships and data-driven interventions, we can strengthen both the reality and perception of Center City as Philadelphia's welcoming economic engine.
Non-resident workers travel in to their jobs and make up the majority of the downtown population between the 9-5 hours. Visitors follow in the afternoon and stay until the late evening. Many residents are here all day and make up a large consistent proportion of the population.


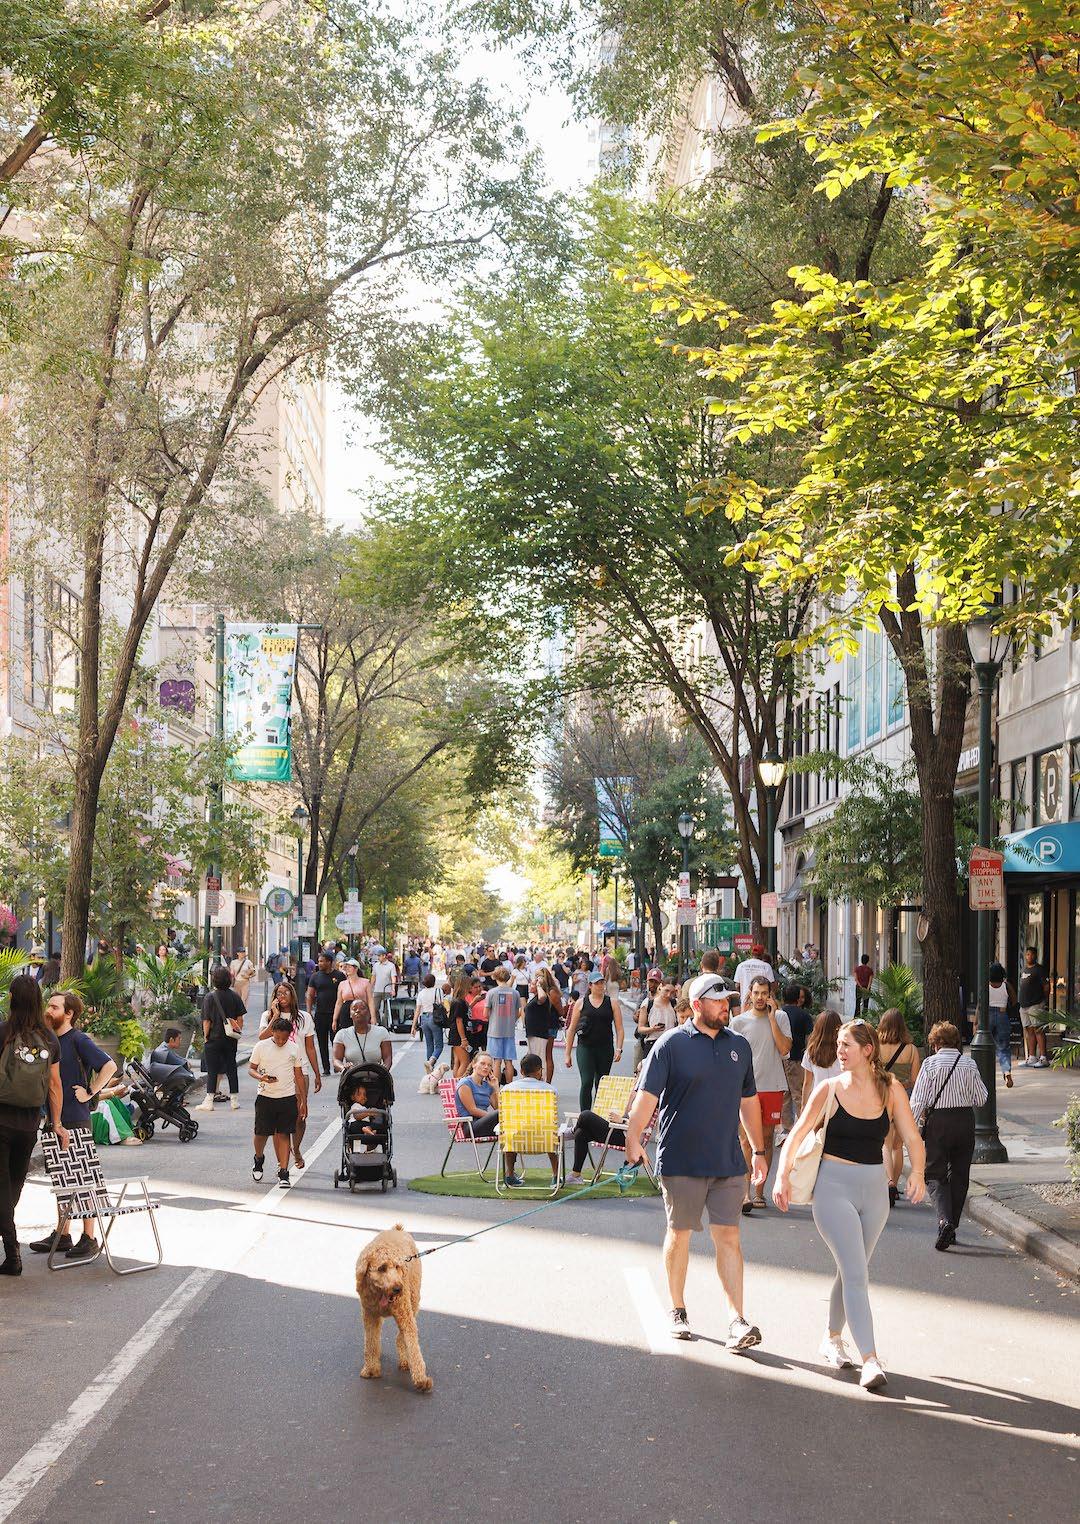
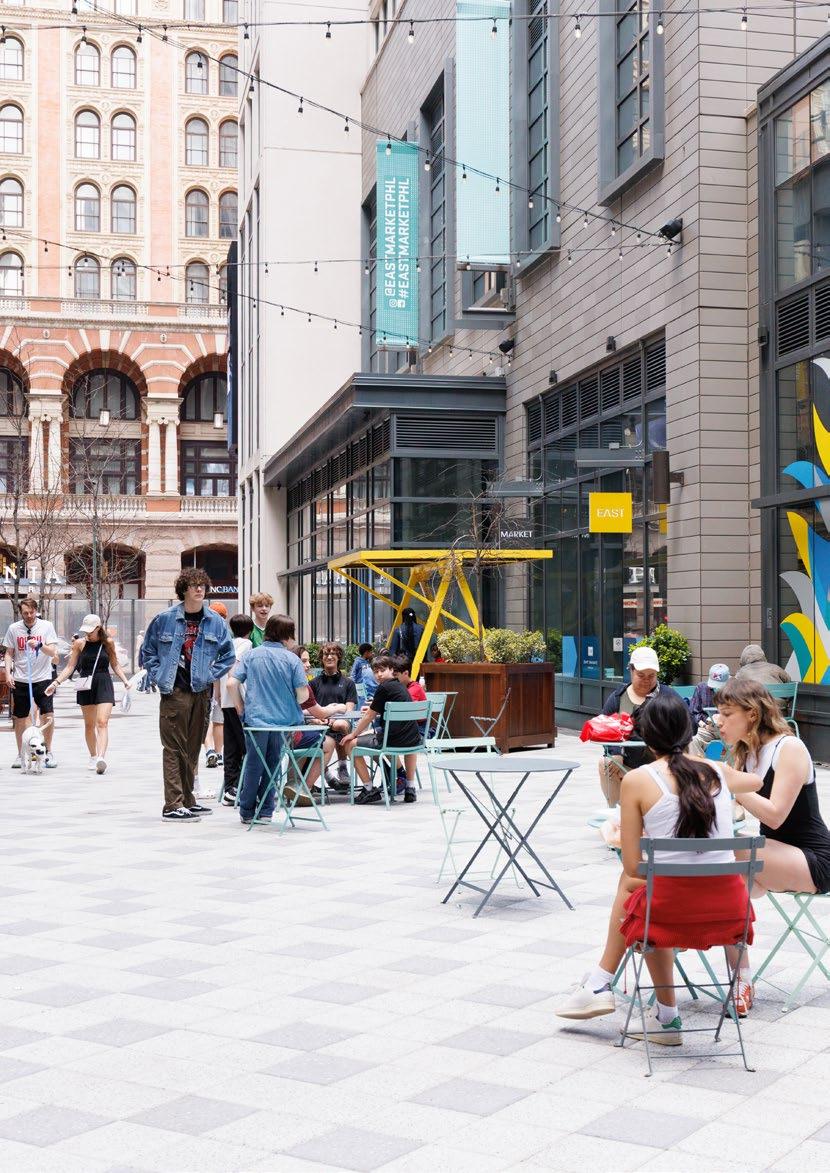
With the intent of downtown perception through placemaking, CCD launched Open Streets on West Walnut Street in September 2024—temporarily closing seven blocks to vehicles on select Sundays. The initiative brings together all aspects of CCD's operational excellence in place management, building on lessons learned managing successful parks, including Dilworth Park. The program's dual goals were to reinforce the competitive advantage of Philadelphia's inherent walkability and drive traffic to restaurants and retailers. The results proved that streets filled with people generate more commerce than streets filled with cars. A Philadelphia Inquirer columnist likened the scene to Barcelona's La Rambla, with families, shoppers, and Eagles fans creating a vibrant atmosphere.
The power of changing the narrative was especially evident when my effervescent colleague Giavana Suraci Pruiti, the program's adept project manager, appeared on local news broadcasts discussing the program's vibrancy—offering a refreshing counter to the usual doom-laden coverage of downtown. Data showed benefits extending beyond the closure area, with neighboring streets seeing increased activity. Importantly, 36% of businesses reported reductions in nuisance behavior, while none experienced increases.
The evidence is clear; Center City Philadelphia in 2025 is reinventing itself as a more resilient, diverse, and dynamic downtown. Like my son seeing cars in a snow-covered landscape, we all bring our selective awareness to how we perceive Center City. This report invites you to look beyond preconceptions and recognize the remarkable urban center that continues to drive our region's economic and cultural prosperity.
This report is the culmination of months of work from CCD’s incredibly fearless and fastidious economic development, design, and communications teams. I’m especially grateful for Lauren Smith’s capable project management and Clint Randall’s thoughtful and innovative leadership of our economic development team. The art in the report was created by Miriam Singer, a Philadelphia-based artist who loves and celebrates city life as much as we do. As always, please let us know how you find the report useful.

Prema Katari Gupta President and CEO Center City District
Note: This report went to print on April 17, 2025, amid DOGE cuts to federal capacity, uncertainty around tariffs and immigration, and the announcement of SEPTA’s looming funding crisis.


90% of pedestrian volume has returned to Center City as of March 2025 (compared to 2019 levels)
42% of citywide jobs are located in Center City
3,811 housing units were completed in 2024
206,876 residents live in Greater Center City
815 retailers are located in Center City
942,977 visitors attended an event at the Pennsylvania Convention Center in 2024
97,523 daily SEPTA riders in Center City (on average)
299,956 jobs in Greater Center City
3.2 million occupied hotel rooms in 2024
51% of jobs in Center City do not require a bachelor's degree
Jobs Office
Return to Office
Conversions
Development


Center City Philadelphia is the city and region’s largest and most concentrated employment hub. Of all jobs that exist in Philadelphia, 42% are located within the boundaries of Greater Center City (Girard Avenue to Tasker Street, river to river). These nearly 300,000 jobs represent one in 10 jobs across the entire Greater Philadelphia region.
Citywide, job recovery in Philadelphia has been robust even as it has lagged faster growth markets: data from the end of 2024 at the city/county level reveal that Philadelphia has created nearly 119,000 jobs since the depths of the pandemic, putting the city 35,000 jobs above 2019 levels and for the first time surpassing the total number of jobs since 1980. For the smaller geography of Greater Center City, data is available through 2022 and tells a similarly positive story: the downtown area added nearly 22,000 jobs yearover-year.
More jobs than 1980: 2024 was the first year in 45 years that Philadelphia has exceeded its 1980 jobs totals.
Employment for all:
More than half of all Center City jobs require less than a college degree.
42% of all jobs: The nearly 300,000 jobs in Greater Center City make up 42% of all jobs located within Philadelphia.
More Philadelphians work in Center City than in North, South, West, Northwest,


Greater Center City— 8 square miles making up less than 6% of Philadelphia’s land area—contains 42% of all jobs in the city, and 1 in 10 of all the jobs across our entire metropolitan region. Of the nearly 300,000 jobs in Greater Center City, more than 243,000 are densely clustered in the core between Pine and Vine streets, meaning that more than a third of all jobs in Philadelphia are located within less than 2% of its land area.
The importance of Center City as an employment hub is reflected in the distribution of where Center City workers live. In addition to the 148,000 Center City jobs held by city residents (see previous page), dozens of ZIP codes each contain between 1,000 and 5,000 Center City employees across the suburbs of Pennsylvania and New Jersey.
Center City’s current strength lies in the diversity of its job offerings, which is in turn built on the unique roles our downtown plays as a hub of health care, commerce, entertainment, hospitality and conventions, and the creative economy. This rich ecosystem offers opportunities for people of all education levels, with more than half of downtown jobs requiring less than a college degree.
Home ZIP Codes of Center City Workers, 2024
Center City’s workforce comes from across the region as well as from every ZIP code within city limits.
Source: Placer.ai
Number of Center City Workers
1,001–5,000 501–1,000 0–500
5,001–8,500
8,501–11,103
These intersecting sectors create an economic dynamism downtown that is unmatched by even the most productive and vibrant suburban employment hubs. Our region has many notable job engines outside of city limits, with half a dozen suburban enclaves containing more than 20,000 jobs each, including Bala Cynwyd, Horsham, King of Prussia and the townships of Abington, Radnor, and Upper Dublin. It takes combining dozens of suburban employment nodes to match the commercial might of Greater Center City as a jobs hub.
Despite its dominance, Center City contains less office space than the sum of its surrounding suburbs, a function of both sprawling development patterns and archaic tax policies that have helped drive private sector employment outside of city limits. This is one reason why more than 40% of Philadelphia workers leave the city each day to reach their jobs.
The current Tax Reform Commission has laid out recommendations for a more business-friendly tax environment in Philadelphia, and Mayor Cherelle Parker’s proposed budget includes some crucial first steps in this direction. Tax policy reforms are essential for Center City to not only capture a higher share of regional office employment and development, but also for established and emerging companies to grow downtown.
Total Jobs: Greater Center City and Major Suburban Employment Hubs, 2022
The combined employment totals of 20 Census Designated Places (CDPs), townships, and boroughs across the northern and western suburbs do not cumulatively offer as many employment opportunities as Center City Philadelphia.
Source: U.S. Census Bureau, Longitudinal Employment-Household Dynamics, 2022. Geographies are Census Designated Places (CDPs) unless otherwise labeled.
The number of jobs in Philadelphia has risen ever since the Great Recession of 2008 with the notable exception of 2020. The pace of job growth has trailed many other major cities, indicating the need for structural reforms around tax policy and business attraction efforts. Nevertheless, the gradual growth allowed the city to surpass its 1990 jobs totals in 2019. Preliminary data from December 2024 from the Bureau of Labor Statistics (BLS) reveal that the city’s total nonfarm employment has now surpassed 1980 levels. Philadelphia’s economy supports more jobs today than it has in 45 years, and year-end 2024 jobs totals are 35,200 above the 2019 peak. In fact, the city has added back more than 118,000 jobs since the fallout in 2020.
Net Migration as Percentage of Population, 2019-2024
The BLS also measures employment change via the Quarterly Census of Employment and Wages (QCEW), which collects information from more than 95% of all U.S. jobs and is available at the county level. Comparing these data across the five southeastern Pennsylvania counties in our region reveals that Philadelphia and its collar counties each experienced their previous employment peaks in 2007-2008, just prior to the Great Recession. The city’s performance since then has far outpaced the surrounding suburbs: Bucks, Chester, Delaware, and Montgomery counties have grown their total jobs between 1% and 4% above their pre-recessionary peaks, adding a combined 33,000 jobs. The City of Philadelphia now boasts employment levels 11% above its pre-recessionary peak, having added nearly 68,000 jobs, more than twice the suburban total.
Citywide Employment Relative to 1980 Levels
It has been 45 years since Philadelphia last contained this many jobs.
Source: Bureau of Labor Statistics
1,000,000
500,000
Job data at the sub-county level lag significantly behind larger geographies, but what is available tells a promising story that corroborates with citywide and regional measures. 2022 ZIP code data—the most recent available—show that core Center City added nearly 16,000 jobs year-overyear, while extended Center City added 6,000 jobs, for a total gain of 22,000 jobs from 2021 to 2022 in Greater Center City. The BLS data for this same year record a citywide gain of 29,300 jobs, suggesting that a significant majority of job growth within Philadelphia occurred in Greater Center City. The more recent BLS data also suggest that forthcoming ZIP code level results for 2023-2024 will show ongoing improvement.
Job Growth Since Previous Employment Peak (2007–2008)
Philadelphia County has added more jobs than the four collar counties combined above its 2008 peak.
Source: Bureau of Labor Statistics, QCEW survey
Greater Center City Jobs, 2022
Recent ZIP code level data reveals that Greater Center City is once again crossing the threshold of 300,000 jobs.
Source: U.S. Census Bureau, Longitudinal Employment-Household Dynamics, 2022.
While 42% of all Philadelphia’s jobs exist in Greater Center City, key sectors are overrepresented given the concentration of high-quality office space and the presence of major cultural and hospitality destinations. Center City contains a majority of all city jobs in the following sectors.
Share of Total
Source: U.S. Census Bureau, Longitudinal Employment-Household Dynamics, 2022
Select Large Center City Employer Head Counts, 2024
Source: CCD survey of downtown employers
Employer Center City head count (approx)
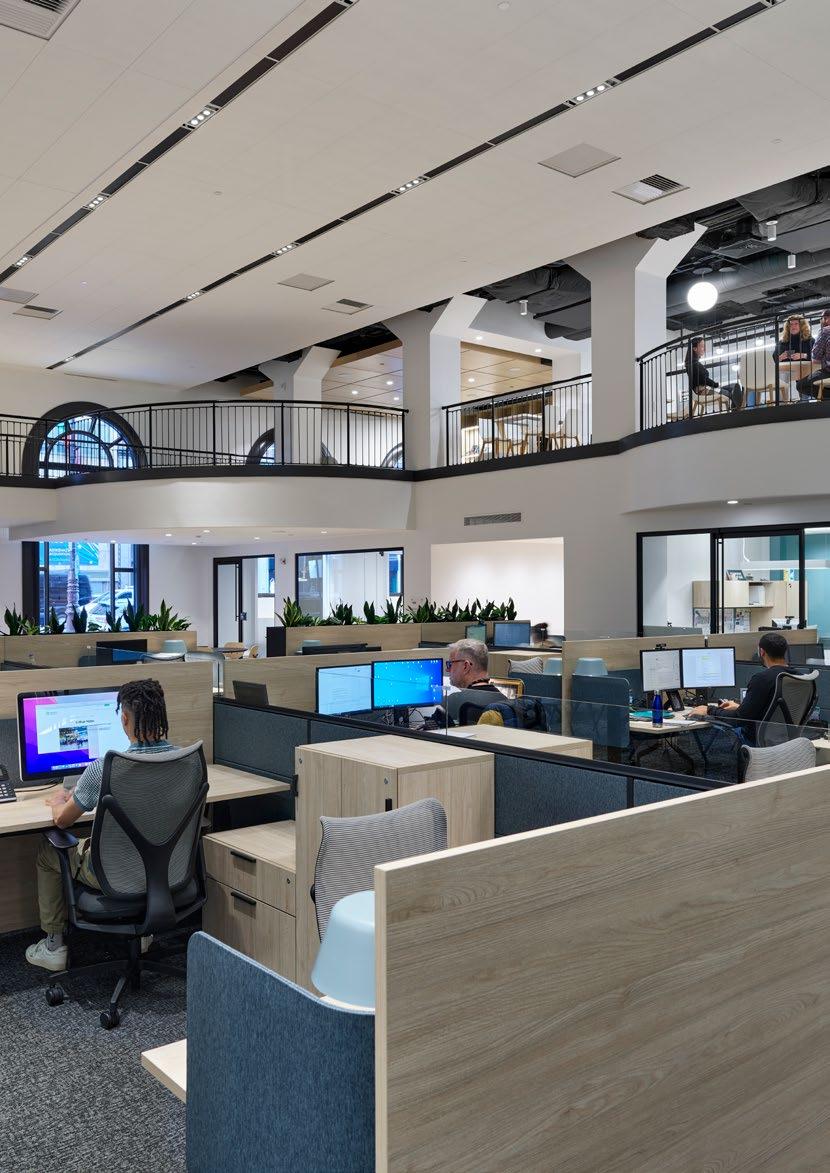

Office market dynamics remain in a state of worldwide flux as tenants across all industries reassess their workplace needs an era of hybrid and remote work. In Philadelphia, the landscape is uneven. Trophy buildings are benefitting from a flight to quality and gaining occupancy, while just a handful of older Class A and B buildings account for a majority of all market vacancy. There will be no one-size-fits-all solution to rightsizing and updating the inventory, but one thing is certain: Center City has too much office space. More precisely, it has an excess of the kind of space that corporate occupiers and the post-pandemic workforce find undesirable.
In two recent instances, this has played in Center City’s favor, as Morgan Lewis and Chubb ultimately opted to build the workplaces that they need to attract and retain the best and the brightest. In so doing, downtown has gained two new Trophy class office buildings and added to its net number of office-occupying jobs. And in the case of Morgan Lewis, its former building is coming online as the latest residential addition to the West Market office district, illustrating how a flight to quality can accelerate the virtuous cycle of redevelopment across property types.
Vacancy is concentrated: Just over a dozen buildings contain the lion’s share of the office market’s large blocks of unused space.
The flight to quality persists: Trophy buildings are vastly out-performing the rest of the office market as tenants prioritize quality over quantity.
Bright spots in the office district: Despite challenging fundamentals, key office and retail deals bode well for Market West’s recovery.
Center City has too much office space. But only a handful of buildings in the West Market District contain most of the vacancy.
Several of these large blocks of space are slated to be absorbed via conversion. Others can chip away as they welcome tenants in search of an upgrade to their previous workplaces. The balance of this space remains challenged due to age, quality, or the financial health of the property it occupies (buildings in distress have a harder time attracting tenants).


A select subset of office buildings make up the lion’s share of all downtown office vacancy. Each building’s tenancy, capital position, quality, location, and ownership is unique, necessitating propertyspecific solutions. In nearly all cases there are two major paths forward: reinvest or redevelop.
Reinvest in aging office properties to bring them up to contemporary standards, allowing them to benefit from the flight to quality: We’ve seen this happen within Philadelphia in previous real estate cycles across buildings of all vintages and layouts. 1100 Ludlow, The Bourse, 325 Chestnut, 1600 Market, and 1735 Market are all examples of buildings where major investments in amenities, finishes, systems, and retail have driven up office pricing and occupancy.
Office vacancy by class
Redevelop to another use: The larger and more square the building, the more challenging this path forward tends to be. Many of the Penn Center buildings – those clustered between the north side of Market and the south side of JFK Boulevard between City Hall and 17th Street – offer longer rectangular layouts more conducive to residential and hotel floorplans. Half of Three Parkway and the entirety of 1701 Market are welcoming new residents to former office space this year. The future of the Wanamaker Building is also likely to eliminate excess office space via partial conversion to apartments, among other uses.
Trophy buildings remain highly occupied, healthy even by pre-pandemic standards. Older Class A buildings have vacancy rates twice as high as Trophy properties.
Source: CoStar
For those buildings without a clear path forward, creativity will be necessary. The Tax Reform Commission’s recommendations released in February of this year offer some suggestions for how to incentivize redevelopment and create more demand for office-occupying industries, addressing both the supply and demand sides of this conundrum.
Throughout 2024, Class A vacancy ticked up one point to 25%, whereas Trophy properties held steady. Class B buildings are generally better occupied than Class A, creating softness in the middle of the market. This trend is best visualized via absorption, a measure of the change in occupancy of space. In 2024, Trophy buildings saw net positive absorption resulting in higher occupancy at yearend than 12 months prior. The other classes of office product saw net negative absorption in every quarter of 2024. Downsizing accounts for some of this, but major relocations are an ongoing driver. Since the vast majority of relocating and renewing firms shrink their footprints, the total amount of occupied space is decreasing even when deal volume is high.
Over the course of 2024, Trophy office properties reduced vacancy thanks to move-ins by tenants often relocating from lower quality buildings.
Source: CoStar
Vacancy in Large Urban Office Submarkets, Q4 2024 Center City’s office vacancy challenges must remain a focus for downtown stakeholders to avoid reaching the vacancy seen in other urban office cores.
Source: JLL
San Francisco Jackson Square
(CBD)
(CBD)
(CBD) Los Angeles (CBD)
Downtown
Leasing activity by class
Downtown (CBD)
Another way to understand the flight to quality is through leasing activity, where volumes by building class are not proportionate to the amount of available inventory. On a square footage basis, 43% of office leasing in 2023-2024 occurred in Trophy buildings (compared to 44% in Class A buildings and just 13% in Class B buildings). Since Trophy buildings make up approximately 20% of the Center City inventory, the amount of leasing they are capturing is more than double what might be expected.
Leasing Activity by Class Trophy buildings make up just 20% of Center City’s inventory but captured 43% of all leasing activity in 2024.
Source: CoStar
Trophy Class A Class B
These leases provide a representative snapshot of office market dynamics. Broadly speaking, larger established firms are cutting back on space while select newcomers are in expansion mode on a smaller scale. Critically, ground-floor uses are evolving to bring more life and vitality to an area of Center City trying to shake a reputation as a 9-to-5 district.
Building Tenant(s)
Three Logan Square
Polsinelli, Royer Cooper Cohen Braunfeld
1429-33 Walnut Simpli
2000 Market Marshall Dennehey
1735 Market Cake and Joe
Three Logan Square Five Iron Golf
1515 Market Unnamed Japanese restaurant concept
Duane Morris Plaza Duane Morris
Notes
Out of market law firms continue to plant flags in Center City given its deep history and talent pool in the legal sector. These two recently arrived law firms are both relocating (and growing) within Center City.
This food systems startup relocated from Baltimore to pursue hiring and rapid expansion.
This defense litigation firm's renewal is notable among large law firms in that it gave back just 10% of its previous footprint (the average has been closer to 40%).
This coffee and pastry spot will bring a new amenity to the building and activate the street in the process.
This entertainment concept can attract both daytime and evening customers to an increasingly mixed use corner of the office district.
Building on the success of Uptown Beer Garden, a local restaurateur will replace a former bank with a lively indoor/ outdoor dining concept.
After considering relocation, this long-established anchor in the office district will remain in its namesake building, occupying about 25% less space than it did pre-pandemic.
As its staff grows, this large organization is converting 21,000 square feet of storage space into additional offices as part of its renewal of 117,000 s.f. at 1441 Sansom.

Workplace quality and employer culture are factors in returning to the office, but it is clear that encouraging in-person work is as much about factors external to the actual work environment. On a basic level, workers want more and better reasons to be in the office in the first place, and fewer reasons to avoid it. As applied to Center City, this means maximizing what is unique, exciting, and fun about downtown, such as what we observed during Center City District Sips, while simultaneously ameliorating the negative aspects of commuting.
Placer.ai data show that nearly half of Center City workers come from within city limits, while tens of thousands more arrive from close-in and transit-accessible suburbs (see map). Improving the reliability, frequency, cleanliness, and perceived safety and comfort of public transit commutes can go a long way toward facilitating more in-person work.
On closer observation, return-to-office (RTO) tracks with proximity to one’s place of work, with Placer showing that employees living in or within two miles of Center City are back at rates of nearly 90%. This suggests that while improving commuting conditions could help drive up attendance from workers farther away, one of the best return-to-office strategies Philadelphia can focus on is continuing to attract residents to Greater Center City.
The closer the better:
Workers living within two miles return to the office at vastly higher rates than those commuting from farther away.
Here for beer: CCD’s Sips happy hour program attracted an average 11,000 additional workers into Center City during summer Wednesdays.
1 million one-seat rides: More than 1 million suburban residents can reach Center City via a single transit line.
Workers return at much higher rates the closer they live to work. This is Center City’s structural advantage.
The relationship between distance from work and RTO is linear. Non-resident workers (those who hold Center City jobs but do not live here) who live within two miles of Center City are back at rates approaching 90%. Those who live five to 10 miles away are 20% less likely to be back in office as those living two miles or less.
Source: Placer.ai
Placer.ai data allows for a comparison of major downtowns and the degree to which key populations are returning. Center City District first assessed these dynamics in Downtowns Rebound: The Data Driven Path to Recovery, published in October 2023. The same data used to produce this landmark piece of research has been updated through year-end 2024 to illustrate the current performance and progress 26 different downtowns are experiencing.
Across the 26 large downtowns analyzed, the average non-resident worker return rate is 68%. Philadelphia is among the top markets on this metric with a return rate of 74%, equivalent to Boston as of year-end 2024. This outpaces the recovery rate in Lower Manhattan (70%), but trails behind Midtown Manhattan which ranks second highest nationwide (83%).
The mixed-use nature of Center City’s jobs ecosystem, which includes many non-negotiably in-person fields including health care and hospitality, supports this relatively strong recovery of non-resident workers. In the case of Philadelphia, our large downtown population also means that we have many residents who also work downtown. This is a key ingredient for sustained economic growth.
Source:Placer.ai
Home ZIP Codes of Center City Workers With Rail Lines
Center City’s workforce comes from across the region, including dozens of ZIP codes accessible via train where anywhere from 500 to 5,000 Center City workers live.
Source: Placer.ai, SEPTA, PATCO
Number of Center City Workers
0–500
501–1,000
1,001–5,000
5,001–8,500
Rail Lines
8,501–11,103 Patco
SEPTA Metro
SEPTA Regional Rail
More than 1 million suburban residents are connected to Center City via a “one-seat ride,” meaning that they live in close proximity to a rail line that provides direct access to the urban core. This is why restoring and expanding frequency of rail service to 2019 levels or better is critical for encouraging trips downtown for workers as well as less frequent visitors.
SEPTA’s precarious funding position will lead to dire and drastic service cuts and eliminations of entire routes. It is hard to overstate the damage this would do to our region’s economic productivity, mobility, congestion, and quality of life. Identifying and securing a predictable funding source—one with the capacity to grow over time to enable investment and improvement of our enviably vast but aging infrastructure—is essential.
The 20th anniversary of Center City District Sips became a case study in social connection driving stronger RTO performance. Throughout the summer, CCD measured the volume of non-resident workers in Center City on Sips Wednesdays compared to other days of the week and found that Sips days saw an average spike of 11,000 non-resident workers in Center City. Within the West Market office district specifically, Sips days attracted an average 5,500 additional non-resident workers compared to other summer weekdays.
CCD is expanding its programming in partnership with major office landlords to improve the RTO experience. Center City Sunrise celebrates Center City workers with coffee giveaways and entertainment on their way into the office. Seven downtown office buildings are hosting an installment in 2025. New for this year, the Workspace Marketplace program is popping up in select office buildings throughout 2025, bringing vendors and artisans directly to office workers for four hours during the workday. Three have taken place thus far in 2025, with more on the way.

Return to office rates - Center City District
BOMA Philadelphia completed a State of the Workplace Survey in March 2025. A total of 98 local companies responded, including 40 based in Philadelphia and many more with office locations in both the city and suburbs. Respondents are well distributed across industries, firm sizes, and occupied square footage.
The survey found that 72% of respondents currently have a hybrid work policy, with three days in-office being the most common arrangement. The most commonly cited reasons for maintaining these policies are concerns around talent attraction and retention. Nearly 38% of respondents asserted that workers are less efficient when not in-office; despite that, most firms indicated they have no plans to revisit their policies.
When asked about the future of remote work, 59% of respondents said that employers will require employees to be in-office more days but probably not all five, while only 13% predicted that most employers will return to fully in-office arrangements.
Center City District surveyed Central Philadelphia Development Corporation (CPDC) member employers about their return-to-office policies. While the majority also maintain three-day in-office policies, several employers noted that they see at least some workers opting to return four to five days a week. 23% of CPDC member companies indicated that they are back in-office Monday through Friday.
Return to Office Rates, Center City District Boundaries
Within Center City District boundaries, average RTO hit 73% in 2024, up from 69% in 2023, with every month of the year except November seeing more people back at work.
Source: Placer.ai
There is no disputing that hybrid work arrangements are here to stay, but year-over-year increases in Center City RTO rates support the emerging theory that dynamic mixed-use employment centers with nearby housing options, an inviting public realm, and lots of touch points for programming and engagement can overperform when it comes to enticing employees back to the office.
This is the secret sauce of places like Center City. Property owners have a role to play in encouraging this dynamic by investing in the quality of their buildings and their events and amenities. The retail and restaurant mix plays another important role by building up an entertainment ecosystem that makes the prospect of a day in the office more fun. Center City District also plays a role in this as a business improvement district thinking holistically about the quality of the public realm and programming in parks and plazas.
While RTO remains more sluggish within the office district, the year-over-year jump was much higher. Office district workers were back at an average rate of 63% in 2024, compared to 52% in 2023.
Source: Placer.ai

Many U.S. cities first grappled seriously with the idea of office-to-residential conversions in the wake of the pandemic. The sudden and unanticipated hollowing out of select office buildings and districts created urgency in places that hadn’t previously felt it. Building conversions ramped up in Philadelphia with the introduction of the citywide 10-year tax abatement in 1997, giving us a nearly quarter-century head start.
Philadelphia’s leadership in this area is a function of a historically slowmoving office market (a weakness) and a rich fabric of pre-war high-rises that lay out beautifully as apartments and hotel rooms (a strength). Aided by permissive zoning designations covering much of Center City, dozens of conversions have removed 10 million square feet of outdated space from the office inventory.
10M s.f. converted: Philadelphia is a national leader in repurposing older office buildings.
1,000 units underway: Current conversion projects will bring 1,000 new homes to Center City as well as hotel rooms and retail.
New tools for the next generation: New mechanisms may be needed to properly facilitate the conversion of more challenging office buildings.
Philadelphia’s decades of leadership in the reinvention of office buildings gives us a leg up. Current conversion projects will add 1,000 more apartment units to Center City. Creative approaches will be needed to extend the momentum.
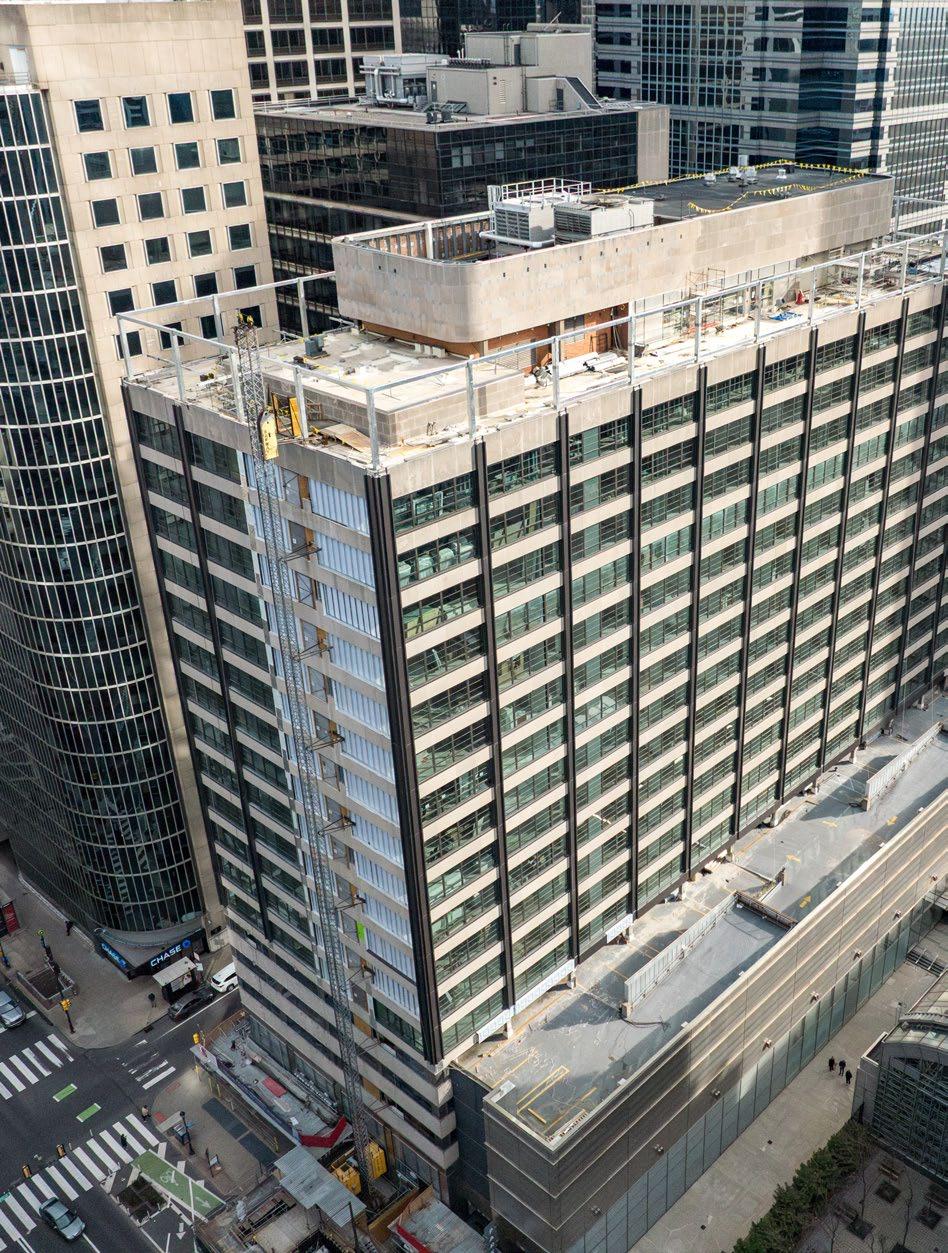
New towers built both for single tenants such as Comcast, Morgan Lewis, and Chubb, as well as multi-tenant projects such as FMC Tower, Cira Centre, 2400 Market Street, and 1100 Ludlow have brought higher quality office space to the market. The latter two properties noted are rare examples of buildings converting into office space from other uses. Strikingly, these newer office properties have offset conversions such that the total supply of office space in and near Center City has remained essentially unchanged for decades. Many other comparable cities found enough tenant demand to substantially grow the supply of new office space, whereas Philadelphia’s comparatively weak demand base has discouraged speculative development of office buildings.
To ensure Center City’s ongoing growth and dynamism, policy makers and property owners will need to get creative: more must be done to grow private-sector, office-occupying employment to grow demand for existing and as-yet-unbuilt office buildings. We must also ensure that our long track record of successful conversions can continue despite likely candidates that are not readily conducive to such a transformation.


The eastern end of the Public Ledger Building underwent conversion to housing several years ago. Work is progressing on conversion of the building’s Chestnut Street side into additional apartments.
The Bellevue Lubert-Adler is overseeing the redevelopment of this landmark building. The existing hotel has undergone extensive renovations, and several floors of former office space are now leasing as apartments. The building’s multiple floors of retail space are also part of the property’s reinvention.
Half of Three Parkway’s floors vacated by Drexel University are now being leased as apartments. Office tenants remain on the building’s upper floors. The building contains 193 apartments.
116 units are underway in this former headquarters for the Jewish Federation on Arch Street in the Logan Square neighborhood at the edge of the office district.
The former headquarters of Morgan Lewis now contains 299 apartments. It is the only full conversion of an office building in the heart of the West Market office district. The building features retail frontages on both Market Street and JFK Blvd.
The Bourse, the only conversion without apartments, will become a hotel while retaining offices and adding streetlevel retail. Sold alongside it, 400 Market will add 176 apartments, bringing new life just east of Independence Mall.

In 2024, 20 major projects were completed from Girard Avenue to Tasker Street, river to river. Approximately three dozen major projects are currently under construction, representing over $1.2 billion in new investment. Residential projects have dominated the landscape in recent years, with more than 3,800 apartments delivered in Greater Center City last year.
The preponderance of housing development is greatly important for maintaining Philadelphia’s ability to attract and retain residents and for helping to stave off spikes in pricing. Center City’s decades-long population boom has been enabled, and likely accelerated, by the growing assortment of housing options across neighborhoods and price points. The flip side is that commercial development has been relatively sparse given the slow pace of job growth and the fact that most major occupiers of office space are contracting their footprints. Chubb’s forthcoming Center City headquarters is a welcome exception to this trend, and an example of how the flight to quality manifests in a city with very little contemporary office space.
44% of all housing: In 2024, 3,800 out of 8,000 units completed citywide were built in Greater Center City. Slowing down in 2025–26: Tax abatement and interest rate changes created a wave of projects that are now tapering off, giving the market time to absorb new supply.
30,000 new homes by 2028:
Center City has a role to play in the Parker administration’s ambitious goal for creation, preservation, and renovation of homes citywide.
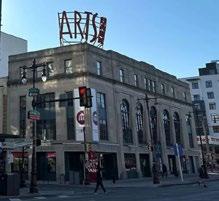
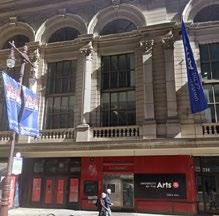
Along Market East, numerous parking lots, underdeveloped parcels, and vacant buildings create current challenges but offer chances for renewal and revitalization. South Broad Street is also dotted with large development sites, but more imminently will see significant transformation as half a dozen former UArts properties prepare to welcome new activity.


Parking lot or potential development site
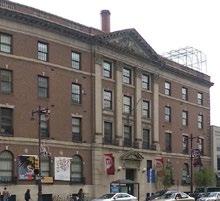
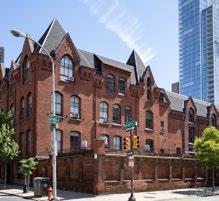
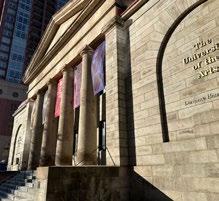
The sudden closure of the University of the Arts stunned the city in 2024. A disposition process for the institution’s real estate holdings has brought some clarity in 2025. Temple University and the Curtis Institute of Music will breathe new life into Terra Hall and the Art Alliance respectively, while Scout Ltd., the developers of South Philadelphia’s Bok Building, will pursue a similarly mixed-use and artist-focused ecosystem within Hamilton Hall and Furness Hall, including housing. The balance of the buildings have been sold to developers who have yet to divulge specifics of their plans.
Significant buildings stretching from South Street up to Walnut Street are poised for new life.


1. 2000 Arch St.
2. 2300 Market St.
3. Jefferson's Honickman Center
4. Schuylkill Avenue Research Building
5. Caroline Kimmel


Public Space
11. Penn's Landing
12. Thomas Paine Plaza
Retail
13. Shops at the Italian Market
Residential
14. 1309 Cambridge St.
15. The Noble
16. 210S12
17. 222 North 11th St.
18. 836 North Broad St.
6. The Jaan at Center City
7. The Jaan at Old City
Cultural/Entertainment
8 Calder Gardens
9. Philadelphia Ballet Center for Dance
10. Family Court Building (Redevelopment)
19. 918 North Broad St.
20. Avenue Flats
21. Broad & Noble
22. Eight Two Eight
23. Eight13 on Broad
24. Eight7Teen
25. Five on Canal
26. Innovator Village
27. Phillip St. Townhomes
28. The Alcott
29. The Darien


30. The Hannah
31. The Jessup House
32. The Josephine
33. 1000 Spring Garden St.
34. 1201-1215 Callowhill St.
35. 1614 Ridge Avenue
36. 1701 Market St.
37. 619 North Broad St.
38. 650 Fairmount
39. 814 North 2nd St.
40. 900 Spring Garden St.
41. Annex 1201
42. Beach St. Landing
43. Bloc24
44. Cameron Square
45. Chocolate Factory
46. Freeman’s Auction House
47. One Thousand and One Residences
48. Rivermark Northern Liberties
49. The Astir Callowhill
50. The Keystone
51. The Lyle on North Broad
52. The McDermott
53. 19th and Chestnut
54. 412 North 2nd
55. 502 Wood St.
56. 915-923 North Broad St.
57. Arbour House
58. Harper Square
59. Piazza Alta (Phase 2)
60. 901 North Front St.
61. 2100 Arch St.
62. 400 Market St.
Mixed Use
63. 2301 John F. Kennedy Blvd.
64. The Bellevue
65. The Bourse
66. Three Parkway
Center City District is prepared to support the City and property owners in tackling near-term challenges while advancing a viable plan for Market East’s very bright future as a mixed-use street.
The cancellation of plans for an NBA arena in Center City brought another significant disruption to Philadelphia’s real estate landscape, hot on the heels of announced closures of the street’s only supermarket in the former Strawbridge & Clothier building and the shuttering of the downtown’s last department store in the Wanamaker Building. East Market Street’s future is now a priority on multiple levels, with a push to implement modest improvements in time for the influx of tourists in 2026, and a longer-term planning process coalescing under the City’s leadership.
The middle time horizon presents the biggest questions and the most opportunity. What must occur within the next five years—before or in tandem with the completion of a broader planning effort—to transform the corridor into what it should and could be: one of the great pedestrian experiences in urban America.
Population
Retail
Restaurants & Nighttime Economy
Arts & Institutions
Visitors & Tourism


Greater Center City (Girard Avenue to Tasker Street, river to river) remains the city’s fastest-growing area, with housing development keeping pace with its population explosion. As the population grows, demographics change as well; new residents are raising Center City’s educational attainment and median household income each year.
Growing the working population that lives near downtown helps to bolster Center City’s retail and office sectors by increasing on-street foot traffic and growing the labor force who have a higher propensity to return to the office the closer they live to work. Center City is extraordinarily well positioned to continue this positive growth with more high demand housing welcoming new residents over the next several years.
More housing, more people: Since 1990, Greater Center City has built over 50,000 housing units, allowing the population to grow by over 70,000 residents.
Relative affordability continues to benefit the city: Center City’s population continues to grow thanks to its relatively low cost of living.
Growth remains in the forecast: Over 5,000 housing units are projected for delivery over the next five years.
In just 30 years, core Center City nearly doubled the number of residents and housing units and established itself as a high-demand place to live.
Population
Housing Units
The report of downtowns’ demise has been greatly exaggerated: Downtowns across the U.S. have experienced a significant residential rebound in recent years. Nearly every city, regardless of location, size, or climate, had higher residential pedestrian volumes in 2024 compared to 2019. This surge is largely driven by the increased residential construction in downtown areas, particularly compared to suburban areas.
Resident Pedestrian Recovery Rate in Downtown Areas: 2024 Q4 as a Percentage of 2019 Q4
Many major U.S. cities, including Philadelphia, have seen residential pedestrian volumes far exceed 2019 levels in 2024.
Source: Placer.ai
Center City & Philadelphia Demographics, 2024 Center City’s population continues to grow, and inflows of new residents are helping to shift the demographic snapshot.
Source: U.S. Census Bureau, ACS Community Survey
Center City residents have always had higher education levels than Philadelphia as a whole. From 2011 to 2023, the share of Center City residents with at least a bachelor’s degree increased from 73% to 80%.
From 2011 to 2023, Center City’s average median household income continued to rise, climbing 61% from $64,100 to $103,236.
Both Greater Center City and Philadelphia County as a whole experienced a period of population decline during the pandemic starting in 2021. While Philadelphia County experienced a decline in population between 2021 and 2023, Greater Center City saw a brief decline during the pandemic but has otherwise experienced strong population growth since.
Net Migration as Percentage of Population, 2019-2024
These residents who are moving in and around Greater Center City are staying in Center City to work and play as well. Those living within two miles of Center City are downtown at a rate of 105% of exceeding (105%) 2019 levels. Sustained housing and population growth near downtown helps recover the economic impact faced by the slower return of suburban visitors to Center City.
Net Migration as Percentage of Population, 2019-2024
Post-pandemic, Philadelphia lost population every year until 2024. Greater Center City was the exception to the rule starting in 2021 and continuing through 2024.
Source: Placer.ai
Greater Center City Philadelphia County
Many outer ZIP codes of Philadelphia and its suburbs lost population from 2000-2020, but all core and extended Center City ZIP codes saw substantial growth. While the city overall has grown by just over 4% between 2000 and 2020, the number of residents has surged across all Greater Center City ZIP codes, with some fully doubling their previous populations.
Change by ZIP
The average rental rate for a one-bedroom apartment in the Rittenhouse Square area (19103 ZIP code) was $1,875. This is 6.25% lower than the national average, 34% lower than King of Prussia, and 74% lower than the Manhattan’s Upper East Side, according to Zillow.
…kept affordable by new supply.
Core Center City added nearly 4,000 housing units since 2019, and Greater Center City added over 14,500 in the same time period.
Average Multifamily Rental Rates, December 2024 Philadelphia’s average rental rates are far below comparable large metro areas, and nearly half Boston and New York.
Source: Zillow
$1,703 Philadelphia $2,058 Chicago $2,497 Washington $3,412 New York $3,544 Boston


Twice a year, Center City District surveys the number of occupied and vacant storefronts across downtown, from Vine Street to South Street. After a steep recovery through 2022, retail occupancy rates have largely held steady in the years since. As of March 2025, retail storefront occupancy stood at 83% across all of Greater Center City.
The retail landscape has shifted over the past several years as retailers have begun to shift their focus more towards understanding and catering to the growing population base that is taking precedence in Greater Center City. Digitally native brands early into their brick-and-mortar foray continue to choose Center City as their expansion destination within the Philadelphia region.
Synchronous recovery: Retail occupancy and pedestrian volumes have grown steadily alongside each other.
Universal destination: Legacy retailers and digitally native brands are choosing Center City for expansion. Who’s wanted?
CCD’s surveying efforts reveal certain types of retailers are in high demand by residents.
As Center City’s retail environment continues to evolve with new stores and concepts, occupancy levels have been stabilizing in recent years.
1,141
Down 8% since 2019
Newly opened: 6
Coming soon: 5
983
Food & beverage
Down 7% since 2019
Newly opened: 35
Coming soon: 32
Down 20% since 2019
Newly
City Retail Occupancy & Pedestrian Recovery Rates
Retail occupancy and pedestrian traffic have been stabilizing over the past three years, rebounding from the pandemic lows of September 2020 and aligning closely since 2022. Recent retail surveys have seen retail occupancy rates stabilize in the low 80s, but the potential for growth in the retail landscape is beginning to come to light. An influx of new residents in Center City has helped counter the decline in visitors, as new retailers continue to choose the area with a greater emphasis on catering to the needs of the growing population base. As pedestrian recovery rates approach 90%, higher foot traffic is expected to drive retail occupancy back to pre-pandemic levels.
Center City Retail Occupancy & Pedestrian Recovery Rates, September 2019-2025
Source: Center City District,Placer.ai
The Business Journals ranked the 1,000 wealthiest ZIP codes in the United States by examining the density of high-income people to determine true geographical concentration of wealth and spending power. Their analysis revealed that the top four wealthiest ZIP codes in the region are all within Greater Center City, with 19103 ranking as the 24th wealthiest ZIP code in the United States.
Greater Philadelphia’s Wealthiest ZIP Codes & National Rank, 2024
Source: Philadelphia Business Journal
Since summer 2024, Center City District has been surveying residents, workers, and visitors to understand their shopping habits and what types of retailers are most sought after in Center City.
According to our survey:
Most Desired Retailer Types in Center City
• Center City residents want more clothing and consumer goods options such as local boutiques, luxury retail stores, department stores, and fast fashion.
• Grocery, home goods and furniture, and big box retailers are next in demand, and are frequently cited as the types of stores that Center City residents most frequently leave the city to visit.
• The top requested stores not currently in Center City are Zara, Nordstrom, Bloomingdale’s, Crate & Barrel, and Mango.
Most Desired Retailer Types in Center City
Source: Center City District

Take our Shopping Survey
Do you have thoughts about the shopping and retail experience in Center City? Tell us! Scan the QR code or visit centercityphila.org/shoppingsurvey

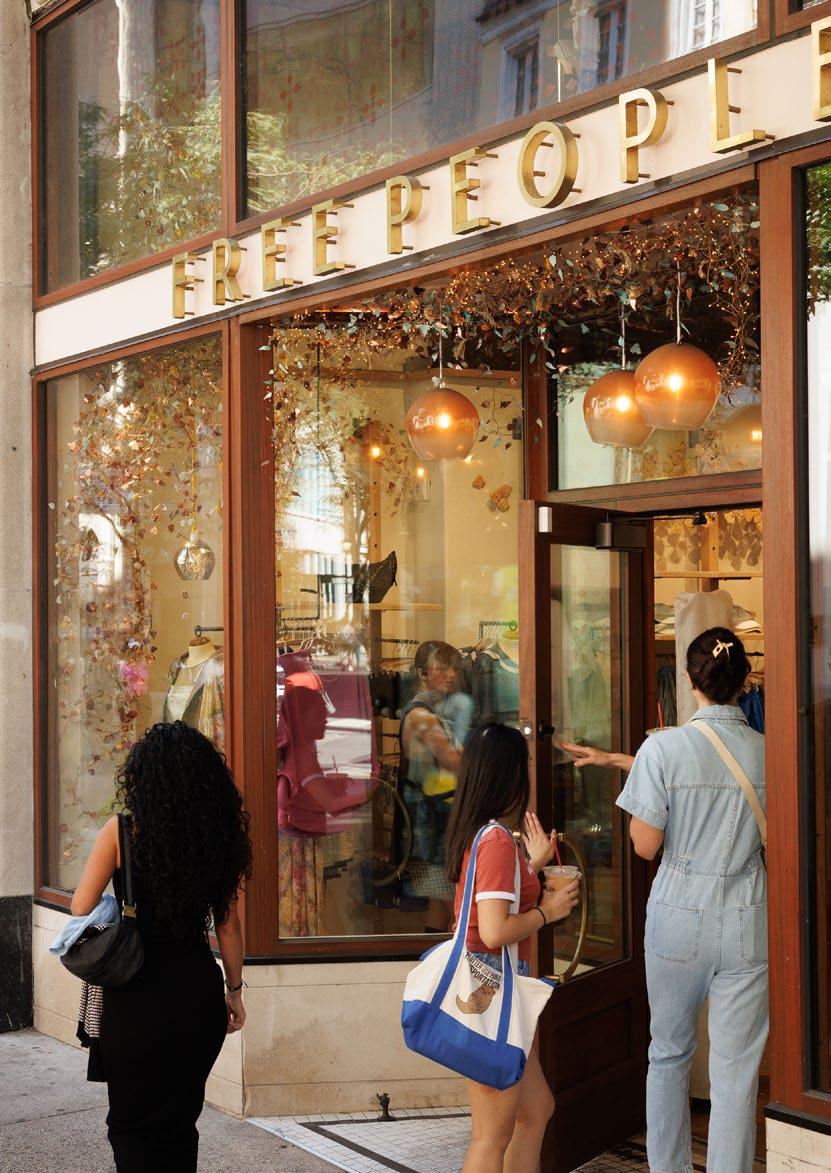
Center City is on the leading edge of retail expansion in the Philadelphia region. Digitally native modern brands such as Aritzia, Reformation, Veronica Beard, and Catbird are making their mark with new and upcoming brick-and-mortar locations. Meanwhile, well-established legacy retailers such as Abercrombie, Mitchell & Ness, and Nike’s Jordan World of Flight are either relocating to —or doubling down on—their Center City footprints, with several new stores and concepts slated to open in 2025.


Catbird 103 S 18th Street
Nike Jordan World of Flight 1617 Walnut Street
F1 Arcade 1330-36 Chestnut Street
Abercrombie & Fitch 1702 Walnut Street
Wonder Food Hall 1600 Chestnut Street
Veronica Beard 1709 Walnut Street
Mitchell & Ness 1513 Walnut Street

One thing has remained consistent over the past five years—people come to Center City to enjoy an evening out. Evening and nighttime foot traffic levels across Center City are approaching or exceeding 2019 levels, with Midtown Village notably surpassing 2019’s nighttime foot traffic levels by 25%.
Growing pedestrian volumes on both weekend and weekday evenings show strong momentum and high demand for a city experience.
This is in no small part due to the many renowned dining establishments across Center City. New and exciting restaurants continue to pop up in every neighborhood downtown, and local establishments are being recognized on the national stage. Six restaurants and chefs were nominated for prestigious James Beard Awards in 2024.
Visitors are staying later: A higher share of visitors are out during late-night hours in Center City.
National recognition continues:
Six Center City restaurants and chefs were nominated for James Beard Awards in 2024.
Where to go out tonight?
Center City has added over 50 restaurants and nightlife destinations since 2020.
Throughout 2024, evening and weekend pedestrian volumes in Center City’s dining and nightlife corridors had begun to exceed 2019 levels.
Source: Placer.ai
Analysis of pedestrian foot traffic in Center City’s two major nightlife corridors (Rittenhouse Row and Midtown Village) reveals strong recovery and growth during nighttime hours (6 p.m. – 12 a.m.).
Rittenhouse Row’s weekday nighttime volumes have nearly reached 2019 baseline levels, while weekends are 4% higher than 2019. Midtown Village’s weekday and weekend evening volumes had far surpassed 2019 levels in 2023 and continued to rise in 2024.
Average Hourly Pedestrian Volumes, Core Center City, 2019 & 2024
Both Rittenhouse Row’s and Midtown Village’s evening pedestrian volumes have grown identically year-over-year. Weekday evening levels are up 6% from 2023, and weekend evening levels are up 8%. This is another prime example of the uneven recovery narrative within Center City; the nighttime economy is highly resilient and has bounced back quicker than the daytime worker crowds, in large part due to Center City’s booming residential growth.
Average Hourly Pedestrian Volumes in Core Center City, 2019 & 2024
Core Center City’s evening and nighttime pedestrian volumes have begun to exceed 2019 levels, while daytime volumes continue to recover.
Source:Placer.ai
Food & Wine Magazine included Philadelphia on its list of Top 10 U.S. Cities for Food and Drink, and for good reason. Center City is home to the highest concentration dining and nightlife destinations in the region, many of which are gaining recognition on the national stage.
Center City’s Nightlife Destinations
Center City is home to 540 nightlife destinations, which includes restaurants, bars, nightclubs, theaters, and music venues. Of these establishments, 509 (94%) are either independently or regionally operated.
Compared to 2022, Center City now has:
+30 restaurants +19 new bars & nightclubs
James Beard Award Nominees
+5 theaters & music venues
Through 2024 and early 2025, three Center City restaurants and three chefs received individual nominations for the prestigious James Beard Awards, further solidifying Center City’s longstanding reputation for a nationally recognized food scene.
2025
Nominee for Best Chef: Mid-Atlantic
Amanda Shulman of Her Place Supper Club 1740 Sansom Street
Nominee for Outstanding Chef
Greg Vernick of Vernick Fish One N. 19th Street
Nominee for Best Bar
The Lovers Bar at Friday Saturday Sunday 261 S. 21st Street
2024
Semifinalist for Outstanding Wine and Other Beverages Program a.kitchen+bar 135 S. 18th Street
Semifinalist for Emerging Chef Yun Fuentes of Bolo 2025 Sansom Street
Semifinalist for Best New Restaurant
My Loup 2005 Walnut Street

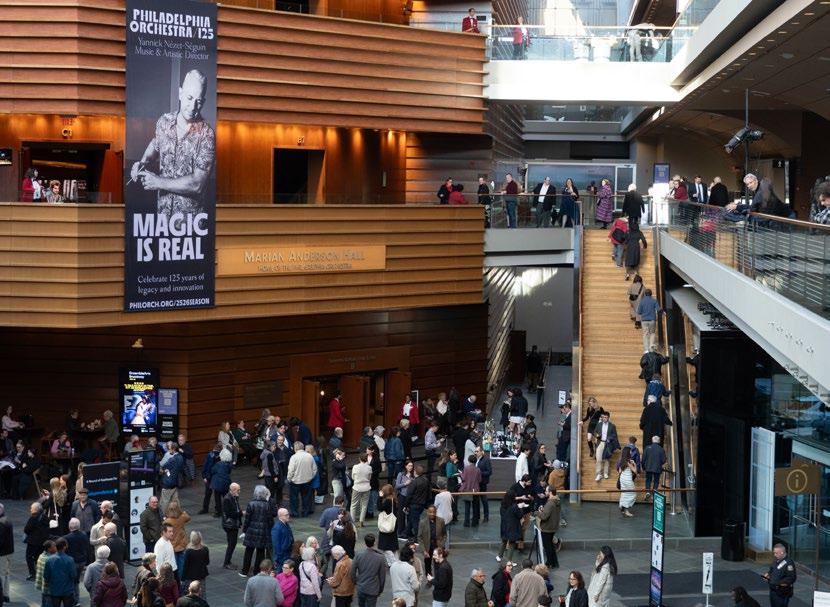
Center City’s world-class cultural landscape plays a vital role in Philadelphia’s economy and quality of life. It supports thousands of jobs, attracts visitors from around the world, and generates significant revenue for the supporting institutions and the city as a whole. Though the pandemic posed a number of existential challenges, cultural institutions have shown remarkable resilience and are thriving in 2025.
With innovative membership drives and new partnerships, the arts are more accessible to a larger audience than ever before. Beyond the traditional theaters and museums, Center City’s walkable environment offers a “museum without walls” experience, with an extensive collection of public art that is on view 24 hours a day, seven days a week, and free of charge.
New cultural destinations: Two world-class cultural buildings are slated to open in 2025.
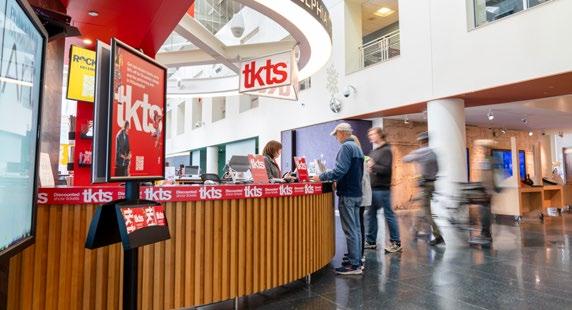
TKTS arrives: TKTS, a Theatre Development Fund initiative located in just four cities worldwide, opened its newest outpost in Center City.
Novel membership outreach: Cultural institutions are making major appeals to younger and more diverse audiences.
A number of Center City’s cultural institutions claimed attendance growth from 2023 to 2024.
Select Cultural Institution Attendance Growth
Source: Source: Center City District, Placer.ai, Individual Institutions
11,513,754
Dilworth Park +34% since 2023
5,560,485
Reading Terminal Market +20% since 2023
1,431,393 Independence Visitor Center
687,903 Philadelphia Museum of Art
Attendance continues to grow year-over-year at many of Center City’s cultural institutions. Rising ticketed admissions coincide with recent trends such as an increase in residents, higher international travel, and creative marketing and programming initiatives. 22 theaters, museums, and organizations provided admissions data, with nearly three-quarters reporting that they have experienced year-over-year growth in 2024.
Source: Source: Center City District, Placer.ai, Individual Institutions

Greater Center City is looking forward to the opening of Calder Gardens and the Philadelphia Ballet Center for Dance in 2025. The Wilma Theater was the recipient of the 2024 Special Tony Award for Outstanding Regional Theatre, which included a $25,000 grant from City National Bank for future improvements to the theater.

TKTS, an initiative from the nonprofit Theatre Development Fund providing discounted arts and culture tickets, introduced their Center City hub in November 2024. Philadelphia joins locations in New York, London, and Tokyo, becoming only the fourth TKTS city in the world. Located in the Independence Visitor Center, TKTS provides ticket discounts, making performances more accessible to Philadelphians and connecting patrons to Center City’s cultural institutions. TKTS currently serves 22 theaters around the Philadelphia region, 12 of which are in Greater Center City.
Center City’s demographics are shifting: the number of residents between 25 and 50 has increased by nearly 30% in the last 15 years. Cultural institutions are making a concerted effort to capitalize on these trends by adapting their membership programs to better appeal to millennial and Gen Z (born 1981-2012) audiences, who now make up over 60% of Center City residents. Recent programs include:
• TKTS Booth
• BalletX: Young Xers
• Philadelphia Art Museum: Young Friends
• Walnut Street Theatre: $35 Under 40 Program
• Philadelphia Orchestra: Orchestra After 5
• Philadelphia Orchestra: Young Friends
• Opera Philadelphia: VIVACE Young Friends Membership
• Ensemble Arts: Community Rush Tickets
• Wilma Theater: Wilma Young Friends
• Arden Theatre Company: Young Friends Night
• Academy of Natural Sciences: Dinos After Dark
• Free Library Foundation: Raven Society
Cultural enrichment doesn’t end with arts and cultural institutions—Center City is rich with public art, creating a “museum without walls” with over 250 sculptures and other works of art across downtown. In early 2025, Philadelphia received the USA Today 10Best Readers’ Choice Award for Best City for Street Art in America.


Center City continues to attract thousands of people each day for various reasons—whether to live, work, or play. February 2025 marked a significant milestone, becoming the first month since 2019 that pedestrian traffic downtown averaged over 400,000 daily.
This sustained growth is driven by strong weekend visitation, increased international travel, and higher convention attendance, all of which positively impact the local hotel and hospitality sectors, as well as the bolstering city’s tax revenue. With the residential population on the rise and more direct international flight routes connecting Philadelphia, Center City is wellpositioned to reach even greater heights in 2025, 2026, and beyond.
Foot traffic stabilizes: Foot traffic remains largely steady in 2024 with the highest growth being Mondays and Tuesdays as workers return to the office.
New routes, new countries: Philadelphia International Airport is adding six new direct international routes across 2024-25.
Rising Reservations: Center City hotels experienced big gains in occupancy and total revenue in 2024.
On an average day in Center City in 2024, there were 377,850 pedestrians downtown.
213,175 visitors & shoppers -2.4% YoY.
63,786 residents +6.9% YoY. Average Daily Pedestrian Volume by Category, 2024
100,889 non-resident employees +4.6% YoY.
23.4% are from Greater Center City 35.4% are from the rest of Philadelphia
23.8% are from the Philadelphia suburbs 17.4% are from outside the Philadelphia market
Overall pedestrian volumes have increased across weekdays as return-to-office plans were implemented in 2024. Center City foot traffic on Mondays and Tuesdays rose by 3.8% and 2%, respectively, compared to the previous year.
Pedestrian Averages by Day of the Week, 2019, 2023, & 2024, Core Center City Monday and Tuesday pedestrian volumes saw the largest jump year-over-year as more businesses returned to regular in-person work.
Source:Placer.ai
Total Pedestrian Recovery Rate, 2024 Q4 as a % of 2019 Q4
Total Pedestrian Recovery Rate, 2024 Q4 as a % of 2019 Q4 Philadelphia also ranks 7th in the nation among downtowns in terms of total foot traffic recovery rates
Source:Placer.ai
Overall foot traffic in Center City has reached 84% of 2019 levels, though the recovery has been uneven and largely dependent on proximity to downtown. Year-over-year visitation continues to grow among those living within five miles of Center City (i.e., Philadelphia residents), driven in large part by new residents moving into recent developments. Suburban visitors (those living five to 25 miles away) are returning, but at a slower pace.
Daily Visitor Averages by Home Distance from Center City (Weekends)
Pedestrian Averages by Home Distance from Center City
Daily Visitor Averages by Home Distance from Center City (Weekdays)
Weekend Visitor Averages
Weekday Visitor Averages
In 2024, American Airlines began nonstop flights from Philadelphia International Airport (PHL) to Copenhagen, Nice, and Naples. In 2025, American Airlines is continuing its international expansion at PHL by adding direct flights to Edinburgh and Milan, and Aeroméxico will begin nonstop service to Mexico City. In August 2024, SEPTA restored full regular half-hour service between Center City and PHL.
USA Today’s 10Best Readers’ Choice Awards bestowed Philadelphia as the “Most Walkable City to Visit in the U.S.” and Lonely Planet identified Philadelphia as one of 10 cities to visit worldwide in 2024. Philadelphia welcomed 1.2 million international visitors in 2024 (up from 1.1 million in 2023), most of whom make Center City a focal point of their travels.
New direct
Top international feeder market
Top International Feeder Markets:
1. Canada
2. United Kingdom
3. India
4. Germany
5. France
New Direct
International Flights:
Edinburgh
Milan
Nice
Copenhagen
Naples
Mexico City
Existing International Flights:
Amsterdam
Aruba
Athens
Barcelona
Bermuda
Bridgetown (Barbados)
Cancun (Mexico)
Doha
Dublin
Frankfurt
Grand Cayman Island
Guanacaste (Costa Rica)
Lisbon
London
Madrid
Montego Bay (Jamacia)
Montreal
Nassau (Bahamas)
Paris
Providenciales (Turks and Caicos)
Punta Cana (Dominican Republic)
Quebec City
Rome
Saint Lucia
Saint Thomas (U.S. Virgin Islands)
Santo Domingo (Dominican Republic)
Sint Maarten
Toronto
Venice
Zurich
Center City hotels experienced a positive 2024, driven by increased international tourism and more nighttime visitors, leading to year-over-year growth in hotel occupancy, revenue per available room (RevPAR), and total revenue from 2023 to 2024. The Four Seasons and The Rittenhouse hotels each earned a five-star rating from Forbes once again, solidifying their status as national luxury leaders, while Sofitel was named one of Conde Nast’s 100 Best Hotels in the World for 2024. Center City’s hotels hosted over 3.2 million room nights in 2024, bringing in nearly $700 million in total revenue and providing a strong ripple effect to the rest of the economy. This sets the stage for Center City to become the epicenter of tourism in 2025, 2026, and beyond.
Center City Hotel Numbers Compared to 2023
Source: STR
66%
Hotel Occupancy
+5%
$215
Average Daily Rate -1% ($217)
$694M
Total Hotel Revenue +6% ($655.4M)
$143 Revenue per Available Room + 6% ($134)
The Pennsylvania Convention Center, spanning three blocks bound by Broad, Arch, 11th, and Race streets, attracts hundreds of thousands of visitors to Center City every year. In the past year, nearly 943,000 people attended 147 conventions and trade shows. Citywide events in 2024 were supported by Center City’s 73 hotels and 13,000 rooms, generating $694.4 million in total revenue, a 6% increase from 2023.
942,977

The 2025 PHS Flower Show was a success for the Pennsylvania Horticultural Society, the Pennsylvania Convention Center, Center City, and the entire Philadelphia region. The Flower Show is the Convention Center’s largest annual event, and this year brought in an estimated 235,000 attendees during its March 1-9 run. These figures reached 96% of 2019’s attendance levels and saw a 24% growth over the 2024 Flower Show’s attendance of 185,000.
Public Realm & Walkability Mobility


Over 300 years ago, William Penn and Thomas Holme built walkability into Philadelphia’s DNA when they mapped out the street grid of what is now Center City. Their planned network of spacious streets and central parks would give rise to the development of Philadelphia’s characteristic rowhomes and its mosaic of mixed-use buildings. Fortuitously, the length of our blocks, the narrow width of our streets, and the locations of our public squares have supported the development of a pedestrian-scale environment that modern-day observers of cities from Jane Jacobs to Jan Gehl would celebrate.
Despite centuries of change and advancement—including the introduction of the automobile and its seismic impact on America’s built environment Center City’s compact, safe, and visually engaging street grid remains among the most walkable urban areas on earth.
The unique composition of our downtown’s public realm is a major competitive advantage for Philadelphia as an attractive place to live, visit, or grow a business, and it cannot be taken for granted. Its desirability and economic diversity create competition for limited space across a wide range of users. Continued investment in the public realm is necessary for improving comfort, safety, mobility, and curb appeal.
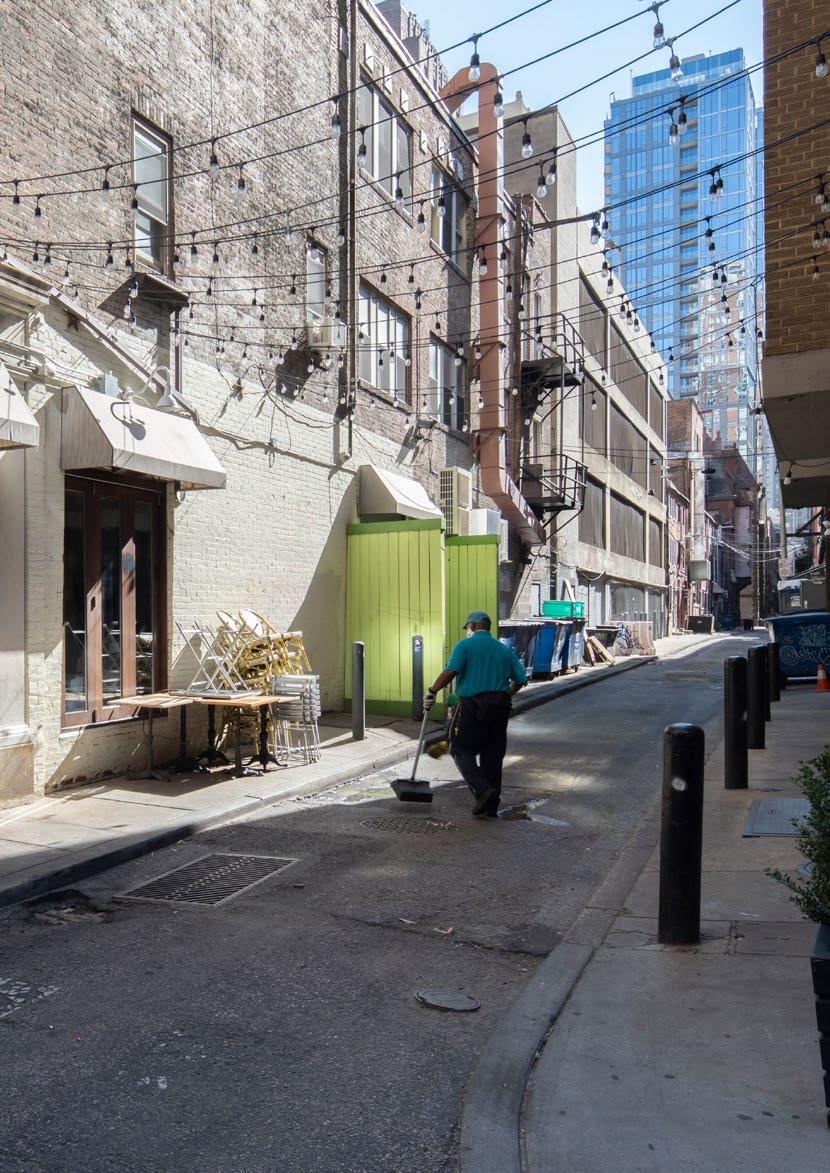
Alleys and office plazas are opportunities: Interventions in these overlooked spaces could significantly improve the pedestrian experience.
Center City is among the most walkable places in the U.S.: Trips made on foot are growing as a share of total trips in Center City.
Green space is just a 5-minute walk away: 88% of all Center City residents are within a 5-minute walk from one or more parks.
Philadelphia’s downtown has one of the highest rates of walking commute in the country—Manhattan is the only place in America where a larger share of the population walks to work.
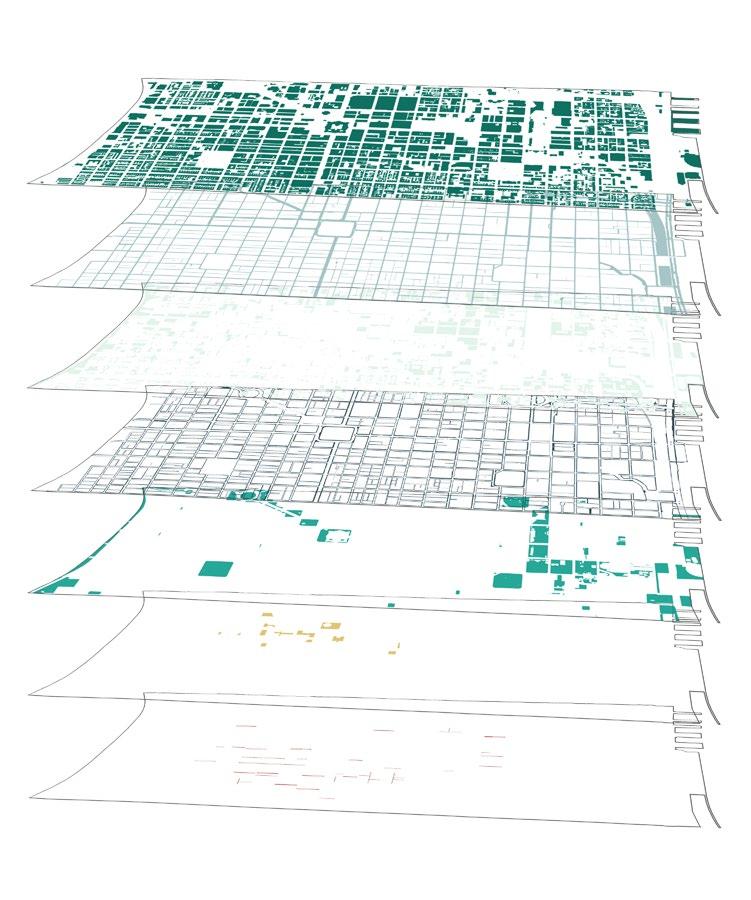
Center City’s public realm is made up of sidewalks, streets, parks, plazas, and alleys. Not including space within private property and space devoted to cars, less than a quarter of downtown’s 1,300 acres is dedicated to pedestrians despite there being as many as 400,000 people on foot in Center City on a typical day. Nearly everyone who experiences Center City—residents, workers, students, visitors—does so as a pedestrian. A mix of publicly- and privately-controlled spaces make up the public realm pedestrians navigate.
Understanding the complexity and composition of the public realm and the roles stakeholders play within it is crucial for guiding investment and identifying ways to improve our shared experience. Center City District is leading the way in public realm improvements through initiatives such as Open Streets, alleyway network analyses, and wayfinding upgrades.
42% Buildings
Buildings occupy more acreage than any other component of the built environment.
19% Streets
Roadways for cars include curb lanes, where competing functions like parking, loading, rideshare drop-offs, and restaurant seating vie for limited space.
18% Privately controlled space
A surprisingly large share of the public realm is private property that is either accessible or visible to pedestrians, including parking lots, courtyards, and shopping centers open to the public, such as the Fashion District.
13% Sidewalks
As the most used and most connective part of the public realm, with 400,000 daily users, the quality, safety, and programming of sidewalk space is crucial.
8% Parks
With little opportunity to add more park space—the Penn’s Landing cap being a notable exception—it is crucial to maximize the usage and quality of available park land.
<1% Office plazas
While these spaces occupy a tiny fraction of the public realm, they loom large as opportunities to enliven the streetscape and enhance the West Market Office District with appropriate investment.
<1% Alleys
Despite facing some quality-of-life challenges, Center City’s alleys offer opportunities to be transformed into public assets.
One of the greatest attributes of Center City’s public realm is its walkability. Center City boasts the highest rate of walking to work outside of downtown Manhattan, and 2023 data of all trips (not just commuting) show that 29% of all trips to and through Center City occur on foot. This is no surprise given that the area is home to 983 food and beverage establishments, 815 retailers, and more than 200 arts and cultural institutions, all within relative walking distance of each other.
Data on all trips to and through Center City provided by SEPTA (via their data partner Replica) reveal that walking trips have increased by 24% since 2019. This is fueled in part by the growth of the downtown residential population which finds itself in an increasingly walkable environment.
For short trips, walking is overwhelmingly the choice most Center City stakeholders make: 85% of trips under a half mile are completed on foot. And nearly 60% of trips between 0.5 miles and 1 mile are walking trips. Core Center City residents are at most a 5-minute walk from a mode of public transportation.
Geospatial Analysis of Major Destinations Underscores Center City’s Walkability
Source: Center City District
29%
of all trips to and through Center City occur on foot
88% of Center City residents are within a 5-minute walk from one or more parks
64% of residents are a 5-minute walk from a grocery store
31% are a 5-minute walk from the West Market office district
In 2025, public spaces that make up small fractions of the downtown environment are having an outsized impact on perceptions of cleanliness and safety. The network of alleys and the plazas that dot the office district provide opportunities to focus attention and resources to improve the pedestrian experience.
In 2024, an average of 377,900 visitors, non-resident workers, and residents moved through Center City Philadelphia every day. Around 87,000 people walked, experiencing downtown as a pedestrian. Compared to those who drive, pedestrians experience the city at a speed that allows mingling and wandering, where pedestrians can pause, reflect, and take in their surroundings. Window shopping is a lot easier at a speed of 3 miles per hour versus 35.
Center City’s 3,554 outdoor dining seats provide a bridge or liminal space between the public and private realms of the city where people can interact. Restaurant-goers can entertain themselves by watching people and events unfold on the sidewalks, parks, and streets, while passersby are enticed to stop for a quick bite, seeing people enjoying delicious food and connecting with friends and family.

While alleys only make up 0.3% of the public realm, they loom large in our collective consciousness as places where “back-of-house” functions are relegated, and nuisance and illegal activity can concentrate. Poor lighting, litter accumulation, and gatherings of unhoused individuals create an outsized impression of alleys as detracting from Center City’s vibrancy and pedestrian experience.
Center City District has spent the last year surveying and studying alleys, defining the network, classifying them by use and condition, and understanding which city agencies and property owners must be convened to improve them. While some alleys must maximize their functional utility, others present opportunities to become not only functional but attractive and convivial parts of our walkable grid through art, activation, and other design interventions.
Office plazas comprise a similarly small share of Center City’s land area, but they define the experience in the West Market office district as areas often devoid of activity and animation. Consistently programmed and well-maintained spaces in and near the office district, including CCD’s Dilworth Park and Collins Park as well as the Comcast Center Plaza, show that the demand for highquality space exists and that effective management and programming can yield benefits.
Not unlike alleys throughout other parts of the district, public plazas are opportunities. In some cases, thoughtful retail leasing will be enough to generate greater foot traffic and critical mass, and several West Market landlords are moving forward with food and entertainment concepts that will generate street life in this increasingly mixed-use area. Some plazas may present a need for more intensive design and programming interventions, for which CCD has long advocated. As demonstrated by programs like the weekly CCD Sips happy hour promotion, plazas can be a part of return-to-office strategies while becoming more dynamic components of the everyday pedestrian experience.
To celebrate our walkable downtown and to promote local businesses, CCD debuted its Open Streets program on West Walnut Street in 2024. On six Sundays in September and December, CCD closed seven blocks of Walnut Street and 18th Street to vehicles for several hours from midmorning to early evening. Retailers hosted pop-up events and CCD brought in live music and entertainment to bring people outdoors and improve the pedestrian experience.
As a result, West Walnut saw 30% more visitors compared to the average Sunday in September 2023. Additionally, 79% of retailers along the Open Streets route reported 90% higher sales, and 90% higher foot traffic compared to the average Sunday. Walkable and pedestrian-friendly streets promote the economy by promoting sales and supporting local businesses.
In light of the program’s warm reception from the public, CCD has scaled the program up in 2025 and will continue to assess Open Streets’ positive impact on retail and dining revenue, crime, and overall impressions of downtown.
Urban walkability is not only about the physical ability to move from one space to another but also about ease of navigation. The first of its kind, Center City Philadelphia’s wayfinding system includes 444 pedestrian signs, maps, and transit identifiers. Installed in 1997, Center City District’s signage network improves the pedestrian navigation experience by guiding visitors and residents alike to Philadelphia’s institutions, attractions, and transit.
In 2024, CCD refreshed, repaired and repositioned signs and transit lighting, including painting all 345 CCD-owned sign poles. As CCD continues to improve signage, modernization and accessibility are key goals including updates to bridge the gap between physical and digital navigation.
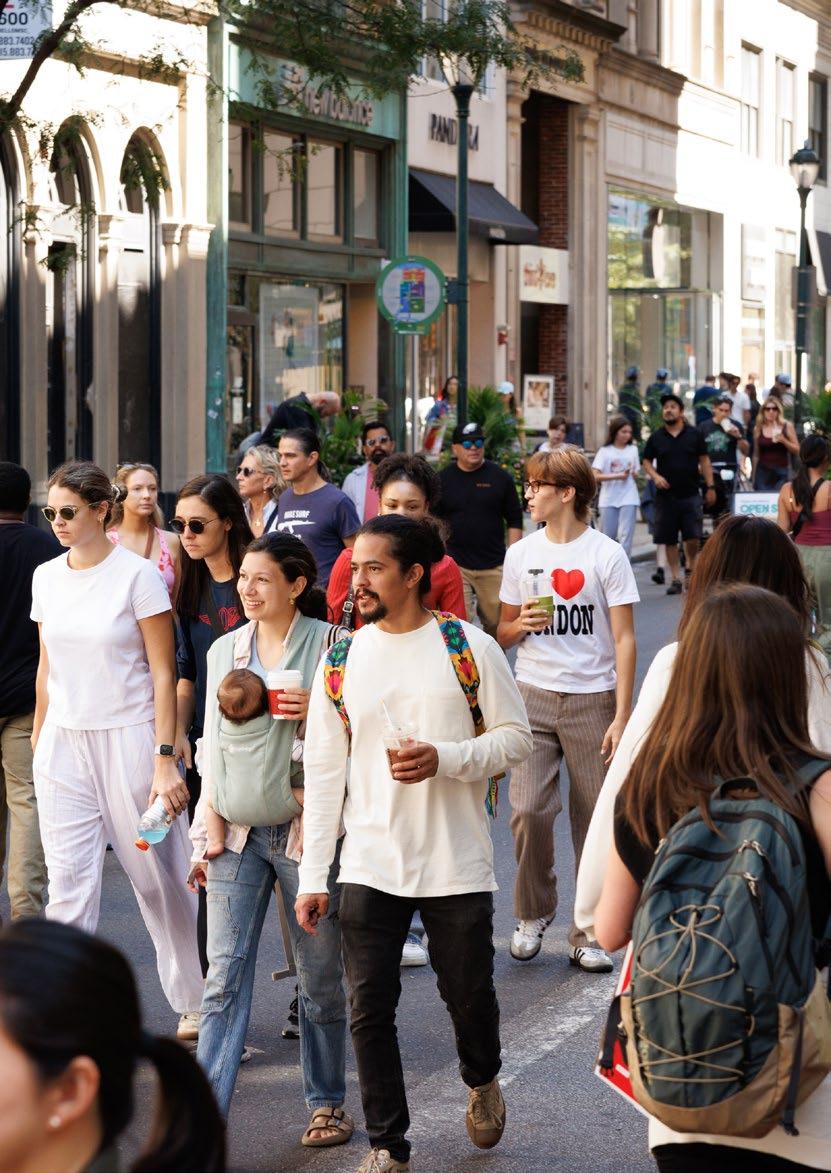

Center City’s walkability benefits not only from its public realm but from its multimodal infrastructure that enables hundreds of thousands of people to move to and through downtown every day. With more than 1 million suburban residents living within a one-seat ride of downtown Philadelphia, transit is a critical component of Center City’s success. Put simply: without transit, there is no downtown. As a result, SEPTA’s long-term funding remains an utmost priority if Center City is to remain the economic and cultural engine of our region.
Trip data from 2019 and 2023 show that the total number of trips to and through core Center City has grown 7% despite a drop-off in commuters (a good reminder that less than 20% of all trips people take involve getting to work). With the average volume of daily visits to Center City on the rise, ensuring that people can experience and traverse downtown safely by all modes of transportation is critical for enabling ongoing growth.
In 2024, SEPTA ridership grew 14%: Metro ridership (subway & trolley) grew 23%.
In 2024, there were 1.3 million Indego rides: Bikeshare ridership climbed 11% in 2024. People move through Center City differently: Mobility choices have changed dramatically in 5 years.
Public transit has recovered more quickly than many people realize. Since the low point of post-pandemic ridership in 2021, SEPTA has seen ridership grow from an average 343,000 daily riders to 586,000.
SEPTA Ridership Growth Since 2021
Despite remote work policies and quality of life concerns post-pandemic, public transit continues to recover in Philadelphia and across the U.S. This pattern of recovery serves as a reminder of how essential a robust transit network is to regions like Philadelphia.
Source: SEPTA


Percentage of Non-Auto Commute
Looking at the entire United States, 90% of Americans commute to work by car, while only 8% walk, bike, or take public transit. In contrast, just 22% of core Center City workers commute to work by car or rideshare whereas 49% commute via walking, biking, or transit. The remaining 29% work from home and don’t commute.
Among the largest U.S. cities, Philadelphia ranks fifth in the number of workers who commute without a car. Citywide, 16.7% of residents commute using public transportation, 9.4% walk to work, and 1.8% bike.
Source: Non-Auto Commute Share by City
Philadelphia has public transit commute rate of 16 7%, walking commute rate of 9 4%, and biking commute rate of 1 8%
There has been an increase to commuting by private car since the pandemic. Due to space limitations downtown, additional cars create more congestion and competition for limited parking spots.
Many factors determine the degree to which commuters can comfortably and reliably opt out of driving, including the density and location of jobs and the quality of infrastructure. Boston’s improvements on both counts—the attraction of jobs in urban districts and improvements in bicycle infrastructure—contribute to its second-place status.
If Philadelphia achieved a 41% non-car commute rate to match Boston’s, this would eliminate approximately 100,000 cars from the road on a typical day, reducing traffic congestion and creating healthier, more sustainable communities.
While commute trips are a common source of frustration and water cooler conversation, most of the trips that generate traffic on Center City streets are not commutes. Data from Replica, which models all trips based on mode of transportation, shows that when it comes to all types of trips ending in core Center City, travel behavior has changed dramatically.
Compared to a typical weekday in 2019, the typical 2023 weekday trip data show:
• Trips made on bicycles are up 67%
• Walking and driving trips grew 24%
• Rideshare trips (Uber/Lyft) have doubled, with approximately 16,000 on an average weekday
• Transit trips into core Center City have dropped as all other modes have risen
The way people get around has changed dramatically since 2019, with increased levels of biking, rideshare, walking, and driving.
Source: SEPTA, Replica
2019 2023
The increasing number of trips into and through Center City is up 9.5% since 2019, a testament to downtown's growing residential population and real estate development. However, overreliance on private car trips will add to congestion, pollution, and ultimately degrade the public environment and quality of life as competition grows for limited space on Center City's narrow street grid.
As Greater Center City’s population continues to rise, investment in multimodal transportation infrastructure is necessary to ensure economic vitality and the efficient movement of people through the city.
When moving to or within the city, the mode people choose to get around is correlated with the distance traveled. For short trips, walking is overwhelmingly the choice most Center City stakeholders make: 85% of trips under a half mile are completed on foot, while nearly 60% of trips between a halfmile and one mile are walking trips. The sweet spot for biking is between one and three miles, and for public transit, it maxes out between three and five miles.
Count of trips by distance and mode of travel
Given that core Center City is only two miles across, walking, biking, and public transportation are the most convenient options for getting around downtown. To reduce congestion and pollution, and to improve the efficiency of biking and buses, substituting more car trips for journeys within two miles of Center City is essential. Additionally, infrastructure can help convert trips within downtown from private vehicles to person-powered travel.
Mode of Travel by Distance, 2023
In Center City, 85% of trips under a half mile are completed on foot and nearly 60% of all trips between 0.5 and 1 mile are walking trips.
Source: SEPTA, Replica
Walking Car Public Transit Biking
Average Weekday Transit Ridership
Source: SEPTA

Center City is the key intersection of all regional public transportation. On an average weekday, 97,523 people board trains or trolleys at Center City stations. The busiest stations in Center City are City Hall, 15th Street, and Suburban Station, transporting a weekday average of 17,288, 12,161, and 11,940 passengers, respectively.
Traveling from New Jersey, PATCO transports an average of 18,895 passengers on weekdays. The newly completed Franklin Square Station on the PATCO line will further encourage ridership within Center City, as riders can now travel from Franklin Square to the Rittenhouse Square area on PATCO.
The Delaware River Port Authority (DRPA) is targeting the end of 2025 for expanded payment options on PATCO, including contactless card, phone, and watch payments already available on SEPTA. This will allow riders to use both systems interchangeably, just as riders do in other multi-system cities.
SEPTA ridership has been steadily rising since the pandemic, with Metro ridership—the L, B, and T lines—increasing three times as much as bus ridership year-over-year (23% and 8% respectively). After several years where bus ridership grew the fastest, 2024’s numbers suggest that public confidence and comfort in taking subway and trolley lines has grown, partly a reflection of increased attention to quality-of-life and cleanliness issues. As a result of increased safety initiatives, SEPTA saw a 33% drop in violent crime from 2023 to 2024, the largest one-year decrease in 43 years.
Future initiatives such as the purchase of new rail cars and an updated wayfinding system currently being rolled out will further improve legibility, reliability, and comfort in the system. These critical improvements are all jeopardized by the lingering lack of a stable funding solution at the state level, and by rapidly shifting federal priorities. Already in 2025, previously awarded grants related to pedestrian and bicycle improvements have been paused or canceled. The proposed Department of Transportation funding formula currently hinges on marriage and birth rates rather than population, income, congestion, pollution, or any other mobility or economic metrics, which does not bode well for federal transportation dollars in major cities.
(pending budget stabilization and a long-term funding solution)
New L cars and new light rail vehicles for the T, G, and D lines
In February 2024, SEPTA secured $317 million to acquire new L cars, with delivery expected between 2029 and 2031. The Trolley Modernization program is set to debut new light rail vehicles on city and suburban trolley routes starting as early as 2027.
Increased security presence
SEPTA prioritized hiring new police officers, adding 45 to its force, bringing the total to 227, and has also launched a virtual patrol unit to enhance its surveillance system, utilizing over 30,000 cameras.
Investment in cleaning and safety
SEPTA demonstrated its commitment to safety and cleanliness by appointing two new executive positions in August 2024 to oversee and further improve its sanitation and security operations.
Addressing the budget deficit
Governor Josh Shapiro announced stop-gap funding of $153 million on November 22, 2024, covering SEPTA’s operating budget gap for Fiscal Year 2025 and delaying a proposed 21.5% fare increase.
As of the date of publication, SEPTA faces a $213 million budget deficit starting July 1, 2025, with no resolution in Harrisburg with regards to permanent and predictable funding. The state legislature must act before this date to prevent catastrophic cuts to service that would send SEPTA into a tailspin and existentially threaten Center City’s livability and economic health.
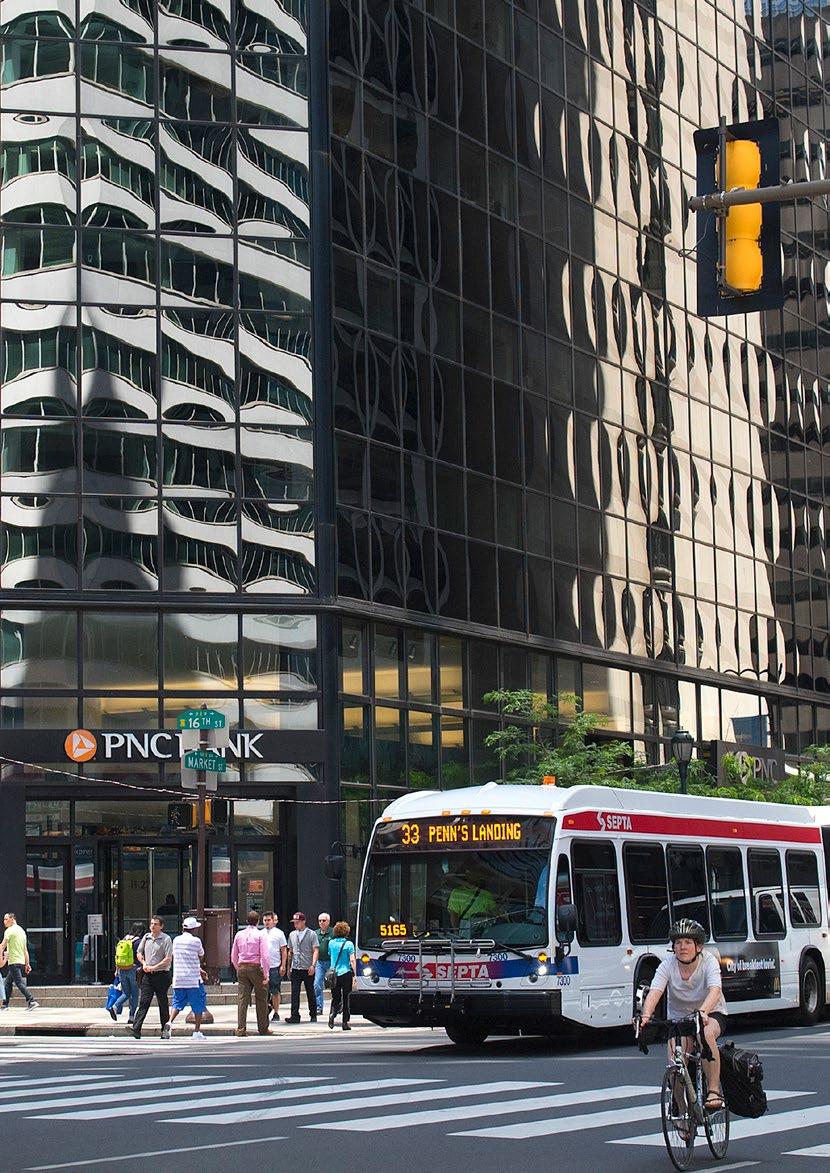
Center City’s bike network continues to expand and evolve as Philadelphia continues the challenging project of building out a cohesive, legible, and functional network on a historic street grid where space is at a premium. Recent, ongoing, and proposed improvements include:
• A two-way protected bike lane on Market Street from 20th to 23rd
• A road diet on Market Street from 2nd to 6th including grade-separated bike lanes
• Investing in bike lanes the Pine and Spruce streets to create more protection
• Red-painted lanes on Walnut and Chestnut (for use exclusively by buses and cyclists)
• A pilot of rubberized bike lane separators undertaken in partnership between CCD and the City along the 13th Street bike lane
• City Councilmember Jeffery Young passed three bike lane bills early in 2025 filling in gaps on 13th, 22nd, and 23rd, and has introduced legislation to create a lane that encircles City Hall, helping cyclists navigate safely through the core of downtown
The increase in biking over the past five years correlates with investment in bike lane infrastructure and the expansion of Philadelphia’s local bikeshare service, Indego, which celebrated its 10th anniversary this year.
The number of annual Indego bike trips has increased by 11% in the last year and by 71% since 2019. Out of nearly 1.3 million Indego bike trips taken in 2024, 72% began or ended in core Center City. That’s 936,000 trips into and out of the densest part of the city that might otherwise have happened in a car or on transit. The top ten Indego stations in 2024 were all located in or around core Center City. Collectively, these ten stations facilitated over 303,000 trips.
As a result of an expanded electric bike inventory, over half of all Indego trips in 2024 were taken using electric bikes. Increasing the electric bike supply has expanded the set of people who can use Indego and made it a more realistic year-round option. To continue the growth of biking in Philadelphia, it is essential to continue investment in protected bike lanes throughout Center City.
In 2024, the most used Indego stations were located within or adjacent to core Center City.
Source: Indego
Bike Lanes and Indego Stations in Center City
Center City’s growing bike network includes over 51 Indego stations and 15 bike lanes.
Source: City of Philadelphia Department of Streets, Indego Bike Share


2024 Bike Network & Indego Bike Stations
Indego Bike Station
Advisory/Shared
Painted
Separated Bike
Facilities


Multimodal mobility is enabled by our walkable and transit-accessible Center City. The arguments in favor of investing in a public realm that supports and expands transportation choices are often focused on congestion and quality of life, but a greater sense of urgency should be devoted to the climate crisis.
Transportation is the largest contributor to greenhouse gas emissions in the U.S., accounting for 28% of our national output. While global cooperation and coordination are necessary to move the needle at the scale required to stave off the worst impacts of rising temperatures, sea levels, and increasingly destructive weather events, cities are vitally important in this fight.
Cities are inherently greener than suburbs and small towns because of how they reduce reliance on car travel and cluster development and density that allows sharing and maximizing infrastructure and resources. Today, governmental bodies at the city level are most able to set climate responses in motion.
When cities go on the offensive, they can make remarkable impacts: Paris has cut nitrogen dioxide emissions in its metropolitan region by 40% in less than two decades through massive investments in the public realm, including expansion of its tree canopy, bicycle infrastructure, rail transit, and pedestrianization.
Cities reduce car emissions:
Per capita, Philadelphia has the lowest vehicle miles traveled in the region.
Our untapped potential: Philadelphia could eliminate 748 million miles of driving a year if our commuting patterns matched Boston’s.
Living closer, living smaller, driving less: Reducing car use and encouraging alternatives to driving is paramount for more sustainable cities.
Philadelphians drive significantly less than people in neighboring counties, because nearly all trips—including commutes, errands, and recreation—can be completed without cars.
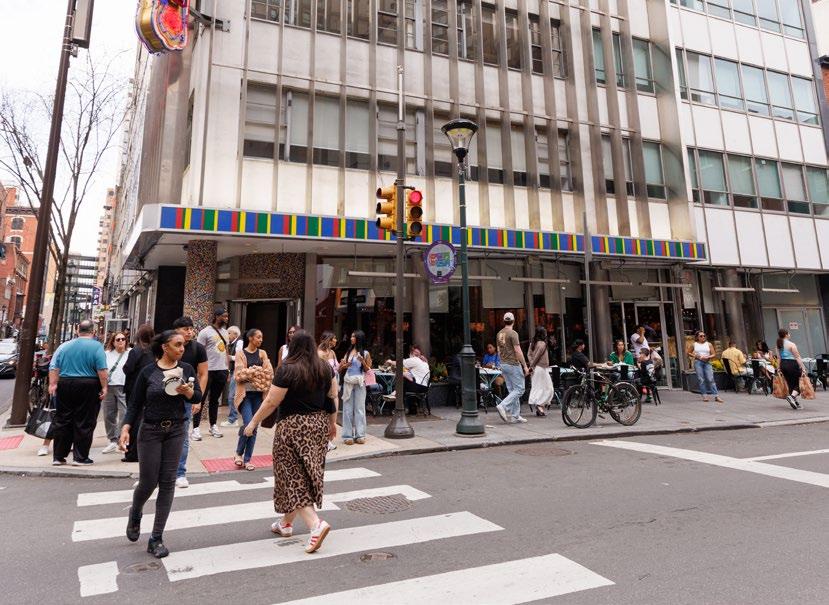
Despite the best efforts of Paul Cret and Jacques Greber, Philadelphia is not Paris. But the more we reinforce the centrality of downtown, the greater the opportunity to reduce emissions and mitigate the impacts that our 6-million-person region has on worsening pollution and rising temperatures. By encouraging non-automotive mobility and making it easier for mote people to live life without sitting in traffic, we can lower vehicle miles traveled (VMT) substantially, thus contributing to a more sustainable, climate-conscious city.
Cities are highly efficient ecologically due to their high density, optimized resource use, and reduced car dependence. As a city built around people and before the invention of the car, Philadelphia is among a minority of large U.S. cities that are naturally designed to enable low-carbon living. Looking at data from the Delaware Valley Regional Planning Commission, Philadelphia boasts the lowest per capita vehicle miles driven out of the eight surrounding counties, highlighting its low reliance on personal vehicles.
According to the Environmental Protection Agency, the average passenger vehicle emits about 400 grams of carbon dioxide per mile. Taking this into account, Montgomery County produced an estimated 6.7 billion vehicle emissions of CO2 in 2022. While this is only 9% higher than the City of Philadelphia in the same year, Montgomery County’s population is half that of Philadelphia’s, revealing the significant per capita impacts of suburban living on emissions.
Population density is a strong predictor of VMT and therefore of emissions. Philadelphia’s density of just under 12,000 residents per square mile places it among the densest U.S. cities, but given the diversity of neighborhood typologies across the city’s 140 square miles, we are less compact than Berkeley, Chicago, and Miami. Greater Center City is more dense than any large city outside of New York. This density enables more people to not travel as far, and often without a motor, to meet their daily needs.
Neighborhood Density per Square Mile
Greater Center City is the densest large neighborhood outside of New York City.
Source: U.S. Census Bureau, 2020
In the mobility chapter, Philadelphia’s fifth place rank is highlighted among major cities for nonautomotive commuting. While impressive, second-place Boston provides an achievable goal to strive for given our cities’ and regions’ comparable land use patterns, transit system sizes, and urban scales. If Philadelphia were to reach a 41% non-car commute rate like Boston, it would remove around 100,000 cars from the roads daily. This would mean 2.1 million less VMT each day, 748 million less VMT a year, and an estimated 307 billion fewer grams of carbon dioxide released a year.
Amidst the political changes of 2025, cities such as Philadelphia are local actors in the fight against climate change. Leveraging Philadelphia’s untapped potential to convert more private car trips into public transit, walking, and biking can quickly and effectively reduce our region’s overall greenhouse gas emissions and climate impact.
Transportation is only one part of the equation because transportation systems are only as functional as the land-use development patterns in which they are embedded. A stronger Center City can move the needle on all sides of this equation:
• Housing: the larger the population in dense urban areas, the less reliance on driving.
• Retail: the more people concentrate in walkable areas, the more retailers will follow that spending power, co-locating goods and services with people who can have most of their daily needs met with minimal or no driving.
• Jobs: the larger the talent pool in and around downtown, the more that companies will see it as an appealing location to invest and expand, growing the share of jobs accessible by transit.
• Visitors and tourism: the more vibrant and walkable Center City is, and the more legible and secure our transit system feels, the more that casual visitors can avoid car trips into the city.
In a place like Center City, most of the necessary ingredients are already present. The task at hand is to improve our aging infrastructure and invest in our public realm so walking, biking, and transit become inevitable and enjoyable choices for a wider swath of Center City stakeholders. This also makes travel and daily living easier for the remaining share of the population that drives, as fewer cars clog streets and compete for limited parking. This is the power of a dynamic downtown.
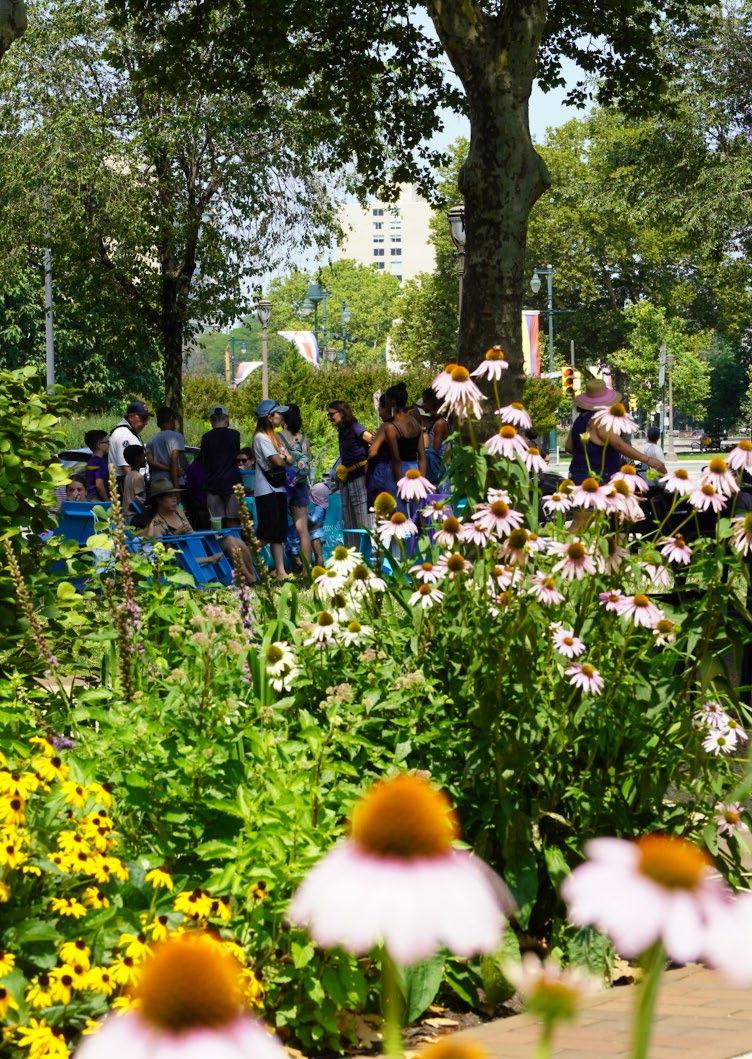
The State of Center City 2025 team includes Jessie Brain (Manager of GIS Mapping Services and Technology), Amy Genda (Vice President of Strategy and Design), Holly Keefe (Manager of Membership and Development), JoAnn Loviglio (Vice President of Communications and Public Relations), Leo Manning (Director of Strategic Communications), Adrianna Morsey (Research Assistant), Clint Randall (Vice President of Economic Development), Jimmy Salfiti (Economic Development Manager), Lauren Smith (Economic Development Manager), Bonnie Thompson (Senior Director of Digital Marketing), Emma Witanowski (GIS Intern), and Dana Womack (Digital Marketing Manager). This document was designed by Dave Orantes (Art Director) with art created by Miriam Singer and illustrations by Cora Levy.
Information Sources
Ballet X
Bureau of Labor Statistics, QCEW survey
Chris’ Jazz Café
CoStar
Delaware Valley Regional Planning Commission (DVRPC)
Eastern State Penitentiary
Indego Bike Share
InterAct Theatre
JLL
Lantern Theater Company
Mural Arts
Museum of American Revolution
National Constitution Center
National Museum of American Jewish History
PATCO
Penn Museum
Philadelphia Ballet
Philadelphia Business Journal
Philadelphia Convention and Visitors Bureau (PHLCVB)
Philadelphia International Airport
Philadelphia Streets Department
Philadelphia Visitor Center Corporation
Placer.ai
Reading Terminal Market
Replica
SEPTA
STR
U.S. Census Bureau
U.S. Census Bureau, American Community Survey
U.S. Census Bureau, Decennial Census
U.S. Census Bureau, Longitudinal EmploymentHousehold Dynamics
U.S. Census Bureau, Public Microdata Areas (PUMAs)
U.S. Environmental Protection Agency
Visit Philly
Photography Credits
Wil To
Matt Stanley Visit Philly
Adrianna Morsey
Clint Randall
Jimmy Salfiti
Jeffry Totaro
Dave Orantes
Amy Genda
Becca Mathias—Pennsylvania Horticultural Society
CCD Board
Paul L. Badger Jr., The Badger Group LLC
Deanna Ballinger, JLL
Valerija (Rija) Beares, CBRE
Anna Boni, Parkway Corporation
John J. Connors, Brickstone Realty Corporation
Jeffrey DeVuono, Brandywine Realty Trust
Paige Jaffe, Square Retail Consultants
Jamal Johnson, Comcast
Daniel Killinger, National Real Estate Development
Robert D. Lane Jr., Bob Lane Advisory LLC
Paul R. Levy, Center City District Foundation
Gregory B. Muller, SSH Real Estate
Drew Murray, O’Brien Business Systems
Randall L. Scott, Coretrust Capital Partners LLC
H. Hetherington Smith, Savills
Jack Soloff, Savills
Christophe P. Terlizzi, Associated Real Estate Consultants LLC
Angela Val, Visit Philadelphia
Carol Watson, Kimpton Hotel Palomar Philadelphia
Tina Byles Williams, Xponance
CCDF Board
John J. Connors, Brickstone Realty Corporation
Jaimie S. Field, Audacy
Michael C. Forman, FS Investments
Thomas J. Gravina, Evolve IP
Paul R. Levy, Center City District Foundation
James L. Paterno, Stockton Real Estate Advisors
Evan Seltzer
Gerard H. Sweeney, Brandywine Realty Trust
Richard Vague, Gabriel Investments
CPDC Board
Ryan Ade, JLL
Miguel Baptista, M&T Bank
Rija Beares, CBRE
Brian Berson, Parkway Corporation
Marc D. Brookman, Duane Morris LLP
Mark T. Celoni, Pennoni Associates Inc.
Andrew Coler, Formerly PNC Real Estate
Edward M. D’Alba, Urban Engineers Inc.
Harold Dichter, Aramark Corporation
Mark A. Duffy, Firstrust Bank
Kenneth Fulmer, Urban Engineers Inc.
Aaron Graves, Cushman & Wakefield
Joseph W. Healy, WRT
Branton Henderson, Bank of America
Monica Jindia, Commonwealth Land Title Insurance Company
Ajamu Johnson, Comcast/NBCUniversal
Peter Kelsen, Blank Rome LLP
Alan C. Kessler, Duane Morris LLP
Daniel Killinger, National Real Estate Development
Bradley A. Krouse, Klehr Harrison Harvey Branzburg LLP
Robert D. Lane, Greenberg Traurig LLP
Rachel Lewis, Morgan Lewis
Shawn McCaney, William Penn Foundation
Matthew N. McClure, Ballard Spahr LLP
Mark Merlini, Brickstone Realty
David Moos, CosciaMoos Architecture
Anne Papageorge, University of Pennsylvania
James R. Pearlstein, Pearl Properties LLC
Missy A. Quinn, Chubb
Julian P. Rackow, Blank Rome LLP
Jon Robins, Greenberg Traurig LLP
Christopher W. Rosenbleeth, Stradley Ronon Stevens & Young LLP
Mark L. Silow, Fox Rothschild LLP
H.Hetherington Smith, Savills
Christophe P. Terlizzi, Associated Real Estate Consultants LLC
Jason A. Tucker, The Goldenberg Group
Erik F. Williams, Saul Ewing LLP
CPDC Members
ABM
Allan Domb Real Estate
Alterra Property Group LLC
Aramark
Ballard Spahr LLP
Bank of America NA
Blank Rome LLP
Blueprint Commercial
Brandywine Realty Trust
Brickstone Realty
CBP Architects
CBRE Inc.
Chubb
Colliers
Comcast
Commonwealth Land Title Insurance Company
Conner Strong & Buckelew
CosciaMoos Architecture
Cozen O’Connor LLP
Cushman & Wakefield of Pennsylvania Inc.
Dranoff Properties
Duane Morris LLP
Econsult Solutions Inc.
Field Operations
Firstrust Bank
Gensler
Goldman Properties
Greenberg Traurig LLP
HDR Architecture
JLL
CPDC Members cont.
Kenilworth Capital Advisors LLC
KieranTimberlake
Klehr Harrison Harvey Branzburg LLP
Korman Communities Inc.
LevLane
Lubert-Adler
M&T Bank
Mercator Advisors LLC
Morgan, Lewis & Bockius LLP
MPN Realty
Narducci Electric Company LLC
National Real Estate Development
Nelson Worldwide
Newmark
O’Donnell & Naccarato
OLIN
Parkway Corporation
Pearl Properties LLC
PECO Energy Company
Pennoni
Pennsylvania Horticultural Society
Philadelphia Parking Authority
PIDC
PMC Property Group
PNC Bank NA
Posel Management Company
Post Brothers
Preservation Alliance for Greater Philadelphia
Reading Terminal Market Corporation
Republic Bank
Saul Ewing LLP
Savills
Scully Company
Seravalli Inc.
SSH Real Estate
Stockton Real Estate Advisors LLC
Strada Architecture LLC
Stradley Ronon Stevens & Young LLP
Structure Tone LLC
The Goldenberg Group
The Klein Company
The Lighting Practice
Toll Brothers Inc.
University of Pennsylvania
Univest Financial Corporation
Urban Engineers Inc.
William Penn Foundation
WRT