
Cycle VIII (2020 - 2023)


Cycle VIII (2020 - 2023)
The National Resource Center on Native American Aging (NRCNAA) is committed to identifying Native Elder health and social issues. Through education, training, and technical assistance, we assist in developing community-based solutions to improve the quality of life and delivery of support services to the Native aging population.
The NRCNAA serves the elderly Native American population of the U.S. The three centers are committed to increasing awareness of issues affecting American Indian, Alaskan Native, and Native Hawaiian Elders. We are a voice and advocate for their concerns. Through education, training, technical assistance, and research, the center assists in developing community-based solutions to improve the quality of life and delivery of support services to this aging population.
The Center for Rural Health (CRH) was established in 1980 within the University of North Dakota’s School of Medicine & Health Sciences. It is one of the nation’s oldest, largest, and most experienced organizations committed to providing leadership in rural health. CRH’s mission is to connect resources and knowledge to strengthen the health of people in rural communities. CRH serves as a resource for healthcare providers health organizations, citizens, researchers, educators, and policymakers across the state of North Dakota and the nation. CRH activities are targeted toward identifying and researching rural health issues, analyzing health policy, strengthening local capabilities, and developing community-based alternatives. Although many specific activities constitute the agenda of the CRH, five core CRH divisions serve as the focus: (1) community outreach and engagement, including the designated North Dakota State Office of Rural Health; (2) education and information dissemination, including the Rural Health Information Hub website; (3) Indigenous programs, including two national American Indian centers; (4) program evaluation; and (5) research.
This project was supported, in part, by grant number 90OIRC0003, from the U.S. Administration for Community Living, Department of Health and Human Services, Washington, D.C. 20201.
Grantees undertaking projects with government sponsorship are encouraged to express freely their findings and conclusions. Points of view or opinions do not, therefore, necessarily represent official ACL policy.
Boozhoo (Hello),
I would like to congratulate the Title VI directors and staff on another successful cycle of “Identifying Our Needs: A Survey of Elders.” It is your dedication and commitment to our Native Elders that makes the collection of this data possible. The information gathered in this survey is vital to identifying the needs of our Elders. We are incredibly grateful for all of the work you do with your programs. We know you wear many hats and ensure your programs continue to provide the important services in our tribal communities that our Elders depend on. You all are truly amazing.
I also want to thank the Elders who participated in the survey. Without your willingness to take the time to share your stories through the data, this report would not be possible. The Elders in our communities are the heart of us all. Their resilience and strength are the motivation behind all of our efforts. They guided us and supported us in our youth: sharing their wisdom, helping us to learn from our mistakes, and weaving a lesson into every story they shared to make us who we are today.
Our Elders also taught us to appreciate and be thankful for each new day. Growing up, I remember how my grandma would always tell us to appreciate our birthdays, since we would never experience that age again. She shared how she was once a part of the younger and middle generations, but then found herself being a part of the older generation.
In the same way, my other grandma would also remind me to appreciate my age, because we don’t stay young forever. All of this advice has stayed with me throughout my years, and is especially meaningful to me now as a parent, while also seeing my parents become part of the older generation. It is hard for me to look at my parents as Elders, since they were the ones who cared for us and made sure we were safe. Now, it is our generation’s honor and responsibility to care for our parents and the Elders in our families and communities.
This focus has been my inspiration and motivation to push forward with the work we do: to make things better for our Elders. It is our turn to care for our Elders; to give a greater chance for them to have a better quality of life and improved overall health. They say it takes a village to raise a child, but it also takes a tribe to care for our Elders. We are that tribe. I feel so blessed and grateful for the opportunity to put this data into action to connect our Elders with the services they need. This data will provide evidence and justification for accessing these vital health services so we can develop a plan to help meet their needs through offering services in our community.
We owe it to our Elders to do the most we can with this data and information to help make their golden years shine!
Miigwech (Thank You), Dr. Collette Adamsen Director, NRCNAA
Turtle Mountain Band of Chippewa Indians
We are indebted to several individuals who provided their time, hard work, and expertise to this project: Dr. Collette Adamsen, Dr. Robin Besse, Halle Short, Shane Knutson, Dr. Chia-Lin Chang, Elaina Seep, and Shelly Davis. We would also like to acknowledge our appreciation for the Title VI Directors and staff who administered this survey and the many Native Elders who took the time to complete it; without you, this report would not be possible.
Every three years since 1998, the NRCNAA has conducted the “Identifying Our Needs: A Survey of Elders” Needs Assessment. This survey, funded by the Administration for Community Living (ACL), collects health and social information from Native Elders across the United States. During the most recent survey round (Cycle VIII), data was collected from just over 21,000 Native Elders between April 2020 and March 2023. The data presented in this report, however, specifically focuses on Native Elders ages 55 years and older (n = 19,744).
The current report is comprised of four main components. The first 12 chapters encompass figures, charts, and maps (where relevant) for each respective survey question, separated by theme. These are followed by a spotlight section, providing specific data points about several different groups of interest, such as those who served on active duty or provided care for their grandchildren. The next component incorporates comparisons between the current Cycle VIII data, data from the National Urban Elder Needs Assessment Survey (NUENAS 1.0), national tribal data, and national data in order to better explore similarities, differences, and needs across groups. Finally, the last section contains summaries of write-in responses that Native Elders provided when completing the survey.
Together, these pages provide a comprehensive overview of the health, needs, and stories of Native Elders across the nation.
While it is impossible to summarize all of the important data pertaining to Native Elders in just a few points, a brief synopsis of some of the more commonly referenced points is listed here.
Most Native Elders surveyed were female (64.0%), between the ages of 60-69 years (44.0%), American Indian (85.6%), and were married or living with a partner (38.4%).
Most rated their health status as good (40.5%), with high blood pressure being the most commonly cited health concern (58.2%). Arthritis (44.8%) and diabetes (40.0%) were also frequently listed.
in Cycles I - VIII

Participation in the Needs Assessment Survey has shown a steady overall increase in participation since its inception in 1998. Cycle VII saw the largest number of participants to date with 23,427 surveys; however Cycle VIII was a close second, collecting 21,095 surveys from Indigenous communities across the U.S.
Close to half of Native Elders (47.4%) had not had a fall, although another 44.4% reported having between one and four falls.
With regard to memory issues, 0.7% of Native Elders reported having Alzheimer’s Disease; followed by 1.9% with dementia; and 8.0% who had other problems with memory or thinking.
Close to one-third of Native Elders were disabled (29.0%). Among them, 36.4% indicated it was due to chronic disease; 28.8% due to accident or injury; 7.3% military service; and 4.4% congenital causes.
Native Elders were most likely to report having Medicare (58.9%) as healthcare coverage or utilizing Indian Health Service (52.0%).
Most Native Elders reported having access to traditional foods (67.6%); 44.7% reported consuming them regularly.
Approximately 21.0% reported smoking, and 42.0% indicated it had been more than 3 years since their last alcoholic drink.
Close to 40.0% of Native Elders (38.2%) reported having a family member provide care for them. About one-third reported taking care of grandchildren (29.8%); 10.6% of respondents were the primary caregiver of their grandchildren.


The map to the left shows the total number of Indigenous communities within each state who participated in the Cycle VIII survey. During this cycle, data was collected from a total of 250 communities, varying across states. For example, there were four participating Indigenous communities in North Dakota who participated in Cycle VIII; 11 from Wisconsin; and six from Nevada. Alaska had the highest number of communities participating at 50.
The map to the left provides another way of exploring participation across states. Because the number of surveys completed by each Indigenous community differed, this map highlights the total percentage of Elders from each state, based on the total number of Elders surveyed across all states (i.e., the survey total).
For example, Oklahoma Elders made up the highest percentage of survey respondents at 18.3%; this was followed by Arizona (11.4%), New Mexico (9.2%) and Alaska (8.3%). States with the lowest percentage of respondents included Florida (0.1%), Virginia (0.2%), and Texas (0.2%).


1.2. Participant Age Group (n = 19,744)

Most Elders identified as being female (64.0%). Slightly over one-third identified as male (36.0%).
Elders who were between the ages of 60 - 69 years made up the largest proportion of respondents (44.0%). This was followed by those between the ages of 70 - 79 years (30.5%), those over the age of 80 (13.9%), and those between 55 - 59 years (11.6%).

The majority of Elders reported being American Indian (85.6%), although 7.7% were Alaska Native. An additional 4.2% indicated they were another ethnicity, followed by 1.6% who were Native Hawaiian, and 0.9% who were a descendant, in which their grandparent or parent was an enrolled tribal member.
Among the 4.2% who selected “Other,” Native Elders had the opportunity to write in a response. A summary of these responses is listed in Table 15.1 in Chapter 15.

Over one-third of Elders were married or living with a partner (38.4%), although close to one-quarter were widowed (23.8%). An additional 21.5% reported being divorced or separated, and 16.2% were single or had never married.

Individual annual income rates varied across participants. Most reported having an annual income between $10,000 and $14,999 (15.2%), although this was closely followed by those whose income was $50,000 or more (12.8%). Incomes of $15,000 - $19,999 or $20,000 - $24,999 (12.6%) were also frequently reported. Approximately 12.4% of Elders had an annual income of less than $5,000.

Most Elders reported that they had attended or graduated from high school (49.9%), and an additional 39.1% went on to attend or graduate from college or technical school. About 7.3% attended or graduated from graduate or professional school.

Close to three-quarters of Elders reported that they were retired or had not been employed full or part-time during the past 12 months (71.0%). There were 21.1% who reported working full-time, however, and 7.9% who did so part-time.

Participants were also asked to list the main reason they did not work in the past 12 months. Most (64.0%) were retired, while 13.7% reported having a disability. Another 8.5% indicated another reason, followed by 6.2% who had a medical condition, 4.4% who were taking care of their home or family, and 3.2% who were unable to find work.
Among the 8.5% who selected “Other,” Native Elders had the opportunity to write in a response. A summary of these responses is listed in Table 15.2 in Chapter 15.
Figure 1.9. Served on Active Duty in the U.S. Armed Forces, Military Reserves, or National Guard (n = 19,306)

Approximately 13.3% of Elders had served on active duty in the U.S. Armed Forces, Military Reserves, or National Guard; most indicated that they had not done so (86.7%).
1.10. Enrolled Member of a Federally-Recognized Tribe (n = 18,779)

Most Elders reported being an enrolled member of a federally-recognized tribe (92.9%). About 7.1% were not.
Figure 1.11. Reside on Reservation, Trust Land, Alaska Village, or Hawaiian Homestead (n = 19,246)


Close to two-thirds of Elders reported that they resided on a reservation, trust land, Alaska village, or Hawaiian homestead (64.4%), although the remaining 35.6% indicated they did not.
Most Elders reported living in their current ZIP code for 20 years or more (69.0%). This was followed by those who lived there between 11 and 20 years (11.6%), five years or less (10.7%), and between 6 and 11 years (8.7%).

Figure 2.1. Participant-Rated Health Status (n = 19,420)

Most Elders rated their health as being good (40.5%) or fair (27.3%). This was followed by those who said their health was very good (20.4%), poor (6.6%), and excellent (5.1%).
Figure 2.2. Number of Overnight Hospital Stays in Past 12 Months (n = 13,605)

Close to three-quarters of Elders had not had an overnight stay in the past 12 months (72.7%). About 11.8% had one stay, 5.7% were in the hospital two times, and 9.8% had stayed three or more times. On average, Elders reported that their average stay in the hospital was 2.6 days.
Figure 2.3. Percentage of Participants
(n = 19,744)

High blood pressure was the most frequently reported chronic condition among Elders (58.2%). This was followed by arthritis (44.8%) and diabetes (40.0%). Other common conditions included cataracts (20.2%), depression (14.3%), and asthma (13.5%).
Approximately 11.1% of Native Elders selected “Other,” where they had the opportunity to write in a response. A summary of these responses is listed in Table 15.3 in Chapter 15.

Figure 2.4 shows the percentage of Native Elders across the United States who reported being diagnosed with arthritis.
Rhode Island had the greatest percentage of Elders (67.8%), followed by Maine (57.5%), Florida (57.1%), and Kansas (56.6%). Texas reported the lowest percentage at 30.6%.
*Note: The number of participants in each state differed widely; because of this, results should be interpreted with caution when making comparisons.

Figure 2.5 shows the percentage of Native Elders across the United States who reported being diagnosed with high blood pressure.
Rhode Island had the greatest percentage of Elders (78.9%), followed by Texas (75.0%), Louisiana (72.9%), and Mississippi (70.6%). Wyoming reported the lowest percentage at 48.8%.
*Note: The number of participants in each state differed widely; because of this, results should be interpreted with caution when making comparisons.

Figure 2.6 shows the percentage of Native Elders across the United States who reported being diagnosed with depression.
Maine had the greatest percentage of Elders (25.8%), followed by Kansas (24.5%), Virginia (22.9%), and South Carolina (21.2%). Rhode Island reported the lowest percentage at 2.2%.
*Note: The number of participants in each state differed widely; because of this, results should be interpreted with caution when making comparisons.

Figure 2.7 shows the percentage of Native Elders across the United States who reported being diagnosed with cataracts.
Texas had the greatest percentage of Elders (30.6%), followed by North Carolina (30.1%), Rhode Island (26.7%), and Michigan (26.0%).
Louisiana reported the lowest percentage at 7.3%.
*Note: The number of participants in each state differed widely; because of this, results should be interpreted with caution when making comparisons.

Looking specifically at the 40.0% of Elders who reported they were diabetic, most (70.3%) were on oral medication and 37.2% were on insulin. This was followed by 4.2% who reported being on dialysis, 2.6% who were diabetic amputees, and 0.6% who said that they were diabetic only during their pregnancy.

Figure 2.9 shows the percentage of Native Elders across the United States who reported being diagnosed with diabetes.
Florida had the greatest percentage of Elders (71.4%), followed by Mississippi (71.3%), Texas (66.7%), and Louisiana (59.4%). Alaska reported the lowest percentage at 17.1%.
*Note: The number of participants in each state differed widely; because of this, results should be interpreted with caution when making comparisons.

The number of chronic conditions that Elders reported was subsequently totaled, in order to create an overall composite score of chronic illnesses.* Most Elders reported having two chronic conditions (24.9%), although another 20.8% only reported having one. Just over 12.0% of Elders did not list having any chronic illness.
Cumulatively, 87.8% of Elders reported having 1 or more chronic illnesses; 77.3% reported having between 1 and 4 chronic illnesses.
The average number of chronic illnesses across all Elders was 2.36.
* Because the values listed here were calculated based on the total number of conditions selected, if the Elder didn’t select any conditions, their total was counted as 0. As a result, this value includes those who may not have answered the question.
Figure


Figure 2.11 shows the percentage of Native Elders across the United States who reported being diagnosed with three or more chronic illnesses.
Maine had the greatest percentage of Elders (55.0%), followed by North Carolina (51.9%), Rhode Island (50.0%), and Texas (50.0%). New Mexico reported the lowest percentage at 28.6%.
*Note: The number of participants in each state differed widely; because of this, results should be interpreted with caution when making comparisons.
Just over 40.0% of Elders reported that they worried about falling down in the past month; the remaining 59.3% did not indicate that falling was a concern.


Figure 2.13 shows the average number of falls across the United States as reported by Native Elders.
Maine had highest number of average falls at 2.5, followed by Hawaii (2.4), Wyoming (2.4), and Montana (2.3). Rhode Island and Florida reported the lowest at 0.6.
*Note: The number of participants in each state differed widely; because of this, results should be interpreted with caution when making comparisons.
Close to half of Elders had not had any falls in the past year (47.4%), although an additional 44.4% reported having between one and four falls. Considerably fewer had between five and eight falls (5.1%) and 9-12 falls (2.0%). Approximately 1.1% had fallen 13 or more times in the past 12 months.
6,895)

Among those who reported having one or more falls, one-third indicated that during a fall they injured themselves seriously enough to need medical treatment (33.3%). The remaining 66.7% reported that they did not seriously injure themselves in the fall(s).

Figure 3.1. Difficulty with ADLs (n = 19,744)

Elders were asked to indicate which activities of daily living that they had difficulty with, due to a health or physical problem that lasted longer than three months (participants could select more than one). ADLs refer to basic, daily activities that are needed in order to live independently.
Elders were most likely to report difficulties with walking (27.9%), followed by bathing or showering (15.7%), and getting in or out of bed (12.3%).
Figure 3.2. Total Number of Difficulties with ADLs (n = 19,744)

Most Elders (63.3%) reported that they did not experience any difficulties with activities of daily living, although 18.5% did have trouble with one. Only 1.9% participants indicated that they had difficulty with all of the activities of daily living that were listed. Most Native Elders had difficulty with an average of .80 activities of daily living.
Figure 3.3. Difficulty with IADLs Due to Health or Physical Problem Lasting Longer than Three Months (n = 19,744)

In addition to difficulties with activities of daily living, Elders were also asked if they experienced any difficulties with instrumental activities of daily living (participants could select more than one). These refer to slightly more complex daily activities that allow one to live independently.
Among Elders who had a health or physical problem lasting longer than three months, over one-third (34.2%) reported difficulty with doing heavy housework. This was followed by 16.0% who had trouble doing light housework.
Figure 3.4. Total Number of Difficulties with IADLs (n = 19,744)

Similar to activities of daily living, most Elders did not report any difficulties with instrumental activities of daily living (58.3%), although 17.2% did report difficulties with one activity. Approximately 1.4% reported having difficulty with all of the instrumental activities of daily living. Most Native Elders had difficulty with an average of 1.03 instrumental activities of daily living.
Figure

Based on Elder responses to the items measuring ADLs and IADLs, their respective need for long-term care was subsequently calculated, which placed Elders into one of four different levels of need, each corresponding with different levels of care.
Most participants had little to no need for long-term care (59.5%), whereas 22.3% had a moderate need, most appropriately met with home and community-based care or personal care services. Another 7.0% had a moderately severe need and may need assisted living, followed by 11.2% who had a severe need, potentially requiring skilled nursing care.

Figure 4.1. Length of Time Since Last Visited Healthcare Provider for Routine Checkup (n = 18,854)

When asked how long it had been since they last visited a doctor/healthcare provider for a routine check-up, most Elders (82.7%) reported doing so within the past year. Another 8.4% had done so in the past two years, and 3.6% within the past three years.
4.2. Length of Time Since Last Mammogram (n = 11,786)

Female Elders were asked how long it had been since they had their last mammogram. Close to half (46.4%) said they had done so within the past year, followed by 19.5% who had done so within the past two years.
Approximately 14.7% of female Elders reported that their last mammogram was five or more years ago; an additional 3.5% had never had this test.
4.3. Length of Time Since Last Pap Smear (n =


Female Elders were additionally asked how long it had been since their last pap smear. Most reported that it had been five or more years ago (41.0%). This was followed by 17.9% who had completed it within the past year, and 15.2% who had done so within the past two years.
Male Elders were asked how long it had been since they had last had a prostatespecific antigen test. Over one-third (34.0%) reported having done it within the past year, although 25.9% said they had never had done this test.

Figure
18,375)

5.2. Use Glasses or Contact Lenses (n = 18,801)

When asked if they experienced blindness in one or both of their eyes, very few Elders reported that this was the case (4.3%). Most (95.7%) said they did not experience this.
Most Elders (83.1%) reported that they used glasses or contact lenses, although 16.9% said this was not the case for them.
Figure 5.3. Trouble Seeing (Even When Wearing Corrective Lenses) (n =


When asked if they had any trouble seeing, even when wearing corrective lenses, close to three-quarters of Elders indicated they did not have any difficulties. Over one quarter of participants (28.8%) reported trouble seeing, however.
= 18,908)
Approximately two-thirds of Elders (66.2%) reported seeing an optometrist in the past year. The remaining one-third (33.8%) did not.
Figure 5.5. Treatment for Glaucoma (n = 18,525)

Most Elders reported that their doctor had never treated them for glaucoma (84.1%), although 15.9% reported this was true for them.
5.6. Total Deafness (n = 18,666)

Very few Elders reported experiencing total deafness (2.9%); most (97.1%) indicated that this was not the case for them.
Figure 5.7. Use a Hearing Aid (n = 18,702)

Most Elders reported that they did not use a hearing aid (83.8%), although 16.2% indicated this was true for them.
5.8. Trouble Hearing (Even When Wearing a Hearing Aid) (n = 16,876)

When asked if they had any trouble hearing, even when wearing their hearing aid, most Elders indicated they did not have any difficulties (81.1%), although 18.9% said they did have trouble hearing.
5.9. Hearing Test in Past Year (n = 18,619)


Most Elders reported they had not had a hearing test in the past year (79.0%), although 21.0% indicated they had done so.
= 18,815)
When asked if they had seen a dentist or dental hygienist in the past year, results were more evenly split. Slightly over half of Elders (53.3%) reported they had seen a dental provider in the past year; 46.7% had not.
5.11. Type of Dental Care Currently Needed (n = 19,744)

Elders were asked to indicate which type of dental care they currently needed; they could select more than one. Most indicated that they did not need any dental care (29.7%), although 26.2% reported needing teeth filled or replaced. Denture work (23.0%), needing teeth pulled (11.5%), or other dental care (10.9%) were also frequently listed.
Approximately 10.9% of Native Elders selected “Other,” where they had the opportunity to write in a response. A summary of these responses is listed in Table 15.4 in Chapter 15.
Figure 5.12.
18,451)

When asked if there was a time in the past year if they needed dental care but could not get it at that time, approximately onequarter of Elders said yes (24.6%). Most (75.4%) indicated this was not the case for them.

Elders were asked to list the reasons why they could not get the dental care that they needed; they could select multiple items.
Most (16.1%) indicated there was another non-listed reason as to why they could not obtain needed dental care; a summary the write-in responses associated with this question is available in Table 15.5 in Chapter 15.
This was followed by not being able to afford the cost (9.3%), being afraid of or not liking dentists (6.0%), their insurance not covering the recommended procedures (5.7%), or not having transportation (5.7%).


Elders were asked if they had experienced any memory issues during the last 12 months. They were able to choose multiple items from a predetermined list.
One-quarter of participants indicated that they had misplaced things (25.5%). This was followed by those who reported memory loss (14.9%), changes in mood or behavior (10.6%), and difficulty in performing familiar tasks (7.6%). They were least likely to report changes in personality (3.9%) and problems with language (3.1%).
Figure 6.2. Total


The total number of memory issues each Elder had experienced was subsequently totaled, in order to create an overall composite score of memory issues.* Most Elders (62.9%) did not indicate any memory issues, although 17.6% indicated one. Another 8.8% said they had two memory issues.
*Because the values listed here were calculated based on the total number of memory issues they selected, if the Elder did not select any conditions, their total was counted as 0. As a result, this value includes those who may not have answered the question.
Diagnosed memory problems were relatively low across most Elders. Most (80.2%) indicated they had not been diagnosed with any memory issues.
Approximately 8.0% had been diagnosed with other problems of memory or thinking. This was followed by 1.9% who had received a diagnosis of dementia, and 0.7% who had a diagnosis of Alzheimer’s Disease.
Figure 6.4. Percentage of Native Elders Reporting Being Diagnosed With Alzheimer’s Disease, Dementia, or Other Problems with Memory or Thinking By State
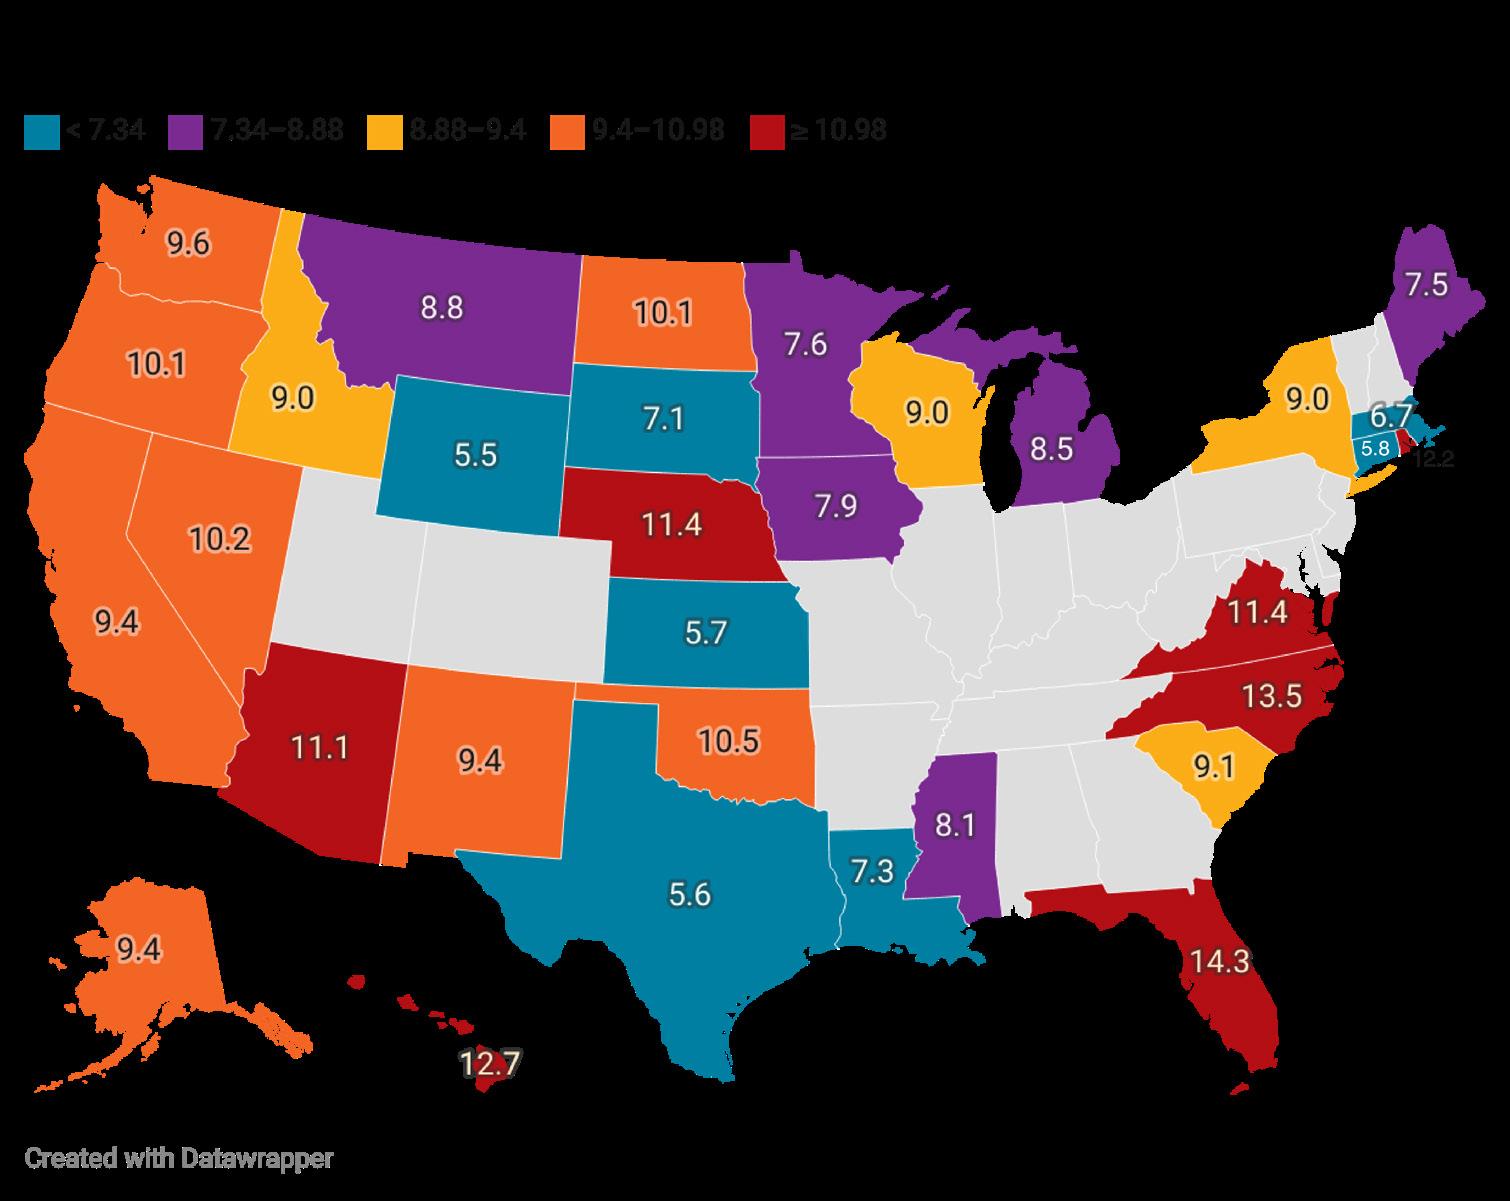
Figure 6.4 shows state percentages of Native Elders who were diagnosed with Alzheimer’s Disease, dementia, or any other problems with memory or thinking.
Florida had the greatest percentage (14.3%), followed by North Carolina (13.5%), Hawaii (12.7%), and Rhode Island (12.2%). Wyoming reported the lowest percentage at 5.5%.
*Note: The number of participants in each state differed widely; because of this, results should be interpreted with caution when making comparisons.
Figure 6.5. Percentage of Native Elders Reporting At Least One Problem With Memory By State

Figure 6.5 shows state percentages of Native Elders who reported having at least one memory problem, such as misplacing things or difficulty performing familiar tasks.
Virginia had the greatest percentage (45.7%), followed by North Carolina (42.9%), Hawaii (42.5%), and Idaho (42.3%). Nebraska reported the lowest percentage at 22.1%.
*Note: The number of participants in each state differed widely; because of this, results should be interpreted with caution when making comparisons.
Figure


Close to one-third of Elders (29.0%) had been diagnosed with a disability. The remaining 71.0% did not report having a disability.
Among those who had been diagnosed with a disability, most Elders said it was due to chronic disease (36.4%). This was closely followed by those who indicated it was due to another unspecified reason (30.8%). For this item, they had the opportunity to write in a corresponding reason; a summary of these write-in responses is listed in Table 15.6 in Chapter 15. Another 28.8% listed accident or injury, followed by military service (7.3%) and congenital causes (4.4%).


Elders were asked if they had any health problems that required them to use special equipment, such as a cane, a wheelchair, a special bed, or a special telephone. This included occasional use of such items, as well as use only in certain circumstances.
Approximately one-third of Elders (31.0%) indicated they did use special equipment for their health problems; the remaining 69.0% did not report doing so.
Elders were also asked if they had ever had a brain injury that limited them in any way for more than a week in any activities.
Most Elders reported this was not the case (94.4%), although 5.6% did indicate they had experienced a brain injury that impacted their activities.


Elders were asked to select which type(s) of healthcare coverage they currently had (they could select more than one). Medicare was the most common choice, with over half selecting that as an option (58.9%). This was followed by 52.0% who selected Indian Health Service; although IHS is not a type of healthcare coverage, it was included in the survey options to better understand health-related services that Native Elders may be utilizing.
Medicaid (22.5%) and private health and medical insurance (20.0%) were also commonly reported, as well as Indian health/tribal insurance (18.4%).
Approximately 1.9% of Elders indicated that they did not have healthcare coverage.
Approximately 7.2% of Native Elders selected “Other,” where they had the opportunity to write in a response. A summary of these responses is listed in Table 15.7 in Chapter 15.
Figure
= 19,744)
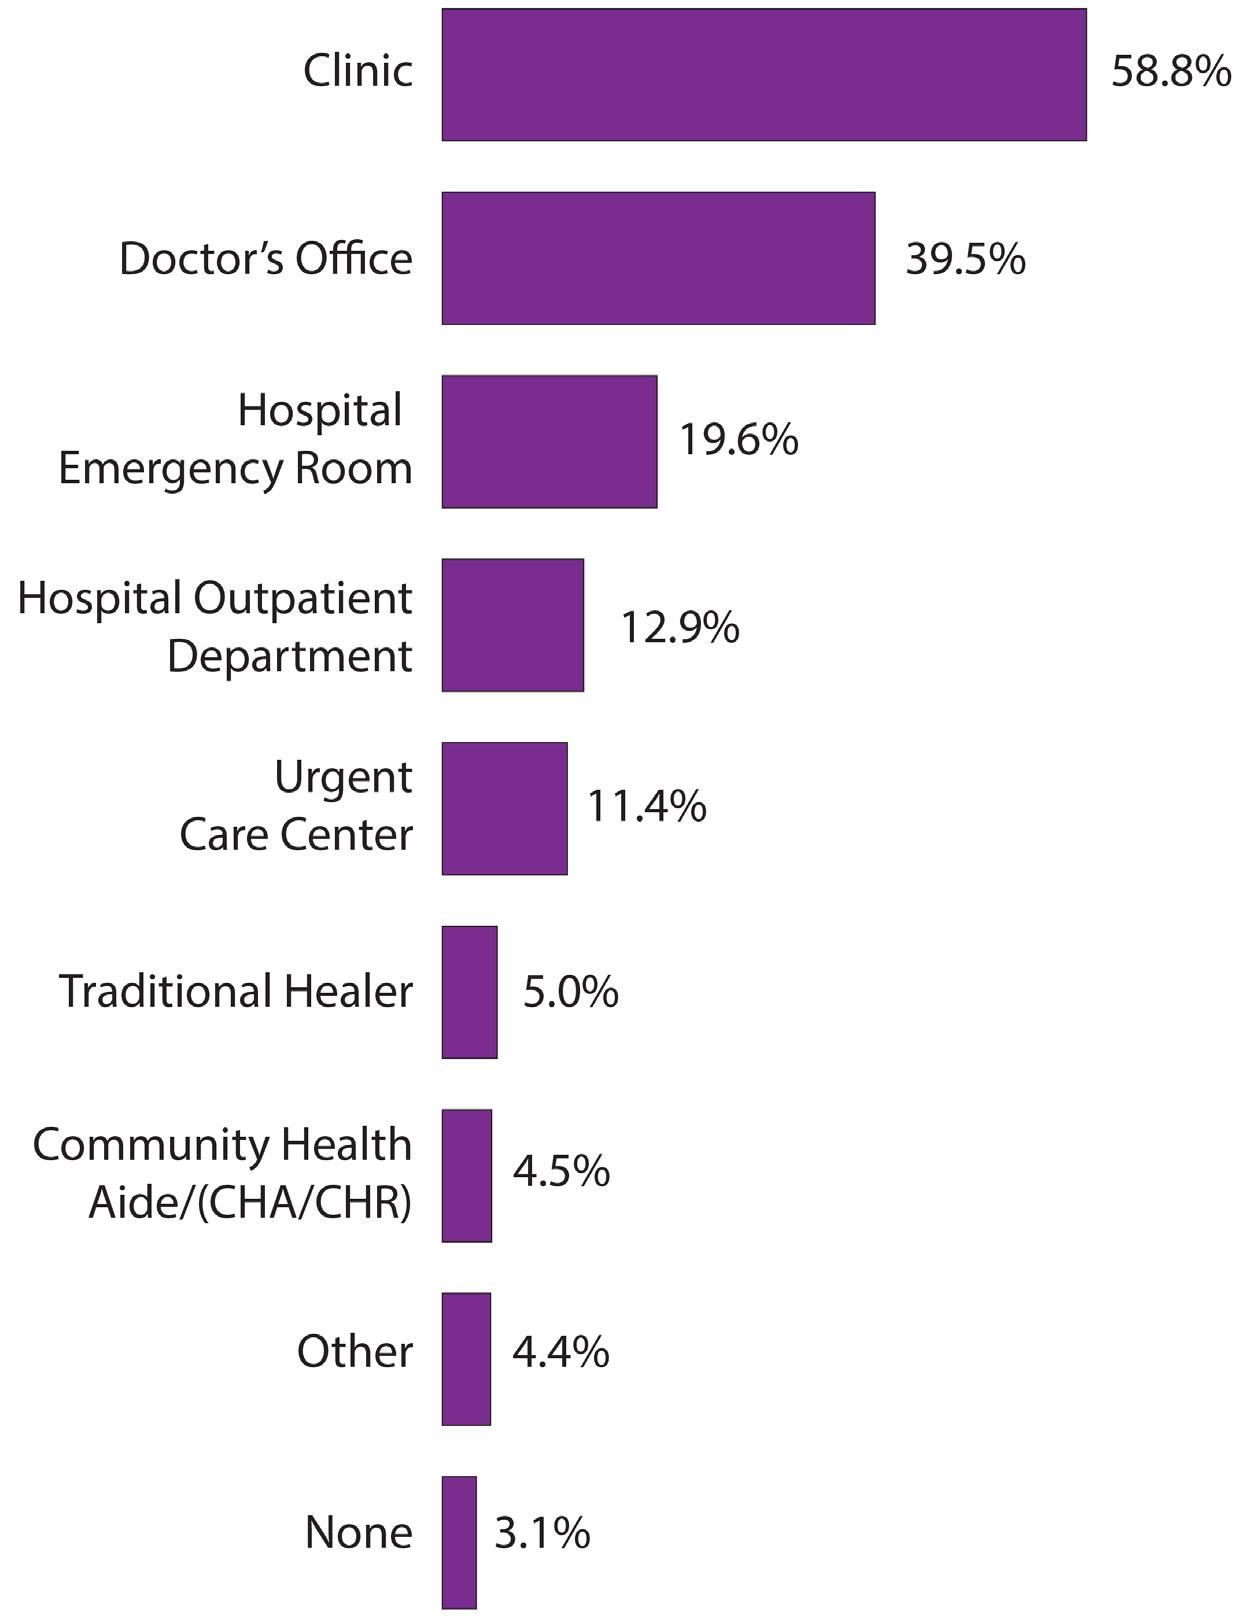
When sick or in need of professional advice about their health, Elders were most likely to say they went to a clinic (58.8%) or doctor’s office (39.5%). This was followed by a hospital emergency room (19.6%), hospital outpatient department (12.9%), or urgent care center (11.4%). Participants could select more than one answer choice.
Approximately 4.4% of Native Elders selected “Other,” where they had the opportunity to write in a response. A summary of these responses is listed in Table 15.8 in Chapter 15.
Figure 7.3.
= 19,744)
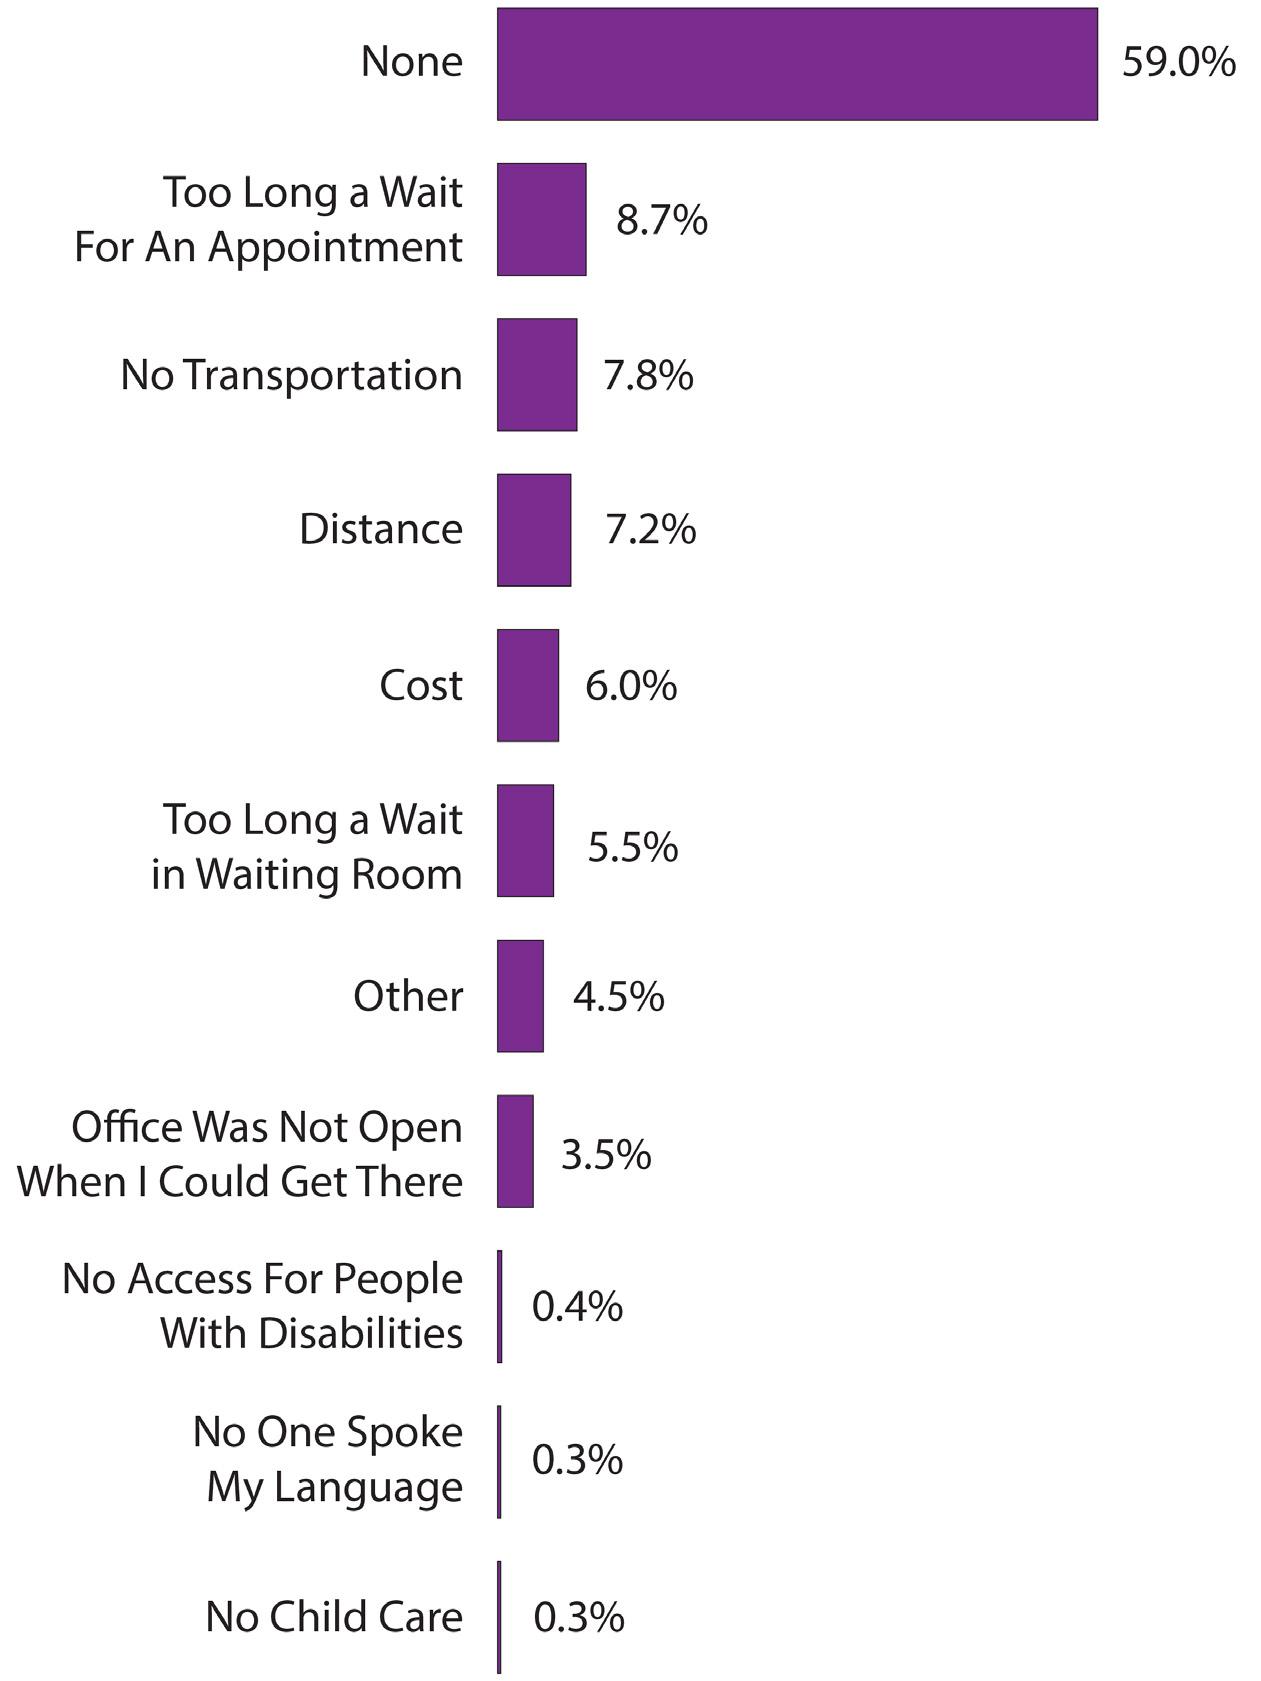
Elders were asked if there were any factors that kept them from medical care in the past 12 months (they could select more than one item).
Most (59.0%) indicated that there were no barriers to medical care. Among those who did report a barrier, too long a wait for an appointment was most frequently listed (8.7%), followed by lack of transportation (7.8%) and distance (7.2%). Cost (6.0%) and too long of a wait in a waiting room (5.5%) were also reported.
Approximately 4.5% of Native Elders selected “Other,” where they had the opportunity to write in a response. A summary of these write in responses is listed in Table 15.9 in Chapter 15.
Participants were least likely to say that they faced language (0.3%) or child care (0.3%) barriers.
Figure 7.4. Did Not Take Prescribed Medication in Past Year Due to Cost (n = 17,983)

Approximately 6.8% of Elders said there had been a time in the past 12 months when they did not take their medication as prescribed because of cost (this did not include over-the-counter [OTC] medication). The remaining 93.2% indicated that cost had not been an issue for them.

8.1.

8.2.

When asked if they currently smoked, most Elders indicated they did not (79.0%). There were 15.9% who reported smoking everyday, however, and 5.1% who smoked some days.
Among Elders who smoked every day, 54.4% reported smoking for social or recreational reasons. Another 8.8% did so at ceremonies. Participants had the option of selecting one or both reasons.

Among Elders who smoked some days, 51.8% reported smoking for social or recreational reasons; 23.5% did so at ceremonies. Participants again had the option of selecting one or both reasons.
8.4.

Elders who reported smoking (every day or some days) were subsequently asked to list how many cigarettes they smoked per day.
The majority of Elders smoked less than 20 cigarettes per day. Most smoked between 6 and 10 cigarettes per day (37.4%), followed by 1 and 5 cigarettes (32.1%).
Another 26.8% smoked between 11 and 20 cigarettes. Comparatively, relatively few smoked between 21 and 30 cigarettes (2.4%) or 31 or more cigarettes (1.3%).
Across all smokers, the average number of cigarettes smoked per day was 9.69.
Figure 8.5. Currently Use Chewing Tobacco or Snuff (n = 17,402)

Elders were asked if they used chewing tobacco or snuff. The vast majority of Elders indicated they did not (97.3%), although 2.7% did confirm using it.
8.6. Number of Containers of Chewing Tobacco or Snuff Used Per Week (n = 373)
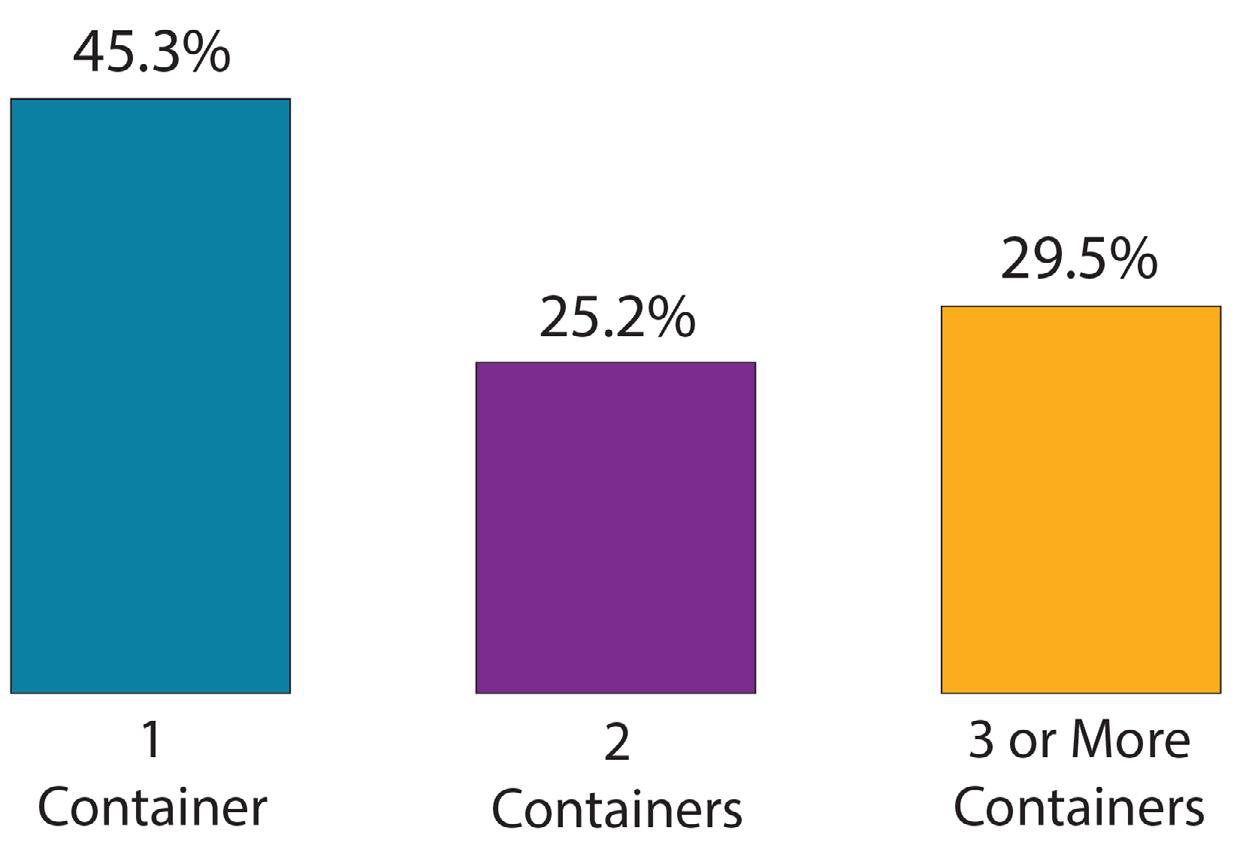
Among those who did report chewing tobacco or snuff, most Elders reported using one container per week (45.3%). This was followed by 29.5% who used three or more containers, and 25.2% who used two.
Across all Elders who reported using chewing tobacco, the average number of containers used per week was 2.37.
Figure 8.7. Length of Time Since Last Alcoholic Beverage (n = 16,377)

Figure 8.8.
Beverage Frequency
When asked how long it had been since they last drank an alcoholic beverage, most Elders said it had been over three years ago (42.0%). This was followed by 24.3% who said it had been within the past 30 days. About 9.4% reported that it had been more than 30 days, but within the past year, and another 6.9% had drank between one and three years ago. Approximately 17.3% of participants reported never having an alcoholic drink before.

Elders who had reported drinking were subsequently asked in the past month, how many days they had five or more drinks at the same occasion. In this context, “occasion” referred to having drinks at the same time or within a couple hours of each other.
Most Elders reported that they had not had any drinks (82.0%), although 10.5% had five or more drinks on one or two days in the past month. This was followed by 3.9% who had five or more drinks on three to five days in the past month, and 3.6% who did so on six or more days.

Figure 9.1. Current Elder BMI (n = 18,400)

Elders were asked to provide their height and weight, which were subsequently used to determine an overall BMI score for each participant.
Close to half of Elders (45.7%) were obese, and 32.9% were overweight. Approximately 21.4% were at a normal weight.

When asked what vigorous exercises they had done in the past month, Elders were most likely to report walking (53.0%). This was followed by activities such as yard work (30.8%), gardening (12.7%), or bicycling (6.1%). About one-quarter of Elders said they did not exercise, and 10.2% indicated another type of exercise not listed. For this item, Native Elders had the option to write in a response; a summary of these responses is listed in Table 15.10 in Chapter 15.
For this question, participants could select more than one activity.
Figure 9.3. Number of Times Engaged in Vigorous Exercises Per Week (n = 12,282)

Among Elders who reported engaging in at least one type of activity, most did so between one and two times per week (50.9%). Another 28.1% did so between three and four times per week, and 20.9% exercised five or more times per week.
9.4. Access to Traditional Foods (n = 17,761)

Over two-thirds of Elders (67.6%) reported having access to traditional foods; the remaining 32.4% did not.
Figure 9.5. Consume Traditional Foods Regularly (n = 15,077)

Traditional Food Frequency
More than half of Elders did not report consuming traditional foods regularly (55.3%); only 44.7% indicated this was the case.
Figure 9.6. Frequency With Which Traditional Foods Are Consumed (n = 9,906)

When asked how often they consumed traditional foods, most Elders said they did so between one and two times per week. This was followed by 19.5% who did so three to four times a week, and 12.1% who consumed traditional foods five or more times per week.
Figure 9.7. Traditional
(n = 9,031)

Elders were asked to describe what traditional foods they regularly consumed. Over 9,000 Elders wrote in responses for this question, resulting in a wide variety of food items. Responses were subsequently incorporated into a word cloud in order to illustrate the findings. Figure 9.7 is not an exhaustive list of all food items, but shows the most frequently listed traditional foods, which appear larger. Based on this, items such as vegetables, elk, beans, frybread, stew, fish, venison, salmon, and chili were commonly listed among participants. For a more in-depth analysis of Native Elder responses, please see Table 15.11 in Chapter 15.

Elders were also asked to indicate which of the statements in Figure 9.8 applied to them; they could select more than one. One-third of participants (33.7%) reported taking three or more different prescription or over-the-counter (OTC) drugs a day. This was followed by 26.5% who ate fewer fruits, vegetables or milk products.
About one-quarter of Elders (24.9%) ate alone most of the time, and 22.8% had an illness or condition that changed the kind or amount of food eaten.
There were 9.6% who said they did not have enough money to buy the food that they needed. They were least likely to say that they had three or more drinks of alcohol every day (2.3%).
Figure 9.9.

Using the statements in Figure 9.8, an overall nutrition score was calculated for each Elder using the Nutrition Screening Initiative, which was developed by the American Academy of Family Physicians, The American Dietetic Association, and the National Council on Aging.
Most Elders had a good nutrition score (52.5%), however 28.2% were at moderate nutritional risk, and the remaining 19.4% had a high nutritional risk.

Figure 9.10 shows the percentage of Native Elders who had a good nutrition status in the United States.
Rhode Island had the greatest percentage of Elders (67.8%), followed by South Carolina (67.7%), Nebraska (63.8%), and Maine (63.3%). Arizona reported the lowest percentage at 43.4%.
*Note: The number of participants in each state differed widely; because of this, results should be interpreted with caution when making comparisons.
9.11.

Figure 9.11 shows the percentage of Native Elders who were at a moderate nutrition risk in the United States.
New York had the greatest percentage of Elders (34.6%), followed by Massachusetts (34.3%), Iowa (31.7%), and Louisiana (31.3%). Texas reported the lowest percentage at 16.7%.
*Note: The number of participants in each state differed widely; because of this, results should be interpreted with caution when making comparisons.

Figure 9.12 shows the percentage of Native Elders who were at a high nutritional risk in the United States.
Texas had the greatest percentage of Elders (30.6%), followed by Arizona (27.5%), Idaho (23.8%), and Connecticut (23.2%). Louisiana reported the lowest percentage at 8.3%.
*Note: The number of participants in each state differed widely; because of this, results should be interpreted with caution when making comparisons.
Figure 9.13. Food Did Not Last, and Did Not Have Money to Get More (n = 18,545)

“The food I bought just didn’t last, and I didn’t have money to get more.”
Elders were asked to indicate how true this statement had been for them in the past year. Most (66.8%) said that it was never true; however, it was sometimes true for 23.9%, and often true for 9.3% of Elders.
Figure 9.14. Could Not Afford to Eat Balanced Meals (n = 18,575)
“I couldn’t afford to eat balanced meals.”

Elders were asked to indicate how true this statement had been for them in the past year. Most (63.6%) said that it was never true; however, it was sometimes true for 25.3%, and often true for 11.1% of Elders.
Figure 9.15. Cut the Size of Or Skip Meals Due To Not Enough Money for Food (n = 18,726)


When asked if they had cut the size of or skipped meals due to not enough money in the past 12 months, most Elders said this was not the case (84.2%). About 15.8% of participants did report reducing meal size/frequency because they could not afford it.
= 2,964)
Elders who reported cutting the size of or skipping meals due to money in the past 12 months were asked to indicate how often they had done so. Among them, over one-third indicated doing so almost every month (37.3%), while another third (36.6%) reported doing it some months but not every month. Approximately 18.6% reported only one or two months.
Figure 9.17. Ate Less Than Wanted Due To Not Enough Money (n = 18,602)

About 15.3% of Elders said that they had eaten less than they felt they should in the past 12 months because there wasn’t enough money for food. The remaining 84.7% indicated this was not true for them.
Figure 9.18. Hungry but Didn’t Eat Because Not Enough Money For Food (n = 18,543)

About 11.4% of Elders reported that there was at least one time in the past 12 months where they were hungry but didn’t eat because there wasn’t enough money for food. The remaining 88.6% of participants said this was not true for them.

Figure 10.1. Participation in Practices Including Traditional Food, Music, and Customs (n = 18,001)
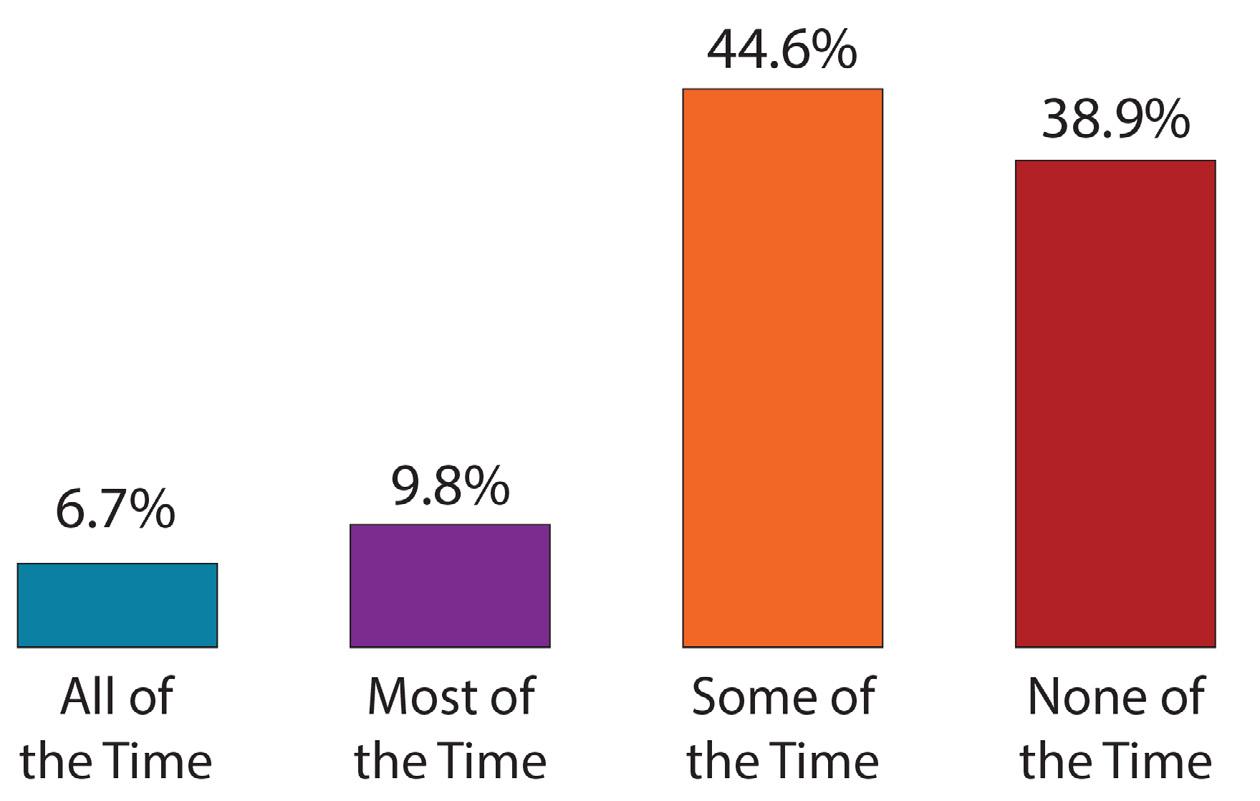
When asked if they participated in cultural practices that included traditional food, music, and customs, most Elders said they did so some of the time (44.6%). About 9.8% did so most of the time, and 6.7% did so all of the time. Over one-third of participants (38.9%) said they never participated, however.
Figure 10.2. Percentage of Native Elders Who Reported Never Participating in Cultural Practices By State

Figure 10.2 shows the percentage of Native Elders in the United States who reported never participating in cultural practices.
Rhode Island had the greatest percentage of Elders (60.0%), followed by South Carolina (58.6%), North Dakota (47.1%), and Nevada (45.7%). Florida reported the lowest percentage at 10.7%.
*Note: The number of participants in each state differed widely; because of this, results should be interpreted with caution when making comparisons.
Figure 10.3.
(n = 19,744)

Elders were asked to choose from a list of items which cultural practices and traditions they participated in; they could select more than one item.
Powwows were selected most frequently (28.9%), followed by consuming (24.9%) and preparing (19.9%) cultural or traditional foods. Activities such as smudging (19.5%), listening to cultural or traditional music or songs (14.9%), speaking their cultural or traditional language (14.5%), and engaging in cultural or traditional dance (13.0%) or storytelling (8.8%) were also common.
There were 8.1% of Native Elders who indicated “Other,” where they had the opportunity to write in a response. A summary of these responses is listed in Table 15.12 in Chapter 15.
Elders were least likely to participate in activities such as a drum group (3.1%) or a Sundance ceremony (3.0%).
Figure 10.4. Frequency of Socialization (n = 16,716)

Elders were also asked how often they got out and socialized, such as attending church or religious meetings, clubs or organizations they belonged to, or cultural activities and traditional ceremonies. Responses were relatively similar across all answer choices; most (22.4%) said they did so one to two times per month, followed by 22.0% who did so three to four times per month. Approximately 15.3% socialized five to eight times, and 20.6% did so nine or more times. There were 19.7% of Elders who reported that they did not socialize.
10.5.

Figure 10.5 shows the average number of times Native Elders reported socializing per month, by state.
Hawaii Elders had the highest average at 9.8 times, followed by North Carolina (8.9 times), New York (8.0 times), and South Carolina (7.7 times). South Dakota and Idaho tied for lowest at 3.6.
*Note: The number of participants in each state differed widely; because of this, results should be interpreted with caution when making comparisons.

10.7.
Over one-third of Elders (38.2%) reported having a family member who provided care for them. The remaining 61.8% did not.

Figure 10.7 shows the percentage of Native Elders across the United States who reported having a family member provide care for them.
Florida had the greatest percentage of Elders (55.0%), followed by South Dakota (50.9%), New Mexico (49.2%), and North Carolina (49.2%). Virginia reported the lowest percentage at 22.9%.
*Note: The number of participants in each state differed widely; because of this, results should be interpreted with caution when making comparisons.

Slightly less than one-third of Elders (29.8%) reported taking care of grandchildren. The remaining 70.2% did not take care of grandchildren.

Figure 10.9 shows the percentage of Native Elders across the United States who reported taking care of grandchildren.
South Dakota had the greatest percentage of Elders (46.0%), followed by Florida (44.0%), Iowa (41.1%), and Wyoming (40.2%). Rhode Island reported the lowest percentage at 13.3%.
*Note: The number of participants in each state differed widely; because of this, results should be interpreted with caution when making comparisons.
Figure 10.10. Primary Caregiver for Grandchildren (n = 18,627)

Elders were also asked if they were the primary caregiver for grandchildren; in this case, about 10.6% said that they were the primary caregiver.
Figure 10.11. Percentage of Native Elders Who Reported Being Primary Caregiver for Grandchildren By State

Figure 10.11 shows the percentage of Native Elders across the United States who reported being the primary caregiver of their grandchildren.
South Dakota had the greatest percentage of Elders (25.9%), followed by Wyoming (22.6%), Montana (22.5%), and North Dakota (21.7%). Hawaii reported the lowest percentage at 3.3%.
*Note: The number of participants in each state differed widely; because of this, results should be interpreted with caution when making comparisons.
Figure 10.12.

Elders were asked if they had someone, such as a family friend or neighbor, who they felt like they could depend upon to provide physical support to them. This might include things like shopping or running errands, fixing things around the house, or providing transportation. Most Elders (75.9%) said they had someone to provide physical support, although this was not the case for close to one-quarter of participants (24.1%).

Figure 10.13 shows the percentage of Native Elders across the United States who reported having physical support, such as shopping, running errands, or fixing things around the house.
Rhode Island had the greatest percentage of Elders (92.2%), followed by Nebraska (87.0%), North Carolina (83.7%), and Maine (83.5%). Virginia reported the lowest percentage at 61.8%.
*Note: The number of participants in each state differed widely; because of this, results should be interpreted with caution when making comparisons.
Figure

Elders were additionally asked if they had someone they could depend on to provide social support, such as listening to problems, giving advice, or providing companionship. Compared to physical support, this percentage was higher, with 81.8% of Elders saying they had someone they could depend upon. The remaining 18.2% did not report having that level of support.

Figure 10.15 shows the percentage of Native Elders across the United States who reported having social support, such as someone who could give advice or provide companionship.
Rhode Island had the greatest percentage of Elders (95.6%), followed by Nebraska (93.0%), Florida (90.5%), and Hawaii (90.5%). Virginia reported the lowest percentage at 62.9%.
*Note: The number of participants in each state differed widely; because of this, results should be interpreted with caution when making comparisons.


Most Elders lived in a single family residence (73.3%) or other type of housing (13.2%). This was followed by an apartment (10.6%), retirement home (0.9%), being homeless (0.9%), and a sleeping room or boarding house (0.6%). Elders were least likely to live in a health facility (0.4%).
Time at Present Address
Figure 11.2. Length of Time At Present Address (n = 19,052)

Figure 11.3. Current Living Situation (n = 18,699)

Most Elders had lived at their present address for over 10 years (67.0%). Others had lived at their current address for less than five years (18.8%) or between six and 10 years (14.2%).
Close to two-thirds of Elders reported living with family members (62.7%), although approximately one-third (31.3%) lived alone. Considerably fewer Elders lived with non-family members (3.8%) or with both family and non-family members (2.3%).

Figure 12.1. Amount of Time in the Past Month Elders Felt Happy (n = 19,009)

In the past month, Elders reported feeling happy most of the time (54.3%), followed by some of the time (22.1%) or all of the time (21.8%). Only 1.8% never felt happy.
12.2. Amount of Time in Past Month Elders Felt Calm and Peaceful (n = 18,928)

Similar to happiness, most Elders reported feeling calm and peaceful most of the time in the past month (52.6%). This was followed by some of the time (25.9%) and all of the time (19.1%). Approximately 2.4% of Elders had never felt calm and peaceful in the past month.
Figure 12.3. Amount of Time in Past Month Elders Felt Very Nervous (n = 18,836)

With regard to anxiety, most Elders did not report feeling like a nervous person at all in the past month (53.5%), while 39.8% felt nervous at least some of the time. Considerably fewer felt nervous most (5.1%) or all (1.6%) of the time.
Figure 12.4. Amount of Time in Past Month Elders Felt Downhearted

In the past month, most Elders did not feel downhearted and blue (49.3%), although 44.7% reported feeling that way some of the time. About 4.9% felt downhearted and blue most of the time, and 1.1% felt that way all of the time.
Figure 12.5. Amount of Time in Past Month Elders Felt So Down in the Dumps Nothing Could Cheer Them Up (n = 18,886)

When asked how often in the past month they had felt so down in the dumps that nothing could cheer them up, most Elders said none of the time (73.2%). About 23.3% reported feeling this way some of the time, followed by 2.6% most of the time, and 0.9% all of the time.
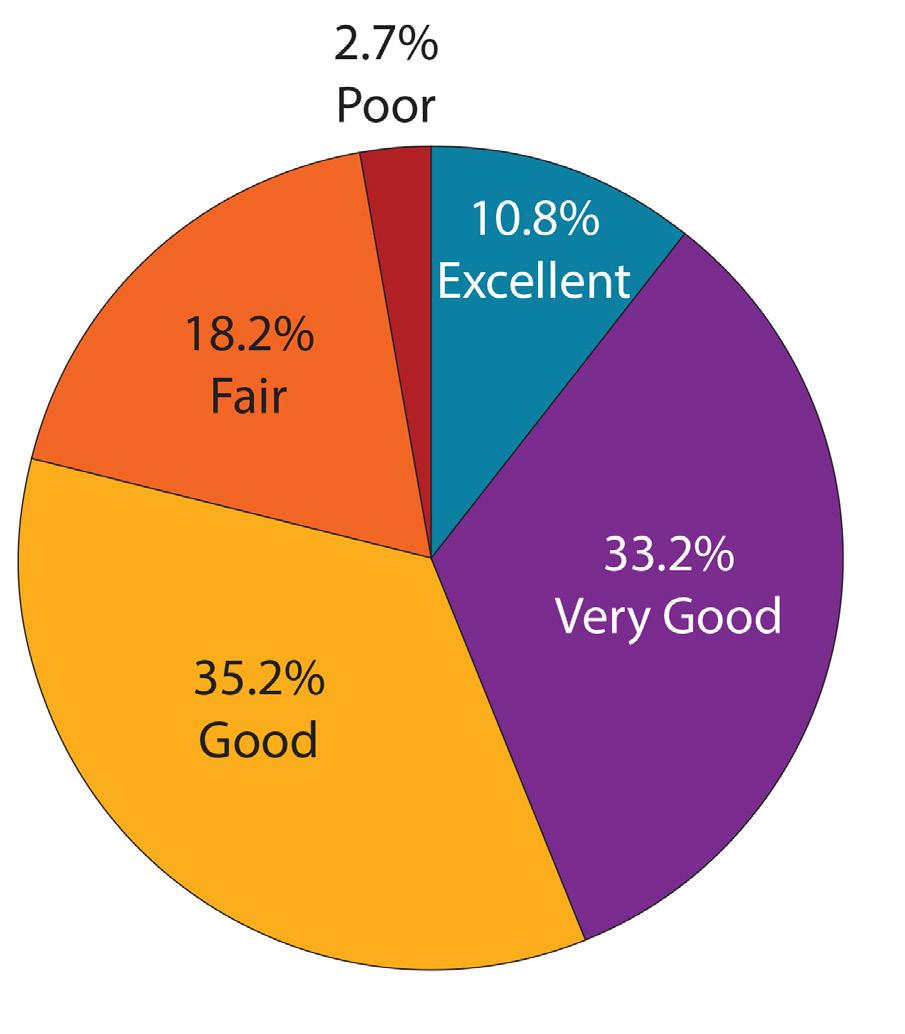
Elders were also asked to rate their quality of life in the past year. Overall, most said their quality of life was either good (35.2%) or very good (33.2%), although responses of fair (18.2%) and excellent (10.8%) were also common. Only 2.7% of participants said their quality of life was poor.
Figure 12.7. Nutrition Services Elders Currently Use vs. Those They Would Consider Using (n = 19,744)

In separate questions, Elders were asked to indicate which nutrition services they were currently using (purple), versus those which they would be willing to use if they became unable to meet their own needs (orange). Services are sorted by overall interest (now use + would use totals).
With regard to nutrition services, Elders were most likely to report currently using home-delivered meals (33.3%), congregate meals (23.5%), and nutrition education (5.7%). This order remained the same for programs that Elders would be interested in using, with many listing home-delivered meals as their top choice (71.8%), followed by congregate meals (25.4%) and nutrition education (15.5%).
Figure 12.8. Support Services Elders Currently Use vs. Those They Would Consider Using (n = 19,744)

Support services were also assessed across Elders, looking to see which services they currently used (purple), versus those support services they would be willing to use if they became unable to meet their own needs (orange). Services are sorted by overall interest (now use + would use totals).
Elders were most likely to report currently using senior center programs (28.8%), transportation (11.9%), home repair or modification services (7.5%), and home health services (6.7%). If needed, they would be most likely to report using home health services (41.0%), transportation (40.8%), senior center programs (39.1%), and home repair or modification services (34.0%).
They were least likely to be in need of services such as speech therapy, Elder abuse prevention programs, and employment services.
Figure 12.9. Caregiving Services Elders Currently Use vs. Those They Would Consider Using (n = 19,744)

Caregiving services were also assessed across Elders, looking to see which services they currently used (purple), versus those caregiving services they would be willing to use if they became unable to meet their own needs (orange). Services are sorted by overall interest (now use + would use totals).
Elders did not report high percentages for services currently being used, with caregiver programs being the mostfrequently listed service (5.8%), followed by personal care services (5.4%), and homemaker and chore services (4.1%). With regard to services that they would consider using, most were likely to say caregiver programs (36.5%), followed by homemaker and chore services (34.9%), and personal care services (30.3%).
Participants were least likely to report interest in services such as nursing facilities, respite care, and skilled nursing facilities.
Figure 12.10.
(n = 19,744)

Various other services were also examined, looking to see which services Elders were currently using (purple), versus those they would be willing to use if they became unable to meet their own needs (orange). Services are sorted by overall interest (now use + would use totals).
Elders were most likely to report currently using pharmacy services (38.3%), government-assisted housing (6.2%), emergency response systems (5.6%) and financial assistance (5.6%). With regard to services that they would consider using, they were most likely to say pharmacy (43.8%), emergency response systems (36.1%), financial assistance (34.8%), and durable medical equipment (28.5%).
Participants were least likely to report interest in services such as retirement communities, financial planning or counseling, and shared housing.

The Cycle VIII data is a composite of information from many Native Elders across the United States. Within this data lies the stories and unique needs of various different groups. In order to provide a more comprehensive overview of the many Native Elders the data comprises, this chapter provides a one-page overview of descriptive information for 11 different groups. It is hoped that this data will help to provide a summary of some of the characteristics and needs of Native Elders who are featured.
The 11 spotlights cover a wide range of groups, including those who served on active duty, those who regularly reported eating traditional foods, those who reported taking care of grandchildren, as well as those who reported having a disability. Other areas of focus include Native Elders who reported memory issues, those who reported having five or more falls, those with five or more chronic illnesses, and those who lived alone. Finally, information is also presented regarding Native Elders with food insecurity, those who had a family member providing care for them, as well as those who reported socializing.
There were 2,574 Native Elders who reported serving on active duty in the U.S. Armed Forces, Military Reserves, or National Guard.
Approximately 87.3% were male and 12.7% were female. Most Native Elders who reported serving on active duty were 70-79 years old (40.8%), followed by 60-69 years (31.1%), 80+ years (21.8%), and 55-59 years (6.4%).
Figure 13.1. Chronic

The most common chronic conditions among Native Elder veterans were high blood pressure (62.5%), arthritis (41.3%), and diabetes (39.6%). Approximately 11.1% of veterans reported not having any chronic conditions.
With regard to barriers to healthcare, 7.3% of Native Elder veterans were most likely to report that distance from a healthcare facility kept them from receiving care. This was followed by 7.3% who reported a long wait time for appointments, 6.4% who lacked transportation, and 6.3% who indicated that cost was a barrier.
Approximately 36.6% of Native Elders who served on active duty reported being diagnosed with a disability. Approximately 42.2% of those who were diagnosed with a disability reported being disabled while serving in the military.
13.2.

Approximately 38.2% of Native Elder veterans reported being overweight; 39.0% reported being obese.
Over half (51.0%) of Native Elder veterans reported that they engaged in walking as a form of exercise. Approximately 36.5% reported yard work and 12.4% reported gardening as a form of exercise.

Over 55.0% of Native Elders who served on active duty reported a good nutritional status. When reporting different factors that impacted Native Elder veterans’ nutrition, 36.2% reported taking three or more different prescription or OTC drugs per day. Twenty-five percent reported eating alone most of the time, and 23.7% reported eating fewer fruits, vegetables, or milk products.
There were 6,376 Native Elders who reported both having access to traditional foods as well as regularly consuming them.
Approximately 36.5% of these Native Elders were male and 63.5% were female. Most Native Elders were between 60-69 years old (44.5%), followed by those who were 70-79 years (31.1%), 80+ years (13.5%), and 55-59 years (10.9%).
Most Native Elders who reported regularly consuming traditional foods did so between one to two times per week (57.1%), with 26.4% reporting they ate traditional foods three to four times per week. Approximately 16.5% reported eating traditional foods five or more times per week.
Among Native Elders who reported regularly consuming traditional foods, most said their health was good (41.2%); this was followed by those who said their health was fair (25.4%), very good (21.4%), or poor (6.2%). Approximately 5.8% said their health was excellent.
Chronic Conditions
Figure 13.4. Chronic Conditions

Approximately 88.1% of Native Elders who reported regularly eating traditional foods reported one or more chronic health conditions. High blood pressure was the most common chronic condition (56.4%), followed by arthritis (45.5%) and diabetes (36.7%).
Cultural participation levels of Elders who regularly consumed traditional foods were also assessed. Most Elders reported participating in cultural practices some of the time (49.1%), followed by 15.3% who did so most of the time, and 11.9% who reported participating all of the time. The remaining 23.7% never participated in cultural practices.
Nearly 30.0% of Native Elders who regularly ate traditional foods reported being diagnosed with a disability. Of these, 36.3% reported being disabled due to chronic illness, followed by accident or injury (30.5%), military service (8.4%), and congenital causes (4.1%). Approximately 29.9% reported that they were disabled due to other causes.
Figure 13.5. Causes of Disability

Most Native Elders who regularly consumed traditional foods reported that they did not smoke cigarettes (79.1%). Among those who reported smoking, 15.6% smoked every day, while 5.3% smoked some days. Of Native Elders who smoked cigarettes, most smoked 1-10 cigarettes (71.6%).
Only 3.2% of Native Elders who regularly consumed traditional foods used chew or snuff. Of these, 45.7% reported using one can of chewing tobacco per week, with 27.2% using two containers per week, and 27.2% using three or more containers per week.
There were 5,621 Native Elders who reported that they took care of grandchildren.
Approximately 28.7% of Native Elders who took care of grandchildren were male and 71.3% were female. Most were between the ages of 60-69 years old (51.6%), followed by 70-79 years (27.7%), 55-59 years (14.1%), and 80+ years (6.6%). Almost 34.0% reported being the primary caregiver of their grandchildren.
Figure 13.6. Chronic Conditions

Approximately 88.1% of Native Elders who took care of grandchildren reported one or more chronic conditions. High blood pressure was the most common chronic condition (56.9%), followed by arthritis (45.5%) and diabetes (41.1%).
Approximately 33.0% of Native Elders who took care of grandchildren were overweight; 48.9% were obese. Most Elders (57.7%) reported walking as a form of exercise, followed by yard work (34.7%), and gardening (13.9%). Approximately 21.9% reported not engaging in any exercise activities.
The majority of Native Elders who reported taking care of their grandchildren said they participated in cultural practices some of the time (47.2%). This was followed by 31.5% who said they never did, 12.8% who did so most of the time, and 8.5% who participated all of the time.
Figure 13.7.

Nearly 27.0% of Native Elders who took care of grandchildren reported being diagnosed with a disability. Of those Native Elders who reported being diagnosed with a disability, 37.6% were disabled due to chronic disease, followed by accident or injury (29.1%), military service (7.1%), and congenital causes (3.7%). Another 30.5% reported that they were disabled due to other causes.
Figure 13.8. Nutritional

Over 51.0% of Native Elders who took care of grandchildren reported a good nutritional status. Approximately 31.2% reported taking three or more different prescribed or over-the-counter (OTC) drugs per day.
There were 4,903 Native Elders who reported having a disability. Approximately 41.5% were male and 58.5% were female. Most were between 60-69 years old (45.8%), followed by 70-79 years (29.6%), 55-59 years (12.4%), and 80+ years (12.2%).
13.9.

When asked about the cause of their disability, 36.4% of Native Elders with a disability reported it was due to chronic disease. Approximately 28.8% reported their disability was due to an accident or injury, followed by 7.3% due to military service, and 4.4% congenital causes. Approximately 30.8% of Native Elders with a disability said they were disabled due to other causes.
Healthcare Barriers
Figure 13.10. Barriers

When asked about barriers to healthcare, 52.0% of Native Elders with a disability reported that they did not face any barriers in receiving healthcare. However, approximately 13.9% of Native Elders reported a lack of transportation, followed by distance (12.0%), and too long of a wait for an appointment (11.5%).
Figure 13.11. Chronic Conditions

Approximately 96.3% of Native Elders with a disability reported one or more chronic conditions, with 65.1% reporting high blood pressure, followed by arthritis (59.9%), and diabetes (49.0%).
Approximately 61.0% of Native Elders with a disability reported having a health problem where they needed to utilize special equipment, such as a cane or a wheelchair.
Approximately 49.7% of Native Elders with a disability were obese; 27.9% were overweight, and 22.4% were neither overweight or obese.
Approximately 46.8% of Native Elders with a disability reported walking as a form of exercise, followed by yard work (23.9%) and gardening (10.0%). Approximately 34.3% reported they did not exercise. Of those Elders who exercised, 52.7% reported exercising one to two times per week.
Most Native Elders with a disability (74.6%) reported socializing at least once a month. Approximately 52.8% reported having a family member who provided care for them. Approximately 78.8% reported having someone that they could depend on to provide physical support, while 82.0% reported having someone they could depend on to provide social support.
There were 1,913 Native Elders who reported having problems with memory or thinking. Within this group, 7.1% reported having Alzheimer’s Disease, 19.2% had dementia, and 82.5% reported having other problems with memory or thinking.
Approximately 40.7% of Native Elders with memory issues were male and 59.3% were female. Most were between 60-69 years old (35.3%), followed by 70-79 years (30.3%), 80+ years (25.9%), and 55-59 years (8.5%).
Figure 13.12. Issues with Memory or Thinking
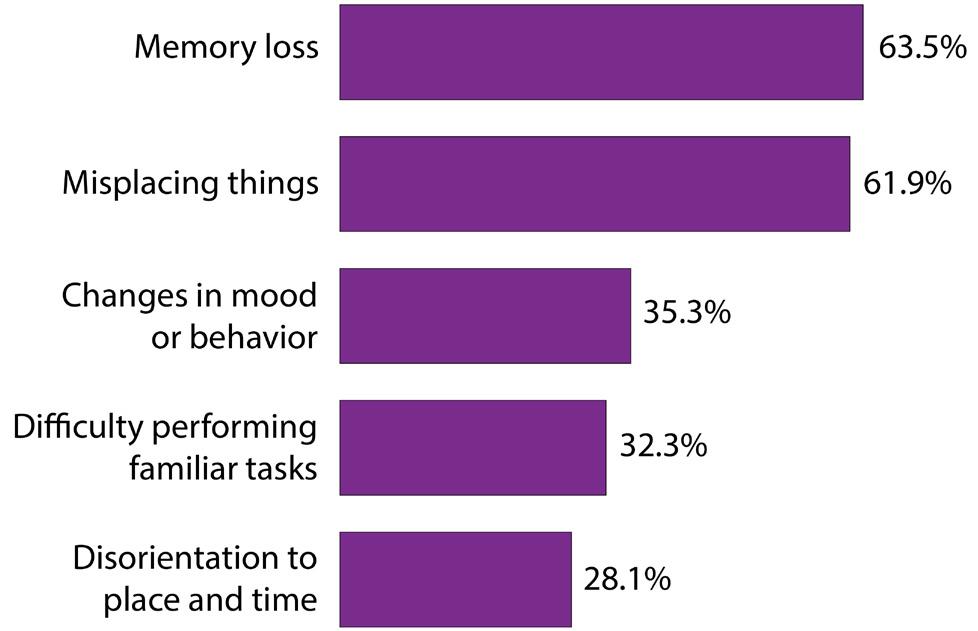
Among Native Elders who had problems with memory or thinking, memory loss was the most common issue experienced (63.5%), followed by misplacing things (61.9%), and changes in mood or behavior (35.3%).
When asked to rate their quality of life in the past month, most Elders with memory issues reported that it was good (34.6%) or fair (32.4%), followed by very good (20.0%), and poor (7.8%). Only 5.2% reported that it was excellent.
Most Native Elders with memory issues reported socializing at least once a month (74.6%).
Approximately 60.4% reported living with other family members, while 30.5% reported living alone. About 59.1% of Native Elders with memory issues reported having a family member who provided care for them.
Most Native Elders with memory issues reported that they had someone they could depend on to provide physical support (76.8%) as well as social support (80.2%).
Figure 13.13. Chronic Conditions

Approximately 94.3% of Native Elders with issues with memory or thinking also reported having one or more chronic conditions. The most common chronic condition among Elders with memory or thinking problems was high blood pressure (63.1%), followed by arthritis (53.3%), and diabetes (45.2%).
Figure 13.14. Causes of Disability

Approximately 54.3% of Native Elders with memory or thinking issues reported having a disability. The most common cause of disability was chronic disease (37.6%), followed by accident or injury (32.0%), military service (7.7%), and congenital (6.0%). The remaining 29.6% reported other causes.
There were 1,113 Native Elders who reported having five or more falls. Approximately 40.6% were male and 59.4% were female. Most Native Elders who experienced five or more falls were 60-69 years old (40.8%), followed by 70-79 years (30.5%), 80+ years (15.4%), and 55-59 years (13.3%).
Within this group, most reported experiencing between five and eight falls (62.1%), followed by 9-12 falls (24.8%), and 13 or more falls (13.1%).
Approximately 90.8% of Native Elders who experienced five or more falls reported that they were worried about falling down. Approximately 49.5% reported experiencing an injury due to falling that required medical treatment.
Most Native Elders reporting five or more falls said that their health was fair (41.0%). This was followed by 26.6% who said their health was good, and 23.2% who reported it as poor. Only 7.4% and 1.8% said their health was very good or excellent, respectively.
Figure 13.15. Most Common Difficulties with ADLs

Approximately 76.0% of Native Elders who had five or more falls reported experiencing difficulties with activities of daily living (ADLs). The most common difficulty listed was walking (65.2%). This was followed by bathing and showering (42.7%), getting in and out of bed (35.0%), and dressing (31.8%).
Figure 13.16. Causes of Disability

Approximately 59.1% of Native Elders who had five or more falls reported being diagnosed with a disability. The most common cause of disability was due to chronic disease (39.2%), followed by accident or injury (33.9%), military service (6.6%), and congenital causes (5.2%). The remaining 29.2% reported their disability was due to other causes.
Approximately 29.8% of Native Elders who had five or more falls were overweight; 44.6% were obese. The most common form of exercise was walking (43.8%), followed by yard work (23.1%), and gardening (11.1%). Approximately 35.3% reported that they did not engage in any exercise activities.
Most Native Elders who had five or more falls reported socializing at least once a month (72.1%). Approximately 57.1% reported living with other family members, while 34.3% reported living alone.
Most Native Elders who had five or more falls reported that they had someone they could depend on to provide physical support (78.2%) as well as social support (78.5%).
When asked to rate their quality of life, most Native Elders who had five or more falls reported it was fair (35.3%); this was followed by 30.1% who said good, and 18.9% who reported it was very good. Approximately 9.2% indicated their quality of life was poor, and 6.5% said it was excellent.
There were 2,059 Native Elders who reported having five or more chronic illnesses. Among them, 27.7% were male, and 72.3% were female. Most were between the ages of 60-69 years (39.0%), closely followed by those 70-79 years (35.9%), 80+ years (16.8%), and 55-59 years (8.3%).
Health Status
Figure 13.17. Self-Reported Health

Most Native Elders with five or more chronic conditions indicated that they were in fair health (42.4%). Another 29.6% said their health was good, while 20.6% reported that they were in poor health.
Among Native Elders who reported having five or more chronic illnesses, most reported having high blood pressure (91.1%), arthritis (89.6%), and diabetes (72.8%). This was followed by 62.3% who reported cataracts, 49.3% with depression, and 47.4% with asthma.
Healthcare Barriers
Figure 13.18. Barriers

When asked about barriers to healthcare, 48.4% of Native Elders with five or more chronic conditions reported that they did not face any barriers in receiving healthcare. However, approximately 14.5% reported a lack of transportation, followed by too long of a wait for an appointment (12.9%), and distance (12.7%).
Most Native Elders with five or more chronic illnesses reported having between one and four falls (56.9%), although one-quarter did not report any falls (25.0%). About 10.8% reported five to eight falls, and 5.1% reported 9-12 falls. Approximately 2.2% reported 13 or more falls.
Figure 13.19. Percentage of Native Elders Reporting Difficulty with Activities of Daily Living

Native Elders with five or more chronic illnesses were most likely to report difficulty with doing heavy housework (65.4%), followed by walking (55.8%), doing light housework (36.2%), and bathing or showering (35.3%).
Over half (57.4%) of Native Elders with five or more chronic illness had been diagnosed with a disability. Most reported that it was due to chronic disease (48.5%), followed by other causes (30.1%), accident or injury (28.6%), military service (6.2%), and congenital causes (4.1%).
There were 5,847 Native Elders who reported living alone. Among them, 36.1% were male and 63.9% were female. Most were between the ages of 60-69 years (42.8%), followed by 70-79 years (32.7%), 80+ years (15.5%), and 55-59 years (9.0%).
Most Native Elders who lived alone reported that they had not had a fall in the past year (45.8%), although this was closely followed by 45.6% who had one to four falls. About 5.5% had between five and eight falls; 2.2% had 9-12 falls, and 1.0% had 13 or more falls.
Close to one-third of Native Elders who lived alone had been diagnosed with a disability (30.9%). Chronic disease was the most commonly listed reason (35.1%), followed by other reasons (30.6%), accident or injury (29.1%), military service (6.8%), and congenital causes (4.5%).
Close to one-third of Native Elders living alone reported having a family member who provided care for them (28.0%). About 15.3% reported taking care of grandchildren; 2.3% were their primary caregiver.
Most Elders who lived alone had a good nutritional status (45.8%), although 29.1% were at a moderate risk, and 25.1% were at a high nutritional risk.
Figure 13.20. Participation in Cultural Practices

When asked how often they participated in cultural practices, most Native Elders reported that they did so some of the time (44.7%), or none of the time (40.3%). Only 9.1% reported doing so most of the time. Six percent did so all of the time.
Figure 13.21. Number of Times Socialized in Past Month

Native Elders who lived alone reported that, on average, they socialized three to four times a month (21.7%), followed by 20.7% who did so one to two times per month.
Figure 13.22. Support Services Currently Used Versus Would Use

When asked to select which support services they were using, Native Elders living alone were most likely to report pharmacy services (39.5%), home-delivered meals (34.5%), and senior center programs (31.1%). If at some point they became unable to meet their own needs, most reported that they would be willing to use home-delivered meals (72.2%), transportation (44.9%) and pharmacy (44.0%) services.
There were 7,177 Native Elders who reported that they had a family member who was providing care for them.
Approximately 36.8% were male and 63.2% were female. Most were between the ages of 60-69 years (36.3%), followed by 70-79 years (33.7%), 80+ years (22.1%), and 55-59 years (7.9%). With regard to marital status, 37.9% reported being married or living with a partner, followed by 30.1% who were widowed.
Figure 13.23. Percentage of Native Elders Reporting Memory Issues

Only 1.3% of Native Elders who had a family member providing care for them reported having Alzheimer’s Disease; 3.6% reported dementia, and 12.0% had other problems with memory or thinking.
Among Native Elders who had a family member providing care for them, 40.4% reported having a disability.
Figure 13.24. Causes of Disability

Most Native Elders reported that their disability was due to chronic disease (40.2%), followed by other causes (29.4%), accident or injury (27.3%), military service (6.4%), and congenital causes (4.6%).
Many Native Elders who reported having a family member provide care for them had a good nutritional status (45.8%). There were 30.2% who were at a moderate nutritional risk, however, and 24.0% who were at a high nutritional risk.
Figure 13.25. Quality of Life in Past Month

Most Native Elders who reported a family member was caring for them rated their quality of life as good (36.6%), followed by very good (28.4%), or fair (22.2%).
Figure 13.26. Living Arrangement

Most Native Elders who reported that a family member was caring for them indicated that they lived with family members (71.7%), although about one quarter reported living alone (23.0%).
There were 1,898 Native Elders who reported having food insecurity. For this spotlight, those with food insecurity were defined as those who indicated “Yes” to the statement “I don’t always have enough money to buy the food I need.”
Among Native Elders with food insecurity, 33.3% were male and 66.7% were female. Most were between the ages of 60-69 years (49.4%), followed by 70-79 years (28.3%), 55-59 years (14.1%), and 80+ years (8.3%).
Most reported an income of $10,000-$15,000 (22.7%), although 21.1% also reported an income of $5,000 or less. One third of Native Elders with food insecurity reported taking care of their grandchildren (35.8%); 13.6% were their primary caregivers.

Most Native Elders who reported having food insecurity were at a high nutritional risk (81.7%). An additional 18.3% were at a moderate nutritional risk; there were none who had a good nutritional status.
Among those who reported having food insecurity, 61.1% reported that they cut the size of their meals or skipped meals in the last 12 months because there wasn’t enough money for food. Similarly, 58.4% ate less than they should because there wasn’t enough money for food, and 47.2% indicated that they were hungry but didn’t eat because they did not have enough money in the past 12 months.
When asked if they could not afford to eat balanced meals in the last 12 months, 44.0% indicated this was often true, followed by 43.8% who said it was sometimes true, and 12.2% who reported that it was never true.
Figure 13.28.

Among Native Elders with food insecurity, 44.3% reported eating fewer fruits, vegetables, or milk products. Another 29.2% ate fewer than two meals per day, and 23.8% were not physically able to shop, cook, or feed themselves.
In addition to those listed in Figure 13.28, 42.4% reported eating alone most of the time, and 34.3% reported having an illness or condition that changed the kind or amount of food eaten.
Figure 13.29. Access to and Consumption of Traditional Foods

Close to two-thirds of Native Elders with food insecurity reported having access to traditional foods (61.3%). About 44.0% reported regularly consuming traditional foods, however. When asked how often they consumed traditional foods, most Native Elders with food insecurity indicated between one to two times per week (68.6%), followed by three to four times a week (20.2%), and 11.2% who did so five or more times per week.
There were 13,415 Native Elders who reported socializing. Approximately 34.1% were male, and 65.9% were female. Most were between the ages of 60-69 years (44.0%), followed by 70-79 years (30.9%), 80+ years (13.4%), and 55-59 years (11.6%).
General Health Status
Figure 13.30. Self-Reported Health

Most Native Elders who socialized reported that their health was good (41.2%), followed by 25.8% who said their health was fair or very good (22.1%).
Cultural Practices
Figure 13.31. Most Frequently Reported Cultural Practices

Most Native Elders who socialized reported engaging in cultural activities such as powwows (33.7%), consuming (29.6%) or preparing (23.9%) cultural or traditional foods, and smudging (22.3%).
Figure 13.32. Feelings of Happiness in Past Month

Native Elders who socialized reported feeling happy most of the time (56.8%); this was followed by 21.8% who reported being happy all of the time, and 20.2% who were happy some of the time.
Figure 13.33. Perceptions of Physical and Social Support

Native Elders were also asked about feelings of support. When asked if they felt as though they had someone they felt like they could depend on to provide physical support to them, 77.7% of those who reported socializing said this was the case. When asked if they had someone to depend on to provide social support, 84.5% indicated this was true.

In order to illustrate the unique needs of Cycle VIII Native Elders, this chapter highlights several different comparisons across multiple datasets. Throughout these pages, many of the data points are compared to the National Urban Elder Needs Assessment Survey (NUENAS 1.0), which explores similar questions among urban Native Elders. Several figures and tables also contain information from national tribal data, which comes from multiple years of Behavioral Risk Factor Surveillance System Survey Data (BRFSS). When available, national data was also drawn from several different datasets for comparison; this included data sets such as BRFFS, the National Health and Nutrition Examination Survey Data (NHANES), the National Post-Acute and Long-Term Care Study (NPALS), as well as the U.S. Census Bureau’s Census of Population and Housing.
Given the number of survey questions, it was not always possible to find corresponding questions in other data sets; because of this, not all comparisons are available for all items. Additionally, for some figures and tables, please note that not all question items are listed, and that some questions allowed Elders to select more than one response; as a result, not all percentages may add to 100.0%.
Gender
Figure 14.1. Gender of Native Elders

Ethnicity
Figure 14.2. Ethnicity of Native Elders

Age
Figure 14.3. Age of Native Elders

Active Duty
Figure 14.4. Active Duty in U.S. Armed Forces, Military Reserves, or National Guard

Education
Figure 14.5. Highest Grade or Year of School Completed

Annual Income
Figure 14.6. Personal Annual Income

Figure 14.7. Self-Reported General Health Status

Table 14.1. Prevalence of Chronic Illnesses
Figure 14.8. Number of Times Stayed in Hospital Overnight or Longer During Past 12 Months

Table 14.2. Length of Time Since Last Visited Doctor/Healthcare Provider for a Routine Checkup
Table 14.3. Length of Time Since Last Mammogram? (For Women Only) Response
Table 14.4. Length of Time Since Last Pap Smear? (For Women Only) Response
Table 14.5. Length of Time Since Prostate-Specific Antigen Test (PSA; For Men Only)
Optometrist
Figure 14.9. Seen Eye Doctor in Past Year

Hearing Test
Figure 14.10. Hearing Test in Past Year

Dental Care
Figure 14.11. Seen Dentist or Dental Hygienist in Past Year

Barriers to Dental Care
Table 14.6. Reasons For Not Getting Needed Dental Care
Trouble Seeing
Figure 14.12. Trouble Seeing With One or Both Eyes (Even When Wearing Glasses or Contact Lenses?)

Trouble Hearing
Figure 14.13. Trouble Hearing (Even When Wearing Hearing Aid)?

Unable to Get Dental Care
Figure 14.14. Needed Dental Care but Unable to Get It In Past Year

Table 14.7. Type of Healthcare Coverage
Table 14.8. Places Went When Sick or In Need of Professional Advice About Health
Table 14.9. Barriers to Medical Care in the Past 12 Months
Figure 14.15. Currently Smoke Cigarettes

Table 14.10. Cigarettes Smoked Per Day
Figure 14.16. Use Chewing Tobacco or Snuff

Table 14.11. Number of Days in Past Month Had Five or More Drinks On Same Occasion
Table 14.12. Length of Time Since Last Alcoholic Beverage
I have never had an alcoholic drink in my life
Figure 14.17. Regularly Consume Traditional Foods

Nutritional Health
Table 14.13. Nutritional Health Assessment Response
Figure 14.18. Frequency of Consuming Traditional Foods

I have an illness or condition that made me change the kind and/or amount of food I eat.
I eat fewer than two meals per day.
I eat few fruits or vegetables or milk products.
I have three or more drinks of beer, liquor, or wine almost every day.
I have tooth or mouth problems that make it hard for me to eat.
I don’t always have enough money to buy the food I need.
I eat alone most of the time.
I take three or more prescribed or OTC drugs a day.
Without wanting to, I have lost or gained 10 pounds in the last six months.
I am not always physically able to shop, cook, and/or feed myself.
Nutritional Category
Figure 14.19. Nutrition Category (Calculated Based on Items Relating to Nutritional Health)
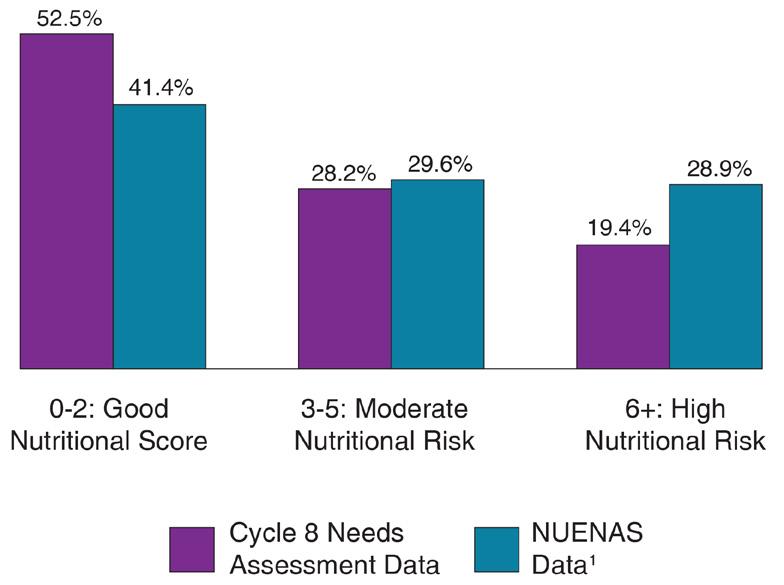
BMI Categories
Figure 14.20. Body Mass Index (Based on Reported Height and Weight)

Food Didn’t Last
Figure 14.21. Food Didn’t Last and Didn’t Have Money to Get More (How Often True in Past 12 Months)

Figure 14.22. Cut Size of Meals or Skip Meals Because Not Enough Money for Food (In Past 12 Months)

Eat Less Than Should
Figure 14.23. Ate Less Than Should Because Not Enough Money For Food (In Past 12 Months)

Figure 14.24. Could Not Afford to Eat Balanced Meals (How Often True in Past 12 Months)

Table 14.14. How Often Cut Size of or Skipped Meals in Last 12 months (Among Those Who Reported Doing So)
Hungry but Didn’t Eat
Figure 14.25. Hungry but Didn’t Eat Due to Lack of Money (In Past 12 Months)

Take Care of Grandchildren
Figure 14.26. Take Care of Grandchildren

Social Support
Figure 14.27. Have Someone Who Can Depend On to Provide Social Support

Socialization
Table 14.15. Frequency of Socializing
Primary Caregiver of Grandchildren
Figure 14.28. Primary Caregiver of Grandchildren

Physical Support
Figure 14.29. Have Someone Who Can Depend On to Provide Physical Support

Family Member Caregiver
Figure 14.30. Family Member Who Provides Care

Table 14.16. Present Type of Housing
Time at Present Address
Figure 14.31. Length of Time Lived At Present Address

Average Number in Household
Figure 14.32. Average Number of Individuals in Household (Including Self)

Living Situation
Figure 14.33 Living With Family Members, Non-Family Members, or Alone

Average Children in Household
Figure 14.34. Average Number of Children Younger Than 18 Years Living in Household (Among Households With Children)

Figure 14.35. Memory Diagnoses

Table 14.17. Memory Issues Experienced During the Past 12 Months
Disability
Figure 14.36. Diagnosed with Disability

Figure 14.37. Reason for Disability

Table 14.18. Currently Using Support Services
Table 14.19. Services Willing To Use If Became Unable to Meet Own Needs
1. Coalition on Urban Indian Aging. (2023). Native Urban Elder Needs Assessment (NUENAS 1.0). https://www. nrcnaa.org/assets/5498-25290/nuenas-final-report.pdf
2. Center for Disease Control and Prevention. (2015, 2017, 2019, 2020). Behavioral Risk Factor Surveillance System Survey Data (BRFFS). Atlanta, Georgia: U.S. Department of Health and Human Services.
3. Center for Disease Control and Prevention. (2013-2014; 2017-2018). National Health and Nutrition Examination Survey Data (NHANES). Atlanta, Georgia: U.S. Department of Health and Human Services.
4. Center for Disease Control and Prevention. (2018). National Post-Acute and Long-Term Care Study (NPALS). Retrieved October 8, 2021 from https://www.cdc.gov/nchs/npals/questionnaires.htm.
5. Center for Disease Control and Prevention. (2003-2006). National Health and Nutrition Examination Survey Data (NHANES). Atlanta, Georgia: U.S. Department of Health and Human Services, Centers for Disease Control and Prevention.
6. Center for Disease Control and Prevention. (2002). Behavioral Risk Factor Surveillance System Survey Data (BRFFS). Atlanta, Georgia: U.S. Department of Health and Human Services, Centers for Disease Control and Prevention.
7. U.S. Census Bureau. (2000). Census of Population and Housing. United States Department of Commerce. Retrieved from http://www.census.gov.

For several of the survey questions, Native Elders were given the option to write in a response, such as when they selected “Other” as a survey response. These write-in responses were then examined and qualitatively coded based on theme. For many of the write-in responses, there were some Elders who wrote multiple responses or responses that fit into multiple themes. As a result, this is why the total for many of the responses is larger than the initial count, although both numbers are cited for each as reference.
When interpreting the results, it is important to note a few potential limitations. First, there may be some overlap between the items on the survey and the corresponding write-in responses. For example, in the question corresponding with Table 15.4, Native Elders were asked to list the type of dental care they currently needed; they could select from various options including getting teeth filled or replaced, teeth pulled, gum treatment, and denture work, among others. In their write-in responses, some Elders list these same answers (e.g., they wrote that they needed denture work). It is possible that they may not have seen the initial item in the list, or may instead be using the write-in response to expand upon their initial selection. As a result of this, there may be some overlap or repetitiveness between the frequency results and the corresponding write-in responses.
In addition, for many questions, there were usually several Native Elders who indicated that the item being discussed was not applicable. Unless otherwise specified, these responses were included when calculating overall percentages of qualitative themes.
It is also worth noting that there is likely some overlap between some of the qualitative categories listed. Attempts were made to concisely organize responses into categories based on what was interpreted as the main theme of the write-in response, however it is possible the original intent of the writing was misunderstood, or could have been better-classified. Because of this, the qualitative summaries listed in the subsequent pages are not perfect, but are a good-faith attempt to summarize and provide a voice to the Native Elders who took the time to share their thoughts, views, and opinions.
Are you American Indian, Alaska Native, Native Hawaiian, Descendant, or other?
Other (Please Specify)
Table 15.1 Write-In Responses for Ethnicity
There were 753 Native Elders who wrote in a response regarding their ethnicity; these answers were separated into 799 responses.
Responses were organized into categories, with the understanding that each of the ethnicities and cultures within each category are distinctly unique. Responses were only grouped together as a way to broadly categorize results.
Among those who wrote in a response, the most common answer was White (30.5%); this was followed by 29.8% of Native Elders who identified as Native American, Indian, or Indigenous.
About 9.8% of Native Elders reported being Scandinavian/European; these included ethnicities such as German, English, French, Scottish, Norwegian, Polish, Belgian, Danish, and Dutch, among others. A similar percentage reported being Hispanic, Mexican, Latino, Mayan, or Aztec (9.1%).
An additional 6.1% wrote in unclear responses.
Many Native Elders listed the ethnicity of their spouse (5.9%). Most (n = 35) said their spouse was Native American; eight reported having a White/ Native American spouse; two had a spouse that was an Alaska Native; and one each reported having a spouse that was White, as well as one that was White and Alaska Native.
About 3.4% of Native Elders reported being Asian. Ethnicities included Filipino, Japanese, Chinese, and Vietnamese. This was followed by 1.9% who were Black or African American; 1.0% who listed themselves as American; 0.6% who reported being Alaska Natives; and 0.5% who were from Cape Verde.
Less commonly cited responses included descendants (0.4%), Pacific Islanders/Native Hawaiians (0.4%), South American, such as Brazilian or Columbian (0.3%); Caribbean, such as from Cuba and Puerto Rico; as well as 0.1% who were Russian.
If Applicable, What Were the Main Reasons You Did Not Work in the Past 12 Months?
Other (Please Specify)
Table 15.2. Write-In Responses for Reasons Not Worked in Past 12 Months
There were 808 Native Elders who wrote in a response regarding the main reasons they did not work in the past 12 months; these answers were separated into 813 responses.
Among those who wrote in a response, most Native Elders listed medical reasons and/or disabilities as the primary reason they did not work in the past year (18.2%). This was followed by 13.8% who reported that they were either currently working or were self-employed.
About 10.2% of Native Elders reported they hadn’t worked in the past year due to COVID; age was also another commonly mentioned reason (8.9%). About 6.5% indicated that there was no reason or the question was not applicable, and 5.7% wrote in a response that was unclear or unknown.
Caregiving for family members accounted for 5.3%, whereas an additional 5.3% listed that they were retired. About 4.8% of Native Elders indicated that they were not currently working due to either being terminated, suspended, or laid off; an additional 3.9% reported their work was seasonal or temporary.
Other reasons included personal choice, such as not being interested in working (3.8%); being unable to find a job and/or jobs not being available (3.2%); lack of transportation (2.5%); or being unemployed or unable to work (1.8%).
An additional 1.5% mentioned that they may not be qualified for the position; this was followed by 1.2% who were receiving benefits such as social security. About 1.1% were not working due to mental health concerns.
Less common reasons included family/personal reasons (0.6%); relocation (0.6%); having issues with their employer (0.5%); weather (0.4%) and drugs or alcohol (0.2%).
Has a Doctor Ever Told You That You Had Any of the Following Diseases?
Other (Please Specify)
Table 15.3. Write-In Responses for Diseases
There were 2,063 Native Elders who wrote in a response regarding the diseases they experienced; these answers were separated into 2,426 responses.
Responses covered a wide array of conditions and diseases that were broadly classified into the categories shown in Table 15.3.
Among those who wrote in a response, heart and vascular disease was the most prominent (14.1%); this category includes conditions such as atrial fibrillation, pacemakers, heart disease, heart attacks, as well as high cholesterol and aneurysms.
The next most frequently reported group was autoimmune/immune conditions (7.7%). Specific conditions within this group included rheumatoid arthritis, lupus, Sjogren’s syndrome, Grave’s disease, fibromyalgia, as well as allergies and asthma, among others.
Kidney-related issues were third most common (7.3%); this included conditions such as kidney disease, failure, transplant, as well as kidney cancer. This was followed by chronic obstructive pulmonary disease (COPD; 6.6%); and thyroid-related conditions such as thyroid cancer and hypo/hyper-thyroidism (4.7%).
Issues affecting Native Elders’ spine, back, neck and shoulders were also frequently mentioned (4.0%) - specific issues within this group included spinal stenosis, degenerative discs, and general back problems, among others. This was followed by about 4.0% of responses which were unknown, in which the medical issue being described was unclear.
Problems affecting colon and the digestive system were also cited (3.6%); this category contains conditions such as colitis, colon cancer, celiac disease, irritable bowel syndrome, as well as pancreatitis and gallbladder issues, among others.
Table 15.4. Write-In Responses for Needed Dental Care
There were 1,914 Native Elders who wrote in a response regarding the dental care they currently needed; these answers were separated into 1,950 responses.
Among those who wrote in a response, most Native Elders reported that they needed a cleaning and/or dental exam (55.9%). This was followed by approximately 11.9% who said they needed implants, and 9.9% who indicated they required dentures or maintenance on their dentures.
Partials were also frequently mentioned (4.5%); this value was followed by 2.8% of responses which were classified as unknown, as the dental care being described was unclear.
Approximately 2.7% of Native Elders indicated needing restorative work, followed by root canals (2.2%). Other care needed included crowns and crown maintenance (1.3%); bridges and bridge maintenance (1.2%); needing teeth pulled (1.2%); and other non-specific requests (1.1%).
Fillings were reported by 1.0% of Native Elders, followed by another 1.0% who indicated they did not need any dental services. About 0.8% indicated tooth loss, and 0.7% reported needing a night guard for grinding teeth or further intervention for their TMJ (temporomandibular joint) dysfunction.
About 0.6% of Native Elders indicated needing dental care for periodontal disease and gum care; followed by 0.4% who listed whitening; 0.3% requiring surgery; and an additional 0.3% who needed teeth alignment.
What Were the Reasons That You Could Not Get the Dental Care You Needed?
Other (Please Specify)
Table 15.5. Write-In Responses Reasons Unable to Get Needed Dental Care
There were 2,480 Native Elders who wrote in a response regarding the reasons why they were unable to get the dental care they needed; these answers were separated into 2,515 responses.
Among those who wrote in a response, most reported that the pandemic was the main reason for issues in receiving dental care (20.9%); many said that their dentist office was closed or had limited service and appointments available because of it.
About 20.0% of respondents indicated that there were no reasons and they did not currently need any dental care. This was closely followed by 19.2% who said they could not get needed dental care due to lack of availability or long wait times. Another 6.4% reported having a variety of medical issues or concerns that impaired their ability to get dental care, such as surgery, Alzheimer’s and dementia, or high blood pressure.
Approximately 5.3% of Native Elders reported that their dentist had a staff shortage that affected their ability to get care; followed by issues in scheduling appointments or cancellations (4.7%).
Many Native Elders also mentioned having or needing dental prosthetics (4.1%); this was followed by issues with insurance (2.7%); transportation (2.7%); and unknown reasons that were unclear (2.2%).
Additional reasons included personal scheduling conflicts (2.1%); feeling lazy and not wanting to go (1.8%); anxiety or fear (1.4%); the dentist office being closed (1.4%); and care being unavailable or the dentist being unable to offer help for their particular concern (1.0%).
Less-cited reasons included other responses (0.8%); missed appointments (0.8%); the problem not being emergent enough (0.7%); waiting on referrals (0.6%); not being treated well or their dentist making mistakes (0.5%); the weather (0.4%); and being unaware of where to go (0.3%).
Table 15.6. Write-In Responses for Causes of Disability
There were 1,251 Native Elders who wrote in a response regarding the reasons why they were disabled; these answers were separated into 1,394 responses.
Among those who wrote in a response, the most commonly listed reason for disability among Native Elders was issues relating to their spine, nerves, or back (10.1%), such as having a bad back, pinched nerves, spinal stenosis, or neuropathy. Brain-related conditions were also frequently listed (9.5%); these included conditions such as stroke, aneurysms, and traumatic brain injuries.
Mental health was the third-most common cause (8.8%), consisting of issues such as PTSD, mental illness, depression, as well as abuse. Other responses were frequently listed at 7.6%; followed by arthritis and conditions such as bone loss (7.0%).
Many Native Elders also cited having bad knees or needing knee replacement (5.8%); this was followed by disability that was work-related (4.7%); having vision and hearing issues and/or vertigo (4.7%); and heart related issues such as heart disease or heart failure (4.5%).
Aging was listed as the cause of disability for 4.2% of Native Elders; followed by cancer or tumors (3.8%) - most instances in this category were non-specific, although some listed colon cancer, breast cancer, or brain tumors. Autoimmune conditions such as rheumatoid arthritis, multiple sclerosis, lupus, Guillain-Barré syndrome, and fibromyalgia were listed by 3.4% of Native Elders.
Another 2.9% of Native Elders listed diabetes; followed by hip issues or replacement (2.9%); lung problems such as asthma, chronic obstructive pulmonary disease (COPD), or lung cancer (2.9%); or that the disability was the result of an accident (2.5%).
There were 1,173 Native Elders who wrote in a response regarding the type of healthcare coverage they had; these answers were separated into 1,176 responses.
Among those who wrote in a response, several Native Elders reported that their healthcare coverage was Medicaid (23.0%), where the patient has set benefits covered by the plan and the provider submits individual claims for reimbursement. This was followed by Medicare (16.8%), which was comprised of programs such as Medicare Advantage Plans, Military Medicare Wrap Around, and Medicare Supplements.
Private insurance was also frequently mentioned (16.0%), followed by employer health plans (11.3%). Retirement programs were reported by 7.4% of Native Elders; this category included responses such as veteran services and VA retirement plans, military retiree plans, as well as employee retirement plans.
Approximately 3.3% of Native Elders utilized a plan that was either Medicaid or Medicare, but could not be determined without further information, as the carrier listed provided both types of insurance. An additional 3.1% had responses which were unclear or could not be determined without further information and were categorized as unknown.
About 2.8% reported having a tribal employment plan, followed by 1.5% who had a medical savings plan, or other type of insurance (1.4%). An additional 1.4% did not report having any insurance coverage or were unsure. About 1.0% reported having prescription, vision, and/or dental coverage, followed by 0.6% who had an unknown non-IHS insurance (either employer insurance or Medicaid), and 0.3% who were enrolled in a marketplace plan.
There were an additional 10.0% (n = 118) of Native Elders who wrote in Tribal IHS as healthcare coverage (not pictured in table). There is a common misconception of IHS being an insurance coverage plan. While IHS services are part of healthcare treaty rights from the federal government to Tribal Nations, it is not an insurance program and is not structured like standard fee for service programs like Medicaid.
When You Are Sick or in Need of Professional Advice About Your Health, to Which of the Following Places Do You Usually Go? Other (Please Specify)
Table 15.8. Write-In Responses for Places Went to For Medical Advice
There were 777 Native Elders who wrote in a response regarding other locations they went to when sick or in need of professional advice about their health; these answers were separated into 797 responses.
Among those who wrote in a response, over half indicated that they sought help from an IHS or tribal health-related facility including clinics, wellness centers, or hospitals (53.8%).
Approximately 6.5% of Native Elders reported selftreatment, or turning to family members or friends to get health advice. This was followed by 6.3% of responses which were non-specific or unclear.
About 6.0% of Native Elders reported seeking advice or care from a VA clinic or hospital. This was followed by 4.9% who went to a hospital, health center, clinic, or wellness center (these responses did not mention IHS- or tribal-related healthcare).
Local providers or health professionals such as personal doctors, nurses, or primary care providers were also mentioned (4.5%). Some also mentioned specialists or health-related service professionals (4.4%), which included responses such as neurosurgeons, naturopaths, cardiologists, and acupuncturists, among others.
Just over 3.0% of Native Elders reported that they used the internet or did their own research to obtain advice; 2.1% said they utilized a telehealth or telephone appointment. This was followed by 1.5% who engaged in religious practices such as prayer; and 1.4% who reported going to a traditional healer or using traditional medicine.
About 1.3% turned to behavioral or mental healthrelated services; this was followed by 0.9% who called a nurse line; 0.9% who utilized a health service such as hospice or EMS; 0.9% who reported insurance; 0.8% who went to the emergency room; and 0.6% who turned to a community health or home health resource.
Have Any of the Following Kept You From Medical Care in the Past 12 Months? Other (Please Specify)
Table 15.9. Write-In Responses for Reasons Kept From Medical Care
There were 583 Native Elders who wrote in a response regarding barriers that kept them from medical care in the past 12 months; these answers were separated into 596 responses.
Among those who wrote in a response, the most frequently listed reason that impacted Native Elder’s ability to get medical care was pandemicrelated reasons (24.0%); outside of many who listed COVID-19, other reasons included being afraid of the virus or the healthcare offices being closed. This was followed by 12.9% of respondents who indicated nothing had kept them from medical care.
Work schedules and being busy with personal responsibilities were also commonly mentioned (8.4%); providers and appointments being unavailable, wait-listed, or having a long wait were also often cited (6.4%). Lack of support and accessibility were additionally mentioned (5.7%)responses here noted that many were too sick to get to the doctor, were bedridden, or did not have anyone to take them to get medical care.
About 5.0% of Native Elders reported that they did not have insurance or experienced insurance problems which impacted their ability to get care. This was closely followed by issues with transportation (4.9%); issues with scheduling or rescheduling appointments, or cancellations (4.5%); and that they were not treated well (4.4%).
Other reasons included weather (4.0%); unknown reasons (3.5%); anxiety or fear (3.0%), personal reasons (3.0%); not having doctors or the medical clinic being short-staffed (2.7%); and other reasons (1.8%). About 1.5% of Native Elders were denied service.
Less commonly cited issues included waiting on referrals (1.3%); missed appointments (1.0%); needed care being unavailable (0.7%); the office being closed (0.7%); and experiencing a language barrier or being hard of hearing (0.5%).
Table 15.10. Write-In Responses for Vigorous Exercises Completed
There were 1,745 Native Elders who wrote in a response regarding other vigorous exercises they engage in; these answers were separated into 1,861 responses.
Among those who wrote in a response, the most common exercise listed by Native Elders was house work or yard work (14.4%), such as shoveling snow, cleaning, remodeling, and repairs. This was followed by 11.0% who listed sports or outdoor activities such as volleyball, bowling, golf, and hiking, among others.
Many reported that they completed a workout at home or at the gym (10.4%); as well as woodworking (8.0%). Several also mentioned that their work kept them active (5.7%); or that they went to physical or occupational therapy (5.6%).
About 4.5% of Native Elders reported hunting, fishing, or gathering; as well as activities such as zumba or dance (4.3%); ranch and farm-related work (3.9%); stretching (3.7%); as well as walking, jogging, or running (3.5%). Yoga/Pilates was reported by 3.4% of Native Elders, as well as use of cardio machines (3.1%).
Some reported activities such as exercises completed from standing, sitting, or from bed (2.9%); this was followed by 2.5% who listed manual labor; and 2.5% who cared for their family and/or pets.
Approximately 1.7% of respondents listed an unclear activity; as well as 1.6% who said they did not exercise.
There were 9,031 Native Elders who wrote in a response regarding the traditional foods that they regularly consumed. These answers were then separated into 25,247 responses; 506 were subsequently removed due to being either unknown or unclear, or the Native Elder writing that they did not eat traditional foods or did not know what was considered a traditional food, resulting in a total of 24,741.
To better understand the results, it is important to note some of the factors and potential limitations surrounding the current methods of classification. As mentioned above, some items were unknown or unrecognizable despite a Google search; as a result, these responses were not included in the final count. Additionally, nonspecific responses that couldn’t be assigned to a distinct identifiable category of food were generally excluded as well (e.g., snacks or Chinese food).
Items were generally organized by the food category rather than what was in the food (e.g., mutton stew was classified as a stew, rather than as a meat). Occasionally, best judgment was used when item groupings were difficult to ascertain due to potential lack of commas - for example, it could be difficult to tell if a Native Elder indicated “fish eggs” or “fish, eggs,” which could result in two different ways of classifying the response.
The traditional foods and information listed here is a good faith effort to create a composite of Native foods from a variety of different communities, cultures, and regions. Both percentages and frequencies are listed in this discussion to aid in clarity.
As can be seen in Table 15.11, the most frequently listed traditional food among Native Elders was meat (17.6%, n = 4,362). Within this category, wild game was listed most frequently (n = 2,724), specifically that of venison (n = 1,280); moose (n = 489); elk (n = 368); and buffalo (n = 178). Other meats listed included fowl/poultry (n = 330); pork (n = 224); beef (n = 173); and lamb (n = 64).
Other non-specific meats (n = 847) were also listed, such as “meat” (n = 520); dried meat (n = 111); or boiled meat (n = 39); among others.
Seafood was also commonly mentioned (17.2%, n = 4,244). Within this category, many reported fish (n = 3,230), specifically salmon (n = 792). Within seafood, many (n = 818) listed various types of shellfish, such as clams (n = 284); crab (n = 218); cockles (n = 61); and shellfish (n = 59); among others.
About 15.0% (n = 3,719) of Native Elders reported eating vegetables. The most common food within this group was beans (n = 1,571); followed by nonspecific “vegetables” (n = 668); squash (n = 563); and potatoes (n = 527).
Bread was also a common traditional food mentioned (12.7%, n = 3,142). This category encompassed breads (n = 2,249), of which frybread was by far the most common (n = 1,457); but also foods such as tortillas (n = 635); cornbread (n = 90); and popovers (n = 75).
The next most frequently listed item was stews and soups (7.6%, n = 1,881). These were referenced by a variety of names, which presented some difficulty in listing sub-categories. Generally speaking, chili, as well as red or green chili, was very common (n = 620). An additional 284 listed “soup”; and 253 listed “stew”; as well as 234 who listed corn soup or hulled corn soup, among others.
Grains and starches made up the next most common category (6.9%, n = 1,711). Corn (n = 1,069) and cornmeal (n = 336) were mentioned frequently within this group, as was taro (n = 156).
About 6.1% (n = 1,513) of Native Elders reported eating fruit as a traditional food. With this group, berries were by far the most common (n = 984), including chokecherries, huckleberries, salmonberries, wild berries, and juneberries, among others. There were 426 Native Elders who listed “fruit,” although other specific kinds included apples (n = 25); bananas (n = 23); and watermelons (n = 16).
Table 15.11. Write-In Responses for Traditional Foods
Rice was another common response (4.4%, n = 1,097). Within this group, most Native Elders reported eating either wild rice (n = 727) or rice (n = 359).
Greens and plants (2.4%, n = 599) incorporated a variety of responses. These included seaweed (n = 279) and greens (n = 155); as well as spinach (n = 46); plants (n = 33); camas (n = 14); and collard greens (n = 10).
Among drinks (1.4%, n = 347), tea was most common (n = 235); followed by atole (n = 61); water (n = 18); and various other beverages (n = 33).
Within the taco category (1.0%, n = 254), most Native Elders primarily reported eating Indian tacos (n = 162) or “tacos” (n = 91).
The sugar, sweets, and desserts category (0.9%, n = 227) also incorporated a variety of foods, including maple syrup (n = 56); puddings (n = 38); grape dumplings (n = 27); as well as Eskimo ice cream (n = 17); among others.
Eggs were next most commonly reported at 0.9% (n = 215); this was followed by nuts and seeds (0.8%, n = 197). Within this latter category, acorns were cited frequently (n = 70); followed by “nuts” (n = 68); and pine nuts (n = 41).
Specific dishes were also common (0.7%, n = 183). These included dishes such as tamales (n = 80); lau lau (n = 34); enchiladas (n = 20); tanchi labona (n = 13); steam fry (n = 11); and burritos (n = 9).
Fish eggs were listed by 0.6% of Native Elders (n = 160). This was followed by various dairy items (0.6%, n = 143); as well as pasta and dumplings (0.5%, n = 133). Sauce was also mentioned (0.5%, n = 126); this included items such as gravy (n = 77) and wojapi (n = 40).
Other items included salads (0.4%, n = 100); roots (0.4%, n = 97); fat and oil-related products (0.3%, n = 65); meat and fish pies (0.2%, n = 47); jams and jellies (0.2%, n = 46); herbs and spices (0.2%, n = 38); other responses (0.1%, n = 27); sandwiches (0.1%, n = 26); cactus (0.1%, n = 25); and fermented foods/relish/salsa (0.1%, n = 17).
Do You Participate in the Following Cultural Practices/Traditions? Other (Please Specify)
Table 15.12. Write-In Responses for Cultural Practices/Traditions
There were 1,182 Native Elders who wrote in a response regarding other vigorous exercises they engaged in; these answers were separated into 1,216 responses.
Among those who wrote in a response, most reported that they did not participate in any kind of cultural practice or tradition (28.0%); some said they were no longer physically able to do so, while others said none were available, or that COVID-19 played a factor.
Many reported engaging in arts, crafts, sewing, writing, or other creative activities, such as carving, beadwork, and painting, among others (11.6%). This was followed by those who participated in church or other religious-related activities (10.6%).
Gatherings and social events were also common (8.6%); this included family gatherings, memorials, public meetings, festivals, weddings, or other celebrations. Another common activity was that of meals (6.2%), such as feast days, potlucks, luncheons, or helping to prepare food.
About 5.4% of Native Elders reported participating in a variety of ceremonies, such as Easter Ceremony, Moon Ceremony, or naming ceremonies, among others. An additional 4.4% also reported dancing; as well as 4.4% who listed non-specific cultural activities. About 4.0% wrote responses which were unclear or listed the frequency of their participation.
There were 3.0% who participated in games, sports, or physical activities, such as stick games, hand games, and canoeing. Another 3.0% also reported engaging in activities such as hunting, fishing, gathering, and harvesting.
The NRCNAA is made up of experts, researchers, and leaders with diverse backgrounds and experience. Our team is committed to helping improve the lives of Native Elders and working to ensure they get the resources they need.

Dr. Collette Adamsen Director, NRCNAA, RCNAD Research Assistant Professor collette.adamsen@und.edu

Heather Skadsem Long-Term Support Services Tribal Liaison heather.skadsem@und.edu

Cole Ward Outreach Coordinator cole.ward@und.edu

Halle Short Research Support halle.m.short@und.edu

Dr. Karen Semmens Clinical Assistant Professor DNP, GCNS-BC karen.semmens@und.edu

Dr. Robin Besse Senior Research Analyst robin.besse@und.edu

Dr. Chia-Lin Chang Research Assistant Professor chialin.chang@und.edu

Shane Knutson Research Support shane.knutson@und.edu

Elaina Seep Policy Specialist elaina.seep@und.edu

Shelly Davis Indigenous Populations Research Coordinator shelly.davis@und.edu

Brittany Decouteau Long-Term Services and Supports Specialist brittany.decouteau@und.edu
