Department description and budget detail City Attorney’s Office
The City Attorney’s Office represents the City of Centennial in all legal matters affecting the municipal corporation. This representation includes day-to-day advice and counsel, defense of lawsuits filed against the City and affirmatively asserting claims that will benefit the citizens and municipal operations. The City Attorney attends all City Council meetings and provides legal advice to the City Council. Other attorneys in the City Attorney’s Office: advise the City’s administrative departments if requested by the department; advise the City’s boards, commissions and authorities; drafts
or supervises the drafting of ordinances and resolutions; provides assistance and advice if requested by the City Manager on contracts, agreements and other legal documents prepared or negotiated by the City Council, Council Members, City Manager and City administrative staff; supervises the prosecution of municipal code violations through the City’s contracts prosecution staff; and directs the City’s special and outside legal counsel.
CITY ATTORNEY'S OFFICE (001 121) YEAR 1 YEAR 2 BUDGET 2021 2022 2022 2023 2024 2023 Budget 2024 Budget DETAIL Actual Adopted Revised Budget Budget to 2022 Adopted to 2023 Budget Departmental Costs 937,149 $ 1,148,150 $ 1,148,150 $ 1,193,680 $ 1,241,030 $ 4% 4% City Attorney's Office Service 860,353 906,400 906,400 942,660 980,370 4% 4% Special Legal Services 72,242 231,750 231,750 241,020 250,660 4% 4% Outside Counsel Services 4,554 10,000 10,000 10,000 10,000 0% 0% TOTAL CITY ATTORNEY'S OFFICE 937,149 $ 1,148,150 $ 1,148,150 $ 1,193,680 $ 1,241,030 $ 4% 4% BIENNIAL BUDGET % Change 80
Department description and budget detail City Clerk’s Office
The City Clerk’s Office is responsible for all official City records, legal publications, records management and handling of open records requests. The City Clerk is the secretary to City Council and attends and records all City Council meetings and prepares City Council agendas, packets and minutes. The City Clerk’s Office maintains the Centennial Municipal Code, legal notice publications and meetings notices. Also, licensing administration (including Liquor, Massage Parlor and Pawnbroker licensing) is a responsibility of this office, working with the Arapahoe County Sheriff’s Office in enforcement of licensing concerns. The City Clerk’s Office administers Centennial’s special municipal elections. The City Clerk, as a
Designated Election Official, assists the County in the conduct of coordinated elections. The City Clerk sits as the chairperson for the Centennial Elections Commission and oversees Fair Campaign Practices Act filings for candidates for municipal office, as well as filings for various issue committees. The City Clerk manages the ad hoc appointment committees for the various City boards and commissions and the membership rosters. The Clerk’s Office is a registered Acceptance Agency to accept passport applications on behalf of the U.S. Department of State.
• Facilitated 2022 TABOR Election on a lodging tax
• Implemented online payment option for liquor licensees
• Implemented cross-training of City Clerk’s Office Staff and Court Staff as Passport Agents, improving customer service and increasing availability
• Facilitate 2023 Council Election
• Resume photo services for passport applications and increase appointment availability
• Continued implementation of records management policies and directives, including supporting City processes
81 CITY CLERK'S OFFICE (001 111) YEAR 1 YEAR 2 BUDGET 2021 2022 2022 2023 2024 2023 Budget 2024 Budget DETAIL Actual Adopted Revised Budget Budget to 2022 Adopted to 2023 Budget Personnel Costs 304,100 $ 424,250 $ 440,840 $ 314,140 $ 341,800 $ -26% 9% Salaries And Wages 225,906 305,700 320,380 255,480 265,640 -16% 4% Benefits 78,194 118,550 120,460 58,660 76,160 -51% 30% Departmental Costs 69,350 122,000 122,000 135,200 135,200 11% 0% Boards, Commissions & Community Activities 11,874 20,000 20,000 25,200 25,200 26% 0% Election Services 29,367 75,000 75,000 75,000 75,000 0% 0% Professional Services 13,147 5,000 5,000 5,000 5,000 0% 0% Records Storage 10,373 12,000 12,000 20,000 20,000 67% 0% Legal Notices 4,088 10,000 10,000 10,000 10,000 0% 0% TOTAL CITY CLERK'S OFFICE 373,449 $ 546,250 $ 562,840 $ 449,340 $ 477,000 $ -18% 6% BIENNIAL BUDGET % Change
City Clerk’s Office
82
City Manager City Clerk and Municipal Court Director (0.5) Deputy City Clerk, Licensing and Passport Manager (1) Assistant City Clerk (1) Records and Data Management Specialist (1) Administrative Coordinator (0.5)
CLERK 4.0 FTE
CITY
City Manager’s Office
Department description and budget detail

The City Manager’s Office sets the standards for the City organization in providing quality services to the public and ensuring the policies and vision established by City Council are implemented. Section 8.4(c) of the Centennial Home Rule Charter gives the City Manager the responsibility of supervising and overseeing all aspects of City functions and activities and service contracts of personnel and departments that report to the City Manager.
The Central Services division is responsible for overseeing the centralized administrative operations of the City including office supplies, postage, printing and publishing, meetings, training and travel, and overseeing professional dues and memberships for all City employees.
83
City Manager’s Office
84
CITY MANAGER'S OFFICE (001 200) YEAR 1 YEAR 2 BUDGET 2021 2022 2022 2023 2024 2023 Budget 2024 Budget DETAIL Actual Adopted Revised Budget Budget to 2022 Adopted to 2023 Budget City Manager Administration (001 201) Personnel Costs 918,732 $ 894,650 $ 943,310 $ 968,390 $ 1,005,420 $ 8% 4% Salaries And Wages 664,696 692,040 735,100 752,660 772,990 9% 3% Benefits 254,037 202,610 208,210 215,730 232,430 6% 8% Departmental Costs 66,197 90,000 90,000 615,000 500,000 583% -19% Professional Services 42,697 90,000 90,000 465,000 390,000 417% -16% Project-Specific 23,500 - - - - N/A N/A Intergovernmental - - - 150,000 110,000 N/A -27% Subtotal City Manager Administration 984,930 984,650 1,033,310 1,583,390 1,505,420 61% -5% Economic Development (001 203) Personnel Costs 289,997 513,450 530,430 - - -100% N/A Salaries And Wages 234,765 395,600 410,630 - - -100% N/A Benefits 55,232 117,850 119,800 - - -100% N/A Departmental Costs 183,207 505,000 505,000 - - -100% N/A Professional Services 144,205 445,000 445,000 - - -100% N/A Project-Specific 39,003 60,000 60,000 - - -100% N/A Subtotal Economic Development 473,204 1,018,450 1,035,430 - - -100% N/A Central Services (001 205) Internship Wages 10,626 20,000 20,000 20,000 20,000 0% N/A Annual Compensation - 455,000 79,940 709,310 736,700 56% 4% Tuition Reimbursement 7,750 15,000 15,000 18,000 18,000 20% 0% Office Supplies 26,528 39,560 39,560 54,000 55,500 37% 3% Postage And Courier 8,432 16,000 16,000 17,500 17,750 9% 1% Non-Capital Equipment - 2,000 2,000 2,000 2,000 0% 0% County Treasurer Fee 125,151 126,500 126,500 131,500 135,000 4% 3% Professional Services 12,623 65,000 65,000 65,000 65,000 0% 0% Printing Services 600 3,000 3,000 3,000 3,000 0% 0% Bank Fees 126 300 300 - - -100% N/A Merchant Card Services - 27,000 27,000 110,000 113,000 307% 3% Security Services 75,578 167,310 167,310 165,000 165,000 -1% 0% City Attorney's Office Service - 100,000 100,000 100,000 100,000 0% 0% Professional Development 135,278 251,430 251,430 315,450 316,600 25% 0% Staff Committees 969 2,500 2,500 8,000 8,000 220% 0% Dues And Memberships 194,715 260,390 260,390 360,970 372,090 39% 3% Subscriptions 11,830 15,740 15,740 14,300 14,300 -9% 0% Sales Tax Incentives 760,247 495,000 495,000 1,060,000 1,100,000 114% 4% Construction Use Tax Incentive - 550,000 550,000 400,000 375,000 -27% -6% Other Incentives - 2,500,000 2,500,000 1,000,000 1,000,000 -60% 0% Subtotal Central Services 1,383,076 5,111,730 4,736,670 4,554,030 4,616,940 -11% 1% TOTAL CITY MANAGER'S OFFICE 2,841,210 $ 7,114,830 $ 6,805,410 $ 6,137,420 $ 6,122,360 $ -14% 0% BIENNIAL BUDGET % Change
City Manager’s Office
85
City Manager (1) Deputy City Manager (1) Manager, Development Foresight and Infrastructure Readiness (1) Assistant City Manager (1) Executive Assistant (1)
CITY MANAGER 5.0 FTE
Department description and budget detail Communications
The Communications Department is responsible for communicating the City’s policies, initiatives and activities to external and internal audiences. This is accomplished by working with the media, posting information on the City’s website and sharing via social media, producing print and digital marketing materials and providing opportunities for
COMMUNICATIONS (001 420)
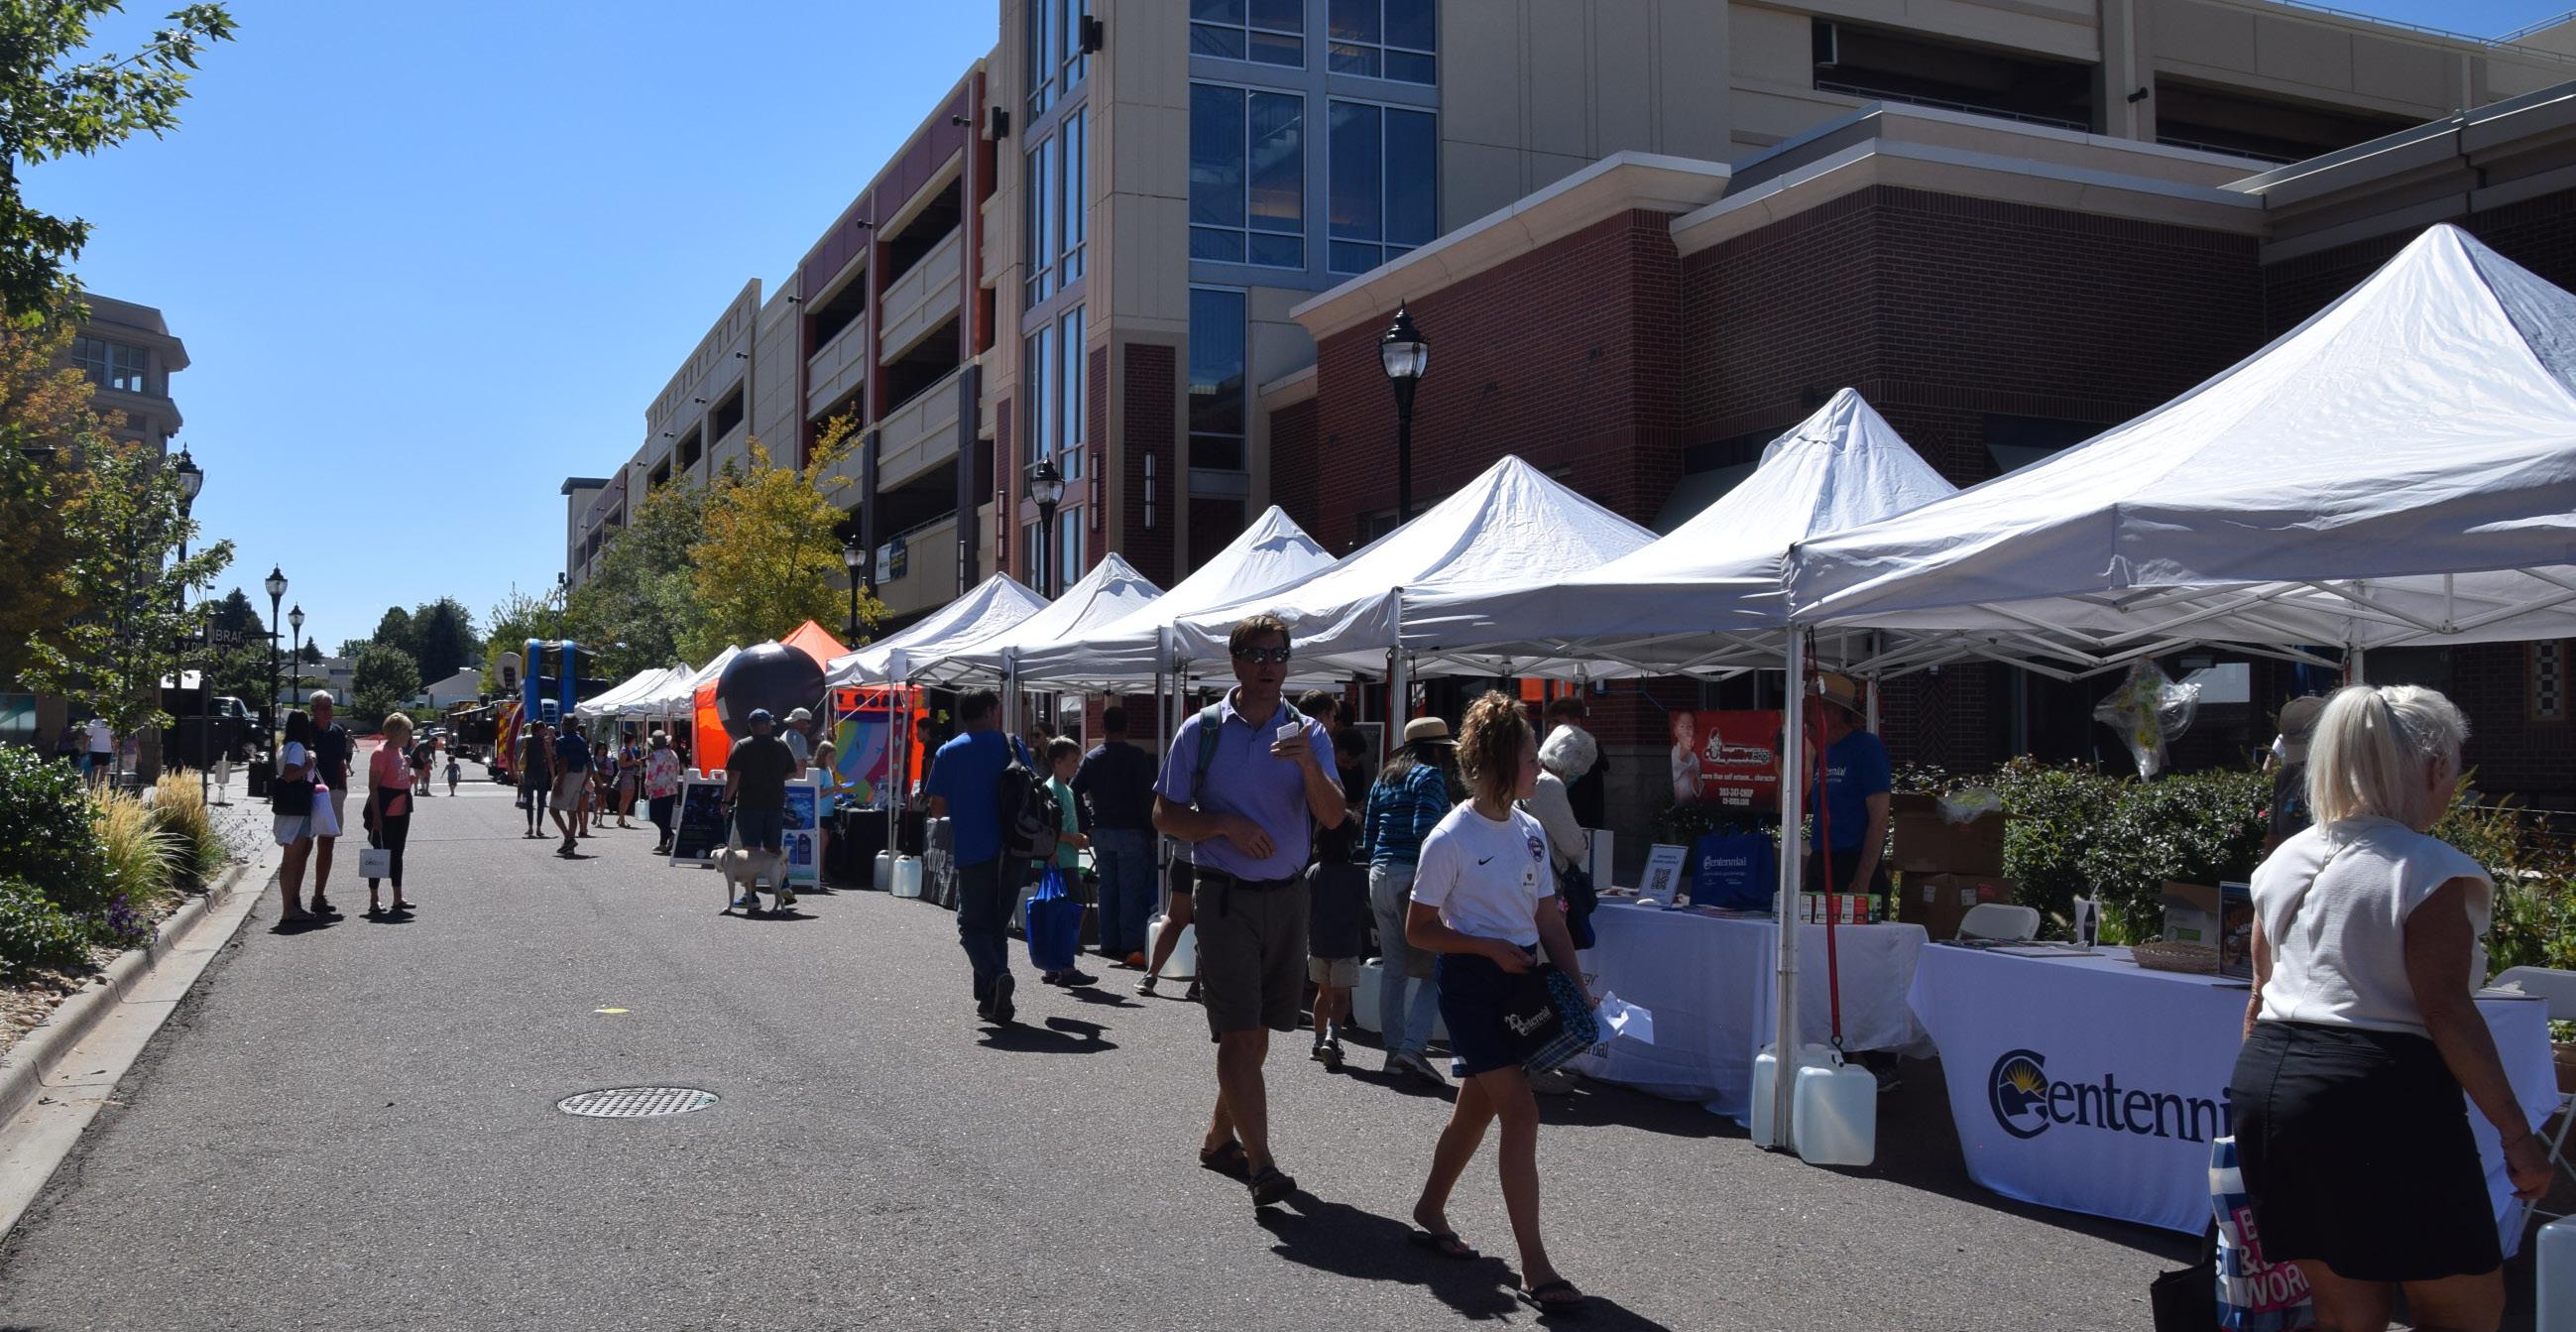
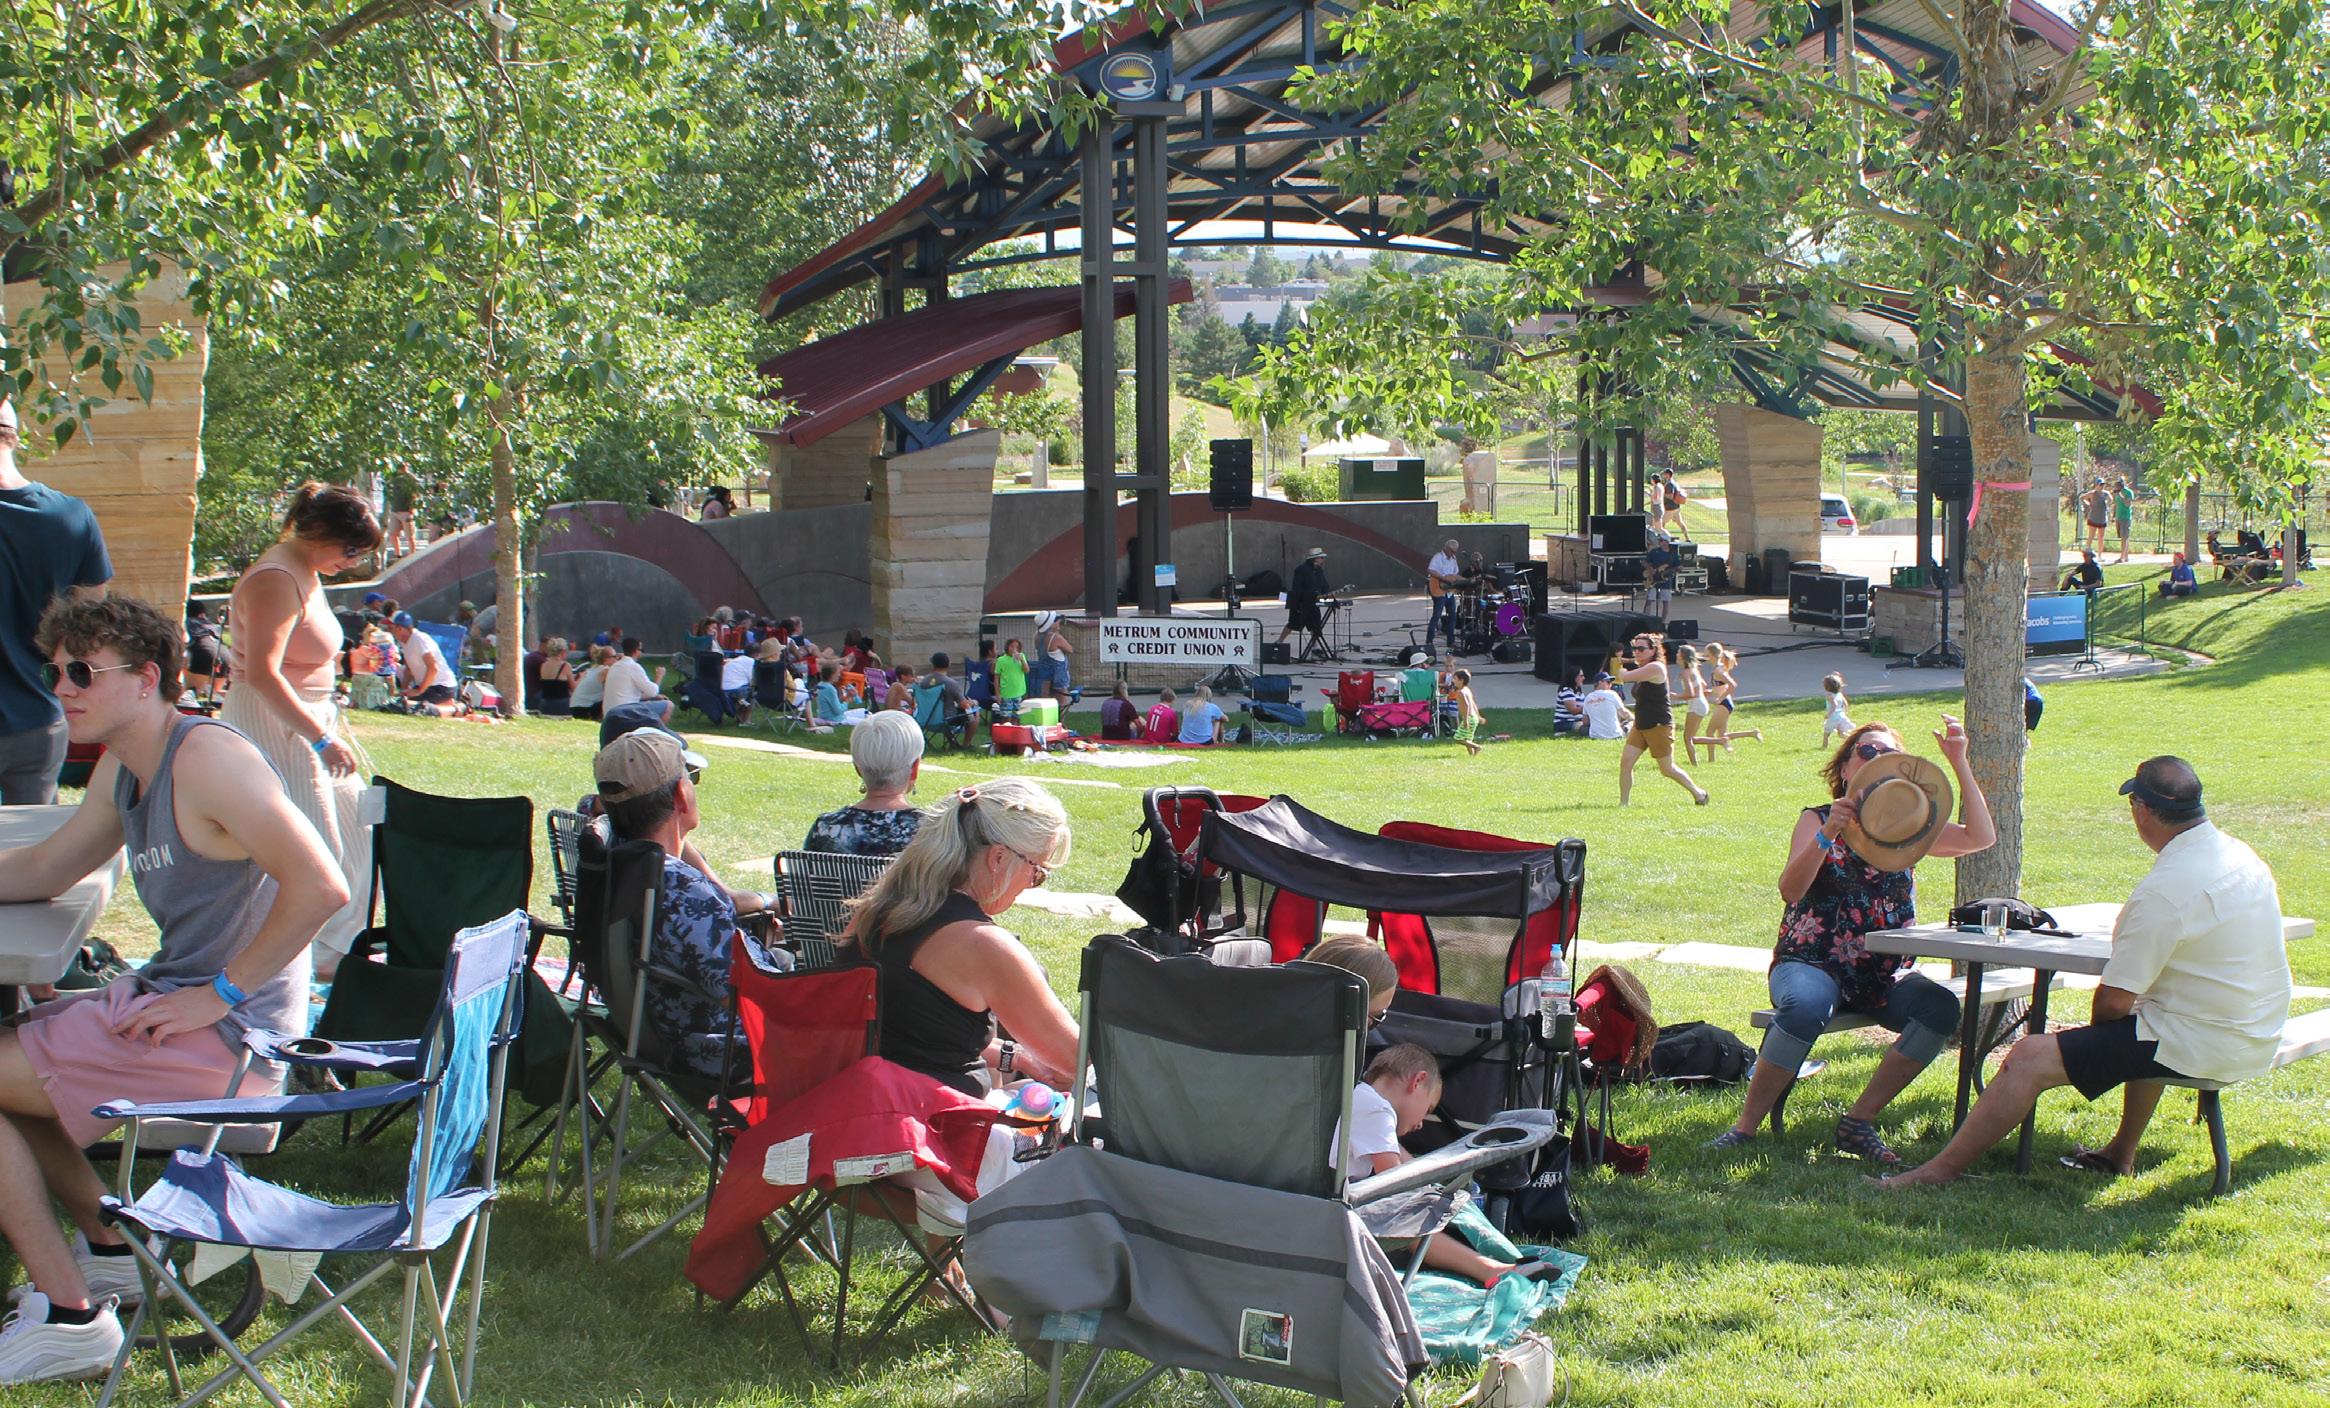
public input through various communication channels. The Communications Department plans, executes, publicizes and produces community events in Centennial Center Park and at various public locations across the City and leads the Centennial 101 Leadership Academy.
• Led community engagement for various projects including Housing, Transportation Master Plan and various City projects and initiatives
• Hosted 10 City-led events attended by more than 13,000 residents
• Updated City branding, including logo, positioning statement and Centennial’s distinct advantages
• Managed and implemented Centennial 101 and State of Our City after hiatus due to COVID-19
• Created and distributed more than 235 e-newsletters/ bulletins achieving more than 400,000 impressions
• Initiated website accessibility audit to improve customer service
• Maintained 99.97% uptime on the City website which received over 650,000 unique visitors
• Achieved nearly 470,000 impressions on citizen engagement social media outreach, representing 12.8% engagement per impression and 6% more impressions over 2021
• Align digital accessibility of City website across service areas
• Proactively develop programs to engage and grow the City’s online community
• Implement branding action items; complete signage/ wayfinding audit and needs assessment
86
YEAR 1 YEAR 2 BUDGET 2021 2022 2022 2023 2024 2023 Budget 2024 Budget DETAIL Actual Adopted Revised Budget Budget to 2022 Adopted to 2023 Budget Personnel Costs 469,920 $ 516,400 $ 539,970 $ 645,360 $ 681,260 $ 25% 6% Salaries and Wages 353,163 389,540 410,390 469,280 487,980 20% 4% Benefits 116,757 126,860 129,580 176,080 193,280 39% 10% Departmental Costs 455,298 626,000 626,000 753,000 738,000 20% -2% Boards, Commissions and Community Activities 10,708 20,000 20,000 5,000 20,000 -75% 300% Community Activities 277,370 316,000 316,000 350,000 385,000 11% 10% Professional Services 110,342 175,000 175,000 247,000 211,000 41% -15% Project-Specific - - - 30,000 - N/A -100% Printing Services 3,146 25,000 25,000 26,000 27,000 4% 4% Advertising 11,086 15,000 15,000 15,000 15,000 0% 0% Newsletter 42,646 75,000 75,000 80,000 80,000 7% 0% TOTAL COMMUNICATIONS 925,218 $ 1,142,400 $ 1,165,970 $ 1,398,360 $ 1,419,260 $ 22% 1% BIENNIAL BUDGET % Change
87 Communications Assistant City Manager Communications Director (1) Customer Engagement Manager (1) Communications Coordinator (1) Communications Specialist (1) Communications Strategist (1) Digital Communications Specialist (1) COMMUNICATIONS 6.0 FTE
Community & Economic Development
Department description and budget detail
The Community and Economic Development function of the city government is responsible for the growth, development and maintenance of land use within the City. In 2022, the City combined multiple functions under the Community and Economic Development Department, in addition to bringing Building Services (which reviews and issues building permits) from a contractor-provided service to an in-house service. CED is made up of Building Services, Economic Development, Neighborhood Services and Planning, as well as two contracted services, Code Compliance and Animal Services. These service areas work together to carry out the City’s vision and mission to address the physical and economic elements of the community.
The Building Services, Neighborhood Services and Planning divisions are responsible for managing the physical growth and development of the community to preserve quality of life, enhance property values and protect public safety by overseeing long-range planning, open space programming, current planning, building and neighborhood services.
The Economic Development division’s role is to maintain and expand Centennial’s vibrant economy through the retention and expansion of existing businesses and attraction of new enterprises. Economic Development assists the development community in creating and maintaining high-quality real estate within the City. The division is currently engaged in a multi-year effort to develop strategies that will enable retail centers with Centennial to adapt and thrive in a changing retail environment.
The Code Compliance division promotes a desirable living and working environment through the enforcement of codes to protect property values and quality of life. With a focus on voluntary compliance, the Code Compliance division seeks to partner with residents, neighborhood organizations, businesses, public agencies and other City departments to enhance the understanding of local regulations and, in doing so, foster civic pride.
Animal Services is committed to preserving the quality of life in the City by serving and protecting citizens and animals in our community through enforcement of animal-related laws and aims to educate residents on responsible pet ownership.
88
Community & Economic Development
89
COMMUNITY & ECONOMIC DEVELOPMENT (001 800) YEAR 1 YEAR 2 BUDGET 2021 2022 2022 2023 2024 2023 Budget 2024 Budget DETAIL Actual Adopted Revised Budget Budget to 2022 Adopted to 2023 Budget CD Admininistration (001 801) Personnel Costs 486,830 $ 551,340 $ 574,830 $ 631,010 $ 666,770 $ 14% 6% Salaries And Wages 376,214 411,510 432,300 458,940 477,240 12% 4% Benefits 110,617 139,830 142,530 172,070 189,530 23% 10% Departmental Costs 29,900 141,000 141,000 668,000 603,000 374% -10% Neighborhood Services 29,900 135,000 135,000 138,000 158,000 2% 14% Professional Services - 6,000 6,000 100,000 100,000 1567% 0% Project-Specific - - - 200,000 100,000 N/A -50% City Attorney Services - - - 230,000 245,000 N/A 7% Subtotal CD Administration 516,730 692,340 715,830 1,299,010 1,269,770 88% -2% Planning (001 802) Personnel Costs - - - 589,670 624,790 N/A N/A Salaries And Wages - - - 440,000 457,530 N/A N/A Benefits - - - 149,670 167,260 N/A N/A Departmental Costs - - - 220,000 220,000 N/A N/A Professional Services - - - 220,000 220,000 N/A N/A Subtotal Planning - - - 809,670 844,790 N/A N/A Building (001 803) Personnel Costs - - - 1,131,030 1,240,540 N/A N/A Salaries And Wages - - - 823,370 856,170 N/A N/A Benefits - - - 307,660 384,370 N/A N/A Departmental Costs - - - 345,000 345,000 N/A N/A Non-Capital Equipment - - - 10,000 10,000 N/A N/A Professional Services - - - 325,000 325,000 N/A N/A Other Incentives - - - 10,000 10,000 N/A N/A Subtotal Building - - - 1,476,030 1,585,540 N/A N/A Code Compliance (001 804) Departmental Costs 751,310 891,590 891,590 916,840 948,910 3% 3% Code Compliance Contract 751,310 891,590 891,590 916,840 948,910 3% 3% Subtotal Code Compliance 751,310 891,590 891,590 916,840 948,910 3% 3% Animal Services (001 805) Departmental Costs 696,806 746,740 746,740 754,250 772,210 1% 2% Animal Services Contract 696,806 746,740 746,740 754,250 772,210 1% 2% Subtotal Animal Services 696,806 746,740 746,740 754,250 772,210 1% 2% Economic Development (001 807) Personnel Costs - - - 616,610 648,660 N/A N/A Salaries And Wages - - - 464,600 483,120 N/A N/A Benefits - - - 152,010 165,540 N/A N/A Departmental Costs - - - 255,000 255,000 N/A N/A Professional Services - - - 255,000 255,000 N/A N/A Subtotal Economic Development - - - 871,610 903,660 N/A N/A TOTAL COMMUNITY & ECONOMIC DEVELOPMENT 1,964,846 $ 2,330,670 $ 2,354,160 $ 6,127,410 $ 6,324,880 $ 163% 3% BIENNIAL BUDGET % Change
Community & Economic Development
• Reorganized and added services under a combined Community and Economic Development Department including Building Services, Economic Development, Neighborhood Services, Planning, Code Compliance and Animal Services to align City services provided to the community
• Expanded 1041 Regulations for enhanced local control
• Transitioned Building Services from contract to in-house model to increase service levels
• Implemented new Short-Term Rental Registration Program
• Launched Centennial Movie Nights Program for residents and neighborhoods
• Awarded six large community improvement grants totaling $10,000 each and distributed over $47,000 in small community engagement grants with anticipated attendance of over 15,000
• Completed annexation of Dove Valley Regional Park, Cherry Creek Innovation Campus and adjacent vacant land
• Completed several Land Development Code updates and amendments including live-work land use regulations, fiber optic infrastructure standards, rooftop greenhouses and Dove Valley Residential Overlay
• Completed update of Centennial NEXT to recognize the future vision for the City with amendments to Spotlight Areas and the Future Land Use Map associated with Dove Valley and various annexations
• Rezoned City-owned property at South Potomac Street and East Fremont Avenue
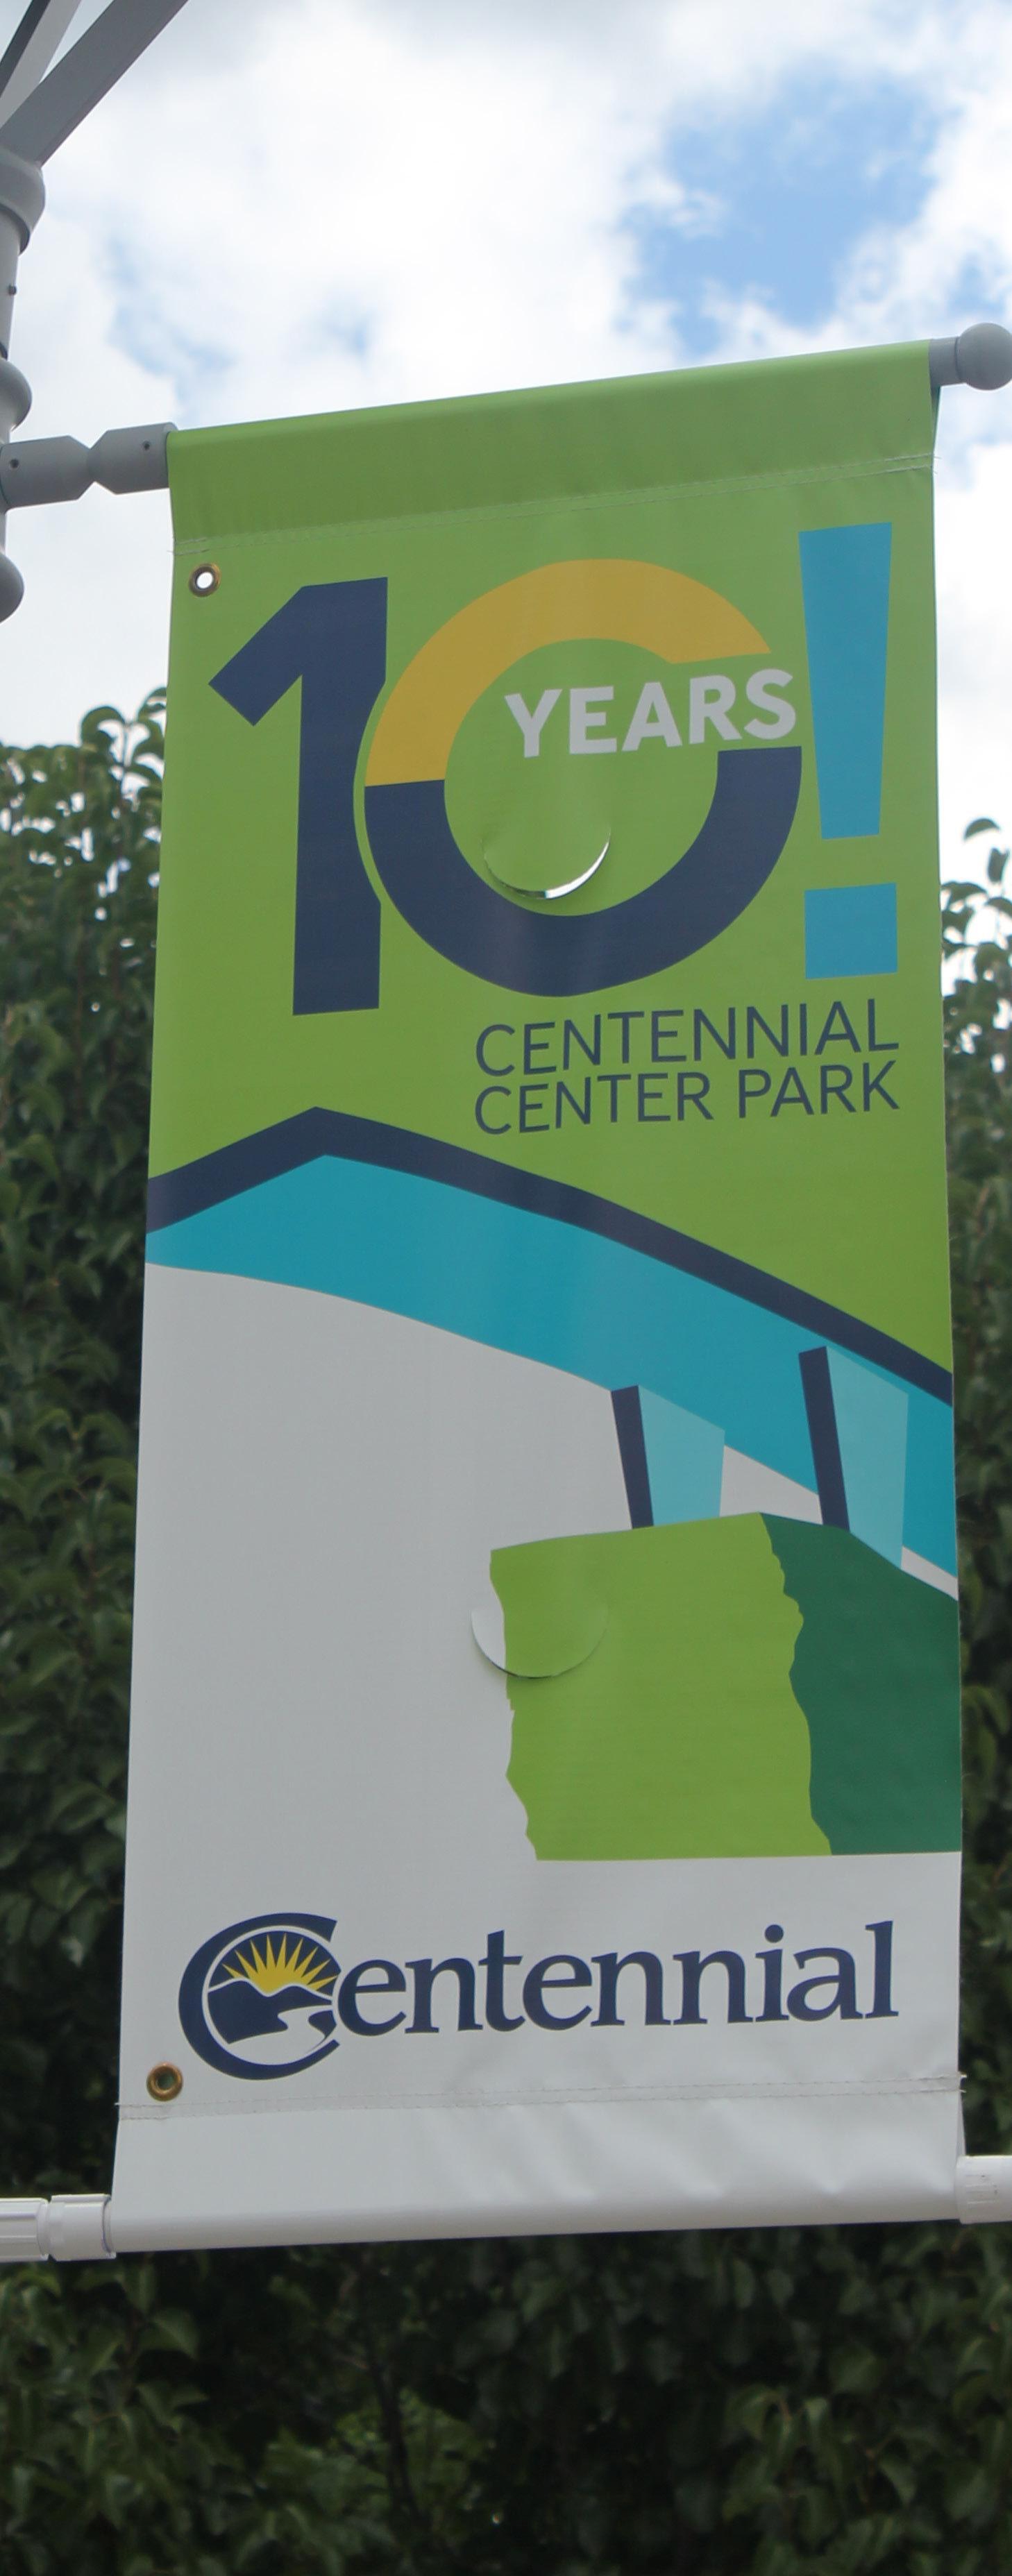
• Centennial Center Park expansion/construction project substantially complete
• Completed Centennial Link Trail design, with the goal of connecting east and west Centennial along a single trail system
• Continued Lone Tree Creek Trail design
• Continued development of retail center strategies for University Boulevard Corridor; began development of retail center strategies for Smoky Hill Road Corridor and Centennial Promenade
• Awarded $9,000 in prototype funding to 19 Centennial businesses through the 2022 Spark Centennial program
• Implemented license expiration notification process for pet licenses
• Continue work on Centennial Housing Study and policy development
• Adopt updated International Building Codes, update buildings guides and website for Building Services division
• Continue Short-Term Rental licensing and evaluate thirdparty providers
• Implement neighborhood signage program associated with the Safe Streets Initiative
• Evaluate future development trends and identify opportunities to implement the City’s Strategic Plan through the Land Development Code and Centennial NEXT
• Complete Arapahoe Urban Center regulating plan
• Continue to facilitate development of The DistrictCentennial, Westray, SouthGlenn and other major projects
• Complete retail frameworks for local corridors
• Implement mobile pet registration option through Animal Services
• Implement proactive code compliance efforts on retail centers and commercial properties
90
Community & Economic Development
DEVELOPMENT 27.0 FTE COMMUNITY & ECONOMIC
91
Deputy City Manager Community and Economic Development Director (1) Deputy Community Development Director (1) Neighborhood Services Administrator (1) Animal Services Administrative Analyst (1) Principal Planner (1) Senior Planner (1) Planner II (3) Planner I (2) Administrative Assistant (1) Economic Development Director (1) Senior Economic Developer (1) Economic Development Specialist (2) Chief Building Official (1) Building Inspector (4) Plans Examiner (2) Permit Technician (3) Administrative Assistant (1) Code Compliance
Department description and budget detail Elected Officials
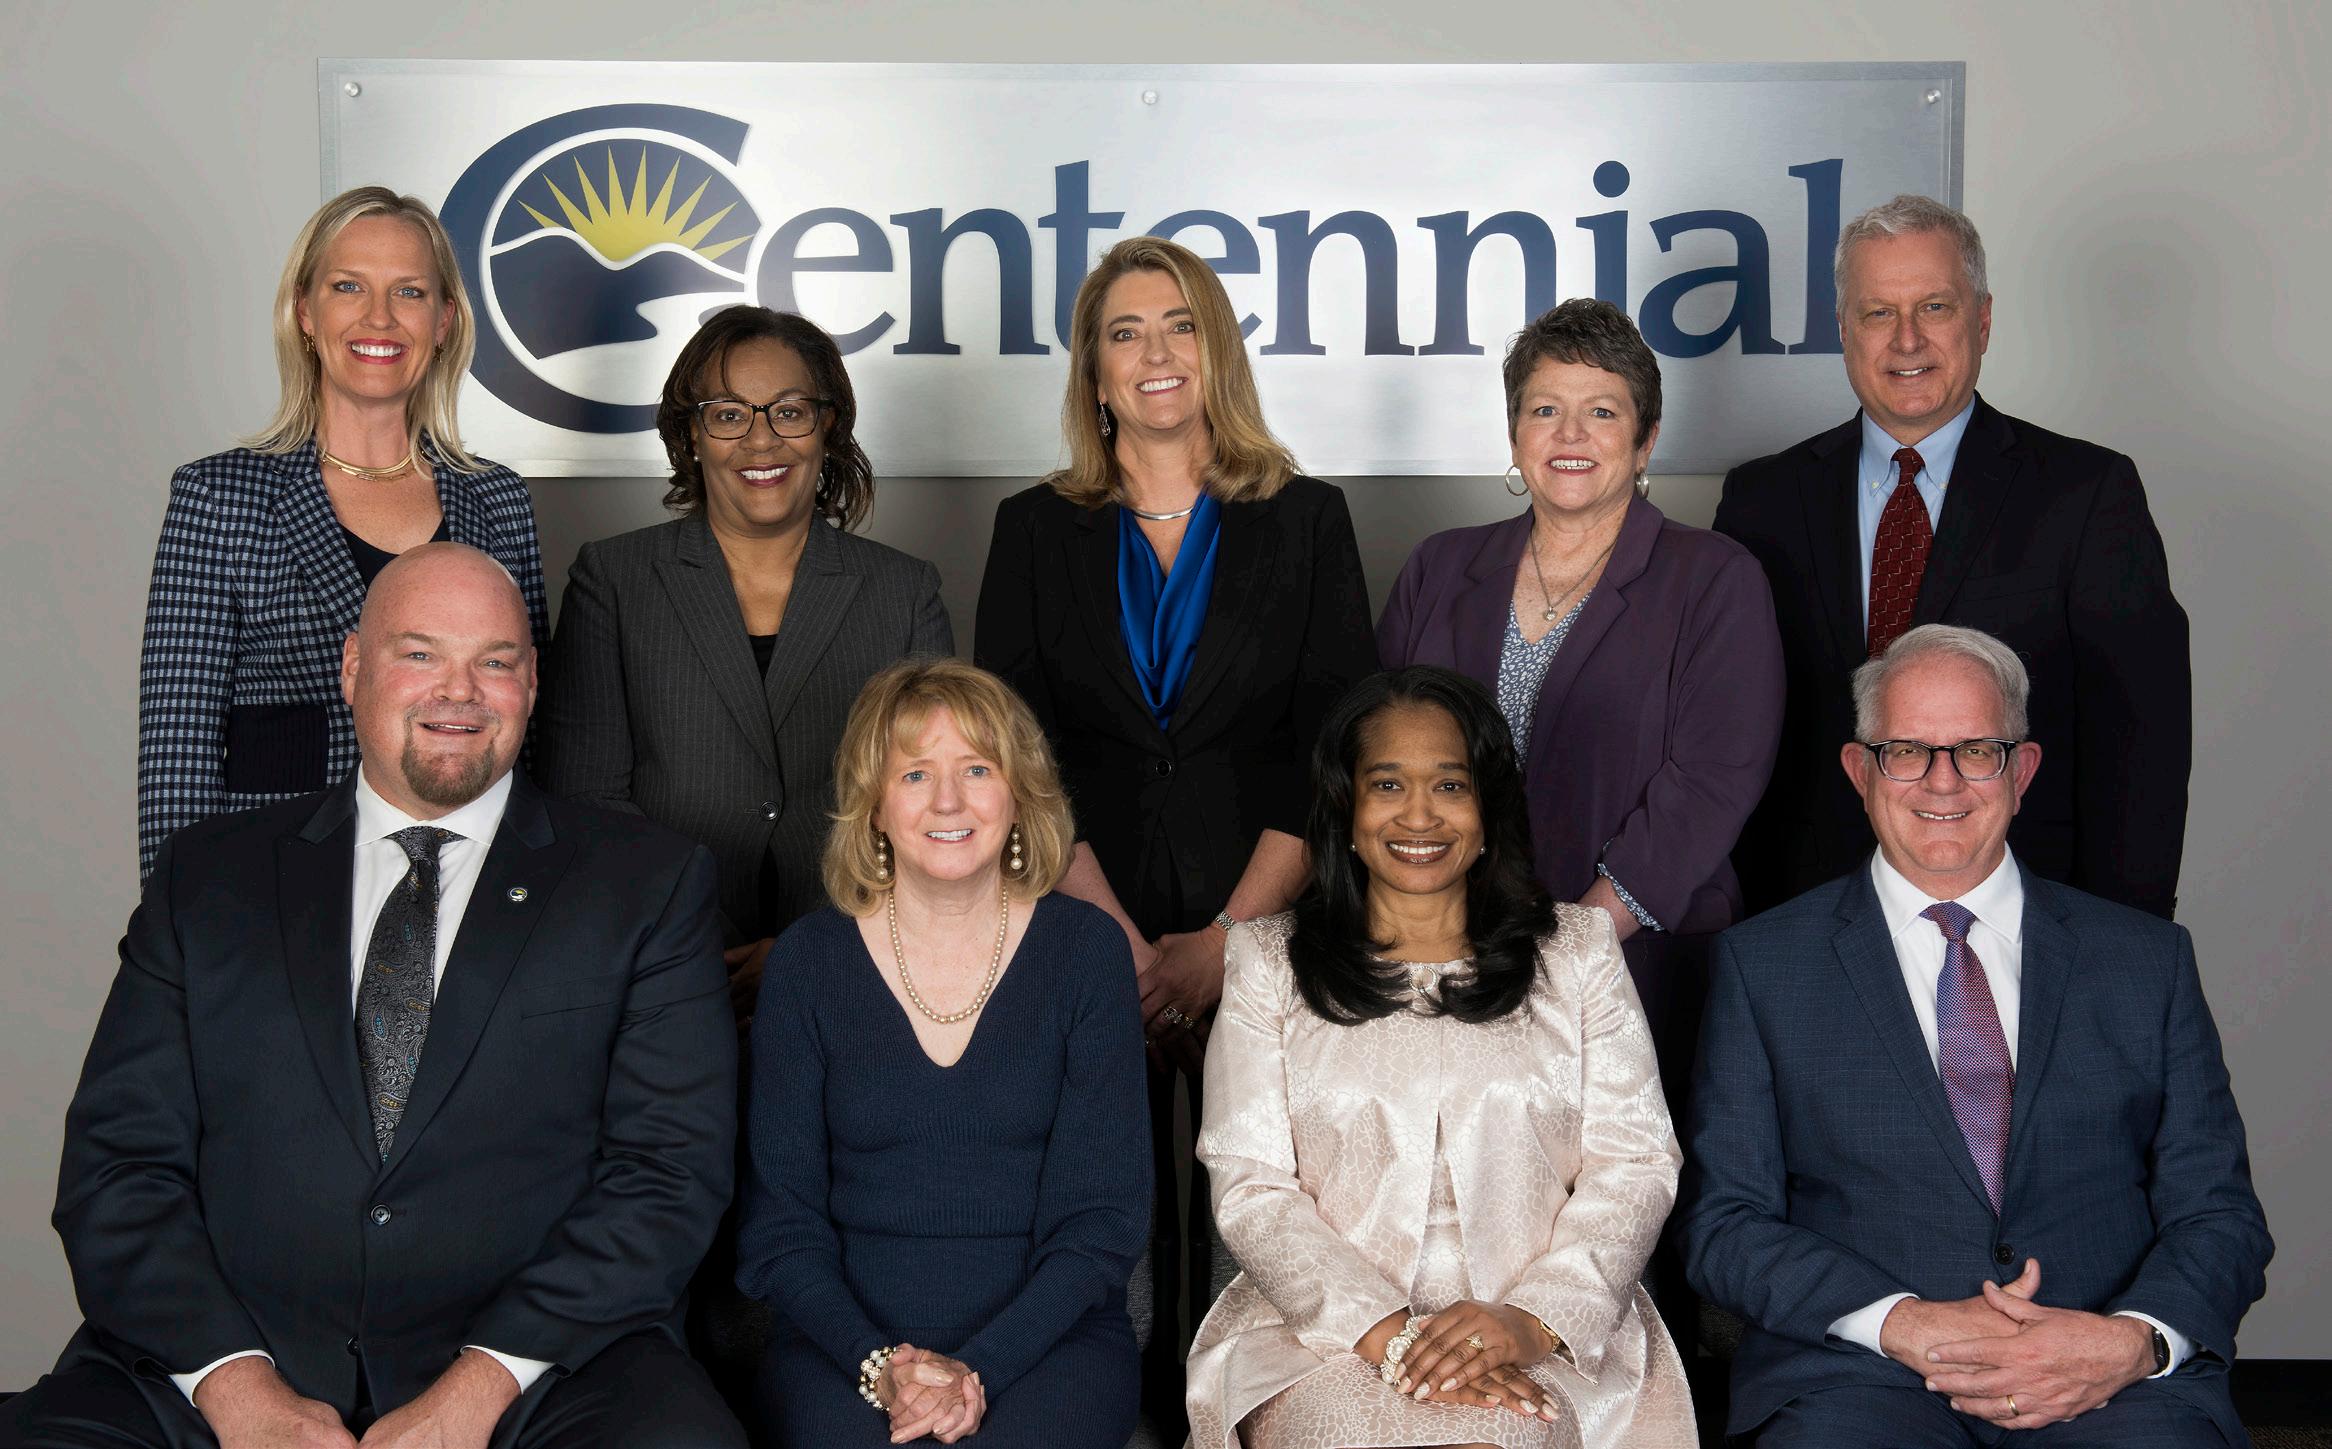
The Mayor and City Council constitute the elected officials for the City of Centennial. The Mayor and City Council provide proactive community leadership in the formation of public policy that promotes and maintains the economic interests of the City, a high quality of life and a safe and attractive environment for the citizens. Two Council Members represent each of the four districts, ensuring equal representation
across the City. The Mayor is elected at-large for a four-year term, and the City Council members are elected to four-year staggered terms. The City Council works as a unified body and is entrusted with representing and balancing diverse public interests, establishing policy and providing visionary leadership for the community now and into the future.
ELECTED OFFICIALS (001 101) YEAR 1 YEAR 2 BUDGET 2021 2022 2022 2023 2024 2023 Budget 2024 Budget DETAIL Actual Adopted Revised Budget Budget to 2022 Adopted to 2023 Budget Personnel Costs 172,031 $ 195,580 $ 195,580 $ 188,590 $ 197,760 $ -4% 5% Salaries And Wages 113,016 113,020 113,020 113,020 113,020 0% 0% Benefits 59,015 82,560 82,560 75,570 84,740 -8% 12% Departmental Costs 80,353 106,000 106,000 106,000 106,000 0% 0% Community Sponsorships 12,900 20,000 20,000 20,000 20,000 0% 0% Professional Services 10,000 - - - - N/A N/A Professional Development 18,703 60,000 60,000 60,000 60,000 0% 0% Council Meetings 38,750 26,000 26,000 26,000 26,000 0% 0% TOTAL ELECTED OFFICIALS 252,384 $ 301,580 $ 301,580 $ 294,590 $ 303,760 $ -2% 3% BIENNIAL BUDGET % Change 92
Department description and budget detail Finance
The Finance Department provides fiduciary control over the City’s assets and performs budgetary and fiscally-related services that provide useful financial information to the City as an organization and its citizens. The department is composed of the Revenue, Accounting and Reporting, and Purchasing Administration divisions. The functions of the department include: centralized accounting including accounts payable and receivable; revenue collection and analysis; preparation of monthly financial statements and analysis; preparation of
the City’s Annual Budget and Comprehensive Annual Financial Report; cash and investment management; risk management; payroll; and purchasing.
The Sales and Use Tax Program provides licensing services for retail businesses; administration and collection of sales and use tax; collection of delinquent sales and use tax; and auditing of retailers’ records to ensure compliance with the City’s ordinance.
FINANCE
YEAR 1 YEAR 2 BUDGET 2021 2022 2022 2023 2024 2023 Budget 2024 Budget DETAIL Actual Adopted Revised Budget Budget to 2022 Adopted to 2023 Budget Finance Administration (001 301) Personnel Costs 1,218,960 $ 1,393,350 $ 1,130,300 $ 1,467,670 $ 1,534,940 $ 5% 5% Salaries And Wages 930,555 1,028,540 850,900 1,074,640 1,117,460 4% 4% Benefits 288,406 364,810 279,400 393,030 417,480 8% 6% Departmental Costs 230,750 203,780 290,780 179,500 184,200 -12% 3% Professional Services 96,933 10,000 100,000 10,000 10,000 0% 0% Project-Specific - 45,000 45,000 - - -100% N/A Audit Services 56,100 50,600 50,600 62,000 64,000 23% 3% Investment Services 23,724 42,000 40,000 43,500 43,500 4% 0% Bank Fees 8,707 14,000 13,000 13,000 13,500 -7% 4% Merchant Card Services 13,560 - - - - N/A N/A Financial Accounting Services 31,727 42,180 42,180 51,000 53,200 21% 4% Subtotal Finance Administration 1,449,710 1,597,130 1,421,080 1,647,170 1,719,140 3% 4% Sales Tax (001 302) Departmental Costs 78,223 238,000 220,000 238,500 244,000 0% 2% Professional Services 67,498 215,000 200,000 215,000 220,000 0% 2% Lockbox Fees 10,725 23,000 20,000 23,500 24,000 2% 2% Subtotal Sales Tax 78,223 238,000 220,000 238,500 244,000 0% 2% Risk Management (001 303) Departmental Costs 350,040 390,000 346,500 386,500 404,500 -1% 5% Property & Casualty 328,758 375,000 330,000 370,000 386,500 -1% 4% Workers Compensation Insurance 21,282 15,000 16,500 16,500 18,000 10% 9% Subtotal Risk Management 350,040 390,000 346,500 386,500 404,500 -1% 5% TOTAL FINANCE 1,877,972 $ 2,225,130 $ 1,987,580 $ 2,272,170 $ 2,367,640 $ 2% 4% BIENNIAL BUDGET % Change 93
(001 300)
Finance
• Managed American Rescue Plan Act funding requirements and reports
• Completed in-depth long-range financial forecast for expenditures and revenues to support fiscal sustainability
• Worked with Council, Budget Committee and City departments to implement biennial budgeting, improving transparency and long-range planning
• Worked with new investment advisors to maintain the City’s investments prudently and strategically
• Received the GFOA Distinguished Budget Presentation Award for 2022 Budget
• Worked with City Manager’s Office, City Clerk’s Office and City Council to refer a lodging tax ballot question to voters
• Implement new Governmental Accounting Standards Board Statement 87
• Continue to optimize City financial software for additional functionality to increase transparency and oversight
• Implement collection and administration of retail bag fee pursuant to state law
• Review and provide long-range financial forecasting to the City Council as part of the City’s Strategic Planning
• Work with investment advisors to review the City’s investments and determine areas to consolidate holdings
• Implement new Governmental Accounting Standards Board Statement 96
• Increase EFT payments to vendors/suppliers, reducing demand for paper checks and improving security
94
FINANCE 14.0 FTE
95 Finance City Manager Finance Director (1) Accounting Manager (1) Senior Accountant (1) Accountant (2) Accounting Technician (2) Purchasing Manager (1) Purchasing Specialist, Buyer (1) Revenue Manager (1) Financial Analyst (1) Finance Assistant and Payroll Technician (1) Sales and Use Tax Technician (2) Sales and Use Tax Audits
Human Resources
Department description and budget detail
The Human Resources Department is responsible for providing a full range of comprehensive human resources programs while ensuring compliance with federal, state and local employment law. This department provides employees with the highest level of quality service and support in essential areas such as employee and employer relations, recruitment and selection, policy development, training and development, benefits, compensation, personnel records management and investigation and resolution of internal complaints. The Human Resources Department is a collaborative partner with internal departments to support
multiple personnel, staffing and other human resourcesrelated needs.
By providing quality service to our internal customers, the Human Resources Department empowers employees so they can accomplish their goals and objectives for City Council and the citizens of Centennial. Employees are offered a fair and ethical human resources department, assisting them in a multitude of personnel matters that may arise during their career with the City.
HUMAN RESOURCES (001
YEAR 1 YEAR 2 BUDGET 2021 2022 2022 2023 2024 2023 Budget 2024 Budget DETAIL Actual Adopted Revised Budget Budget to 2022 Adopted to 2023 Budget Personnel Costs 322,217 $ 394,500 $ 416,070 $ 400,460 $ 421,850 $ 2% 5% Salaries And Wages 243,738 285,480 304,570 297,890 309,770 4% 4% Benefits 78,479 109,020 111,500 102,570 112,080 -6% 9% Departmental Costs 15,692 11,000 11,000 27,000 12,000 145% -56% Professional Services 360 - - - - N/A N/A Project-Specific 10,675 6,000 6,000 21,000 6,000 250% -71% Onboarding And Recruitment 4,657 5,000 5,000 6,000 6,000 20% 0% TOTAL HUMAN RESOURCES 337,910 $ 405,500 $ 427,070 $ 427,460 $ 433,850 $ 5% 1% BIENNIAL BUDGET % Change 96
401)
Human Resources
• Maintained an average days-to-fill for position vacancies rate of 67.25
• Offered a total of 35 internal trainings for City Staff
• Continued supporting employee engagement activities, resulting in the sixth consecutive Gallup Exceptional Workplace award recognition for the City
• In partnership with a third-party consultant, implemented a revised salary structure and kept medical insurance increase to <5%
• Provide expert administration of compensation and benefits programs to both contain costs and remain competitive in the marketplace; conduct third-party compensation review
• Strive for ongoing improvement in manager development
• Provide support and training for employee relations and performance development
HUMAN RESOURCES 3.0 FTE
97
City Manager
Human Resources Director (1) Human Resources Generalist and Recruiting Manager (1) Human Resources Assistant (1)
Department description and budget detail Municipal Court
The mission of the City of Centennial Municipal Court is to efficiently and expeditiously adjudicate all cases filed within our jurisdiction while providing exemplary customer service. The Municipal Court adjudicates traffic, animal control, code
compliance and general code violations of the City. Court staff assist the presiding municipal court judge and prosecutors with various legal duties.
YEAR 1 YEAR 2 BUDGET 2021 2022 2022 2023 2024 2023 Budget 2024 Budget DETAIL Actual Adopted Revised Budget Budget to 2022 Adopted to 2023 Budget Personnel Costs 350,032 $ 248,080 $ 264,730 $ 350,410 $ 356,340 $ 41% 2% Salaries And Wages 258,825 189,720 204,460 257,360 267,600 36% 4% Benefits 91,207 58,360 60,270 93,050 88,740 59% -5% Departmental Costs 79,042 88,800 88,800 88,800 93,000 0% 5% Professional Services 9,821 22,000 22,000 22,000 22,000 0% 0% Printing Services - 1,000 1,000 1,000 1,000 0% 0% Merchant Card Services 8,388 - - - - N/A N/A Judge Services 44,004 45,800 45,800 45,800 50,000 0% 9% Prosecutor Services 16,830 20,000 20,000 20,000 20,000 0% 0% TOTAL MUNICIPAL COURT 429,075 $ 336,880 $ 353,530 $ 439,210 $ 449,340 $ 30% 2% BIENNIAL BUDGET % Change 98
MUNICIPAL COURT (001 500)
Municipal Court
• Restarted Teen Court after pause resulting from the impacts of the COVID-19 pandemic
• Implemented secure file transfer dropbox for Centennial Animal Services to transfer Court tickets and related documents
• Updated pro se packet for defendants requesting trials
• Cross-trained City Clerk’s Office Staff and Court Staff as Passport Agents
• Implement text notifications to defendants to reduce failure-to-appear
99
City Manager City Clerk and Municipal Court Director (0.5) Senior Court Clerk (1) Deputy Court Clerk (2) Administrative Assistant (0.5) MUNICIPAL COURT 4.0 FTE
Office of Information Technology
Department description and budget detail
The Office of Information Technology is composed of two teams: Technical Services and Service Desk & Applications Support. OIT supports the current and future technology, mapping and data needs and information technology initiatives to enhance City operations and further the vision of the City.
RESPONSIBILITIES INCLUDE
• Managing all duties assigned to the IT Service Desk to support their ability to meet Key Performance Measures
• Ensuring the City has properly maintained and wellfunctioning technology hardware; this includes desktops, laptops, phones, servers and all other computing devices
• Supporting major and minor updates to software suites, and support operations in evaluating all software needs
• Maintaining a current and accurate geospatial database that is a resource for residents, business owners, Council, Staff and contractors
• Providing continual updates and enhancements to external and internal facing GIS maps
• Providing constant analysis of new or enhanced services that meet ever-changing needs of residents, business owners and the internal operations of the City
100
Office of Information Technology
101
OFFICE OF INFORMATION TECHNOLOGY (001 410) YEAR 1 YEAR 2 BUDGET 2021 2022 2022 2023 2024 2023 Budget 2024 Budget DETAIL Actual Adopted Revised Budget Budget to 2022 Adopted to 2023 Budget OIT Administration (001 411) Personnel Costs $ 231,356 $ 237,240 $ 244,380 $ 399,470 $ 419,400 68% 5% Salaries And Wages 191,133 187,520 193,840 309,160 321,490 65% 4% Benefits 40,223 49,720 50,540 90,310 97,910 82% 8% Subtotal OIT Administration 231,356 237,240 244,380 399,470 419,400 68% 5% Client Services (001 412) Personnel Costs 223,547 308,170 333,310 727,960 766,240 136% 5% Salaries And Wages 164,776 217,880 240,130 542,100 563,700 149% 4% Benefits 58,770 90,290 93,180 185,860 202,540 106% 9% Departmental Costs 549,402 756,080 856,080 2,446,110 2,436,852 224% 0% Office Supplies - - - - - N/A N/A Computer Supplies 10,605 16,000 16,000 17,280 18,670 8% 8% Non-Capital Equipment 37,790 73,000 73,000 74,000 60,000 1% -19% Professional Services 75,961 - 100,000 60,000 62,000 N/A 3% Project-Specific 49,238 161,600 161,600 770,000 589,000 376% -24% IT Services 64,978 72,000 72,000 354,200 385,870 392% 9% Software Licenses And Maintenance 190,734 240,880 240,880 988,930 1,128,220 311% 14% Software Other 4,231 15,000 15,000 - - -100% N/A Equipment 32,099 - - - - N/A N/A Copiers 13,897 30,000 30,000 39,300 39,300 31% 0% Telecommunications 34,157 78,400 78,400 80,000 86,400 2% 8% Cell Phones 35,604 69,200 69,200 62,400 67,392 -10% 8% Alarm And Fax Lines 108 - - - - N/A N/A Subtotal Client Services 772,949 1,064,250 1,189,390 3,174,070 3,203,092 198% 1% Technical Services (001 413) Personnel Costs 656,196 683,100 715,510 1,005,210 1,061,270 47% 6% Salaries And Wages 499,093 534,660 563,340 725,270 754,180 36% 4% Benefits 157,103 148,440 152,170 279,940 307,090 89% 10% Departmental Costs 355,731 407,840 407,840 442,600 320,828 9% -28% Computer Supplies 348 - - - - N/A N/A Non-Capital Equipment 7,736 - - - - N/A N/A Professional Services 35,900 80,000 80,000 201,600 203,328 152% 1% Project-Specific 131,409 39,500 39,500 150,000 105,000 280% -30% IT Services 157,643 210,250 210,250 - - -100% N/A Software License And Maintenance 22,695 78,090 78,090 91,000 12,500 17% -86% Subtotal Technical Services 1,011,927 1,090,940 1,123,350 1,447,810 1,382,098 33% -5% Analytical & GIS Services (001 414) Personnel Costs 299,162 314,370 328,840 - - -100% N/A Salaries And Wages 218,472 226,860 239,670 - - -100% N/A Benefits 80,690 87,510 89,170 - - -100% N/A Departmental Costs 71,279 176,440 176,440 - - -100% N/A Professional Services 20,472 90,000 90,000 - - -100% N/A Software Licenses And Maintenance 50,807 86,440 86,440 - - -100% N/A Subtotal Analytical & GIS Services 370,441 490,810 505,280 - - -100% N/A Enterprise Services (001 415) Personnel Costs 473,625 583,780 587,040 - - -100% N/A Salaries And Wages 344,067 407,790 410,670 - - -100% N/A Benefits 129,558 175,990 176,370 - - -100% N/A Departmental Costs 312,333 458,330 458,330 - - -100% N/A Project-Specific 12,064 - - - - N/A N/A IT Services 142,233 147,000 147,000 - - -100% N/A Software Licenses And Maintenance 158,036 311,330 311,330 - - -100% N/A Subtotal Enterprise Services 785,958 1,042,110 1,045,370 - - -100% N/A TOTAL OFFICE OF INFORMATION TECHNOLOGY 3,172,631 $ 3,925,350 $ 4,107,770 $ 5,021,350 $ 5,004,590 $ 28% 0% BIENNIAL BUDGET % Change
Office of Information Technology
• Supported records management through the implementation of an email retention policy
• Successfully planned, implemented and integrated several major hardware and software changes; supported initiatives leveraging cloud-based services
• Implemented secondary connection for improved internet service resiliency through partnership with Centennial FiberWorks
• Enhanced GIS capabilities to include 3-D imagery and support City services
• Assisted Public Works Department in the deployment and implementation of the Intelligent Transportation System
• Drove implementation of a new asset management system for the City in support of Public Works
• Implement immersive collaboration capabilities
• Simplify and develop governance for technical architecture
• Complete integration of enterprise systems
• Leverage automation to deliver process optimization
• Support digital accessibility assessment of City website and services
102
Office of Information Technology
103
Assistant City Manager IT Director and Chief Information Officer (1) Service Desk and Applications Support Manager (1) Business Analyst (1) Applications Specialist (3) Senior Client Systems Admin (1) Client Systems Admin (1) Financial Application Administrator (1) Administrative Assistant (0.5) Senior Data Architect (1) Technical Services Manager (1) Cyber Security and Network Engineer (1) Systems Architect (1) Systems Engineer (1) Senior Systems Admin (1) Senior GIS Analyst (1) GIS Analyst (1) INFORMATION TECHNOLOGY 17.5 FTE
Office of Strategic Initiatives Department
description and budget detail
The Office of Strategic Initiatives leads strategic endeavors, manages and supports projects and programs and fosters continuous improvement and innovation in the City. OSI supports strategic planning, budgeting, performance measurement and continuous improvement for the City. OSI also manages the Centennial Fiber Fund, administers
emergency management in partnership with the Arapahoe County Sheriff’s Office, manages the City’s general improvement districts as well as franchise agreements and works with others in the organization to support various larger policy initiatives.
• Working with the Arapahoe County Sheriff’s Office, developed and applied for grant to underground CORE power lines
• Completed Fiber Master Plan addendum; adopted fiberready codes with Community and Economic Development
• Completed a multi-party joint fiber build in The District
• Implemented sustainability solutions for the City including establishing electric vehicle fleet stations, electrifying City fleet and installing rooftop solar panels
• Complete fence replacement in the Willow Creek 1 & 2 General Improvement Districts
• Continue work with City Council, Arapahoe County and other community partners to address homelessness issues
• Evaluate splash pad reconstruction at Centennial Center Park
• Implement strategies for digital accessibility with Communications and Information Technology Departments
• Complete solar install at Civic Center as well as measurement and verification of energy performance contract and Electric Vehicle Action Plan
104
OF STRATEGIC INITIATIVES
YEAR 1 YEAR 2 BUDGET 2021 2022 2022 2023 2024 2023 Budget 2024 Budget DETAIL Actual Adopted Revised Budget Budget to 2022 Adopted to 2023 Budget Personnel Costs $ 502,979 $ 554,740 $ 586,180 $ 386,780 $ 408,630 -30% 6% Salaries And Wages 440,407 421,710 449,540 276,950 287,990 -34% 4% Benefits 62,572 133,030 136,640 109,830 120,640 -17% 10% Departmental Costs 32,421 44,500 44,500 22,500 12,500 -49% -44% Professional Services 1,250 2,500 2,500 16,500 6,500 560% -61% Project-Specific 31,171 42,000 42,000 6,000 6,000 -86% 0% TOTAL OFFICE OF STRATEGIC INITIATIVES 535,401 $ 599,240 $ 630,680 $ 409,280 $ 421,130 $ -32% 3% BIENNIAL BUDGET % Change
OFFICE
(001 430)
Office of Strategic Initiatives
STRATEGIC INITIATIVES 3.0 FTE
105
City Manager Strategic Initiatives Manager (1)
Assistant
Senior Management Analyst (1) Management Analyst (1)
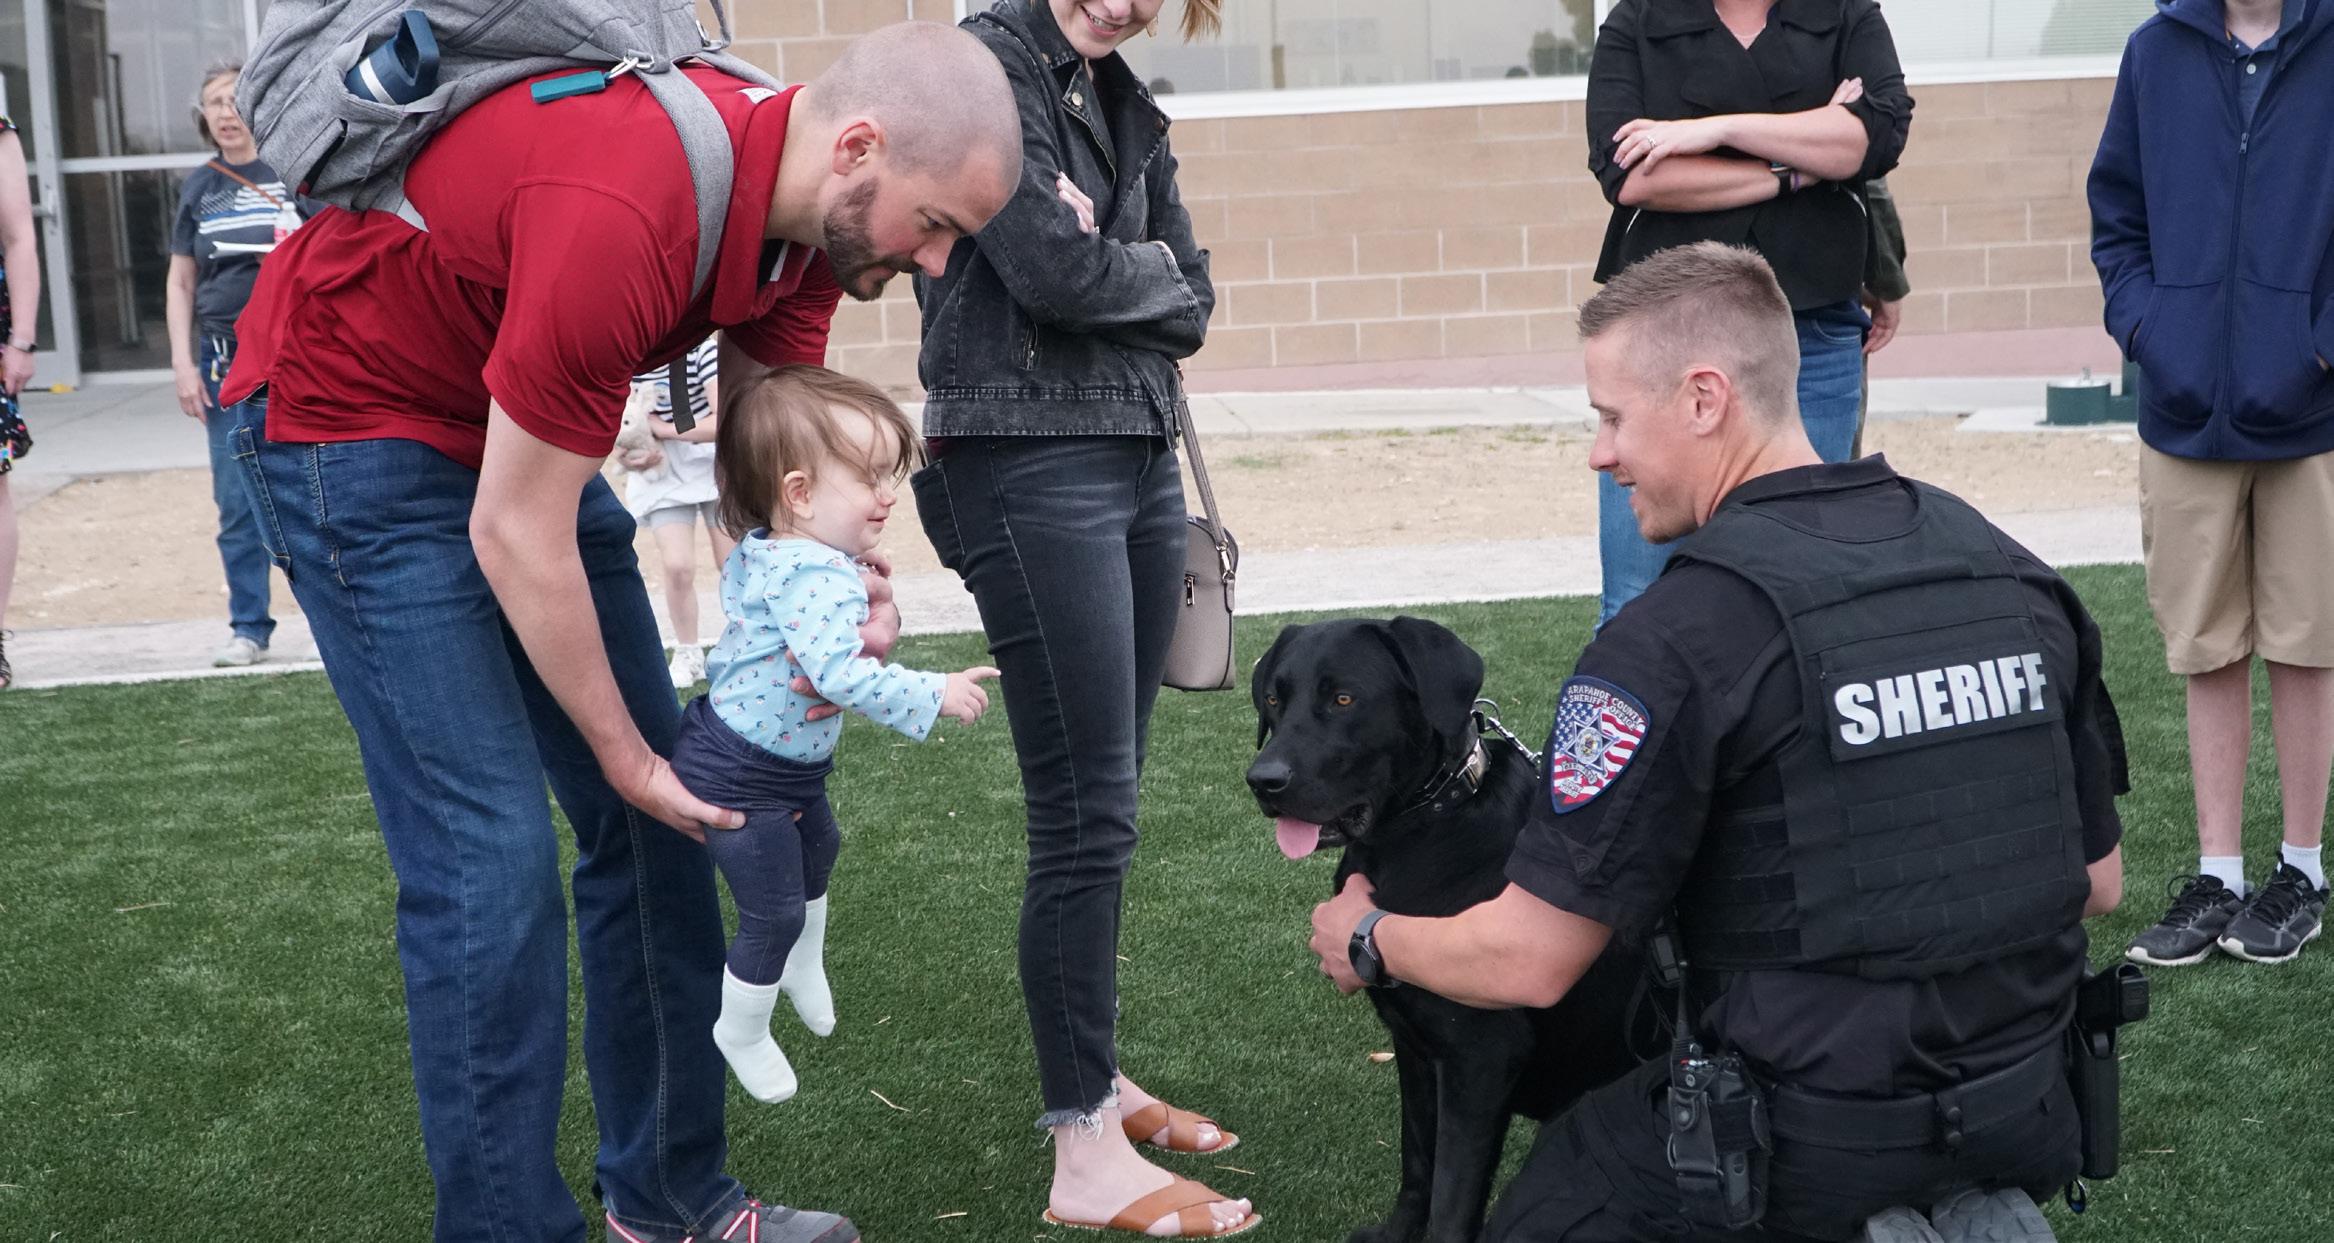
Public Safety
Department description and budget detail
The Arapahoe County Sheriff’s Office provides a full range of law enforcement and public safety services to the citizens of Centennial through a multi-year agreement. These services include uniformed patrol, traffic safety, criminal investigation, emergency management, community resources, school resource officers, SWAT, bomb squad and records
management. The ACSO has been nationally accredited since 1988. The agency is committed to fostering Centennial’s high quality of life through innovative City-wide programs and services, including graffiti cleanup, community resource and crime prevention and community service specialists.
PUBLIC SAFETY (001 510) YEAR 1 YEAR 2 BUDGET 2021 2022 2022 2023 2024 2023 Budget 2024 Budget DETAIL Actual Adopted Revised Budget Budget to 2022 Adopted to 2023 Budget Departmental Costs 30,053,397 $ 32,325,100 $ 32,325,100 $ 34,179,580 $ 36,084,150 $ 6% 6% Public Safety Contract 30,053,397 32,325,100 32,325,100 34,179,580 36,084,150 6% 6% TOTAL PUBLIC SAFTEY 30,053,397 $ 32,325,100 $ 32,325,100 $ 34,179,580 $ 36,084,150 $ 6% 6% BIENNIAL BUDGET % Change 106
Department description and budget detail Public Works
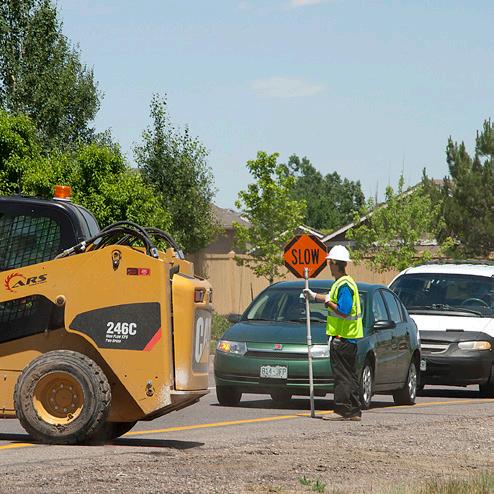
Public Works administration manages all functions of the department to provide a well-functioning and well-maintained street system to ensure safe and efficient transportation for the public. It manages and coordinates work activities for public works capital improvements, transportation planning, traffic engineering and street maintenance. It also manages information services for the department, which includes the business systems (i.e., phones and computers) and the 24-hour Citizen Response Center. The department is responsible for coordinating the activities of contractors and utility providers for work in the public right-of-way for new developments; issuing development permits; and coordinating and inspecting construction for all new developments.
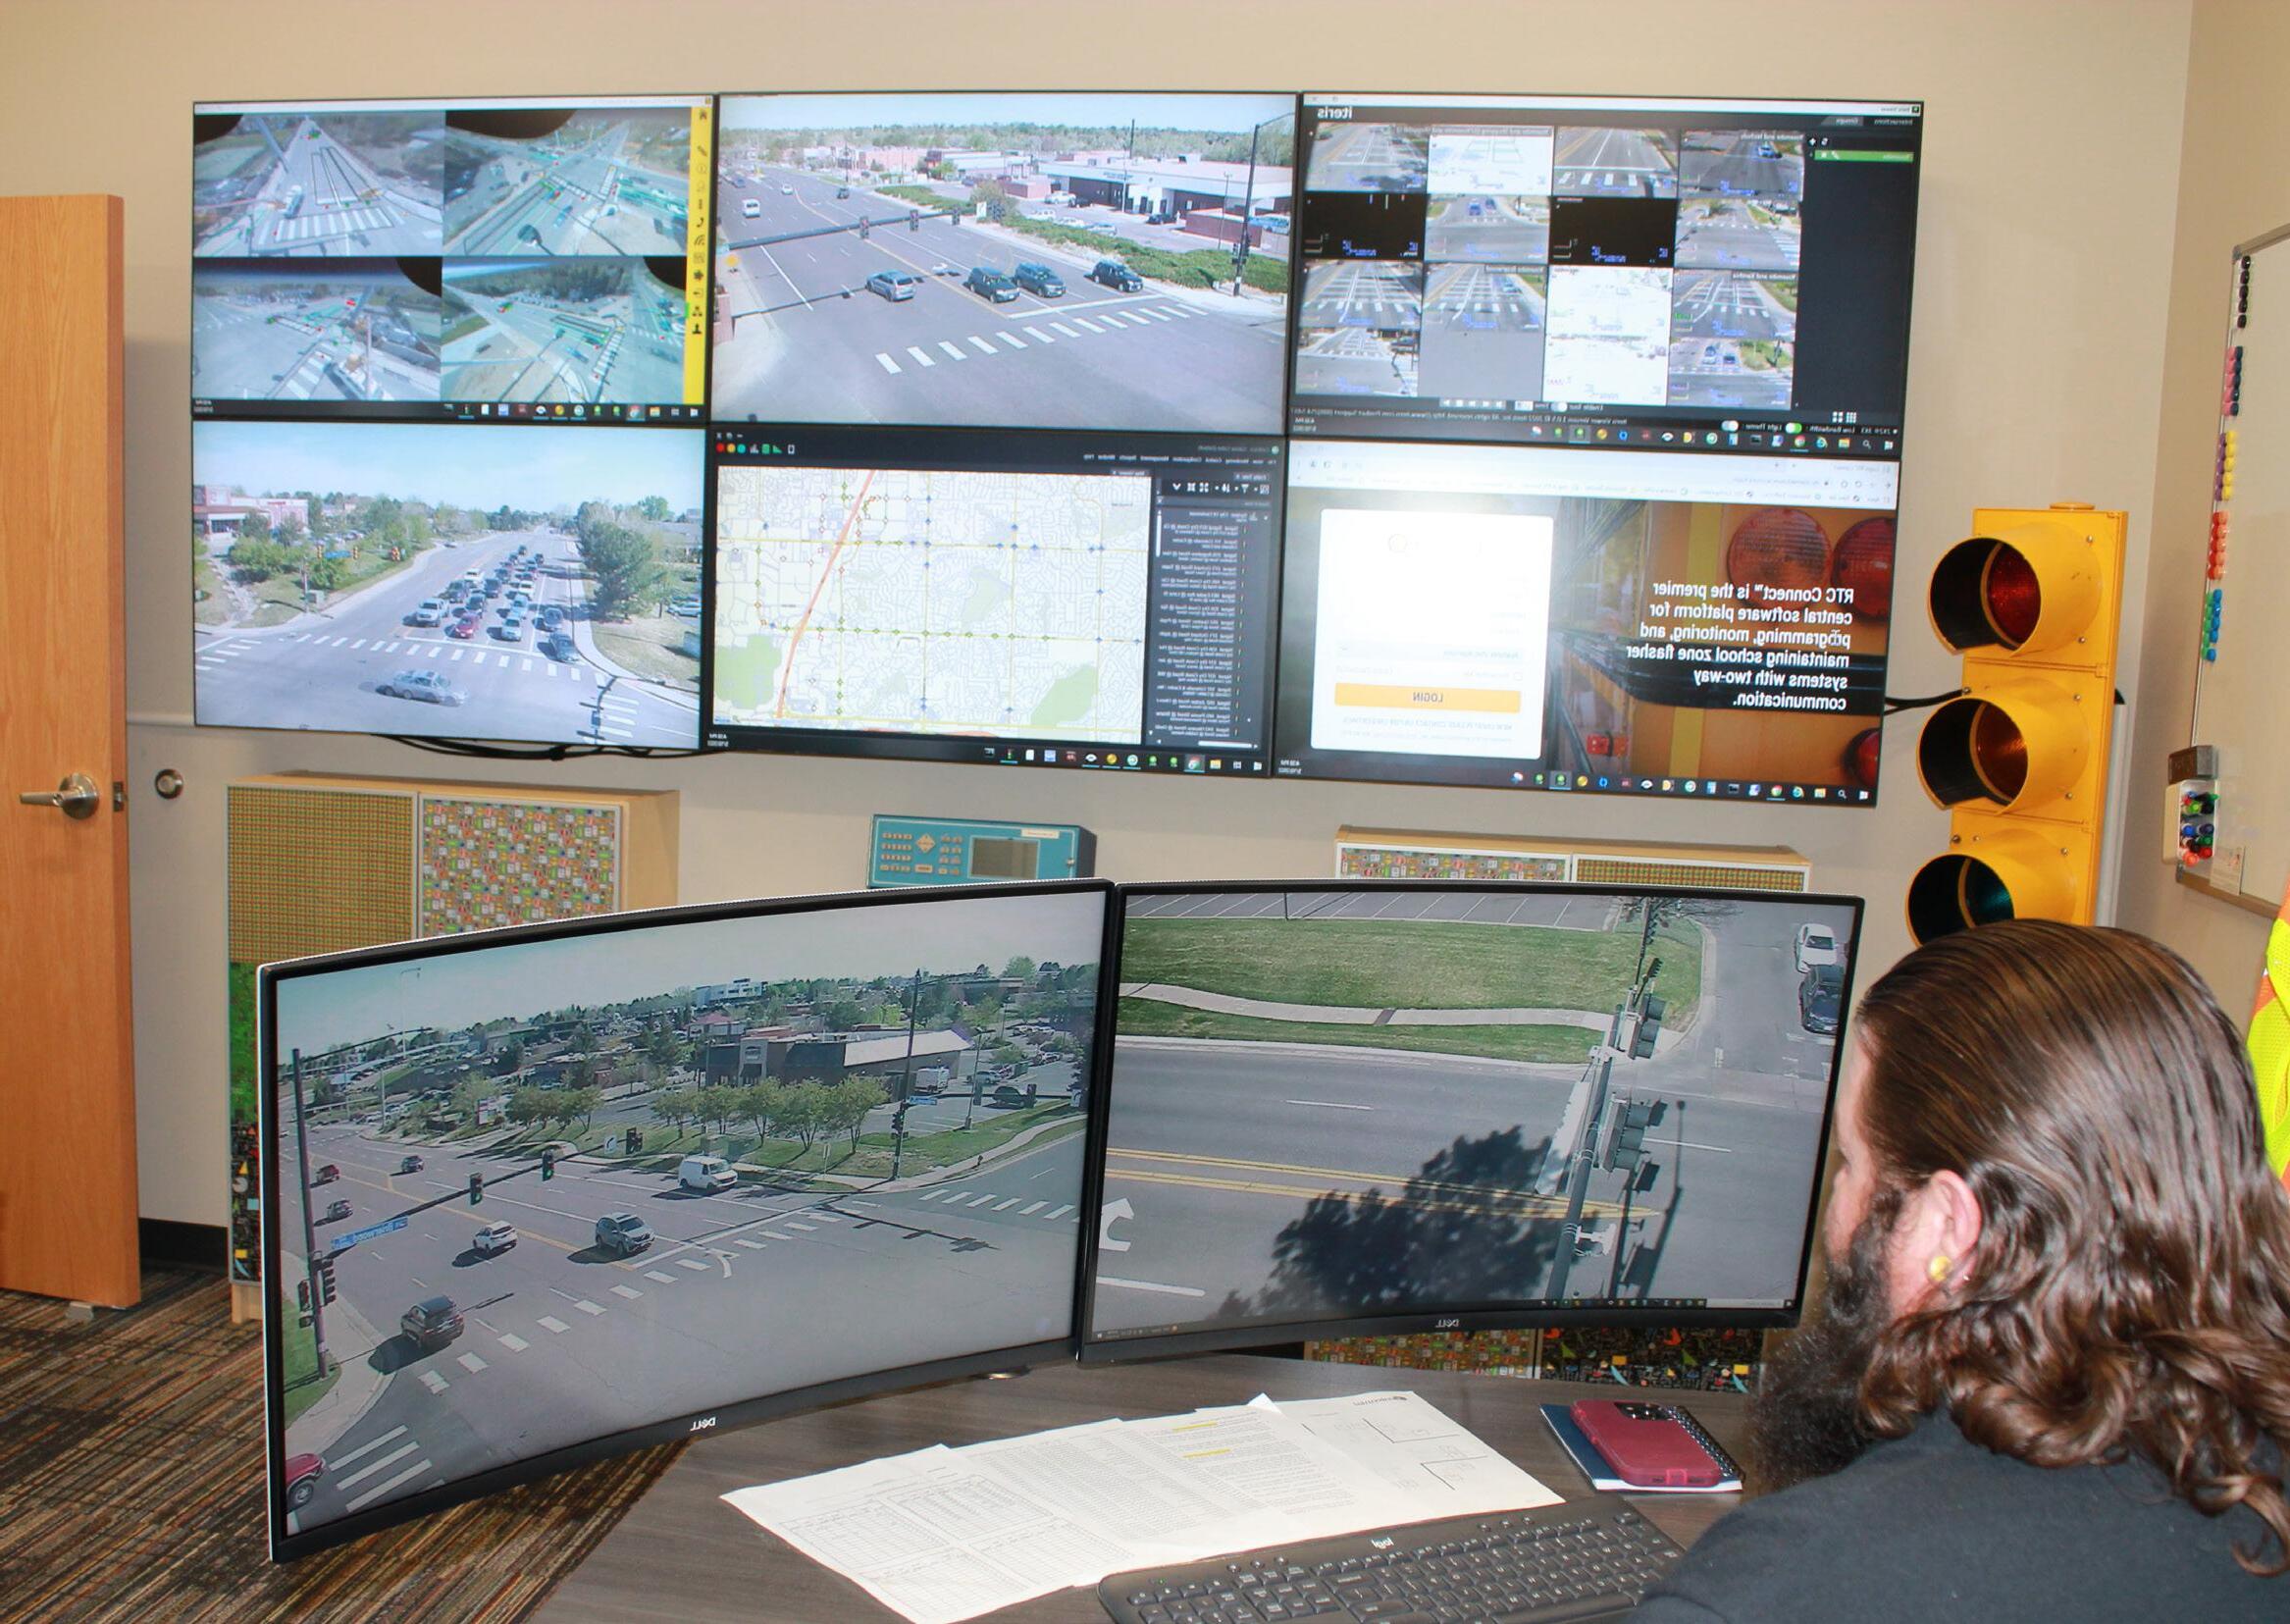
The Traffic Engineering Services division is responsible for transportation planning, traffic engineering and neighborhood safety to provide a safe and efficient transportation system for City residents and commuters. The division works with state and local transportation agencies to coordinate efforts to improve the transportation network. It also manages the collection of traffic data, reviews development plans and traffic studies, manages traffic signs and pavement marking programs, manages the operation and maintenance of traffic signals, reviews and anayzes accident data and identifies and recommends intersection improvements.
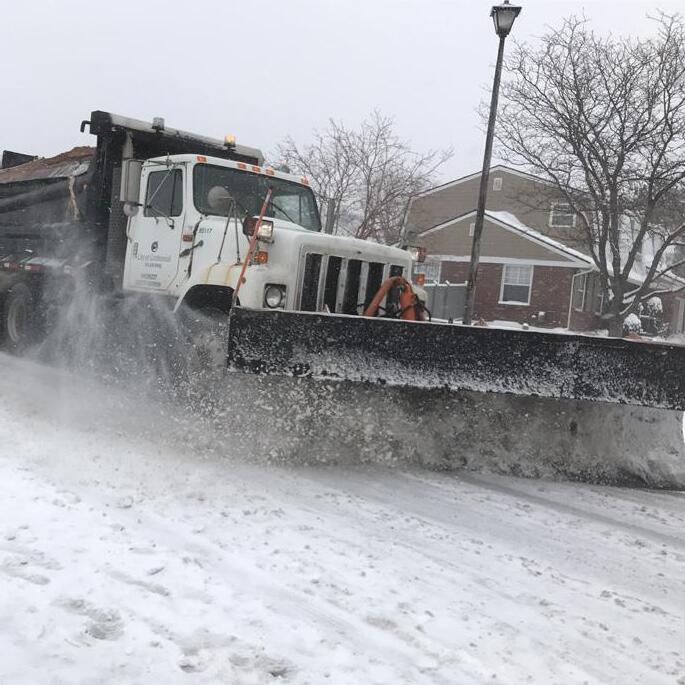
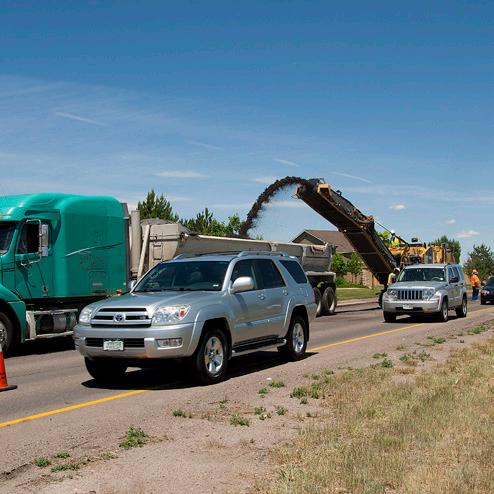
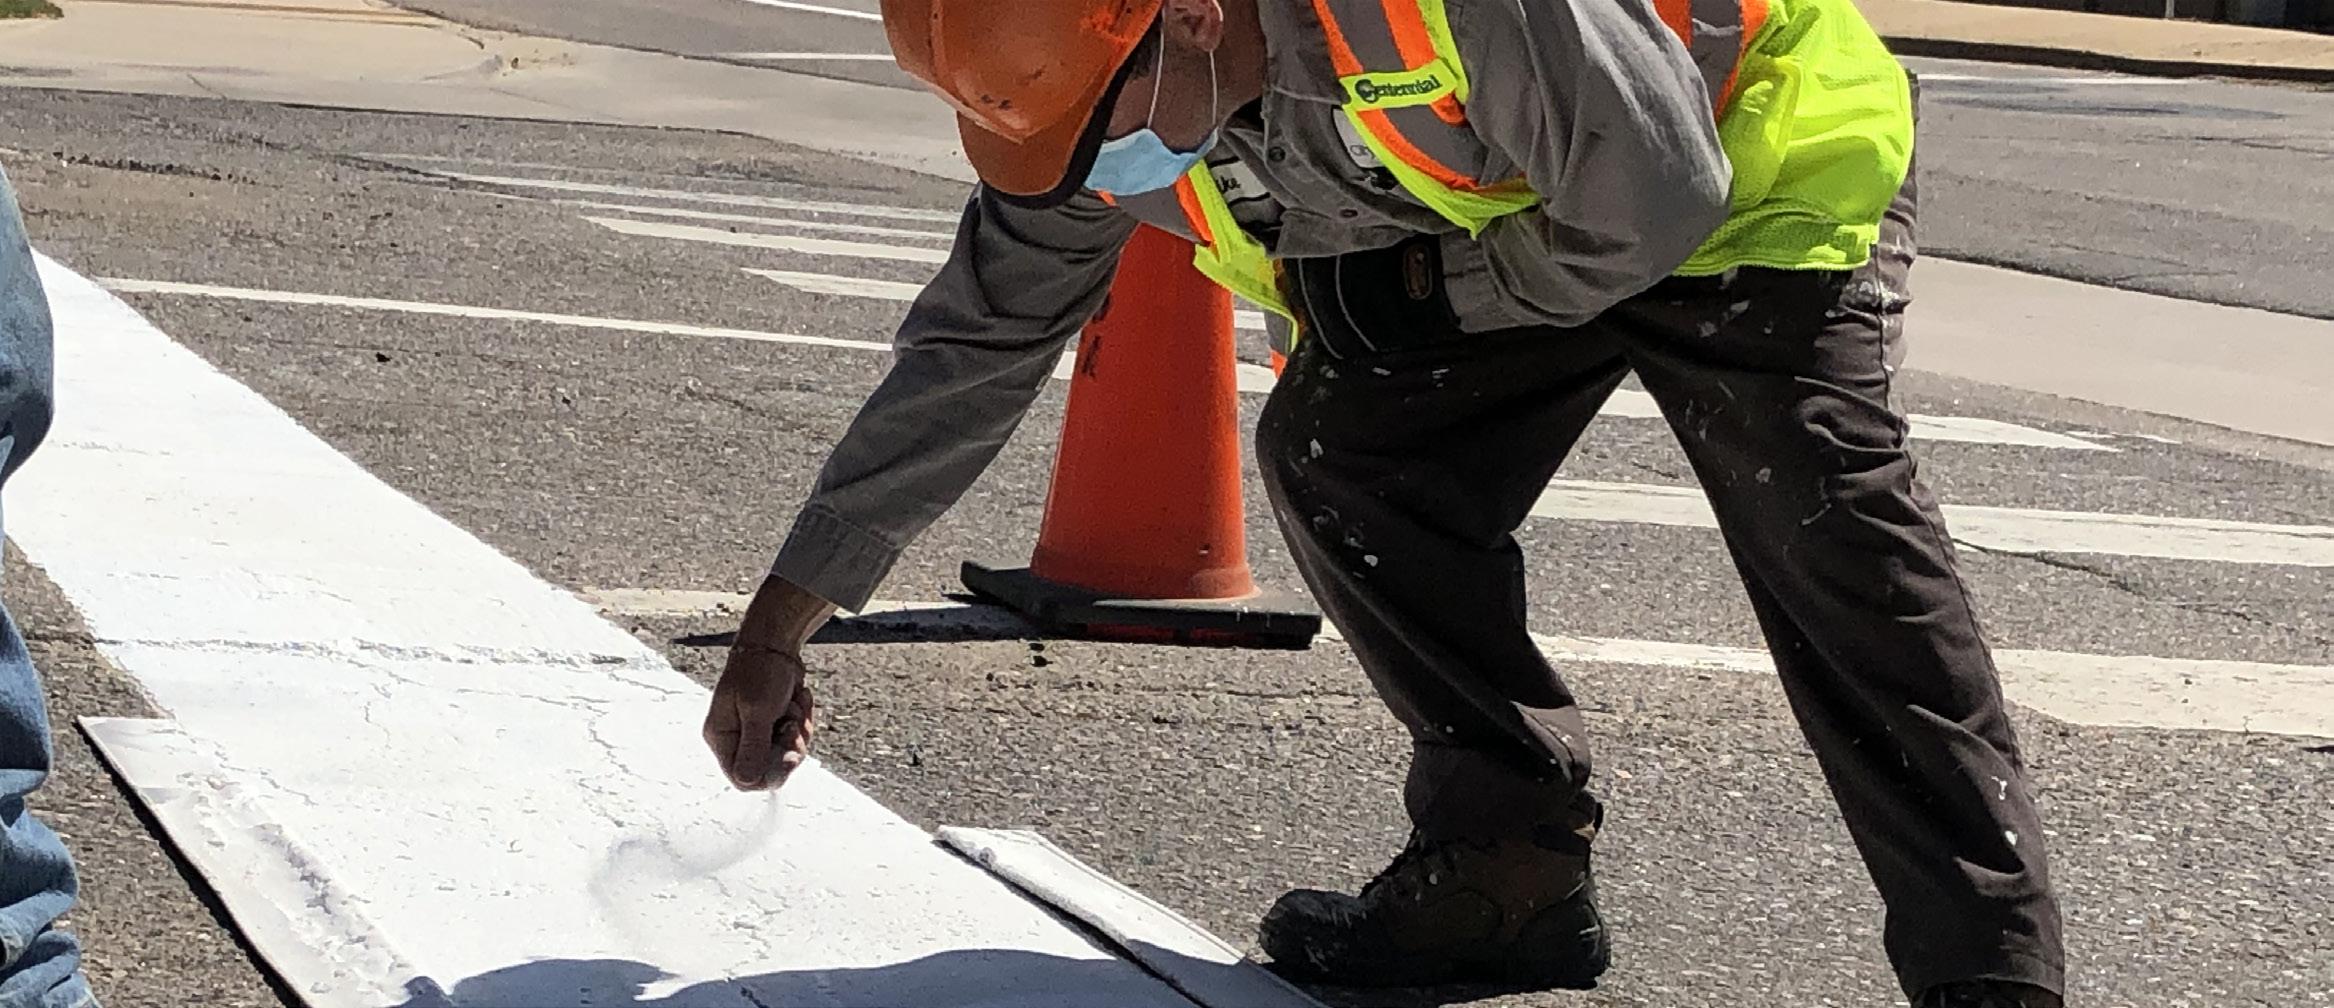
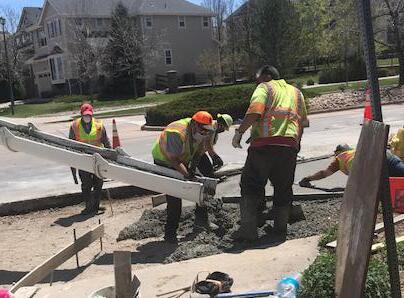
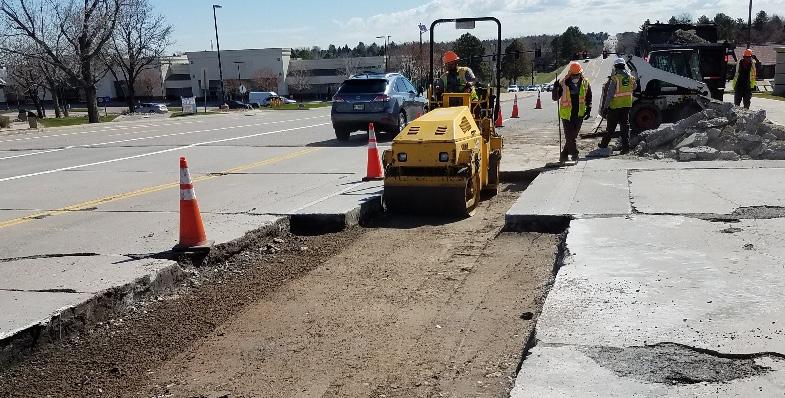
Field Services provides a well-maintained street system through its street sweeping, mowing, pavement patching, concrete replacement, crack sealing, lane striping, pavement marking and sign maintenance programs. It also provides snow removal services for the City’s designated priority streets. The division is responsible for coordinating the activities of utility providers, is-suing permits and inspecting construction for all work within the public right-of-way.
Facilities and Fleet provide ongoing maintenance to the City’s buildings, park and fleet assets. This includes: providing operational oversight and monitoring services for Centennial Center Park; landscape maintenance; inspection and maintenance of playground and park equipment; regular and routine maintenance on fleet vehicles; general maintenance at the Civic Center and public works facility; performing condition assessment on the City’s equipment; and snow removal, all while minimizing interruptions of the day-to-day operations of citizens, employees and general City business.
107
Public Works
PUBLIC WORKS (001 600) YEAR 1 YEAR 2 BUDGET 2021 2022 2022 2023 2024 2023 Budget 2024 Budget DETAIL Actual Adopted Revised Budget Budget to 2022 Adopted to 2023 Budget Public Works Administration (001 601) Personnel Costs 790,304 $ 801,870 $ 842,970 $ 932,130 $ 981,330 $ 16% 5% Salaries And Wages 586,595 590,350 626,720 698,620 726,460 18% 4% Benefits 203,709 211,520 216,250 233,510 254,870 10% 9% Departmental Costs 8,514,469 9,146,010 9,146,010 194,000 195,000 -98% 1% Materials Fuel (96,132) - - - - N/A N/A Professional Services 58,914 150,000 150,000 150,000 150,000 0% 0% Project-Specific 76,349 50,000 50,000 - - -100% N/A Public Works Contract 8,431,798 8,898,010 8,898,010 - - -100% N/A Mosquito Control 41,478 42,000 42,000 44,000 45,000 5% 2% Animal Services 2,062 6,000 6,000 - - -100% N/A Subtotal Public Works Administration 9,304,773 9,947,880 9,988,980 1,126,130 1,176,330 -89% 4% Fleet (001 602) Departmental Costs 6,840 10,500 10,500 20,000 20,000 90% 0% Fuel 1,690 1,000 1,000 5,000 5,000 400% 0% General Repair And Maintenance 5,150 9,500 9,500 15,000 15,000 58% 0% Subtotal Fleet 6,840 10,500 10,500 20,000 20,000 90% 0% Facilities (001 604) Departmental Costs 773,787 950,700 950,700 1,054,700 1,069,700 11% 1% Non-Capital Equipment 10,169 13,000 13,000 13,000 13,000 0% 0% Professional Services 84,531 90,000 90,000 125,000 125,000 39% 0% Security Services 9,154 - - 3,500 3,500 N/A 0% Facilities Contract 334,190 367,500 367,500 390,000 405,000 6% 4% Grounds Maintenance 65,457 75,000 75,000 75,000 75,000 0% 0% Park Maintenance 783 1,000 1,000 1,200 1,200 20% 0% General Repair And Maintenance 68,556 100,000 100,000 140,000 140,000 40% 0% Utilities 168,284 225,000 225,000 240,000 240,000 7% 0% Centennial Park Utilities 11,387 20,000 20,000 22,000 22,000 10% 0% Alarm and Fax Lines 8,025 15,000 15,000 15,000 15,000 0% 0% Building Improvements 9,144 10,000 10,000 10,000 10,000 0% 0% Furniture & Fixtures 4,106 34,200 34,200 20,000 20,000 -42% 0% Subtotal Facilities 773,787 950,700 950,700 1,054,700 1,069,700 11% 1% TOTAL PUBLIC WORKS 10,085,400 $ 10,909,080 $ 10,950,180 $ 2,200,830 $ 2,266,030 $ -80% 3% BIENNIAL BUDGET % Change 108
Public Works
• Completed the deployment and expansion of the City’s Intelligent Transportation System, including the completion of the traffic fiber backbone in partnership with Centennial FiberWorks
• Completed the incorporation of adaptive traffic signal control in selected corridors including Arapahoe Road, Dry Creek Road, Jordan Road, Himalaya Street and Smoky Hill Road
• Completed roadside improvement program at the Himalaya Street and Chenango Drive intersection and on Dry Creek Road between University and Clarkson Street
• Completed Smoky Hill Road Transportation Study from Buckley Road to Versailles Parkway
• Completed annual street rehabilitation program in addition to ongoing maintenance
• Conducted traffic safety analyses on various projects and construction activities and implemented recommendations
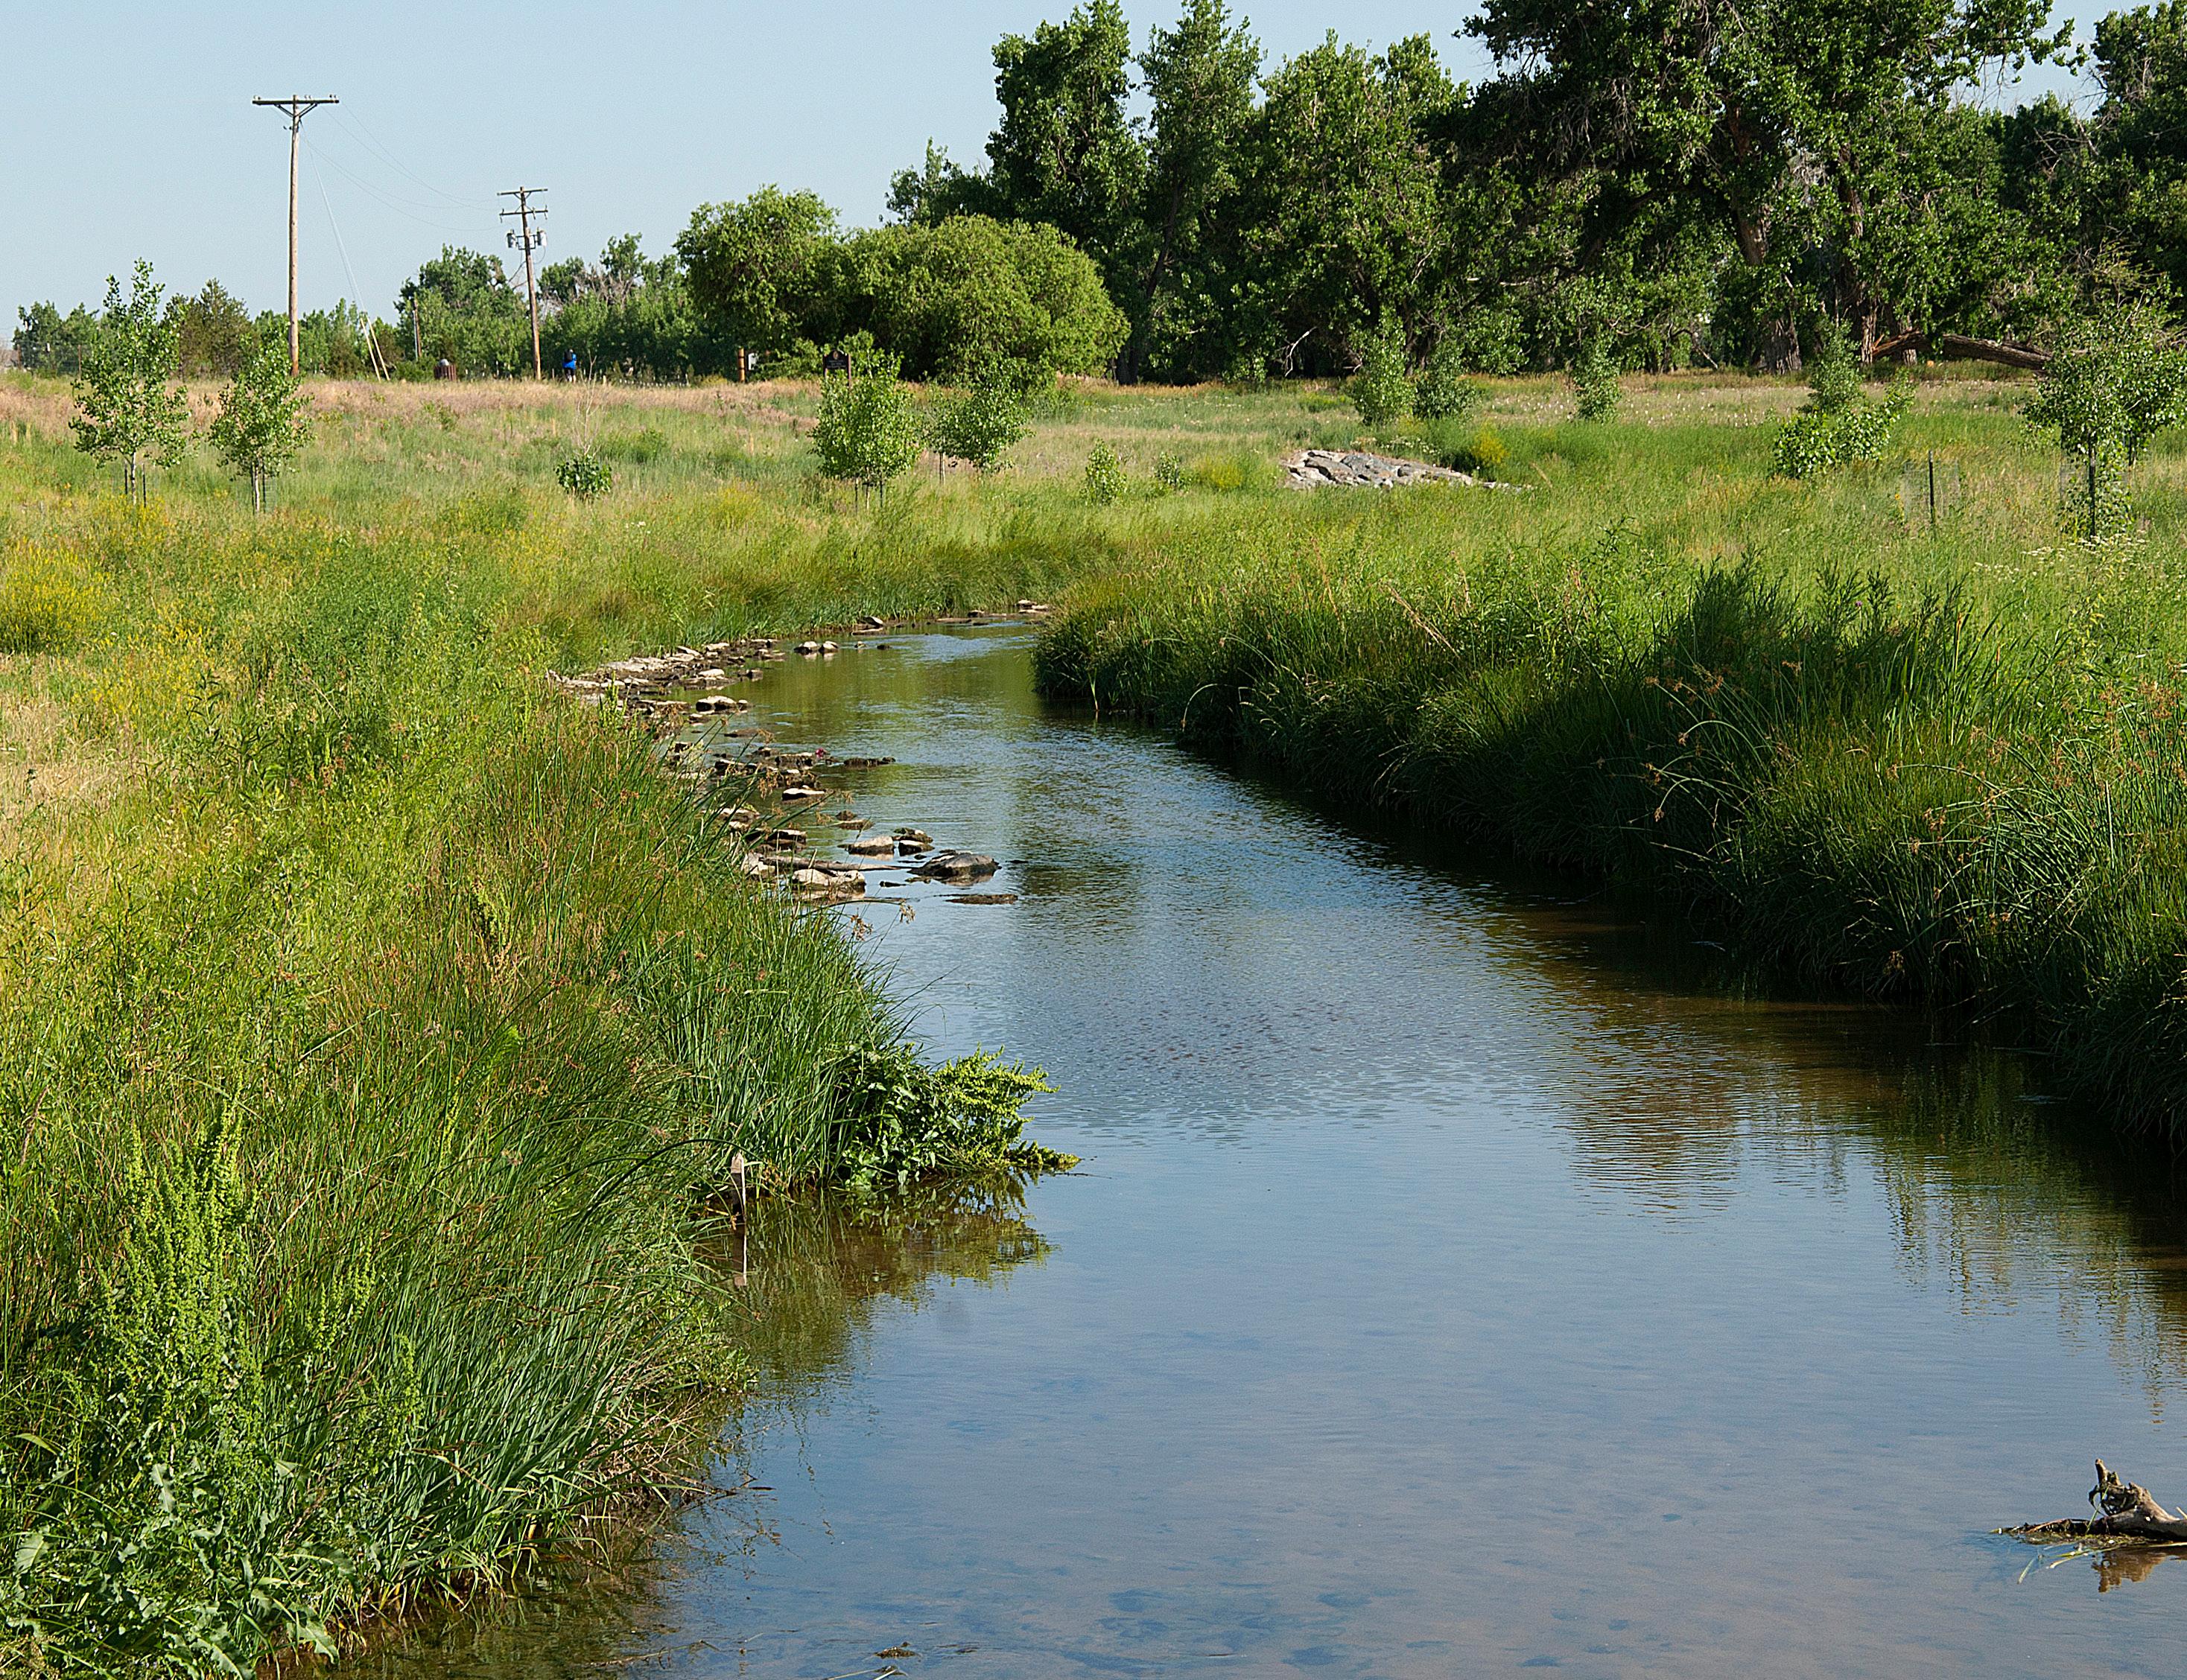
• Facilitated design and construction of Open Space trail projects
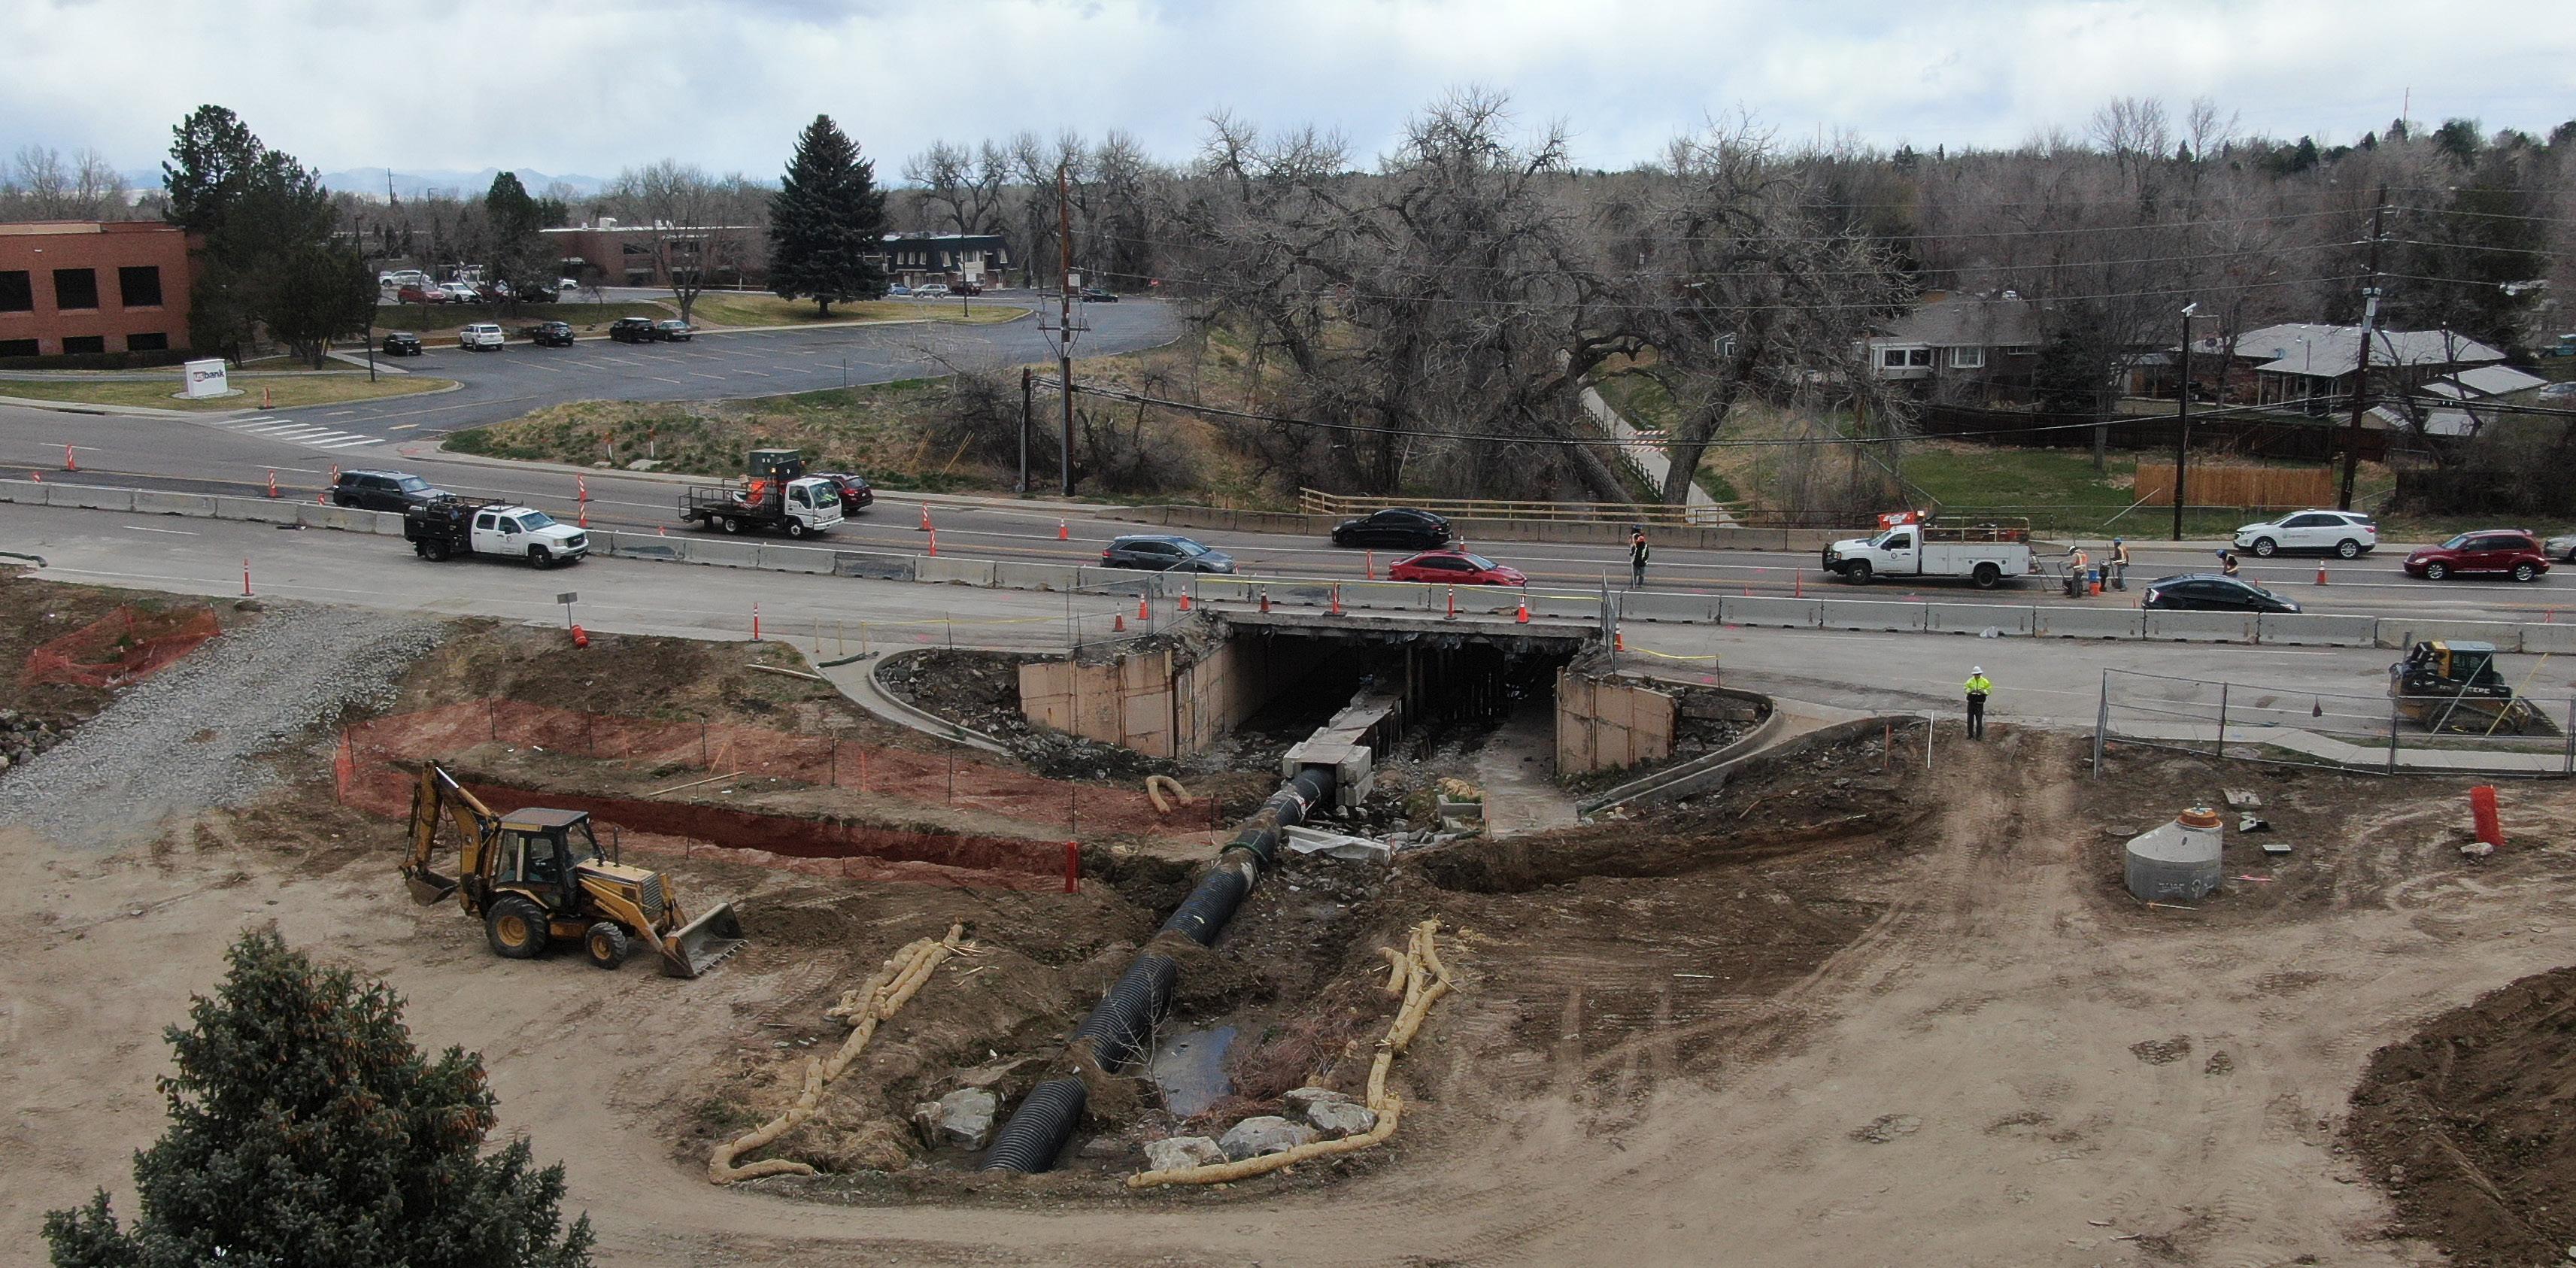
• Commenced with construction of Arapahoe Road Bridge Project over Big Dry Creek
• Completed design, easement acquisition and utilities coordination for Orchard Road widening project
• Completed design and easement acquisition for County Line road widening project between University Boulevard and Broadway
• Begin construction for the Orchard Road widening project
• Finish construction for the Arapahoe Road Bridge Replacement at Big Dry Creek Project
• Implement crosswalk safety improvements at identified intersections/crossings
• Explore options for completing pedestrian and bike corridors to improve connections to community nodes (parks, schools, community centers and access to goods and services)
• Replace end-of-life spanwire traffic signals with traffic mast arm poles
• Construction of Lone Tree Creek Trail Phase II and continued design of Phase III underpass at Arapahoe Road
• Continue construction of Arapahoe Road Bridge Trail and Highline Canal crossing at Orchard Road
109
Public Works
PUBLIC WORKS 7.5 FTE
110
Deputy City Manager Director of Public Works (1) Engineer Manager (1) Engineer I (2) Administrative Assistant (0.5) Construction and Facilities Manager (1) Construction Inspector (1) Public Works Program Manager (1) Public Works Contractor
Department description and budget detail Street Fund
STREET FUND (112) YEAR 1 YEAR 2 BUDGET 2021 2022 2022 2023 2024 2023 Budget 2024 Budget DETAIL Actual Adopted Revised Budget Budget to 2022 Adopted to 2023 Budget BEGINNING FUND BALANCE 24,682,789 $ 55,341,185 $ 55,341,185 $ 60,355,735 $ 48,446,625 $ 9% -20% Revenues Sales Tax 2,800,000 2,800,000 2,800,000 2,800,000 2,800,000 0% 0% Motor Vehicle Use Tax 6,353,336 5,800,000 5,800,000 6,250,000 6,380,000 8% 2% Highway Users Tax Fund 5,119,491 4,650,000 4,650,000 3,715,000 4,400,000 -20% 18% Road and Bridge Shareback 597,256 605,000 605,000 625,000 625,000 3% 0% Pavement Degradation Fees 49,470 40,000 40,000 40,000 40,000 0% 0% State Grants 334,266 1,450,000 1,450,000 1,450,000 - 0% -100% Federal Grants 422,264 - - - - N/A N/A Intergovernmental - Other 623,315 765,000 765,000 885,350 53,000 16% -94% Miscellaneous 6,304 - - - - N/A N/A Subtotal Revenues 16,305,702 16,110,000 16,110,000 15,765,350 14,298,000 -2% -9% Other Financing Sources Transfer In From General Fund 30,000,000 12,000,000 12,000,000 25,000,000 20,000,000 108% -20% Transfer In From Capital Improvement Fund 2,000,000 6,500,000 6,500,000 - - -100% N/A TOTAL REVENUES & TRANSFERS 48,305,702 34,610,000 34,610,000 40,765,350 34,298,000 18% -16% BIENNIAL BUDGET % Change 111
Street Fund
112
STREET FUND (112) YEAR 1 YEAR 2 BUDGET 2021 2022 2022 2023 2024 2023 Budget 2024 Budget DETAIL Actual Adopted Revised Budget Budget to 2022 Adopted to 2023 Budget Expenditures County Treasurer Fee 265,686 $ 275,000 $ 275,000 $ 312,500 $ 319,000 $ 14% 2% Roadways (603) Materials Snow Removal 620,560 650,000 650,000 700,000 700,000 8% 0% Materials Asphalt 73,718 130,000 130,000 226,000 226,000 74% 0% Materials Fuel 157,268 160,000 160,000 250,000 250,000 56% 0% Professional Services 767,877 3,026,000 3,026,000 2,072,450 550,000 -32% -73% Public Works Contract 3,824,469 4,760,190 4,760,190 15,298,760 15,652,060 221% 2% Animal Services - - - 6,000 6,000 N/A 0% Median Repairs - 60,000 60,000 30,000 30,000 -50% 0% Street Rehab 7,222,111 7,500,000 8,850,000 12,000,000 12,000,000 60% 0% Roadside Improvements 408,871 1,000,000 1,000,000 1,000,000 - 0% -100% Emergency Repairs 67,740 200,000 200,000 200,000 200,000 0% 0% Major Structures - 350,000 350,000 350,000 350,000 0% 0% Minor Structures 36,818 70,000 70,000 50,000 50,000 -29% 0% TMA Landscaping 51,553 52,000 52,000 52,000 52,000 0% 0% Roadway Data Collection 2,058 226,300 226,300 - - -100% N/A Land Acquistion 53,571 500,000 500,000 450,000 500,000 -10% 11% Roadway Improvements 391,000 1,005,000 1,005,000 1,005,000 605,000 0% -40% Capital Projects 636,493 11,700,000 11,700,000 8,500,000 - -27% -100% Neighborhood Traffic Mitigation Program 151,618 225,000 225,000 150,000 150,000 -33% 0% Subtotal Roadways 14,465,724 31,614,490 32,964,490 42,340,210 31,321,060 34% -26% Traffic Signalization (605) Professional Services - 417,000 517,000 394,000 854,735 -6% 117% Public Works Contract 637,411 684,460 684,460 - - -100% N/A Traffic Signals Maintenance 122,795 200,000 200,000 730,000 150,000 265% -79% Traffic Signals Utilities 40,995 37,500 37,500 40,000 40,000 7% 0% Traffic Signals 596,968 2,163,000 3,029,500 4,348,000 1,735,000 101% -60% ITS Project - 22,000 22,000 155,000 90,000 605% -42% Capital Projects - - - 300,000 250,000 N/A -17% Subtotal Traffic Signalization 1,398,170 3,523,960 4,490,460 5,967,000 3,119,735 69% -48% Bike & Pedestrian (607) Professional Services - - - 650,000 250,000 N/A -62% Transit & Shelter Administration - 20,000 20,000 25,000 20,000 25% -20% Roadway Improvements 55,534 40,000 40,000 50,000 400,000 25% 700% Sidewalks 458,049 1,435,000 2,140,000 1,791,000 - 25% -100% Traffic Signals - 250,000 452,500 518,750 658,750 108% 27% Subtotal Bike & Pedestrian 513,583 1,745,000 2,652,500 3,034,750 1,328,750 74% -56% Street Lighting (608) Street Light Maintenance 50,239 100,000 100,000 100,000 100,000 0% 0% Street Lighting Utilities 953,903 900,000 900,000 920,000 920,000 2% 0% Subtotal Street Lighting 1,004,142 1,000,000 1,000,000 1,020,000 1,020,000 2% 0% TOTAL EXPENDITURES 17,647,306 38,158,450 41,382,450 52,674,460 37,108,545 38% -30% NET CHANGE IN FUND BALANCE 30,658,396 (3,548,450) (6,772,450) (11,909,110) (2,810,545) ENDING FUND BALANCE 55,341,185 $ 51,792,735 $ 48,568,735 $ 48,446,625 $ 45,636,080 $ -6% -6% 25% Operating Reserve 5,479,430 $ 5,051,950 $ % Change BIENNIAL BUDGET
Street Fund
Sidewalk Reserve: Said funds shall be reserved to complete sidewalk segments identified within the City’s 10-year Capital Improvement Plan.
Easter Avenue and Havana Street Intersection: Said funds shall be applied towards the intersection improvements at Easter Avenue and Havana Street. The committed amount is 20% of the estimated $12m cost, which would be the City portion of the project.
Infrastructure Replacement Reserve: Said funds shall be applied towards the replacement of existing infrastructure owned and maintained by the City of Centennial. This may include, but is not limited to, streets, sidewalks, street lights, signal lights, and bridges.
Intersection Improvements Reserve: Said funds are committed and will be applied as warrants are approved for signal lights and associated infrastructure and other safety improvements.
Undergrounding Reserve: Said funds shall be reserved for undergrounding overhead utilities within the City of Centennial.
Emergency Capital Repairs: Said funds shall be available if emergency repairs need to be made to infrastructure, or other capital improvements and other appropriated funds are not available or insufficient to cover cost of repairs.
Capital Asset Acquisition: Said funds shall be reserved for the potential purchase of capital street-related assets by the City in the event direction is provided.
Capital Projects: Said Funds shall be reserved for projects identified in the Transportation Master Plan. 2023 and 2024 budgeted projects not included in committed fund balance.
Arapahoe Road multimodal sidepaths: Said funds shall be reserved for the 2025 construction of Arapahoe road sidepaths project (full project encumberance before DRCOG reimbursement in 2025).
Colorado Boulevard Multimodal Improvements: Said funds shall be reserved for the future construction of the Colorodo Boulevard multimodal improvements between Dry Creek and Arapahoe Road. Staff will continue to pursue federal funding to offset the full cost of these improvements. The committed amount is 20% of the estimated $8m cost, which would be the City portion of the project.
Dry Creek and Holly Spanwire Signal Upgrade : Said funds shall be reserved for the 2025 contruction of spanwire replacement traffic signals, with anticipated federal HSIP funding of $1,300,000 in 2025.
2023 2024 Committed Fund Balance 1,634,000 1,634,000 2,400,000 2,400,000 1,000,000 1,000,000 1,400,000 1,400,000 1,000,000 1,000,000 500,000 500,000 3,700,000 3,700,000 6,146,000 6,146,000 4,479,000 4,479,000 1,600,000 1,600,000 1,500,000 1,500,000 Total Committed Fund Balance 25,359,000 $ 25,359,000 $ Uncommitted Fund Balance 17,608,195 $ 15,225,130 $
Fund Balance
113
Department description and budget detail Capital Improvement Fund
Said funds have been reserved for city building improvements and major repairs to City facilities.
Funds
for making accessibility improvements to City facilities.
CAPITAL IMPROVEMENT FUND (200) YEAR 1 YEAR 2 BUDGET 2021 2022 2022 2023 2024 2023 Budget 2024 Budget DETAIL Actual Adopted Revised Budget Budget to 2022 Adopted to 2023 Budget BEGINNING FUND BALANCE 24,176,237 $ 20,751,186 $ 20,751,186 $ 11,921,186 $ 7,930,186 $ -43% -33% Other Financing Sources Transfer In From General Fund 1,280,000 - - - - N/A N/A TOTAL REVENUES & TRANSFERS 1,280,000 - - - - N/A N/A Expenditures Building Improvements 214,568 1,910,340 2,050,340 1,855,000 90,000 -3% -95% Equipment - 20,000 20,000 - - -100% N/A Vehicles 72,731 30,000 160,000 75,000 - 150% -100% ITS Project 2,187,276 1,005,000 1,469,050 981,000 255,000 -2% -74% Traffic Signals 10,267 150,000 150,000 250,000 250,000 67% 0% IT Systems 165,080 965,000 1,215,000 150,000 - -84% N/A Professional Services - 225,000 225,000 - - -100% N/A Project Specific 55,128 680,000 680,000 680,000 - 0% -100% Subtotal Expenditures 2,705,051 4,985,340 5,969,390 3,991,000 595,000 -20% -85% Other Financing Uses Transfer Out To Street Fund 2,000,000 6,500,000 6,500,000 - - -100% N/A TOTAL EXPENDITURES & TRANSFERS 4,705,051 11,485,340 12,469,390 3,991,000 595,000 -65% -85% NET CHANGE IN FUND BALANCE (3,425,051) (11,485,340) (12,469,390) (3,991,000) (595,000) ENDING FUND BALANCE 20,751,186 $ 9,265,846 $ 8,281,796 $ 7,930,186 $ 7,335,186 $ -14% -8% 2023 2024 Committed Fund Balance 5,000,000 5,000,000 750,000 750,000 Total Committed Fund Balance 5,750,000 $ 5,750,000 $ Uncommitted Fund Balance 2,180,186 $ 1,585,186 $ BIENNIAL BUDGET Building Reserve:
Building Accessibility Improvements:
reserved
% Change FUND BALANCE DETAIL 114
Department description and budget detail Open Space Fund
Balance
Said funds shall be reserved to complete future capital projects identified by City Council. Ten percent of Open Space funds annually will be put into reserve and shall carry any remaining previous year's funds. (Council Policy 2018-CCP-01): Balance includes 10% of 2019 -2022 actual, 2023 and 2024 estimated revenues. Arapahoe County IGA - Dove Valley: City's funding obligation for Dove Valley improvements per IGA. Centennial Link Trail: Said funds shall be reserved to complete the Centennial Link Trail - includes amounts for 2025 - 2027 for segments 9D, 6A, 6B, 9B and 9E. Committed amount does not include amounts budgeted in 2023 and 2024.
OPEN SPACE FUND (111) YEAR 1 YEAR 2 BUDGET 2021 2022 2022 2023 2024 2023 Budget 2024 Budget DETAIL Actual Adopted Revised Budget Budget to 2022 Adopted to 2023 Budget BEGINNING FUND BALANCE 15,036,249 $ 16,610,314 $ 16,610,314 $ 14,100,205 $ 11,101,965 $ -15% -21% Revenues Open Space Tax 3,301,172 3,400,200 3,400,200 3,926,000 4,075,000 15% 4% Park Reservations - - - 45,000 45,000 N/A 0% Interest Income 111,568 150,000 150,000 150,000 125,000 0% -17% Intergovernmental 796,366 2,250,000 2,250,000 1,500,000 868,210 -33% -42% TOTAL REVENUES 4,209,106 5,800,200 5,800,200 5,621,000 5,113,210 -3% -9% Expenditures Trails Professional Services 17,620 225,480 225,480 209,290 551,370 -7% 163% Grounds Maintenance 66,934 125,000 125,000 145,000 150,000 16% 3% OS Project Level 1 Parks and Recreation 635,648 4,850,000 5,350,000 1,071,650 200,000 -78% -81% OS Project Level 2 Lone Tree Creek Trail 1,200,769 4,415,000 4,415,000 2,940,000 5,050,000 -33% 72% City Priority Projects 399,737 1,870,000 1,870,000 2,200,000 705,000 18% -68% Neighborhood Trail Connections - 25,000 25,000 25,000 25,000 0% 0% OS Project Level 3 Regional Partnerships 314,333 893,930 1,227,205 2,028,300 833,500 127% -59% TOTAL EXPENDITURES 2,635,041 12,404,410 13,237,685 8,619,240 7,514,870 -31% -13% NET CHANGE IN FUND BALANCE 1,574,065 (6,604,210) (7,437,485) (2,998,240) (2,401,660) ENDING FUND BALANCE 16,610,314 $ 10,006,104 $ 9,172,829 $ 11,101,965 $ 8,700,305 $ 11% -22% 2023 2024 Committed Fund Balance 1,695,900 2,207,220 3,000,000 3,000,000 563,500 563,500 Total Committed Fund Balance 5,259,400 $ 5,770,720 $ Uncommitted Fund Balance 5,842,565 $ 2,929,585 $ BIENNIAL BUDGET LongTermProjectsReserve:
% Change Fund
115
Conservative Trust Fund
Department description and budget detail
CONSERVATION TRUST FUND (110) YEAR 1 YEAR 2 BUDGET 2021 2022 2022 2023 2024 2023 Budget 2024 Budget DETAIL Actual Adopted Revised Budget Budget to 2022 Adopted to 2023 Budget BEGINNING FUND BALANCE 3,504,556 $ 3,764,010 $ 3,764,010 $ 3,914,010 $ 3,099,010 $ 4% -21% Revenues Lottery Proceeds 714,938 625,000 625,000 665,000 680,000 6% 2% Interest Income 1,626 10,000 10,000 20,000 20,000 100% 0% TOTAL REVENUES 716,564 635,000 635,000 685,000 700,000 8% 2% Expenditures Park Maintenance 457,110 600,000 600,000 1,500,000 700,000 150% -53% TOTAL EXPENDITURES 457,110 600,000 600,000 1,500,000 700,000 150% -53% NET CHANGE IN FUND BALANCE 259,454 35,000 35,000 (815,000)ENDING FUND BALANCE 3,764,010 $ 3,799,010 $ 3,799,010 $ 3,099,010 $ 3,099,010 $ -18% 0% BIENNIAL BUDGET % Change 116
Department description and budget detail* Land Use Fund
* During the development of the 2023 and 2024 Biennial Budget, the City’s Land Use Fund was formally consolidated into the General Fund. Moving forward, the City will no longer appropriate revenues and expenditures into this fund.
LAND USE FUND (300) YEAR 1 YEAR 2 BUDGET 2021 2022 2022 2023 2024 2023 Budget 2024 Budget DETAIL Actual Adopted Revised Budget Budget to 2022 Adopted to 2023 Budget BEGINNING FUND BALANCE - $ - $ - $ - $ - $ N/A N/A Revenues Contractor License 237,964 240,000 240,000 - - -100% N/A Other Permits 224,243 148,000 148,000 - - -100% N/A Building Permits 2,198,762 2,425,000 2,425,000 - - -100% N/A Plan Review Fees 1,009,549 710,000 710,000 - - -100% N/A Planning Plan Review Fees 376,019 290,000 290,000 - - -100% N/A Building Re-inspection Fees 2,703 6,000 6,000 - - -100% N/A Grant Revenue - 200,000 200,000 - - -100% N/A Rent Recovery Contractor 22,626 - - - - N/A N/A Miscellaneous Revenues 79,918 80,000 80,000 - - -100% N/A Other Reimbursements 3,062 4,000 4,000 - - -100% N/A Subtotal Revenues 4,154,848 4,103,000 4,103,000 - - -100% N/A Other Financing Sources Transfer In From General Fund 808,660 - 221,000 - - N/A N/A TOTAL REVENUES & TRANSFERS 4,963,508 4,103,000 4,324,000 - - -100% N/A BIENNIAL BUDGET % Change LAND USE FUND (300) YEAR 1 YEAR 2 BUDGET 2021 2022 2022 2023 2024 2023 Budget 2024 Budget DETAIL Actual Adopted Revised Budget Budget to 2022 Adopted to 2023 Budget Personnel Costs 658,123 1,935,460 1,969,460 - - -100% N/A Salaries and Wages 496,792 1,374,520 1,404,520 - - -100% N/A Benefits 161,331 560,940 564,940 - - -100% N/A Departmental Costs 2,644,734 2,007,450 2,194,450 - - -100% N/A Annual Compensation - 34,000 - - - -100% N/A Office Supplies 2,008 12,000 12,000 - - -100% N/A Postage and Courier 44 500 500 - - -100% N/A Non-Capital Equipment 49,506 15,000 30,000 - - -100% N/A Materials Fuel 123 500 500 - - -100% N/A Boards, Commissions and Community Activities 3,307 20,700 20,700 - - -100% N/A Professional Services 15,855 755,000 955,000 - - -100% N/A Printing Services 1,703 5,000 5,000 - - -100% N/A Merchant Card Services 129,006 80,000 80,000 - - -100% N/A Financial Accounting Services 2,917 2,000 2,000 - - -100% N/A City Attorney's Office Service 173,418 214,240 214,240 - - -100% N/A Annexations 28,534 50,000 50,000 - - -100% N/A Engineering Services - 20,000 20,000 - - -100% N/A Land Use Contracted Services 104,023 120,000 120,000 - - -100% N/A Permitting and Inspections 2,014,363 471,570 471,570 - - -100% N/A Transit & Shelter Administration 13,544 - - - - N/A N/A Professional Development 10,127 44,750 44,750 - - -100% N/A Dues and Memberships 2,450 4,550 4,550 - - -100% N/A Subscriptions 119 1,500 1,500 - - -100% N/A Onboarding and Recruitment - - - - - N/A N/A Software Licensing and Maintenance 89,894 127,120 127,120 - - -100% N/A Facility Lease - 9,720 9,720 - - -100% N/A Copiers 3,591 9,300 15,300 - - -100% N/A Other Incentives 200 10,000 10,000 - - -100% N/A Subtotal Expenditures 3,302,857 3,942,910 4,163,910 - - -100% N/A Other Financing Uses Transfer Out To General Fund 1,660,651 160,090 160,090 - - -100% N/A TOTAL EXPENDITURES & TRANSFERS 4,963,508 4,103,000 4,324,000 - - -100% N/A NET CHANGE IN FUND BALANCE - - - -ENDING FUND BALANCE - $ - $ - $ - $ - $ N/A N/A % Change BIENNIAL BUDGET 117
Department description and budget detail Fiber Fund
FIBER FUND (310) YEAR 1 YEAR 2 BUDGET 2021 2022 2022 2023 2024 2023 Budget 2024 Budget DETAIL Actual Adopted Revised Budget Budget to 2022 Adopted to 2023 Budget BEGINNING CASH BALANCE 834,798 $ 840,443 $ 840,443 $ 598,240 $ 175,840 $ -29% -71% Revenues Miscellaneous Revenue 15,022 - - - - N/A N/A Leased Property Revenue 43,393 38,190 38,190 42,600 33,900 12% -20% TOTAL REVENUES 58,415 38,190 38,190 42,600 33,900 12% -20% Other Financing Sources Transfer In From General Fund - - - - 155,260 N/A N/A TOTAL REVENUES & TRANSFERS 58,415 38,190 38,190 42,600 189,160 12% 344% Expenditures Professional Services 3,379 50,000 50,000 50,000 50,000 0% 0% Project Specific 10,467 250,000 250,000 200,000 100,000 -20% -50% City Attorney's Office Service 10,004 25,000 25,000 25,000 25,000 0% 0% General Repair and Maintenance 28,920 30,000 30,000 40,000 40,000 33% 0% Contingency - 100,000 100,000 150,000 150,000 50% 0% TOTAL EXPENDITURES 52,770 455,000 455,000 465,000 365,000 2% -22% Change in Net Position - Budgetary Basis 5,645 (416,810) $ (416,810) $ (422,400) $ (175,840) ENDING CASH BALANCE 840,443 $ 423,633 $ 423,633 $ 175,840 $ - $ -58% -100% BIENNIAL BUDGET % Change 118
Fund balance, total financial sources and uses Antelope GID
ANTELOPE GID (900) YEAR 1 YEAR 2 BUDGET 2021 2022 2022 2023 2024 2023 Budget 2024 Budget DETAIL Actual Adopted Revised Budget Budget to 2022 Adopted to 2023 Budget BEGINNING FUND BALANCE 65,959 $ 54,329 $ 54,329 $ 37,428 $ 33,678 $ -31% -10% Revenues Property Tax 175,323 175,000 175,000 175,000 175,000 0% 0% Specific Ownership Tax 11,078 8,000 8,000 10,000 10,000 25% 0% Investment Income 17 400 400 400 400 0% 0% TOTAL REVENUES 186,418 183,400 183,400 185,400 185,400 1% 0% Expenditures County Treasurer Fee 2,630 2,625 2,625 2,625 2,625 0% 0% Professional Services 15,700 6,250 6,250 6,250 6,250 0% 0% Bank Fees 343 1,000 1,000 1,000 1,000 0% 0% Principal 100,000 105,000 105,000 105,000 110,000 0% 5% Interest 79,375 76,375 76,375 74,275 71,125 -3% -4% TOTAL EXPENDITURES 198,048 191,250 191,250 189,150 191,000 -1% 1% NET CHANGE IN FUND BALANCE (11,630) (7,850) (7,850) (3,750) (5,600) ENDING FUND BALANCE 54,329 $ 46,479 $ 46,479 $ 33,678 $ 28,078 $ -28% -17% BIENNIAL BUDGET % Change 119
Fund balance, total financial sources and uses Cherry Park GID
CHERRY PARK GID (710) YEAR 1 YEAR 2 BUDGET 2021 2022 2022 2023 2024 2023 Budget 2024 Budget DETAIL Actual Adopted Revised Budget Budget to 2022 Adopted to 2023 Budget BEGINNING FUND BALANCE 146,621 $ 183,910 $ 183,910 $ 209,260 $ 210,010 $ 14% 0% Revenues Property Tax 59,586 61,350 61,350 63,200 65,000 3% 3% Specific Ownership Tax 3,770 3,000 3,000 3,500 3,500 17% 0% Investment Income 3,959 2,000 2,000 1,500 1,500 -25% 0% TOTAL REVENUES 67,315 66,350 66,350 68,200 70,000 3% 3% Expenditures County Treasurer Fee 894 930 930 950 975 2% 3% Professional Services 4,900 2,500 2,500 2,500 2,500 0% 0% Bank Fees 305 400 400 500 500 25% 0% City Attorney's Office Service - 2,000 2,000 4,000 5,000 100% 25% Grounds Maintenance 10,319 39,500 39,500 51,500 49,500 30% -4% General Repair and Maintenance 6,584 - - - - N/A N/A Utilities 7,024 8,000 8,000 8,000 8,000 0% 0% TOTAL EXPENDITURES 30,026 53,330 53,330 67,450 66,475 26% -1% NET CHANGE IN FUND BALANCE 37,289 13,020 13,020 750 3,525 ENDING FUND BALANCE 183,910 $ 196,930 $ 196,930 $ 210,010 $ 213,535 $ 7% 2% BIENNIAL BUDGET % Change 120
Fund balance, total financial sources and uses
FOXRIDGE GID (730) YEAR 1 YEAR 2 BUDGET 2021 2022 2022 2023 2024 2023 Budget 2024 Budget DETAIL Actual Adopted Revised Budget Budget to 2022 Adopted to 2023 Budget BEGINNING FUND BALANCE 2,014,326 $ 492,969 $ 492,969 $ 543,608 $ 494,408 $ 10% -9% Revenues Property Tax 207,222 204,600 204,600 205,840 206,270 1% 0% Specific Ownership Tax 12,088 5,000 5,000 10,000 10,000 100% 0% Investment Income 2,619 1,500 1,500 1,500 1,500 0% 0% Miscellaneous Loan Proceeds 220 - - - - N/A N/A TOTAL REVENUES 222,149 211,100 211,100 217,340 217,770 3% 0% Expenditures Elections - - - - - N/A N/A County Treasurer Fee 3,094 3,070 3,070 3,100 3,110 1% 0% Professional Services 1,576,123 3,000 3,000 85,500 10,500 2750% -88% Bank Fees 122 500 500 500 500 0% 0% City Attorney's Office Service 2,807 5,000 5,000 4,000 4,000 -20% 0% Grounds Maintenance 19,447 37,500 37,500 37,500 37,500 0% 0% Utilities 3,265 4,750 4,750 4,750 4,750 0% 0% Principal 85,000 90,000 90,000 90,000 90,000 0% 0% Interest 53,648 43,160 43,160 41,190 39,220 -5% -5% TOTAL EXPENDITURES 1,743,506 186,980 186,980 266,540 189,580 43% -29% NET CHANGE IN FUND BALANCE (1,521,357) 24,120 24,120 (49,200) 28,190 ENDING FUND BALANCE 492,969 $ 517,089 $ 517,089 $ 494,408 $ 522,598 $ -4% 6% BIENNIAL BUDGET % Change 121
Foxridge GID
Fund balance, total financial sources and uses

WALNUT HILLS GID (720) YEAR 1 YEAR 2 BUDGET 2021 2022 2022 2023 2024 2023 Budget 2024 Budget DETAIL Actual Adopted Revised Budget Budget to 2022 Adopted to 2023 Budget BEGINNING FUND BALANCE 723,815 $ 760,377 $ 760,377 $ 762,276 $ 491,436 $ 0% -36% Revenues Property Tax 90,521 92,600 92,600 95,800 98,200 3% 3% Specific Ownership Tax 5,725 5,500 5,500 5,500 5,500 0% 0% Investment Income 360 5,000 5,000 3,000 3,000 -40% 0% Insurance Proceeds 775 - - - - N/A N/A TOTAL REVENUES 97,381 103,100 103,100 104,300 106,700 1% 2% Expenditures County Treasurer Fee 1,490 1,400 1,400 1,440 1,480 3% 3% Professional Services 11,719 9,500 9,500 12,500 12,500 32% 0% Bank Fees 5,582 400 400 500 500 25% 0% City Attorney's Office Service 500 2,000 2,000 5,000 2,500 150% -50% Grounds Maintenance 41,058 111,700 111,700 354,700 242,200 218% -32% Utilities 470 1,000 1,000 1,000 1,000 0% 0% TOTAL EXPENDITURES 60,819 126,000 126,000 375,140 260,180 198% -31% NET CHANGE IN FUND BALANCE 36,562 (22,900) (22,900) (270,840) (153,480) ENDING FUND BALANCE 760,377 $ 737,477 $ 737,477 $ 491,436 $ 337,956 $ -33% -31% BIENNIAL BUDGET % Change 122
Walnut Hills GID
Fund balance, total financial sources and uses Willow Creek

WILLOW CREEK GID (750) YEAR 1 YEAR 2 BUDGET 2021 2022 2022 2023 2024 2023 Budget 2024 Budget DETAIL Actual Adopted Revised Budget Budget to 2022 Adopted to 2023 Budget BEGINNING FUND BALANCE 4,942,271 $ 4,642,050 $ 4,642,050 $ 2,497,880 $ 24,380 $ -46% -99% Revenues Property Tax 298,752 297,550 297,550 300,050 301,800 1% 1% Specific Ownership Tax 18,207 7,000 7,000 10,000 10,000 43% 0% Investment Income 40,110 3,000 3,000 1,500 1,000 -50% -33% TOTAL REVENUES 357,069 307,550 307,550 311,550 312,800 1% 0% Expenditures County Treasurer Fee 4,472 4,900 4,900 4,500 4,550 -8% 1% Professional Services 381,086 4,602,500 4,602,500 2,500,000 2,500 -46% -100% Bank Fees 202 500 500 500 500 0% 0% City Attorney Services 5,795 5,000 5,000 5,000 5,000 0% 0% Grounds Maintenance 453 10,000 10,000 10,000 10,000 0% 0% Principal 40,000 70,000 70,000 75,000 80,000 7% 7% Interest 224,883 193,550 193,550 190,050 186,300 -2% -2% Bond Issuance 400 - - - - N/A N/A TOTAL EXPENDITURES 657,290 4,886,450 4,886,450 2,785,050 288,850 -43% -90% NET CHANGE IN FUND BALANCE (300,221) (4,578,900) (4,578,900) (2,473,500) 23,950 ENDING FUND BALANCE 4,642,050 $ 63,150 $ 63,150 $ 24,380 $ 48,330 $ -61% 98% BIENNIAL BUDGET % Change 123
GID
Authority
Fund balance, total financial sources and uses
124
CENTENNIAL URBAN REDEVELOPMENT AUTHORITY (740) YEAR 1 YEAR 2 BUDGET 2021 2022 2022 2023 2024 2023 Budget 2024 Budget DETAIL Actual Adopted Revised Budget Budget to 2022 Adopted to 2023 Budget BEGINNING FUND BALANCE 451,565 $ 116,312 $ 116,312 $ 116,312 $ 116,312 $ 0% 0% Revenues Property Tax 4,773,846 5,650,000 5,650,000 5,460,000 5,625,000 -3% 3% Sales Tax 373,805 510,000 510,000 770,000 807,000 51% 5% Investment Income - 500 500 500 500 0% 0% Miscellaneous Revenues 17,946 100,000 100,000 100,000 100,000 0% 0% TOTAL REVENUES 5,165,597 6,260,500 6,260,500 6,330,500 6,532,500 1% 3% Expenditures County Treasurer Fee 73,177 84,750 84,750 81,900 84,400 -80% 0% Professional Services 353,491 98,000 98,000 100,000 100,000 -3% 3% Bank Fees 117 2,500 2,500 500 500 51% 5% Property Tax Pass-Thru 4,700,260 5,565,250 5,565,250 5,378,100 5,540,600 1% 3% Sales Tax Pass-Thru 373,805 510,000 510,000 770,000 807,000 N/A N/A TOTAL EXPENDITURES 5,500,850 6,260,500 6,260,500 6,330,500 6,532,500 1% 3% NET CHANGE IN FUND BALANCE (335,253) - - -ENDING FUND BALANCE 116,312 $ 116,312 $ 116,312 $ 116,312 $ 116,312 $ 0% 0% BIENNIAL BUDGET % Change
Centennial Urban Redevelopment
