Approved Annual Budget


Fiscal Year 2022 - 2023

www.celina-tx.gov

The above information is presented on the cover page of the City of Celina’s FY2023 Proposed Budget to comply with requirements of Section 102.005(b) of the Texas Local Government Code.
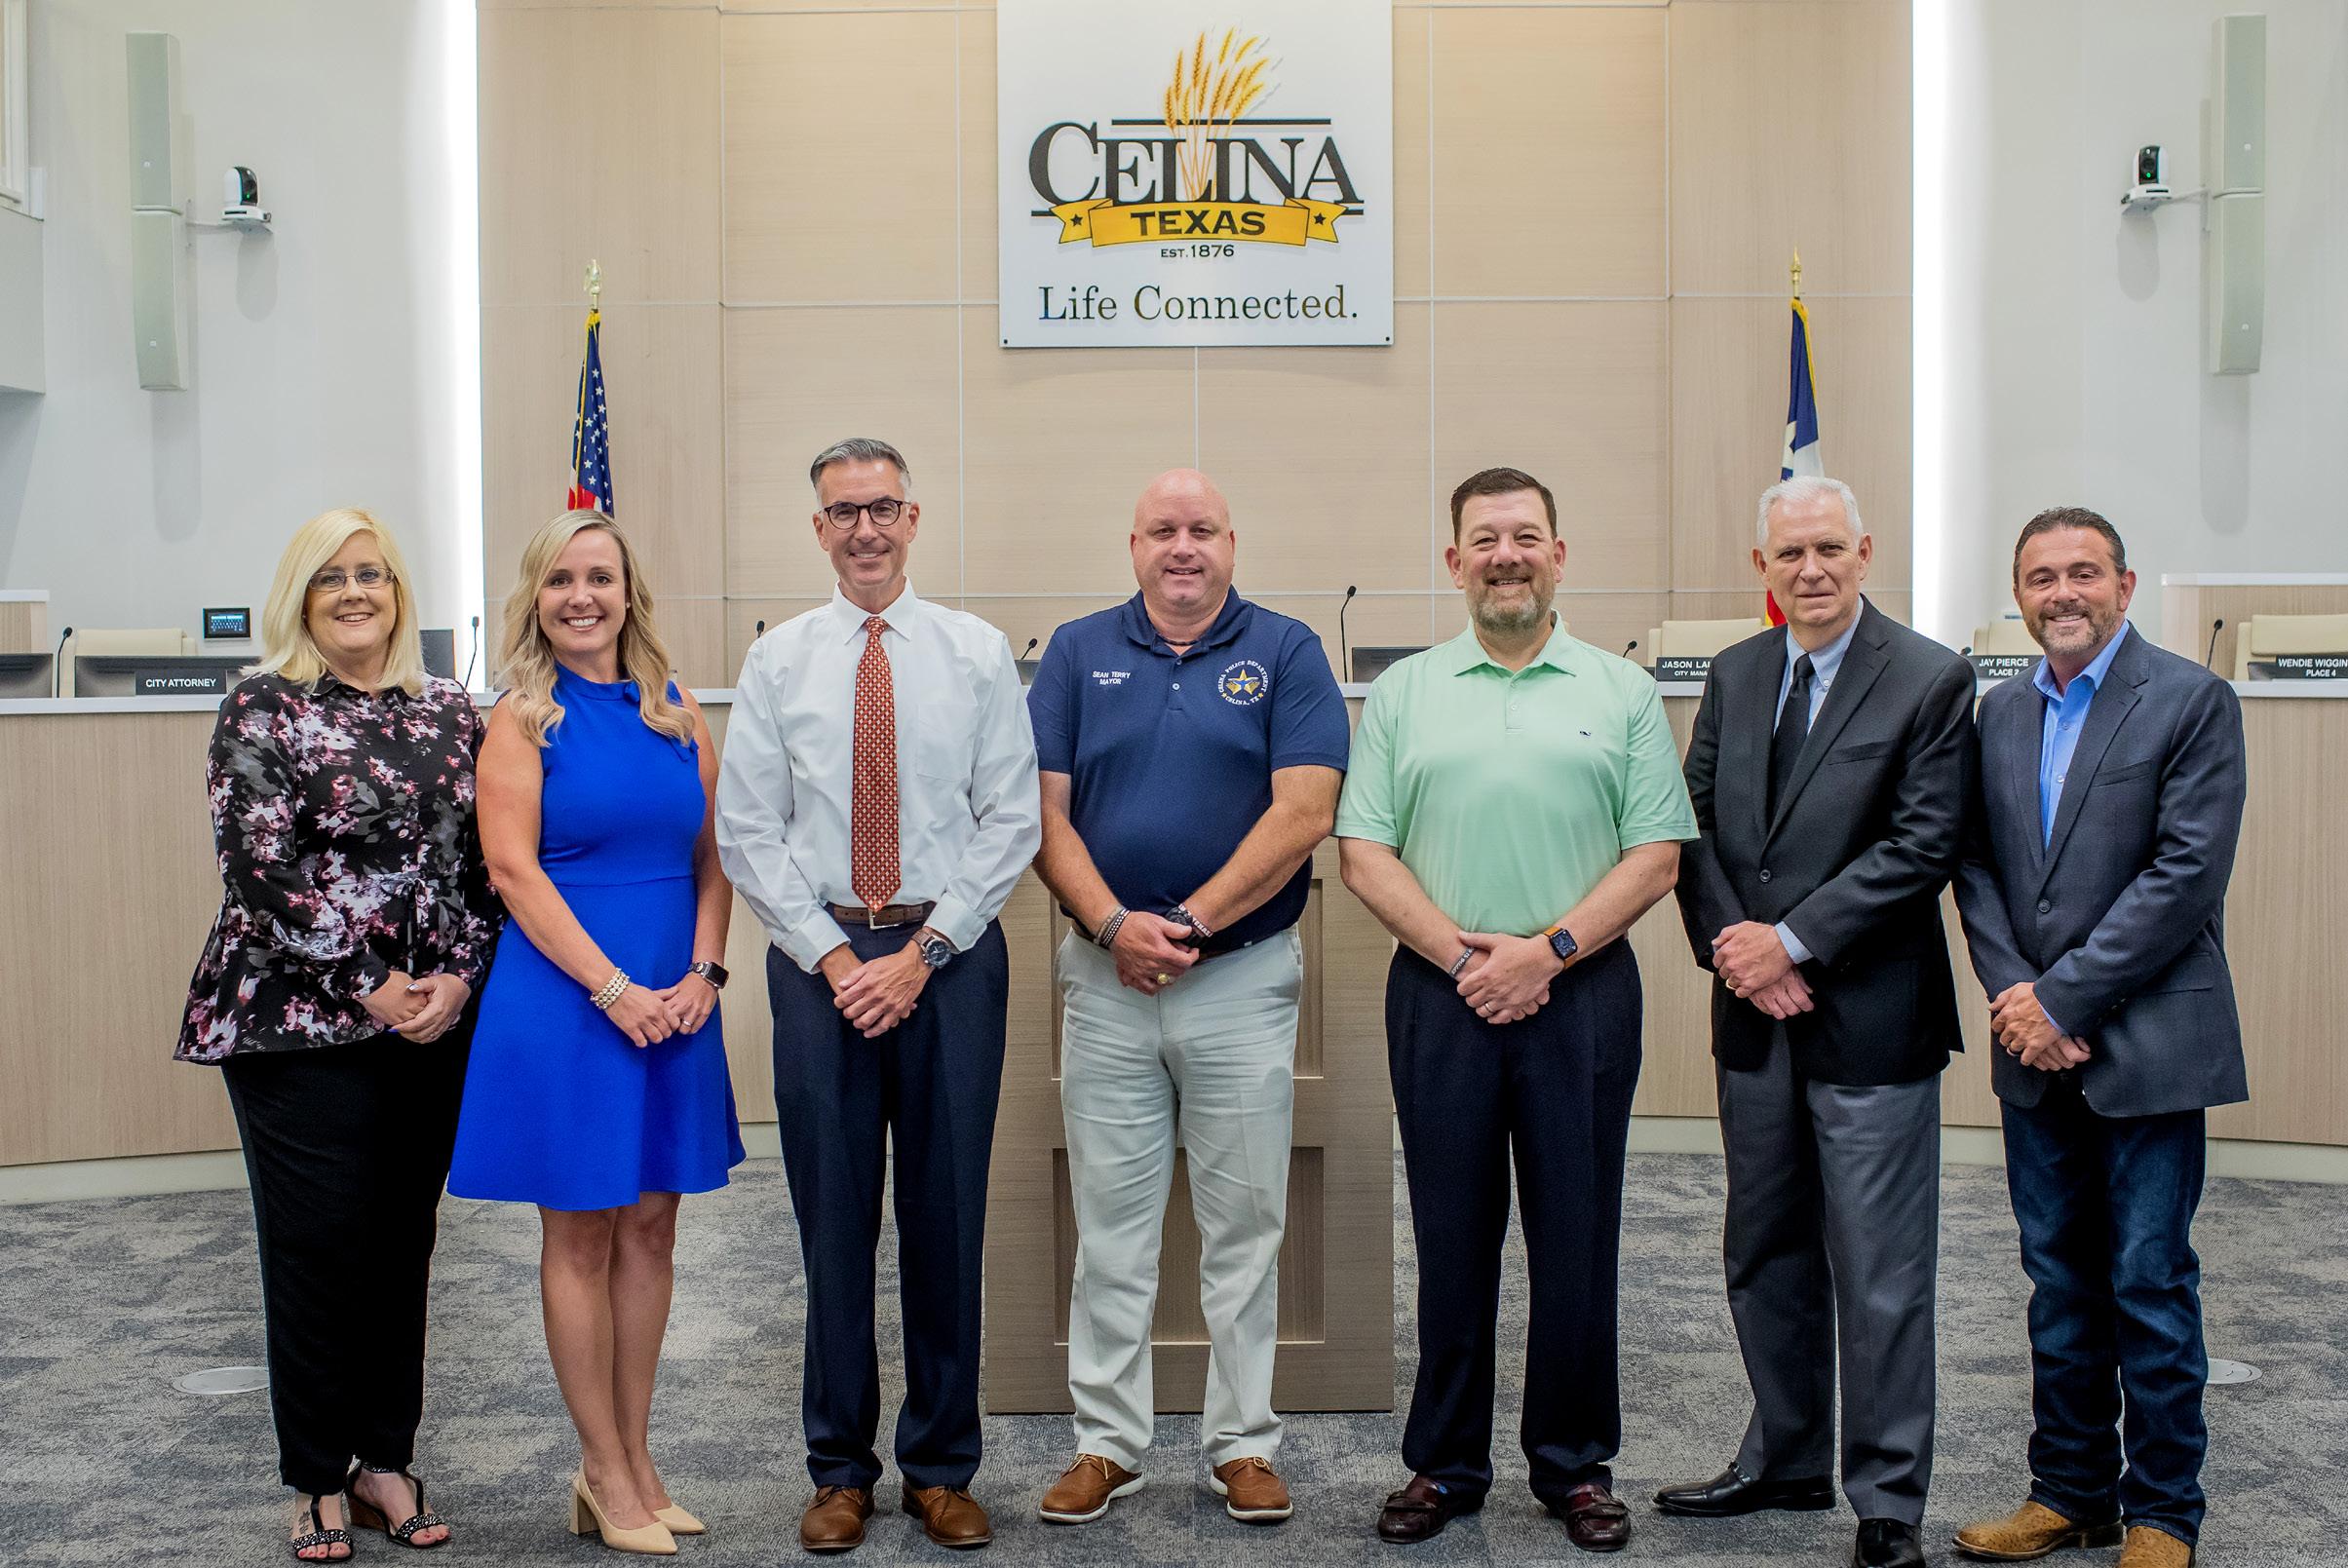
The members of the governing body voted on the adoption of the budget as follows: FOR:
Philip Ferguson, Place 1
Jay Pierce, Place 2 Andy Hopkins, Place 3 Wendie Wigginton, Place 4 Mindy Koehne, Place 5 Tony Griggs, Place 6
“This budget will raise more revenue from property taxes than last year's budget by an amount of $6,954,614, which is a 44.22 percent increase from last year's budget. The property tax revenue to be raised from new property added to the tax roll this year is $4,559,356.”

Celina is literally wired for connectivity with high‐speed fiber but also encourages personal connections through interconnected trails, open patios, and a thriving City square. Businesses and communities are built on these connections. brings people together.
Business Spotlight videos are produce to introduce Celina’s small businesses to out community, providing free advertisement opportunities on our Youtube channel and in the monthly Life Connected newsletter SPOTLIGHT
Our lifestyle website features sections for Live, Work, Play and Learn activities around Celina. LIFEINCELINATX.COM
The official community podcast of Celina,.On every episode, we celebrate and share the stores behind the amazing people, businesses, and groups that make Celina Home.
• We do the right thing at all times
• We are committed to building and maintaining credibility and trust both internally and externally
• We are accountable in our words and actions
• We question that which may be inconsistent with our Core Values
• We are a unified body and work as a team
• When we disagree, we resolve it according to our Core Values
• We value and respect all employees and our customers
• We foster a culture that includes understanding, support, balance and a sense of humor
• We embrace openness, diversity and inclusion
• We always do our best
• We embrace innovation and efficiency while remaining good stewards of City resources
• We are accountable and take pride in our work
• We seek opportunities to learn and expand our professional horizons
• We are selfless public servants and believe in helping other
• We treat everyone the way we wish to be treated
• We are caring and empathetic in all we do
• We work to deliver excellent service to all we encounter
 Life
Life
July 29, 2022
Honorable Mayor and Members of Council:
The Fiscal Year 2022-2023 (FY23) budget, beginning October 1, 2022, is presented here for your review and has been adopted in accordance with Texas law and the City of Celina Charter. The FY2022-2023 budget, as presented, is balanced for all funds, and continues to provide exceptional service to the residents of Celina. The provisions within this budget are based on the guiding principles established and confirmed in the City Council’s Strategic Plan, Comprehensive Plan, and Core Values. These Core Values represent our highest aspirations, our moral code and what we are deeply passionate about. Excellence, Community, Integrity, and Service are the foundation of the organization for which the departmental budgets are built. Living Life Connected. ensures every decision about the City is made through the lens of rightful actions, honesty, transparency, and mindfulness for our future success.

As we look to the upcoming fiscal year and what we as a City would like to accomplish, it helps to reflect on the prior fiscal year and the strides that we have made together. Celina continues to experience high growth and in November 2021, Dallas Business Journal named Celina the #1 Fastest Growing City in North Texas based on population growth from 2016 2020.
With unprecedented population growth, the ability to provide adequate public safety to our residents is imperative. Design of the Law Enforcement Center and Fire Station #3 are in their final stages and all sites for future police and fire stations have been purchased. Commercial growth continues with Methodist Health System announcing its plans to build a $200 million hospital at the corner of Dallas North Tollway and FM428, opening in 2025. Scottish Rite for Children issued a press release announcing the purchase of 76 acres of land near the intersection of Dallas Parkway and Punk Carter Parkway
Other businesses such as ServePro, Starbucks, and 7Eleven continue to be attracted to the opportunities Celina provides. Through our sustained relationship with Celina Independent School District, Celina’s youth will also experience great opportunities with the opening of the new Celina Middle School and additional schools slated for years to come. In May, the City and Celina ISD announced an agreement to preserve the Bobcat Field Complex which will see the stadium repurposed into an amphitheater as part of a linear park to be developed along Doe Branch Creek. Additionally, one of the existing buildings located in the Complex is currently being redeveloped into a community center for Celina’s seniors.
This year, we established the Neighborhood Integrity Program which provides grants to HOA’s to revitalize neighborhood amenities and features. The 2022 – 2024 Strategic Plan was also adopted by the City in May. By adhering to the Strategic Plan, the City will focus fiscal decisions on actionable items that will impact the city.
The Executive Summary, City Fund Summary, and Adopted Fund Budgets that follow this letter provide an overview of revenue and expenditure budgets for FY2023 and the financial impact comparison to the previous fiscal year.
We are leading a great City and will continue to achieve great things in FY2023.
Respectfully submitted,
 Jason Laumer City Manager
The annual operating budget for the City of Celina is the conclusion of many hours of work that continues through the year until the adoption of both the tax rate and budget in September 2022 for Fiscal Year 2022-2023. The City Manager, Executive Team, department directors and staff work together throughout the budget process regarding priorities by placing the needs of the community first and in line with the City Council’s Strategic Plan and Core Values. Our Core Values are the foundation of the organization for which the departmental budgets are built and are as follows:
• Be Service focused
• Place the Community first
• Make ethical (Integrity) decisions
• Maximize efficiency through Excellence
The City of Celina’s internal core value system stems from the philosophy of Servant Leadership and the belief that as public servants, all actions stem from the obligation to put the needs of the residents first and dedicate our decision making and actions to the ideal that City employees exist to serve the people. These Core Values represent our highest aspirations, our moral code and what we are deeply passionate about.
All of this in tandem embodies “Life Connected.” making a genuine connection from the City to all residents and businesses. Living “Life Connected.” is how we as the City, bring life to our core values; ensuring every decision about the City is made through the lens of rightful actions, honesty, transparency, and mindfulness for our future success. These strategic plans and core values are designed to work in conjunction and are designed to serve as the foundation for each annual budget.
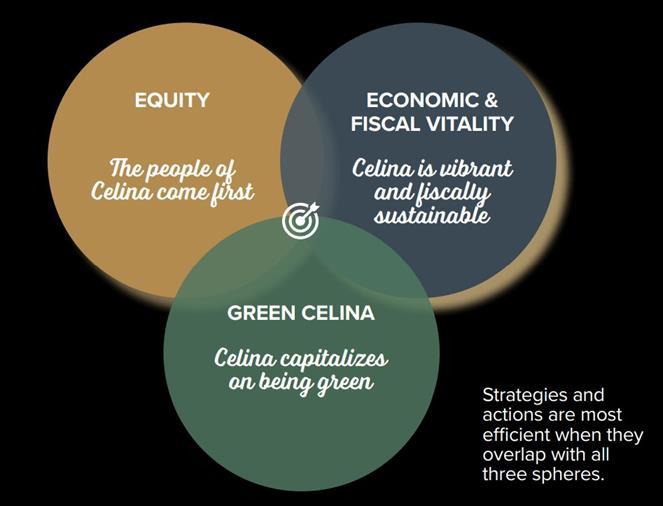
The City of Celina’s mission is to preserve its agricultural heritage and flourish as a close knit, ever growing family. In May 2022, the City Council adopted its updated 2022 2024 Strategic Plan to provide a unique and extraordinary quality of life complemented by a significant array of high tech and desirable businesses, agritourism assets, unique destinations, and connections.

The seven strategic plan goals for 2022-2024 are:
• Be the LIFE CONNECTED. City
• Be the UNIQUE City
• Be the City of THE FUTURE, CONNECTED TO ITS PAST
• Be the City BUILT ON PUBLIC SAFETY
• Be the City of SERVANT LEADERS
• Be the City of INNOVATIVE INFRASTRUCTURE
• Be the City of SMALL BUSINESS
By adhering to the Strategic Plan, the City will focus fiscal decisions on actionable items that will impact the city.
In April 2021, the Celina 2040 Comprehensive Plan was implemented. The Comprehensive Plan provides a framework for sustainable fiscal decisions to ensure the community vitality over time. Every financial decision made by the City will use this framework to ensure that each initiative will adhere to the needs of the residents.
The City Manager and Executive Team review all budget requests for alignment with Council direction with reference to the City’s Strategic and Comprehensive Plans. Collectively, these plans outline a path that will ensure that Celina maintains its rural and welcoming feel while facilitating new development and improvements in the right way.
The annual budget process begins in January each year. Each January, the City holds a budget kick off meeting. The budget calendar outlining key dates for the upcoming budget year as well as the budget manual outlining the important components that each department is responsible for is provided.
The City of Celina utilizes a budget planning software provided by McLain Decision Support Systems called mBudget to help develop the upcoming year’s budget and future planning years. The software provides the detail budget and helps directors to complete their end of year forecasts along with capital requests, new service level requests and new staffing request for the new fiscal year. In February, mBudget is opened for directors to begin formulating their budgets.
In March and April, Finance provides up to date information and helps to answer questions as necessary for the departments to begin finalizing their budget requests. In April, preliminary budgets are submitted for review by the Executive Team. After budgets have been submitted, Finance completes a review of all revenues and expenditures for the new year and will adjust as needed. This process is completed by the end of May each year.
Budget Workshop with the Executive Team and each department is held in June. During workshop the financial position of the City is discussed as well as budget priorities for the upcoming year. Base budgets, capital and new staff requests for each department are assessed and adjustments are made as appropriate.
Certified appraisals from both Collin and Denton Counties are submitted at the end of July and Finance formulates a final proposed operating budget that is balanced and is in conformity with the City’s fund balance requirements.
At the end of July, the City Manager presents a proposed budget to the City Council in council workshop. In September, public hearings are held for the proposed budget and proposed tax rate to gather public feedback. The last step is the formal adoption of the tax rate and budget by ordinance during the September council meeting. Once adopted, the tax rate and budget go into effect October 1 for the start of the new fiscal year.
01/27/22 City Manager and Directors receive Budget Calendar
01/31/22 Directors receive FY2023 Budget Manual
MBudget opened for Directors to update:
--FY2022 Estimates
--FY2023 Budget Year
02/07/22
--FY2024 Planning Year --FY2025 Planning Year
--FY2026 Planning Year
--FY2027 Planning Year
03/02/22
04/08/22
VERF meeting - Overview/ Update Fleet Schedule (VERF), determine budget needs
All Budget Data (FYE estimates and budget years 2022, 2023, 2023, 2024, 2025, 2026,2027) to be completed by Directors in MBudget.
05/05/22 Follow up VERF meeting 06/13/2206/16/22
BUDGET WORKSHOP - City Manager and Directors – Management Team Open Discussion on Budgeted Priorities and Plans (Funds 102, 120, 123) 06/17/2207/01/22
Internal Budget Meetings
07/25/22 Received Certified Appraisal Rolls from Chief Appraiser §26.01(a)
07/29/22 Council Budget Work Session (Provide Council proposed budget during this meeting)
08/09/22
Regular City Council Meeting – Submit no-new -revenue and voter-approval tax rates to City Council.
City Council Meeting
· Hold Budget Hearing (prior to date of tax levy)
09/13/22
· Hold Tax Rate Hearing
Adopt Budget and Tax Rate
The Combined Budget Summary is inclusive of the General Operating funds, Enterprise funds, Special Revenues funds, Governmental funds, Capital Improvements funds, TIRZ 11 fund, and Component Units. The total adopted appropriations budget for all funds including the Capital Improvement Project fund is $148.67 million for FY2022-2023. The total adopted revenues budget for all funding including Capital Improvement is $92.19 million for FY2022 23.
The Combined Budget Summary is in the section entitled City Fund Summary and shows a detailed look at revenues and expenditures by category. Each fund identified on this schedule shows beginning balances, revenues, and expenditures. Revenues are broken down by type and expenditures are broken down by category including General Government, Public Safety, Development Services, Public Services, Utilities, Debt Services, and Transfers Out.
The City of Celina utilizes a fiscally conservative strategy when projecting revenues and expenditures. Revenue and expenditure patterns are closely monitored so that adjustments can be made readily throughout the year with amendments going before the City Council for approval.
The City of Celina takes a stable approach when projecting revenues. Residential and commercial growth, along with economic expectations, are primary drivers in estimating revenues. In the past several years, the City of Celina has enjoyed a relatively stable upward revenue trend. This trend is caused by growth in population, property values, sales tax, and the development of residential communities. While monitoring changes in building permit fee revenues, the City still anticipates residential growth during the next several years, focus on the revenue structure for the future will shift more towards sales tax growth with commercial business.
The City of Celina is striving to diversify its revenues, expand the City tax base through economic expansion, maintain healthy financial reserves and hire and retain a top quality workforce. The City strives to deliver services in a customer friendly, pro business and pro development manner.
The major Source of Funds revenue categories for the City of Celina are Ad Valorem Taxes, Sales Taxes, Licenses and Permits, and Rates, Fees, and Charges.
All sources of funding with the exception for the Capital Improvement Project fund (CIP) planned for 2022 2023 is $92.09 million an increase over the adopted 2021 2022 revenue budget by $20,152,249 or 28.02%.
The following matrix reflects the sources of all funds by category:
Sources of Funds
Adopted 2021-2022
Ad Valorem Taxes 15,201,611$
Sources of Funds Adopted 2022-2023
% of Total Change Year Over Year % Change
Ad Valorem Taxes 22,311,200$ 24.23% 7,109,589$ 46.77%
Sales Taxes 4,365,000$ Sales Taxes 7,033,570$ 7.64% 2,668,570$ 61.14%
Franchise & Other Taxes 617,000$ Franchise & Other Taxes 997,450$ 1.08% 380,450$ 61.66%
Licenses & Permits 10,022,000$ Licenses & Permits 10,025,000$ 10.89% 3,000$ 0.03% Rates, Fees and Charges 36,532,491$ Rates, Fees and Charges 44,347,275$ 48.16% 7,814,784$ 21.39%
Misc/Intergovernmental 2,288,862$ Misc/Intergovernmental 2,335,850$ 2.54% 46,988$ 2.05%
Interest Income 520,500$ Interest Income 518,950$ 0.56% (1,550)$ -0.30%
Transfers In 2,385,478$ Transfers In 4,515,896$ 4.90% 2,130,418$ 89.31%
Total Sources 71,932,942$ Total Sources 92,085,191$ 100.00% 20,152,249$ 28.02%
The City of Celina’s primary source of revenue is Ad Valorem or property tax. This year, $22,311,200 has been budgeted for all property tax collections including delinquents, penalties and for payments to the tax increment reinvestment zones (TIRZ).
Sales tax revenue for all funds is expected to grow 61.14% over last year. An adopted budget of $7.03 million has been forecast for the upcoming year across all funds. Celina has enjoyed continued sales tax growth year over year. The original adopted sales tax budgets for 2020 2021 was $2.97 million, and $4.37 for 2021 2022 respectively. Sales tax revenue is net of all sales tax rebates and contractual agreements.
Rates, fees, and charges for service is adopted for FY2023 at $44,347,275 and represents about 48.16% of the City’s funding of operations. The increase in rates, fees, and charges over 2022 is $7,814,784 or about 21.39%.
A percentage of the adopted city-wide rates, fees and charges for service are budgeted for water and wastewater services representing $27.58 million or 62.18% of the $44.35 million projected for 2023. Of this amount, $13,600,000 or 48.28% comes from water sales, $8,100,000 or 28.75% for wastewater sales, $4,435,000 or 15.74% from water/wastewater connection fees, and an additional $1,481,400 or 5.26% from other services including meter and developer revenue.
In June 2022, the City created a new Enterprise fund from the Water/Wastewater Fund called the Solid Waste Fund. All revenues and expenditures for sales and services that were held in the Water/Wastewater Fund were transferred into the Solid Waste Fund. The Solid Waste Fund provides for the collection of solid waste and disposal along with recycling services and maintaining of the public rights-of-way in the City. Rates and fees for services are adopted at $2,478,000 for the upcoming year. Operational costs for contracted garbage and recycling services and maintaining of the rights of way is adopted at $2,510,000.
Another major source of revenue originates from licenses and permits. These revenues are generated for services rendered and user fees charged for permits, construction inspection fees, fire/ems and police fees, and other related services. In 2023, a budget of $10,025,000 has been adopted which is $3,000 increase over the adopted 2022 budget.
Transfers In are a part of the total sources of funds and is adopted at $4,515,896. This number reflects one time transfers for infrastructure improvements and reimbursement of in kind services across the funds. The remaining revenue is attributable to other types of services and interest income. The transfers also include the funding for the vehicle equipment replacement funds for both the General Fund and the Water/Wastewater Fund.
According to the Collin and Denton County Central Appraisal District (DCAD), the certified taxable value after the homesteads with tax ceiling is estimated with appraisal review board grand totals is $4,137,390,503. This value is 49.6% or $1.371 billion more in assessed valuation than the 2021 adjusted taxable value (as of 07/25/2022). Of this increase, $706 million is attributable to new taxable values added to the tax roll which includes improvements and personal property.
The following graph reflects historical growth in taxable property values including the current year (2022) certified value:
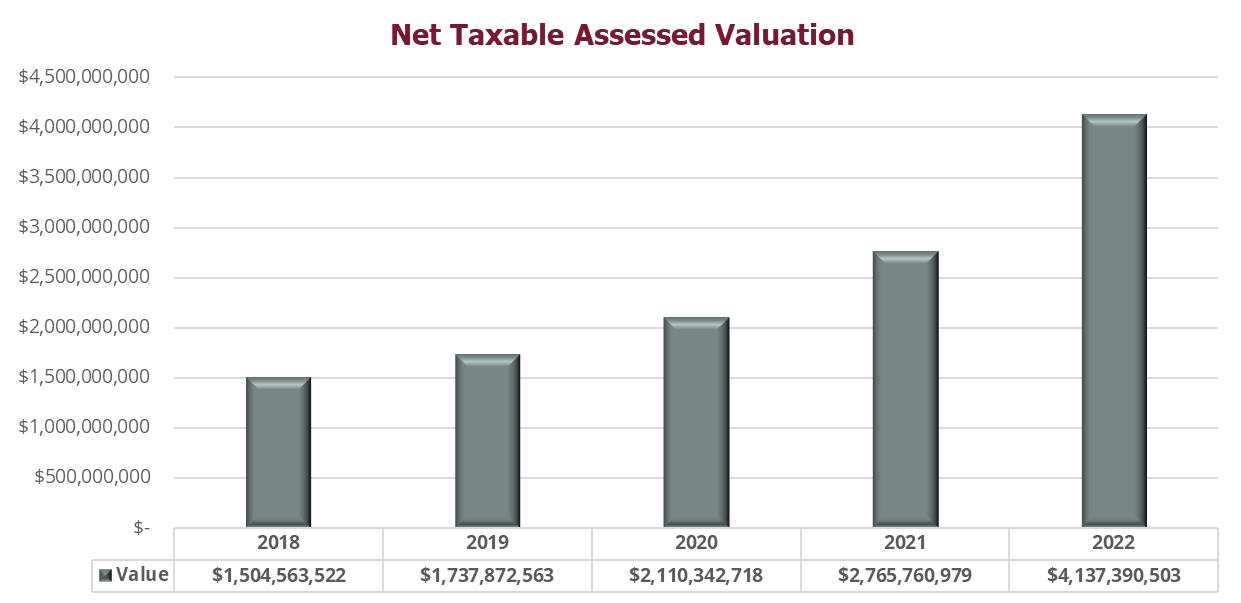
The City will strive to maintain a tax rate to keep level with cities and towns while still providing adequate revenue to fund the needs of a rapidly growing community now and into the future. As the city grows so will the demands for service, the tax rate will also need to increase due to the growing population and rooftops. This year, the City has adopted a tax rate of $0.634759 to meet these objectives.
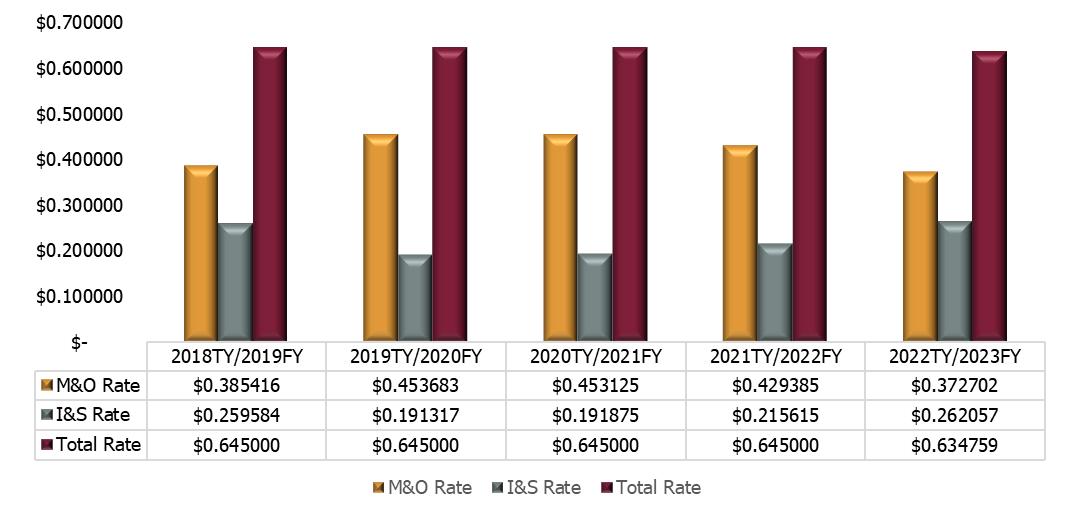
The adopted tax rate of $0.634759, is a tax reduction from the FY2022 tax rate of $.645000. Of the total tax rate of $0.634759, $0.372702 or 58.72% is dedicated to maintenance and operation expenses of the municipal government and $0.262057 or 41.28% is dedicated to general obligation debt service.
The average taxable single-family home value is currently $451,920 as of July 2022. At the property tax rate of $0.634759, the City tax paid on the average single-family home will be approximately $2,868. For comparison purposes, a single-family home valued at $100,000 will pay $635.
The following graph is a historical picture of the City’s tax rate history for maintenance and operations and interest and sinking:
In the past, local governing bodies have had the autonomy to realize up to 8% of revenue growth from property taxes at their discretion. Due to changes in the law handed down from Senate Bill 2 Texas Property Tax Reform and Transparency Act from the 86th legislative session in 2019 and implemented in fiscal year 2021, tax rate calculations and revenue growth has been capped at 3.5%. The new taxable property added to the tax rolls is not included in the 3.5% cap.
The Texas legislature is scheduled to meet again in January 2023 with its session ending in May. Local government bodies will be monitoring the session to determine if any additional changes in the tax calculations will be enacted.
Celina’s conservative revenue forecasts will help mitigate the negative impacts of this revenue cap to the City’s operations; however, the City will have to pay close attention to revenue numbers in future years and determine when an election is necessary to keep up with demands for service and growth.
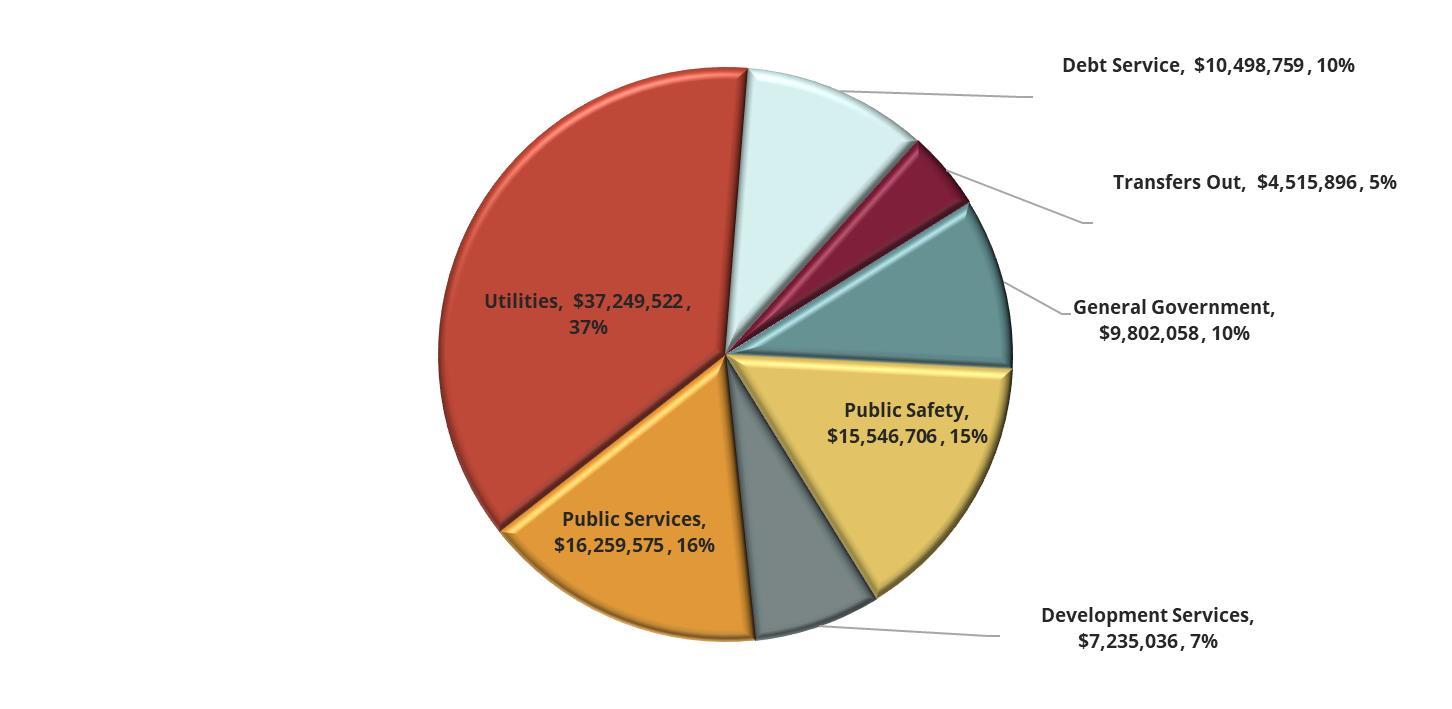
The following represents the use of all funds by category:
General Government 7,810,732$
General Government 9,802,058$ 9.69% 1,991,326$ 25.49%
Public Safety 12,476,859$ Public Safety 15,546,706$ 15.38% 3,069,847$ 24.60% Development Services 7,107,992$ Development Services 7,235,036$ 7.16% 127,044$ 1.79%
Public Services 11,889,879$
Public Services 16,259,575$ 16.08% 4,369,696$ 36.75%
Utilities 32,423,705$ Utilities 37,249,522$ 36.84% 4,825,817$ 14.88%
Debt Service 6,668,635$ Debt Service 10,498,759$ 10.38% 3,830,124$ 57.43%
Transfers Out 2,385,478$
Transfers Out 4,515,896$ 4.47% 2,130,418$ 89.31%
Total Uses 80,763,280$ Total Uses 101,107,552$ 100.00% 20,344,272$ 25.19%
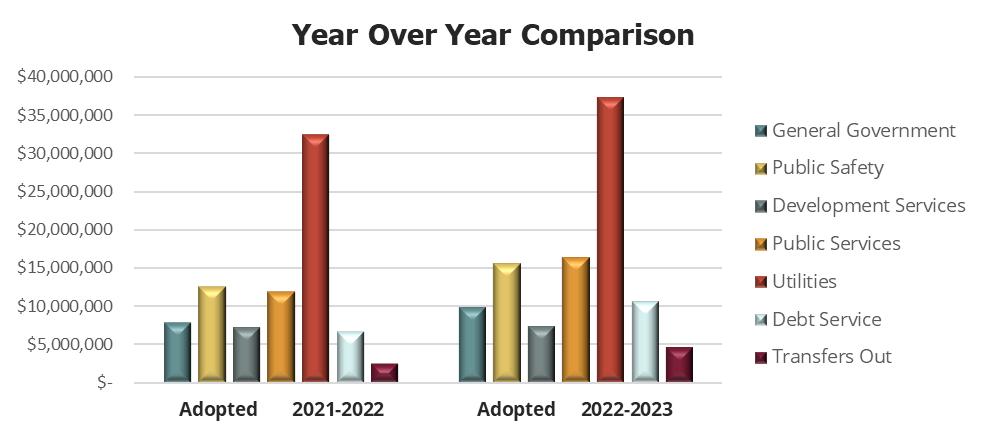
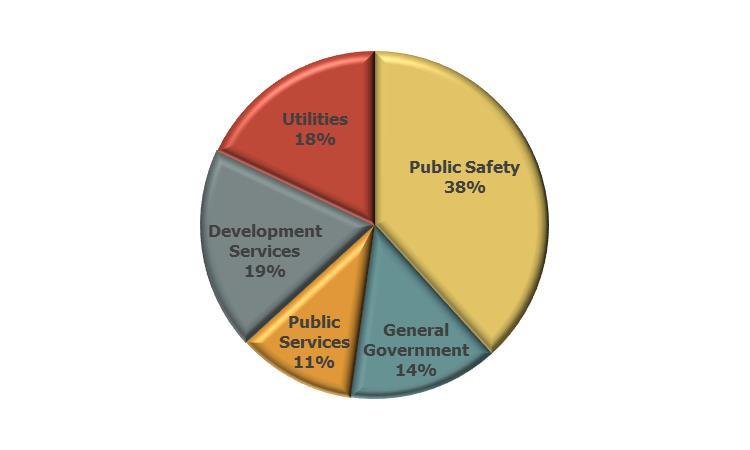
The operating budget is a combination of all costs to accomplish comprehensive city wide business including transfers and debt service payments except for the Capital Improvement Project (CIP) Fund. Use of Funds for total combined expenditures are broken down by General Government, Public Safety, Development Services, Public Services, Utilities, Debt Service and Transfers. The total of the combined operating expenditure budget for the 2023 fiscal year is $101,107,552, compared with $80,763,280 originally budgeted in FY 2022. This is an increase of $20,344,272 or 25.19%.
The General Government budget increased $1,991,326 or 25.49% over 2022. Public Safety will see a 24.60% increase over the adopted 2021-2022 budget or $3,069,847. Public Services includes Parks, Streets, and Library Services and will see the largest percent increase year over year (excluding Transfers) at 36.75%. This amounts to a budget increase of $4,369,696 from the 2022 adopted budget of $11,889,879. Utilities, Debt Service and Transfers adopted budget totals $52,264,177 in comparison to the adopted 2021 2022 budget of $41,477,818. The overall use of funds also includes capital improvement projects that are not funded by the issuance of bonds.
The City Fund Summary section of this document provides more detail regarding the individual fund budgets and the total expenditures broken down per fund.
The following charts reflect the percentage cost of operations by operational function of the City:
Operating costs are broken down in the following chart for the City’s core operating funds comparing this year to last year:
The list below represents significant one time expenditures across the total projected FY2022-2023 combined funds to provide new or upgraded levels of service. The adopted FY2022 2023 expenses total $3,997,258 and below is a sample listing of some of the expenditures anticipated:
Priorities addressed in this budget are to provide adequate funding to maintain service levels amid population growth in the City and to continue to meet the expectations of the community. This budget adopted an increase of eighteen (18) full time equivalent (FTE) positions. This includes sixteen (16) FTE positions in the General Fund and two (2) FTE positions in the Water/Wastewater Fund. Of these new positions, six (6) positions are for Public Safety, three (3) positions each for both Public and Development Services, and five (5) positions for General Government to continue to keep in step with City growth. The new positions including compensation and benefits will total $1,546,985 and are listed below:
General Government (4.5)
▪
Service Desk Analyst Information Technology (1.0)
▪
Senior Buyer Finance (1.0)
▪
Downtown Manager Administration (1.0) Development Liaison – Administration (1.0)
Special Events Intern Marketing (0.5)
▪
Fire Plan Reviewer (Captain) Fire/EMS (1.0)
▪ Assistant Police Chief PD (1.0)
▪ Traffic Sergeant PD (1.0)
▪ Traffic Officer PD (1.0)
▪ School Resource Officer – PD (1.0)
▪
TCOLE Training Specialist PD (1.0)
▪
Sign Technician Streets (1.0)
▪ Intern – Library (0.5)
▪ Recreation Coordinator Parks (1.0)
▪ Senior Analyst GIS (1.0)
▪ Senior Engineer Engineering (1.0)
▪ Landscape Architect Development Services (1.0)
Utilities (2.0)
▪ ULM Worker Public Works (1.0)
▪
Wastewater Treatment Operator Public Works (1.0)
Although staffing changes occur throughout the year between departments, the total number of FTE’s to close the 2022 budget year sits at 243.25. The 2022 2023 adopted budget maintains the 2022 end of year totals and with the addition of the new positions requested, will begin the 2023 budget year at 261.25 FTE’s for a salary and benefits cost of $27,001,260.
Below is the 5-Year historical detail of Full-Time Equivalents (FTE) by department for both the General Fund and Water/Wastewater Fund:
GIS
The following chart is a breakout by service area across the City: Total Package Positions Adopted
1.00 1.00 2.00 2.00 2.00 1.00 3.00
Facilities Management 1.00 1.00 2.00 2.00 2.00 2.00
Information Technology 2.50 2.00 2.00 3.00 3.00 1.00 4.00
Finance 8.00 7.00 7.00 10.00 10.00 1.00 11.00
Library 3.50 3.50 3.50 5.00 5.00 0.50 5.50
City Secretary 2.00 2.00 2.00 2.00 2.00 2.00
Development Services 18.00 19.00 21.00 28.00 29.00 1.00 30.00
Administration 4.00 6.00 6.00 8.00 7.00 2.00 9.00
Municipal Court 3.00 2.00 2.00 2.00 2.00 2.00
Fire/EMS 26.00 41.00 41.00 43.00 46.00 1.00 47.00
Streets 7.00 6.00 6.00 8.00 7.00 1.00 8.00
Police 27.00 29.00 35.00 46.00 46.00 5.00 51.00 Parks 8.00 9.00 10.00 13.00 14.25 1.00 15.25
Marketing 2.00 2.00 3.00 5.00 5.00 0.50 5.50
Engineering 7.00 10.00 11.00 14.00 15.00 1.00 16.00
Human Resources 2.00 2.00 4.00 3.00 3.00 3.00
Water 14.00 15.00 16.00 23.00 22.00 1.00 23.00 Wastewater 8.00 7.00 8.00 10.00 12.00 1.00 13.00
Utility Billing 3.00 3.00 3.00 6.00 6.00 6.00
Fleet 1.00 1.00 1.00 1.00
Drainage/Stormwater 1.00 2.00 4.00 4.00 4.00
The City offers competitive benefits to employees, including group medical, dental, and vision insurance with dependent coverage available. Life and long term disability insurances are 100% City paid. Optional insurance offerings are provided for short-term disability and additional life insurance.
The City participates in Texas Municipal Retirement System (“TMRS”), a statewide administered pension plan. The City’s TMRS plan is a 2 to 1 matching ratio with a 5 year vesting period. Service eligibility for retirement is age 60 with 5 years of service or any age with 20 years of service. The City provides pension benefits for all its full time employees through TMRS. The City continues to contribute 100% of its annual required contribution (ARC) at an actuarially determined rate and is solid. Both the employees and the City make contributions monthly.
Most cities in North Texas utilize Update Service Credits (“USC”) and Cost of Living (“COLA”) adjustment within their TMRS benefit package. To be competitive and retain and attract new employees, it is necessary to update the City’s current plan. This update will increase the overall retirement benefit for an employee. Once approved, in October of 2022, this will be available for employees January 1, 2023.
The approved FY2023 budget includes a step increase for general service employees on the updated step plan executed in FY 2021 as well as a 2% cost of living adjustment. The Police and Fire departments implemented a new step plan in fall of 2021 and a step increase is adopted. The Public Works step plan was introduced and rolled out in fiscal year 2022 and was effective August 2022.


There are multiple areas of reserves built into the budget. By ordinance, the City is required to maintain a 25% General Fund Balance. For FY23, this amount is approximately $8.70 million. Revenues to pay for services are typically delayed due to the timing of growth and the new growth showing up on the tax rolls. This means that while the expenses for new growth are immediate, the revenues follow a few years later.
The Water/Wastewater Fund predicts a working capital reserve of $12.18 million which is approximately 40.89% of FY 2023 revenue received or 149 days of working capital. The Water/Wastewater Fund has multiple revenue sources; however, the main source of revenue is generated by water sales therefore is rate sensitive. Every effort is made to keep rate increases at a minimum with the last rate increase in fiscal year 2020.
General Fund revenues and budgeted transfers are estimated at $31,424,954 for FY23. This is an increase of 12.21% or $3,419,248 over FY22. The main source of revenue into the General Fund are Ad Valorem and Sales Taxes which are forecast at 48.79% of the total General Fund revenue for fiscal year 2023. This growth is contributed to the continued commercial development, new construction values, appreciation in property values and population growth in the area.
The General Fund is the fund that encompasses the basic services of municipal government. These services include Police, Fire, Streets, Development Services, Parks, Public Works, Administration, and all other internal services.
General Fund operating expenditures total $33,946,286 before transfers out. With transfers, the total General Fund budget for FY23 is $34,792,200. This budget is a 17.17% increase or $5,098,561 more than FY22 budget.
General Fund transfers to the Vehicle and Equipment Replacement (VERF) Fund for FY23 is adopted at $845,914. The VERF Fund is a separate fund that provides for the replacement of capital vehicles and equipment. FY23 will see a decrease of $3,710 from the adopted 2022 budget of $849,624. This decrease in transfers is a result of adjustments to the useful life of capital vehicles and equipment.
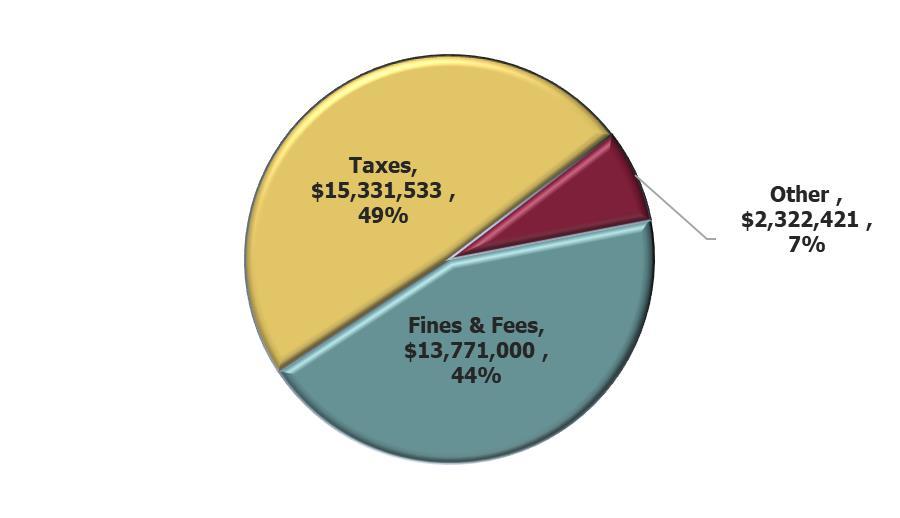
The following chart is representative of the revenues supporting general operations: FY 2022 – 2023 General Fund Revenue
The General Fund is broken down by department and are grouped into the appropriate category by major function including General Government, Public Safety, Development Services, and Public Services. Overall, Public Safety makes up the largest cost center of general purpose operations with a combined budget of $14.42 million or 41.44% of the total General Fund Budget anticipated in the new fiscal year. Public Safety is comprised of Fire/EMS, Police, and Municipal Court.
Fire/EMS will have a total of 47 personnel and includes one (1) new FTE position with an adopted operating budget of $6.90 million an increase over the adopted FY22 budget of $1.30 million. This department makes up 19.83% of the adopted general operating fund budget for the upcoming year. The Fire/EMS operating budget will see increases in the forthcoming years when Fire Station No. 3 has completed construction and becomes operational and fully staffed.
The Police Department’s adopted budget for 2022 is $7.29 million and amounts to 20.95% of the general operating budget. The FY23 budget contains five (5) new FTE positions, with the addition of two Officers for a Traffic Division, one new School Resource Officer, a TCOLE Specialist, and an Assistant Police Chief.
Funding has been included for the Police Department to hold additional trainings and schools for its officers as well and the purchase of capital equipment. For the 2023 budget year, the Police Department will be transitioning to the AXON Technology which integrates both body and dash cameras that help with some of society’s most difficult challenges: Protect Life, Preserve Truth, and Accelerate Justice.
For FY23, the Development Services division, which includes both GIS and Development Services, has an adopted budget totaling $4.02 million. An increase over 2022 of $191,125 and will have a personnel count of thirty three (33) including two (2) FTE positions for the new year. Development Services has budgeted a total of 1,400 residential building permits for the City for the 2022 2023 year and represents 11.54% of the overall general operating fund budget.
Totals for the remaining departments not highlighted above is $15,512,490 for the 2022 2023 budget year an increase over the previous year by $2.63 million. Some of the departments included in this total are Parks, Streets, Engineering, and Library Services. New FTE positions for the remaining departments total nine (9) and are being added to cover the increased growth of the City for the last several years. Further funding for new capital, operational items and software for these departments are included in the overall budget and a sample breakdown can be found in the Significant One Time Expenditures section of this Budget Summary.
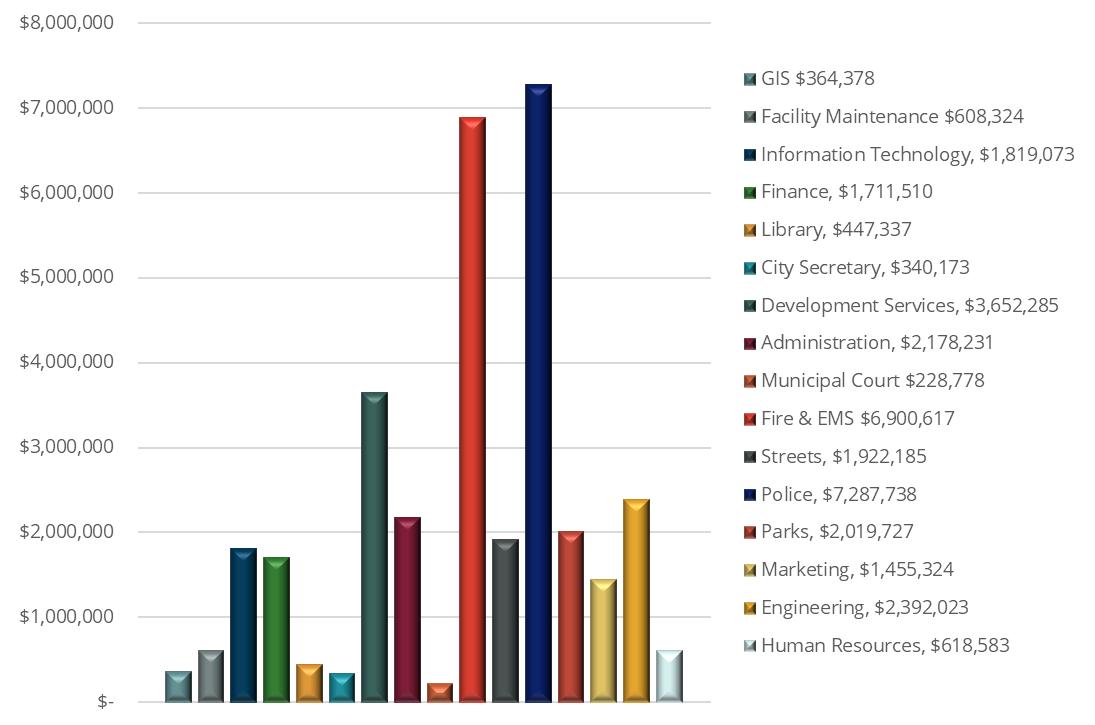
The following chart is representative of the expenditures of the General Fund: FY2022 – 2023 General Fund Expenditures by Department
Water/Wastewater, Solid Waste, Utility Infrastructure, Impact, Capital Recovery, Stormwater Drainage, and Utility Vehicle and Equipment Replacement Fund account for the full service operations of the water and sewer system including water production and distribution, sewer collection and treatment, the collection and disposal of solid waste and the development of new water, wastewater, and drainage systems. These Enterprise funds are 100% self supporting with revenues generated from rates, charges, and fees sufficient to cover operations, debt and various scheduled capital outlay purchases and capital infrastructure projects and act as business enterprises that utilize full accrual accounting and segregates and distinguishes water operations and sewer operations and works toward making each operation self supporting.
The Water/Wastewater Fund (“the utility system”) accounts for water and wastewater operations of the City of Celina. The operations of the utility system include Water, Wastewater, as well as Utility Customer Service. Water and Wastewater services are provided to both residential and commercial customers. Currently, the City of Celina has 11,065 utility accounts that are serviced. Separately, the City is contracted by Denton County Fresh Water Supply District 10 which recently updated their name to Elm Ridge Water Control and Improvement District to perform and manage their water utility maintenance and billing.
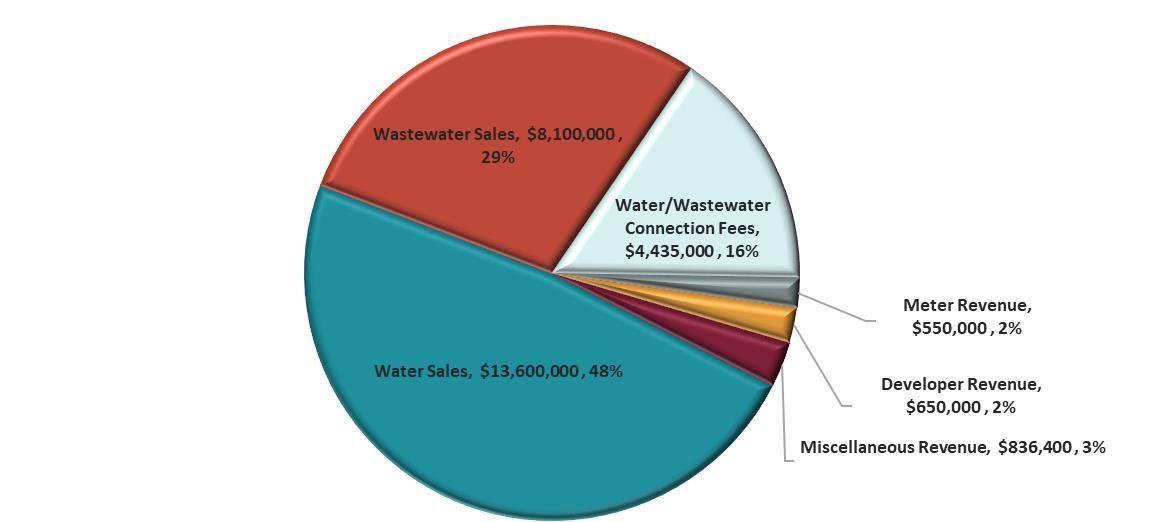
The total Water/Wastewater Fund revenues from rates, fees, and charges is expected to be $27,575,000 for the 2023 fiscal year. This includes water/wastewater sales, connections fees, meter and developer fees and other fees and charges. Other fees and charges are related to services performed in the field for new connections as well as penalties and interest on late payments and disconnects. Miscellaneous revenues for the Water/Wastewater Fund total $596,400 and includes revenue of $400,000 from Elm Ridge Water Control and Improvement District.
The following chart reflects the sources of revenue supporting the City’s utility system:
Other revenue sources include impact fees, capital fees and developer contributions. The City does assess and collect these fees to help support the costs of infrastructure associated with new development for both commercial and residential development.
Infrastructure projects include water, wastewater, and stormwater drainage. Some of the current and future projects that are funded from these revenues include waterline construction, wastewater treatment plant construction, and drainage improvements within the City. Revenues for these funds are adopted at $6,342,900 for the 2022 2023 fiscal year. This is an increase of 22.30% increase over the adopted 2021 2022 budget of $5,186,500.
Water will have a total of twenty-three (23) FTEs and includes one (1) new FTE position with an adopted operating budget of $11,252,353 an increase over the adopted FY22 budget of $9,633,030 and makes up 37.78% of the water/wastewater operating fund budget for the upcoming year. The budget includes a pass-through increase for water purchased through Upper Trinity Regional Water District (UTRWD). The rate for purchased water increased 15.8% per 1,000 gallons.
Wastewater will have a total of thirteen (13) FTEs and includes one (1) new FTE position with an adopted operating budget of $3,381,862 an increase over the 2021-2022 budget of $2,919,966 and is 11.35% of the fund budget.
All other departments will have a total of eleven (11) FTEs and does not include any new positions. All other operating expenditures including both City and Upper Trinity Regional Water District debt is $13,981,267. These costs and FTE staffing includes the Stormwater Drainage Fund.
Impact and Capital Recovery operation costs are anticipated at $5,500,000 with an additional transfer to other Enterprise funds of $1,500,000 for the forthcoming year. These costs cover the engineering, construction, testing, and land acquisitions for capital water/wastewater projects that are mentioned in the above passages.
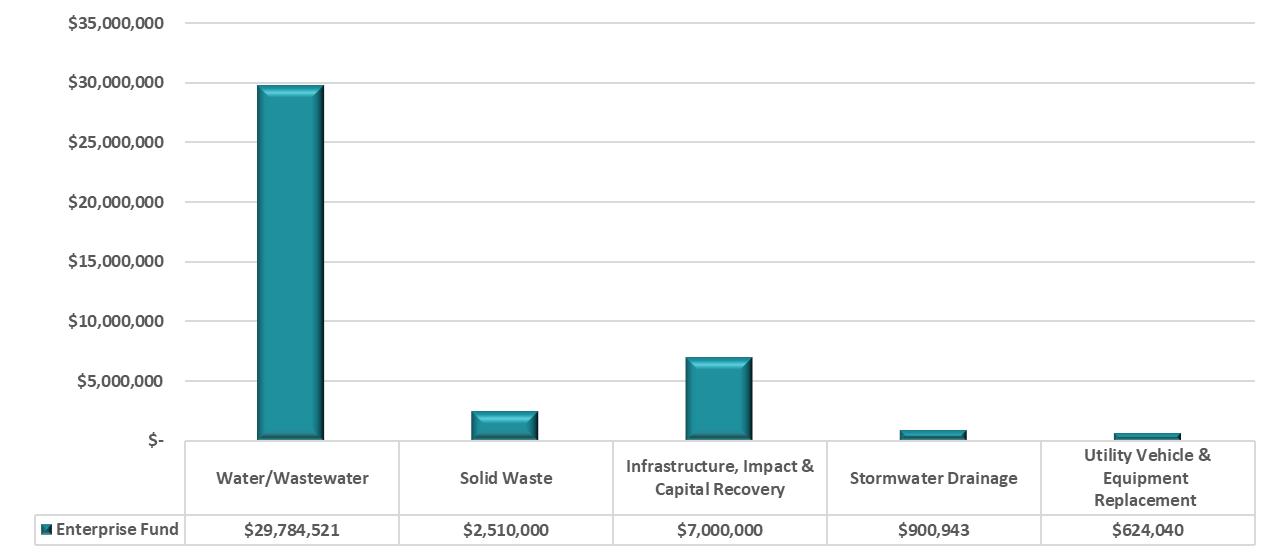
The following graph reflects the uses of funds in the City’s Enterprise Fund:
This fund helps with the beautification of the City of Celina. The revenues collected are allocated for improvements for sidewalks, street landscaping, signage, lighting, and façade improvements as well as Music on the Square and public art. The funding for this fund comes predominantly from Water Tower Rental fees, Tree Mitigation fees, and Warning Device fees.
In FY2022, the City established the Neighborhood Integrity Program which provides grants to HOA’s to revitalize neighborhood amenities and features. Also in the 2022 budget year, the City of Celina began setting aside revenues from this fund to cover the construction of storm warning devices.
The 2022 2023 revenue is forecast at $327,000 and expenditures from operations are $412,500. Projected costs to be incurred in FY23 include Façade Grants, Neighborhood Integrity, Music on the Square, Public Art, and Arbor Day Trees.
The Capital Acquisition Fund is a fund that Celina uses to allocate a portion of surplus revenues into for future capital expenditures. Fiscal Year 2022 2023 scheduled expenditures include:
Fire Station No. 3 FF&E $300,000
Fire Station No. 3 Emergency Signal $200,000 Law Enforcement Center FF&E $350,573 School Zone Flashers $200,000 Wayfinding $150,000 Downtown Street Blade Upgrade Project $137,734 Senior Center FF&E $100,000 Performance Management Study $140,000 Trimax Snake 400S2 Mower $41,754
In FY2022, the City of Celina funded capital project needs through a series of Certificates of Obligation for General and Water/Sewer totaling $70 million and follows up issuances in FY2021 of $95.5 million. Projects are completed through a phased approach and are based on identified needs as the city continues to grow.
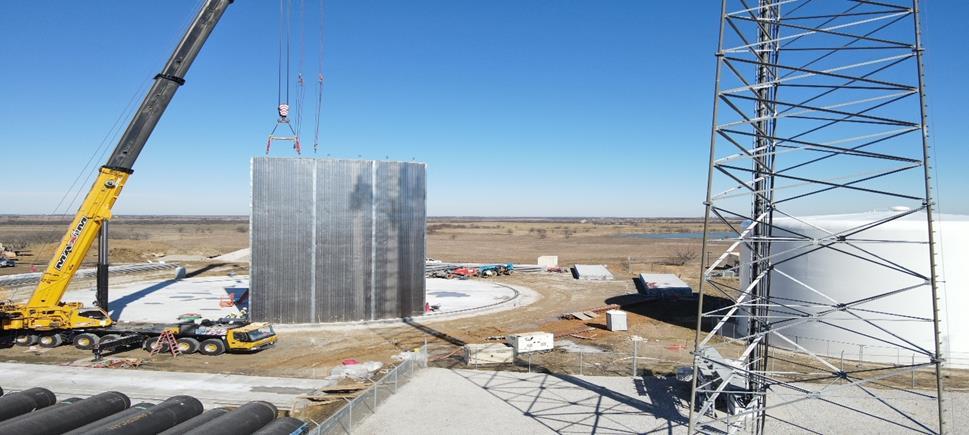
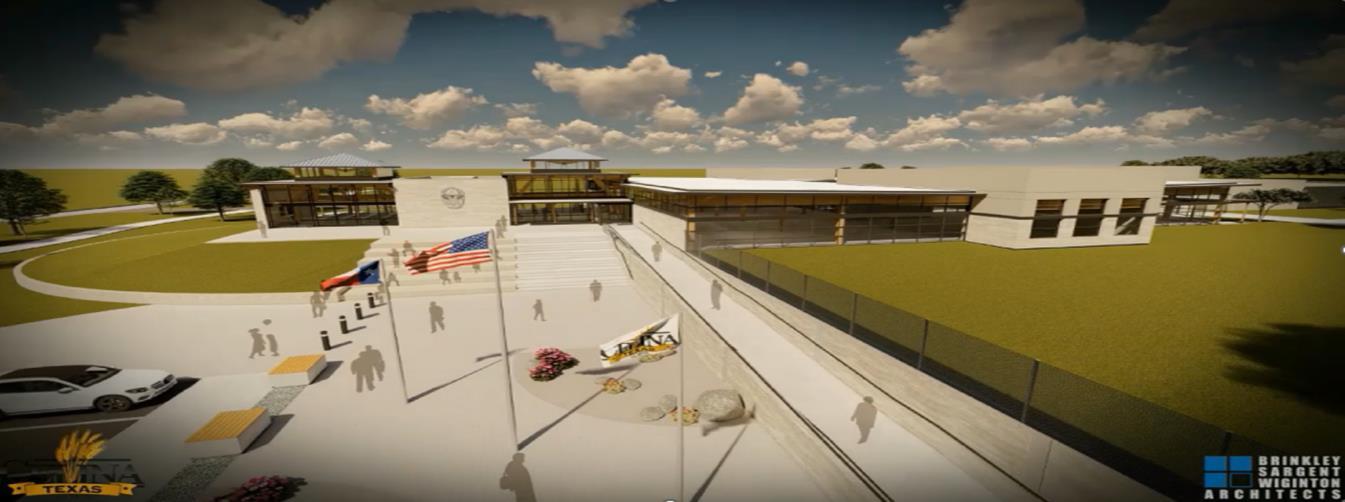
The following is a list of some of the major projects that the Engineering Department has slated for the coming fiscal year expected: Law Enforcement Center construction Fire Station No. 3 construction Preston Road Lighting Phase II Senior Center construction Legacy Hills Water Reclamation Plant Coit Waterline construction
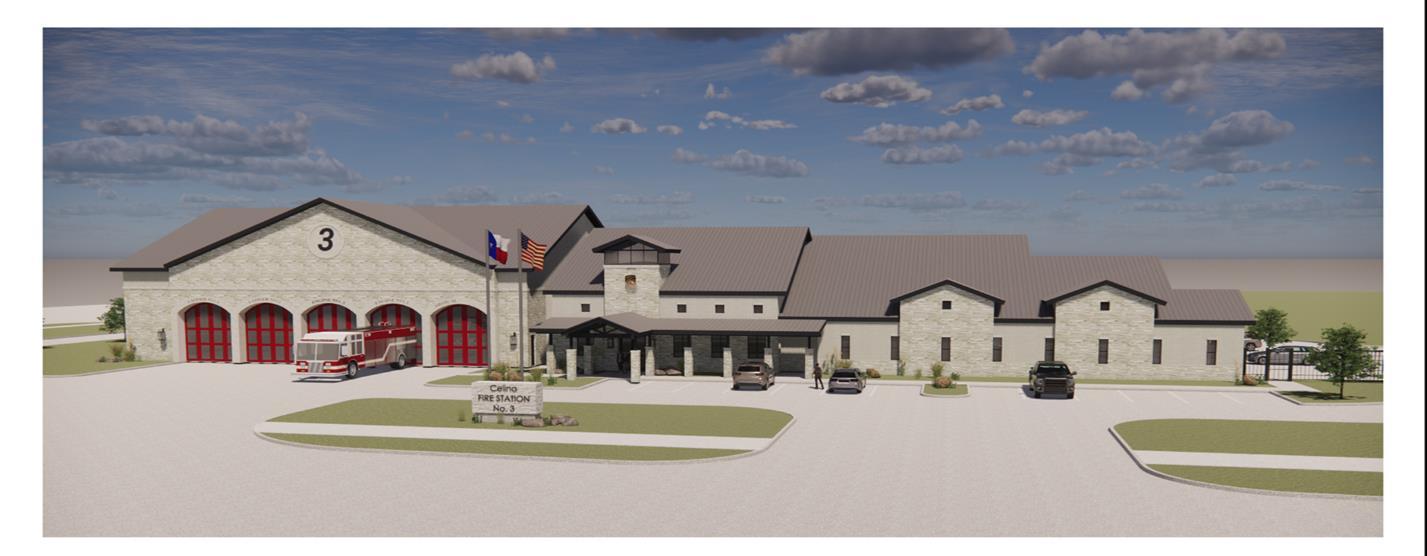 Fire Station No. 3 Design Rendering
Law Enforcement Center Design Rendering
Fire Station No. 3 Design Rendering
Law Enforcement Center Design Rendering
A tax increment reinvestment zone or TIRZ is created as an ordinance of the City Council of the City of Celina, Texas, designating a contiguous geographic area within the city as a reinvestment zone pursuant to Chapter 311 of the Texas Tax Code.
Table of TIRZs in which City of Celina participates:
4SuttonFields 2017 13.22% 27,210.00$ 57,662.36$ 95,389$ 131,205$ 206,971$
5Old CelinaLimited 2016 50.00% $ 2,400.00$ 2,123$ 13,830$ 15,903$
6GlenCrossing 2016 44.48% 30,767.53$ 83,407.06$ 127,096$ 199,420$ 349,028$
7Ownsby Frms 2016 34.60% 13,017.62$ 37,297.01$ 92,760$ 146,962$ 254,407$
8Sutton FieldsII 2017 7.76% 9,367.36$ 33,588$ 66,567$ 162,377$
9TheColumns 2017 34.20% 4,175.85$ 25,311$ 59,494$ 159,771$
10 Chalk Hill 2017 34.20% 1,778.78$ 4,026.93$ 4,027$ 20,097$ 80,813$
12 Edgewood Creek 2022 47.00% $ $ $ $ 7,390$
13 Legacy Hills 2022 15.50% $ $ $ $ 8,290$ 508,231$ 988,660$ 1,475,183$ 2,163,769$ 3,748,941$GrandTotal
*Not Inc.
TIRZ #11 for Downtown Celina consists of approximately 687 acres and funding that supports the Downtown Celina TIRZ is based on the incremental increase of property taxes and sales taxes generated within its boundaries and is supported by City of Celina, Economic Development Corporation (EDC), Community Development Corporation (CDC), and Collin County.
TIRZ #11 was established in 2017 upon the termination of TIRZ #1. In 2017, the taxable base was $86,443,673. For the 2022 tax year, fiscal 2023 budget year the TIRZ certified taxable value is $172,984,530 For 2021, the TIRZ estimated value of $153,163,582 represents an increase of $31,822,286 or 26.23%.
In Fiscal Year 2023, the fund has adopted expenditures of $400,000 for the contractual payment of the Rasor Tract. This was acquired in 2021 for the purchase of the right of way required for the reconstruction of Elm Street. 1,201,727 70.00% 111,236.02$ 330,000.00$ 451,660$ 721,814$ 1,302,264$
This debt service provides the financing of long-term capital projects that improve the City’s streets, parks, buildings, and other infrastructure that is not generally covered by the debt service of the Water/Wastewater Fund.
The following is a list of all debt obligations:
9/30/20238,875,000 10,192,093 19,067,093
9/30/202410,690,000 9,661,804 20,351,804
9/30/202510,970,000 9,209,288 20,179,288
9/30/202612,200,000 8,776,169 20,976,169 9/30/202713,100,000 8,246,219 21,346,219
9/30/202813,665,000 7,676,450 21,341,450
9/30/202914,255,000 7,087,081 21,342,081
9/30/203014,660,000 6,488,344 21,148,344
9/30/203115,265,000 5,896,350 21,161,350
9/30/203215,690,000 5,360,650 21,050,650 9/30/203315,875,000 4,864,988 20,739,988
9/30/203415,730,000 4,375,050 20,105,050
9/30/203515,940,000 3,853,200 19,793,200 9/30/203614,870,000 3,350,044 18,220,044 9/30/203714,745,000 2,883,081 17,628,081
9/30/203814,550,000 2,430,294 16,980,294 9/30/203911,105,000 1,993,744 13,098,744
9/30/20408,950,000 1,678,000 10,628,000 9/30/20419,220,000 1,408,700 10,628,700
9/30/20423,320,000 1,129,500 4,449,500
9/30/20433,490,000 963,500 4,453,500
9/30/20443,660,000 789,000 4,449,000 9/30/20453,840,000 606,000 4,446,000
9/30/20464,040,000 414,000 4,454,000 9/30/20474,240,000 212,000 4,452,000 9/30/2048 $272,945,000 $109,545,547 $382,490,547
General Fund (102) Debt Service (103) Water/Wastewater (202) Solid Waste (203)
Utility Infrastructure, Impact, & Capital Fees (205, 206, 209, 210) Stormwater Drainage (208)
Utility Vehicle & Equipment Replacement (213) Park Fee (109) Grants (115)

Law Enforcement (116) Court Security/Tech (118, 119) Technology (122)
Beginning Fund Balances $ 12,075,154 1,925,406$ 13,791,358$ 1,649,563$ 22,327,901$ 776,013$ 1,161,978$ 5,581,234$ 2,039$ 118,574$ 133,156$ 570,092$
Revenues:
Ad Valorem Taxes 11,274,083 11,037,117
Sales Taxes 3,250,000
Franchise & Other Taxes 807,450 190,000
Licenses & Permits 10,025,000
Rates, Fees and Charges 3,746,000 27,575,000 2,478,000 4,300,000 840,000 2,000,000 7,275
Intergovernmental 400,000
Miscellaneous 1,096,590 41,400 2,000 5,000 200,000
Interest 195,000 25,000 155,000 2,000 44,500 8,400 1,000 20,000 50 200 300 1,500
Transfers In 1,030,831 750,000 400,000 739,151
Total Revenues: $ 31,424,954 $ 11,062,117 $ 28,171,400 $ 2,670,000 $ 5,094,500 $ 1,248,400 $ 740,151 $ 2,020,000 $ 2,050 $ 5,200 $ 7,575 $ 201,500
Expenditures:
General Government 7,275,894 190,000
Public Safety 14,417,133 18,000 40,000
Development Services 4,016,663
Public Services 8,236,596 5,185,000
Utilities 27,714,539 2,510,000 5,500,000 900,943 624,040 Debt Service 10,498,759
Transfers Out 845,914 2,069,982 1,500,000
Total Expenditures 34,792,200$ 10,498,759$ 29,784,521$ 2,510,000$ 7,000,000$ 900,943$ 624,040$ 5,185,000$ $ 18,000$ 40,000$ 190,000$
Ending Fund Balance 8,707,908$ 2,488,764$ 12,178,237$ 1,809,563$ 20,422,401$ 1,123,470$ 1,278,089$ 2,416,234$ 4,089$ 105,774$ 100,731$ 581,592$
General Operating Enterprise 2022-2023 Special RevenueIntegrity (123) Downtown (112) (450, 451) (106)
Vehicle (120)
Road Capital (121)
Capital Improvement Program (621,621A,721, 622, 722)
TIRZ 11 (311) EDC (401) CDC (402)
1,166,543$ 25,425$ 1,818,800$ 1,263,809$ 4,201,146$ 4,400,196 $3,053,883 5,612,666$ 104,354,803$ 372,717$ 2,653,705$ 2,234,995$ 191,271,158$ 22,311,200 1,925,000 1,858,570 7,033,570 997,450 10,025,000 325,000 900,000 550,000 1,626,000 44,347,275 472,860 872,860 115,000 3,000 1,462,990 2,000 500 1,000 1,000 11,000 8,500 4,000 15,000 100,000 500 20,000 2,500 618,950 750,000 845,914 4,515,896
$ 327,000 $ 115,500 $ 1,651,000 $ 1,000 $ 561,000 $ 854,414 $ 4,000 $ 1,641,000 $ 100,000 $ 473,360 $ 1,948,000 $ 1,861,070 $ 92,185,191
412,500 124,153 140,000 1,584,511 75,000 9,802,058 221,000 850,573 15,546,706 1,000,000 68,373 150,000 2,000,000 7,235,036 1,028,491 850,000 80,000 479,488 30,504,072 400,000 46,763,647 17,054,115 54,303,637 10,498,759 100,000 4,515,896 512,500$ 124,153$ 1,028,491$ 850,000$ 1,000,000$ 369,373$ $1,620,061 2,000,000$ 47,558,187$ 400,000$ 1,584,511$ 75,000$ 148,665,739$ 981,043$ 16,772$ 2,441,309$ 414,809$ 3,762,146$ 4,885,237$ $1,437,822 5,253,666$ 56,896,616$ 446,077$ 3,017,194$ 4,021,065$ 134,790,610$ Units
2020 - 2021 Actual 2021 - 2022 Adopted
2021 - 2022 Amended 2021 - 2022 Estimated 2022 - 2023 Adopted
Fund Balance, Beginning of Year $ 8,865,847 9,348,977$ 9,348,977$ 16,328,612$ 12,075,154$
Fines & Fees 17,954,960$ 13,369,600$ 13,896,171$ 14,706,362$ 13,771,000$
Taxes 11,516,165 12,627,581 12,627,581 13,455,638 15,331,533
Grants 1,270,374 30,000 30,000 55,520
Contributions & Donations 290,525 230,550 231,700 276,010 348,250
Interest Income 124,953 150,000 150,000 150,000 195,000
Other Revenue 523,832 694,255 729,262 734,272 748,340
Total Revenues 31,680,809$ 27,101,986$ 27,664,714$ 29,377,802$ 30,394,123$
GIS 197,847$ 233,538$ 233,538$ 233,078$ 364,378$
Facility Maintenance 450,826 555,747 555,747 510,847 608,324
Information Technology 947,643 1,252,146 1,252,146 1,251,221 1,819,073
Finance 1,078,128 1,410,621 1,489,721 1,458,191 1,711,510 Library 242,967 465,490 466,640 442,058 447,337
City Secretary 202,940 236,906 287,906 287,654 340,173
Development Services 2,706,953 3,592,000 3,626,019 3,379,709 3,652,285 Administration 1,577,594 2,017,604 2,017,604 2,114,481 2,178,231
Municipal Court 181,964 206,854 206,854 205,954 228,778 Fire & EMS 5,016,144 5,604,843 5,988,546 6,002,245 6,900,617 Streets 1,369,200 1,699,031 1,699,031 1,615,568 1,922,185 Police 4,321,099 6,320,162 6,461,999 6,229,999 7,287,738 Parks 1,593,577 1,594,268 1,755,545 1,745,076 2,019,727 Marketing 453,011 1,241,105 1,241,105 1,240,955 1,455,324 Engineering 1,656,666 1,965,102 2,042,502 2,044,722 2,392,023 Human Resources 376,141 448,598 468,598 468,598 618,583
Total Expenditures 22,372,698$ 28,844,015$ 29,793,501$ 29,230,356$ 33,946,286$
Total available resources less expenditures $ 18,173,958 $ 7,606,948 $ 7,220,190 $ 16,476,058 $ 8,522,991
Other Financing Sources (Uses)
Transfers In 1,254,790$ 903,720$ 948,720$ 948,720$ 1,030,831$ Transfers Out 2,872,225 849,624 5,349,624 5,349,624 845,914
Total other financing sources (uses) $ (1,617,435) $ 54,096 $ (4,400,904) $ (4,400,904) $ 184,917
Fund Balance, End of Year 16,556,523$ 7,661,044$ 2,819,286$ 12,075,154$ 8,707,908$
Fund Balances:
Restricted for:
Prepaids and Inventory $ 227,911 $ - $ - $ - $Unassigned: Fund Balance 16,328,612$ 7,661,044$ 2,819,286$ 12,075,154$ 8,707,908$
Total Fund Balances 16,556,523$ 7,661,044$ 2,819,286$ 12,075,154$ 8,707,908$
2020 - 2021 Actual 2021 - 2022 Adopted
4100 SALES TAX
2021 - 2022 Amended 2021 - 2022 Estimated 2022 - 2023 Adopted
$ 2,930,968 $ 2,300,000 $ 2,300,000 $ 3,500,000 $ 3,850,000
4101 PROPERTY TAX-CURRENT 10,425,657 12,614,051 12,614,051 12,614,051 16,227,475
4102 PROPERTY TAX-CONTRA (2,354,257) (2,837,744) (2,837,744) (3,024,687) (5,100,181)
4103 PROPERTY TAX-DELINQUENT 190,466 134,274 134,274 134,274 146,789
4104 SALES TAX REBATE (292,982) (200,000) (200,000) (500,000) (600,000)
4105 FRANCHISE TAXES - ELECTRICITY 405,763 400,000 400,000 450,000 500,000
4106 FRANCHISE TAXES - GAS 154,004 150,000 150,000 232,000 260,000
4107 FRANCHISE TAXES - TELEPHONE 11,898 15,000 15,000 10,000 8,000
4108 FRANCHISE TAXES - CABLE TV 30,372 40,000 40,000 24,000 22,000
4112 MIXED BEVERAGE TAX 14,274 12,000 12,000 16,000 17,450
4200 PERMITS 13,832,140 10,000,000 10,000,000 11,000,000 10,000,000
4201 DEVELOPMENT FEES 236,218 150,000 150,000 200,000 200,000
4202 CONSTRUCTION INSPECTION FEES 2,017,134 700,000 700,000 1,200,000 800,000
4208 ISD PERMIT FEES - - - (232,252) -
4210 PROFESSIONAL STUDY FEES 66,335 100,000 130,000 100,000 150,000
4300 COURT FINES 48,997 90,000 90,000 90,000 120,000
4301 COURT FINES TIME PAY 327 600 600 600 500
4302 COURT FINES DEF DISPOSITION 46,671 50,000 50,000 50,000 50,000
4305 CREDIT CARD FEES 383,369 400,000 400,000 200,000 230,000
4310 EMS SERVICE FEES 389,637 350,000 350,000 350,000 450,000
4311 FIRE INSPECTION FEES 16,042 3,000 3,000 65,000 50,000
4312 ALARM PERMIT FEES 32,106 22,000 22,000 22,000 25,000
4313 MUD1 FIRE/EMS AND POLICE FEES 801,758 1,300,000 1,661,571 1,250,000 1,275,000
4314 HEALTH INSPECTION FEES 175 5,000 5,000 28,000 15,000
4315 PID ADMINISTRATION FEES 50,000 199,000 239,000 254,000 250,000 4318 FIELD/PAVILLION RENTAL FEE 20,478 - 45,000 45,000 45,000 4319 FIRE/POLICE FEES GREEN MEADOWS 7,178 - 50,000 83,614 110,000
4329 LIEN RELEASE FEE 6,395 - - 400 500 4400 INTEREST INCOME 124,953 150,000 150,000 150,000 195,000 4502 SAFER GRANT 1,199,891 - - 25,5204506 FAMILY AND CHILD VIOLENCE GRANT 70,483 30,000 30,000 30,0004604 LIBRARY DONATIONS 2,802 1,500 2,650 1,500 1,000 4610 COUNTY LIBRARY FUNDS 19,746 18,000 18,000 18,000 18,000 4611 CONTRIBUTIONS 90,648 41,050 41,050 35,250 85,250 4612 CITY SPONSORED EVENTS DONATIONS 1,266 2,000 2,000 2,000 2,000 4613 CRAFT AND CORK 5,022 11,500 11,500 -4618 SPECIAL EVENTS - - - 50 -
4621 CAJUN FEST 137,671 113,000 113,000 107,040 118,000 4622 BEWARE 306 8,000 8,000 24,670 34,000 4623 CHRISTMAS ON THE SQUARE 1,241 10,500 10,500 42,000 40,000 SPLASH N BLAST 31,825 25,000 25,000 45,500 50,000 4700 POLICE REPORTS 783 1,000 1,000 1,000 500
4702 COUNTY REBATE OF CHILD SAFETY 9,419 2,000 2,000 8,000 8,000 COLLIN CO FIREMAN'S ASSOC 57,824 75,000 75,000 54,870 52,000 DENTON CO FIREMAN'S ASSOC 10,000 10,000 10,000 10,000 10,000 INSURANCE PROCEEDS 43,898 - - -SALE OF ASSETS 292 - - 102PARK FACILITIES USAGE REVENUE 252,366 216,455 236,455 265,000 231,500 PARK CONCESSION STAND - -
2020 - 2021 Actual 2021 - 2022 Adopted 2021 - 2022 Amended 2021 - 2022 Estimated 2022 - 2023 Adopted
Fund Balance, Beginning of Year 2,228,648$ 2,212,549$ 2,212,549$ 2,170,989$ 1,925,406$
Taxes 4,515,868$ 5,291,030$ 6,401,552$ 6,401,552$ 11,037,117$
Interest Income 32,912 25,000 25,000 21,500 25,000
Other Revenue 7,940,173
Total Revenues 12,488,953$ 5,316,030$ 6,426,552$ 6,423,052$ 11,062,117$
Principal 3,340,200$ 2,605,000$ 2,605,000$ 2,605,000$ 5,330,000$
Interest 2,012,300 4,061,485 4,061,485 4,061,485 5,167,359
Issuance Charges 104,749
Miscellaneous 7,884,564 2,150 2,150 2,150 1,400
Total Expenditures 13,341,813$ 6,668,635$ 6,668,635$ 6,668,635$ 10,498,759$
Total available resources less expenditures $ 1,375,789 $ 859,944 $ 1,970,466 $ 1,925,406 $ 2,488,764
Other Financing Sources (Uses)
Transfers In $ $ $ $ $
Transfers Out (795,200)
Total other financing sources (uses) $ 795,200 $ - $ - $ - $ -
Fund Balance, End of Year 2,170,989$ 859,944$ 1,970,466$ 1,925,406$ 2,488,764$
2020 - 2021 Actual 2021 - 2022 Adopted 2021 - 2022 Amended 2021 - 2022 Estimated 2022 - 2023 Adopted
Working Capital, Beginning of Year 9,517,011$ 11,921,567$ 11,921,567$ 14,609,873$ 13,791,358$
Water Sales 9,439,507$ 8,700,000$ 9,200,000$ 11,900,000$ 13,600,000$
Wastewater Sales 7,078,609 6,400,000 6,900,000 7,365,000 8,100,000
Water/Wastewater Connection Fees 7,366,457 5,518,500 5,518,500 5,074,000 4,435,000
Meter Revenue 960,752 660,000 660,000 715,000 550,000
Developer Revenue 850,000 650,000 650,000 650,000 650,000
Trash & Recycling* 1,782,086 1,905,000
Fines & Fees 218,603 185,400 185,400 260,000 240,000
Miscellaneous Revenue 82,879 26,400 26,400 41,400 41,400
Interest Income 141,915 125,000 125,000 125,000 155,000
Other - Intergovernmental/Grant 1,029,133 400,000 400,000 400,000 400,000
Reimbursement - Other 310,266 208,083
Total Revenues 28,949,942$ 24,570,300$ 23,975,566$ 26,738,483$ 28,171,400$
Water Department 9,131,884$ 9,633,030$ 10,400,173$ 10,253,471$ 11,252,353$
Wastewater Department 3,379,227 2,919,966 3,400,000 3,268,346 3,381,862
Utility Billing 457,082 705,256 885,000 882,046 932,660
Trash & Recycling* 1,456,141 1,895,000
Fleet 17 124,790 99,890 99,890 107,196
Debt Service - City Issued 5,629,667 7,419,171 7,419,171 7,419,171 10,442,963
Debt Service - UTRWD 1,742,238 1,598,220 1,598,220 1,598,220 1,597,505
Total Expenditures 21,796,257$ 24,295,433$ 23,802,454$ 23,521,144$ 27,714,539$
Total available resources less expenditures $ 16,670,696 $ 12,196,434 $ 12,094,679 $ 17,827,212 $ 14,248,219
Transfers In 500,000$ $ $ $ $
Transfers Out 2,560,823 1,535,854 4,035,854 4,035,854 2,069,982
Total other financing sources (uses) $ (2,060,823) $ (1,535,854) $ (4,035,854) $ (4,035,854) $ (2,069,982)
Working Capital, End of Year 14,609,873$ 10,660,580$ 8,058,825$ 13,791,358$ 12,178,237$
Fund Balance, Beginning of Year $ $ $ $ 1,649,563$
Trash Franchise Fee $ $ 85,000$ 173,000$ 190,000$
Trash & Recycling Sales 1,820,000 2,195,563 2,478,000
Interest Income 1,000 2,000
Total Revenues $ $ 1,905,000$ 2,369,563$ 2,670,000$
Solid Waste Operations $ $ 1,895,000$ 1,720,000$ 2,510,000$
Total Expenditures $ 1,895,000$ 1,720,000$ 2,510,000$
Total available resources less expenditures $ - $ - $ 10,000 $ 649,563 $ 1,809,563
Other Financing Sources (Uses)
Transfers In $ $ 1,000,000$ 1,000,000$ $ Transfers Out
Total other financing sources (uses) $ - $ - $ 1,000,000 $ 1,000,000 $ -
Fund Balance, End of Year $ $ 1,010,000$ 1,649,563$ 1,809,563$
Fund Balance, Beginning of Year 16,261,717$ 23,140,645$ 23,140,645$ 25,489,406$ 22,327,901$
Infrastructure Fees (205) $ $ $ $ $
Water/Wastewater Impact Fees (206) 6,095,868 2,000,000 2,000,000 3,725,000 2,000,000
Water Capital Recovery Fees (209) 3,144,549 1,000,000 1,000,000 1,800,000 1,000,000
Wastewater Capital Recovery Fees (210) 3,159,539 1,000,000 1,000,000 1,800,000 1,300,000
Interest Income (205, 206, 209, 210) 140,818 100,000 100,000 75,000 44,500
Total Revenues 12,540,774$ 4,100,000$ 4,100,000$ 7,400,000$ 4,344,500$
Infrastructure Operations (205) $ $ $ $ $
Water/Wastewater Impact Operations (206) 475 5,000,000 12,500,000 11,711,931 3,000,000
Water Capital Recovery Operations (209) 914,586 1,000,000 1,000,000 349,574 1,000,000 Wastewater Capital Recovery Operations (210) 500,000 1,000,000 1,000,000 1,500,000
Total Expenditures 1,415,061$ 7,000,000$ 14,500,000$ 12,061,505$ 5,500,000$
Total available resources less expenditures $ 27,387,431 $ 20,240,645 $ 12,740,645 $ 20,827,901 $ 21,172,401
Other Financing Sources (Uses)
Transfers In $ $ 1,500,000$ 1,500,000$ 750,000$ Transfers Out 1,898,024 1,500,000
Total other financing sources (uses) $ (1,898,024) $ - $ 1,500,000 $ 1,500,000 $ (750,000)
Fund Balance, End of Year 25,489,406$ 20,240,645$ 14,240,645$ 22,327,901$ 20,422,401$
2020 - 2021 - 2022 - 2022 - 2022 -
Fund Balance, Beginning of Year 776,730$ 765,724$ 765,724$ 1,295,128$ 776,013$
Stormwater Fees 777,412$ 780,000$ 780,000$ 780,000$ 840,000$ Contributions 250,000
Interest Income 6,956 6,500 6,500 5,100 8,400
Total Revenues 1,034,367$ 786,500$ 786,500$ 785,100$ 848,400$
Stormwater Drainage Operations 515,969$ 1,078,543$ 1,613,715$ 1,604,215$ 900,943$
Total Expenditures 515,969$ 1,078,543$ 1,613,715$ 1,604,215$ 900,943$
Total available resources less expenditures $ 1,295,128 $ 473,681 $ (61,491) $ 476,013 $ 723,470
Transfers In $ 300,000$ 300,000$ 300,000$ 400,000$
Transfers Out
Total other financing sources (uses) $ - $ 300,000 $ 300,000 $ 300,000 $ 400,000
Fund Balance, End of Year 1,295,128$ 773,681$ 238,509$ 776,013$ 1,123,470$
Fund Balance, Beginning of Year $ 906,895$ 906,895$ 906,895$ 1,161,978$
Miscellaneous Revenue $ $ $ $ $
Interest Income 1,000 1,000 500 1,000
Total Revenues $ 1,000$ 1,000$ 500$ 1,000$
Capital Expenditures $ 49,729$ 86,729$ 77,551$ 624,040$
Total Expenditures -$ 49,729$ 86,729$ 77,551$ 624,040$
Total available resources less expenditures $ - $ 858,166 $ 821,166 $ 829,844 $ 538,938
Other Financing Sources (Uses)
Transfers In 906,895$ 332,134$ 332,134$ 332,134$ 739,151$ Transfers Out
Total other financing sources (uses) $ 906,895 $ 332,134 $ 332,134 $ 332,134 $ 739,151
Fund Balance, End of Year 906,895$ 1,190,300$ 1,153,300$ 1,161,978$ 1,278,089$
• Park Fee 109
• Downtown 112
• Grants 115
• Law Enforcement 116
• Court Security 118
• Court Technology 119
• Technology 122
• Integrity 123
• Developer Capital Fee 450
• Wilson Park Fee 451
2020 - 2021 Actual 2021 - 2022 Adopted 2021 - 2022 Amended 2021 - 2022 Estimated 2022 - 2023 Adopted
Fund Balance, Beginning of Year 3,132,007$ 3,225,390$ 3,225,390$ 4,751,911$ 5,581,234$
Park Fees 5,295,776$ 1,200,000$ 1,200,000$ 3,296,500$ 2,000,000$ Grants 1,500,000
Developer Revenue 2,304,137
Interest Income 42,242 25,000 25,000 14,661 20,000
Total Revenues 9,142,156$ 1,225,000$ 1,225,000$ 3,311,161$ 2,020,000$
Parks & Recreation 4,909,752$ 2,500,000$ 2,500,000$ 2,481,838$ 5,185,000$
Total Expenditures 4,909,752$ 2,500,000$ 2,500,000$ 2,481,838$ 5,185,000$
Total available resources less expenditures $ 7,364,411 $ 1,950,390 $ 1,950,390 $ 5,581,234 $ 2,416,234
Transfers In $ $ $ $ $
Transfers Out 2,612,500 Total other financing sources (uses) $ (2,612,500) $ - $ - $ - $ -
Fund Balance, End of Year 4,751,911$ 1,950,390$ 1,950,390$ 5,581,234$ 2,416,234$
2020 - 2021 Actual 2021 - 2022 Adopted 2021 - 2022 Amended 2021 - 2022 Estimated 2022 - 2023 Adopted
Fund Balance, Beginning of Year 10,727$ 12,788$ 12,788$ 12,788$ 2,039$
Grants 8,873$ $ $ 1,926$ 2,000$ Interest Income 85 35 50
Total Revenues 8,958$ -$ -$ 1,961$ 2,050$
Operations 6,897$ $ 12,710$ 12,710$ $
Total Expenditures 6,897$ $ 12,710$ 12,710$ $
Total available resources less expenditures $ 12,788 $ 12,788 $ 78 $ 2,039 $ 4,089
Other Financing Sources (Uses)
Transfers In $ $ $ $ $ Transfers Out
Total other financing sources (uses) $ - $ - $ - $ - $ -
Fund Balance, End of Year 12,788$ 12,788$ 78$ 2,039$ 4,089$
2020 - 2021 Actual 2021 - 2022 Adopted 2021 - 2022 Amended 2021 - 2022 Estimated 2022 - 2023 Adopted
Fund Balance, Beginning of Year 25,833$ 36,619$ 36,619$ 36,619$ 118,574$
Police Seizures 10,593$ $ 25,000$ 122,804$ 5,000$ Interest Income 194 150 200
Total Revenues 10,786$ -$ 25,000$ 122,954$ 5,200$
Operations $ $ 41,000$ 41,000$ 18,000$
Total Expenditures $ $ 41,000$ 41,000$ 18,000$
Total available resources less expenditures $ 36,619 $ 36,619 $ 20,619 $ 118,574 $ 105,774
Other Financing Sources (Uses)
Transfers In $ $ $ $ $ Transfers Out
Total other financing sources (uses) $ - $ - $ - $ - $ -
Fund Balance, End of Year 36,619$ 36,619$ 20,619$ 118,574$ 105,774$
2020 - 2021 Actual 2021 - 2022 Adopted 2021 - 2022 Amended 2021 - 2022 Estimated 2022 - 2023 Adopted
Fund Balance, Beginning of Year 120,491$ 105,917$ 105,917$ 126,356$ 133,156$
Court Security/Technology Revenue 5,907$ 5,000$ 5,000$ 6,500$ 7,275$ Interest Income 830 100 100 300 300
Total Revenues 6,738$ 5,100$ 5,100$ 6,800$ 7,575$
Municipal Court Administration 873$ 20,000$ 20,000$ $ 40,000$
Total Expenditures 873$ 20,000$ 20,000$ $ 40,000$
Total available resources less expenditures $ 126,356 $ 91,017 $ 91,017 $ 133,156 $ 100,731
Other Financing Sources (Uses)
Transfers In $ $ $ $ $ Transfers Out
Total other financing sources (uses) $ - $ - $ - $ - $ -
Fund Balance, End of Year 126,356$ 91,017$ 91,017$ 133,156$ 100,731$
2020 - 2021 Actual 2021 - 2022 Adopted 2021 - 2022 Amended 2021 - 2022 Estimated 2022 - 2023 Adopted
Fund Balance, Beginning of Year 175,659$ 385,043$ 385,043$ 548,150$ 570,092$
Technology Fees 587,000$ 200,000$ 200,000$ 325,000$ 200,000$ Interest Income 2,891 1,500 1,500 1,500 1,500
Total Revenues 589,891$ 201,500$ 201,500$ 326,500$ 201,500$
Operations 17,400$ 100,000$ 325,000$ 304,558$ 190,000$
Total Expenditures 17,400$ 100,000$ 325,000$ 304,558$ 190,000$
Total available resources less expenditures $ 748,150 $ 486,543 $ 261,543 $ 570,092 $ 581,592
Transfers In $ $ $ $ $ Transfers Out 200,000 Total other financing sources (uses) $ (200,000) $ - $ - $ - $ -
Fund Balance, End of Year 548,150$ 486,543$ 261,543$ 570,092$ 581,592$
2020 - 2021 Actual 2021 - 2022 Adopted 2021 - 2022 Amended 2021 - 2022 Estimated 2022 - 2023 Adopted
Fund Balance, Beginning of Year 267,294$ 426,794$ 426,794$ 550,493$ 1,166,543$
Fees 398,326$ 335,000$ 597,500$ 940,000$ 325,000$
Interest Income 2,729 2,000 2,000 2,000 2,000
Total Revenues 401,055$ 337,000$ 599,500$ 942,000$ 327,000$
Operations 117,856$ 170,000$ 433,750$ 325,950$ 412,500$
Total Expenditures 117,856$ 170,000$ 433,750$ 325,950$ 412,500$
Total available resources less expenditures $ 550,493 $ 593,794 $ 592,544 $ 1,166,543 $ 1,081,043
Other Financing Sources (Uses)
Transfers In $ $ $ $ $ Transfers Out 100,000
Total other financing sources (uses) $ - $ - $ - $ - $ (100,000)
Fund Balance, End of Year 550,493$ 593,794$ 592,544$ 1,166,543$ 981,043$
Fund Balances:
Restricted for: Warning Device Program $ - $ 150,000 $ 150,000 $ 390,000 $ 465,000 Unassigned: Integrity Fund Programs 550,493$ 443,794$ 442,544$ 776,543$ 516,043$
Total Fund Balances 550,493$ 593,794$ 592,544$ 1,166,543$ 981,043$
2020 - 2021 Actual 2021 - 2022 Adopted 2021 - 2022 Amended 2021 - 2022 Estimated 2022 - 2023 Adopted
Fund Balance, Beginning of Year 71,403$ 92,593$ 92,593$ 77,680$ 25,425$
Contributions & Donations 81,554$ 65,000$ 65,000$ 25,500$ 115,000$ Grants
Interest Income 623 900 900 225 500
Total Revenues 82,177$ 65,900$ 65,900$ 25,725$ 115,500$
Main Street Operations 75,900$ 93,000$ 93,000$ 77,980$ 124,153$
Total Expenditures 75,900$ 93,000$ 93,000$ 77,980$ 124,153$
Total available resources less expenditures $ 77,680 $ 65,493 $ 65,493 $ 25,425 $ 16,772
Other Financing Sources (Uses)
Transfers In $ $ $ $ $ Transfers Out
Total other financing sources (uses) $ - $ - $ - $ - $ -
Fund Balance, End of Year 77,680$ 65,493$ 65,493$ 25,425$ 16,772$
2020 - 2021 Actual 2021 - 2022 Adopted 2021 - 2022 Amended 2021 - 2022 Estimated 2022 - 2023 Adopted
Fund Balance, Beginning of Year 11,575$ 14,075$ 14,075$ 175,199$ 376,300$
Capital Recovery Fees 1,018,060$ 1,028,491$ 1,028,491$ 400,000$ 700,000$ Interest Income 3,090 2,500 2,500 1,100
Total Revenues 1,021,150$ 1,030,991$ 1,030,991$ 401,100$ 700,000$
Developers Incentive Payment 857,526$ 1,028,491$ 1,028,491$ 200,000$ 1,028,491$
Total Expenditures 857,526$ 1,028,491$ 1,028,491$ 200,000$ 1,028,491$
Total available resources less expenditures $ 175,199 $ 16,575 $ 16,575 $ 376,299 $ 47,809
Other Financing Sources (Uses)
Transfers In $ $ $ $ 750,000$
Transfers Out
Total other financing sources (uses) $ - $ - $ - $ - $ 750,000
Fund Balance, End of Year 175,199$ 16,575$ 16,575$ 376,299$ 797,809$
2020 - 2021 Actual 2021 - 2022 Adopted 2021 - 2022 Amended 2021 - 2022 Estimated 2022 - 2023 Adopted
Fund Balance, Beginning of Year -$ 1,212,500$ 1,212,500$ 1,251,501$ 1,442,501$
Park Fees 39,001$ 517,500$ 517,500$ 190,000$ 200,000$ Interest Income 2,500 2,500 1,000 1,000
Total Revenues 39,001$ 520,000$ 520,000$ 191,000$ 201,000$
Construction $ $ $ $ $
Total Expenditures $ $ $ $ $
Total available resources less expenditures $ 39,001 $ 1,732,500 $ 1,732,500 $ 1,442,501 $ 1,643,501
Other Financing Sources (Uses)
Transfers In 1,212,500$ $ $ $ $ Transfers Out Total other financing sources (uses) $ 1,212,500 $ - $ - $ - $ -
Fund Balance, End of Year 1,251,501$ 1,732,500$ 1,732,500$ 1,442,501$ 1,643,501$
Governmental Fund
2020 - 2021 Actual 2021 - 2022 Adopted 2021 - 2022 Amended 2021 - 2022 Estimated 2022 - 2023 Adopted
Fund Balance, Beginning of Year $ 950,000$ 950,000$ 950,000$ 1,263,809$
Contributions $ $ $ $ $ Intergovernmental Revenue Interest Income 1,000 1,000
Total Revenues -$ -$ -$ 1,000$ 1,000$
Street Construction Operations $ 850,000$ 850,000$ 687,191$ 850,000$
Total Expenditures -$ 850,000$ 850,000$ 687,191$ 850,000$
Total available resources less expenditures $ - $ 100,000 $ 100,000 $ 263,809 $ 414,809
Other Financing Sources (Uses)
Transfers In 950,000$ $ 1,000,000$ 1,000,000$ $ Transfers Out Total other financing sources (uses) $ 950,000 $ - $ 1,000,000 $ 1,000,000 $ -
Fund Balance, End of Year 950,000$ 100,000$ 1,100,000$ 1,263,809$ 414,809$
2020 - 2021 Actual 2021 - 2022 Adopted 2021 - 2022 Amended 2021 - 2022 Estimated 2022 - 2023 Adopted
Fund Balance, Beginning of Year 1,976,687$ 2,855,141$ 2,855,141$ 3,059,450$ 4,201,146$
Road Impact Fees 1,609,668$ 300,000$ 300,000$ 1,717,204$ 550,000$ Other Revenue
Interest Income 16,399 8,000 8,000 11,000 11,000
Total Revenues 1,626,066$ 308,000$ 308,000$ 1,728,204$ 561,000$
Road Impact Operations 543,303$ 1,000,000$ 1,081,000$ 586,508$ 1,000,000$
Total Expenditures 543,303$ 1,000,000$ 1,081,000$ 586,508$ 1,000,000$
Total available resources less expenditures $ 3,059,450 $ 2,163,141 $ 2,082,141 $ 4,201,146 $ 3,762,146
Other Financing Sources (Uses)
Transfers In $ $ $ $ $
Transfers Out
Total other financing sources (uses) $ - $ - $ - $ - $ -
Fund Balance, End of Year 3,059,450$ 2,163,141$ 2,082,141$ 4,201,146$ 3,762,146$
2020 - 2021 Actual 2021 - 2022 Adopted 2021 - 2022 Amended 2021 - 2022 Estimated 2022 - 2023
Fund Balance, Beginning of Year 4,288,463$ 3,741,506$ 3,741,506$ 3,976,082$ 4,400,196$
Miscellaneous Revenue $ $ $ 30,100$ $
Interest Income 27,419 15,000 15,000 10,000 8,500
Total Revenues 27,419$ 15,000$ 15,000$ 40,100$ 8,500$
Capital Expenditures 885,417$ 163,846$ 534,689$ 465,610$ 369,373$
Total Expenditures 885,417$ 163,846$ 534,689$ 465,610$ 369,373$
Total available resources less expenditures $ 3,430,464 $ 3,592,660 $ 3,221,817 $ 3,550,572 $ 4,039,323
Transfers In 635,725$ 849,624$ 849,624$ 849,624$ 845,914$
Transfers Out 90,107
Total other financing sources (uses)
$ 545,618 $ 849,624 $ 849,624 $ 849,624 $ 845,914
Fund Balance, End of Year 3,976,082$ 4,442,284$ 4,071,441$ 4,400,196$ 4,885,237$
Fund Balance, Beginning of Year 1,983,189$ 1,314,585$ 1,314,585$ 1,120,596$ 3,053,883$
Intergovernmental Revenue 461,550$ $ $ $ $ Interest Income 9,096 10,000 10,000 6,000 4,000
Total Revenues 470,646$ 10,000$ 10,000$ 6,000$ 4,000$
Capital Acquisitions 2,119,739$ 750,000$ 3,030,000$ 2,622,713$ 1,620,061$
Total Expenditures 2,119,739$ 750,000$ 3,030,000$ 2,622,713$ 1,620,061$
Total available resources less expenditures $ 334,096 $ 574,585 $ (1,705,415) $ (1,496,117) $ 1,437,822
Transfers In 786,500$ $ 4,550,000$ 4,550,000$ $ Transfers Out
Total other financing sources (uses) $ 786,500 $ - $ 4,550,000 $ 4,550,000 $ -
Fund Balance, End of Year 1,120,596$ 574,585$ 2,844,585$ 3,053,883$ 1,437,822$
2020 - 2021 Actual 2021 - 2022 2021 - 2022 2021 - 2022 Estimated 2022 - 2023
Fund Balance, Beginning of Year 1,585,655$ 5,247,778$ 5,247,778$ 5,954,605$ 5,612,666$
Road Capital Recovery Fee 3,762,837$ 1,000,000$ 1,400,000$ 1,800,000$ 1,500,000$ Fire Recovery Fee 126,000 126,000 Intergovernmental Revenue
Reimbursement - Other 376,315 995,523 995,523
Interest Income 22,080 15,000 15,000 15,000 15,000
Total Revenues 4,161,232$ 1,015,000$ 2,410,523$ 2,936,523$ 1,641,000$
Road Capital Recovery Operations 1,192,282$ 2,000,000$ 3,278,462$ 3,278,462$ 2,000,000$
Total Expenditures 1,192,282$ 2,000,000$ 3,278,462$ 3,278,462$ 2,000,000$
Total available resources less expenditures $ 4,554,605 $ 4,262,778 $ 4,379,839 $ 5,612,666 $ 5,253,666
Other Financing Sources (Uses)
Transfers In 1,400,000$ $ $ $ $ Transfers Out
Total other financing sources (uses) $ 1,400,000 $ - $ - $ - $ -
Fund Balance, End of Year 5,954,605$ 4,262,778$ 4,379,839$ 5,612,666$ 5,253,666$
2020 - 2021 Actual 2021 - 2022 Adopted 2021 - 2022 Amended 2021 - 2022 Estimated 2022 - 2023 Adopted
Fund Balance, Beginning of Year $ 60,712,272$ 60,712,272$ 71,002,653$ 104,354,803$
Revenues
Miscellaneous Revenue $ $ $ $ $
Interest Income 19,338 47,000 100,000
Total Revenues 19,338$ $ $ 47,000$ 100,000$
621 Bond Fund 17,913,633$ 14,281,754$ 14,281,754$ 10,535,411$ 3,550,956$
621A Bond Fund 556,940 31,500,000 31,500,000 641,703 18,301,357
721 Bond Fund 6,776,389 14,930,518 14,930,518 8,508,580 8,715,031
622 Bond Fund 35,000,000 8,348,241 8,651,759
722 Bond Fund 35,000,000 8,660,916 8,339,084
Total Expenditures 25,246,962$ 60,712,272$ 130,712,272$ 36,694,851$ 47,558,187$
Total available resources less expenditures $ (25,227,624) $ - $ (70,000,000) $ 34,354,803 56,896,616$
Other Financing Sources (Uses)
Bonds Issued 96,230,277$ $ 70,000,000$ 70,000,000$ $ Transfers In Transfers Out
Total other financing sources (uses) $ 96,230,277 $ - $ 70,000,000 $ 70,000,000 $
Fund Balance, End of Year 71,002,653$ $ $ 104,354,803$ 56,896,616$
2020 - 2021 Actual 2021 - 2022 Adopted 2021 - 2022 Amended 2021 - 2022 Estimated 2022 - 2023 Adopted
Fund Balance, Beginning of Year 196,326$ 392,767$ 392,767$ 394,981$ 372,717$
Intergovernmental Revenue 294,079$ 439,657$ 439,657$ 377,236$ 472,860$ Interest Income 1,208 500 500 500 500
Total Revenues 295,287$ 440,157$ 440,157$ 377,736$ 473,360$
Downtown Celina 96,632$ 400,000$ 400,000$ 400,000$ 400,000$
Total Expenditures 96,632$ 400,000$ 400,000$ 400,000$ 400,000$
Total available resources less expenditures 394,981$ 432,924$ 432,924$ 372,717$ 446,077$
Other Financing Sources (Uses)
Transfers In $ $ $ $ $ Transfers Out
Total other financing sources (uses) $ - $ - $ - $ - $ -
Fund Balance, End of Year 394,981$ 432,924$ 432,924$ 372,717$ 446,077$
2020 - 2021 Actual 2021 - 2022 Adopted 2021 - 2022 Amended 2021 - 2022 Estimated 2022 - 2023 Adopted
Working Capital, Beginning of Year 1,071,200$ 1,514,494$ 1,514,494$ 2,071,418$ 2,653,705$
Taxes 1,465,484$ 1,150,000$ 1,150,000$ 1,750,000$ 1,925,000$ Grants
Intergovernmental Revenue 200,000 200,000 200,000
Other Revenues 3,000 3,000 3,000 3,000 3,000
Interest Income 26,326 15,000 15,000 39,000 20,000
Total Revenues 1,694,810$ 1,368,000$ 1,368,000$ 1,792,000$ 1,948,000$
Personnel Costs 196,526$ 390,672$ 390,672$ 350,014$ 523,681$
Legal & Professional 19,567 23,500 23,500 26,000 42,000
Utilities 1,460 2,400 2,400 1,200 2,400
General & Administrative 264,662 393,500 393,500 257,521 630,000
Debt Service 105,038 105,038 105,038 105,978 5,000
TIRZ Agreements 36,000 40,000 40,000 58,000 66,430
Total Expenditures 623,253$ 955,110$ 955,110$ 798,713$ 1,269,511$
Total available resources less expenditures 2,142,757$ 1,927,384$ 1,927,384$ 3,064,705$ 3,332,194$
Transfers In $ $ $ $ $
Transfers Out 71,339 411,000 411,000 411,000 315,000
Total other financing sources (uses) $ (71,339) $ (411,000) $ (411,000) $ (411,000) $ (315,000)
Working Capital, End of Year 2,071,418$ 1,516,384$ 1,516,384$ 2,653,705$ 3,017,194$
2020 - 2021 Actual 2021 - 2022 Adopted 2021 - 2022 Amended 2021 - 2022 Estimated 2022 - 2023 Adopted
Fund Balance, Beginning of Year 1,345,926$ 2,421,906$ 2,421,906$ 2,791,083$ 2,234,995$
Taxes 1,465,484$ 1,150,000$ 1,150,000$ 1,750,000$ 1,925,000$
TIRZ Agreements (31,089) (35,000) (35,000) (58,088) (66,430)
Miscellaneous Revenue
Interest Income 10,762 15,000 15,000 2,000 2,500
Total Revenues 1,445,157$ 1,130,000$ 1,130,000$ 1,693,912$ 1,861,070$
Miscellaneous Expense $ $ 2,250,000$ 2,250,000$ 75,000$
Total Expenditures $ $ 2,250,000$ 2,250,000$ 75,000$
Total available resources less expenditures 2,791,083$ 3,551,906$ 1,301,906$ 2,234,995$ 4,021,065$
Transfers In $ $ $ $ $ Transfers Out
Total other financing sources (uses) $ - $ - $ - $ - $ -
Fund Balance, End of Year 2,791,083$ 3,551,906$ 1,301,906$ 2,234,995$ 4,021,065$
Taxing Unit Name
Taxing Unit’s Address, City, State, ZIP Code
Phone (area code and number)
Taxing Unit’s Website Address
GENERAL INFORMATION: Tax Code Section 26.04(c) requires an officer or employee designated by the governing body to calculate the no-new-revenue (NNR) tax rate and voter-approval tax rate for the taxing unit. These tax rates are expressed in dollars per $100 of taxable value calculated. The calculation process starts after the chief appraiser delivers to the taxing unit the certified appraisal roll and the estimated values of properties under protest. The designated officer or employee shall certify that the officer or employee has accurately calculated the tax rates and used values shown for the certified appraisal roll or certified estimate. The officer or employee submits the rates to the governing body by Aug. 7 or as soon thereafter as practicable.
School districts do not use this form, but instead use Comptroller Form 50-859 Tax Rate Calculation Worksheet, School District without Chapter 313 Agreements or Comptroller Form 50-884 Tax Rate Calculation Worksheet, School District with Chapter 313 Agreements.
Water districts as defined under Water Code Section 49.001(1) do not use this form, but instead use Comptroller Form 50-858 Water District Voter-Approval Tax Rate Worksheet for Low Tax Rate and Developing Districts or Comptroller Form 50-860 Developed Water District Voter-Approval Tax Rate Worksheet.
The Comptroller’s office provides this worksheet to assist taxing units in determining tax rates. The information provided in this worksheet is offered as technical assistance and not legal advice. Taxing units should consult legal counsel for interpretations of law regarding tax rate preparation and adoption.
The NNR tax rate enables the public to evaluate the relationship between taxes for the prior year and for the current year based on a tax rate that would produce the same amount of taxes (no new taxes) if applied to the same properties that are taxed in both years. When appraisal values increase, the NNR tax rate should decrease.
The NNR tax rate for a county is the sum of the NNR tax rates calculated for each type of tax the county levies.
While uncommon, it is possible for a taxing unit to provide an exemption for only maintenance and operations taxes. In this case, the taxing unit will need to calculate the NNR tax rate separately for the maintenance and operations tax and the debt tax, then add the two components together.
2. 2021 tax ceilings. Counties, cities and junior college districts. Enter 2021 total taxable value of homesteads with tax ceilings. These include the homesteads of homeowners age 65 or older or disabled. Other taxing units enter 0. If your taxing unit adopted the tax ceiling provision in 2021 or a prior year for homeowners age 65 or older use this step. of Celina 972-382-2682 North Ohio Street, Celina, TX 75009 www.celina-tx.gov 2,957,316,297 197,503,454 2,759,812,843
1. 2021 total taxable value. Enter the amount of 2021 taxable value on the 2021 tax roll today. Include any adjustments since last year’s certification; exclude Tax Code Section 25.25(d) one-fourth and one-third over-appraisal corrections from these adjustments. Exclude any property value subject to an appeal under Chapter 42 as of July 25 (will add undisputed value in Line 6). This total includes the taxable value of homesteads with tax ceil ings (will deduct in Line 2) and the captured value for tax increment financing (adjustment is made by deducting TIF taxes, as reflected in Line 17).1 $
Form developed by: Texas Comptroller of Public Accounts, Property Tax Assistance Division For additional copies, visit: comptroller.texas.gov/taxes/property-tax
8. 2021 taxable value, adjusted for actual and potential court-ordered adjustments. Add Line 3 and Line 7. $
9. 2021 taxable value of property in territory the taxing unit deannexed after Jan. 1, 2021. Enter the 2021 value of property in deannexed territory 5 $
10.
2021 taxable value lost because property first qualified for an exemption in 2022. If the taxing unit increased an original exemption, use the difference between the original exempted amount and the increased exempted amount. Do not include value lost due to freeport, goodsin-transit, temporary disaster exemptions. Note that lowering the amount or percentage of an existing exemption in 2022 does not create a new exemption or reduce taxable value.
A. Absolute exemptions. Use 2021 market value: $
B. Partial exemptions. 2022 exemption amount or 2022 percentage exemption times 2021 value:. + $
C. Value loss. Add A and B. 6 $
11.
2021 taxable value lost because property first qualified for agricultural appraisal (1-d or 1-d-1), timber appraisal, recreational/ scenic appraisal or public access airport special appraisal in 2022. Use only properties that qualified in 2022 for the first time; do not use properties that qualified in 2021
A. 2021 market value: $
B. 2022 productivity or special appraised value: - $
C. Value loss. Subtract B from A. 7 $
12. Total adjustments for lost value. Add Lines 9, 10C and 11C. $
13. 2021 captured value of property in a TIF. Enter the total value of 2021 captured appraised value of property taxable by a taxing unit in a tax increment financing zone for which 2021 taxes were deposited into the tax increment fund. 8 If the taxing unit has no captured appraised value in line 18D, enter 0. $
14. 2021 total value. Subtract Line 12 and Line 13 from Line 8. $
15. Adjusted 2021 total levy. Multiply Line 4 by Line 14 and divide by $100. $
16. Taxes refunded for years preceding tax year 2021. Enter the amount of taxes refunded by the taxing unit for tax years preceding tax year 2021 Types of refunds include court decisions, Tax Code Section 25.25(b) and (c) corrections and Tax Code Section 31.11 payment errors. Do not include refunds for tax year 2021. This line applies only to tax years preceding tax year 2021. 9 $
17. Adjusted 2021 levy with refunds and TIF adjustment. Add Lines 15 and 16. 10 $ 18.
Total 2022 taxable value on the 2022 certified appraisal roll today. This value includes only certified values or certified estimate of values and includes the total taxable value of homesteads with tax ceilings (will deduct in Line 20). These homesteads include homeowners age 65 or older or disabled. 11
A. Certified values: $
B. Counties: Include railroad rolling stock values certified by the Comptroller’s office: + $
C. Pollution control and energy storage system exemption: Deduct the value of property exempted for the current tax year for the first time as pollution control or energy storage system property: - $
D. Tax increment financing: Deduct the 2022 captured appraised value of property taxable by a taxing unit in a tax increment financing zone for which the 2022 taxes will be deposited into the tax increment fund. Do not include any new property value that will be included in Line 23 below. 12 - $
E. Total 2022 value. Add A and B, then subtract C and D. $
5 Tex. Tax Code § 26.012(15)
6 Tex. Tax Code § 26.012(15)
7 Tex. Tax Code § 26.012(15)
8 Tex. Tax Code § 26.03(c)
9 Tex. Tax Code § 26.012(13)
10 Tex. Tax Code § 26.012(13)
11 Tex. Tax Code § 26.012, 26.04(c-2)
12 Tex. Tax Code § 26.03(c) 4,793,789 6,323,082 11,116,871 0 0 0 11,116,871 326,497,467 2,422,426,272 15,624,649 30,632 15,655,281 4,191,540,499 0 558,744,243 3,632,796,256
19.
Total value of properties under protest or not included on certified appraisal roll. 13
A. 2022 taxable value of properties under protest. The chief appraiser certifies a list of properties still under ARB protest. The list shows the appraisal district’s value and the taxpayer’s claimed value, if any, or an estimate of the value if the taxpayer wins. For each of the properties under protest, use the lowest of these values. Enter the total value under protest. 14 $
B. 2022 value of properties not under protest or included on certified appraisal roll. The chief appraiser gives taxing units a list of those taxable properties that the chief appraiser knows about but are not included in the appraisal roll certification. These properties also are not on the list of properties that are still under protest. On this list of properties, the chief appraiser includes the market value, appraised value and exemptions for the preceding year and a reasonable estimate of the market value, appraised value and exemptions for the current year. Use the lower market, appraised or taxable value (as appropriate). Enter the total value of property not on the certified roll. 15 + $
C. Total value under protest or not certified. Add A and B. $
20. 2022 tax ceilings. Counties, cities and junior colleges enter 2022 total taxable value of homesteads with tax ceilings. These include the homesteads of homeowners age 65 or older or disabled. Other taxing units enter 0. If your taxing unit adopted the tax ceiling provision in 2021 or a prior year for homeowners age 65 or older or disabled, use this step.16 $
21. 2022 total taxable value. Add Lines 18E and 19C. Subtract Line 20. 17 $
22. Total 2022 taxable value of properties in territory annexed after Jan. 1, 2021. Include both real and personal property. Enter the 2022 value of property in territory annexed. 18 $ 23. Total 2022 taxable value of new improvements and new personal property located in new improvements. New means the item was not on the appraisal roll in 2021. An improvement is a building, structure, fixture or fence erected on or affixed to land. New additions to exist-ing improvements may be included if the appraised value can be determined. New personal property in a new improvement must have been brought into the taxing unit after Jan. 1, 2021 and be located in a new improvement. New improvements do include property on which a tax abatement agreement has expired for 2022 19 $ 24. Total adjustments to the 2022 taxable value. Add Lines 22 and 23. $ 25. Adjusted 2022 taxable value. Subtract Line 24 from Line 21. $ 26. 2022 NNR tax rate. Divide Line 17 by Line 25 and multiply by $100. 20 $ /$100
27. COUNTIES ONLY. Add together the NNR tax rates for each type of tax the county levies. The total is the 2022 county NNR tax rate. 21 $ /$100
The voter-approval tax rate is the highest tax rate that a taxing unit may adopt without holding an election to seek voter approval of the rate. The voter-approval tax rate is split into two separate rates:
1. Maintenance and Operations (M&O) Tax Rate: The M&O portion is the tax rate that is needed to raise the same amount of taxes that the taxing unit levied in the prior year plus the applicable percentage allowed by law. This rate accounts for such things as salaries, utilities and day-to-day operations.
2. Debt Rate: The debt rate includes the debt service necessary to pay the taxing unit’s debt payments in the coming year. This rate accounts for principal and interest on bonds and other debt secured by property tax revenue. The voter-approval tax rate for a county is the sum of the voter-approval tax rates calculated for each type of tax the county levies. In most cases the voter-approval tax rate exceeds the no-new-revenue tax rate, but occasionally decreases in a taxing unit’s debt service will cause the NNR tax rate to be higher than the voter-approval tax rate.
Line 28. 2021 M&O tax rate. Enter the 2021 M&O tax rate. /$100 2021 taxable value, adjusted for actual and potential court-ordered adjustments. Enter the amount in Line 8 of the No-New-Revenue Tax Rate Worksheet.
13 Tex. Tax Code § 26.01(c) and (d)
14 Tex. Tax Code § 26.01(c)
15 Tex. Tax Code § 26.01(d)
16 Tex. Tax Code § 26.012(6)(B)
17 Tex. Tax Code § 26.012(6)
18 Tex. Tax Code § 26.012(17)
19 Tex. Tax Code § 26.012(17)
20 Tex. Tax Code § 26.04(c)
21 Tex. Tax Code § 26.04(d) 206,988,321 206,988,321 266,523,037 3,573,261,540 12,138,345 706,143,114 718,281,459 2,854,980,081 2,760,040,610
30. Total 2021 M&O levy. Multiply Line 28 by Line 29 and divide by $100 $
31.
Adjusted 2021 levy for calculating NNR M&O rate.
A. M&O taxes refunded for years preceding tax year 2021. Enter the amount of M&O taxes refunded in the preceding year for taxes before that year. Types of refunds include court decisions, Tax Code Section 25.25(b) and (c) corrections and Tax Code Section 31.11 payment errors. Do not include refunds for tax year 2021. This line applies only to tax years preceding tax year 2021. .............. + $
B. 2021 taxes in TIF. Enter the amount of taxes paid into the tax increment fund for a reinvestment zone as agreed by the taxing unit. If the taxing unit has no 2022 captured appraised value in Line 18D, enter 0. – $
C. 2021 transferred function. If discontinuing all of a department, function or activity and transferring it to another taxing unit by written contract, enter the amount spent by the taxing unit discontinuing the function in the 12 months preceding the month of this calculation. If the taxing unit did not operate this function for this 12-month period, use the amount spent in the last full fiscal year in which the taxing unit operated the function. The taxing unit discontinuing the function will subtract this amount in D below. The taxing unit receiving the function will add this amount in D below. Other taxing units enter 0. +/- $
D. 2021 M&O levy adjustments. Subtract B from A. For taxing unit with C, subtract if discontinuing function and add if receiving function. $
E. Add Line 30 to 31D. $
32. Adjusted 2022 taxable value. Enter the amount in Line 25 of the No-New-Revenue Tax Rate Worksheet. $
33. 2022 NNR M&O rate (unadjusted). Divide Line 31E by Line 32 and multiply by $100. $ /$100
34.
Rate adjustment for state criminal justice mandate. 23
A. 2022 state criminal justice mandate. Enter the amount spent by a county in the previous 12 months providing for the maintenance and operation cost of keeping inmates in county-paid facilities after they have been sentenced. Do not include any state reimbursement received by the county for the same purpose $
B. 2021 state criminal justice mandate. Enter the amount spent by a county in the 12 months prior to the previous 12 months providing for the maintenance and operation cost of keeping inmates in county-paid facilities after they have been sentenced. Do not include any state reimbursement received by the county for the same purpose. Enter zero if this is the first time the mandate applies. – $
35.
C. Subtract B from A and divide by Line 32 and multiply by $100. ........................................... $ /$100
D. Enter the rate calculated in C. If not applicable, enter 0. $ /$100
A. 2022 indigent health care expenditures. Enter the amount paid by a taxing unit providing for the maintenance and operation cost of providing indigent health care for the period beginning on July 1, 2021 and ending on June 30, 2022, less any state assistance received for the same purpose. $
B. 2021 indigent health care expenditures. Enter the amount paid by a taxing unit providing for the maintenance and operation cost of providing indigent health care for the period beginning on July 1, 2020 and ending on June 30, 2021, less any state assistance received for the same purpose................................................................................... $
Rate adjustment for indigent health care expenditures. 24 0 0 0 0 0.000000
C. Subtract B from A and divide by Line 32 and multiply by $100. $ /$100
D. Enter the rate calculated in C. If not applicable, enter 0. $ /$100
A. 2022 indigent defense compensation expenditures. Enter the amount paid by a county to provide appointed counsel for indigent individuals and fund the operations of a public defender's office under Article 26.044, Code of Criminal Procedure for the period beginning on July 1, 2021 and ending on June 30, 2022, less any state grants received by the county for the same purpose . . . . . . . . . . .
B. 2021 indigent defense compensation expenditures. Enter the amount paid by a county to provide appointed counsel for indigent individuals and fund the operations of a public defender's office under Article 26.044, Code of Criminal Procedure for the period beginning on July 1, 2020 and ending on June 30, 2021, less any state grants received by the county for the same purpose.
C. Subtract B from A and divide by Line 32 and multiply by $100.
D. Multiply B by 0.05 and divide by Line 32 and multiply by $100. $ $ $ /$100 $ /$100
E. Enter the lesser of C and D. If not applicable, enter 0. $ /$100
A. 2022 eligible county hospital expenditures. Enter the amount paid by the county or municipality to maintain and operate an eligible county hospital for the period beginning on July 1, 2021 and ending on June 30, 2022 $
B. 2021 eligible county hospital expenditures. Enter the amount paid by the county or municipality to maintain and operate an eligible county hospital for the period beginning on July 1, 2020 and ending on June 30, 2021 $
C. Subtract B from A and divide by Line 32 and multiply by $100. ........................................... $ /$100
D. Multiply B by 0.08 and divide by Line 32 and multiply by $100. $ /$100
E. Enter the lesser of C and D, if applicable. If not applicable, enter 0. $ /$100
38.
Rate adjustment for defunding municipality. This adjustment only applies to a municipality that is considered to be a defunding municipality for the current tax year under Chapter 109, Local Government Code. Chapter 109, Local Government Code only applies to municipalities with a population of more than 250,000 and includes a written determination by the Office of the Governor. See Tax Code 26.0444 for more information.
A. Amount appropriated for public safety in 2021. Enter the amount of money appropriated for public safety in the budget adopted by the municipality for the preceding fiscal year $
B. Expenditures for public safety in 2021. Enter the amount of money spent by the municipality for public safety during the preceding fiscal year $
C. Subtract B from A and divide by Line 32 and multiply by $100 ........................................... $ /$100
D. Enter the rate calculated in C. If not applicable, enter 0. $ /$100
39. Adjusted 2022 NNR M&O rate. Add Lines 33, 34D, 35D, 36E, and 37E. Subtract Line 38D. $ /$100
40.
Adjustment for 2021 sales tax specifically to reduce property values. Cities, counties and hospital districts that collected and spent additional sales tax on M&O expenses in 2021 should complete this line. These entities will deduct the sales tax gain rate for 2022 in Section 3. Other taxing units, enter zero.
A. Enter the amount of additional sales tax collected and spent on M&O expenses in 2021, if any. Counties must exclude any amount that was spent for economic development grants from the amount of sales tax spent $
B. Divide Line 40A by Line 32 and multiply by $100 ........................................................ $ /$100
C. Add Line 40B to Line 39. $ /$100
41. 2022 voter-approval M&O rate. Enter the rate as calculated by the appropriate scenario below. $ /$100
Special Taxing Unit. If the taxing unit qualifies as a special taxing unit, multiply Line 40C by 1.08. - orOther Taxing Unit. If the taxing unit does not qualify as a special taxing unit, multiply Line 40C by 1.035.
D41. Disaster Line 41 (D41): 2022 voter-approval M&O rate for taxing unit affected by disaster declaration. If the taxing unit is located in an area declared a disaster area and at least one person is granted an exemption under Tax Code Section 11.35 for property located in the taxing unit, the governing body may direct the person calculating the voter-approval tax rate to calculate in the manner provided for a special taxing unit. The taxing unit shall continue to calculate the voter-approval tax rate in this manner until the earlier of
1) the first year in which total taxable value on the certified appraisal roll exceeds the total taxable value of the tax year in which the disaster occurred, or the third tax year after the tax year in which the disaster occurred
If the taxing unit qualifies under this scenario, multiply Line 40C by 1.08. 27 If the taxing unit does not qualify, do not complete Disaster Line 41 (Line D41). $ /$100
42.
45.
A. Debt also includes contractual payments to other taxing units that have incurred debts on behalf of this taxing unit, if those debts meet the four conditions above. Include only amounts that will be paid from property tax revenue. Do not include appraisal district budget payments. If the governing body of a taxing unit authorized or agreed to authorize a bond, warrant, certificate of obligation, or other evidence of indebtedness on or after Sept. 1, 2022, verify if it meets the amended definition of debt before including it here. 28
Enter debt amount $
B. Subtract unencumbered fund amount used to reduce total debt.
C. Subtract certified amount spent from sales tax to reduce debt (enter zero if none)
D. Subtract amount paid from other resources
– $
– $
– $
E. Adjusted debt. Subtract B, C and D from A. $ Certified 2021 excess debt collections. Enter the amount certified by the collector. 29 $ 44. Adjusted 2022 debt. Subtract Line 43 from Line 42E. $
A. Enter the 2022 anticipated collection rate certified by the collector. 30 .................................... %
B. Enter the 2021 actual collection rate. %
Total 2022 debt to be paid with property taxes and additional sales tax revenue. Debt means the interest and principal that will be paid on debts that: (1) are paid by property taxes, (2) are secured by property taxes, (3) are scheduled for payment over a period longer than one year, and (4) are not classified in the taxing unit’s budget as M&O expenses. 2 anticipated collection rate. 0 0 10,498,759 1,003,677 9,495,082 100.00 101.40 101.67 106.46 101.40 9,363,986 3,573,261,540
C. Enter the 2020 actual collection rate. % Enter the 2019 actual collection rate. % If the anticipated collection rate in A is lower than actual collection rates in B, C and D, enter the lowest collection rate from B, C and D. If the anticipated rate in A is higher than at least one of the rates in the prior three years, enter the rate from A. Note that the rate can be greater than 100%. 31 % 2022 debt adjusted for collections. Divide Line 44 by Line 45E. $ 2022 total taxable value. Enter the amount on Line 21 of the No-New-Revenue Tax Rate Worksheet. 2022 debt rate. Line 46 by Line 47 and multiply by $100. /$100 202 voter-approval Lines 41 and /$100 Disaster Line 49 (D49): voter-approval tax rate taxing unit by disaster declaration. Complete this line if the taxing unit the voter-approval tax rate the manner provided for a special taxing unit on Line D41. Line D41 and 48. /$100
50. COUNTIES ONLY. Add together the voter-approval tax rates for each type of tax the county levies. The total is the 2022 county voter-approval tax rate. $ /$100
Cities, counties and hospital districts may levy a sales tax specifically to reduce property taxes. Local voters by election must approve imposing or abolishing the additional sales tax. If approved, the taxing unit must reduce its NNR and voter-approval tax rates to offset the expected sales tax revenue.
This section should only be completed by a county, city or hospital district that is required to adjust its NNR tax rate and/or voter-approval tax rate because it adopted the additional sales tax.
51. Taxable Sales. For taxing units that adopted the sales tax in November 2021 or May 2022, enter the Comptroller’s estimate of taxable sales for the previous four quarters. 32 Estimates of taxable sales may be obtained through the Comptroller’s Allocation Historical Summary webpage. Taxing units that adopted the sales tax before November 2021, enter 0. $
52. Estimated sales tax revenue. Counties exclude any amount that is or will be spent for economic development grants from the amount of esti mated sales tax revenue. 33 $
Taxing units that adopted the sales tax in November 2021 or in May 2022. Multiply the amount on Line 51 by the sales tax rate (.01, .005 or .0025, as applicable) and multiply the result by .95. 34 - or -
Taxing units that adopted the sales tax before November 2021. Enter the sales tax revenue for the previous four quarters. Do not multiply by .95.
53. 2022 total taxable value. Enter the amount from Line 21 of the No-New-Revenue Tax Rate Worksheet. $ 54. Sales tax adjustment rate. Divide Line 52 by Line 53 and multiply by $100. $ /$100
55. 2022 NNR tax rate, unadjusted for sales tax.35 Enter the rate from Line 26 or 27, as applicable, on the No-New-Revenue Tax Rate Worksheet $ /$100
56. 2022 NNR tax rate, adjusted for sales tax. Taxing units that adopted the sales tax in November 2021 or in May 2022. Subtract Line 54 from Line 55. Skip to Line 57 if you adopted the additional sales tax before November 2021 $ /$100
A taxing unit may raise its rate for M&O funds used to pay for a facility, device or method for the control of air, water or land pollution. This includes any land, structure, building, installation, excavation, machinery, equipment or device that is used, constructed, acquired or installed wholly or partly to meet or exceed pollution control requirements. The taxing unit’s expenses are those necessary to meet the requirements of a permit issued by the Texas Commission on Environmental Quality (TCEQ). The taxing unit must provide the tax assessor with a copy of the TCEQ letter of determination that states the portion of the cost of the installation for pollution control. This section should only be completed by a taxing unit that uses M&O funds to pay for a facility, device or method for the control of air, water or land pollution.
57. 2022 voter-approval tax rate, unadjusted for sales tax.36 Enter the rate from Line 49, Line D49 (disaster) or Line 50 (counties) as applicable, of the Voter-Approval Tax Rate Worksheet $ /$100 58. 2022 voter-approval tax rate, adjusted for sales tax. Subtract Line 54 from Line 57. $ /$100 Voter-Approval Rate Adjustment Pollution Certified expenses from the Texas Commission on Environmental Quality (TCEQ). Enter the amount certified in the determination letter from TCEQ. 37 The taxing unit shall provide its tax assessor-collector with a copy of the letter. 38 2022 total taxable value. Enter the amount from Line 21 of the No-New-Revenue Tax Rate Worksheet. Additional rate for pollution control. Divide Line 59 by Line 60 and multiply by $100. $ /$100 62. 2022 voter-approval tax rate, adjusted for pollution control. Add Line 61 to one of the following lines (as applicable): Line 49, Line D49 (disaster), Line 50 (counties) or Line 58 (taxing units with the additional sales tax). $ /$100
32 Tex. Tax Code § 26.041(d)
33 Tex. Tax Code § 26.041(i)
34 Tex. Tax Code § 26.041(d)
35 Tex. Tax Code § 26.04(c)
36 Tex. Tax Code § 26.04(c) Tex. Tax Code § 26.045(d) Tex. Tax Code § 26.045(i)
The unused increment rate is the rate equal to the difference between the adopted tax rate and voter-approval tax rate before the unused increment rate for the prior three years. 39 In a year where a taxing unit adopts a rate by applying any portion of the unused increment rate, the unused increment rate for that year would be zero. The difference between the adopted tax rate and voter-approval tax rate is considered zero in the following scenarios:
•a tax year before 2020; 40 •a tax year in which the municipality is a defunding municipality, as defined by Tax Code Section 26.0501(a); 41 or •after Jan. 1, 2022, a tax year in which the comptroller determines that the county implemented a budget reduction or reallocation described by Local Government Code Section 120.002(a) without the required voter approval. 42
This section should only be completed by a taxing unit that does not meet the definition of a special taxing unit. 43
The de minimis rate is the rate equal to the sum of the no-new-revenue maintenance and operations rate, the rate that will raise $500,000, and the current debt rate for a taxing unit. 44
This section should only be completed by a taxing unit that is a municipality of less than 30,000 or a taxing unit that does not meet the definition of a special taxing unit. 45
In the tax year after the end of the disaster calculation time period detailed in Tax Code Section 26.042(a), a taxing unit that calculated its voter-approval tax rate in the manner provided for a special taxing unit due to a disaster must calculate its emergency revenue rate and reduce its voter-approval tax rate for that year.46
Similarly, if a taxing unit adopted a tax rate that exceeded its voter-approval tax rate, calculated normally, without holding an election to respond to a disaster, as allowed by Tax Code Section 26.042(d), in the prior year, it must also reduce its voter-approval tax rate for the current tax year. 47
This section will apply to a taxing unit other than a special taxing unit that:
• directed the designated officer or employee to calculate the voter-approval tax rate of the taxing unit in the manner provided for a special taxing unit in the prior year; and
• the current year is the first tax year in which the total taxable value of property taxable by the taxing unit as shown on the appraisal roll for the taxing unit submitted by the assessor for the taxing unit to the governing body exceeds the total taxable value of property taxable by the taxing unit on January 1 of the tax year in which the disaster occurred or the disaster occurred four years ago.
39 Tex. Tax Code § 26.013(a)
40 Tex. Tax Code § 26.013(c)
41 Tex. Tax Code §§ 26.0501(a) and (c)
42 Tex. Local Gov’t Code § 120.007(d), effective Jan. 1, 2022
43 Tex. Tax Code § 26.063(a)(1)
44 Tex. Tax Code § 26.012(8-a)
45 Tex. Tax Code § 26.063(a)(1)
46 Tex. Tax Code §26.042(b) Tex. Tax Code §26.042(f)
This section will apply to a taxing unit in a disaster area that adopted a tax rate greater than its voter-approval tax rate without holding an election in the prior year.
Note: This section does not apply if a taxing unit is continuing to calculate its voter-approval tax rate in the manner provided for a special taxing unit because it is still within the disaster calculation time period detailed in Tax Code Section 26.042(a) because it has not met the conditions in Tax Code Section 26.042(a)(1) or (2).
73. 2021 adopted tax rate. Enter the rate in Line 4 of the No-New-Revenue Tax Rate Worksheet. $ /$100
If a disaster occurred in 2021 and the taxing unit calculated its 2021 voter-approval tax rate using a multiplier of 1.08 on Disaster Line 41 (D41) of the 2021 worksheet due to a disaster, enter the 2021 voter-approval tax rate as calculated using a multiplier of 1.035 from Line 49.
- or -
74. $ /$100 Adjusted 2021 voter-approval tax rate. Use the taxing unit’s Tax Rate Calculation Worksheets from the prior year(s) to complete this line.
If a disaster occurred prior to 2021 for which the taxing unit continued to calculate its voter-approval tax rate using a multiplier of 1.08 on Disaster Line 41 (D41) in 2021, complete the separate Adjusted Voter-Approval Tax Rate for Taxing Units in Disaster Area Calculation Worksheet to recalculate the voter-approval tax rate the taxing unit would have calculated in 2021 if it had generated revenue based on an adopted tax rate using a multiplier of 1.035 in the year(s) following the disaster. 48 Enter the final adjusted 2021 voter-approval tax rate from the worksheet.

- or -
If the taxing unit adopted a tax rate above the 2021 voter-approval tax rate without calculating a disaster tax rate or holding an election due to a disaster, no recalculation is necessary. Enter the voter-approval tax rate from the prior year’s worksheet.
75. Increase in 2021 tax rate due to disaster. Subtract Line 74 from Line 73. $ /$100
76. Adjusted 2021 taxable value. Enter the amount in Line 14 of the No-New-Revenue Tax Rate Worksheet. $
77. Emergency revenue. Multiply Line 75 by Line 76 and divide by $100. $
78. Adjusted 2022 taxable value. Enter the amount in Line 25 of the No-New-Revenue Tax Rate Worksheet. $
79. Emergency revenue rate. Divide Line 77 by Line 78 and multiply by $100. 49 $ /$100
80. 2022 voter-approval tax rate, adjusted for emergency revenue. Subtract Line 79 from one of the following lines (as applicable): Line 49, Line D49 (disaster), Line 50 (counties), Line 58 (taxing units with the additional sales tax), Line 62 (taxing units with pollution control) or Line 67 (taxing units with the unused increment rate). $ /$100
Indicate the applicable total tax rates as calculated above.
No-new-revenue tax rate.
As applicable, enter the 2022 NNR tax rate from: Line 26, Line 27 (counties), or Line 56 (adjusted for sales tax). Indicate the line number used: ______
Votover-appral tax rate
As applicable, enter the 2022 voter-approval tax rate from: Line 49, Line D49 (disaster), Line 50 (counties), Line 58 (adjusted for sales tax), Line 62 (adjusted for pollution control), Line 67 (adjusted for unused increment), or Line 80 (adjusted for emergency revenue). Indicate the line number used: ______
$ /$100
$ /$100
De minimis rate. $ /$100
If applicable, enter the 2022 de minimis rate from Line 72.
Enter the name of the person preparing the tax rate as authorized by the governing body of the taxing unit. By signing below, you certify that you are the designated officer or employee of the taxing unit and have accurately calculated the tax rates using values that are the same as the values shown in the taxing unit’s certified appraisal roll or certified estimate of taxable value, in accordance with requirements in Tax Code. 50 0.548349 0.634759 0.636148 2,422,426,272 0.645000 15,624,649 2,854,980,081 0.634759 26 49
ORDINANCENO. 2022-112
AN ORDINANCE OF THE CITY OF CELINA, TEXAS ADOPTING AND APPROVING THE BUDGET FOR THE FISCAL YEAR 2022-2023, BEGINNING OCTOBER 1, 2022, AND ENDING SEPTEMBER 30, 2023; IN ACCORDANCE WITH EXISTING STATUTORY REQUIREMENTS; REPEALING ALL CONFLICTING ORDINANCES; CONTAINING A SEVERABILITY CLAUSE; AND PROVIDING AN EFFECTIVE DATE.
WHEREAS, the City Manager and staff have prepared and filed with the City Secretary a proposed budget for the operation of the City during Fiscal Year 2022-2023; and
WHEREAS, pursuant to the laws of the State of Texas and the Home Rule Charter of the City of Celina, Texas (“Celina”), the City Manager has submitted to the Mayor and Council a proposed budget of the revenues and expenditures for conducting the affairs of said city and providing a complete financial plan for Fiscal Year beginning October 1, 2022, and ending September 30, 2023; and
WHEREAS, the City Council on September 13, 2022, conducted a public hearing to receive input from citizens of the City concerning the content of the budget, and for which notices were duly posed in the Celina Record; and
WHEREAS, the City has acknowledged that this budget will raise more total property taxes than last year’s budget by $6,954,614, or 44.22%, and of that amount, $4,559,356 is tax revenue to be raised from new property added to the tax roll this year; and
WHEREAS, the City Council having considered the proposed budget at length, and having provided input in its preparation, has determined that the proposed budget and the revenues and expenditures contained therein are in the best interest of the City and, therefore, the Council desires to approve and adopt the budget by formal action.
NOW, THEREFORE, BE IT ORDAINED BY THE CITY COUNCIL OF THE CITY OF CELINA, TEXAS, THAT:
SECTION 1. The proposed budget for the fiscal year beginning October 1, 2022, and ending September 30, 2023, as submitted to the City Council by the City Manager, which budget is attached hereto as Exhibit “A” for all purposes is hereby approved and adopted as the City’s budget of all revenue and expenditures of the City of Celina, Texas for Fiscal Year 2022-2023; and
SECTION 2. The sum of one hundred forty-eight million, six hundred sixty five thousand, seven hundred thirty nine US Dollars ($148,665,739) is hereby appropriated for the City’s FY2022-2023 Budget. Further, these funds are for payment of operating, capital, and debt service expenses associated with the operation and administration of the City, according to the various purposes and intents described in the FY2022-2023 budget document.
SECTION 3. Should any paragraph, sentence , subdivision, clause , phrase, or section of this Ordinance be adjudged or held to be unconstitutional, illegal, or invalid , the same shall not affect the validity of this Ordinance, as a whole or any part or provision thereof, other than the part or parts adjudged to be invalid, illegal, or unconstitutional.
SECTION 4. This Ordinance shall be in full force and effect from and after its adoption by the City Council, pursuant to applicable State and Local laws and the City of Celina Home Rule Charter.
SECTION 5. All other ordinances and Code provisions that are in conflict herewith are hereby repealed , but only to the extent of any such conflict or inconsistency.
SECTION 6. The City Council of the City of Celina, Texas met in a public meeting on September 13, 2022, and adopted this ordinance with a majority vote as follows:
Mayor Sean Terry Mayor Pro Tern Jay Pierce
Deputy Mayor Pro Tern Wendie Wigginton
Council Member Philip Ferguson Council Member Tony Griggs
Council Member Andy Hopkins Council Member Mindy Koehne
YEA NAY ABSTAIN ABSE T
YEA Z AY =ABSTAIN=ABSENT =
YEA L NA y ABSTAIN ABSENT __
YEA 7 NA Y _A BSTAIN __ ABSENT __
YEA L NAY ABSTAIN ABSENT
YEA Z NAY =A BSTAI N=A BSENT = YEA L, AY __ ABSTAIN __ ABSENT __
ADOPTED on the 13 th day of September 2022. Field, City

ORDINANCENO. 2022-113
ANORDINANCEOFTHECITYOFCELINA,TEXAS,FIXINGANDLEVYING MUNICIPAL AD VALOREM TAXES FOR THE FISCAL YEAR BEGINNING OCTOBER 1, 2022 AND ENDING SEPTEMBER 30, 2023; DIRECTING THE ASSESSMENT THEREOF TO PROVIDE REVENUES FOR THE PAYMENT OF CURRENT OPERATION AND MAINTENANCE EXPENSES AND INDEBTEDNESS OF THE CITY; PROVIDING FOR A LIEN ON ALL REAL AND PERSONAL PROPERTY TO SECURE PAYMENT OF TAXES DUE THEREON; PROVIDING FOR COLLECTION BY THE COLLIN AND DENTON COUNTY TAX ASSESSOR/COLLECTOR; CONTAINING A SEVERABILITY CLAUSE; REPEALING ALL ORDINANCES AND PARTS THEREOF IN CONFLICT HEREWITH; AND PROVIDING AN EFFECTIVE DATE.
WHEREAS, it is necessary to levy such an ad valorem tax at a given rate to generate revenues sufficient to meet the projected expenditures of the City for FY 2022-2023; and
WHEREAS, the City Council of the City of Celina, Texas (the “City”) has approved on the 13th day of September, 2022, the budget for the fiscal year beginning October 1, 2022 and ending September 30, 2023 (FY 2022-2023); and
WHEREAS, the aforesaid Ordinance anticipates and requires the levy of an ad valorem tax on all taxable property in the City of Celina; and
WHEREAS, the Chief Appraiser of Collin County Tax Appraisal District has prepared and certified the appraisal roll for the City of Celina, Texas, that roll being that portion of the approved appraisal roll of both Collin County Tax Appraisal District and Denton County Tax Appraisal District which lists property taxable by the City of Celina, Texas; and
WHEREAS, all statutory and constitutional requirements concerning the levying and assessing of ad valorem taxes have been completed in due and correct time, including proving notice of and conducting a public hearing regarding the ad valorem tax levied hereby; and
Section 1. There is hereby levied for the FY 2022-2023 upon all real property situated within the corporate limits of the City of Celina, Texas, and upon all personal property which was owned within the corporate limits of the City of Celina, Texas, on January 1, 2022, except so much thereof as may be exempt by the Constitution or laws of the State of Texas, or this ordinance, a tax of $0.634759 on each One Hundred Dollars ($100.00) of assessed valuation on all taxable property. The tax rate consists of two components each of which is hereby approved separately. The total tax herein so levied shall consist and be comprised of the following components:
a) An ad valorem tax rate of $0.372702 on each One Hundred Dollars ($100.00) assessed valuation of all taxable property is hereby levied for the purpose of defraying the maintenance and operation expenses of the City of Celina, Texas for the fiscal year ending September 30, 2023; and
b) An ad valorem tax rate of $0.262057 on each One Hundred Dollars ($100.00) assessed valuation of all taxable property is hereby levied for the purpose of the payment of principal and interest of the valid bonded indebtedness, and related fees of the City of Celina, Texas for the fiscal year ending September 30, 2023; and
Section 2. The City of Celina shall have lien on all taxable property located in the City of Celina to secure the payment of taxes, penalties, and interest, and all costs of collection, assess and levied hereby.
Section 3. Taxes shall be payable in full at the office of the Collin County Tax Assessor/Collector, 2300 Bloomdale Road, Suite 2324, McKinney, TX 75071 and the Denton County Tax Assessor/Collector, 1505 E. McKinney, Denton, TX 76209-4525. The City shall have available all rights and remedies provided by law for the enforcement of the collection of taxes levied under this Ordinance.
Section 4. The tax roll presented to the City Council, together with any supplements thereto, are hereby accepted and approved.
Section 5. Should any paragraph, sentence, provision, clause, phrase or section of this Ordinance be adjudged or held to be unconstitutional, illegal, or invalid, the same shall not affect the validity of this Ordinance, as a whole or any part or provision thereof, other than the part or parts adjudged to be invalid, illegal, or unconstitutional.
Section 6. This ordinance shall be in full force and effect from and after its adoption by the City Council and publication of its caption as the law and the Home Rule Charter of the City of Celina provide in such cases.
Section 7. All other ordinances and Code provisions in conflict herewith are hereby repealed, but only to the extent of any such conflict or inconsistency and all other provisions of the City of Celina Code not in conflict herewith shall remain in full force and effect.
Section 8. The repeal of any ordinance or parts thereof by the enactment of this Ordinance, shall not be construed as abandoning any action now pending under or by virtue of such ordinance; not shall it have the effect of discontinuing, abating, modifying or altering nay penalty accruing or to accrue, nor as affecting any rights of the city under any section or provision of any ordinances at the time of passage of this Ordinance.
Section 9. The City Council of the City of Celina, Texas met in a public meeting on September 13, 2022, and adopted this ordinance with a majority vote as follows:
Mayor Sean Terry
Mayor Pro Tern Jay Pierce
Deputy Mayor Pro Tern Wendie Wigginton
Council Member Philip Ferguson
Council Member Tony Griggs
Council Member Andy Hopkins
Council Member Mindy Koehne
YEA NAY ABSTAIN ABSENT
YEA / NAY ABSTAIN ABSENT
YEA AY ABSTAIN ABSENT
YEA / NAY ABSTAIN ABSENT
YEA L NA y - ABSTAIN ABSENT
YEA / NAY ABSTAIN ABSENT
YEA .LN AY = ABSTAIN = ABSE T

THIS TAX RATE WILL RAISE MORE TAXES FOR MAINTENANCE AND OPERATIONS THAN LAST YEAR'S TAX RATE. THE TAX RATE WILL EFFECTIVELY BE RAISED BY 3.50% AND WILL RAISE TAXES FOR MAINTNENACE AND OPERATIONS ON A $100,000 HOME BY APPROXIMATELY -$56.69.
on the 13 th day of September 2022.
ATTEST: Lauren Field, City Secretary