


John E. Chapman
Chief Executive Officer
Chief Investment Strategist
Tyler J. Beachler
Managing Partner, Portfolio Management
Deputy Chief Investment Strategist


Clearwater Capital Partners
About Clearwater
Clearwater Capital Partners was established by John Chapman in 2006 in response to the prevalent shortcomings within the financial industry, including conflicts of interest, non-disclosure of material facts, and broken promises. Recognizing the critical need for genuine advice on real issues, our firm set out to redefine industry standards. Investors deserve far more than the fragmented sales pitches often delivered by Wall Street. At Clearwater, delivering honest and competent advice guides our every action. The principles and insights that shaped our business model from the outset continue to be fundamental to our operations. Our firm has grown primarily through referrals, a testament to our enduring client loyalty. Today, we are a wellestablished and thriving firm.
Our teamʼs expertise spans with designations that include: CFP®, CTFA®, CDFA®, AWMA®, CRPS®, CIMA®, AIFA®, QKA®, CPA®.
Board of Directors
John E. Chapman
Al R. Krause
John W. Sleeting
Jeffrey P. DeHaan
Heather J. Larson
Joesph Kutcha
Operating Committee
John E. Chapman
John W. Sleeting
Jeffrey P. DeHaan
James F. Chapman
Tyler J. Beachler
Katie Berganske-Frank
Danuta Garb
Al R. Krause
Wealth Advisors
John E. Chapman
John W. Sleeting
Jeffrey P. DeHaan
Greg W. Davis
James F. Chapman
Melissa Dailey-Newman
Jacob M. Clark
Valerie N. Hogan
Institutional Advisory Services
Kevin G. Carani
John Ellis
Carter R. King
Portfolio Management
Tyler J. Beachler
Rocky A. Byrd
Noah Mule
Advanced Planning
Kevin J. Nolte
Conor A. Durkin
Global Strategies
Hunter Sims
Operations Specialists
Ty D. Sampson
Andrea L. Patterson
Braden C. Maher
Phil M. Richardson
Brand and Marketing
Katie L. Berganske-Frank
Hayley E. Holmes
Human Resources and Accounting
Al R. Krause
Danuta Garb
Erica Rangel
Client Experience
Katie L. Berganske-Frank
Liza D. Alexanian
Hayley E. Holmes
Compliance, IT, & Risk Management
Rocky A. Byrd
James F. Chapman
Ty D. Sampson
Jeffrey P. DeHaan
Clearwater Capital Partners
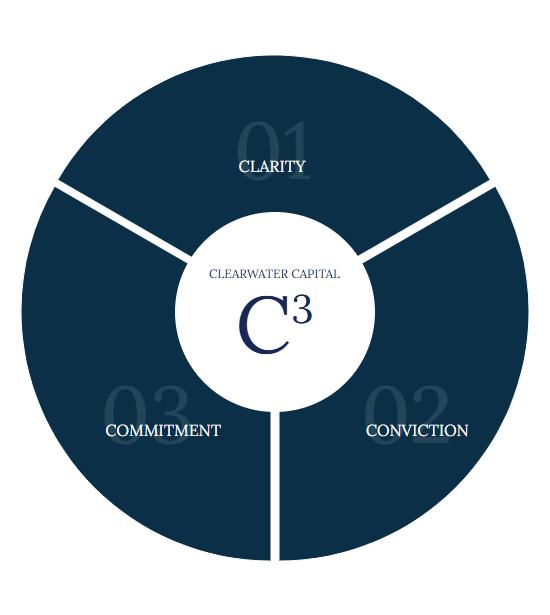
Clearwater Capital C3
Successful wealth management is the product of clear thinking, hard work, and consistent follow-through. At Clearwater Capital we have developed a rigorous framework for decision-making that we call C3. This disciplined process guides successful individuals and families through the prioritization of long-term objectives, the evaluation of high impact tactics, and the implementation.
Identify / Prioritize Objectives
Establish Assumptions
Collect / Organize Data
Model and Test Scenarios
Interpret Findings
Establish Path Forward
Establish Action Plan
Implement
Monitor / Maintain
The title of this year’s full Outlook 2025 report from Clearwater Capital Partners was “A Complicated Path Forward”. As investors pass this year’s halfway mark, it is natural to reflect on a turbulent first half as attention now turns to how best to navigate the back half of the year. At the beginning of the year, we observed:
“Predicting market outcomes over the near-term is an impossible proposition, especially in periods of dramatic change such as the one we are currently in. The best we can do is o�er our view of current conditions and lay out various scenarios that appear to us as more likely than not.”
To say that it has been a turbulent year so far for the capital markets would be an understatement. Trade Tari� turmoil, conflicting data reports, AI- driven volatility, dramatic geopolitical developments, and the on -again, o�-again forward movement of the President’s Big Beautiful Bill have conspired to keep investors guessing.
We correctly forecasted an uptick in market volatility and a market correct ion of 10% or more. This expectation came, and went, quickly as President Trump announced – and then repeatedly delayed – aggressive tari� policy with global trading partners.
Even as conditions appear to be calming, critical questions linger. Trade negotiations are ongoing, wars in Europe and the Middle East persist, corporate earnings show resiliency, but equity markets trade at record highs, and valuations are elevated. The Fed has been reluctant to cut interest rates even as inflation data has come in much better than expected for four consecutive months.
For much of the first half of 2025, soft economic data (confidence surveys and sentiment indicators) flashed red even as hard data (labor reports, durable goods orders, and industrial production) remained stable and even improved modestly.
As the major headlines of any given day swing back and forth between optimism and fear, investors are left trying to navigate an uncertain future with the nagging question: Are the storms passing , or is this merely the eye of a hurricane?
We originally anticipated that this would be a “transitional” year for the economy and the markets. What we may have missed in our January report was how “transformational ” this year would turn out to be. This said, we have maintained the belief that investors should remain constructive in 2025 while being especially attentive to the unique risks present in our economy and around the globe.
From our January report, we concluded:
“We are powerless to determine the circumstances that will occur in our lives, but we are very much in a position to decide how we will act in response to them.
The economy and financial markets are inherently cyclical, with periods of growth and contraction alternating over time. The process of building and expanding wealth is an exhilarating challenge, but it's important to recognize that the path forward is often asymmetrical, volatile, and frustrating.”
With several indicators currently pointing to slowing economic activity (consumer spending, construction spending, housing , and auto sales), we continue to believe a mild recession is still possible in 2025.
In this mid-year update, we will review a wide range of key economic metrics, important legislative developments, and the geopolitical landscape to inform our expectations and strategies for the second half of the year.
As always, we wish to express our gratitude for your continued confidence in our abilities to help you advance towards achieving your most important wealth goals.
John E. Chapman
Tyler J. Beachler
Third Quarter 2025
The primary driver of market volatility thus far in 2025 has revolved around President Trump’s global trade policies and, specifically, his intentions for using tari�s as his primary point of leverage in trade negotiations with foreign countries around the world . The nature and magnitude of tari�s announced on April 2 by President Trump triggered a market correction that came within a single percentage point of bear market territory.
As proclaimed by the President, the day of the announcement (dubbed Liberation Day) marked a new era of tari� policy intended to make trade fairer to U.S. interests and to close various loopholes through which some of our trading partners have been taking advantage of the U.S. Through the International Emergency Economic Powers Act (IEEPA), the trade policy imposed a 10% baseline tari� on nearly all imports but also enacted much greater country -specific tari�s that targeted major trading partners with whom the US has significant trade deficits.
After sharp market declines, President Trump issued a 90- day suspension on April 9, reducing most new tari�s to a flat 10% instead of the higher rates originally announced. This move was justified as a gesture to trading partners, showing “sincere intentions” to negotiate on trade issues. As the July 9 expiration of the suspension approached, President Trump extended the lower 10% tari� rate for an additional three weeks, pushing the deadline to August 1, 2025 .
Meanwhile, the President has set di�erent rates for specific countries, sometimes raising or lowering them from the initial threats. Other threatened tari�s were rescinded or further delayed, such as with Colombia and several African nations, reflecting ongoing negotiations or shifting policy priorities.
In addition to country-specific news, President Trump announced sector-specific tari�s as he confirmed a new 50% copper tari� to start August 1, matching steel and aluminum. Not only that, but the President is also threatening to impose a 200% tari� on pharmaceuticals very soon and then suggested that the levies would not go into e�ect immediately.
Trump’s approach to higher tari�s in 2025 has involved a pattern of announcing aggressive increases, then delaying or moderating them.
Not only is there still uncertainty about whether we will get tari� deals before August 1 or what those tari� rates will be, but there is a big overhang on the judicial oversight of these tari�s. On May 28, 2025, the U.S. Court of International Trade (CIT) ruled that President Trump overstepped his authority by imposing some of these broad tari�s under the IEEPA.
If the CIT ruling is upheld, the average tari� rates would fall back below 10% . However, the administration has appealed this ruling, and the U.S. Court of Appeals granted that the tari�s remain in e�ect while the appeal is pending. Currently, oral arguments are scheduled for July 31 ; however, all of this may ultimately land with the Supreme Court.
Amidst the ongoing tari� uncertainty, the Federal government is collecting record levels of revenue from tari�s. The U.S. Department of the Treasury just reported that the government received $27 billion in June, on top of the $22 billion received in May and $16 billion in April (Bloomberg). U.S. Treasury Secretary Scott Bessent believes that U.S. tari� revenue could reach $300 billion in 2025.
Over the next decade, the imposed and scheduled tari�s could raise between $2.0 trillion and $5.2 trillion in revenue, depending on the final scope and permanence of the tari�s (Penn Wharton Budget Model).
Who is paying these tari�s? With the data we have so far, it appears that foreign exporters are not fully absorbing the cost of the higher tari�s. Data from a Harvard Business School study tracking over 330,000 product listings at major U.S. retailers found that prices on imported goods rose by about 3% between the first wave of tari�s in early March and the end of June 2025.
Recent estimates suggest that a broad 25% tari� could raise prices for investment goods by about 9.5% and for consumption goods by about 2.2% in the near term. For core inflation measures like the PCE index, new tari�s could add at least 0.5 percentage p oints, and potentially more under extreme scenarios (Boston Federal Reserve Bank).
It should be noted that several prominent economists, including Art La�er argue that tari�s are fundamentally not inflationary and that those advancing inflationary concerns simply do not understand the concept of Learner’s Synergy Theory when it comes to complex systems having multiple interdependent factors.
Domestic goods that compete with imports also saw price increases, though to a lesser extent (about 2%). The study also noted that while the price increases on Chinese goods were the largest, they were still far below the tari� rates themselves, which ranged from 10% to 145% during this period.
While some suppliers and retailers initially absorbed part of the tari� costs by reducing their margins, the majority of companies have passed at least some of the higher costs on to consumers. Surveys show that 76% of Texas manufacturers planned to pass tari� -related costs to consumers, and two -thirds of executives in a national survey said they might have to do the same (CBS News).
Tari�s are a tax, and, like any increase in taxes, they create headwinds to growth and/or profit. These tari�s represent a one-time adjustment to the prices of imported goods. Accordingly, we do not believe that tari�s alone would cause a sustained inflationary spiral. For a more sustainable inflation impact, we would look to the U.S. M2 money supply, which has grown only 4% over the year, which is well below the long-term average (see more on the topic of Inflation below).
Tari�s and U.S. trade policy are critically important to Wall Street and investor expectations because they directly impact corporate earnings, market volatility, and overall economic growththe fundamental drivers of stock prices.
Tari�s increase the cost of imported goods, which can squeeze profit margins for U.S. companies, especially those reliant on global supply chains. While companies may try to pass some of these costs onto consumers, not all can do so fully, leading to reduced earnings. For example, Goldman Sachs estimates that every five-percentage-point increase in the U.S. tari� rate could reduce S&P 500 earnings per share by roughly 1-2%.
Tari�s can slow global economic growth by disrupting trade flows and supply chains. Retaliatory measures from other countries can further hurt U.S. exporters. This global drag can weigh on multinational company earnings and investor sentiment.
Struggling to fully anticipate whether tari�s will be implemented, increased, or rolled back creates volatility in financial markets. This uncertainty makes it harder for investors to forecast corporate profits and economic conditions, prompting risk - o� sentiment and sometimes triggering sharp
sello�s in equities and other risk assets. Conversely, markets rallied sharply when tari� delays were announced.
Investors have struggled to make sense of it all and have been scrambling to identify who the winners and losers might be as the often - contradictory messaging swings back and forth.
Investors and businesses find it di�icult to plan, as the e�ective dates and a�ected countries change frequently, leading to a “wait -and-see” approach and postponement of major investment decisions. This uncertainty has been especially disruptive for manufacturers, who report that price volatility and unclear trade rules are causing customers to delay capital expenditure.
When it comes to equity prices and investor sentiment, markets are currently trading at or near alltime highs. This could indicate that investors have come to the conclusion that much of the initial concern over tari�s was unwarranted and that the final impact from the trade turmoil could be nowhere near what was originally feared . As Bob Doll recently intimated, investors are trying very hard to get comfortable with being uncomfortable.
On this point, we can only hope this expectation proves accurate, as the market is certainly not pricing in the possibility of future surprises.
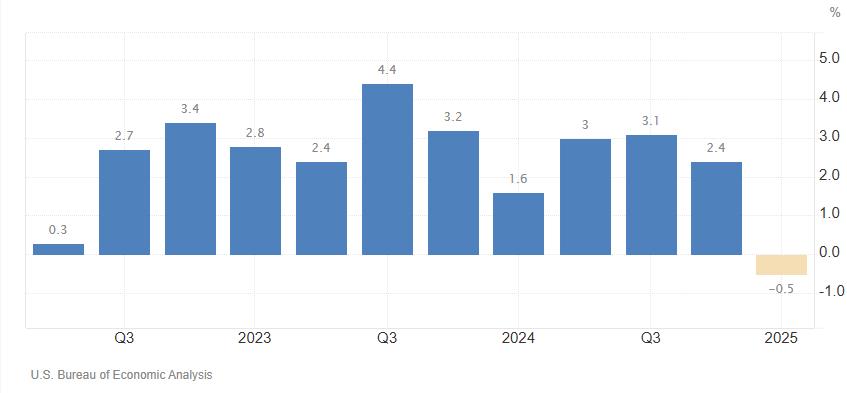
The U.S. economy contracted at an annualized rate of 0.5% in Q1 2025, a sharper decline than the second estimate of a 0.2% drop and the first quarterly contraction in three years. The weaker GDP figure was largely driven by significant downward revisions to consumer spending and exports. Consumer spending rose just 0.5%, the slowest pace since the sharp declines of 2020 , down from 1.2% in the previous estimate.
The announcement of President Trump’s tari� policies in April has created a number of distortions and aberrations in some economic indicators. Sometimes, firms increase imports to build inventories (e.g., ahead of expected tari�s). This can temporarily boost imports and inventories, but if it leads to reduced future domestic production or investment, GDP may eventually fall, not because of the imports themselves, but due to lower domestic activity.
Economists attribute the weak first- quarter GDP numbers primarily to a combination of trade disruptions from new tari�s, a sharp surge in imports, and a slowdown in consumer spending . The annualized GDP contraction marks the first negative quarter in several years and is viewed as a significant shift from the previous period’s growth .
We believe that a single quarter’s dip into contraction territory is not itself conclusive of a pending recession, especially given the unique fact pattern of the current administration’s e�orts to reform global trade with aggressive tari� policies. We would expect the second quarter numbers to rebound into positive territory as the trade distortions reverse the front-running activity of the first quarter.
There is plenty of room for debate over whether the weak Q1 GDP was a tari�- driven anomaly or if continued tari�s and weak consumer spending will lead to stagnation. Looking into the back half of the year, we see several indicators that suggest the economy could continue to slow, and the possibility of a mild recession cannot be ruled out, even as it appears somewhat less likely than was believed only three or four months ago.
Inflation
Macro data reports on inflation came in below expectations for the fourth consecutive month in May, rising only 0.1%. This trend would suggest that the link between tari�s and inflation may have been overestimated.
Brian Wesbury (First Trust) observes that “tari�s can raise prices for the tari�ed items, but they leave less money left over for other goods and services. Tari�s shu�le the deckchairs on the inflation ship, not how high or low the ship sits in the water.”
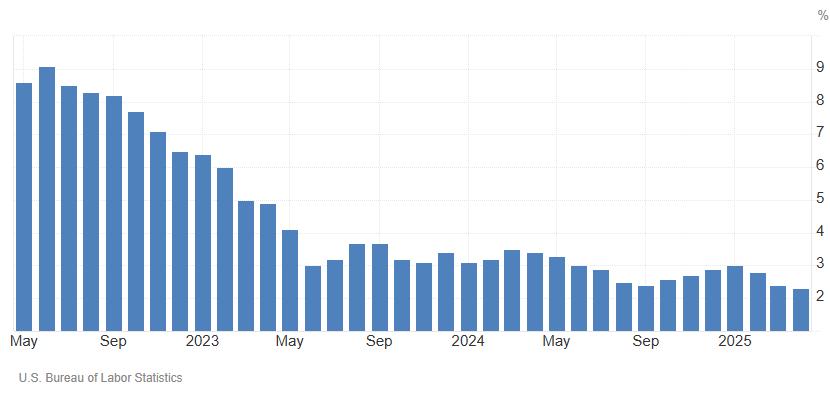
“Core” prices, which strip out food and energy, rose 0.1% in May versus a consensus expected +0.3%. Although core inflation has been much harder to subdue than overall inflation and is still up 2.8% in the last twelve months, it has finally started follow ing suit, up 1.7% annually in the last three months.
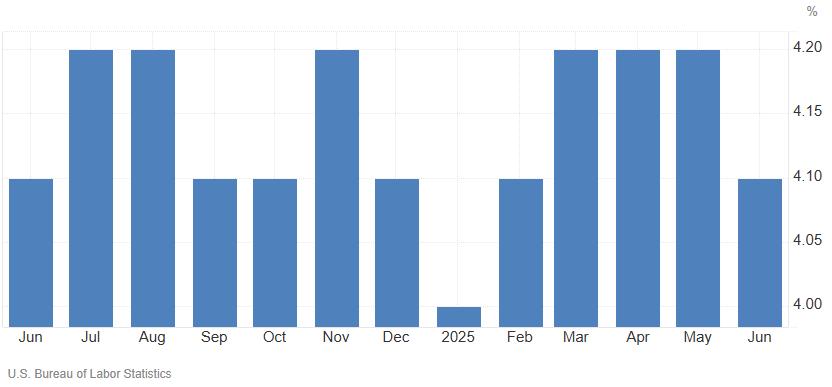
The May 2025 U.S. employment report, from the U.S. Bureau of Labor Statistics, showed that the labor market continued to grow but at a slower pace Non-farm payrolls increased by 139,000, slightly above most economists’ expectations but below the previous month’s revised gain of 147,000.
The unemployment rate held steady at 4.2%, unchanged from April. The rate has held within a narrow 4.0%–4.2% band since May 2024, signaling broad labor market stability.
Even as the headline numbers suggest “labor market stability”, the May 2025 report o�ered mixed signals to investors attempting to gauge the overall health of the U.S. Economy. The May report showed that payrolls were revised down an unusually large 95,000 for the prior two months, leaving the net gain, including revisions, at a tepid 44,000.
Much of the recent job growth has been concentrated in government and healthcare, while private sector gains have been modest. “Core payrolls” (excluding three sectors: government, education & health services, and leisure & hospitality, all of which are heavily influenced by government spending and regulation) increased only 5,000 in May and are up only a grand total of 26,000 in the past three months (First Trust).
Active job postings have declined for three consecutive months, with a 7% drop in June alone. The slowdown is broad-based, a�ecting most industries and especially entry-level roles.
Civilian employment, an alternative measure of jobs that includes small- business start-ups (but is volatile on a month-to -month basis), dropped 696,000 in May. The only reason the unemployment rate is not rising is that labor force participation rates are dropping . With the labor participation rate declining from 62.6% in April to 62.3% in June and the civilian non-institutional population of about 273.2 million, we can estimate that approximately 695,000 fewer people are working or seeking work today compared to April (The Bureau of Labor Statistics).
Continued unemployment claims have risen over the past four weeks, with 1,965,000 people receiving benefits in the week ending June 28 . This is the highest level since November 2021. The four-week moving average of continued claims is also at its highest since late 2021 (The Bureau of Labor Statistics)
If you’re feeling confused about the U.S. labor market right now, you’re not alone. The important thing to remember about labor reports is that they are backward-looking and often cited as a “lagging indicator” of economic activity. This means it reflects changes in the economy only after broader economic shifts have already occurred. For example, the number of people employed or the unemployment rate typically changes after the economy has either improved or worsened, rather than predicting future trends.
Retail sales in the U.S. declined 0.9% month - over-month in May 2025, following a downwardly revised 0.1% drop in April and worse than the market forecast of a 0.7% fall.
Not only did retail sales fall below consensus expectations in May, but the reading also posted the largest monthly decline since March 2023, and the prior month’s reading was revised down as well. It would appear that consumers are pulling back in the midst of rising uncertainty.
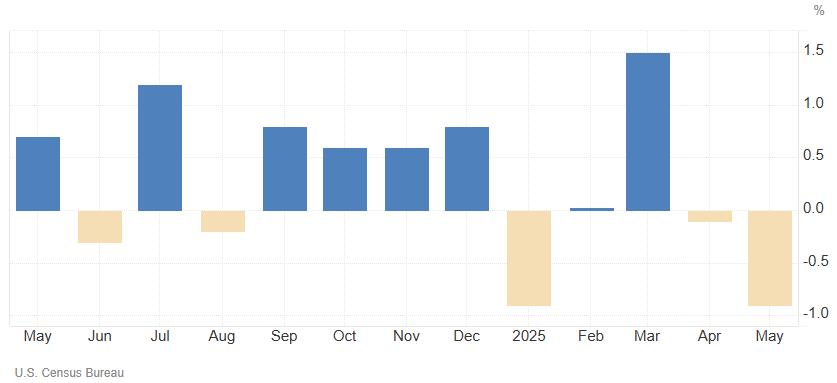
As we have often observed, the U.S. Census Bureau’s measure of retail sales is not adjusted for inflation. “Real” (inflation-adjusted) retail sales are up just 0.9% in the past year and are still down from the peak in early 2021. This points to the fact that consumers are paying higher prices today but taking home fewer goods than they were four years ago.
Regardless of how one might prefer to account for the impact of inflation on consumer spending patterns, recent weakness in U.S. retail sales suggests that the U.S. consumer is becoming more cautious, reflecting fading pent-up demand and growing caution about the broader economic environment.
While we generally view the May retail sales dip as a combination of temporary tari�- driven irregularities and early signs of growing consumer caution , we do not necessarily see it as an immediate sign of a consumer recession.
The Conference Board Leading Economic Index® (LEI) for the US ticked down by 0.1% in May 2025, after declining by 1.4% in April (revised downward from –1.0% originally reported). The LEI has fallen by 2.7% in the six- month period ending May 2025, a much faster rate of decline than the 1.4% contraction over the previous six months.
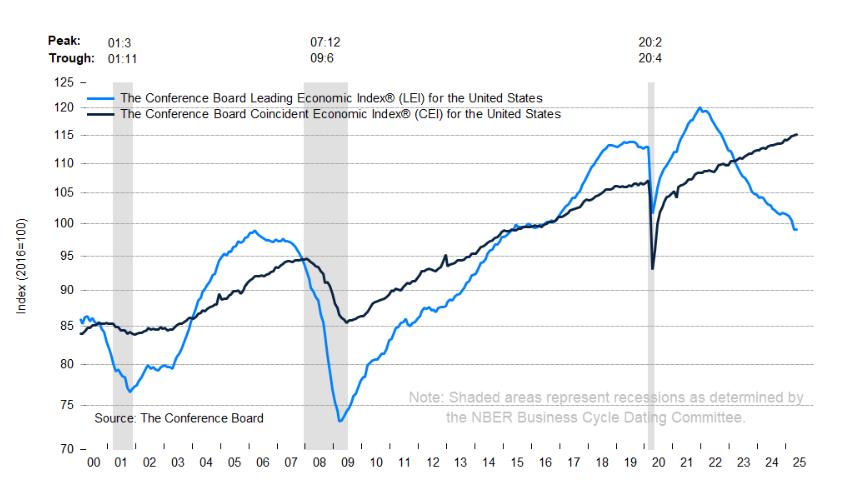
While the decline in leading indicators in May was relatively small, we would observe that the index has been trending lower for an extended period of time. As illustrated in the graph above, meaningful periods of decline are often associated with recessions (the grey shaded vertical bars).
Consumers’ pessimism, persistently weak new orders in manufacturing, a second consecutive month of rising initial claims for unemployment insurance, and a decline in housing permits weighed on the Index, contributing to May’s overall decline. With the substantially negative revision in April and the further downtick in May, the six-month growth rate of the Index has become more negative, triggering a potential recession signal.
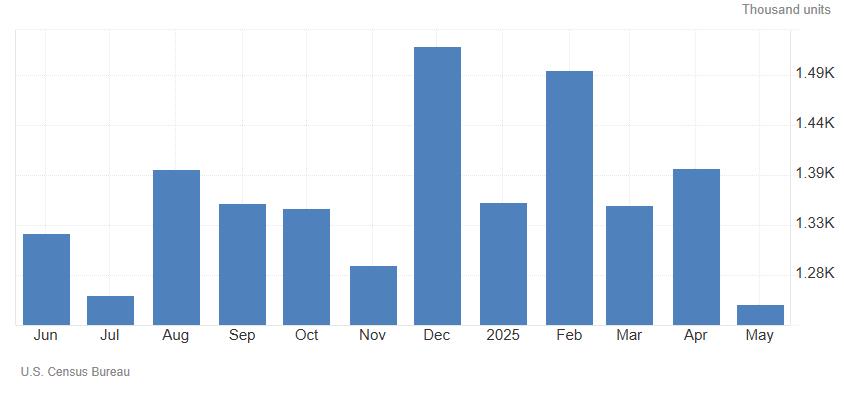
U S housing starts dropped sharply by 9.8% month - over-month in May 2025 to a seasonally adjusted annual rate of 1.256 million units, down from an upwardly revised 1.392 million in April and well below market expectations of 1.36 million. This marked the weakest level since May 2020, in the early aftermath of the COVID -19 pandemic.
Recent housing data revealed the increasing pressure on homebuilders and other housing-related sectors. This is important because housing and housing-related sectors account for 16.4% of U.S. GDP as of the first quarter of 2025, according to the Bureau of Economic Analysis. Historically, the combined share of housing in GDP has ranged from 15% to 18%, with the current figure at the higher end of that range.
Unsold home inventory has climbed for 20 consecutive months, with the number of homes for sale up 20% compared to last year and back to pre -pandemic levels in many markets. There are now about 826,000 single-family homes unsold, 32% more than a year ago.
We believe housing market demand is seriously impacted by today’s higher-for-longer interest rate scenario. And with mortgage rates expected to ease only slightly to 6.7% by the year- end, housingrelated activity is likely to remain under pressure. We would not expect material improvements in the outlook for housing until mortgage rates move back down to 5% or less.
The NFIB Small Business Optimism Index in the U S came in at 98.6 in June 2025, below 98.8 in May and forecasts of 98.7, but holding slightly above the 51-year average of 98. A substantial increase in respondents reporting excess inventories contributed the most to the decline in the index.
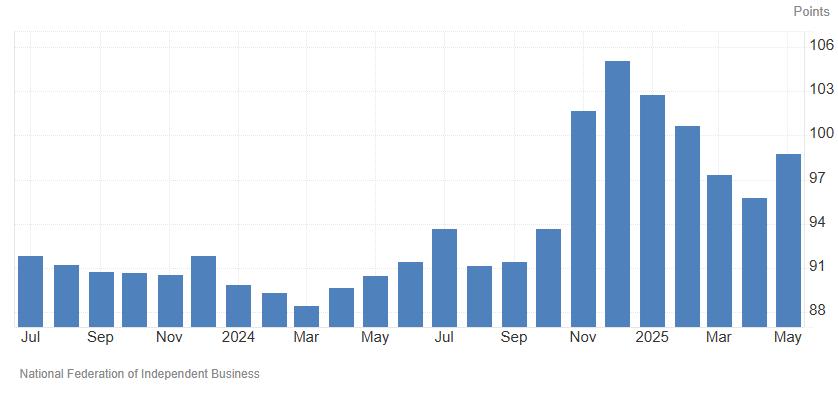
There are numerous components to the NFIB’s monthly survey of business owners. One such measure relates to the overall health of respondents’ businesses. The June report showed a substantial deterioration in this metric, with declines in the percentages reporting their business was in excellent or good health . When asked to rate the overall health of their business, 8% reported excellent (down six points), and 49% reported good (down six points). 35% percent reported the health of their business was fair (up seven points), and 7% reported poor (up three points).
The “One Big Beautiful Bill” has made its way through the House and the Senate and was signed into law by President Trump on July 4, 2025 The legislation locks in lower individual tax rates, expands the standard deduction, increases the child tax credit, and raises the estate tax exclusion. For businesses, it makes permanent the small business deduction and several business tax breaks
The bill includes measures to "unleash American energy," support domestic manufacturing, and promote deregulation, all intended to further drive economic growth and reindustrialization.
Perhaps the most notable pro -growth provision of the bill relates to expensing and investment incentives for businesses. The law makes permanent the ability for businesses to immediately expense investments in short-lived assets and domestic research and development. Section 179
expensing for small businesses is doubled to $2.5 million, and 100% expensing is allowed for new and expanded factories (The Tax Foundation).
It is estimated that the permanence of the small business deduction alone is projected to create over 1 million new Main Street jobs annually and save 1.1 million manufacturing jobs ( Ways and Means Committee).
Provisions like no tax on tips and overtime pay are intended to boost take -home pay for workers, especially in blue- collar and service sectors. The Council of Economic Advisers estimates the bill could raise GDP by up to 5.2% in the short term and 3.5% in the long run, with investment potentially rising 14.5% and more than four million jobs created over time.
By making key provisions of the 2017 Tax Cuts and Jobs Act permanent - including rates, brackets, and the larger standard deduction - the bill aims to provide long-term certainty for households and businesses, encouraging sustained investment and planning . These pro -growth policies – now signed into law – are the cornerstone of President Trump’s economic agenda.
Along with deregulation and trade policy, President Trump’s team hopes these measures will deliver higher GDP growth, millions of new jobs, higher wages, and greater economic security for American families, while critics warn of higher consumer prices, trade retaliation, and fiscal risks from large tax cuts and spending increases.
We believe the ultimate success of President Trump’s economic initiatives will hing e on the gains in economic activity these policies are able to produce.
As we summarize our economic and market outlook for the second half of 2025, we would be remiss not to mention the enormous impact the emergence of Artificial Intelligence (AI) is, and will have going forward, on our economy.
Artificial intelligence (AI) stands out as one of the most significant innovations of recent decades, rivaling or even surpassing many previous technological breakthroughs in its scope and impact. Unlike specialized inventions such as the telephone, automo bile, or sewing machine, which transformed specific aspects of life, AI is a general-purpose technology that is fundamentally reshaping multiple sectors simultaneously, including healthcare, transportation, finance, education, agriculture, and more.
Artificial Intelligence continues to be a key theme across capital markets. The AI stack , or ecosystem, is broad and includes AI infrastructure, AI data and models, and ultimately AI applications and services.
It’s believed that we are still in the early innings of the AI timeline, with the large focus and investment being directed toward building out the infrastructure rather than achieving artificial general intelligence, though more on that later.
The AI race to build out the infrastructure has resulted in accelerated AI capital expenditure ( CE) spending. In fact, CE from the major AI “hyperscalers” may reach $278B in 2025 and be just shy of $1T over the next 3 years (J.P. Asset Management, Bloomberg).
This spend is to usher in the next phase in enterprise and consumer AI adoption , not just moving beyond chatbots and content generation, but rather embedding AI more deeply into daily life. In the short term, this includes greater adoption of AI co -pilots and agents to automate administrative tasks or AI- embedded hardware.
AI not only automates and optimizes existing processes but also accelerates the pace of innovation itself by enabling faster data analysis, risk assessment, and collaborative tools that improve decision-making and organizational e�iciency.
Over the intermediate term, it’s likely there will be progress in medical breakthroughs as well as the deployment of humanoid robots for manufacturing/logistics use, and personal use in time. Even now, a tool called AlphaFold won a Nobel Prize in 2024 for predicting the structure of 200 million proteins. This allows researchers to now rapidly model protein targets for disease, design drugs, or even create enzymes or antibodies.
With these applications and growing uses of AI, the compute r power needed for inference in AI models is exploding. Inference is the process by which a trained model applies what it’s learned from large data sets to new, unseen data to make decisions or predictions . These inference models, such as agentic AI, are becoming more complex as they become multimodal (images/audio/video), and have multi-step reasoning for immediate responses to complex tasks and objectives (i.e., managing logistics chains).
The goal of these complex models is to achieve artificial general intelligence (AGI) or AI systems with human-like reasoning and adaptability, which would have super complex inference steps. This is the type of intelligence that is leading many to believe that AI will displace a vast majority of the workforce (New York Times).
Whether we should pursue this type of intelligence is, of course, a question in and of itself, but assuming this pursuit leads to a more productive world, it exacerbates the problem of power supply. According to BlackRock, this type of intelligence and inference model ing likely requires 100x the compute of a simple inference model/query (GPT-4).
The power demand growth driven by AI is projected to exceed that of the projected power supply over the next several years. According to consulting firm ICF International, U.S. electricity demand is set to rise 25% between 2023 and 2030 in large part due to the boom in data centers. They also state that to meet the demand surge, the U.S. needs to add roughly 80 GW (gigawatts) of generation capacity per year from now until 2045, which is double the average 40 GW installed per year in the last 5 years.
There appears to be a need for continued and accelerated power capacity, yet there isn’t a clear solution to the problem of the projected 2030 shortfall of power supply. Renewables are a growing energy source, yet these technologies require massive growth in energy storage and are less reliable. Natural gas appears to be one of the more reliable solutions in the short term , but may face climate challenges if it rapidly accelerates production. Nuclear fission looks to be a great solution, but only in the long term, given the time it takes to build nuclear power plants and the related regulatory hurdles. Fusion is also a very promising solution, but projects are still in the experimental phase.
The advancement of AI is exciting and scary at the same time. There does appear to be an opportunity for further investment opportunities in the areas surrounding AI, such as the grid and longer-term resource solutions to power shortages.
While previous innovations such as the telephone revolutionized communication and the automobile transformed mobility, AI is unique in its ability to continuously learn, adapt, and improve, making it a dynamic force that could shape the trajectory of futur e technological and societal developments in ways we are only beginning to understand.
In summary, AI's significance lies not just in its immediate applications but in its potential to redefine the very process of innovation and to permeate virtually every aspect of modern life, much as electricity and the internet did before it. Accordingly, several of the experts we have summarized below cite artificial intelligence as a significant driver of productivity and growth going forward.
A new feature in our Outlook 2025 report highlighted a summary of the viewpoints from prominent economists, academics, and market commentators. These are professionals with whom we have had numerous interactions over the years and whose opinions we respect. Below is an update of their expectations looking towards the second half of 2025.
Professor Jeremy Siegel , Wharton School of the University of Pennsylvania, maintains a mid-year 2025 economic outlook characterized by cautious optimism mixed with concerns over trade policy, Federal Reserve actions, and the sustainability of recent market gains . Siegel expects muted returns for the S&P 500 in the second half of 2025, following two strong years. He forecasts gains in the zero to 10% range, noting that the market’s dominant tech stocks could see "flattish" performance, while undervalued small- and mid- cap stocks may rally.
Brian Wesbury, Chief Economist at First Trust Advisors, has a mid-year 2025 economic outlook that is notably cautious, reflecting concerns about the sustainability of recent economic growth and the risks associated with fiscal tightening and market overvaluation .
He believes the U.S. is at high risk for a mild recession in 2025, with real GDP potentially declining by 0.5% to 1%. This is attributed to the U.S. economy’s reliance on large deficits and government stimulus over the past several years.
Wesbury sees stocks as overvalued by about 20% based on his Capitalized Profits Model. He does not expect a repeat of the 20%+ gains of previous years. Instead, he forecasts the S&P 500 to end 2025 between 5,000 and 5,400 (with 5,200 as a central estimate), suggesting the potential for modest losses for investors from current levels.
Edward Yardeni, President of Yardeni Research, has a mid-year 2025 economic outlook that is notably bullish, emphasizing the resilience of the U.S. economy and a constructive view on equities despite ongoing policy and geopolitical uncertainties.
Yardeni Research has raised its S&P 500 forecast to 7,000 for 2025, reflecting growing optimism about the U.S. economy’s strength. This is a significant upward revision from previous targets of 6,000–6,500 and is based on robust GDP data and pro -business policies. Yardeni acknowledges risks from policy shifts, global trade tensions, and potential market volatility, but he believes these are outweighed by the underlying economic and technological strengths
Yardeni is especially bullish on the impact of AI - driven productivity gains, which he believes will help drive better-than- expected economic growth and corporate earnings. He forecasts S&P 500 earnings per share could reach $285 in 2025 and $320 in 2026, supporting higher equity valuations .
David Kostin, Goldman Sachs' Chief U.S. Equity Strategist, maintains an optimistic stance in his mid-year 2025 economic outlook. Kostin and his team have raised their 12 -month S&P 500 target to 6,900 (from 6,500) and increased the year- end 2025 target to 6,600 (from 6,100), citing expectations that the Federal Reserve will cut interest rates sooner than previously anticipated .
Goldman Sachs forecasts S&P 500 earnings-per-share (EPS) growth of 7% in 2025, reaching $262, slightly above the median strategist forecast. Kostin notes that while tari�s are creating a modest drag on growth and a one-time boost to inflation, these e�ects are expected to be o�set by strength in sectors like information technology, communication services, and healthcare.
Kostin highlights that while the outlook is positive, risks remain, particularly around the ultimate impact of tari�s, supply chain disruptions, and the possibility that companies may have to absorb more costs than anticipated, which could further pressure margins.
Rick Rieder, BlackRock’s Head of the Global Allocation Investment Team, maintains a resilient and optimistic outlook for the U.S. economy in the second half of 2025, despite headwinds from tari�s and slowing growth. Rieder believes the U.S. economy will remain robust, with the services sector largely insulated from tari� impacts. He points to strong consumer spending and significant tailwinds from artificial intelligence and technological innovation as drivers that will help o�set the initial shock of tari�s.
He expects a surge in productivity and innovation to drive economic growth , particularly in the latter part of 2025, and sees these forces as helping to contain inflation pressures.
While acknowledging some short-term labor market weaknesses, Rieder anticipates a robust finish to 2025, with business investment and R&D spending supporting continued growth . His main caution is the federal deficit, which he views as the largest potential threat to the positive trajectory.
Mike Wilson, Morgan Stanley's Chief U.S. Equity Strategist, has adopted a constructive and increasingly bullish outlook for the second half of 2025 . Wilson highlights a sharp improvement in corporate earnings outlook and a rebound in earnings revisions breadth, which he sees as a key bullish signal for equities.
Morgan Stanley’s 12-month price target for the S&P 500 is 6,500 , implying roughly 4% upside from recent levels. Wilson believes the market is likely to overlook softer economic data in favor of forward-looking signals from corporate earnings.
Wilson describes the macro backdrop as “slow growth, not no growth.” He expects the U.S. economy to avoid recession, with resilient consumer spending and ongoing innovation helping to support modest expansion. He acknowledges ongoing risks from policy uncertainty, debt burdens, and the need for higher productivity growth, but believes the market’s strength is signaling confidence in solutions emerging for these challenges.
David Kelly, Chief Global Strategist at J.P. Morgan Asset Management, presents a mid-year 2025 economic outlook centered on moderation, resilience, and heightened policy uncertainty. He expects real GDP growth of 2.1% for 2025, reflecting a transition from the post -pandemic boom to a more normalized, moderate pace of expansion.
Kelly believes that Consumer spending remains the primary driver o f economic activity in the U.S., though at a slower rate than in previous years. He believes that wage growth is steady, and Kelly notes that the labor market’s normalization should help bring inflation down.
He describes the current environment as “out of the storm, into the fog,” emphasizing that policy shifts are the main source of volatility for the outlook . He advises investors to focus on diversification and balance as the U.S. economy settles into a new, more moderate phase.
Thomas Lee, Head of Research at Fundstrat, maintains a bullish but nuanced mid -year 2025 economic outlook, emphasizing both strong tailwinds for equities and the potential for increased volatility as the year progresses. Lee’s base case is for the S&P 500 to reach 7,000 early in the second half, before ending the year at 6,600. This outlook reflects his expectation of a strong first half for equities, followed by weaker visibility and increased risks in the second half of the year.
As inflation continues to ease, Lee expects the Federal Reserve to shift focus toward supporting employment, which should be positive for risk assets. He sees that President Trump’s probusiness policies, including deregulation and tax cuts under the Trump administration, could boost confidence and corporate earnings simultaneously.
Lee forecasts S&P 500 earnings per share (EPS) growth to $275 in 2025 and $300 in 2026 (13% and 9% year- over-year, respectively), driven by a recovery in corporate capital expenditures, improving productivity, and a weaker U.S. dollar. He anticipates P/ E multiple expansion toward 22x 2026 EPS, supported by historical trends when yields are in the 4 –5% range.
Je�rey Kleintop, Chief Global Strategist at Charles Schwab, describes the mid-year 2025 economic outlook as one of resilience amid transition, with global markets showing typical postelection patterns and a notable divergence between the U.S. and other major economies.
Kleintop notes that while U.S. and Chinese economies are slowing in 2025, most other developed markets are expected to see improved growth. Many of these economies experienced “rolling recessions” in prior years and are now rebounding, supporting global ex pansion.
Kleintop warns that while momentum is strong, the range of possible outcomes is wide due to policy uncertainty, especially regarding tari�s, fiscal policy, and labor markets . This could drive volatility in the second half of the year. He continues to see potential for international stock market leadership over U.S. stocks in the second half of 2025.
The Bespoke Investment Group presents a cautiously optimistic view at mid-year but highlights a more volatile and less predictable environment compared to the prior two years of steady gains.
Bespoke expects the bull market to persist into 2025, but with much less consistency and greater risk of reversals. The firm notes that after a period of strong economic and market performance, "things could really go either way" in the second half, reflecting increased uncertainty and the end of the “honeymoon” phase for bullish catalysts.
Bespoke underscores that 2025 will be "much less steady," with the potential for both positive and negative surprises. The firm suggests that investors should be prepared for a bumpier ride, with the possibility of both continued gains and sharper corrections.
There is clearly a wide range of expert opinions regarding the path forward in 2025. While mostly “cautiously optimistic”, many commentators cite tari�s and trade tensions frequently as major concerns for the coming year. Consistent with our own writings over the past several years, many experts view current geopolitical risks, including ongoing conflicts and potential escalations, as adding to the uncertainty.
We value the divergent perspectives and observations of industry professionals and will continue to consider their commentary throughout the year.
It’s hard to believe that it was only three months ago that the market was on the verge of a bear market, and a recession seemed like a foregone conclusion. Everything has been coming up golden in the last few weeks as the major averages, many sectors, and countless stocks are trading at “golden crosses” (a bullish technical chart pattern that occurs when a stock’s short -term moving average crosses above its long-term moving average).
Technical trends alone won’t drive the market higher, and going forward, the economy and earnings will need to deliver. In terms of the economy, we’ve seen a prolonged trend in recent months where economic momentum relative to expectations has been disappointing, but there are some signs of improvement.
One thing seems relatively clear in a world filled with uncertainties : U.S. stocks are currently expensive. Nearly every traditional measurement of valuation shows how high equity prices are today relative to history.
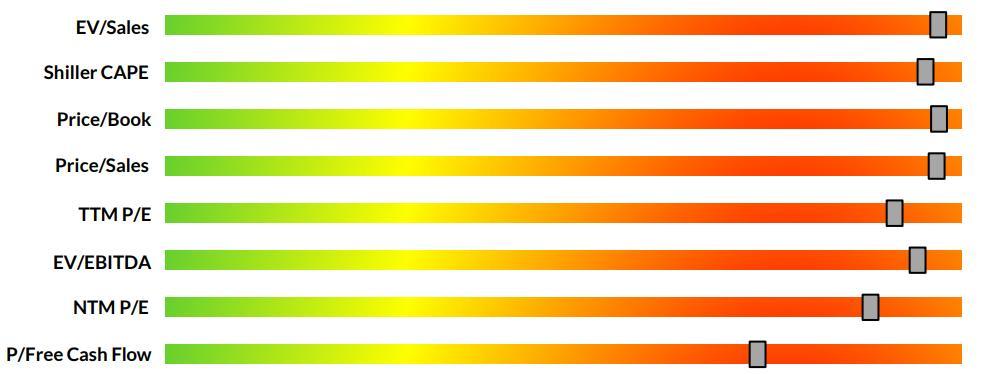
Crossmark, Strategas, FactSet, Bloomberg, Robert S hiller as of 5-31-2025
Given the challengin g fact pattern surrounding our “Complicated Path Forward”, we envision three distinct scenarios that could emerge over the balance of this year and into 202 6:
1) Bullish Scenario – The economy reaccelerates following a brief period of moderating growth and final trade negotiations. Inflation continues to move lower, and corporate profit expectations rise due to the pro -growth policies of the Big Beautiful Bill , Fed rate cuts, and productivity gains stemming from innovation such as artificial intelligence. In this scenario, 2026 earnings forecasts for the S&P 500 top $300 per share, and valuations remain elevated with multiples nearing 23x Accordingly, the near-term fair-value target for the S&P 500 index would approximate 7,000.
2) Tread Water Scenario – The U.S. economy continues to slow but avoids a recession. Investors await clearer signals or major events before making significant shifts to portfolio strategy. Inflation remains above Fed targets, and monetary policy remains tighter than investors would prefer. In this scenario, 2026 earnings forecasts for the S&P 500 range from $285-$288 per share, and valuations moderate somewhat, with multiples moving down to 21x. Accordingly, the near-term fair-value target for the S&P 500 index would approximate 6,000.
3) Bearish Scenario – U.S. trade policy proves to be more disruptive than currently anticipated, and economic activity turns negative. A short and shallow recession develops, and the Fed moves to stimulate a faltering economy with multiple interest rate cuts. In this scenario, 2026 earnings forecasts for the S&P 500 drop below $265 per share, and valuations dip with multiples moving down to the high teens. Accordingly, the near-term fair-value target for the S&P 500 index would approximate 5,000.
Our current base case is the Tread Water Scenario, and we believe the Bearish Scenario is the least likely of the three. Where the market goes between now and the end of the year will likely be driven by factors we don’t even know about yet. One important thing to keep in mind is that just as it was wrong to get too negative in April, investors probably should avoid becoming too positive now when everything looks great.
The first half of 2025 was marked by extraordinary volatility in U.S. capital markets, driven primarily by policy shocks and rapid reversals in investor sentiment. We saw the largest global sello� in equities following the U.S. announcement of sweeping new tari�s , only to see a historic rally beginning seven days later when the tari� increases were put on hold
Historically, it has taken the U.S. stock market an average of 361 trading days to recoup losses following a correction of 15% . The correction that began in April saw a decline of nearly 20% and a full recovery in only 55 days (Crossmark).
The wholesale transformation of the global trade system initiated by President Trump on “Liberation Day” has dominated the investment landscape since the original announcement. Now, the countdown to August 1, 2025, is on. Rumors about pending trade deals with key trading partners are plentiful, but rumors are very di�erent than final deals.
Exemptions and exceptions will happen , and there will be winners and losers when all is settled. Understanding the details emerging from these negotiations will be critical to navigating market dynamics for the remainder of 2025 and 2026.
Who could possibly have imagined that U.S. equity indices would be trading at, or near, all-time highs if, at the beginning of the year, we were somehow told that in the span of just six months:
a new administration would be fundamentally reshaping the way government works through a record number of executive presidential orders and wide-ranging e�iciency initiatives,
a global trade war would be triggered by the U.S. announcing aggressive tari� policies,
U.S. borders would virtually close, triggering a shortage of workers,
a new Middle East war between Israel and Iran would break out,
the U.S. would unilaterally attack and destroy Iran’s nuclear program,
a credit agency would downgrade U.S. debt,
recession probability estimates surged to over 50% , only to recede to less than 25%,
profit growth would slow, while equity valuations approached all-time highs,
Gold and Bitcoin would both trade to record highs, and,
the widely anticipated interest rate cuts by the Federal Reserve would not materialize.
The market’s resiliency thus far in 2025 has been remarkable. The test going forward will be to see if the markets can continue to look through challenging headlines.
Proper wealth management demands a sound framework for decision -making. As new information becomes available, our thesis will be adjusted. Please know we will work tirelessly to maintain relevant perspectives, e�ective strategies, and favorable outcomes.
Here is how we describe our responsibility to you:
“There is no substitute for hard work, insight, planning, and action in pursuit of unambiguous goals. By establishing a working thesis for the economy and markets, we have confidence that we will be better equipped to respond to the various twists and turns coming our way. We take nothing for granted, and we strive to construct judgments that are supported by data and logic.”
Thank you for taking the time to review our perspectives and forecasts in this report. We look forward to continuing this journey together and are deeply grateful for your continued confidence in us.
Clearwater Capital Partners July 2025
We’re excited to share that our recent headquarters expansion in Ho�man Estates has created an even more collaborative environment for our team and a more welcoming space for our clients. Whether you prefer meeting in person or virtually, we’re committed to o�ering flexible, personalized options that suit your preferences and schedule.
Over the past year, Clearwater Capital Partners’ new website has received tremendous feedback from our clients. The site features a variety of resources, including episodes of our Entrepreneurial Legacies podcast, market commentary, technical insights, white papers, trending topics, event information, and company news all organized to keep you informed and engaged with the latest from Clearwater
Engagement through the Clearwater Capital Portal and mobile app continues to grow, and we’re constantly enhancing these tools to give you more control over how and when you receive information. As we expand our digital capabilities, we remain focused on ma intaining industryleading cybersecurity standards to keep your data safe and secure.
We welcome the opportunity to connect with you, virtually or in person, review the details of your case, and help you make the most of the resources and capabilities we’ve thoughtfully put in place to support your goals.

Liza Alexanian is a valued member of the Clearwater team and plays an important role in keeping us all connected. Among her many responsibilities, Liza oversees the Clearwater Capital calendar and helps coordinate meetings for our clients. If you’d like to schedule a time with your advisor, Liza or one of our amazing operations specialists will be happy to assist you.
liza.alexanian@ccpwealth.com 847-841-8650
Clearwater Capital Partners (CCP) is an independent Registered Investment Advisor registered with the Securities and Exchange Commission (SEC). The firm was founded in 2006 by John Chapman as a locally owned, privately held professional services firm.
The firm provides comprehensive wealth management services to successful individuals and families through its Private Client Practice. The firm’s Institutional Advisory Group o�ers a suite of professional services to businesses, non-profit organizations, foundations, and ERISA-governed retirement plans.
Our
services are designed to help simplify the
increasing demands and complexities related to making sound financial decisions.
As an independent advisory firm, we embrace the fiduciary responsibilities we have for our clients and are at liberty to deliver solutions we believe best reflect their unique needs.
We believe that our firm’s only allegiance is to our client.
We do not represent the interests of any financial institution, brokerage firm , or portfolio manager. We believe that the only valid wealth management strategy is one that accurately and objectively reflects the needs, preferences, and goals of the individual client.
Wealth management is a process; one that takes place over long spans of time, and one that is best served through dedicated expertise, meticulous evaluations, and disciplined judgment. Our process adheres to these precepts and seeks to create an intelligent framework for consistent and rational decision making.
Our process, named Clearwater C3, is a consistent system for prioritizing goals and setting forth a course of deliberate action with deep commitment. Our methods are focused on each client’s most critical objectives and are designed to achieve congruity between values and actions.
Wealth management firms vary widely in their philosophies and in the services they o�er. Clearwater Capital is dedicated to a well- organized process that places the client at the center of our business model. We are uniquely qualified in the disciplines of wealth management, and our clients have entrusted us with the care of their most cherished ambitions. In return, we endeavor to meet this privilege with diligence and accountability.
We place a premium on commitment, objectivity, and transparency. We embrace the fiduciary duty we have for our clients, putting their objectives before all else. Our independence allows us the freedom to develop world - class solutions without interference or a proprietary product bias.
We serve in accordance with our core beliefs, and always with the utmost discretion and confidentiality.
What can we do for you?
The opinions presented are those of Clearwater Capital Partners and John Chapman, Chief Executive Officer and Chief Investmen t Officer, as of July 2025 and may change, without notice, as subsequent economic and market conditions vary.
This material is presented as opinion and commentary. It is not intended to be relied upon as a forecast, research or invest ment advice, and is not a recommendation, offer or solicitation to buy or sell any securities or to adopt any investment strategy. It is strictly intended for educational purposes only.
The information and opinions contained in this material are derived from proprietary and nonproprietary sources deemed by Cle arwater Capital Partners to be reliable, are not necessarily all inclusive and are not guaranteed as to accuracy. Past performance does not guarantee future results. There is no guarantee that any forecasts made will come to pass. Reliance upon information in this material is at the sole discretion of the reader. No investment or investment strategy is risk free.
International investing involves additional risks, including risks related to foreign currency, limited liquidity, less gover nment regulation and the possibility of substantial volatility due to adverse political, economic or other developments.
The two main risks related to fixed -income investing are interest rate risk and credit risk. Typically, when interest rates rise, there is a corresponding decline in the market value of bonds. Credit risk refers to the possibility that the issuer of the bo nd will not be able to make principal and interest payments.
Index performance is referenced for illustrative purposes only. You cannot invest directly in an index. The Dow Jones Industr ial Average is owned by S&P Global, the S&P 500 is a registered trademark of The McGraw -Hill Companies, and The Russell 3,000 Index is maintained by FTSE Russell. Because of their narrow focus, sector investing will be subject to greater volatility than investing more broa dly across many sectors and companies.
High yield/junk bonds (grade BB or below) are not investment grade securities, and are subject to higher interest rate, credi t, and liquidity risks than those graded BBB and above. They generally should be part of a diversified portfolio for sophisticated investors.
Municipal bonds are subject to availability and change in price. They are subject to market and interest rate risk if sold pr ior to maturity. Bond values will decline as interest rates rise. Interest income may be subject to the alternative minimum tax. Mu nicipal bonds are federally taxfree but other state and local taxes may apply.
Government bonds and Treasury bills are guaranteed by the US government as to the timely payment of principal and interest an d, if held to maturity, offer a fixed rate of return and fixed principal value.
The payment of dividends is not guaranteed. Companies may reduce or eliminate the payment of dividends at any given time.
Nothing contained herein is offered as tax advice. Please consult qualified professionals with any tax planning needs or tax questions you may have.
Investment Advice offered through Clearwater Capital Partners a registered Investment Advisor. Please consult with a qualifi ed investment professional before investing.
20250716 - 1