
5 minute read
Surrounding Areas


15 MAP 3. Bufalo Census Tract Map
C. GENDER IDENTITY
Advertisement
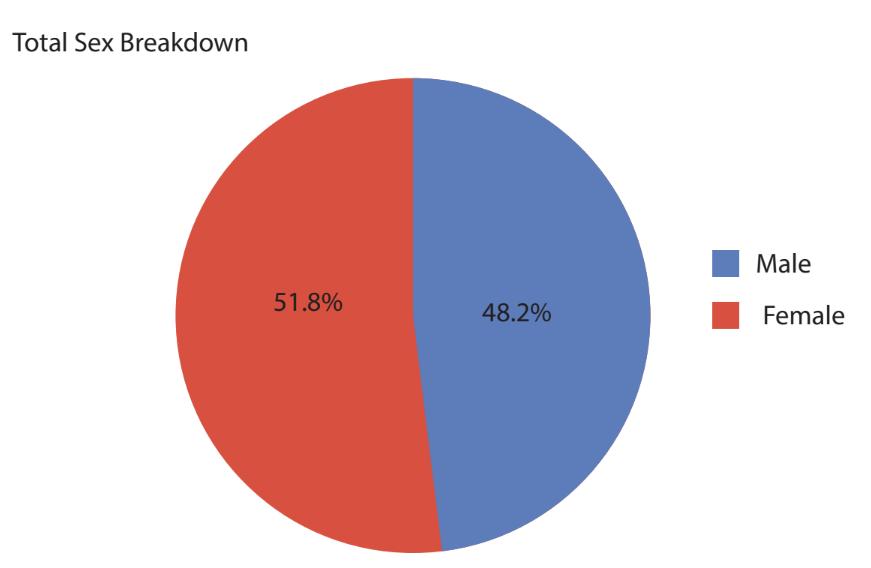
13Nearly all of the census tracts we collected data from have more women than men, though the difference is not too significant. Overall, 51.8% of the population in the selected census tracts are women, while men comprise 48.2% of it. Of all the census tracts, tract 80.03 has the smallest gap between the number of men and women with a difference of only 80 more women. Meanwhile, tract 80.02 has the largest difference of 440 more women. It is interesting to note that the two census tracts are adjacent to each other; In addition, tract 46.01, which encompasses the western half of University Heights, is the only tract to have more men than women with 148 more men.
FIGURE 3. Sex By Census Tract
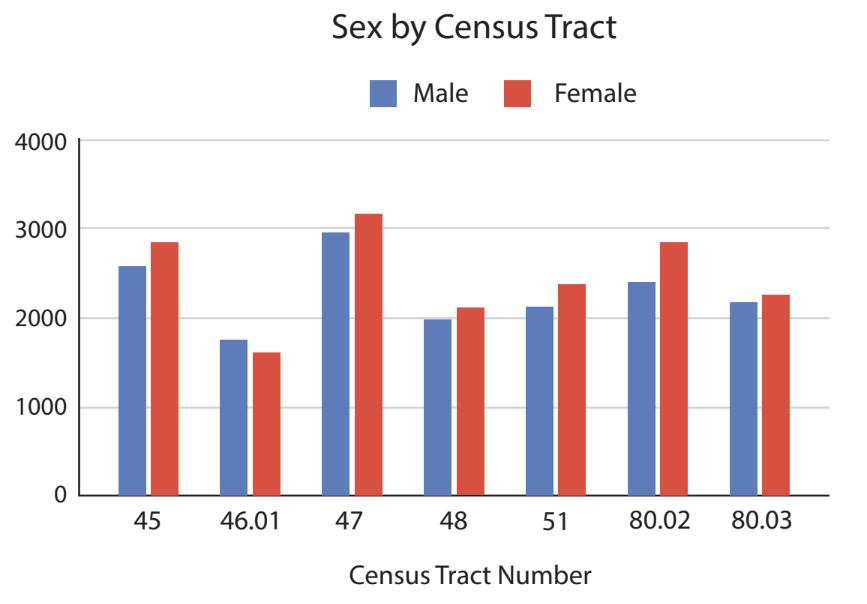
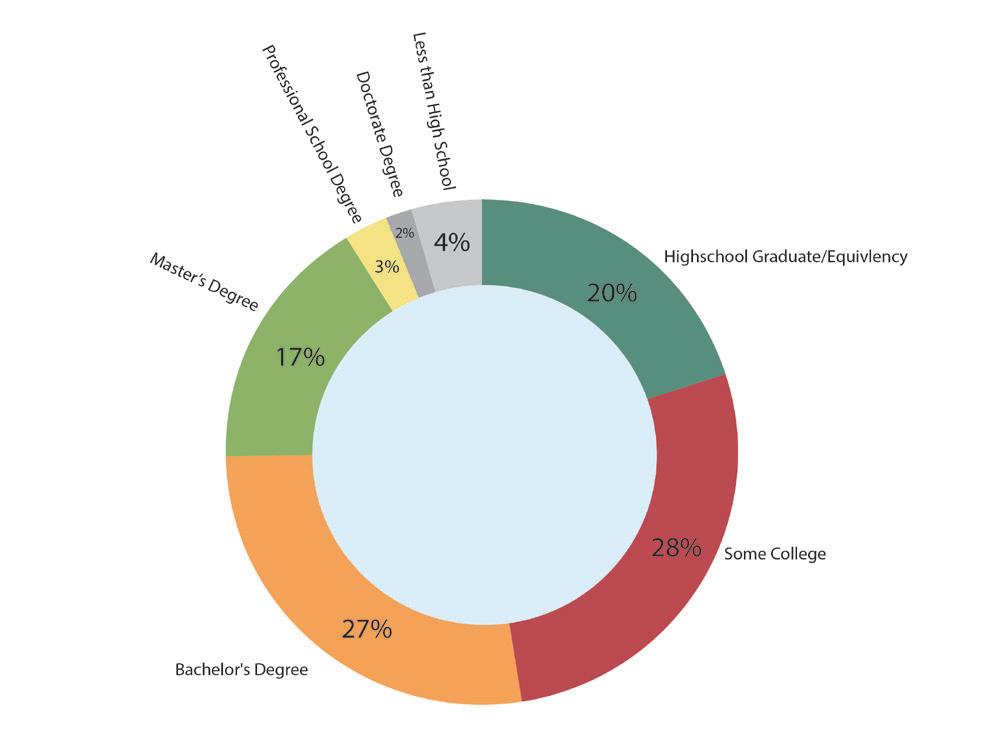
FIGURE 4. Overall Sex Breakdown
D. EDUCATION LEVEL
Most residents living around the study area received a high school degree, a bachelor’s degree, and a master’s degree. Based on tracts 45, 46.01, 48, more than half of the population obtained bachelor's and master’s degrees. Conversely, 64% of the population in tract 47 received some college education obtained or a high school degree. Overall, the percentage of educational attainment of the selected census tracts appears to be similar.14
FIGURE 5. Education Levels
E. AGE
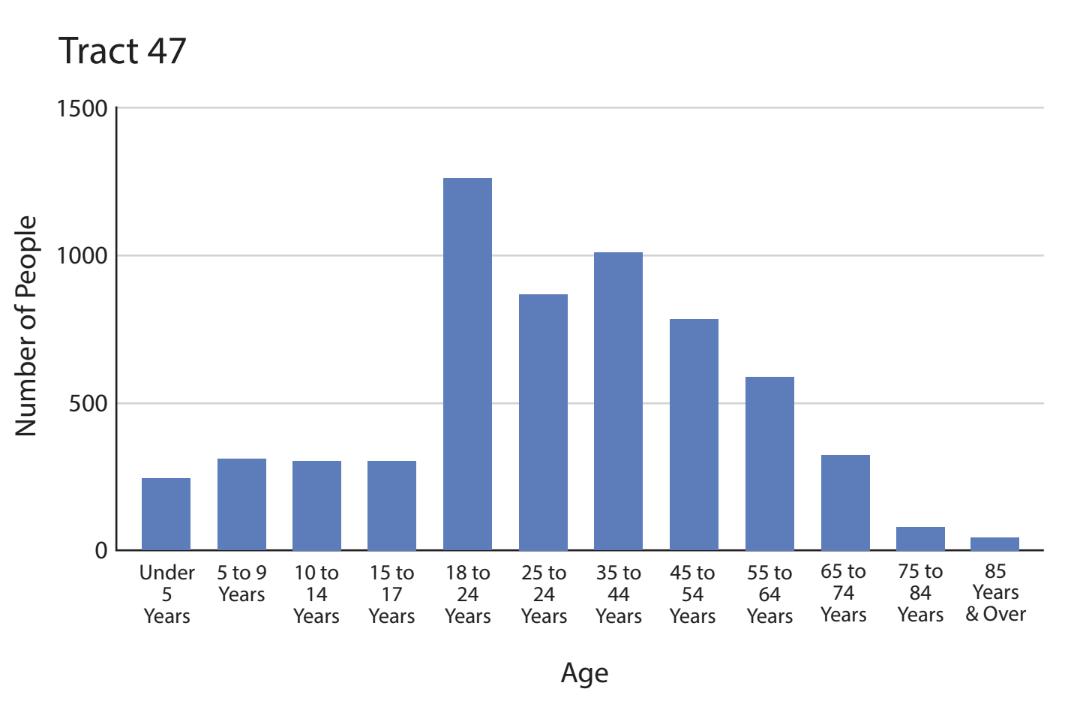
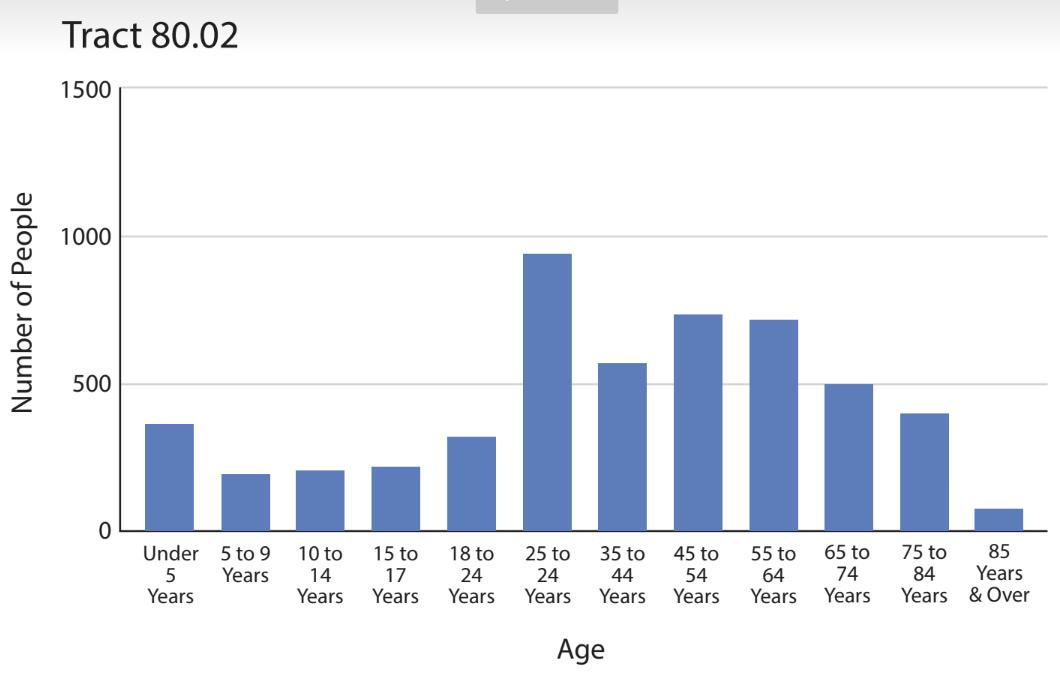
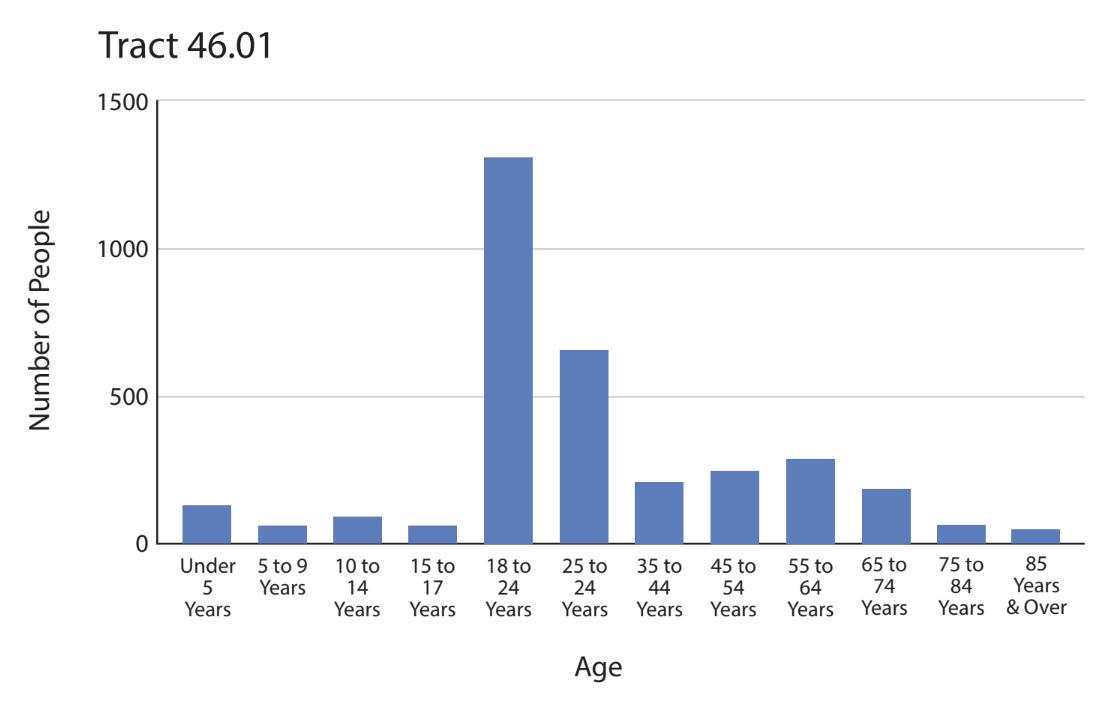
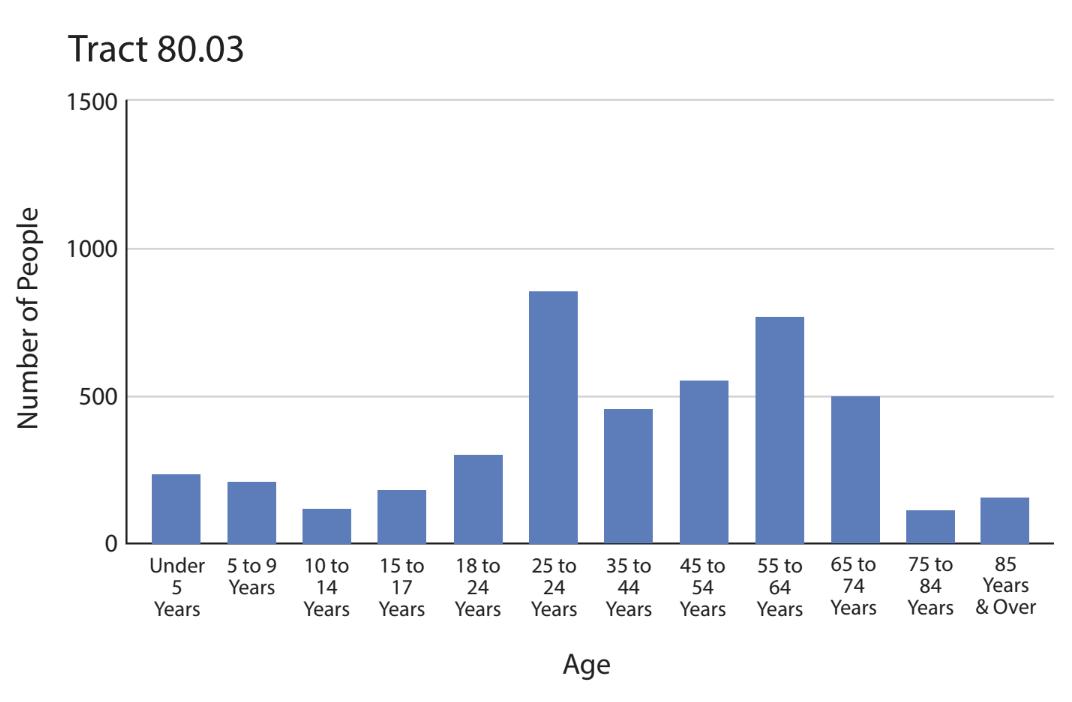
Since tract 46.01 is located within University Heights, it is likely the reason why it is the only tract to have an obvious majority of 18-to-24 year olds. Tract 47 also has university students living there, but there is a noticeable increase of young adults aged 25 to 34 as well as middle-aged adults aged 35 to 54. These residents are possibly local Buffalonians, and the increase is likely due to the greater distance away from UB South Campus. Tracts 45, 48, 51, 80.02, and 80.03 have relatively similar age demographics, and there tends to be more young and middle-aged adults. Overall, 25to-34 year olds are the most common age demographic when looking at the data as a whole, and there are similar numbers of college age students as well as people in their 30s, 40s and 50s.15
13 Sex, Census Tract 45, Erie, NY. ACS 2019 (5-Year Estimates). Social Explorer. (2019). https://www.socialexplorer.com/ a9676d974c/view. 14 Education, Census Tract 45, Erie, NY. ACS 2019 (5-Year Estimates). Social Explorer. (2019). https://www.socialexplorer. com/a9676d974c/view. 15 Age, Census Tract 45, Erie, NY. ACS 2019 (5-Year Estimates). Social Explorer. (2019). https://www.socialexplorer.com/ a9676d974c/view.
FIGURE 6. Age Demographics By Tract


3.5 SOCIOECONOMIC STATISTICS
A. MEDIAN HOUSEHOLD INCOME
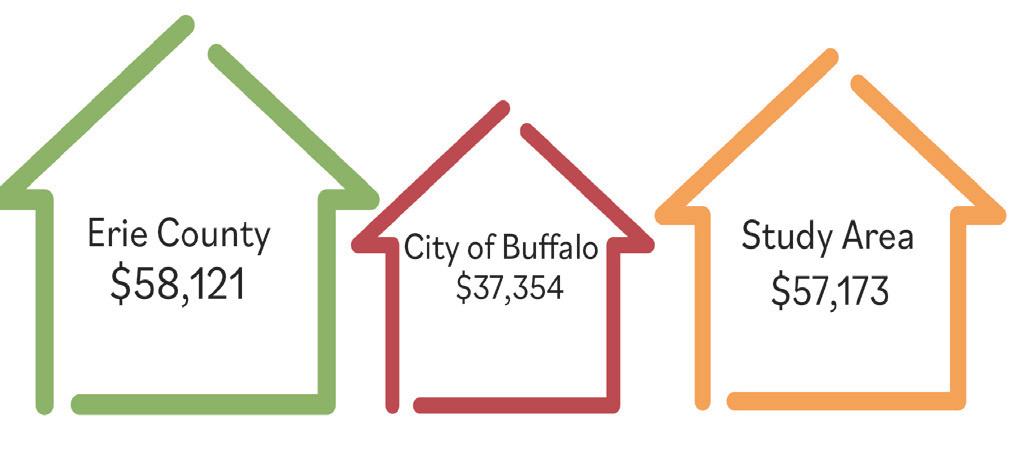
Median household income is a good indicator of wealth within a community. In 2019, the median household income for Erie County was $58,121, with the City of Buffalo reporting a median household income of $37,354. The average median household income for the 7-tract study area is $57,173, which is 1.65% lower than the county and 41.9% higher than the city. Within the study area, tracts 47 and 51 reported the lowest median household incomes with $39,440 and $44,163 respectively, and both were higher than the city median household income. Tract 47 likely houses many college students who may hold part-time jobs, have limited income to report, or living on loans. Tract 51 has older established neighborhoods and includes the Holling Homes development, a property of the City of Buffalo Municipal Housing Authority. This tract is also home to the newly developed Rachel Vincent Way with residential infill development that may not have been included in the 2019 estimates. The highest income reported was found in tract 48 with a median household income of $76,270. This tract covers a significant portion of the commercial district on Hertel Avenue that boasts a variety of locally owned businesses, restaurants, and retail shops.16
FIGURE 7. Median House Incomes
B. EMPLOYMENT
It is important to know the employment rate of a community to better understand the condition of the operating economy and get insight on the city’s labor market. In all census tracts, at least 75% of employed individuals are White. In most of the census tracts, the second highest reported racial demographic of employed people are Black or African American, but this population is significantly smaller compared to the number of White employees. The only exception is census tract 46.01, where the number of Asian employees is slightly greater than the number of Black or African American employees. There are no reported Native Americans or Hawaiian employees residing in areas around our site. When comparing the data sets of 2014, 2016, and 2019, the employment rate appears to steadily decrease. The only exception lies in census tract 46.01; While the number of employed workers is still less than it was in 2014, it is greater than that in 2016. When comparing employment by sex, the number of male and female employees are relatively similar. For instance, census tracts 45, 48, 51, and 80.02 have more male employees, but tracts 46.01, 47, and 80.03 have more female employees. Overall, the percentage of male and female employees are relatively equal with less than 10% difference for all census tracts, with the highest difference in tract 80.02 of 9%.17
C. COMMUNITY HEALTH
Trails and greenspaces are essential for numerous reasons, with community health being a major one. Physical inactivity and chronic diseases are becoming more prevalent in the U.S. When COVID-19 caused everyone to quarantine at home, people had less opportunities to exercise and relax in nature. If people did go outside, it was difficult to maintain social distancing even in public parks sometimes due to the sheer number of people and the insufficient supply of greenspace. Despite the world slowly returning to ormalcy, there is still an increased demand for further expansion and investment in trails and greenspace. A few of the many benefits of trails include better access to the outdoors and increased physical activity, which can help combat conditions such as coronary heart disease and obesity.18
According to the Trust for Public Land (TPL), Buffalo is ranked 38 out of 100 ParkScore cities in
16 Median Household Income (Inflation Adjusted Dollars), Census Tract 45, Erie, NY. ACS 2019 (5-Year Estimates). Social Explorer. (2019). https://www.socialexplorer.com/a9676d974c/view. 17 Labor Force, Civilian, Employed, Census Tract 45, Erie, NY. ACS 2019 (5-Year Estimates). Social Explorer. (2019). https://www.socialexplorer.com/a9676d974c/view. 18 BRFSS 2019, 2018. ACS 2019 (5-Year Estimates). ACS 2018 (5-Year Estimates). Places, Local Data for Better Health. (2022). https://experience.arcgis.com/experience/22c7182a162d45788dd52a2362f8ed65.


