5 minute read
3.6 Land Use & Transportation


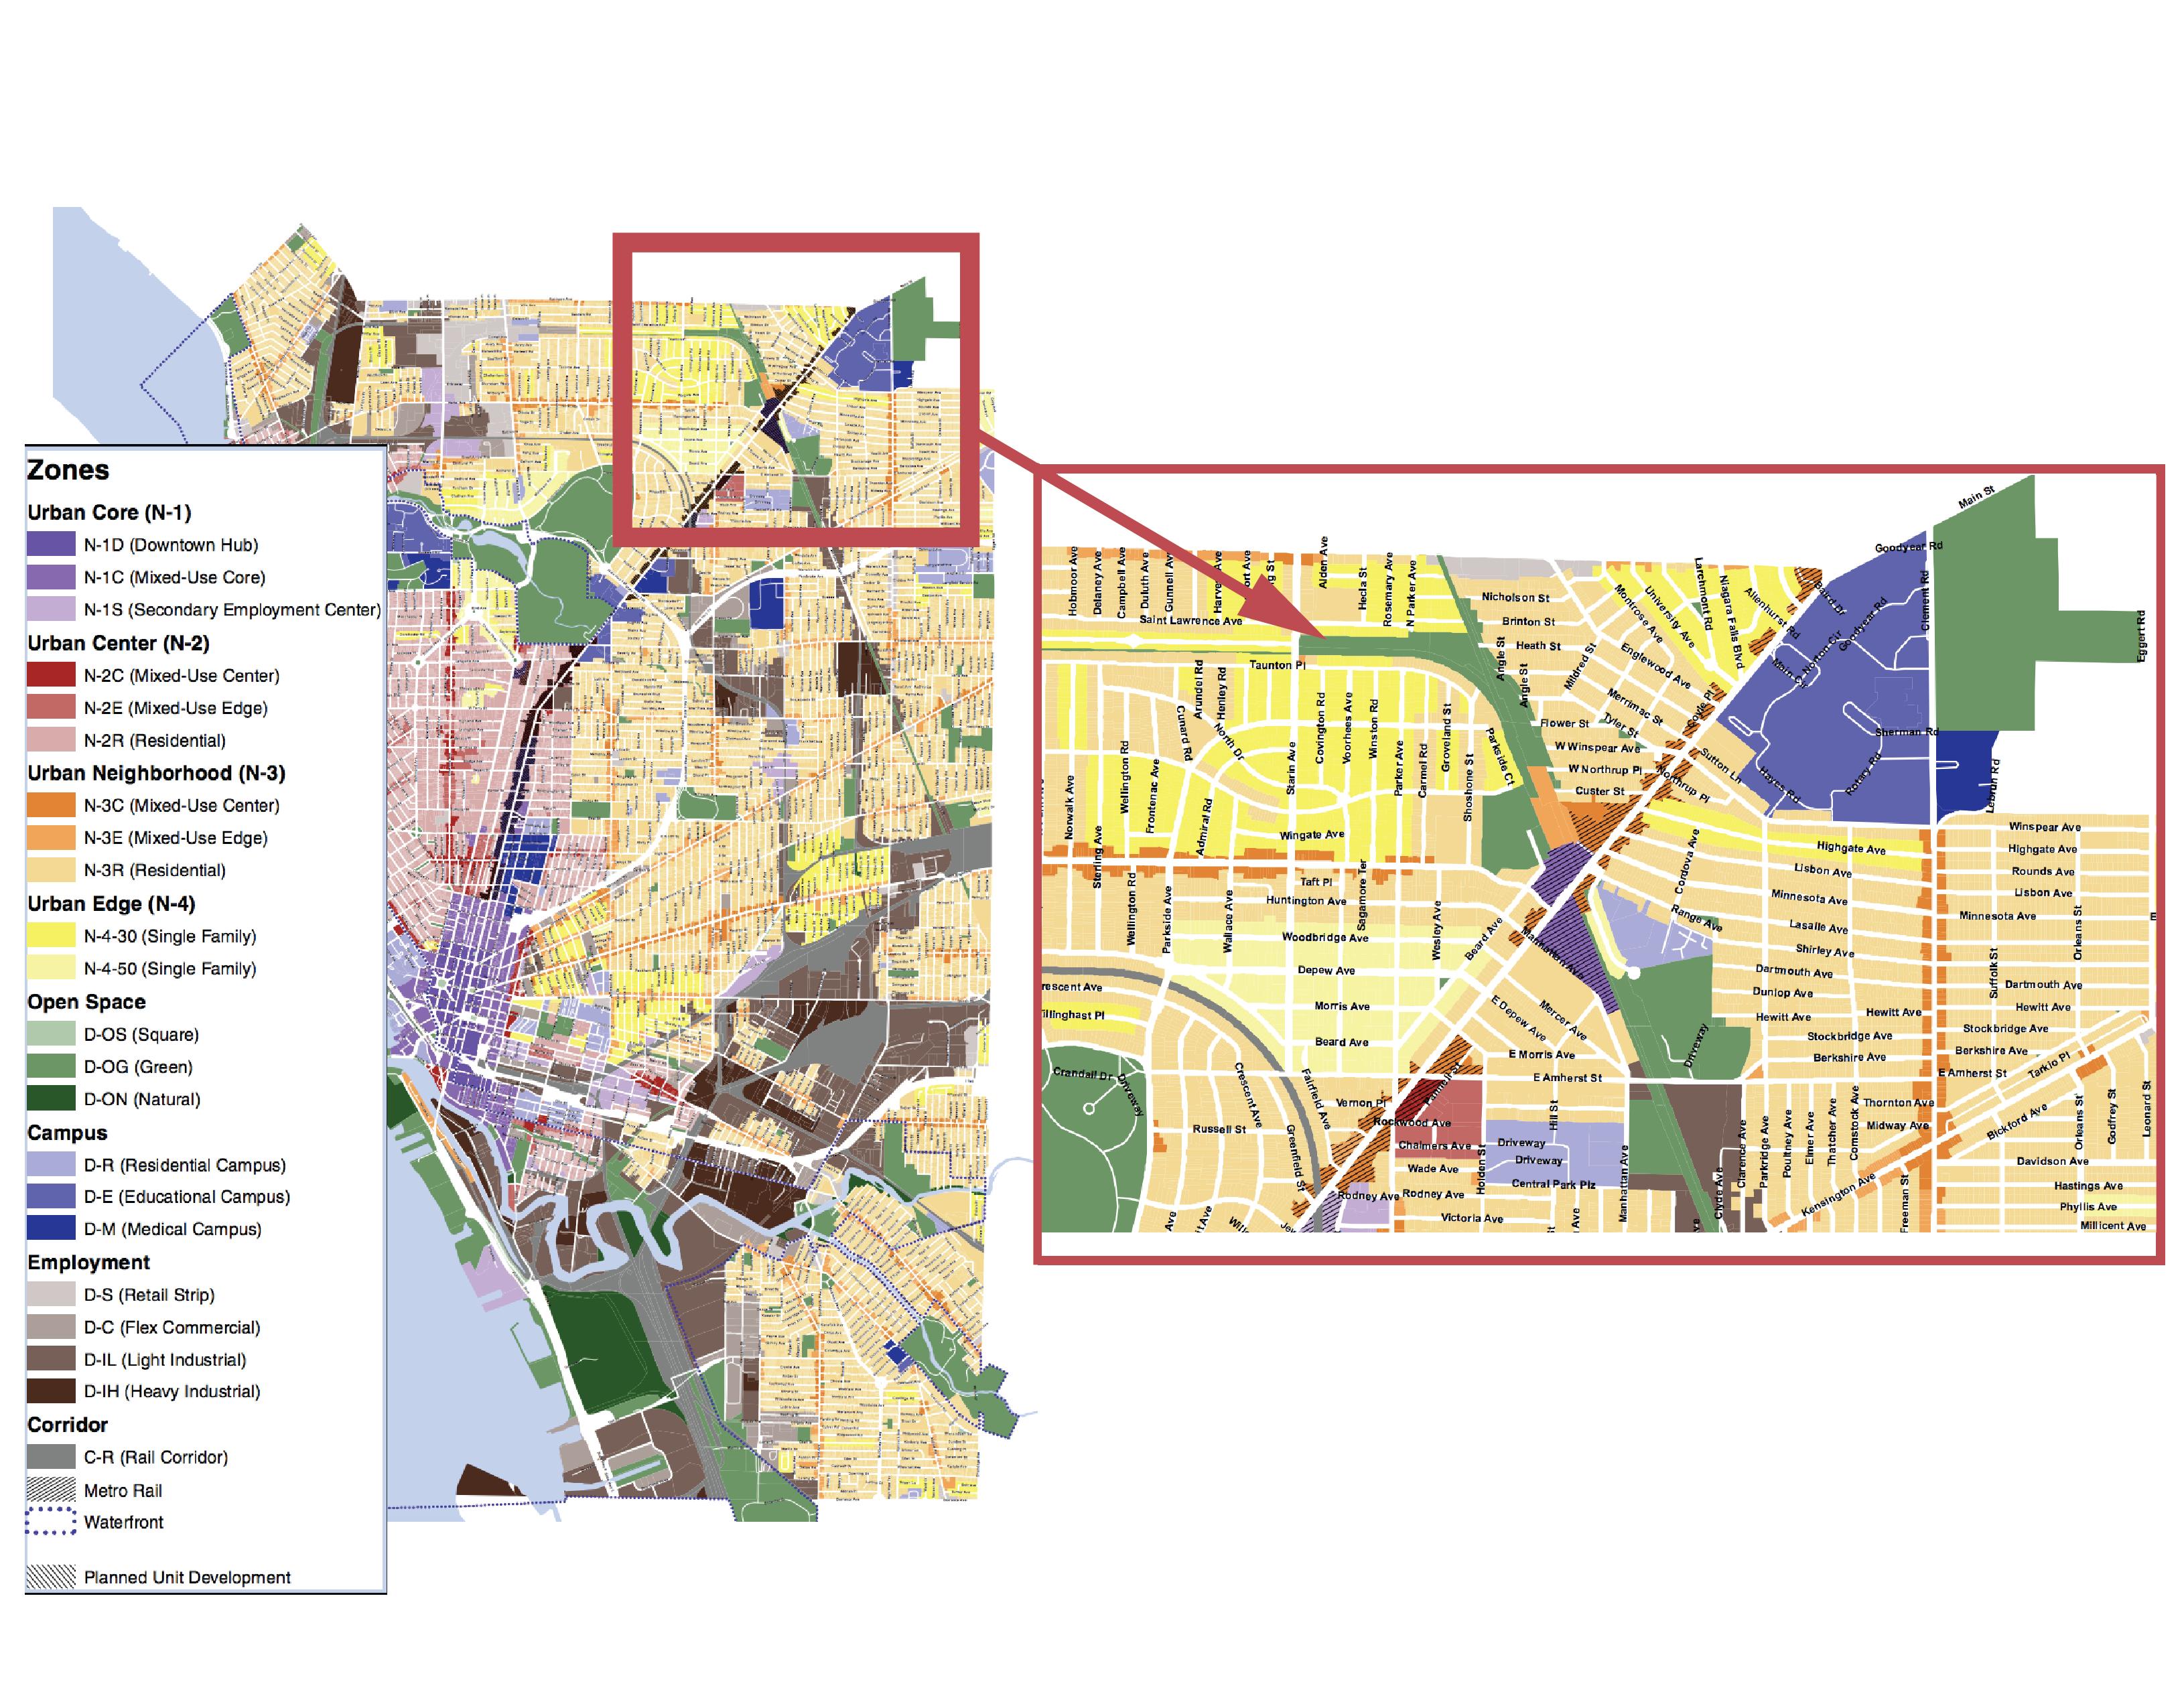
21 MAP 4. Bufalo Zoning Map
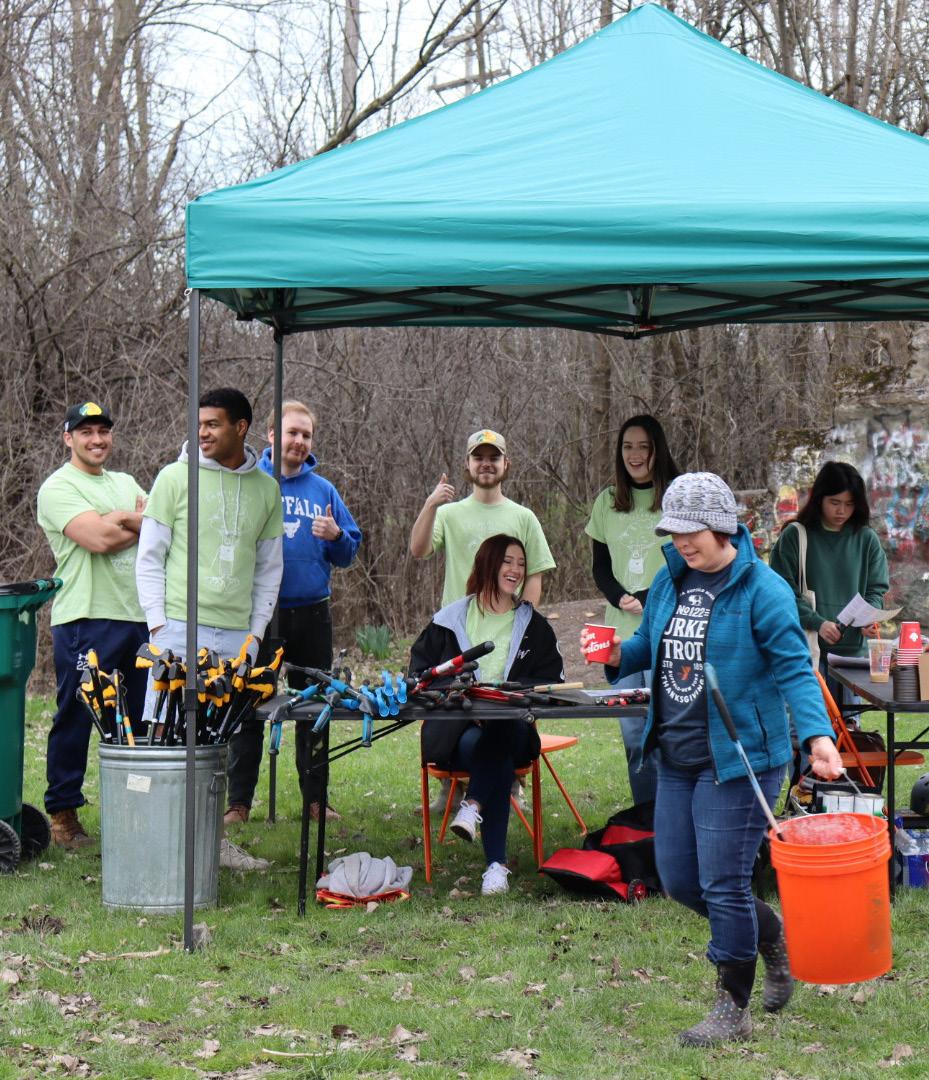
nity assets include the University Heights Collaborative22 (UHC), the Tool Library, and the University at Buffalo (UB). The UHC is a community-based organization that fosters and promotes the well-being and cooperation of the neighborhood. It is composed of residents and other groups, such as local block clubs and neighborhood watch groups. The UHC consists of committees involved in beautification, business involvement, communication, neighborhood watch, and landlord outreach. It is a helpful resource because its board consists of residents in the neighborhood, so there is a direct line of communication with people in the community. Because the UHC also consists of block clubs, we can reach smaller organizations in the community as well as reach more residents that are not necessarilyaffiliated with these groups. The Tool Library23 is a non-profit organization that lends tools for a small annual fee. Anyone in Buffalo or in nearby suburbs, both homeowners and renters alike, can sign up for a membership with the Tool Library. However, considering many households in University Heights consist of shortterm renters, particularly college students, it is especially helpful for University Heights residents to have a place where one can have access to tools that may not be needed for regular use. Rather than buying expensive tools that will only be used once or a few times, people can borrow tools as needed and save money. The Tool Library is home to numerous types of tools, and people can borrow tools needed for anything ranging from simple at-home DIY projects to larger scale events, such as neighborhood clean-ups and tree plantings. UB is also a highly valued asset to the University Heights neighborhood, along with its faculty, students, and this studio. This studio aims to focus on equitable community engagement before developing design plans for the site, which is not always practiced in the field of environmental design. In addition, the students are also great assets because of their passion for helping the community. In fact, the April clean-up event had an incredibly high turnout, with a majority of the attendees being UB students. With these community assets, we were able to network and reach community members that know the neighborhood and site well. For instance, we met with UHC board members and were able to get a better sense of the dynamic between longtime residents and student renters. In addition, we utilized tools from the Tool Library for the highly successful clean-up event. Despite the existence of these great community assets, there is a disconnect between longtime residents and student renters. It is not unheard of for older local residents to report negative interactions with college students, and it has contributed to strained relations over time. However, considering a majority of the clean-up event attendees were also UB students, this demonstrates their desire to connect with and help the community. We hope that this project can open a dialogue and improve communication between the two groups, as well as allow them to work together in deciding the fate of the Starin Nature Preserve.
Advertisement
C. TRANSPORTATION
According to 2019 ACS census data, there is an obvious majority of people who drive a vehicle to commute to work. Census tract 80.02 has the highest estimated percentage of people who drive a vehicle to work with a rate of 93.9%, while tract 46.01 has the lowest rate of 71.2%. This discrepancy is possibly due to tract 46.01 being more likely to have more student renters, and college students are less likely to own a car compared to working adults. Of the people who drive a vehicle to work, a relatively small proportion of them carpool. For most census tracts, the rate of people carpooling ranges from roughly
22 About. University Heights Collaborative (UHC). (2022). http://ourheights.org/about/#mission. 23 About Us. The Tool Library. (2022). https://www.thetoollibrary.org/about/.
5% to 8%. Interestingly, this figure is significantly higher for tracts 47 and 80.03, with a rate of 20.9% and 13% of people, respectively. Tract 47 is also home to a considerable number of UB students, so it may be the increase in college students that causes such a difference in this census tract. However, it is unclear why tract 46.01 has a noticeably lower rate of 6.4%. Public transportation rates are also highly variable, with the lowest of 2.2% at tract 80.02. There is a moderate increase in public transit rates in tract 51 with a rate of 7.6%. Tracts 46.01 and 47 have the most people taking public transportation to work, with estimates of 17.6% and 10.6%, respectively. Figures for walking and biking are even lower, though the former is slightly more popular than the latter. Rates for walking range from 0% 7.4% while rates for biking range from 0% to 2%. Interestingly, census tract 45 is the only one to have rates of 0% for both walking and biking, and it is also the tract that contains the project site. If the site were to be preserved and developed into a trail, these figures may increase due to better connectivity. Though not as many people rely on public transportation compared to personal vehicles, this would likely change if Buffalo’s public transit system were to be improved. It is important to have an effective public transit system to serve those who rely on it, but it may not be sufficient enough for those who do need it. Nearly 56,700 households in Erie County do not own a car. Not only are 67% of these households low-income, but also 2,000 of them are not located in an area with easy access to transportation. There is also a large difference when it comes to race and who is using this public transport. For workers earning between $35,000 and $65,000, 21% of workers of color use public transport compared to 3% of white workers. When comparing workers earning between $15,000 and $35,000, 29% of workers of color use it while 7% of white workers use it. For workers who earn less than $15,000 per year, 51% of workers of color use public transportation while only 8% of white workers use it. As annual wages decrease, the gap between the number of workers of color versus white workers utilizing public transportation grows exponentially. It is clear the city of Buffalo is largely dependent on single-occupancy vehicles, but there is still a sizeable portion of people who utilize non-motorized forms of transportation such as walking and biking. There is also a significant number of people who use more environmentally friendly motorized modes of transit such as public transportation and carpooling. Having more trails and greenspaces available may encourage people to use cars less, and perhaps more people would walk or bike to work.24
24 Commuting Characteristics By Sex, Census Tracts 45, 46.01, 47, 48, 51, 80.02, 80.03. ACS 2019 (5-Year Estimates). United States Census Bureau. (2019). https://data.census.gov/cedsci/table?g=1400000US36029004500,36029004601,360290047 00,36029004800,36029005100,36029008002,36029008003&tid=ACSST5Y2019.S0801&moe=false.
04
FINDINGS & FIELDWORK