The Carolina Planning Journal is the annual, student-run journal of the Department of City and Regional Planning at the University of North Carolina at Chapel Hill.
COPYRIGHT AND LICENSE
© Copyright 2025, Carolina Planning Journal. This work is licensed under a Creative Commons AttributionNon-Commercial-ShareAlike 4.0 International License.
PRINTING
A Better Image Printing Durham, North Carolina
ACKNOWLEDGEMENTS
Funding for this publication was generously provided by the Nancy Grden Graduate Student Excellence Fund, which supports graduate students working directly with the department’s Carolina Planning Journal, the John A. Parker Endowment Fund, and the North Carolina Chapter of the American Planning Association, and by our subscribers.
CAROLINA PLANNING JOURNAL
Department of City and Regional Planning
University of North Carolina at Chapel Hill
CB #3140, New East Building Chapel Hill, NC 27599-3140 USA
EDITOR-IN-CHIEF
Samantha Pace
EDITORIAL BOARD
Joe Wilson
Candela Cerpa
Noah Ellington
Nicki Harris
Benjamin Jacobs
Mohammad Haider
Kamaruzzaman
Helen Klass-Warch
Jo (Joungwon) Kwon
Annie Oommen
Jazmine Pritchett
Aditya Roy
Josh Salzburg
Sarah Slay
Joseph Womble
CONTRIBUTORS
Alejandro Cotté Alsina
Kristi Brantley
Sofia Cardamone
Candela Cerpa
Zhiyuan Chen
Audrey Compiano
Lee Corum
Jackson Dille
Emily Ensminger
Lyndsay Gavin
Anya Grahn
Nancy Grden
Sylvie Guezeon
Andrew Holland
Renata Pouton Kamakura
carolinaplanningjournal@gmail.com
www.carolinaangles.com
Anna Lynch
Jim Miller
Samantha Niven
Erick Peña
Tony Perez
Aaron Sinclair
Nea Strawn
Roger Waldon
Joseph Womble
Lizbeth Woodby
SPECIAL THANKS
The Carolina Planning Journal would like to thank the North Carolina Chapter of the American Planning Association; DCRP
Chair Todd BenDor; DCRP staff members Diana Devereaux, Elle Hughes, Sandra Lazo de la Vega, and Sarah Ward; and, of course, all of our subscribers. COVER PHOTOGRAPHER
Jo (Joungwon) Kwon
The University of North Carolina at Chapel Hill
Department of City + Regional Planning
To George Hemmens, the chair of UNC’s City and Regional Planning Department from 1974-1978, for his unwaivering support of this journal’s launch, 50 years ago.
Jackson Dille, Emily Ensminger, and Lizbeth Woodby
FORM-BASED
Zhiyuan Chen and Aaron Sinclair
REDEVELOPING
Sofia Cardamone, Nea Strawn, and Audrey Compiano
REFLECTIONS: 50 YEARS OF CAROLINA PLANNING
Kristi Brantley and Anya Grahn-Federmack
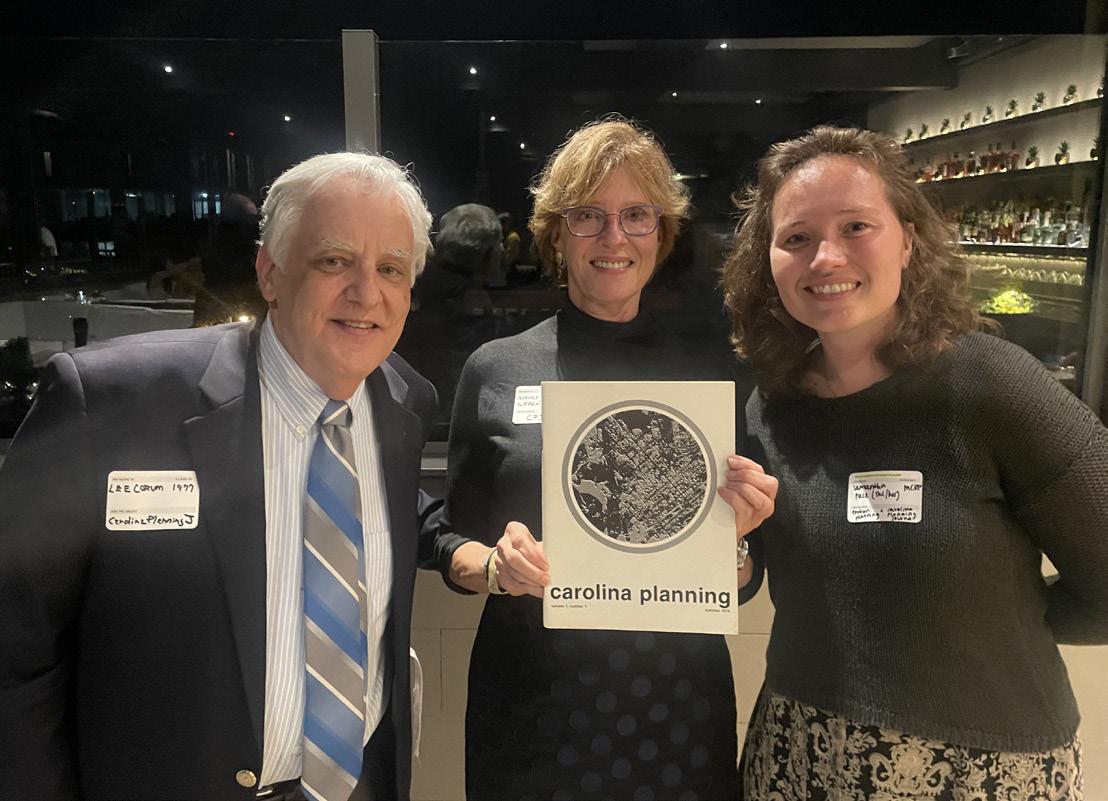
Nancy Grden, Jim Miller, and Lee Corum FORM-BASED
STUDENT WORK
FROM THE EDITOR
SAMANTHA PACE is the Editor-in-Chief of the Carolina Planning Journal. Samantha is a third year dual master’s student in City and Regional Planning at UNC Chapel Hill and Environmental Management at Duke. After receiving her undergraduate degree in Industrial Design from North Carolina State University, she worked at a sustainable building materials start-up in Research Triangle Park. She is passionate about resilience planning, urban design, and sustainable infrastructure.
DEAR READERS,
This year marks a momentous occasion as the Carolina Planning Journal (CPJ), the oldest student-run planning publication in the nation, celebrates its 50th anniversary. We are excited to celebrate this milestone with you, the CPJ community, through this volume.
Volume 50 offers several featured articles investigating the theme of Design in Planning and the Environment, a collection of student work showcasing place-based planning and urban design, Reflections on 50 Years, an interview with the founders of CPJ, and concludes with highlights from the UNC Chapel Hill Department of City and Regional Planning (DCRP), the next NC-APA Conference, and the Volume 51 Call for Papers.
Authors of the featured articles explore design as a topic or framework within planning and the environment. The disciplines of design and planning are intertwined through their overlapping impacts and focus on urban form and the environment - built and natural - as well as their approaches to address challenges. The strategies we use to define, design, and plan for the challenges we face, ultimately shape the world we inhabit and ourselves. These papers demonstrate how a design amplifies the values of its designers, and how who is impacted is often not who is empowered in the design process. The design lens makes space for both critique and creativity, helping us to begin to imagine the path between what is and what could be.
In “Designing Living Things,” Candela Cerpa and Dr. Renata Poulton Kamakura explores the relationship of humans and non-human species in our cities. Examining nature-based solutions and green/blue infrastructure, they argue that these frameworks generally center on the utility of non-human species for human interests and overlook the agency of non-humans. They offer ideas of how we can better design spaces for non-humans’ agency to co-exist with human interests, drawing on case studies in Colombia and Hawai’i.
In “Reimagining Paper Streets in Durham,” Andrew Holland, Lyndsay Gavin, and Erick Peña discuss how the City of Durham has approached tapping into the potential of paper streets, roads that were planned but never constructed, as opportunities to support community needs. They demonstrate how redesigning these spaces intertwines with community empowerment, city staff and leadership, and existing and potential policies.
In “The Cost of a Degree,” Samantha Niven argues that universities often fail to build meaningful relationships with the neighboring local communities, leading to their exclusion from the university’s design and planning decisions. Samantha evaluates key moments of growth in two mid-Atlantic universities, discerning circumstances in which communities experienced displacement and harm, or collaboration and inclusion.
In “It’s (50 Years) Time to See the (In)visible,” Sylvie Guezeon investigates the absence of university students’ participation in the design process of campus transportation through firsthand research at the University of Minnesota TwinCities. Through a participatory development process, she offers a pilot transit ambassadors program addressing this gap, building capacity for student riders to co-design the transportation system, making the process more engaged and inclusive.
In “Principles to Design a Successful Bike Share Network in a Small or Medium City,” Joseph Womble evaluates bike share systems located in Chattanooga, TN, Aspen, CO, and Pittsburgh, PA, synthesizing insights for how to design bike share systems for municipalities with less than 500,000 residents.
In “How the Sprawling Designs of Today’s School Carpool Lines Make Traffic Worse,” Anna Lynch applies the idea of induced demand to the lengthening carpool lines in the design of schools. She asserts that lengthening carpool lines is not easing the congestion, as it was designed to do, and continues to create negative impacts for students and parents. Drawing this observation to our attention, she assesses school transportation alternatives, providing healthier and safer options.
In “El Transporte Colectivo,” Alejandro Cotté Alsina presents his findings on the perception of poverty among public transportation users in San Juan, Puerto Rico after the Integrated Transportation Authority made services free in March 2024. Transportation systems and development policies in the area have reduced the contact zones of social classes, and a substantial increase in users of the free public transportation created a new opportunity for social classes to engage with each other. Alejandro proposes that designing public transportation as spaces of engagement between social classes can reshape how residents view poverty in Puerto Rico.
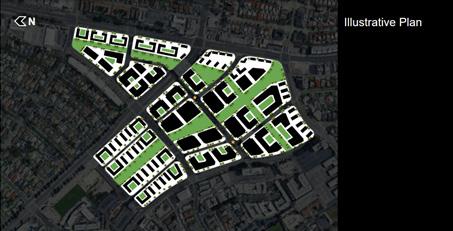
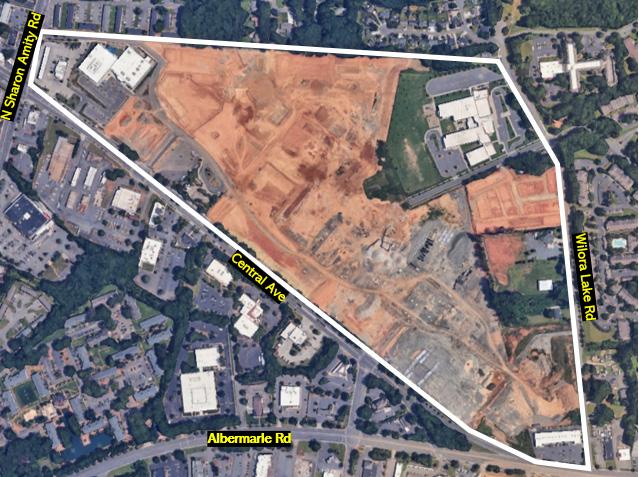
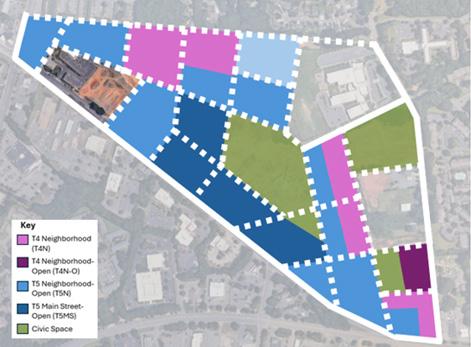
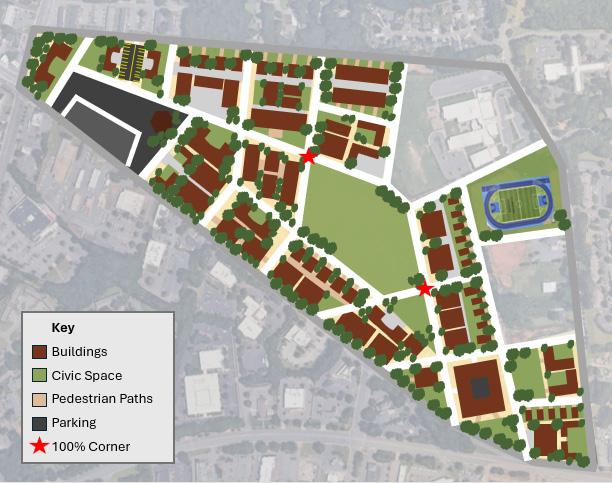
Turning now to the Place-Based Planning and Urban Design section, we feature the work of three student teams applying place-based planning tools and urban design frameworks on selected sites across the country in a new class taught by Tony Perez of Opticos Design.
We bring you a special section in this volume, Reflections: 50 Years of Carolina Planning, for which we asked contributors to be in conversation with CPJ’s history and its previous articles. In “Evolving Perspectives in Historic Preservation: A 35-Year Reflection,” Kristi Brantley and Anya Grahn-Federmack engage with ideas from Robert Stipe’s 1989 piece on historic preservation from CPJ Volume 15.1, providing a modern perspective and weaving together key developments on the topic. In “What it Meant for Me, and the Planning Practice,” Roger Waldon reflects on the role of UNC’s Department of City and Regional Planning and CPJ in his 50 years in the planning field. This section concludes with an interview with the founders of CPJ – Nancy Grden, Jim Miller, and Lee Corum – who recount the beginning of the journal, how it has changed over time, and their hopes for the future. As we celebrate this milestone, we aim to honor our history. In so doing, this volume is dedicated to George Hemmens (1932-2024), the chair of DCRP in the 1970s, whose invaluable support helped to bring the journal to life.
To conclude Volume 50, we celebrate the achievements of DCRP and look to the upcoming join NC-APA/SCAPA Conference and Volume 51. Online, you can dive deeper with our Angles blog, managed this year by Joe Wilson. Thank you for reading, and thank you to our authors and editors for all their efforts to make this possible. Here’s to many more years of the Carolina Planning Journal.
Warmly, Samantha Pace
EDITORIAL BOARD
The following people are integral to the success of the Journal and its online platform, CarolinaAngles.com:
SAMANTHA PACE / CPJ Editor-in-Chief
Samantha (she/her) is a third year dual master’s student in City and Regional Planning at UNC Chapel Hill and Environmental Management at Duke. After receiving her undergraduate degree in Industrial Design from North Carolina State University, she worked at a sustainable building materials start-up in Research Triangle Park. She is passionate about resilience planning, urban design, and sustainable infrastructure.
JOE WILSON / Angles Managing Editor
Joe is a second year master’s student in City and Regional Planning specializing in housing and community developoment. His research interests include community stability, access to social services, and the development of social capital in neighborhood contexts. His master’s project, The Functions of Neighborhood Schools, examines the intersections between educational policy and city planning.
CANDELA CERPA / Editor & Writer
Candela is a third-year dual master’s student in City and Regional Planning at UNC-Chapel Hill and Environmental Management at Duke University. She is interested in equitable natural hazards planning and urbanism in the Global South. Born and raised in Uruguay, she received her B.S. in Environmental Science and Policy from the University of Maryland, College Park. Outside of work and school, she enjoys learning new recipes, listening to audiobooks, and fostering cats.
NOAH ELLINGTON / Editor
Noah Ellington is a dual MPA/MCRP student at UNCChapel Hill, focusing on local government, housing, and community development. He works on the NC Benchmarking Project and is passionate about using data and public engagement to improve municipal services. Originally from North Carolina, Noah enjoys live music, running, and exploring small towns across the state.
NICKI HARRIS / Editor
Nicki is a master’s student in City and Regional Planning at UNC-Chapel Hill. She is interested in housing policy and financing tools. Prior to graduate school, Nicki worked at a nonprofit affordable housing developer in DC. She is a graduate of Carleton College.
BEN JACOBS / Editor
Ben is a first-year in the City and Regional Planning at UNC Chapel Hill. He is interested in active transportation planning, emergency service transportation planning, and creating safe and effective multi-modal networks. Outside of class, he enjoys playing music with friends, spending time with family, and hanging out with his dog, Willow.
MOHAMMAD HAIDER KAMRUZZAMAN / Editor
Haider is a PhD student in City and Regional Planning at UNC Chapel Hill. He is particularly interested in how data-driven methods can support sustainable transportation planning. His work aims to inform policies that promote equity, accessibility, and environmental sustainability in urban mobility. He is passionate about integrating advanced modeling tools with real-world transportation challenges.
HELEN KLASS-WARCH / Editor
Helen Klass-Warch is a second-year master’s student in the Department of City and Regional Planning at UNCChapel Hill specializing in Transportation and Natural Hazards Planning. She has worked for the Coastal Resilience Center under Dr. Miyuki Hino studying and cleaning datasets related to equity in public funding programs for flooding mitigation in North Carolina. Last summer she lived in Merida, Mexico, researching how flooding affects people’s mobility during Merida’s annual rainy season, studying behavior response, and governance issues. Helen was born and raised in Saint Paul, Minnesota and holds a BA from Wesleyan University in biology and history.
JO (JOUNGWON) KWON / Editor
Jo (Joungwon) Kwon is graduating from the Department of City and Regional Planning with a PhD. Having been a part of CPJ since 2019, her research interests include visualizations and augmented reality (AR) in plans, urban informatics, and plan evaluation. With a background of Statistics and English Literature, she received her MA in Computational Media at Duke University. Outside of her planning expertise, Jo enjoys indie films, live performances, designing t-shirts, and a good cup of Joe.
ANNIE OOMMEN / Editor
A proud double Tar Heel, Annie is from the Triangle area in North Carolina. After completing her BA in Public Policy in 2020 from Carolina, she taught English in Nantes, France and worked in health policy in Washington, D.C. Annie’s research and professional interests include youth mobility, complete streets, and active transportation. She is passionate about leveraging the built environment to promote climate resiliency and social connectivity.
JAZMINE PRITCHETT / Editor
Jazmine is a dual maseter’s student in Environmental Management at Duke University and City and Regional Planning at UNC. Her academic interests include climate resilience, environmental justice, and the use of planning tools to support equitable adaptation in communities.
ADITYA ROY / Editor
Soon to be double Tar Heel with a passion in comprehensive long-range planning, sustainable development, and making the future more certain.
JOSH SALZBERG / Editor
Josh Salzberg (they/them) is a dual degree student in the UNC Chapel Hill Master of City & Regional Planning and Duke University Master of Environmental Management programs. They conduct research on the political economies of electric grid planning, natural hazard resilience, and multilateral planning. Josh is a graduate of Hampshire College.
SARAH SLAY / Editor
Sarah is a first-year dual master’s student with the UNC MCRP and Duke Master’s of Environmental Management. Her research interests include freshwater resource management and land use changes in urban environments. She’s thrilled to contribute to the 50th anniversary edition and hopes that CPJ will inspire planners for another 50 years.
JOSEPH WOMBLE / Editor & Writer
Joseph is a first-year student in the Master’s of City and Regional Planning program at UNC Chapel Hill. His studies focus on transportation systems and their intersections with housing and broader land use. Previously, he provided technical assistance to local governments seeking to advance clean energy and clean transportation goals.
DESIGNING LIVING THINGS
Human Relationships with Nature
CANDELA CERPA (SHE/HER/ELLA)
Candela is a third-year dual master’s student in City and Regional Planning at UNC Chapel Hill and Environmental Management at Duke University. She is interested in equitable natural hazards planning and urbanism in the Global South. Born and raised in Uruguay, she received her B.S. in Environmental Science and Policy from the University of Maryland, College Park. Outside of work and school, she enjoys learning new recipes, listening to audiobooks, and fostering cats.
DR. RENATA POULTON KAMAKURA (THEY/THEM)
Renata is a 2024-25 National Academy of Sciences Science Policy Fellow at the Gulf of Mexico Coastal Ocean Observing System. They completed their Ph.D. in Ecology at Duke University in 2024 studying urban forest health and structure in Chicago, IL and Durham, NC. Their current work focuses on the impacts of marine heatwaves on coastal ecosystems, communities, and industries in the northern Gulf of Mexico region. Their hobbies include running, trying to learn how to watercolor, and exploring small museums or exhibits in local neighborhoods and libraries.
ABSTRACT
Cities house over half of the global human population and are home to a diversity of nonhuman species. In the ongoing climate crisis, there is increasing interest in ensuring urban areas are designed to survive increasing climate extremes while supporting conservation goals and limiting resource use. This urban resilience depends on our ability to plan for, and with, an increasingly volatile climate, historically degraded ecosystems, and non-human species surviving in increasingly fragmented habitats. Nature-based solutions (NbS) and Green/Blue infrastructure (GBI) are two examples of approaches that incorporate non-human entities as part of urban planning for more sustainable cities. However, these frameworks generally focus on the usefulness of and ability to control and shape non-humans for human needs. Human needs are important; however, this approach does not account for the challenges and opportunities that come from the agency of non-humans, like tree root network expansion, human-wildlife interactions, and changes in river courses. This paper investigates how NbS and GBI support (or not) the needs and interests of non-humans alongside humans. Then it describes some frameworks for how non-human needs and agency can be understood and incorporated into urban planning/design projects using both theoretical frameworks and practical case studies. The case studies highlight the opportunity to learn from a mix of Western and non-Western approaches both in the Global South (Barranquilla, Colombia) and Global North (O’ahu, Hawai’i). In doing so, we provide ideas for how, in designing more resilient cities, we can treat non-humans as active participants in healthy, thriving, urban communities.
INTRODUCTION
Cities are often seen as human realms, designed with humans primarily in mind. Yet a walk around a city quickly shows that they are home to more than just humans. Be it an ibis in Victoria, Australia, burrowing through trash in search of food, a troop of macaques in Shimla, India, stealing food at tourist sites, or mature oak trees pulling up sidewalks in Houston, U.S., nonhuman species are constantly interacting with humanbuilt infrastructure. Like people, non-humans seldom do what planners expect: they have agency. Ignoring non-human agency risks not just the consequences of unplanned interactions, like in the examples above, but also overlooks the potential benefits humans and nonhumans can derive from our cohabitation. To facilitate more beneficial and less tense interactions, our planning practices should account for both human and non-human agency in city design.
The literature on human-non-human relationships, especially in the context of conservation, has highlighted the challenge of non-human agency and its consequences for decades (Nyhus 2016; Soulsbury and White 2014). Beyond basic city functionality, our ability to coexist with non-humans is critical for human health and wellbeing (Elton 2021; Kirk, Pemberton, and Quick 2019; Soulsbury and White 2014; ‘Āina of Ka ‘ōnohi et al. 2023) as well as biodiversity conservation and ecosystem health (‘Āina of Ka ‘ōnohi et al. 2023; Nyhus 2016; Pineda-Pinto, Frantzeskaki, and Nygaard 2022). Simultaneously, humannon-human relationships can come with tensions, including inconveniences (like wildlife-caused littering), injustices (like inaccessible sidewalks due to root growth), and even death (like mountain lion attacks). These realities call for plans that are not naively optimistic about humannon-human interactions but recognize their importance all the same.
In response to the challenges of human-non-human interactions, some frameworks argue humans and nonhumans should be largely separated. For example, Wilson’s Half Earth theory (2016) argues that humans should be concentrated in cities to allow for large national parks and wildlife reserves that are ceded entirely to non-humans. More broadly, the term “nature” is sometimes used to
reference that which is separate from human influence, something “pristine” that humans would “ruin” (Nash 2014, Turner 2011, 27-8). Large areas with regulated human access do provide vital ecosystem services, including necessary habitat for some non-human species (Pfeifer et al. 2017, Gray et al. 2016). However, there is growing recognition that nature does (and should) exist in cities too.
In light of this shift, urban planning has increasingly recognized the importance of building with and alongside regional ecosystems (Frantzeskaki 2019; Pineda-Pinto, Frantzeskaki, and Nygaard 2022). Concepts like Naturebased Solutions (NbS) and Blue-Green Infrastructure (BGI) encourage incorporating nature/non-humans into urban systems to improve sustainability, cost-savings, and human health (Pineda-Pinto, Frantzeskaki, and Nygaard 2022; Ribbe et al. 2024; An et al. 2024). As we face climate and biodiversity crises, these approaches can play a key role in pushing for more sustainable and resilient cities.
In this article, we review NbS and BGI definitions to explore how non-humans’ agency and needs are or are not considered in these frameworks and more broadly in urban planning. Then, we look at two case studies, one in the Global North and one in the Global South, where human-non-human relationships have been incorporated into urban NbS/BGI projects. We thus hope to examine how common concepts like NbS and BGI can be strengthened by recognizing the need to foster human-non-human relationships and, in doing so, plan for non-human, as well as human, needs and agency.
NbS AND BGI: NON-HUMANS IN URBAN PLANNING
Since at least the late nineteenth century with the Garden City movement, urban planning in the Global North has sought to incorporate non-humans into city design to improve sustainability, cost-savings, and human health outcomes (Howard 2006). Two contemporary examples are NbS and BGI. NbS are interventions that seek to “protect, sustainably manage, and restore natural and artificial ecosystems” to address human social challenges and benefit humans and non-humans, such
as habitat protection and ecosystem restoration (Ribbe et al. 2024). BGI are combined networks of natural and designed landscape components that link hydrological functions (“blue infrastructure”) with vegetation systems (“green infrastructure”) to provide socioeconomic benefits, like retention ponds and rain gardens (Ribbe et al. 2024).
The literature on NbS and BGI has recently expanded to include discussions on justice and community codesign. In a review of urban NbS projects in Europe, for example, Frantzeskaki emphasizes how projects should be interdisciplinary, inclusive of diverse ways of knowing and perspectives, and responsive to residents’ needs (2019). Even neoliberal organizations, like the World Economic Forum (WEF), have begun proposing ideas that call for partnerships across local governments, the private sector, and civil society and emphasize the need to tackle inequality through NbS projects. The WEF’s “Nature-Positive Cities” report, for example, highlights both the need for partnership with businesses to adequately “catalyze investments” and stories of policymakers learning how to build resilient and livable cities directly from residents (An et al. 2024).
Despite the growing recognition that incorporating nonhuman elements into cities is important and requires attentiveness to justice, there is less clarity on how those calls for justice translate into human-non-human relationships. “BiodiverCities,” another WEF project, emphasizes that cities should “live in harmony with nature by 2030,” and has a call to “put nature first,” with NbS as the backbone (Khatri et al. 2022). Within a neoliberal, capitalist framework of “optimizing” and “maximizing” value, there is a recognition that humans have to live with nature, but human needs remain the metrics for success. In Frantzeskaki’s review, the need to control and manage the “green infrastructure” is clear starting from the first “lessons learned,” where they describe how designing projects to appear aesthetically pleasing and “natural” heavily influences their success (Frantzeskaki 2019). What it means to appear natural, and the irony of having to design non-humans to create that image, is not examined. This approach is not unique to this review, but was instead integral to, for example, the design work of Frederick Law Olmsted in projects like Central Park in New York City (Godoy 2023; McClelland 1993) and is ultimately the core method through which NbS and BGI are meant to improve human-centric outcomes (Ribbe et al. 2024). In a review of 121 NbS papers, Pineda-Pinto and colleagues
found that NbS approaches are primarily framed from a human-focused perspective, focusing on nature in terms of the services it provides to humans (2022).
BUILDING BRIDGES BETWEEN HUMANS AND NON-HUMANS
To build resilient relationships between humans and nonhumans, we must learn how to listen to non-humans and integrate their agency into decision-making and planning. Pineda-Pinto and colleagues argue for “ecological justice” an approach that develops relationships between ecosystems and humans that are resilient, rather than shaping ecosystems to provide for human resilience (2022). Their approach relies partly on science (especially ecological science) as a means to increase people’s awareness of their relationships with non-humans. They also detail various mechanisms of incorporating the agency of non-humans into planning, from participatory planning methods that include discussion of non-human needs and capabilities to identifying principles for human-nonhuman relationships (Pineda-Pinto et al., 2022). Sheikh and colleagues propose that digital technologies can integrate communication from non-human beings into smart urban governance (2021). They caution that it is not enough to monitor non-humans’ numbers and movement; we must learn how non-humans communicate and how they navigate urban landscapes (Sheikh et al. 2021). This includes finding and facilitating vital relationships between non-humans, like tree-fungi relationships, and learning how to balance human and non-human needs, like designing glass buildings to provide humans with natural light while reducing bird collisions. Taking it a step further, they highlight numerous examples drawn from Indigenous political systems that recognize non-human agency in governing lands and waters. For example, oral traditions within the Tlingit and Tagish First Nations convey the agency and role of glaciers in water governance while maintaining human knowledge of and respect for the glaciers. Perhaps most critically, they argue that
“a truly ‘smart’ urban governance should embrace the fact that humans, technology, and our political institutions do not have all the answers” (Sheikh et al. 2021).
As such, we need to shift away from a framework of complete understanding and control to one of relationshipbuilding and co-management.
RELATIONSHIP-BUILDING AS PLANNING IN PRACTICE
In this section, we present two cities exploring urban human-non-human relationships, one in the Global South and one in the Global North. The first community, Barranquilla, Colombia, presents a traditional example of an NbS/GBI project but shows how human residents are shifting their relationship to non-human life and ecosystem elements even under a neoliberal doctrine. The second community in O’ahu, Hawai’i, presents an Indigenous, non-Western approach to urban humannon-human relationships in the Global North.
BRINGING GREEN BACK: LESSONS FROM BARRANQUILLA, COLOMBIA
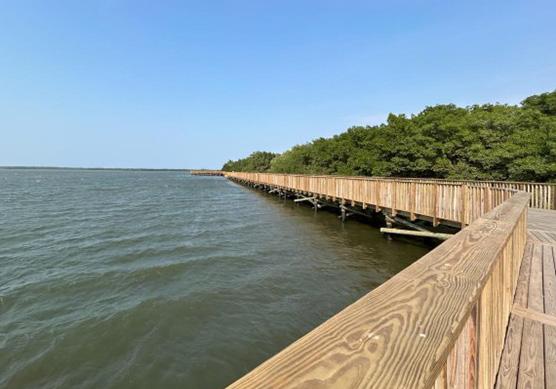
The Colombian city of Barranquilla is home to 1.2 million people (Swan 2023). In the past decade, the coastal city has been “shedding much of its industrialized past and seeking sustainable growth” (Swan 2023). In particular, the program “Todos Al Parque” has been making strides in increasing the space that vegetation, water, and wildlife have throughout the city. Beginning in 2011, Todos Al Parque has worked to restore blue-green spaces; so far, over sixteen million square feet of green spaces have been restored and designated as 300 urban parks (Alcaldía de Barranquilla 2024, Maassen 2022). This includes two BGI initiatives: Cíenaga de Mallorquín Park, with paths and bike lanes by wetlands and mangroves, and the Gran Malecón Riverwalk, with a 3.1-mile riverwalk by Colombia’s largest river, the Magdalena (Breathe Life 2022).
Todos Al Parque was created with community engagement, biodiversity protection, and social and spatial equity at its core. The initiative initially aimed to recover sixty parks for those who needed
it the most, which the city defined as young children, women, disabled people, and elderly residents in “a leading example of NbS” (Alcaldía de Barranquilla 2023a, Maassen 2022). The community gave recommendations, like the soccer pitch’s surface material, the size of playgrounds, and the inclusion of space for children’s programming. A symbolic signing ceremony, where residents “approved” the definitive version, was held before construction began at each park (Maassen 2022).
Todos Al Parque also created spaces where non-humans are the sole users, including four urban forests with 39.5 acres exclusively designated to grow 15,714 trees (Alcaldía de Barranquilla 2023b). Some of the twelve tree species planted include bonga (Ceiba pentandra), lluvia de oro (Laburnum anagyroides), ceiba blanca (Hura crepitans), caucho morado (Ficus elastica), alistonias (Alstonia scholaris), and mangle plateado (Conocarpus erectus; Alcaldía de Barranquilla 2023b). Cíenaga de Mallorquín Park recorded fifteen species of marine invertebrates, nine fish and amphibian species, seven reptile species, eighty-one bird species, and four mangrove trees (Alcaldía de Barranquilla 2023b). Ecological restoration efforts and social initiatives are likely to bring more species back to Barranquilla or create new habitats.
The reports focus on the human benefits of the NbS projects. For example, residents saw improved healthcare through pop-up vaccination sites, higher rates of recreation and socialization through sports programs, increased economic diversity through markets, and more (Breathe Life 2022). There are some brief mentions of improved water quality and the presence of vegetation and local and migratory birds, mainly from the perspective of birdwatching and the ecotourism they bring (Alcaldía de Barranquilla 2024). In 2023, for example, the City reported that more than ten million people visited the Gran Malecón Park for sport and recreation (Swan 2023). However, some of the quotes included in the articles offer insight into how these benefits are tied to residents’ views of the growing presence of nonhumans in the city.
Before the program, residents had an extremely negative perception of blue and green urban spaces, associating them with “drug dealing, crime, and neglect” (Maassen 2022) as well as pollution from decades of industrial development (Swan 2023). After the redevelopment, residents are expressing far more positive views. Barranquilla’s mayor from 2020 to 2023, Jaime Pumarejo, reflected that
“the [Magdalena] river is us. We exist because of it, but we forgot about it and turned away from it” (Swan 2023).
This quote is directly about a human-non-human relationship, seeing how ecological degradation can reflect worsening human conditions. About a lawsuit he filed against the federal government in 2022, alleging it was not doing enough to protect the river from pollution, Pumarejo said that “if we clean up the river, we’re cleaning up the country, bettering people’s quality of life and finding a place where we can unite” (Swan 2023). To heal that relationship, there are calls to “get people back to the river because it had become an industrial zone and we wanted to make them touch the river again, see it, feel it” (Swan 2023).
With the projects, there has also been a significant shift in the literal space that non-humans now use in Barranquilla. Today, 93 percent of households live within an eight-minute walk to a green, public space (Breathe Life 2022). This approach not only benefits more people while decreasing the need for transportation to those green spaces, but it also places urban nature as a neighbor rather than a faraway destination.
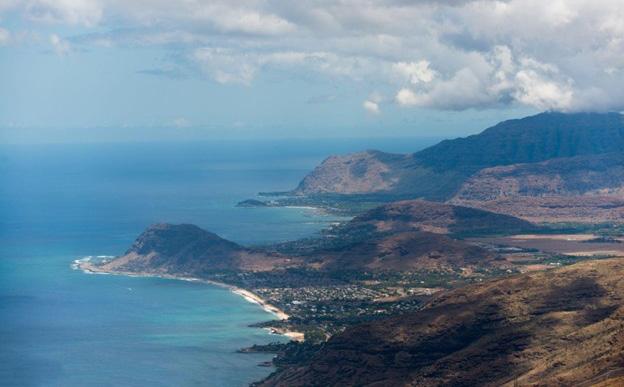
URBAN ‘ĀINA IN O’AHU, HAWAI’I: CITIES AS SOURCES OF SACRED RELATIONSHIPS
‘Āina of Ka ‘ōnohi and colleagues offer urban ‘Āina in O’ahu in Hawai’i as an example of urban landscape engagement that emphasizes human-non-human relationships by drawing on Native Hawaiian practice and knowledge (2023). ‘Āina, a foundational Hawaiian concept, encompasses physical, psychological, and spiritual dimensions that describe relationships between people, homelands, identity, god/goddess, and family. In this framework, “humans are kin to all that is the universe.” Urban ‘Āina then, despite the colonial realities of urban landscapes in Hawai’i, defines urban areas as a “source of sacred relationships among humans, land, water, sky, and ancestors” (‘Āina of Ka ‘ōnohi et al. 2023). The paper and the case studies (offerings) presented are an opportunity to (re)create relationships in urban Hawai’i. Cities are not described as human-centered but, instead, a shared space of kinship.
We here focus on one of their case studies, a restoration at the edge of a residential area in the Wai’anae mountain range. Following expert guidance, stewards from the Mālama Learning Center initially planted trees ten feet apart with shrubs between the trees and ground cover throughout at the Pālehua dryland forest restoration site (‘Āina of Ka ‘ōnohi et al. 2023). This approach aims to reduce competition and thus allow the trees to grow. Instead, stewards found high rates of tree mortality and low plant health. In response, they tried a different approach. In “community-style” planting, native species are planted in high density in a newly cleared area, a more energy-intensive approach that is restricted to a smaller area. However, by listening to what the plants were telling them and changing their planting practices, they found that the plant communities flourished, facilitating each other’s growth (‘Āina of Ka ‘ōnohi et al. 2023; Mālama Learning Center 2024). In line with Mālama Learning Center goals, the crews who listened and learned from the plants were primarily nearby residents and students. The Center aims to support local communities in “understand[ing] the significance of the resources of this area [...] and feel a sense of belonging as well as kuleana [responsibility, privilege] to care for their home” (‘Āina of Ka ‘ōnohi et al. 2023; Mālama Learning
Center 2024). This case exemplifies how urban greening initiatives can build relationships with both human and non-human kin and foster a practice of listening to what non-humans (in this case, plants) are telling us. More broadly, urban greening projects that include residents in the process and encourage them to look for signs of stress or thriving in nearby plant (or other non-human) life can serve as both an opportunity for relationship-building and as a monitoring and alert system to encourage adjustments in management approaches. It requires both the opportunity for residents to engage in the project work and an openness from project managers to try alternative approaches that might better suit the local project context (e.g. “community-style” planting).
Both this project and the other offerings in the paper talk about relationship building as essential to the health of both human and non-human communities. Human benefits of the urban ‘Āina projects include food access and
the preservation of traditional foodways, spiritual and cultural reconnection with ‘Āina, and various ecosystem services vital to human health and well-being. Some of the projects emphasize the agency of non-humans more than others. However, all provide concrete examples of how to rehabilitate human-non-human relationships and how that supports human community well-being.
Drawn from Native Hawaiian theory and practice, the Urban ‘Āina case studies are deeply place-based (or, more accurately, ‘āina-based) and built from the knowledge and traditions of communities with longstanding relationships to the non-humans in O’ahu. Even the structure of the paper emphasizes the importance of relationships, opening and closing with ceremony.
While applying a specifically Native Hawaiian approach to other contexts would not be appropriate, these offerings highlight that there is a diversity of nonWestern practices, traditions, and ways of knowing that
guide how to rehabilitate human-non-human relationships, even within the settler colonial context of the United States. For urban NbS or BGI, a more pluralistic approach that recognizes the power of local knowledge and traditions would require planners to cede some power to local communities (particularly Indigenous communities) that have long-standing relationships to place. Collaborative projects can draw from both Western understandings of technology and engineering and place-based (often non-Western) understandings of ecology, history, and relationships. Such a pluralistic approach can use a variety of tools and practices to first understand/see/hear and then account for the needs and agency of non-humans.
CONCLUSION: CITIES OF THE FUTURE
If trends continue, future cities will incorporate nature (whether through NbS or GBI) into their design. How this is done, and whether non-human as well as human needs and agency are considered, is yet to be seen. This piece considers some of the ongoing discussions about how urban planning can create spaces where humans and nonhumans can coexist and, ideally, build generative and healthy relationships. NbS and GBI provide opportunities to bring non-humans more fully into urban spaces, though they often imply the need to control non-humans to do so. Frameworks related to ecological justice push planners to move beyond controlling non-humans for human needs and instead plan for the needs and interests of both humans and non-humans. Digital technologies can provide some tools that facilitate our ability to listen to and adjust for non-human needs, but technology alone cannot replace the need for healthy human-non-human relationships. Our case studies highlight that, both within the Global South and Global North there are both Western and non-Western approaches, traditions, tools, and knowledge that can foster human-non-human relationships and inform planning approaches. Because of our limited scope, we only focus on two theoretical approaches and two case studies. We offer this paper as part of the conversation on how to consider human-nonhuman relationships in urban planning, especially in the context of NbS and GBI. We hope readers are encouraged to explore local possibilities alongside their human and non-human neighbors.
WORKS CITED
‘Āina of Ka‘ōnohi, Anthony K. Deluze, Kamuela Enos, Kialoa Mossman, Indrajit Gunasekera, Danielle Espiritu, Chelsey Jay, et al. 2023. “Urban ʻĀina: An Indigenous, Biocultural Pathway to Transforming Urban Spaces.” Sustainability (Switzerland) 15 (13). https://doi.org/10.3390/ su15139937
Alcaldía de Barranquilla. “El modelo de gobernanza para la sostenibilidad que Barranquilla destacó en la COP16.” October 29, 2024. Accessed January 1, 2025. https:// www.barranquilla.gov.co/mi-barranquilla/modelo-degobernanza-sostenibilidad-cop16
Alcaldía de Barranquilla. “Barranquilla, ejemplo latinoamericano en soluciones basadas en la naturaleza.” July 28, 2023a. Accessed January 1, 2025. https://www. barranquilla.gov.co/mi-barranquilla/barranquillaejemplo-latinoamericano-en-soluciones-basadas-enla-naturaleza
Alcaldía de Barranquilla. “Barranquilla, una ciudad verde que no para de crecer.” December 11, 2023b. Accessed February 16, 2025. https://www.barranquilla.gov.co/ mi-barranquilla/barranquilla-una-ciudad-verde-queno-para-de-crecer
An, Esther, London Breed, Arjun Dhawan, Nollaig Forrest, Yoo Jeong-Bok, Cha-ly Koh, Marie Lam-Frendo, et al. 2024. “Nature Positive: Leaders’ Insights for the Transition in Cities.” https://www.weforum.org/publications/naturepositive-leaders-insights-for-the-transition-in-cities/
Breathe Life. “Barranquilla’s Thriving Green and Blue spaces: Successes in Urban Planning.” September 12, 2022. Accessed January 1, 2025. https://breathelife2030. org/news/barranquillas-thriving-green-blue-spaces/ Elton, Sarah. 2021. “Relational Health: Theorizing Plants as Health-Supporting Actors.” Social Science and Medicine 281: 114083. https://doi.org/10.1016/j.socscimed.2021.114083
Frantzeskaki, Niki. 2019. “Seven Lessons for Planning Nature-Based Solutions in Cities.” Environmental Science and Policy 93: 101–11. https://doi.org/10.1016/j. envsci.2018.12.033
Godoy, Eric S. 2023. “Every Tree Fixed with a Purpose: Contesting Value in Olmsted’s Parks.” Environmental Values 33 (5): 511–28. https://doi. org/10.1177/09632719231220425
Gray, Claudia L, Samantha L L Hill, Tim Newbold, Lawrence N Hudson, Luca Börger, Sara Contu, Andrew J Hoskins, Simon Ferrier, Andy Purvis, and Jörn P W Scharlemann. 2016. “Local Biodiversity Is Higher inside than Outside Terrestrial Protected Areas Worldwide.” Nature Communications 7 (1): 12306. https://doi. org/10.1038/ncomms12306
Howard, Ebenezer. Garden Cities of To-Morrow, ed. F.J. Osborn. London: Routledge, 2006. https://doi. org/10.4324/9780203716779
Khatri, Akanksha, DIego Bustamante, Marina Ruta, Cristina Gómez Garcia-Reyes, Fraser Thompson, Shivin Kohli, Heleni Pantelidou, Matthew Free, Giacomo Magnani, and Stephanie Schemel. 2022. “BiodiverCities by 2030: Transforming Cities’ Relationship with Nature.”
Kirk, Robert G W, Neil Pemberton, and Tom Quick. 2019. “Being Well Together? Promoting Health and WellBeing through More than Human Collaboration and Companionship.” Medical Humanities 45 (1): 75. https:// doi.org/10.1136/medhum-2018-011601
Maassen, Anne. “In Barranquilla, Colombia, Urban Parks Revitalize a Declining City.” World Resource Institute. December 7, 2022. Accessed January 1, 2025. https://www. wri.org/insights/barranquilla-colombia-urban-parksrevitalize-declining-city
Mālama Learning Center. 2024. “Palehua Erosion Control and Restoration.” 2024. https://www. malamalearningcenter.org/p257lehua-erosion-control-restoration.html
McClelland, Linda Flint. Presenting Nature: The Historic Landscape Design of the National Park Service, 1916 to 1942. United States: U.S. Department of the Interior, National Park Service, Cultural Resources, Interagency Resources Division, National Register of Historic Places, 1993.
Nash, Roderick. Wilderness and the American Mind: Fifth Edition. United Kingdom: Yale University Press, 2014.
Nyhus, Philip J. 2016. “Human–Wildlife Conflict and Coexistence.” Annual Review of Environment and Resources 41 (Volume 41, 2016): 143–71. https://doi. org/10.1146/annurev-environ-110615-085634
Pfeifer, M, V Lefebvre, C A Peres, C Banks-Leite, O R Wearn, C J Marsh, S H M Butchart, et al. 2017. “Creation of Forest Edges Has a Global Impact on Forest Vertebrates.” Nature 551 (7679): 187–91. https://doi.org/10.1038/ nature24457
Pineda-Pinto, Melissa, Niki Frantzeskaki, and Christian A. Nygaard. “The Potential of Nature-Based Solutions to Deliver Ecologically Just Cities: Lessons for Research and Urban Planning from a Systematic Literature Review.” Ambio 51, no. 1 (April 16, 2021): 167–82. https:// doi.org/10.1007/s13280-021-01553-7
Ribbe, Lars, Greta Dekker, and Gaurav Thapak. 2024. “Chapter 6 - Urban Wetlands and Water Bodies.” In Managing Urban Rivers, edited by Victor R Shinde, Rajiv Ranjan Mishra, Uday Bhonde, and Hitesh Vaidya, 91–107. Elsevier. https://doi.org/10.1016/B978-0-32385703-1.00007-9
Sheikh, Hira, Peta Mitchell, and Marcus Foth. 2023. “More-than-Human Smart Urban Governance: A Research Agenda.” Digital Geography and Society 4: 100045. https://doi.org/10.1016/j.diggeo.2022.100045
Soulsbury, Carl D, and Piran C L White. 2016. “Human–Wildlife Interactions in Urban Areas: A Review of Conflicts, Benefits and Opportunities.” Wildlife Research 42 (7): 541–53. https://doi.org/10.1071/WR14229
Swan, Esan. “Barranquilla shakes off industrial past in bid to protect biodiversity.” Financial Times. May 16, 2023. Accessed January 1, 2025. https://www-ft-com. ezp-prod1.hul.harvard.edu/content/a745faac-5c1d-44e1ab43-a69119151ad3
Turner, Matthew D. 2011. “Production of Environmental Knowledge - Introduction.” In Knowing Nature: Conversations at the Intersection of Political Ecology and Science Studies, edited by Mara J. Goldman, Paul Nadasdy, and Matthew D. Turner, 25–31. United Kingdom: University of Chicago Press.
Wilson, Edward O.. Half-Earth: Our Planet’s Fight for Life. United States: Liveright, 2016
REIMAGINING PAPER STREETS IN DURHAM
Unlocking Urban Potential Through Collaboration and Community Engagement
ANDREW HOLLAND
Andrew Holland serves as Assistant Director for the Budget and Management Services Department and Director of Performance and Innovation with the City of Durham. He leads the Office of Performance and Innovation, which includes the City’s Innovation Team (I Team), Strategy and Performance, Participatory Budgeting, and the American Rescue Plan Act (ARPA) program. He and his team focus on improving outcomes by working collaboratively with staff, residents, local businesses, and partner organizations. Previously, Andrew served as Assistant to the County Manager in Mecklenburg County, where he led the Enterprise Risk Management and Compliance program. He also worked as Assistant to the City Manager in Fayetteville, a Business Analyst in Durham’s Fleet Management Department, and as an Environmental Protection Specialist with the U.S. Environmental Protection Agency in Washington, D.C. Andrew holds a Master of Public Administration from North Carolina Central University and a Bachelor of Science in Urban and Regional Planning from East Carolina University. He is currently pursuing a Doctor of Design at North Carolina State University’s College of Design. His research explores the use of immersive tools to support participatory design processes, particularly in reimagining paper streets as vibrant, community-centered public spaces.
LYNDSAY GAVIN
Lyndsay manages the City of Durham I-Team, where she works to bridge the gap between research and public services. Previously, she was a senior behavioral scientist at the Center for Advanced Hindsight, where she used applied research to bring behavioral insights to public policy. Lyndsay previously studied the health impacts of climate change for the California EPA Office of Environmental Health Hazard Assessment and worked as an Environmental Engineer for an oil company before discovering a passion for local government, à la Leslie Knope. She holds an MPH from Yale and a BS in Biological Engineering from the University of Wisconsin. hobbies include running, trying to learn how to watercolor, and exploring small museums or exhibits in local neighborhoods and libraries.
ERICK PEÑA
Erick Peña is a local government employee and proud Durham native. He has a Bachelor’s in Communications from UNC Charlotte and a Master’s in Public Administration from Villanova University. Erick’s work is focused on improving resident-municipal interactions and outcomes through human centered design and user experience.
ACKNOWLEDGEMENTS: Melissa Amoabeng
INTRODUCTION
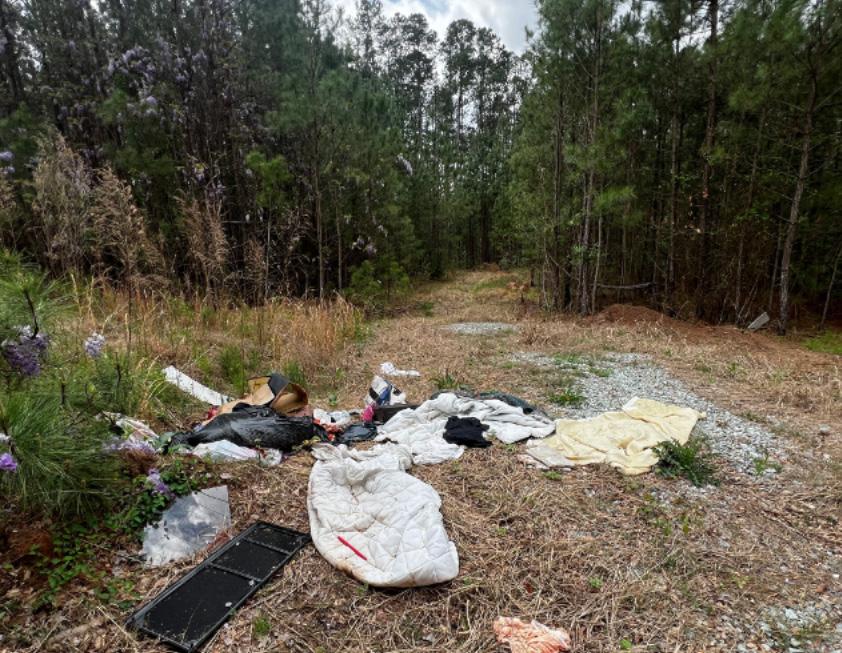
Paper streets are roads that were planned but never built. These unused spaces could potentially help solve important problems in cities. These neglected areas often contribute to issues such as littering, illegal dumping, and the lack of accessible green spaces. However, they also offer opportunities for diverse uses, including recreational spaces, ecological restoration, walkable pathways, and even affordable housing. As city planners and officials increasingly seek innovative solutions for neglected land, Durham’s approach emphasizing communityled design and sustainable development serves as a framework for transforming these spaces into community assets, especially for marginalized neighborhoods that have experienced disinvestment. This article explores Durham’s efforts to reimagine paper streets through interdepartmental collaboration, community engagement, and design innovation. It also outlines the challenges, potential use cases, and potential policy implications tied to the inclusive transformation of these neglected urban spaces.
In 2023, to better understand the scale and complexity of the issues tied to paper streets, the Durham’s Innovation Team (I-Team) initiated a collaboration with the Code Enforcement team to learn how these spaces impact their daily operations. These discussions helped clarify the physical and geographic nature of paper streets and the illegal activities that frequently occur there, including littering and illegal dumping. Based on these conversations, the I-Team recognized that enforcement alone may not be a sustainable solution. However, there is potential to deter such activity through thoughtful interventions. One promising approach is to reimagine, repurpose, and redesign select paper streets in ways that reflect community needs and values - transforming them into safe, usable spaces that discourage misuse and strengthen neighborhood identity.
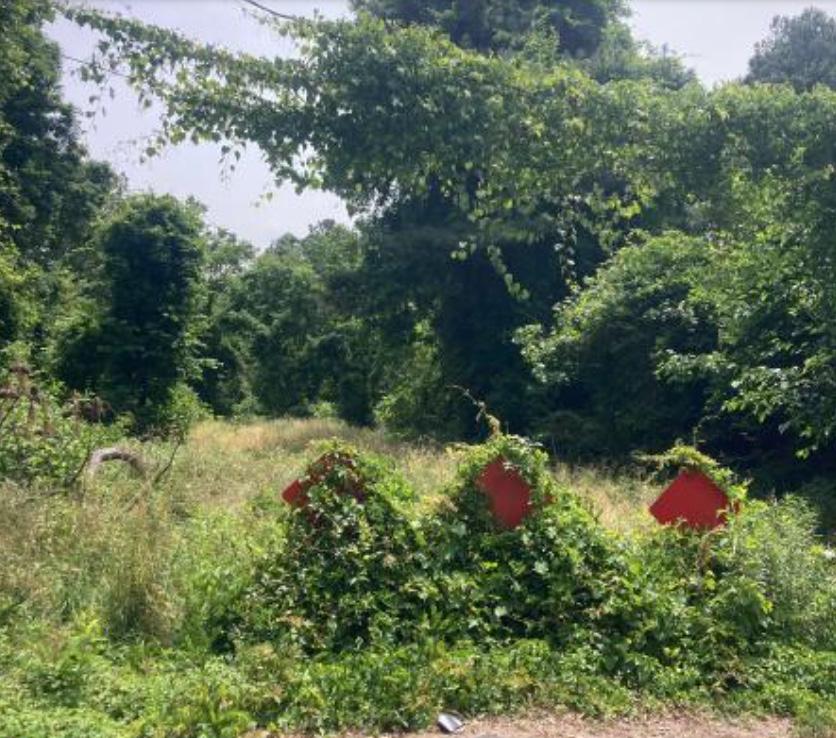
“Paper streets” are designated on city maps but remain undeveloped, leading to their frequent misuse for littering, dumping, loitering, and the presence of invasive vegetation. Such activities place a significant strain on the City’s Code Enforcement and Impact Team, as these areas fall outside the city’s maintenance obligations.
Paper streets often lack official ownership which creates legal ambiguity and complexity, making conversion efforts costly and time-consuming. Consequently, many governments view these areas as challenges not worth addressing.
Despite these hurdles, paper streets hold untapped potential. Some serve practical purposes such as informal walkways or community cut-throughs. Durham alone has over 600 paper streets with approximately 600 located within city limits, amounting to over 200 acres of unused space. This amount of acreage is equivalent to thirty times the size of Durham Central Park.
Recognizing this potential, the I-Team partnered with other city departments to implement innovative strategies to shift perspectives on paper streets. The work focuses on transforming these neglected spaces into valuable community assets, fostering equitable development and revitalization in underserved neighborhoods. Through initiatives like the Love Your Block grant and community cleanups, Durham is pioneering a model for how cities can reimagine and repurpose underutilized urban spaces for the greater good.
LITERATURE REVIEW
To better understand the intricacies of paper streets, the I-Team reviewed existing literature about paper streets. The research centered around how local municipalities have approached paper streets, both in terms of the legal ramifications and creative applications of the spaces. Currently, there is little literature on the state of paper streets in North Carolina. The North Carolina state legal code provides a definition of paper streets but offers little guidance on how to deal with them (N.C. Gen. Stat. § 136-96. 2001). North Carolina law firms have documented how to apply the state statute, both through private and governmental closings, but there are few publicly available examples of closures (Bennington 2001).
Many documented instances of city intervention in paper streets arise from legal disputes and complaints from residents. The ambiguous legal definition of paper streets often leads to confusion and debate over responsibility
for the spaces, particularly among property owners whose lots abut them (Simms 2022). Issues surrounding paper streets vary in severity and scope, sometimes involving entire neighborhoods, city councils, and developers (Shorey 2020; Bouchard 2017). Legal implications remain unresolved due to the lack of solid precedents, creating challenges for residents and developers alike.
Most city interventions involve vacating the disputed area, allowing adjoining property owners to absorb the land (Bellano 2016). Some cities have abandoned undeveloped portions of streets and added them to adjacent nature preserves, while others have repurposed them for pedestrian and bicycle pathways (Brashares et al. 2015; City of Falls
Church n.d.). Although some cities have transformed unaccepted or undeveloped streets into street parks or general green spaces, research suggests these instances are rare.
PROJECT GOAL AND EXECUTION
To effectively address the challenges and opportunities presented by paper streets, the I-Team recognized the need to collaborate with experts who had deeper knowledge and experience in this area. Understanding that these spaces intersect multiple city functions, the I-Team conducted a series of interviews with internal departments, including the General Services Real Estate
Division, the City Attorney’s office, Neighborhood Improvement Services, Planning, Parks and Rec, and Transportation, to assess the complexities.
Through these discussions, it became evident that paper streets were far more intricate than initially anticipated. Legal ambiguities, maintenance responsibilities, zoning regulations, and infrastructure constraints all contributed to the complexity of repurposing these spaces. Given the multi-faceted nature of the issue, the I-Team established a Core Team to systematically address the challenges.
The Core Team consisted of representatives from the General Services-Real Estate Division, Parks and Recreation, and Transportation, while the City Attorney’s Office, Neighborhood Improvement Services, Public Works, and Planning served as auxiliary members providing specialized support. This cross-departmental collaboration was essential to navigating the regulatory, legal, and logistical barriers associated with paper streets.
A critical first step in the process was identifying and cataloging all paper streets within Durham. With assistance from Public Works, the team retrieved a Geographic Information System (GIS) layer that mapped out paper streets within city limits. The findings were striking-- over 600 paper streets were identified, covering more than 200 acres of unused land.
Beyond mapping their locations, the team recognized the importance of understanding the characteristics and attributes of each paper street to determine their best potential uses. Utilizing GIS analysis, they assessed key factors such as:
• Length and width of each paper street
• Topography and terrain
• Zoning classifications and land-use restrictions
• Proximity to bus shelters and transit routes
• Floodplain status and environmental constraints
This data-driven approach brought the paper streets to life, transforming them from abstract spaces on a map into tangible opportunities for urban revitalization. By
analyzing these attributes, the team gained valuable insights into how different sites could be repurposed— whether for green spaces, pedestrian pathways, or community-focused projects.
While this foundational research provided critical information, the team also recognized the need to integrate design into the process to visualize the potential of these spaces more effectively. To achieve this, the I-Team reached out to the North Carolina (NC) State University College of Design’s Landscape Architecture and Environmental Planning program for their expertise in landscape design, planning and environmental management. Moreover, their involvement helped translate raw data into actionable design concepts, allowing the city to explore how paper streets could be reimagined as vibrant, functional community assets. This collaborative approach combining data analysis, cross-departmental coordination, and design innovation laid the groundwork for developing creative, communitycentered solutions for Durham’s underutilized paper streets.
EXPLORING THE URBAN POTENTIAL OF PAPER STREETS
To further explore the urban potential of paper streets, the I-Team partnered with NC State Landscape Architecture and Environmental Planning program. Led by Professors Carla Delcambre and Andy Fox in Fall 2023, the studio challenged students to develop proposals for three selected sites in Durham, integrating sustainable design with ecological considerations.
As part of this initiative, professors and students conducted site visits to paper streets in downtown Durham, bringing a level of design and environmental expertise to assess these vacant lots. Their evaluation went beyond just the physical characteristics of the sites; they also considered the topography, historical significance of surrounding areas, and environmental conditions. This comprehensive approach allowed them to develop strategies that honored the cultural and ecological context of each space while ensuring that redevelopment efforts met the needs of Durham
residents. It should be noted that these student proposals were conceptual and exploratory in nature and did not go through the City of Durham’s formal development review process.
In addition to assessing the feasibility of redesigning these spaces, students explored ways to enhance urban resilience and mitigate environmental impacts. Although these paper streets were located in highdensity urban areas, students identified opportunities to introduce native plants and vegetation to provide much-needed greenery and combat the urban heat island effect, an issue that often accompanies rapid urban growth. Their proposals emphasized how landscape interventions could improve environmental sustainability while also creating functional and aesthetically pleasing spaces for the community.
would be necessary to move from concept to pilot. These conversations deepened mutual understanding between emerging designers and city officials and helped ground the design process in both creativity and practicality.
At the conclusion of the semester, students had the opportunity to present their designs in a final critique session attended by city staff, College of Design professors, and design professionals from the Triangle. This critique provided valuable feedback, allowing students to refine their proposals based on practical considerations and real-world implementation challenges. The discussion prompted important questions around zoning limitations, long-term maintenance responsibilities, community ownership models, and how to balance ecological restoration with safety and usability. City leaders and designers also engaged in thoughtful conversations about how these ideas might scale and what types of partnerships
PAPER STREETS AS A POTENTIAL OPTION FOR AFFORDABLE HOUSING
Building on the earlier design collaborations with NC State, the I-Team also explored how paper streets might conceptually support other pressing needs in Durham, with a particular focus on the city’s ongoing housing challenges. It is important to clarify that the City of Durham does not currently have formal plans to convert paper streets into parcels for affordable housing. Instead, the I-Team’s objective was to explore paper streets as theoretical sites, examining how these constrained
landscapes could inform design thinking related to transitional housing, urban resilience, and community well-being.
In 2019, Durham passed a $95 million affordable housing bond, prompting the I-Team to explore how underutilized paper streets could contribute to housing solutions, particularly for the unhoused population. Given the legal and spatial complexities of paper streets, the team sought innovative ways to integrate housing, green infrastructure, and community well-being into the redesign process.
Building on the earlier work, the I-Team collaborated with NC State’s Landscape Architecture and Environmental Planning program on a second design studio, led by Professors Carla Delcambre and Dong-Jae Yi. This studio focused on identifying paper streets on the periphery of downtown Durham that could accommodate tiny homes, offering a practical and scalable approach to transitional housing. Over the course of the semester, students conducted site visits and worked closely with the Community Safety Department to ensure their designs were not only feasible but also aligned with the needs of Durham’s unhoused residents.
A critical component of these designs was the strategic use of native vegetation to enhance both the livability and therapeutic benefits of these spaces. Recognizing the importance of mental and emotional well-being, some students intentionally incorporated sensory-friendly plants known for their calming and restorative qualities. In addition to improving air quality and mitigating urban heat islands, the integration of greenery intended to create a healing environment for individuals experiencing housing insecurity or mental health challenges.
At the conclusion of the semester, students presented their paper street designs during a design critique attended by city staff, College of Design professors, and local design firms from the Triangle. Their proposals offered creative, human-centered solutions for transforming paper streets into housing opportunities for Durham’s most vulnerable populations. This critique
not only provided students with feedback from industry professionals but also allowed city officials to explore the feasibility of incorporating these ideas into Durham’s long-term affordable housing strategies.
FUNDING AND GRASSROOTS ENGAGEMENT
Expanding the paper streets initiative required more than just policy development and design expertise. It demanded direct involvement from the communities most affected by these underutilized spaces. Ensuring that residents had both a voice in decision-making and the resources to take action became a key priority. To build momentum and empower local leadership, the I-Team sought funding opportunities that would place revitalization efforts directly in the hands of community members.
The I-Team applied for the Bloomberg Center for Public Innovation’s Love Your Block grant; a program designed to enhance public spaces in economically distressed neighborhoods. The $100,000 grant is intended to provide funding to community members and organizations to transform abandoned spaces into community assets. These grants will enable residents to lead initiatives such as cleaning up vacant lots, creating green spaces, or developing recreational areas in underutilized paper streets. The remaining funds support a full-time project management fellow from the community, ensuring that local voices drive the initiative. The program’s first phase focuses on Durham’s Walltown neighborhood, where grassroots engagement will shape the reimagining of these spaces.
As part of these efforts, the I-Team engaged the community in a Martin Luther King Jr. Day litter cleanup in collaboration with Keep Durham Beautiful. Before the cleanup, volunteers received an overview of paper streets and the potential redesign efforts within Walltown. They learned about the significance of these underutilized spaces and how they could be transformed into green areas, pedestrian pathways, or community hubs. The cleanup also provided an opportunity for Walltown residents to participate in a survey about revitalization
efforts for vacant lots in their neighborhood. The survey gathered community perspectives on pressing needs, potential uses, and any concerns regarding redevelopment. This approach encouraged direct engagement, ensuring that residents played a pivotal role in shaping the future of these spaces.
As a two-year commitment, this initiative will require continued engagement and collaboration to ensure the long-term success of these revitalization efforts. Sustaining momentum will involve ongoing partnerships with residents, local organizations, and city departments, reinforcing a community-driven approach to transforming paper streets into vibrant, functional, and inclusive spaces across Durham.
THE BLOOMBERG HARVARD CITY LEADERSHIP INITIATIVE
Durham was selected to participate in the Bloomberg Harvard City Leadership Initiative, a collaboration between the Harvard Kennedy School, Harvard Business School, and Bloomberg Philanthropies. This initiative is designed to equip city officials with tools to address complex urban challenges through data-driven decision-making, innovative governance, and resident engagement.
As part of the Innovation Track, Durham’s cross-functional team is working to standardize definitions for paper streets, prototype innovative land-use solutions, and engage residents in shaping the future of these spaces. The initiative includes leadership training, policy development strategies, and access to a network of city leaders nationwide who are implementing similar projects. Durham officials are participating in workshops and research efforts that help refine approaches to neglected urban spaces, leveraging insights from other municipalities.
Through this initiative, Durham is exploring best practices in urban planning and design, sustainable land use, and community engagement. City officials are working to develop policies that not only clarify ownership and responsibility for paper streets but also create opportunities for long-term redevelopment. The goal is to create
a replicable framework that can be applied to other municipalities, ensuring that paper streets become valuable community assets rather than liabilities.
CONCLUSION
Durham is embarking on a bold initiative to reimagine paper streets and transform them into valuable community assets. This effort is not without its challenges, but with the commitment of city departments and the leadership of Mayor Leonardo Williams and city officials, Durham is demonstrating that innovative urban planning and equitable development are worth the investment. The city is leveraging cross-departmental collaboration, community engagement, and forward-thinking policies to address long-standing issues associated with paper streets.
Hoping to turn neglected spaces into integrated components of future land use, Durham is spotlighting the potential of paper streets in sustainable infrastructure, recreation, environmental resilience, and affordable housing. These spaces also present opportunities for ecological restoration and thoughtful design, incorporating native vegetation, improved stormwater management, and placemaking strategies that enhance connectivity and walkability.
The insights gained from this work will help shape longterm policies and urban strategies, ensuring that paper streets are no longer overlooked but instead recognized as key assets in creating more equitable, sustainable, and well-designed communities.
WORKS CITED
Bellano, A. 2016. “Paper street causes real life controversy in Moorestown.” Patch, November 30. https://patch.com/ new-jersey/moorestown/paper-street-causes-real-lifecontroversy-moorestown
Bennington, D. A. 2001. “Erasing the paper street.” Investors Title. https://www.invtitle.com/docs/articles/ nc/Erasing%20the%20Paper%20Street%202001.pdf
Bouchard, K. 2017. “Waterfront access dispute divides Cape Elizabeth enclave.” Portland Press Herald, October 2. https://www.pressherald.com/2017/10/02/waterfrontaccess-dispute-divides-cape-elizabeth-enclave/
Brashares, J., Weiner, J., Suresh, S., & Freeborn, N. 2015. Street Parks Manual, June. https://sfpublicworks.org/ sites/default/files/4970-SF%20Street%20Parks%20 Manual_Final.pdf
City of Falls Church. n.d. “Paper streets in the city of Falls Church.” The City of Falls Church Virginia. https://www.fallschurchva.gov/AgendaCenter/ViewFile/ Item/199?fileID=6235
N.C. Gen. Stat. § 136-96. 2001. https://www.ncleg.net/ enactedlegislation/statutes/html/bysection/chapter_136/ gs_136-96.html
Shorey, E. 2020. “Hines road residents shocked as ‘paper street’ gets asphalt.” The Valley Breeze, January 15. https:// www.valleybreeze.com/news/hines-road-residentsshocked-as-paper-street-gets-asphalt/article_b5a3cce81807-5138-9a2a-1f10a1b8626c.html
Simms, J. 2022. “Beacon’s paper streets.” The Highlands Current, February 18. https://highlandscurrent. org/2022/02/18/beacons-paper-streets/
THE COST OF A DEGREE
A comparative case study of urban universities in major mid-Atlantic cities and their impact on surrounding communities
SAMANTHA NIVEN
Samantha Niven is in their final term at the Rutgers University Edward J. Bloustein School of Planning and Public Policy in pursuit of their Master’s in City and Regional Planning with a concentration in Equitable and Resilient Community Development. They received a bachelor’s degree in Global Studies with a concentration in Global Health and Sustainability and minors in Spanish, Management Information Systems, and Business Administration from Drexel University. They are interested in communitycentered planning solutions, especially as they relate to Environmental Justice issues and communities.
ABSTRACT
Universities in the United States often rely on relationship-building when differentiating themselves from other universities competing for the same resources, but the relationship they often omit, which can cause complex and often overlooked impacts, is to the communities they abut. In this paper, we observe two universities located in two major mid-Atlantic cities: Drexel University, a private research university in Philadelphia, PA; and Rutgers University, a public university in New Brunswick, NJ. The social-ecological systems (SES) framework is applied to different past, recent, and future development at each university and analyzed based on their outcomes.
INTRODUCTION
Universities have a deep history in the United States, for longer than the United States has been a country. Originating from modest, religious backgrounds, the average college student was white, wealthy and male, until the Morrill Land Grant College Act was passed in 1862 to include students interested in the agricultural and mechanical arts in the university population (United States Senate n.d.). As their offerings and student bodies continued to diversify, universities found the need to distinguish themselves from one another, finding success in marketing strategies similar to those employed by for-profit businesses. While university colors, mascots, and sports teams are tactics that have given universities a strong sense of identity, some of the flashiest marketing used have been the physical design of university campuses. This has led to several patterns arising, such as state-sponsored universities having sprawling campuses in rural areas, prestigious northeastern universities becoming associated with the beautiful ivy climbing up the walls of their academic buildings, and southern universities boasting large buildings reminiscent of their lavish, albeit morally abhorrent, pre-Civil War days.
Nowadays, universities across the country compete for every component of their institution: students, faculty, rankings, sports titles, funding, etc.. Acquiring and maintaining these different components has required intentional relationship-building between universities and stakeholders like alumni, local businesses, and state and municipal governments. While several strategies are implemented for relationship-building purposes, one way that many universities have found particular success has been through the intentional and often radical physical design of their campus. The one group that seems to be consistently omitted from the relationship-building process, and thus the design process, tends to be one of the most physically prominent populations: the existing local community that resided in the space long before the encroachment of the student population. In this study, two universities, Rutgers University and Drexel University, are observed, and prominent events in their histories determine the extent to which university development and design positively and/or negatively impact the surrounding environment, community, and its historic population.
METHODOLOGY
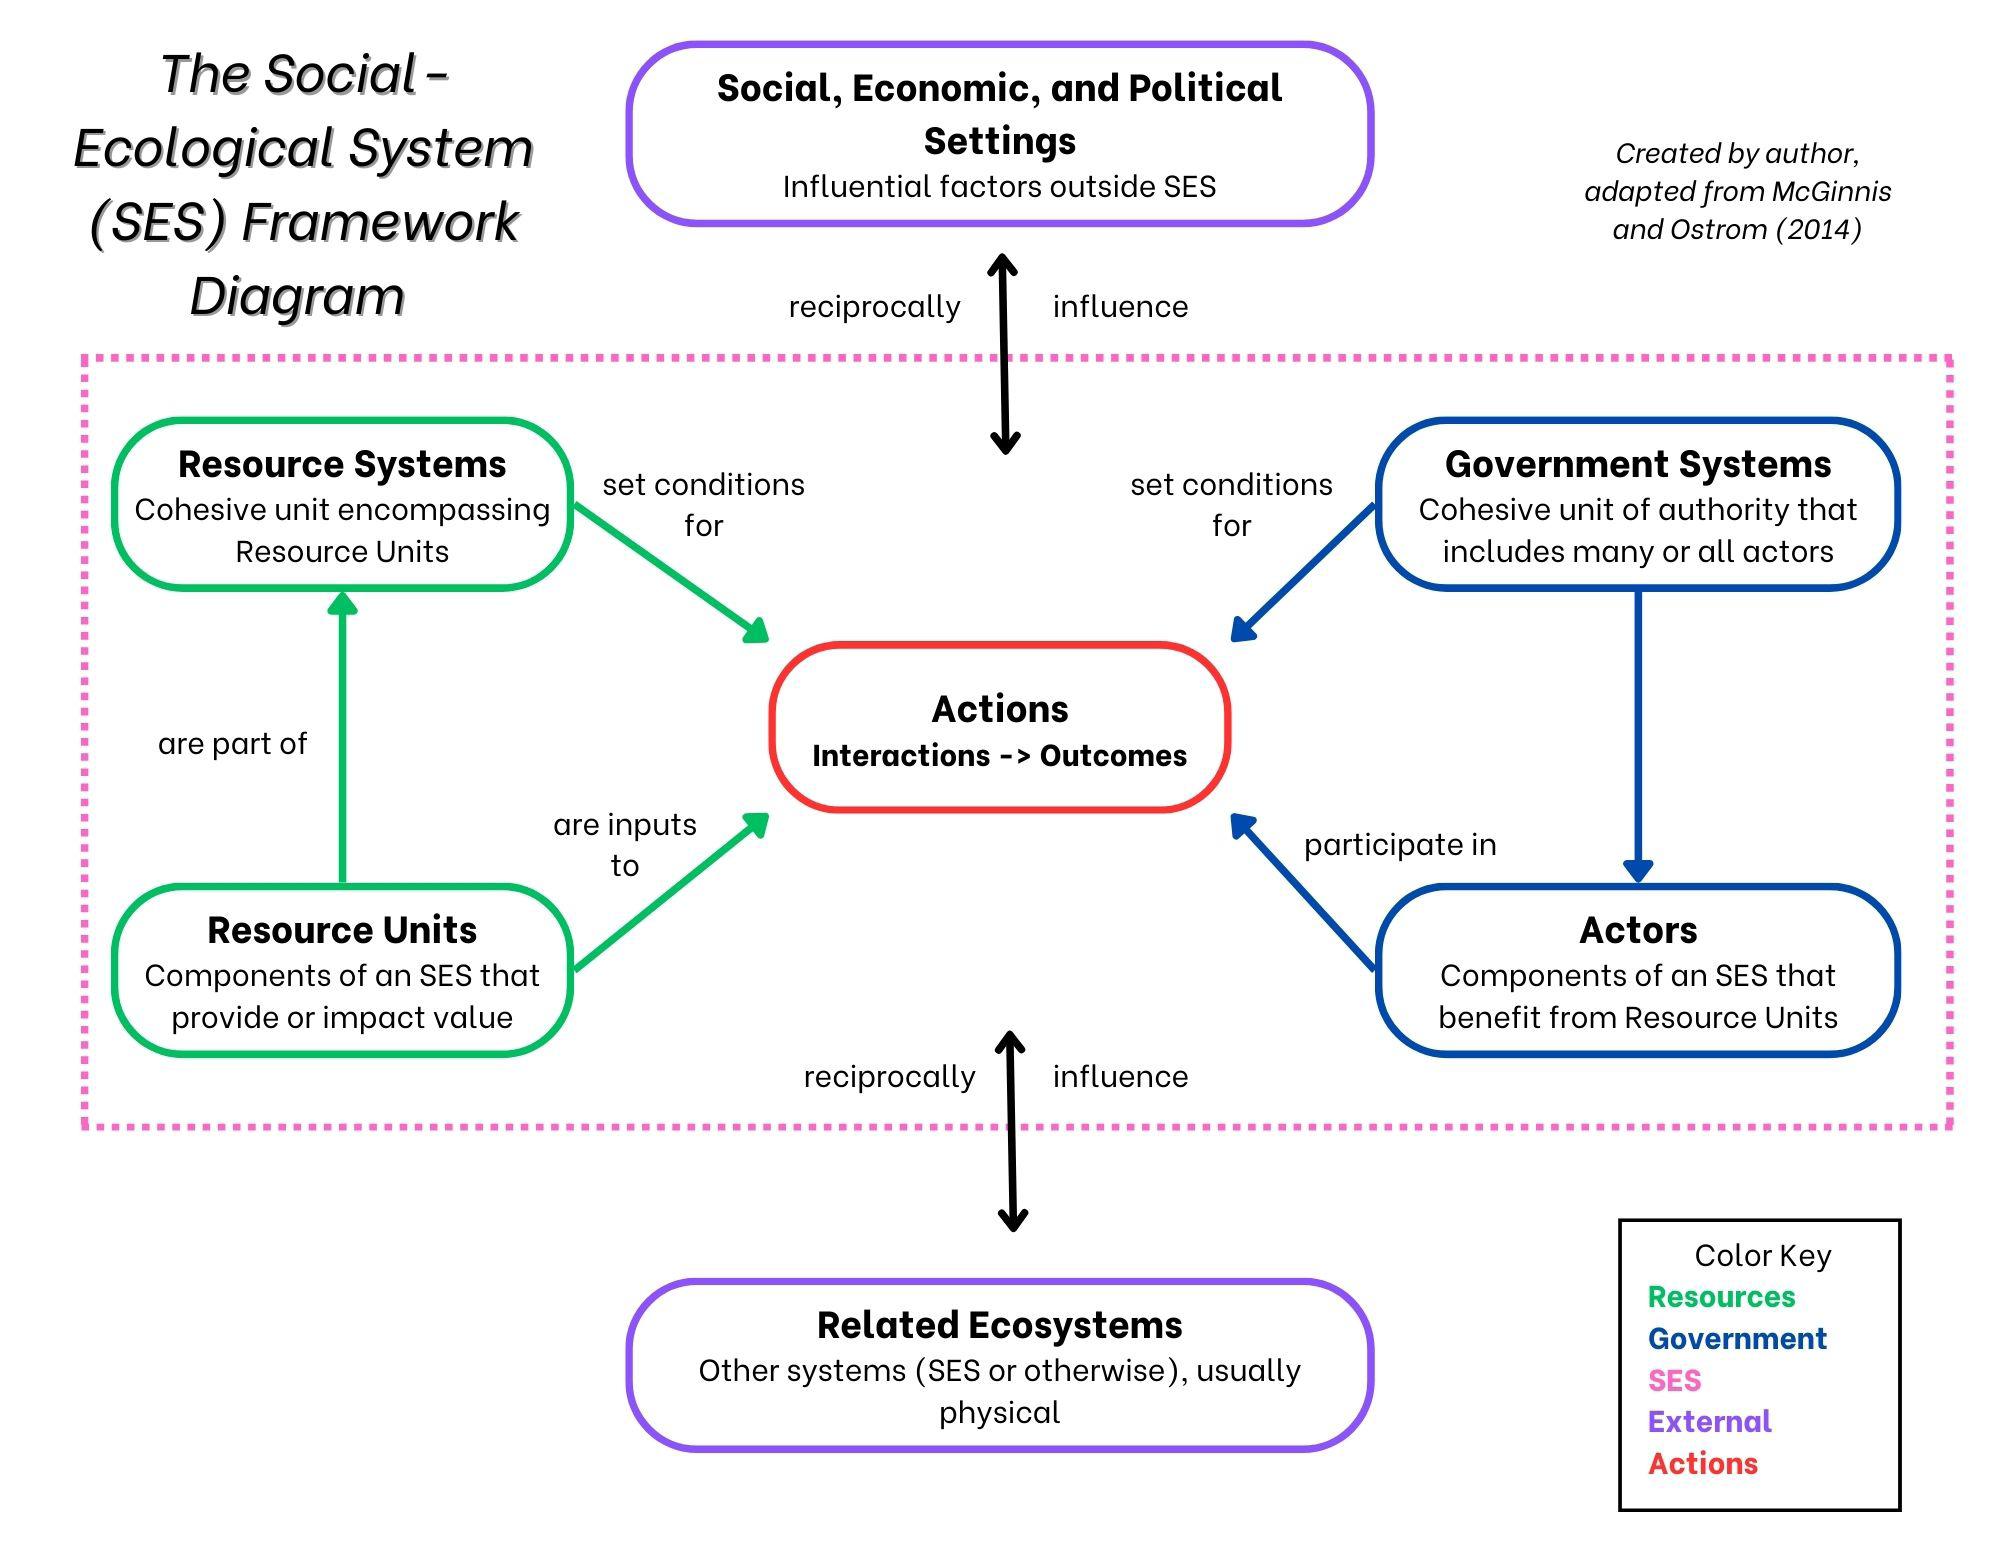
For this comparative case study analysis, a place-based strategy is employed to reduce confounding factors; both universities observed are located in the mid-Atlantic region of the United States in urban settings. There is also a temporal component to the analysis, with each university case consisting of one event occurring in the mid-20th century, one event occurring in the recent past, and one event that is currently ongoing. The framework used in this analysis is the McGinnis and Ostrom (2014) Social-Ecological System (SES) Framework, as illustrated below:
Planning, as an inherently intersectional field, requires a framework with the capability for intersectional analysis, which the SES framework provides. By analyzing the dynamism between and within Government, Resources, and Externalities, a sense of the nuanced interactions and their proceeding outcomes is more easily developed.
CASE 1: DREXEL UNIVERSITY
Founded in Philadelphia in 1891, Drexel University started small; the first 40 years of its existence saw all aspects of university life housed within its first and only building, aptly named the Main Building. As the years passed and the university became a prominent, accredited 4-year private research institution, the university grew in both population and acreage; today, Drexel boasts a student population of over 20,000 in-person students and a whopping 96-acre campus (Drexel University n.d. (a)).
EVENT CONTEXT
In the late 1960’s, University Redevelopment Area Unit 3, located on a main thoroughfare of West Philadelphia, was set to be the site of urban renewal (an activity funded by the federal government to address “blight”). The West Philadelphia Corporation (WPC), a newly formed development corporation that included Drexel as well as other academic institutions, planned a “scholarly urban oasis” in what was, at that time, the neighborhood of Black Bottom (Heritage West n.d.), a historically Black neighborhood with Victorian-style homes and many Black-owned businesses. This project displaced anywhere from 2,000 (Heritage West n.d.) to 10,000 (Susaneck 2024) Black Philadelphians to make way for the “precision medicine Tech Hub” (Huffman 2024) that housed biomedical, telecommunication, startup, and research companies.
Similarly major redevelopment has been needed to house Drexel’s 13,000+ undergraduate students who must complete a two-year on-campus living requirement (Drexel Univeristy n.d.(b)). Being just one of three major universities housed in West Philadelphia, housing has
become a commodity requiring increasingly more space. Drexel and UPenn’s expansion westward was already contentious, but in July 2021, a management group with connections to Drexel decided against renewing its 40-year contract to manage the University City (UC) Townhomes as Section 8 Housing (De Forest 2023) to make way for new apartments targeted to students. The demolishing of the townhomes meant displacing nearly 70 families. Sympathetic students held a massive protest at Drexel, while the “Save the UC Townhomes” coalition formed and mobilized against this development decision. Ultimately, the demolition proceeded, and the townhomes were destroyed. However, upon the completion of the new buildings, 74 units will be preserved as deeply affordable housing (meaning that those that make only 30 percent of the average median income could reasonably afford rent) (De Forest 2023).
As an attempt to discern the ways in which future university projects will impact the surrounding community, the third case event taken into consideration is Drexel’s Master Plan. Adopted in 2017, it outlines the design and development vision for the university and provides maps and mock-ups of changes crucial to “transforming the modern urban university” (Drexel University 2017).
SES BREAKDOWN
University Science Center Development
Social, economic, and political settings
Related Ecosystems
Resource Units
• Federally backed Urban Renewal
• The Black Bottom neighborhood
• Center City Philadelphia
• Black culture
• Black businesses
• Historical housing stock
• Available land
• Section 8 Housing funds
Resource systems
Actors
Government Systems
• The Black Bottom neighborhood
• Universities (incl. UPenn)
• Developers
• Businesses (Biomedical, telecommunications, startup, research)
• West Philadelphia Corporation (WPC)
• U.S. Department of Housing and Urban Development
Interactions
• University City Science Center planned
• Residents and sympathetic students protest
• Federal money awarded to WPC for construction
• Building constructed and is the first of many to come
Table 1 continued on page 33.
University City Townhomes Demolition Drexel Campus Master Plan
• Growing university populations
• Federal subsidies for Section 8 Housing
• The COVID-19 Pandemic
• Townhomes
• Townhome residents
• Tuition-paying university students
• Community organizations
• 40th street subway station
• Housing/land value
• The “neighborhood”/ district of University City
• Universities (incl. UPenn
• Developers (Altman Management Group)
• “Drexel’s urban setting”
• Philadelphia City Government
• University City Business Improvement District
• The corner where the UC Townhomes are located is adjacent with a prominent subway stop, making it prime real estate
• 40-year Section 8 contract not renewed
• Save the UC Townhomes Coalition formed
• Drexel students protest for 31 days
• Altman Management and the City of Philadelphia reach a development agreement
• “The 21st century” as an era of “creative innovation”
• “Surrounding neighborhoods”
• “Public transit”
• Drexel’s history, incl. “the historic main building”
• “Transit stations”
• “Campus”
• “Our University community”
• “Private-sector partners”
• “The Innovation Community”
• “Philadelphia and the region”
• “Student residence, retail, and commercial development”
• “Encourage private development and investment” to “help fund Drexel’s academic mission”
• Introduce “new housing and neighborhood-oriented retail choices” to “attract top faculty, staff, and students” to Powelton Village Mantua
• “These streets can also become Drexel’s signature version of the campus quandrangle - lined with seating, verdant paintings, and lively university and retail destinations that reinforce community on campus”
• “Transform Ludlow Street from a service alley into a promenade”
• “Draw the Community Together Around Shared Places”
• “Demonstrate sustainability innovations”
Social Performance Outcomes
Ecological Performance Outcomes
University Science Center Development
• Center City growth pushes historical residents outwards as rents become more expensive
• Black Bottom residents are displaced
• Neighborhood history and culture are erased
• Presence of medical, academic, and similar industries increases
• Universities experience increased optics
• “Blight” is reduced
• Development area is completely leveled
• Skyrises are built and forever change the West Philadelphia skyline
University City Townhomes Demolition Drexel Campus Master Plan
• The economy and housing market were and are still reeling from the COVID-19 pandemic
• UC Townhomes residents are displaced
• Student housing increases
• 20% of units are set aside as deeply afforable units
• Bringing in outside investors comes with the possibility of displacing more residents and/ or existing small businesses
• Encouraging faculty, staff, and students to neighborhoods on the outskirts of Drexel’s campus could exacerbate gentrification
• Creating a campus quad creates further divide between on-campus and offcampus, which could isolate existing non-Drexel community members
• “Underscores a need for the campus to promote frequent dialogue among diverse faculty, staff, and students;” non-Drexel community members are excluded from the univesrity’s planned community-building activities
• Bringing awareness to and educating the public on various environmental issues in a familiar context
• Development area is completely leveled
• The footprint of Drezel and other surrounding universities expands
• New construction to take place
• Proposed plan committed to providing greenspace
CASE 2: RUTGERS UNIVERSITY
Founded in 1766 as Queen’s College, Rutgers University is the 8th oldest university in the nation and has nearly 44,000 students enrolled at its New Brunswick campus (Rutgers n.d. (b)). The city of New Brunswick, located in Middlesex County in New Jersey, is about an hour and a half drive north of Philadelphia and an hour train ride south of New York City and has about 56,000 people living within its 5.2 square miles (Data USA n.d.).
According to the 2022 ACS 5-year estimates, around 45% of the population in New Brunswick is estimated to be
• Improved pedestrian experience
• Increased greenspace and simultaneous reduction of car-centric design
• Engaging in more sustainable practices and reducing Drexel’s negative environmental impact
Hispanic/Latine, homeownership rate is approximately 20%, and nearly 32% of the population is estimated to be living in poverty (Data USA n.d.). An important stakeholder within the city is Johnson & Johnson, who has been a major employer since the company’s founding in 1886 and has significantly influenced the city’s landscape over the years.
CONTEXT
As with the rest of New Brunswick and the nation, Rutgers experienced unprecedented growth and
development in the 1960s (Robbins 2007). With a building program of $75 million (Robbins 2007), several new buildings and additions peppered Rutgers’ main campus that would spurn parallel development on other nearby campuses like the New Brunswick Theological Seminary (which would sell half of its acreage to Rutgers some 50 years later (Miller n.d.)) as well as a pattern of consistent growth from then until today.
Directly abutting Rutgers’ School of Planning and Public Policy is the 57-block neighborhood of Esperanza, a Spanish word meaning “hope.” With a predominantly Latine population of roughly 12,000, the “neighborhood is characterized by multiple small business corridors reflecting Hispanic heritage” (New Brunswick Tomorrow 2019). The population is also considered low- to moderate-income, as the “neighborhood median household income is approximately 50% of the Middlesex County median household income (New Brunswick Tomorrow 2019).
With all this in mind, self-described social impact organization New Brunswick Tomorrow (NBT) developed the Esperanza Neighborhood Plan, a Neighborhood Revitalization Tax Credit (NRTC) Program (New Brunswick Tomorrow 2019). Spearheading this plan was Charles Bergman, director of neighborhood strategies for NBT and affiliate professional member of the Rutgers Global Health Institute, and the purpose of this plan structure a strategy to capitalize on “Esperanza Neighborhood’s high potential for revitalization” (New Brunswick Tomorrow 2019).
When the block across from the New Brunswick train station was flattened in the summer of 2023, New Brunswick began drastically altering its skyline. “See this pile of dirt?” banners currently surround the site, creating curiosity and opportunities for the public to learn more about the project.
The New Brunswick Development Corporation (DEVCO) is a well-known redevelopment powerhouse in New Brunswick, and this project could be considered the culmination of decades of partnership development.
The project, named the HELIX NJ (standing for Health + Life Sciences Exchange New Jersey) is a mixed use development proposal focusing heavily on the integration of scientific and technological development into everyday life in New Brunswick. The project has three stages associated with the development of three prominent high-rises: H-1, H-2, and H-3 (New Brunswick Development Corporation n.d.). H-1, a 12-story research space and innovation hub, is set to be completed in 2025. The second stage, H-2, will be completed in 2028 as the 10-story “future home of Nokia Bell Labs.” Finally, H-3, to be completed by 2030, will be “the tallest in Middlesex County” at 42 stories and will accommodate residential, retail, and office space (New Brunswick Development Corporation n.d.).
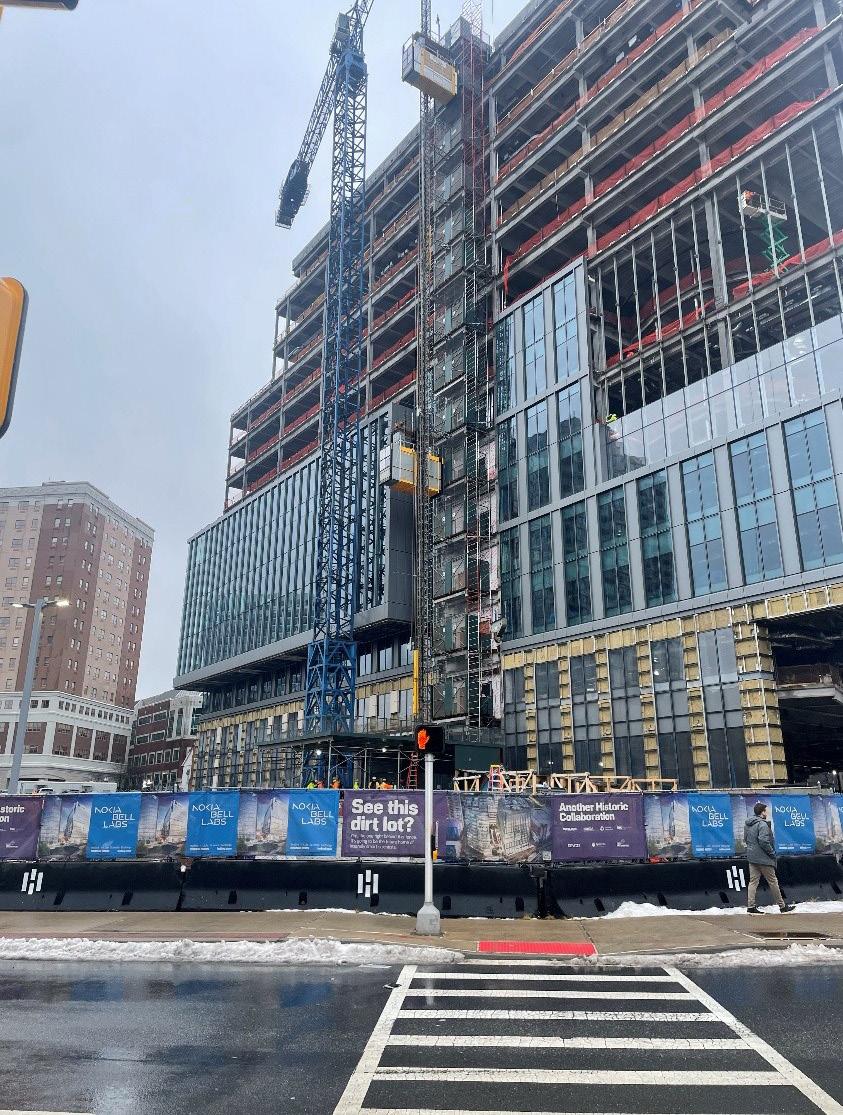
SES BREAKDOWN
Rutgers' 1960s Growth Esperanza Neighborhood Plan HELIX NJ Plan
Social, economic, and political settings
Related Ecosystems
• National turbulence
• Federally backed Urban Renewal
• New Jersey (esp. Rutgers Newark and Camden)
• New Brunswick Theological Seminary
• Students
• Federal bonds
Resource Units
• Demographic growth
• Diversity (among students)
• Political will and resources
• Urban decay from the 1970s
• Rutgers’ first faculty strike
• New Jersey
• Global conditions in Latin America that spurred immigration
• Neighborhood demographics
• Funds (incl. Neighborhood Revitalization Tax Credit program)
• Public transit
• Structural/architectural assets
• Community-member participation and leadership
• Housing prices and availability
• Political support for project
• National growth of medical and educational fields
• International power dynamics
• New Jersey
• New York
Resource systems
Actors
• Rutgers population
• Federal government
• City of New Brunswick
• Neighboring city of Piscataway
• Highland Park neighborhood
• New Brunswick Development Corporation (DevCo)
Table 2 continued on page 36.
• Esperanza Neighborhood
• State and federal government
• Northeast Corridor rail line
• Partnered non-profits (incl. RWJBarnabas University Hospital)
• Rutgers Global Health Institute
• City of New Brunswick
• Students
• Tuition and research grants
• Public transit
• Access to technology and innovation
• Traditionally-skilled professionals
• Rutgers population
• Grant-awarding institutions
• New Brunswick train station
• Universities (incl. Tel Aviv University and Atlantic Technological University)
• Nokia Bell Labs
• New Jersey Innovation Hub
• Health groups (incl. RWJ Barnabas Health, Johnson & Johnson, and Hackensack Meridian Health)
• New Brunswick Development Corporation (DevCo)
Interactions
Rutgers' 1960s Growth
• National turbulence highlights unmet societal needs
• Federal bond money is approved by New Jersey citizens
• Development occurs on both sides of the Raritan River (in New Brunswick, Piscataway, and Highland Park)
• A growing population means growing housing needs
Social Performance Outcomes
Ecological Performance Outcomes
• Other New Brunswick institutions, like the seminary, follow Rutgers’ redevelopment example (then and for decades to come)
• DevCo becomes the leading redeveloper for many institutions’ projects
• Increased capacity means increased density
• Rutgers grows and diversifies in conjunction with New Brunswick
• The Rutgers main campus undergoes a significant landscape change through the addition of several new buildings.
• Increased density means increased resource usage and waste
TABLE 2 . SES
of
Esperanza Neighborhood Plan HELIX NJ Plan
• A strong cultural identity and community cohesion stemmed from the Latine population of the Esperanza neighborhood
• Crime, poverty, housing access, etc. made Esperanza a prime candidate for federally funded revitalization
• Non-profits, spearheaded by New Brunswick Tomorrow, partnered to conduct thorough research for plan over the course of five years
• Rutgers’ first faculty sTrike spent its fourth day in the Esperanza neighborhood
• Extensive community input was made the foundation of the Esperanza Neighborhood Plan
• $1 million was awarded through the Neighborhood Revitalization Tax Credit program
• Rutgers faculty and student workers interacted with a community they had not likely “ever stepped foot in” and recognized solidarity between the communities
• “Promote and celebrate the arts, culture, and community identity”
• Distressed homes received funding for renovations
• “Implement Crime Prevention Through Environmental Design (CPTED) interventions”
• Former site was underutilized and therefore meets the New Jersey criteria for redevelopment
• DevCo capitalizes on decadesold partnerships to develop a plan to revitalize the site and surrounding area
• Plan is approved by city government and construction begins
• Student outrage regarding the unlawful occupation of Palestine was catalyzed by the events of October 7th
• Protests and an encampment took place on Rutgers’ College Ave campus over the course of several days
• Increased jobs and pedestrian traffic
• Global expansion of industries
• Increased Rutgers presence locally and globally
• Solidification of industrial district identity concurrent with Rutgers priorities
• Ending Rutgers’ partnership with Tel Aviv University was a condition of the agreement that the protesters and administration agreed to, one that has yet to be realized
• Non-Rutgers New Brunswick locals largely excluded from the planning process and advertised “HELIX community”
• Downtown New Brunswick experiences a complete skyline change
• Noise and air pollution from construction is ongoing
• Proposed green spaces
DISCUSSION
While the cases present only a subset of universities across the country, the similarities between them provide a message that is simultaneously harrowing and encouraging.
On the side of harrowing, both cases contain aspects to their projects that benefit institutions at the expense of thte surrounding community and environment. Urban renewal seemingly served as a catalyst for a decadeslong pattern of demolition, reconstruction, outward expansion, and perpetual displacement. Projects were and often continue to be in direct disregard of or opposition to the non-university community residing on or near campus. Environmental design or preservation, if considered, tended to take a backseat to the other project priorities, often proposing green spaces without much specificity. With many of these projects being the product of political will and private/non-profit capital, it often took radical groups and individuals to problematize development and the agendas (hidden or explicit) funders have. Social problems were compounded by the environmental toll that redevelopment was taking on the community both in the short term (air quality, construction noise, etc.) and in the long term (increased density, waste production, car emissions, etc.).
On the other hand, both cases show how positively planners, designers, and academics can impact communities with their projects. While the UC Townhomes redevelopment and the Esperanza Neighborhood plan were vastly different in both their processes and outcomes, they both produced results that indicated the acknowledgement of community needs and the accountability the project leaders were willing to have to meet those needs. In the Rutgers case, the project outcome was an intentional collaboration with the community from the beginning, whereas the Drexel case was a result of backlash received from community members associated with the university and not. In both cases, outreach and input were leveraged planning tools that not only provided a more mutually beneficial solution at the end, but also gave community members
something that historically had been gatekept: a sense of ownership.
IMPLICATIONS
This research is an attempt to initiate conversation among practitioners and academics regarding the echoing effects of produced work and research. Every project produced will, to some degree, reflect the mission and values of the entity backing it, so it is imperative that practitioners and academics understand those values. Much like a company’s mission statement or slogan, universities employ mottos to encapsulate their values in one statement. Sol Iustitiae et Occidentem Illustra, a Latin phrase meaning “Sun of righteousness, shine upon the West also,” (Rutgers n.d.(a)) has been Rutgers’ motto for nearly 300 years, while Drexel chose to adopt “Ambition can’t wait” relatively more recently. If mottos are any indication of values, righteousness and ambition are keystone qualities at both Rutgers and Drexel, but these values should be indicative of constructivism as opposed to conquest. Planners, designers, students, alumni, and faculty have roles that are two-fold, being both stewards of knowledge and stewards of community. There is a plethora of tools available to incite change, be it to the physical or theoretical landscape, and with those tools comes the responsibility to use them ethically. Future research should include analysis of different events at different universities, adding to the complex narrative of what exactly a college degree costs, not just for those acquiring it, but also for the surrounding community and environment.
WORKS CITED
Anderson, Jon. n.d. “Studentification.” Cardiff University. Accessed January 8, 2025. https://www.cardiff.ac.uk/__data/ assets/pdf_file/0003/348510/studentification.pdf
Blair, Peter Q., Debroy, Papia, and Heck, Justin. 2021. “SKILLS, DEGREES AND LABOR MARKET INEQUALITY.”
National Bureau of Economic Research. https://www.nber. org/system/files/working_papers/w28991/w28991.pdf
Data USA. n.d. “New Brunswick, NJ.” Accessed January 8, 2025. https://datausa.io/profile/geo/new-brunswicknj?redirect=true
De Forest, Ann. 2023. “The Origins and End of University City Townhomes.” Hidden City, July 14. https:// hiddencityphila.org/2023/07/the-origins-and-end-ofuniversity-city-townhomes/
DREXELPLAN. 2014. “SPOTLIGHT: MAIN BUILDING.” April 17. Accessed February 17,2025. https://drexelmasterplan. wordpress.com/2014/04/17/spotlight-main-building/
Drexel University. n.d. (a). “125 years, 125 events.” Accessed January 8, 2025. https://drexel.edu/125years/history/ timeline/
Drexel University. 2017. “Drexel University Campus Master Plan” Drexel University Office of the President. https:// drexel.edu/facilities/~/media/Drexel/Treasurer-Group/ Facilities/Documents/strategicPlan/pdf/Master_Plan.pdf
Drexel University. n.d. (b). “Rankings and Achievements.” Accessed January 8, 2025. https://drexel.edu/about/ rankings-achievements
Greater Philadelphia Cultural Alliance. n.d. “Demographic Trends and Forecasts in the Philadelphia Region Key Findings.” Accessed January 8, 2025. https://www. philaculture.org/research/reports/demographic-trendsforecasts-philadelphia-region/key-findings
Heritage West. n.d. “The Black Bottom.” Accessed January 8, 2025. https://www.heritagewestphl.org/theblackbottom
Huffman, Sarah. 2024. “Philly’s tech and innovation ecosystem runs on collaboration.” Technical.ly, November 18. https://technical.ly/startups/philadelphia-techinnovation-ecosystem/
Hurdle, Jon. 2024. “Developer of Former Philadelphia Refinery Site Finalizes Pact With Community Activists.” Inside Climate News, October 23. https:// insideclimatenews.org/news/23102024/philadelphiarefinery-redevelopment-impacts/
McGinnis, Michael D. and Elinor Ostrom. 2014. “Socialecological system framework: initial changes and continuing challenges.” Ecology and Society, 19(2): 30. http://dx.doi.org/10.5751/ES-06387-190230
McKechnie, Alex. 2011. “Drexel Establishes Property Management Advisory Board.” DrexelNews, December 9. https://drexel.edu/news/archive/2011/december/propertymanagement-advisory-board
Miller, Holly G. n.d. “Historic seminary leverages land, sheds debt.” Summer 2015. Accessed February 17, 2025. https://www.intrust.org/in-trust-magazine/issues/ summer-2015/historic-seminary-leverages-land-shedsdebt
New Brunswick Development Corporation. n.d. “Helix NJ.” Accessed January 8, 2025. https://www.helixnj.com/
New Brunswick Tomorrow. 2019. “Esperanza Neighborhood Plan.” June. https://documentcloud.adobe. com/gsuiteintegration/index.html?state=%7B%22ids% 22%3A%5B%221yUSLjj-d_-1p4WwaZAjf3mISnjidOp4 k%22%5D%2C%22action%22%3A%22open%22%2C% 22userId%22%3A%22100813604262266664961%22%2C%22resourceKeys%22%3A%7B%7D%7D
O’Donell, Chuck. 2023. “Rutgers Faculty Find Support in New Brunswick’s Esperanza Neighborhood.” TAP into New Brunswick, April 13. https://www.tapinto.net/towns/
new-brunswick/sections/rutgers-university/articles/ rutgers-faculty-find-support-in-new-brunswick-sesperanza-neighborhood
Perelman School of Medicine Center for Excellence in Environmental Toxicology. n.d. “West Philadelphia.” University of Pennsylvania, accessed January 8, 2025. https://ceet.upenn.edu/community/target-communities/ west-philadelphia/
Robbins, Allen B. 2007. “A Brief History of Physics and Astronomy at Rutgers.” Chapter 10. November 8. Accessed February 17, 2025. https://www.physics.rutgers.edu/dept/ history/robbins/chapt10.pdf
Rutgers University. n.d. (a). “About Rutgers.” Accessed February 17,2025. https://www.rutgers.edu/about-rutgers
Rutgers University. n.d. (b). “Rutgers, By the Numbers.” Accessed January 8, 2025. https://www.rutgers.edu/about/ by-the-numbers
Rutgers University. 2015. “Rutgers University Physical Master Plan – Rutgers 2030 Volume 1: New Brunswick.” Introduction. June 18. https://masterplan.rutgers.edu/ sites/default/files/Rutgers%202030%20-%20Volume%20 1%20-%20Rutgers%20University%20-%20New%20 Brunswick%20-%20C%20Introduction%20%281%29.pdf
Rutgers University. 2015. “Rutgers University Physical Master Plan – Rutgers 2030 Volume 1: New Brunswick.” Chap 3. June 18. https://masterplan.rutgers.edu/sites/ default/files/Rutgers%202030%20-%20Volume%20 1%20-%20Rutgers%20University%20-%20New%20 Brunswick%20-%20C%20Rutgers%202030.pdf
Schkrutz, Eric. 2011. “Urban Development in the City of the Traveler: The Story of New Brunswick and Why It May Never Resolve Its Identity Crisis.” April. Accessed February 17, 2025. http://www.nbfplarchive.org/ nbrevitalization/files/nb_bibliographies/schkrutz_2011-_ thesis-_urban_development_in_the_city_of_the_ traveler-_the_story_of_new_brunswick_why_it_may_ never_resolve_its_identity_crisis.pdf
Susaneck, Adam Paul. 2024. “Segregation by Design.” TU Delft Centre for the Just City. https://www. segregationbydesign.com/
United States Senate. n.d. “Morrill Land Grant College Act.” The Civil War: The Senate’s Story. Accessed February 17,2025. https://www.senate.gov/artandhistory/history/ common/civil_war/MorrillLandGrantCollegeAct_ FeaturedDoc.htm
Villa, Michelle. 2023. “New Brunswick Tomorrow Awarded $1 Million for Esperanza Neighborhood Revitalization.” New Brunswick Tomorrow, August 8. https://www.nbtomorrow.org/newsroom/newbrunswick-tomorrow-awarded-1-million-foresperanza-neighborhood-revitalization
West Philadelphia Collaborative History. n.d. “University Redevelopment Area Unit 3.” Accessed January 8, 2025. https://collaborativehistory.gse.upenn.edu/stories/ university-redevelopment-area-unit-3
IT’S (50 YEARS) TIME TO SEE THE (IN)VISIBLE
Students, How Do You Get to And From Campus?
SYLVIE GUEZEON
I am a PhD student at the Humphrey School of Public Affairs. On any given day, you can see me riding the public transit in the Twin Cities, MN. My research in urban planning lies at the intersection of community engagement, transit systems, and public health. My dissertation research elevates awareness within the university setting of the transit and mobility challenges facing students, undergraduate and graduate. With my work, I am testing new data-collection tools and platforms for engaging communities, ensuring they are given equal opportunity to co-create effective and responsive transit solutions.
ABSTRACT
University students constitute a substantial share of the public transportation ridership. Their participation in the design of the transit planning and decision-making processes for campus transportation systems is therefore critical. However, not only are they often (in)visible but their stories of how they get to and from the University campus remain untold. With my research within the University of Minnesota Twin-Cities community, I propose the design of a pilot transit ambassadors’ program to amplify university student riders’ voices. Student ambassadors will support other students in navigating the public transit and provide on-going co-design opportunities to improve the campus transportation systems with the overall goal of building a more inclusive urban and regional transit system.
INTRODUCTION
In his book , “In the Shadow of the Ivory Tower,” Baldwin provides some insights with “the stories of ever-expanding campuses to illustrate the increasingly parasitic relationship between higher education and our cities” (Baldwin 2021).
Design in Planning and the Environment is not often situated within the university community and its environment. In a time when colleges and Universities face a decrease in both enrolling and maintaining students in higher education, lack of transportation is a frequently mentioned reason preventing some students from finishing college (West 2021). Transportation is identified by the Centers for Disease Control and Prevention (CDC) as a social determinant of health (“Social Determinants of Health (SDOH) at CDC” 2024). It can define which students have access to education, housing, employment, healthy food, health facilities, leisure activities and later on, wealth. Transit systems, therefore, are not just indispensable for healthy, equitable forms of community development–they also matter for making strong, inclusive universities.
Whether a transit model works for or against such goals, however, depends on its design. Campus transportation systems rely on student riders, meaning campus transportation design should start with assessing, understanding, and responding to students’ needs and challenges. Unfortunately, when it comes to transportation design, university students’ voices are disproportionately absent. This failing can most impact disadvantaged students, especially those who are international, parenting while enrolled, working students, low-income, and/or have a disability.
Campus transportation interacts with the broader urban transportation system. Historically, the latter shares common goals with the civil rights and the environmental justice movements, meaning transportation investments have tremendous potential to right the wrongs experienced by disinvested and marginalized communities throughout cities and regions in the United States (Bullard 2003, Marcantonio et al. 2017). Moreover, mobility solutions are improved when diverse communities weigh in and coalesce as a movement that pushes against established
power dynamics to generate tangible forms of transport justice (Karner and Duckworth 2019). Therefore, the topic of design of participatory processes of campus transportation systems is pertinent to transit systems agencies and to universities. It is also salient to the wellbeing of students, 31% of whom depend on public transportation for their primary form of transportation (Nash and Mitra 2019). Further, transportation constitutes a substantial 17% percentage of student’s budgets (“Guidance for Living Expenses – Higher Ed | College Board,” n.d.).
In the years since the pandemic began, universities have been turning to the work of social justice, potentially opening opportunities for improving student-centered transportation design. The CDC’s Community Engagement Framework (“Social Determinants of Health (SDOH) at CDC” 2024), applicable to participatory processes for university students, aligns with the questions explored in this paper: how are university student riders represented and involved in local transit systems? What are the challenges that students face both in terms of accessing transit and navigating transit opportunities? Should this gap be solved by universities, decision-makers (government entities such as cities, counties, local and regional planners, public transportation operators, regional planning organizations), and students who should have their say?
BACKGROUND
Drawing from my intersectional identity as a woman of color, an international student, and a transit-dependent person, I conducted a study of students enrolled at the University of Minnesota-Twin Cities (UMN-TC) to understand their transit experiences and explore options for elevating student involvement in transit planning decisions. In 2024, UMN-TC had a diverse enrollment of 54,890 students, including low-income, women, parents, first generations, international students, and students with different abilities (“Enrollments | Institutional Data and Research,” n.d.). Quantitative data from the Parking and Transportation Services (PTS) about student riders is available but there is a lack of research related to students’ lived experiences with transit systems to and from the campus (Allanson,
n.d.). This paper fills this gap by interviewing students about their experiences with university transit systems. My work also seeks to create channels for student participation, such that their experiences can inform planning decisions. To do so, I co-designed the interview process with students. This deeper level of collaboration responds to the call for participation to go beyond symbolism and become an ongoing practice set forward by Pothier et al. (2019) in their article “Is ‘Including Them’ Enough? How Narratives of Race and Class Shape Participation in a ResidentLed Neighborhood Revitalization Initiative.”
This paper is, in part, based on the feedback I received from the Transit Open House I organized in 2023. At this event were two representatives from the Transit Information Center (TIC) at Metro Transit, the main transit operator in the Minneapolis-St Paul area of the United States of Minnesota. The Transit Information Center (TIC) provides a range of services, from a transit expert hotline for help with routes, schedules, and fares to NexTrip, “which provides automated, real-time information 24 hours a day for trips departing in the next 20 minutes and scheduled times thereafter” (“Contact US - Metro Transit, “ n.d.). After witnessing students’ lack of knowledge and their interest in planning and decision-making about their transit trips, one of the representatives from TIC offered the possibility to provide training to any interested students (personal communication). I witnessed the TIC representatives assist students in navigating the transit system apps.
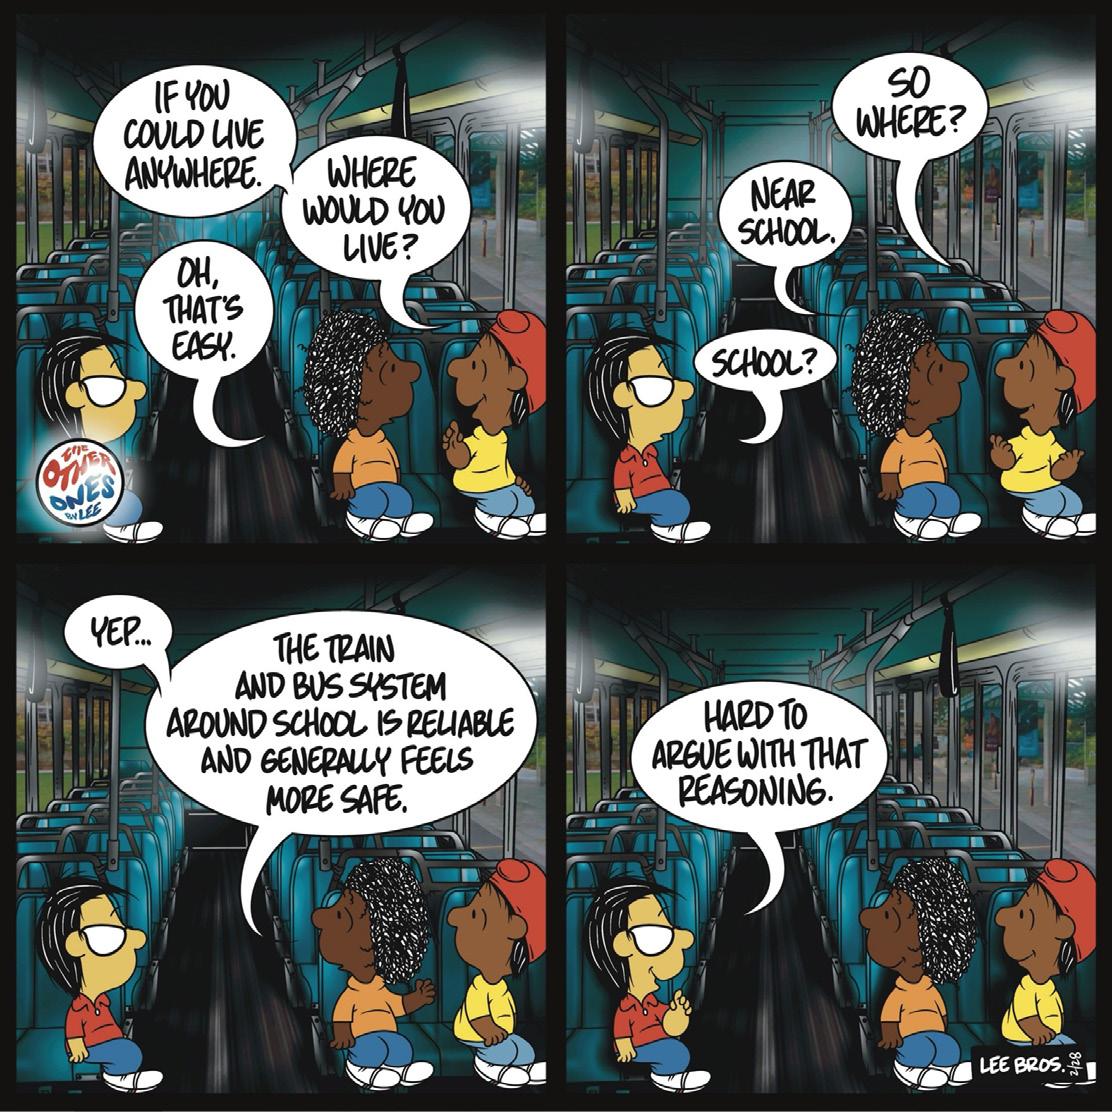
IDEATION OF THE PROJECT/METHOD(OLOGY)
This paper uses a combination of ethnography/participant observation, interviews, and policy analysis to explore how universities, city planners, and policymakers might meet student needs through more participatory processes.
At the beginning of the Spring 2024 semester, through word of mouth, I recruited two student co-designers to conduct the interviews, record, and observe the interviewees alongside me. The observations included commuting alongside the interviewees. According to the website designkit.org, “co-
designers are community members that we partner with to collectively advance the design of a solution” (“designkit.org”). DesignKit.org goes on to clarify that “[h]aving co-designers conduct research or test concepts within their own communities is an excellent way to strengthen your design process.” At the outset of the project, I first explained to the transit ambassadors what the goal of the research was and shared the questions they would ask and for which I was expecting answers/ insights from the students with a flexibility for them to add more questions if they felt the need. Second, they listened to the first interview I did and followed up with taking notes in a few subsequent interviews and finally, they were on their own.
With my co-designers, we recruited 15 student participants through word of mouth and advertisement on diverse social media to be interviewed. The study population is international students and students from rural areas, as we sought to understand how expectations might be
different from suburban or urban students. We learned that (1) students rely on family members and friends to learn about the transit system and, despite using apps, they want (more) physical presence of transit workers, reinforcing the human dimension of transit; and (2) students are generally open to provide feedback if they are incentivized.
RESULTS (1) STUDENTS’ EXPERIENCES
Human dimension of Transit: Relying on someone to learn how to use the system
Most of the participants have been guided by a friend, a faculty, a family member, a driver, or someone on the street to learn how to use the transit system. As one interviewee described, “So, I kind of like learned that on my own. And I asked my friends, those same friends, which bus they recommend and like what app they use, how frequent do these buses go? But that’s kind of like transit for me.” Very often, students are left to their own devices: “I can’t remember if anybody showed me how to use it. I guess the bus driver just told me to tap on the card reader with my student ID and I just kind of did that.” Likewise, another student noted, “well actually I got confused two or three times I went to a wrong place because as you said the university is quite big and the instructions at the beginning as an international student weren’t there.” Similarly, a student shared that “So I haven’t had someone tell me about it, or when I got my student ID or something, if there was a brochure with it that came with my student ID, that I could like look at or a map for something that would have been helpful, definitely.” Worse, one participant was unaware that the university & city transit systems were
operated separately: “[…] which is part of the main reason I haven’t used the university system yet because I don’t know their routes. I don’t know where to catch them, what bus stops there are and stuff. I see them going around. I see one coming towards my place, around my area too, but that might have been a better option for me to use than the city bus, but I don’t know how to use it.”
These experiences are in stark contrast to a few of the students who attended the UMN-TC orientation days where they learned how to use the campus bus system but not the city transit system. For instance, one student liked that “the Humphrey School has a kind of like a buddy program, so they assigned me a second-year student and this person actually showed me how to take the bus.”
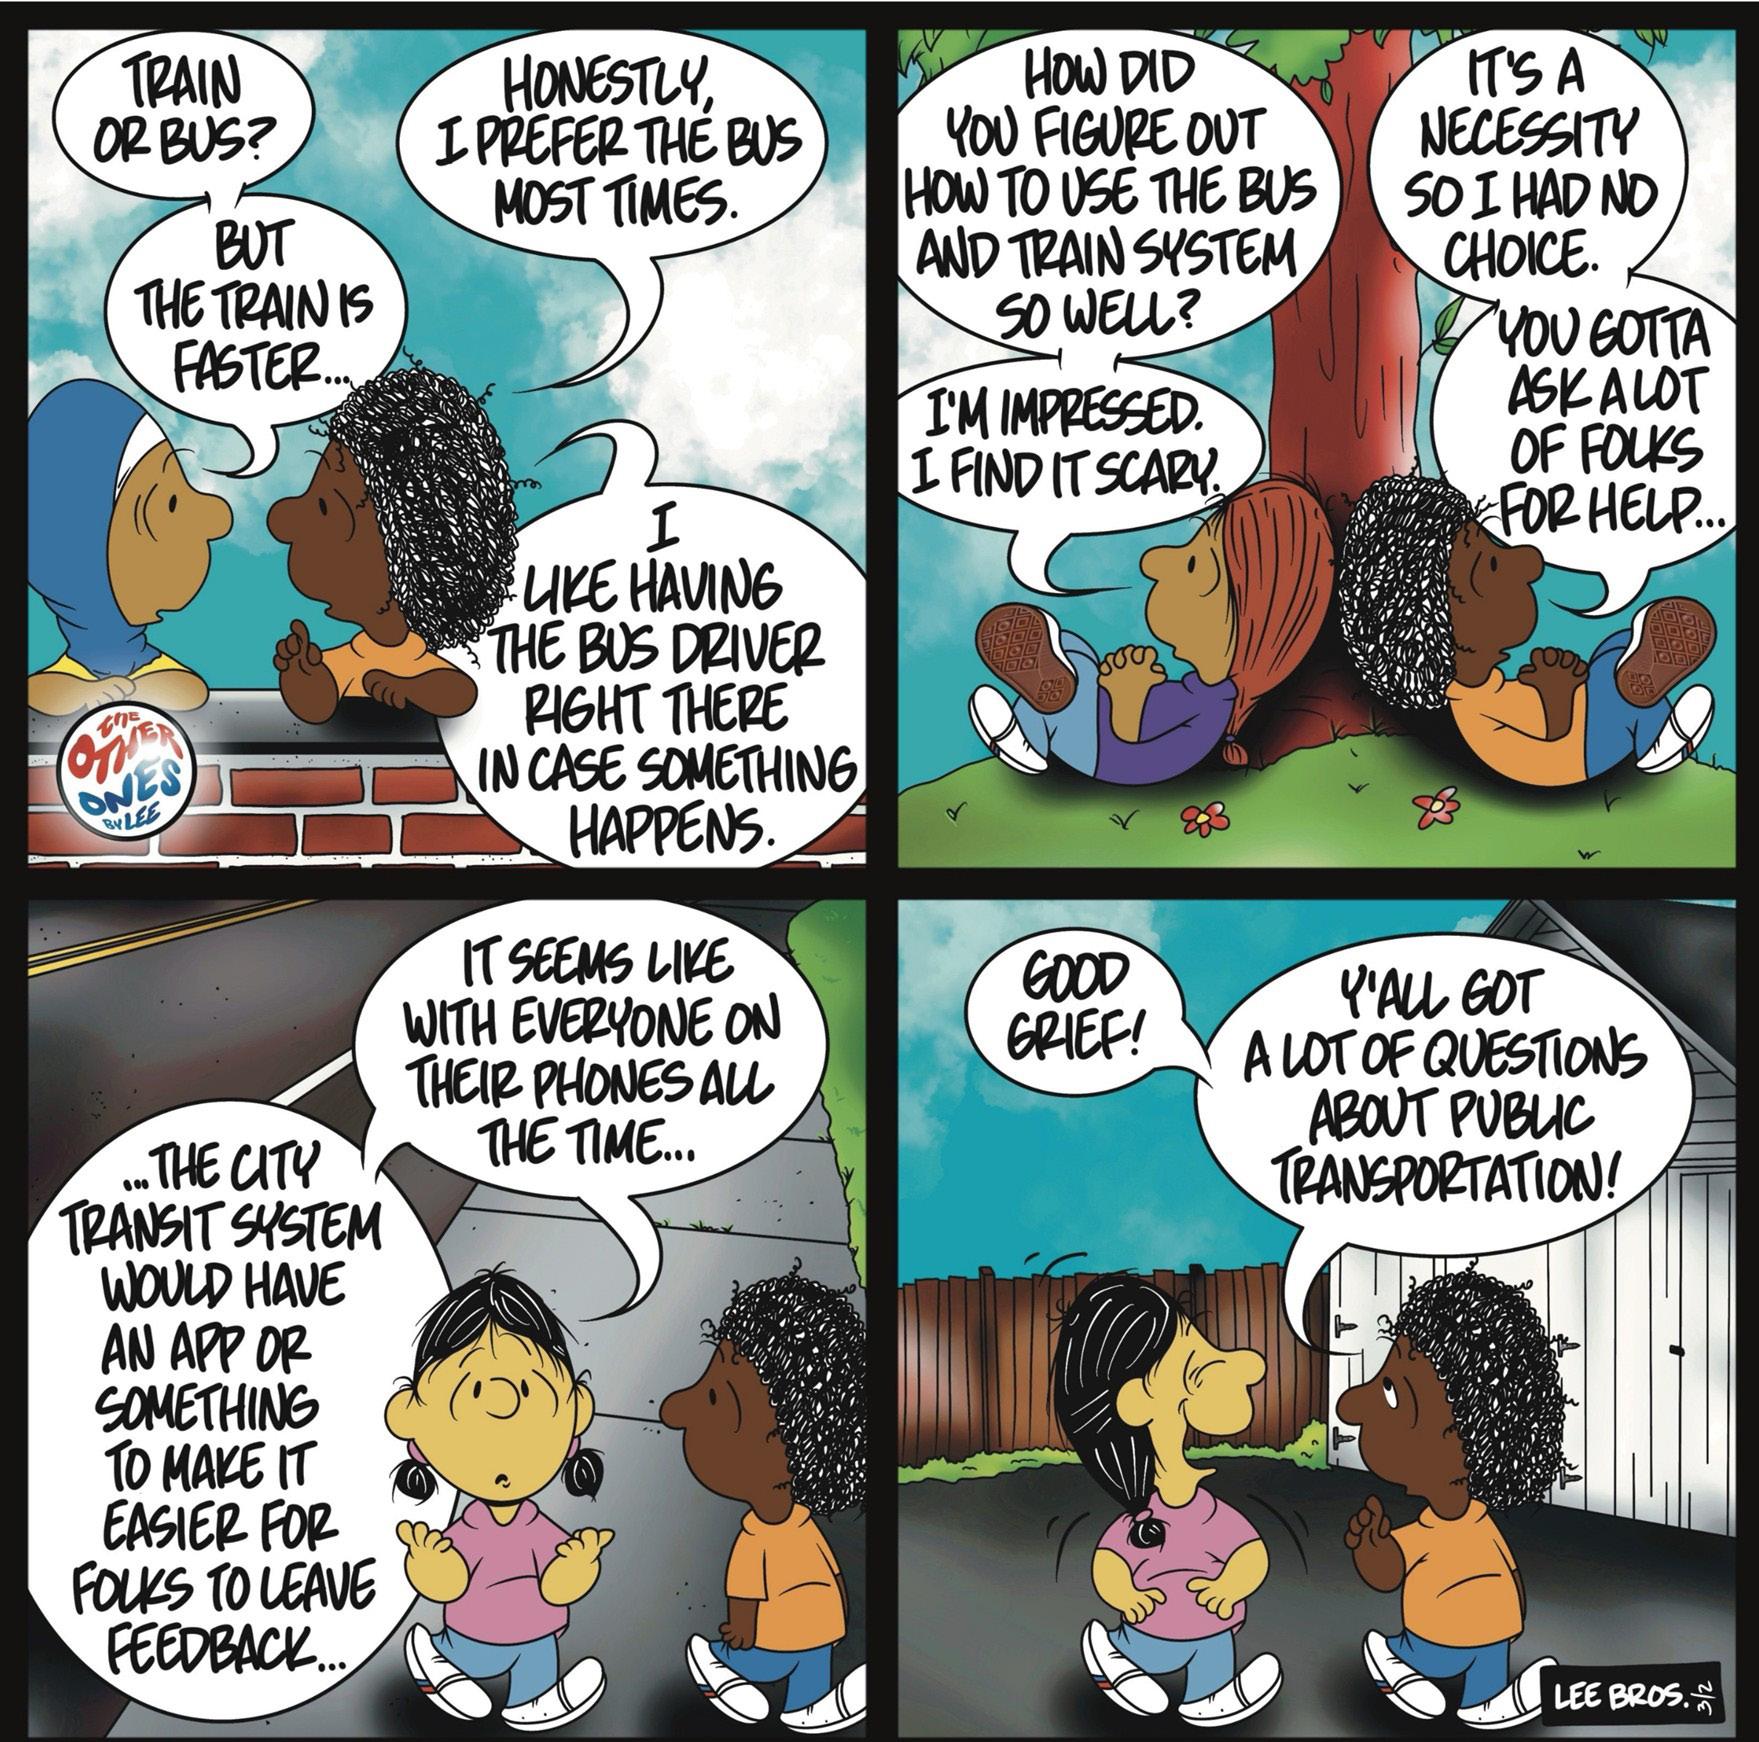
Transit Digitalization: Relying on Apps to master the transit system
While almost all their transit stories started with relying on someone else, students use apps to track where the transit is, to be on time, and to find their way around. As this student put it “[w]e’re all on our phones all the time.” Although their learning experience begins as “a trial and error” process, some students believe that apps and websites are more trustworthy than humans and “I guess, again, it comes to finding the right information and also easily accessible. I can ask a friend, but also, I’m not sure if my friends even use it because a lot of them just try. And also, they might not know the whole picture. So, it’s better to find out from a reliable resource.” International students who are new to the city already know how to use Google Maps, “so here in the United States when I arrived I […] knew that I had to use a Google Maps.”
Students were surprised to learn about TIC, as one said, “I didn’t know that real people help with this.” The student usually uses Google Maps to figure out transit routes but also feels like Google Maps is unreliable. Students attending the event made one critical suggestion:
for new students, there could be more support introducing them to transit lines and how to take public transit more broadly during welcome week.
The program could help expose incoming students to transit (plan trips, use maps, etc). For instance, a participant shared that they would want to learn “even how to read the maps, they are not intuitive if you haven’t taken transit before.” Transit digitalization is about using software and technology related transit to find at what time the next bus or train departs/arrives for example. It includes being able to navigate the transit system by looking and following maps (or more generally map-based apps) on your phone to make the transit experience more seamless, one click/screen away.
(2) WAYS TO PROVIDE FEEDBACK: PARTICIPATING INTO PLANNING
All students but one shared their preferred ways to provide feedback either to the university or to the city transit system. They use surveys, transit apps, websites such as live forums, although they believe that having a conductor/driver will be faster for a response instead of someone in an office who would be hard to find, oneone-conversation such as interviews. “I can say we’re all on our phones all the time. So it’s better to just like type in whatever you’re feeling at the moment and just send it instead of trying to go find a forum somewhere in the office.” Students called for a collaboration between the public transportation agencies and the university to improve routes and time management: “I feel like since we have a collaboration with […] public transportation here in the cities, I wonder if there can be a form sent out, like, similar to like [Student Rating of Teaching] but just kind of like going like, if this is because I assume they can track who takes transportation based off like, you cards, I would assume you could also like send out surveys to the users and like, what are ways that like, we could improve, which would include routes and like, time management, but I feel like that’s, that might be an effective way.”
Students are willing to provide feedback if incentivized with coffee, cash, gift cards, donuts. As one student noted, “for me to provide feedback, I think I need something in return for that feedback because people aren’t just going to go up and be like, oh, this place is good or like this place sucks, that type of thing. So, someone would have to ask me and give me something in return for it.”
Another type of incentive would be to renew their student pass for free if they were to provide feedback: “if you really want to enforce them to give feedback at the end of the year, I’d like them to renew their transit pass or something, require them to give feedback on.”
A surprising type of incentive was a non-monetary motivation to provide feedback, “I think it like takes something kind of like pretty personal to happen that can then drive your interest to do something about it.” Elaborating about this motivation, the student explains
that “for all of us who have ever like … have the bus miss us, um, I’m sure that would make a lot of people pretty angry and maybe more inclined to respond to like a survey about their transit experience.”
DISCUSSION
This study contributes to understanding the barriers university students face when moving to and from campus and ways for them to be involved in the decision-making process regarding transit planning to improve their educational experience and their well-being overall.
The findings show that convenience is understood by students as reliable and frequent transit. Reliability and frequency are more difficult to achieve regardless of whether the students want to travel near or far from the university. The findings also reinforce the human dimension of transit. The fact that students had to talk with someone to learn and understand the transit system underscores their need for (more) formal education on how to use the public transportation, especially for those who are new to the city/campus. Most of the time, their experience with what I call transit digitalization came after talking to someone, thus putting emphasis on coupling any educational programs with promoters (such as transit ambassadors) of the transit systems and apps, websites, etc. Those two features (human dimension of transit and transit digitalization) are also intertwined in the ways students want to provide feedback. Their phone is the main medium/vehicle to convey feedback regarding how to improve getting to and from campus, but they still believe that having someone in the transit provides a faster response for feedback and incident response.
These insights could inform both PTS and TIC’s work. Beyond educational navigation, PTS should update the design of campus transportation systems with students. Similar ideas have been adopted at the University of California, Davis with a distinctive approach to public transit that, while not universally applicable, has been highly effective for the campus and its surrounding community (“Home | ASUCD Unitrans” 2024). Initially established as a campus shuttle, Unitrans has grown into a community-wide transportation system (“Home | ASUCD Unitrans” 2024). Operated predominantly by
students—drivers, supervisors, and managers—with support from a small team of full-time staff, the program thrives on low operating costs and strategic planning of routes through densely populated areas (Force 2004). This ensures fuller buses and greater efficiency. Although university students make up 95% of riders, the service also caters to senior citizens, high school students, and other residents, thanks to city funding that extends its reach beyond the campus. A former General Manager of the Program credits the program’s success due to its unique model and collaborative support from the city (Force 2004).
WHAT IS NEXT?
Further investigation into the idea of student transit ambassadors is warranted by the results of the study. Reflecting on her experience, one of the student codesigners highlighted that she “appreciated that trust in allowing us to […] individually help […] in our own way in your project.”
Based on the discussion, I recommend the co-creation of a curriculum to fulfill students’ needs and concerns. Combining several elements, the current UMN-TC Parking and Transportation services webpage could serve as the host of FAQs, how-to videos and tutorials, and customized consultations.
UMN-TC might follow the example of another university in Minnesota, St. Cloud State University. Cloud State University partners with Metro Bus, the main transit operator in the area, to offer several trainings for the general public, including students as part of a federally funded initiative (Geving 2024). Through this program, the travel training center offers personalized instruction through one-on-one sessions, small or large groups, and classroom settings. During these sessions, trainers teach skills such as reading schedules, paying fares, signaling for stops and planning trips (“Travel Training | Metro Bus” 2024). In one-on-one training, travel trainers visit riders at their homes, guide them to the closest bus stop, and accompany them to their desired destination (“Travel Training | Metro Bus” 2024).
Similarly, Move Minneapolis, a non-profit leader in sustainable commuting, presently offers 15-minutes virtual/ phone transportation consultation sessions with their staff Fridays between 9am and 3pm (“How Can We Help You?Move Minneapolis” 2023). These models could be replicated and tailored for university students with students’ transit ambassadors helping other students along with providing opportunities for student/community engagement practices designed toward a more inclusive urban and regional transit system.
KEY TAKEAWAYS
• UMN-TC students remind us of the human dimension of transit intertwined with its digitalization.
• A transit ambassador program is a viable solution to support students navigating their transportation challenges
• Students will provide feedback (to the transit ambassador) when offering incentives
• This is a call to action for transportation systems. Including universities and transit agencies
WORKS CITED
“Fiscal Year 2023 | Parking & Transportation Services.” n.d. Accessed March 17, 2025. https://pts.umn.edu/resources/ about/annual-reports/fiscal-year-2023.
Bullard, R. (2003). Addressing Urban Transportation Equity in the United States. Fordham Urban Law Journal, 31(5), 1183. https://ir.lawnet.fordham.edu/ulj/vol31/iss5/2
“Contact Us - Metro Transit.” n.d. https://www. metrotransit.org/contact-us.
“Customized Consultations - Move Minneapolis.” 2024. Move Minneapolis. September 23, 2024. https:// moveminneapolis.org/customized-consultations/.
Design Kit. ”Designkit.org”. https://www.designkit.org/
“Enrollments | Institutional Data and Research.” n.d. University of Minnesota. Accessed March 27, 2025. https:// idr.umn.edu/reports-by-topic-enrollment/enrollments.
Force, Kristen. “Public Transit 101: Effective Planning for College Campuses.” https://www.metro-magazine. com/10008845/public-transit-101-effective-planningfor-college-campuses
“Guidance for Living Expenses – Higher Ed | College Board.” n.d. https://highered.collegeboard.org/financialaid/policies-research/budgets.
“Home | ASUCD Unitrans.” 2024. December 13, 2024. https://unitrans.ucdavis.edu/.
“In The Shadow of the Ivory Tower.” 2024. Hachette Book Group. March 25, 2024. https://www.hachettebookgroup.
com/titles/davarian-l-baldwin/in-the-shadow-of-theivory-tower/9781568588919/?lens=bold-type-books.
Karner, A. and R. Duckworth. “‘Pray for Transit’: Seeking Transportation Justice in Metropolitan Atlanta.” Urban Studies, 2019. 56(9): 1882-1900.
Marcantonio, R., A. Golub, A. Karner, and L.N. Dyble. “Confronting Inequality in Metropolitan Regions: Realizing the Promise of Civil Rights and Environmental Justice in Metropolitan Transportation Planning.” Fordham Urban Law Journal, 2017. 44(4): 1017-1077.
Pothier, Melanie, Nishan Zewge-Abubaker, Madelaine Cahuas, Carla Borstad Klassen, and Sarah Wakefield. 2019. “Is ‘Including Them’ Enough? How Narratives of Race and Class Shape Participation in a ResidentLed Neighbourhood Revitalization Initiative.” Geoforum 98 (January):161–69. https://doi.org/10.1016/j. geoforum.2018.11.009.
“Social Determinants of Health (SDOH)” 2024. About CDC. January 17, 2024. https://www.cdc.gov/about/ priorities/why-is-addressing-sdoh-important.html
“Travel Training | Metro Bus.” 2024. Metro Bus. June 13, 2024. https://ridemetrobus.com/home/travel-training/.
West, Charlotte. “A Surprising Reason Preventing some students from finishing college: lack of transportation.” Washington Post. December 10, 2021. https://www. washingtonpost.com/education/2021/12/10/collegestudents-transportation-struggles/
PRINCIPLES TO DESIGN A SUCCESSFUL BIKE SHARE NETWORK IN A SMALL OR MEDIUM CITY
JOSEPH WOMBLE
Joseph Womble is a first-year student in the Master’s of City and Regional Planning program at UNC Chapel Hill. His studies focus on transportation systems and their intersections with housing and broader land use. Previously, he provided technical assistance to local governments seeking to advance clean energy and clean transportation goals.
ABSTRACT
Over the last decade, bike share systems have expanded across the United States. Bike share systems offer opportunities to ride for people who are interested in urban cycling but uncertain about investing in their own bicycle. These systems can increase urban cycling, offer first- and last-mile mobility solutions, and build a bike culture that drives investment in safe cycling infrastructure.
While bike share systems with the highest total ridership are in larger cities such as New York, Washington, D.C., Montreal, and Chicago, smaller municipalities have also embraced bike share systems with varying degrees of success (Shared Micromobility Report, 2024). This paper analyzes the bike share systems of three small and medium municipalities in North America: Chattanooga, Tennessee; Aspen, Colorado; and Pittsburgh, Pennsylvania. Through case studies of these municipalities and a comparison of factors including pricing structures, station proximity to residences and workplaces, and type of facilitating partnership (i.e., public, private, or a public-private partnership), this paper begins to establish principles for successful bike share system design for smaller communities.
INTRODUCTION
The explosive growth of micromobility over the last decade has been transformative for cities around the world (NABSA 2024). As policymakers in various geographies consider how to meet ambitious climate and equity goals, expanding access to micromobility has emerged as a key way to replace some vehicle trips. In the United States in 2018, for example, 48% of all car trips in the 25 most congested metro areas were shorter than three miles (Reed, 2019; Figure 1). Replacement of even a relatively small portion of these car trips with trips on micromobility devices, such as bikes, scooters, and skateboards, would help cities meet emissions reduction goals from the transportation sector (Reed, 2019). Meanwhile, greater use of micromobility devices, along with adequate associated infrastructure, could expand access to destinations for populations that do not have the ability to drive or access to a personal automobile.
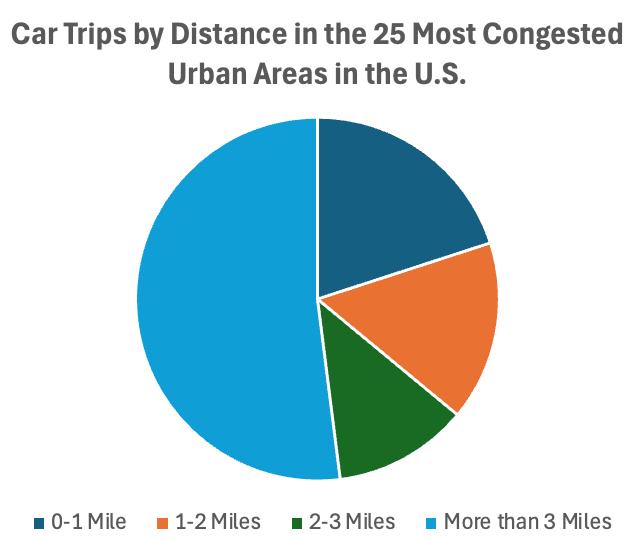
Micromobility devices can be separated into two categories: privately-owned micromobility devices and shared micromobility devices. While addressing affordability of and access to privately-owned micromobility is an important question for policymakers, this paper focuses on shared micromobility systems. Within shared micromobility, there are three main kinds of devices that have gained popularity in the United States: e-scooters, traditional pedal bikes, and e-bikes (BTS, n.d.). This paper primarily focuses on bike share systems that include traditional pedal bikes and e-bikes.
Docked and dockless bike share programs have expanded significantly in the last decade; however, some cities’
progress was hindered by the COVID-19 pandemic (Summary of Docked Bike Share Trips..., n.d.). While the number of docked bike share systems has declined since COVID-19, the number of docked bike share stations within the systems that still exist has increased (Summary of Docked Bike Share Trips..., n.d.; Figure 2). However, even as it has been challenging for new bike share systems to start operations, docked bikeshare rides peaked in 2023 at 61 million in the U.S., surpassing previous records of 53 and 47 million, set in 2022 and 2021, respectively (Shared Micromobility Report, 2024).
Dockless bike share systems have fluctuated significantly over the years, reaching a peak of 125 systems in 2018 and falling to 60 systems in 2024 (Summary of Docked Bike Share Trips..., n.d.) Ridership numbers for dockless bike share systems are dwarfed by ridership of dockless e-scooters (Summary of Docked Bike Share Trips..., n.d.).
While many larger cities in the United States have established bike share systems that now seem to be a semi-permanent part of the urban fabric, medium and small urban areas have also experimented with bike share systems. These areas are often less dense and typically have smaller budgets than larger cities.1 For these reasons, bike share systems in medium and small urban areas often have lower total ridership (Summary of Docked Bike Share Trips..., n.d.). This paper seeks to identify principles for successful bike share system design for medium and small urban areas in the United States.
METHODOLOGY
The research process for this paper consisted of a literature review, an analysis of docked bike share stations by municipality size, and detailed research on the docked bike share systems in three medium and small urban areas.
For the purposes of this paper, large urban areas are defined as having populations of more than 500,000; medium urban areas are defined as having populations of less than 500,000 but more than 200,000; and small urban areas are defined as having populations of less than 200,000 but more than 50,000 (Urban population by city size, n.d.).
This paper uses some terminology that may be helpful to clarify:
• Micromobility: small, low-speed vehicles intended for personal use, including bikeshare systems, electric-assist bikes, and electric scooters (GarciaColberg, 2021).
• Bikeshare stations: individual locations where bikes can be docked
• Bikeshare systems: a collection of more than one bikeshare stations within a specific geography that are operated by some entity
• Docked bikeshare: shared bike systems for which rides must be started and ended at a docking station at specific select locations
• Dockless bikeshare: shared bike systems for which rides can be started and ended anywhere within a specific service area
To determine which urban areas to focus on in the case studies section, I analyzed the Bureau of Transportation Statistics’ map of docked bike share systems and stations, along with an article from the National League of Cities highlighting successful bike share programs in small towns (Funk, 2022).
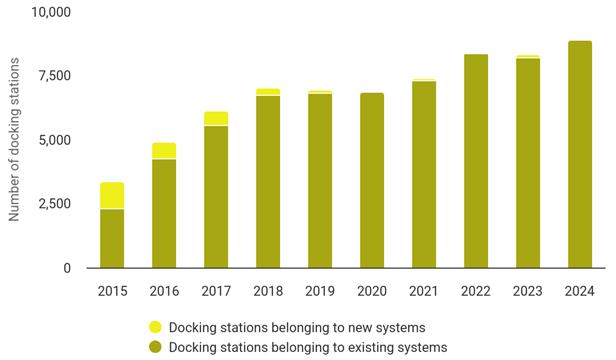
CASE STUDY: CHATTANOOGA, TENNESSEE
Chattanooga, which is considered a small urban area with a population of 187,030, has a relatively successful docked bike share system. “Bike Chattanooga” has 43 stations and peaked at 12,172 monthly trips in May 2021.2
Bike Chattanooga does not offer a single-ride pass for bikes and e-bikes; instead, it offers daily, 3-day, and annual passes (Table 1).
Bike Chattanooga’s stations are primarily concentrated around destinations of interest and areas with the greatest population density (System Map, n.d.; Figure 3). However, the system does offer stations at destinations of interest outside the downtown core.
Daily Bike Access Pass
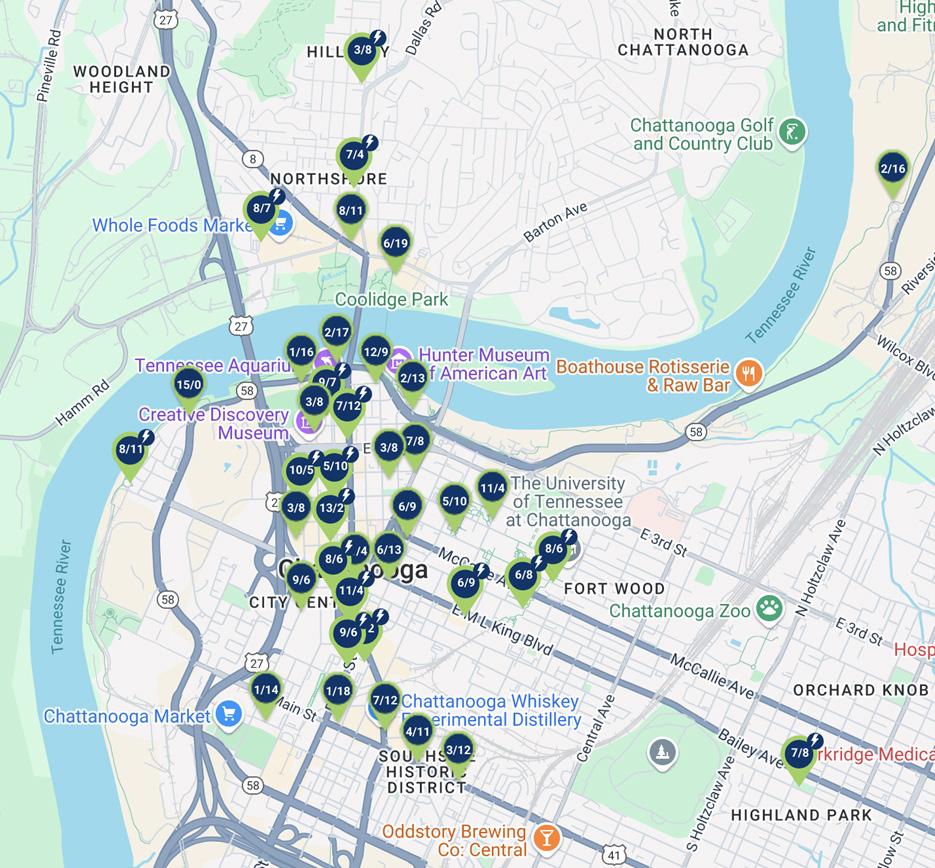
$10 for unlimited 60-minute rides for 24 hours, with an overage fee for rides over 60 minutes of $5 per 30 minutes of trip time
3-Day Bike Access Pass
Annual Bike Pass
Docked E-Scooters
$20 for unlimited 60-minute rides for 72 hours, with an overage fee for rides over 60 minutes of $5 per 30 minutes of trip time
$50 for unlimited 60-minute rides for one year, with an overage fee for rides over 60 minutes of $5 per 30 minutes of trip time
$1 to unlock + $0.35 per minute
For example, there are several stations along the Tennessee River well outside of downtown Chattanooga that could be used for recreational rides.
Bike Chattanooga offers a selection of traditional pedal bikes and e-bikes, but their focus is on pedal bikes. Their website includes a clear dashboard that indicates the number of pedal bikes and e-bikes available at any given station, along with the number of open docks at that station if riders wish to finish their trip there (Figure 3).
Bike Chattanooga is a compelling example of how a midsized community can successfully create and operate a popular and sustainable bike share system that caters to commuters and recreational cyclists alike.
CASE STUDY: ASPEN, COLORADO
Aspen has a population of 6,612, although given its status as a ski resort town, this number fluctuates seasonally. Aspen’s bike share program is called “WE-cycle” and is intended to provide first- and last-mile connections to transit, as well as short rides. WE-cycle now also serves areas surrounding Aspen, including Snowmass Village, Basalt, Willits, El Jebel, and Carbondale (WE-cycle, n.d.). More than 37,000 riders chose to use WE-cycle in just Aspen in 2021 (Funk, 2022).
WE-cycle is free of charge for rides of less than 30 minutes. For rides that exceed 30 minutes, users of pedal bikes are charged $0.50 per minute, and users of e-bikes are charged $5.00 per minute (WE-cycle, n.d.). For longer rides, WEcycle offers what appears to be a comprehensive list of community partners that offer long-term bike rentals.
The system currently consists of 255 pedal bikes, 201 e-bikes, and 88 stations. WE-cycle’s pedal bikes are silver and their Class 1 pedal assist e-bikes are blue. Due to lower e-bike battery life and battery degradation concerns in cold weather, e-bikes are unavailable for public use in Carbondale in winter months (WE-cycle, n.d.). In addition, WE-cycle’s Mid-Valley and Upper-Valley systems were closed for the winter of 2024-2025.
WE-cycle was initially funded through a nonprofit and “adopt-a-bike” donations, through which community members and institutions can pay for the upfront cost of a bike. This allowed for initial capital investment in bikes and docking stations, which garnered further public attention and interest in the program, in turn allowing for increased public and private investment (Funk, 2022). By designing their system to facilitate first- and last-mile transit connections, WE-cycle serves as a good example for establishing bike share systems in tourist towns.
CASE STUDY: PITTSBURGH, PA
Pittsburgh is home to one of the oldest docked bike share programs in the U.S., with its system launching in 2001 (Summary of Docked Bike Share Trips..., n.d.). Pittsburgh’s “POGOH” system added 22 stations and 220 bikes in 2023,
which added station density downtown and expanded farther into other parts of the city previously without bike share access. In the same year, POGOH had 211,251 total trips, a 166% increase from the previous year (POGOH, 2023). With a population of 303,255 people within city limits, Pittsburgh is considered a medium city for the purposes of this article.
As of March 2024, there were 60 POGOH stations across Pittsburgh, which house more than 200 pedal bikes and more than 300 e-bikes (POGOH, 2023). POGOH is aiming to expand even further by adding more than 50 new stations over the coming years, including into other municipalities in Allegheny County (Davidson, 2024).
“We have a vision that POGOH stations cover every neighborhood in the city, and that over time our network will extend to many innerring municipalities in Allegheny County.”
- David White, Executive Director of Bike Share Pittsburgh, the nonprofit that operates POGOH
Pay-As-You-Go
Flex Pass
Annual Membership
Annual “Mobility Justice”
Membership
$4 for each 30 minutes you ride a traditional pedal bike; $5.50 for each 30 minutes you ride an e-bike
$25 for 200 minutes of total ride time that must be used by the end of the year
$120 for one year of unlimited 30-minute rentals, with overage fees for rides over 30 minutes
$10 for one year of unlimited 30-minute rentals, with overage fees for rides over 30 minutes
Corporate Membership Significant discount offered to universities and employers in Pittsburgh
Like many bike share systems, POGOH offers significant discounts to universities and employers that agree to pass along or match these discounts for their students and employees. The University of Pittsburgh, for example, offers free 30-minute rides on POGOH to its students, which may be a large part of why the University constitutes 60% of the POGOH system’s rides (University of Pittsburgh, 2024).
KEY PRINCIPLES
This section seeks to distill broader research about bike share system design, as well as the three case studies above, into a set of key principles for local governments and their nonprofit and private partners to consider. Some of the key principles outlined in this section are not specific to small and medium urban areas; many of the policy recommendations that lead to successful bike share system design in large urban areas are the same in small and medium urban areas.
• As much as possible, bike share systems should leverage existing community gathering spaces when deciding where to site stations, such as libraries and community centers. These are highly visible destinations of interest that can generate additional enthusiasm for a bikeshare program. Chattanooga, Aspen, and Pittsburgh take advantage of destinations of interest in their siting of bike share stations.
• Intentional placement of bike share systems in proximity to destinations of interest is very important to their success (Scott and Ciuro, 2019). This is true in small and large urban areas alike, but destinations of interest and areas with relatively high population density are more likely to have greater demand for shared micromobility.
• Investments in protected bike infrastructure, including greenway trails and on-road protected bike lanes between destinations of interest, are important for the success of bike share systems. With nowhere to safely ride, a system is unlikely to be successful.
• Partnering with large employers and universities to offer bike share as a free or reduced-cost benefit to their workforce or students can be a way to stimulate community interest in the program and improve the odds that it will be fiscally sound, as demonstrated by POGOH’s partnership with the University of Pittsburgh.
• Bike rental options should be limited to 30, 45, or 60 minutes (depending on the local context) with overage fees for longer rentals. Especially when systems are trying to be initiated or expanded, having sufficient circulation of bikes within the system is important to their success. All three case studies have fees that increase once you surpass a certain threshold.
• While docked bike share is a more permanent solution and dockless bike share can create headaches of its own, incentivizing dockless bike share companies to come to a small or medium urban area without any shared micromobility options can be a good, low-cost way to gauge initial interest in a more expansive program.
• Small and medium urban areas tend to have less destinations of interest, so a greater proportion of interested riders may want to use bikes for recreational purposes rather than commuting. By offering longer-term rentals of bikes and associated equipment (e.g., bike racks for cars) or contracting with community bike shops and other partners that can offer longer-term rentals, small and medium urban areas can expand the number of people and type of riders who might be interested in using shared bikes. WE-cycle and Bike Chattanooga offer information on longer-term bike rentals on their website.
• Offering e-bike options alongside traditional pedal bikes is now considered standard for most bike share systems and can increase uptake. All three case studies that were analyzed offer both traditional pedal bikes and e-bikes.
CONCLUSION
Shared micromobility, including shared pedal and electric bicycles, have demonstrated their popularity when paired with adequate bike infrastructure, multiple payment options for different kinds of customers, and sufficient destinations of interest. While many shared micromobility systems took a hit from COVID-19 and associated changes in behavior, systems in some geographies have continued to thrive (Shared Micromobility Report, 2024). To realistically offer bike share in small and medium urban areas, it is important for policymakers and other relevant stakeholders to consider key factors, such as development patterns and behavioral attitudes, that may differentiate cycling patterns in these areas from their larger counterparts.
FOOTNOTES
1. Most docked bike share systems are created and expanded through public-private partnerships, meaning that some public investment is often necessary to make system creation or expansion financially feasible.
2. No data was provided to BTS starting in July of 2022 through present day, so this peak may have been surpassed in the period between July of 2022 and February of 2023. Starting in February 2023, Bike Chattanooga posted estimates of its monthly trips taken on its Instagram page (Bike Chattanooga, n.d.).
WORKS CITED
2023 Ride Report | POGOH. (2023). https://pogoh.com/ blog/2023-ride-report/
Bike Chattanooga. (n.d.). Bike Chattanooga [Instagram page]. Instagram. Retrieved February 3, 2025, from https:// www.instagram.com/bikechattanooga/
Davidson, L. (2024, March 24). POGOH Bike share Hits 1 Million Rides, Proposes 53 New Stations. Pittsburgh Magazine. https://www.pittsburghmagazine.com/pogohbike share-hits-1-million-rides-proposes-53-new-stations/
North American Bike share & Scootershare Association (NABSA). (2024). 5th Annual Shared Micromobility State of the Industry Report. https://doi.org/10.7922/G2DF6PKP
Funk, K. (2022, June 3). Bike share Solutions for Small Cities & Towns. National League of Cities. https://www. nlc.org/article/2022/06/03/bike share-solutions-forsmall-cities-towns/
Garcia-Colberg, M. (2021). Transit and Micromobility (No. 230). Transportation Research Board. https://doi.org/10.17226/26386
POGOH | Parking, Transportation & Services | University of Pittsburgh. (2024). University of Pittsburgh. https://www.pts.pitt.edu/mobility/pogoh
Reed, T. (2019, September). Micromobility Potential in the US, UK and Germany. https://documentcloud.adobe.com/spodintegration/index. html?locale=en-us
Scott, D. M., & Ciuro, C. (2019). What factors influence bike share ridership? An investigation of Hamilton, Ontario’s bike share hubs. Travel Behaviour and Society, 16, 50–58. https://doi.org/10.1016/j.tbs.2019.04.003
Shared Micromobility Report: 2023. (2024, July). NACTO. https://nacto.org/publication/shared-micromobilityreport-2023/
Summary of Docked Bike share Trips by System and Other Attributes. (n.d.). Retrieved December 22, 2024, from https://data.bts.gov/stories/s/Summary-of-DockedBike share-Trips-by-System-and-Ot/7fgy-2zkf/
System Map. (n.d.). Chattanooga Bicycle Transit System. Retrieved April 18, 2025, from https://bikechattanooga. com/system-map/
Urban population by city size | OECD. (n.d.). Retrieved November 26, 2024, from https://www.oecd.org/en/ data/indicators/urban-population-by-city-size.html
U.S. Census Bureau. (2023). 2019-2023 American Community Survey 5-Year Estimates.
WE-cycle | Roaring Fork Valley Bike share. (n.d.). WECycle. Retrieved December 22, 2024, from https://www. we-cycle.org/
HOW THE SPRAWLING DESIGNS OF TODAY’S SCHOOL CARPOOL LINES MAKE TRAFFIC WORSE
ANNA LYNCH
Anna Lynch is a freshman at UNC Chapel Hill studying computer science, public policy, and urban planning. Her work focuses on applying analytics to advance transportation policy, with an emphasis on helping public transit more affordably expand. She spends her time at UNC leading the school’s urban planning club, BuildUP, and in UNC’s game development club. Beyond Chapel Hill, Anna works as a technical intern at analytics firm SAS Institute and as a mobility developer at transit technology start-up People Moving People.
ABSTRACT
Today, 54% of K-12 students arrive to school in a private vehicle (Bureau of Transportation Statistics, 2017). This is a seismic shift from 40 years ago, when more than 60% of students took the bus to school (Safe Routes to School, 2009). To accommodate drivers, schools have invested heavily into designing increasingly intricate, increasingly long carpool lines for drop-off and pick-up. At first glance, carpool line expansion looks like a sensible response to congestion, but could the expansion of school carpool lines actually cause even more traffic for schools? Economics says yes. The economic principle of induced demand explains that expanding a roadway’s capacity reduces the opportunity cost of driving, enabling demand to increase. As drivers make trips previously discouraged by traffic, even more cars pour into the widened road than before. Before too long, the road—or carpool line—is just as congested as it was before expansion. Induced demand suggests that the longer school carpool lines that were built to control congestion have only aggravated the problem. Induced traffic is especially concerning in a school setting, as schoolyard traffic jams expose children to air pollution and burden parents with lengthy drop-off and pick-up waits. Worryingly, both school congestion and carpool lines seem to be growing, with no end in sight. The good news is that there’s a promising escape from the vicious cycle of school carpool line expansion: schools and surrounding neighborhoods that afford kids safe, sustainable, healthy ways to get to class. By creating a built environment fit for our kids, we can promote students’ health, give parents precious time back, and build stronger communities for everyone.
Carpool lines have become a mainstay of new school construction, especially in suburbs. In a school carpool line, private vehicles, driven by (predominantly female) caregivers (Audrey 2016), queue in front of a school building at the start and end of the school day. This design enables guardians to drop their children off while driving to work and pick them up on the way home, saving time and enabling parents to spend more time with their children. Since private cars now carry most students to school, carpool lines have become major players in suburban traffic ecosystems: in fact, up to 30% of peak traffic is caused by parents driving their children to school (Dubay 2003). Traffic-clogged roads outside of schools have prompted school designers and local leaders to try shifting school-bound cars from the road into purposebuilt, high-capacity carpool lines. Those efforts, however, could do more harm than good.
A huge concern for expanding school transportation is induced demand, a well-documented economic phenomenon describing how increasing a product’s supply to alleviate excess demand can backfire. Induced demand describes how increased capacity invites new demand as some who chose not to consume the product begin to do so (Lee 1999). The powerful term doesn’t originate far from school transportation, as economists and planners invented the idea to describe shortcomings of growing roadway networks. The traditional example of induced demand describes a congested freeway finally being widened, only to find itself more acutely traffic-choked than before. Induced demand can describe shifts affecting many goods, but the principle has not previously been applied to school transportation. Signs that the principle is in play here are strong though, with expanding carpool capacities accompanied by a dramatic change in how our children get to school.
A massive upheaval has occurred in school transportation at the same time as our carpool lines have lengthened: a startling number of journeys to school have shifted from buses and sidewalks to cars. Where only 15% of US K-12 students arrived to school in a private car in 1969, 50% of students did so in 2000 (Giuliano 2017). The share has only increased since (Jenkins 2019). This school bus ridership collapse has supersized school traffic loads and the resulting risks to students. Heavier carpool traffic is associated with higher exposure to pollutants and deadly crashes, which school-bound cars cause 37 times more frequently than school buses (Transportation Research Board 2003).
The cyclical trends of school bus ridership collapse and carpool line expansion are reflected in real world examples across the United States. Changes in carpool lines are evidenced by data from public middle schools in Wake County, North Carolina, a large, diverse county. The Wake County Public School System (WCPSS), which includes all public schools in the county, is the 15th largest by enrollment nationwide. The school district is diverse and relatively representative of America’s children, enrolling a class that is 41% White, 21% Black, 20% Latino, and 4% Asian (WCPSS 2025). The county’s land uses are lower density than most American counties (Wake’s population density is a tenth that of Suffolk County, Massachusetts for example), which may correspond to unique transportation patterns. Wake County’s suburban landscape, however, is quite common among American metropolitan areas and contributes to Wake County’s strength as a microcosm for transportation trends in heavily suburban school districts.
Middle schools were chosen for this analysis because they feature fewer transportation design elements than other schools: middle school students don’t need extensive youth protection features found in some elementary schools, and there are no student drivers to demand parking like in high schools. Overall, the surveyed middle schools represent more than 70 years of evolution in school transportation attitudes in an area with similarly suburban land uses to much of the US. The majority of the surveyed schools were built alongside heavy development in the region from 1989 to the present, and the median opening year of sample schools was 2000.
Since 1950, school carpool lines have evolved from a minor piece of the school design process to a substantial portion, or even majority, of the total land used for newly built public schools. The change is jarring: every surviving Wake County middle school built prior to 1988 had a queue less than half the length of even the shortest lines built in the last 17 years. School carpool lines have exploded in length over the last 30 years, and that growth shows no sign of stopping.
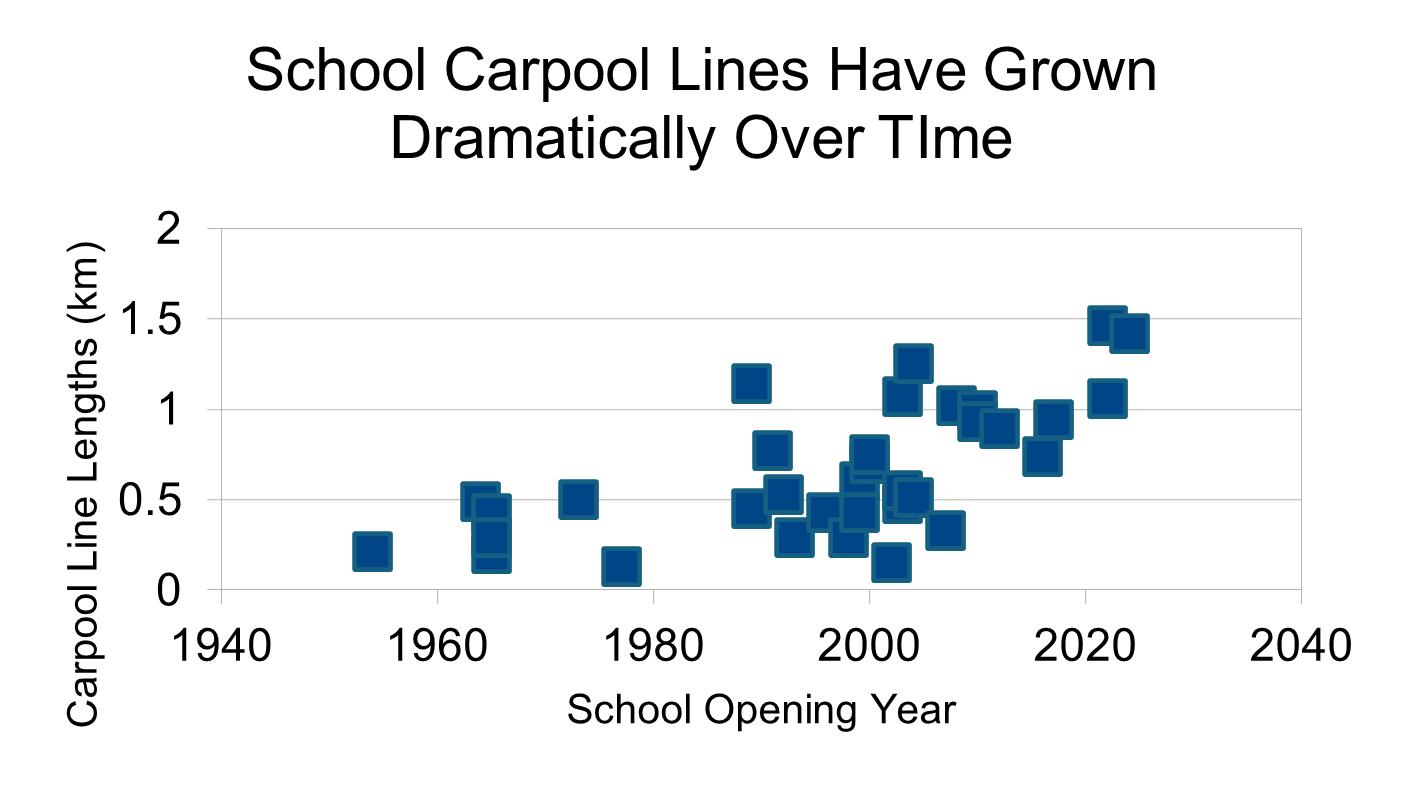
The growth of school carpool lines coincides with the growing school bus ridership collapse. Based on the principle of induced demand, expanding carpool lines are very likely encouraging parents to take their children to school by car, thereby making traffic even worse. To see whether induced demand truly applies, a well-designed study could determine if otherwise similar schools see statistically significantly differences in transportation mode mixes depending on the structure of their school carpool length. Such an effort is outside of the scope of this paper.
While research remains limited, we understand that exposure to busy roadways is bad for children’s health and educational outcomes. These aren’t small changes either–one paper found that whether a school’s location was downwind of a highway had four times the impact on its students’ performance as teacher quality (Webber 2019). While the pollution from highways is bad enough, vehicles idling emit magnitudes more pollution than those moving at speed (McNalty 2019). The pollution from school carpool traffic contributes to point pollution near schools even more strongly than roads, potentially making a devastating impact in students’ health and educational outcomes. To better address students’ safety needs, research should investigate whether there exists a link between school carpool line length and educational and health outcomes.
In the face of school traffic and its potential educational and environmental consequences, schools and communities should recognize that school carpool line expansion encourages motor vehicle traffic. Leaders should emphasize more scalable, less pollutant modes in their school transportation plans. A wide range of tactics is available to address school transportation, and it’s up
to local decision makers to determine the right set of solutions for their context.
The traditional remedy to school traffic is a robust school bus system that ferries students between home and school more affordably, safely, and conveniently than private vehicles. Unfortunately, school bus systems across the country have faced significant strain in recent years, with driver strikes on the rise and significant driver shortages reported in every US state between 2020 and 2023 (Sainato 2023). To protect our school transportation systems from ridership decay and reduce school traffic, school districts must take steps to prevent disruptions to school bus systems. As the largest reason for school bus driver shortages has been found to be compensation (Sainato 2023, Safe Routes to School National Partnership 2009), improved compensation for bus drivers and maintenance personnel is key to maintaining bus ridership. As with any public transportation, a poorly kept bus is just another car on the road.
Where school bus investment is untenable due to cost or political uncertainty, newer approaches may help schools affordably adapt to transportation challenges. Among the most flexible approaches is the bike bus, a caravan of students on bicycles led and/or trailed by trusted teachers, parents, and other adults (Jonathan 2022). Bike buses, originating in the Portland, Oregon area, resemble critical mass protests and enable schools to affordably expand transportation options while promoting sought-after health goals for students. Bike buses and similar low-cost solutions may be a powerful tool for reducing drop-off traffic and school bus disruptions for undersupported school districts (Jonathan 2022).
The ultimate way to bring home and school closer together is to do so literally, by building housing, particularly multifamily housing, near grade schools. Federal data shows that 81% of students living within a mile of school walk on a typical day, with a further 6% taking a school bus (Jenkins 2019). Given how many nearby students choose a mode that costs nothing to the school district, housing near school can drastically reduce the cost of school transportation investments and reduce the health risks of traffic.
A crucial tool in bringing students closer to school is establishing zoning near campuses that allows residents with a diversity of economic backgrounds to live closer to schools. This includes broad strokes reforms like “missing middle” approaches, which give homeowners the opportunity to build additional housing capacity on their land. An even more ambitious manifestation of this type of policy could take the form of a new “safe route to school overlay district,” (SRSOD) coupling housing density with street safety infrastructure. An SRSOD could be defined within a certain radius of select schools, easing density limits where additional housing capacity is most badly needed. It could stipulate requirements and plans for developers and city leaders to include light sources, wide sidewalks, bike lanes, and barriers to protect pedestrians and cyclists. Because safer streets are attractive for new residents, and streets with abundant witnesses are safer, these goals are self-reinforcing and could make SRSODs an additional tool for reducing traffic near schools.
WORKS CITED
Audrey, Nicole. “Get Your Kids to School or Keep Your Job? Parents’ Stress Over Transportation.” NBC News, 2016. https://www.nbcnews.com/business/consumer/get-yourkids-school-or-keep-your-job-parents-stress-n632726
Dubay A. “See Dick and Jane Sit in Traffic,” The Press Democrat, September 7, 2003 cited in Travel and Environmental Implications of School Siting. US Environmental Protection Agency EPA 231-R-03-004. October 2003.
He, S.Y., Giuliano, G. “Factors affecting children’s journeys to school: a joint escort-mode choice model.” Transportation 44, 199–224, 2017. https://doi.org/10.1007/s11116015-9634-x
Jenkins, Daniel. “Children’s Travel to School: 2017 National Household Travel Survey.” Federal Highway Administration, United States Department of Transportation, 2019. https://rosap.ntl.bts.gov/view/dot/58740
Lee, Douglass. “Induced Traffic and Induced Demand.” National Association of City Transportation Officials, 1999. https://doi.org/10.3141/1659-09
Maus, Jonathan. “Portland’s bike bus featured on NBC Nightly News.” Bikeportland.org, 2022. https://bikeportland.org/2022/10/13/portlands-bike-bus-featuredon-nbc-nightly-news-365310
McNalty, Sködt. “How big a problem is idling?” CBC News, 2019. https://www.cbc.ca/news/science/what-on-earthnewsletter-idling-population-climate-change-1.5351917 Safe Routes to School National Partnership. “National Statistics on School Transportation.” 2009. https:// www.saferoutespartnership.org/sites/default/files/pdf/ school_bus_cuts_national_stats_FINAL.pdf
Sainato, Michael. “US school bus drivers strike amid low pay and staff shortages.” The Guardian, 2023. https:// www.theguardian.com/us-news/2023/sep/08/us-schoolbus-driver-strike-union-new-york
Transportation Research Board. The Relative Risks of School Travel: A National Perspective and Guidance for Local Community Risk Assessment.” Transportation Research Board Special Report 269, http://www.nap. edu/catalog.php?record_id=1040
Wake County Public School System. “2024-25 District Facts Report by Year.” 2025, https://www.wcpss.net/ domain/100.
Webber, Robbie. “Proximity to highways affects longterm school performance.” State Smart Transportation Initiative, 2019. https://ssti.us/2019/08/05/proximity-to-highways-affects-long-term-school-performance/
EL TRANSPORTE COLECTIVO
Eje de Cambio en el Imaginario Puertorriqueño
ALEJANDRO COTTÉ ALSINA
Alejandro Cotté Alsina is a master’s student in Economic Development at the University of North Carolina at Chapel Hill’s Department of City and Regional Planning. Born and raised in Puerto Rico, he holds a B.A. with a double major in Social Work and Economics from the University of Puerto Rico. His research focuses on collective tenure structures, the informal economy, and socioeconomic development in low-income communities. Currently, as a recipient of the Global Urbanization Fellowship, he is conducting a comparative study, under Dr. Roberto Quercia’s supervision, on housing cooperatives as a form of public housing in the Global South, examining pioneering cases in India and Uruguay. Alejandro’s academic work is deeply informed by his professional experience, including his role as a research analyst for the Puerto Rico House of Representatives and his experience with community engagement in La Junta Comunitaria del Casco Urbano de Río Piedras, a nonprofit dedicated to socioeconomic development in eight low-income communities of San Juan. For the last year, he has worked as a research assistant for Dr. Meenu Tewari at DCRP as well as a Teaching Assistant for Dr. Quercia.
ABSTRACT
El carro ha dominado el transporte en Puerto Rico por más de medio siglo. En conjunto con políticas de desarrollo urbano de carácter federal y criollo este sistema de transporte individual ha sido cómplice de la reproducción de un discurso de negación de la pobreza generado desde el Estado y aceptado por gran parte de la ciudadanía en el país. De este modo, ha facilitado la enajenación entre las clases sociales en la ciudad donde los espacios de encuentro o zonas de contacto escasean. Sin embargo, en marzo de 2024, con el anuncio de la Autoridad de Transporte Integrado sobre la provisión gratuita del servicio de transporte público para el área metropolitana, el tránsito de personas en los sistemas de autobús y tren aumentó drásticamente. Ante este panorama el transporte colectivo surge como una alternativa en donde generar zonas de contacto entre clases sociales con el potencial de transformar el imaginario de la pobreza en Puerto Rico. En consecuencia, este trabajo realizó un cuestionario a 35 personas durante su proceso de tránsito en el transporte público (TP) para explorar como viajar en TP ha influenciado su percepción sobre la pobreza en comparación a viajar en carro. Las conclusiones arrojaron un 59% de la población muestral que opina ver “más” o “mucha más pobreza” viajando en TP en comparación al carro. Asimismo, la variable “nacionalidad” mostró ser influyente sobre la percepción de la pobreza al viajar en TP. Un 63% de la población que se identificó como puertorriqueña afirmó que viajar en TP ha impactado su percepción de la gravedad del problema de la pobreza en el país. Por otro lado, entre personas identificadas como extranjeras el patrón fue inverso. Finalmente, el artículo propone fomentar el diseño del transporte público en Puerto Rico como una fuente de zonas de contacto que propicie el encuentro entre distintas clases sociales y permita una reconstrucción más realista del imaginario de la pobreza en el país, particularmente para la clase media.
Un acercamiento al transporte colectivo visto como una zona de contacto y su impacto sobre la percepción general de la pobreza en el área metropolitana de San Juan, Puerto Rico durante el periodo especial de transporte público gratuito entre marzo de 2024 y enero 2025
INTRODUCCIÓN
La ciudad tiene como objetivo inherente servir al desarrollo de la sociedad mediante la cercanía, facilitando la posibilidad constante de encuentros en espacios y tiempos. En este contexto, ¿qué es el carro sino una burbuja que dificulta esos encuentros y propicia la enajenación de sus habitantes respecto a las condiciones de vida del otro? Aunque difícilmente refutable, este señalamiento trae más preguntas que respuestas. Por ejemplo, ¿de qué, o de quiénes, nos estamos enajenado? y, ¿es intencional esta enajenación? Así mismo, se queda corto en cuanto a una contrapropuesta. ¿Cuál es la alternativa? Si asumimos el transporte colectivo como respuesta idónea a la enajenación de los sistemas de transporte individual, ¿podemos asegurar que esta es una opción verdaderamente anti enajenadora? Este artículo representa un esfuerzo por comenzar a atender estos cuestionamientos. Para ello se centra la mirada en la percepción de la pobreza en el área metropolitana de Puerto Rico y el transporte colectivo como una zona de contacto 1 . En consecuencia, se pretende contestar las siguientes preguntas: ¿quiénes se encuentran en el transporte colectivo? y, ¿qué impacto, si alguno, tiene ese encuentro sobre la percepción de la pobreza en el país? De esta forma, se quiere analizar la percepción de la magnitud de la pobreza como problema social en Puerto Rico dentro del imaginario colectivo de la población que utiliza el transporte público (TP).
CONCEPTOS CLAVE
Antes de continuar es importante clarificar dos conceptos. El primero es las zonas de contacto (Pratts 1991). En este caso se considera el transporte colectivo en Puerto Rico una zona de contacto entre clases sociales, principalmente la clase media y baja. Por otro lado, el análisis de este proyecto se fundamenta también en la hipótesis de
Montoro y Moreno (2021) sobre el transporte como una herramienta constructivista en el desarrollo de la semiótica de la identidad latinoamericana.2 Esta propuesta da paso a concebir el transporte colectivo como un agente activo en la construcción del imaginario puertorriqueño, lo que a su vez permite entenderlo como un espacio desde el cual definir una imagen de la pobreza en el país.
CONTEXTO
En Puerto Rico el transporte es un tema dominado por el carro. Muy acorde al modelo “Fordiano” de desplazamiento urbano proveniente de los Estados Unidos, a mediados del siglo XX Puerto Rico vivió el desmantelamiento de su sistema ferroviario (Colom Braña 2019). Aunque sobrevivieron a esta debacle ciertas alternativas de transporte colectivo como los autobuses y las “pisicorre”3 el automóvil pasó a ser indiscutiblemente el medio de transporte principal en el archipiélago. Este evento coincidió con unos cambios discursivos de las élites políticas del país que entre 1940 y 1950 comenzaron a impulsar una agenda de desarrollo económico mediante la solidificación del Estado Benefactor4. A través de programas como “Manos a la Obra” el gobierno puertorriqueño apostó por el desarrollo industrial de Puerto Rico desde el sector manufacturero y la economía de servicio, con enfoque turístico. Así mismo, con el nacimiento del Estado Libre Asociado en 1952 creció significativamente el tamaño del gobierno y su provisión de servicios públicos. Aquí es importante resaltar el rol de la metrópolis estadounidense en el desarrollo de este Estado Benefactor y sus políticas asistencialistas (Ver Tabla 1). Esto porque la influencia de la política federal en la lucha contra la pobreza en Puerto Rico no se ha limitado a elementos estigmatizados como la otorgación de cupones de alimento. Igual o más importantes han sido las intervenciones estadounidenses en colaboración con el gobierno criollo en el diseño de las políticas de vivienda,5 la organización espacial de las clases sociales y el transporte.
Por otro lado, es importante resaltar el salvavidas económico que ha representado la implementación
de muchas de estas políticas públicas para millones de puertorriqueños. No obstante, es notable que en su aparente intento por reducir la pobreza estas inversiones han mayormente logrado ocultarla, disimularla y reproducirla bajo un sistema de profunda dependencia colonial. Entonces, a partir de ese disimulo de la pobreza es que pareciera generarse un discurso de negación y/o criminalización de la pobreza fomentado por el Estado. Discurso que, en parte, como consecuencia de la inversión pública en las políticas de interés social, ha calado hondo en el imaginario colectivo de ciertos sectores de la sociedad puertorriqueña que fueran mayormente excluidos de sus beneficios, entiéndase las clases media y alta.
Como evidencia del impacto de este discurso, en Puerto Rico es frecuente escuchar cómo se desacredita la gravedad de la pobreza como problema social al compararla con otros países en Latinoamérica donde si es validada como un problema serio. No obstante, de acuerdo con el U.S. Census Bureau en Puerto Rico la pobreza abarca el 42% de la población (2022) lo que coloca al archipiélago en el puesto más alto tanto entre países latinoamericanos, y estados de EE. UU. (ver Figura 1 para contexto).6 A la vez, actualmente Puerto Rico enfrenta una crisis demográfica que se manifiesta mediante caídas dramáticas en la tasa de natalidad7 junto a otros factores como la emigración masiva a partir del huracán María
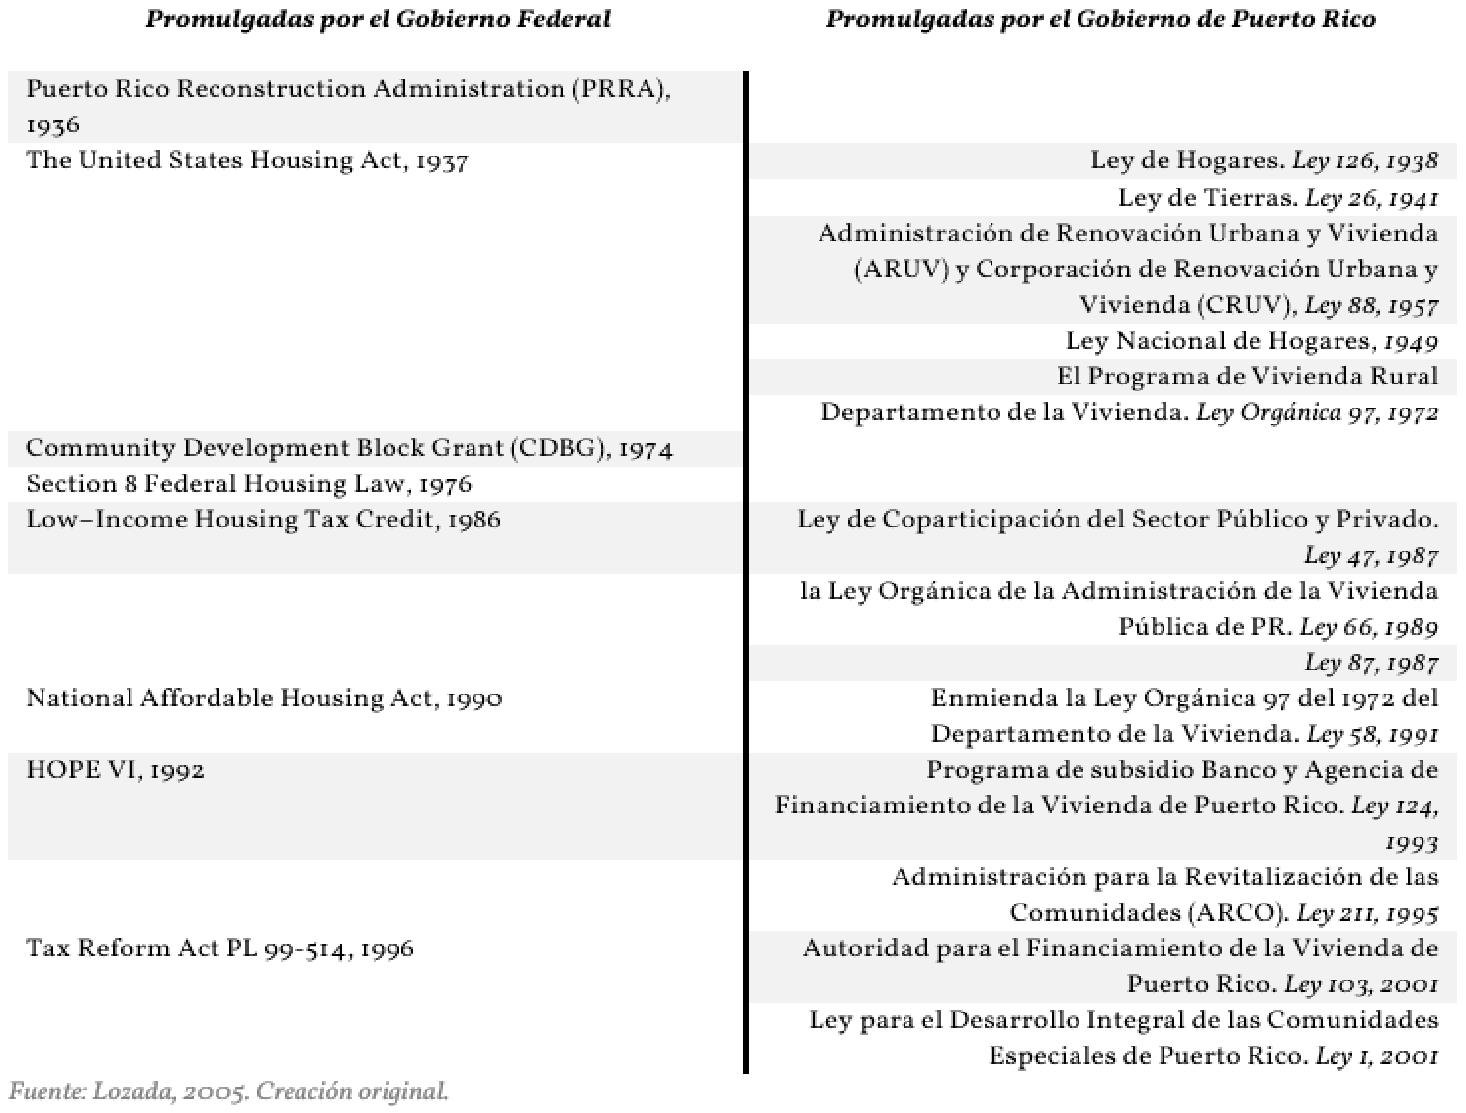
a la organización
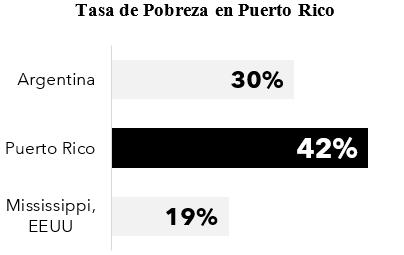
1. Personas bajo nivel de pobreza en Puerto Rico (Censo, 2022) comparado al país con el mayor grado de pobreza en Latinoamérica (CEPAL, 2022) y el estado más empobrecido de EE. UU. (Censo, 2022) (2017). Más aún, el coeficiente GINI ha aumentado de .51 en 1980 a .55 en 2022, mientras la mediana de ingreso por hogar es de $25,095 comparado a $80,610 en los Estados Unidos para 2023 lo que posiciona a Puerto Rico como el territorio más empobrecido en Estados Unidos. A la misma vez, es cierto que variaciones en los estándares de medición de la pobreza por cada región pueden influenciar, hasta cierto punto, la dimensión del problema en cada territorio. Sin embargo, en definitiva, estas estadísticas presentan una realidad puertorriqueña que contextualizada en su entorno geográfico y político es, cuanto menos, alarmante.
Es aquí donde se enlaza el tema de la realidad socioeconómica del país con el transporte individualizado como posible cómplice de este ocultamiento de la pobreza. Osea, que la capacidad enajenadora del carro facilita la validación de estos ideales de negación y criminalización de la pobreza, en parte porque simplemente lo que no se ve no existe (Colón Reyes 2023). Pareciera entonces, que el sistema de transporte en Puerto Rico está diseñado para evitar generar zonas de contacto entre clases sociales. Entiéndase, que las clases no se ven unas a otras salvo en momentos excepcionales en parte porque así está diseñada la ciudad, lo que facilita la reproducción de la idea de la pobreza como un mito urbano que el Estado Benefactor dejó atrás. A su vez permite la fundamentación de discursos apologistas de la desigualdad social que claman: “En Puerto Rico el que es pobre, es pobre porque quiere.”
Con el nuevo milenio se inauguró en 2004 el primer sistema ferroviario en el territorio desde el cierre del último trolley en 1957 (Santamaría 1994). El “Tren Urbano” del gobernador Pedro Roselló era una promesa de prosperidad dirigida a una población necesitada de alternativas para desplazarse. No obstante, su desarrollo no fue el esperado: su diseño original nunca fue completado, los costos de construcción fueron sumamente altos8 y la integración con el sistema de autobuses no fue óptima. En consecuencia, lo que pretendía ser una alternativa concreta al transporte individualizado se convirtió como mucho, salvo por ciertos bolsillos del área metropolitana, en un complemento ineficiente para el viaje en carro. Aun así, el Tren Urbano y la Autoridad Metropolitana de Autobuses han perdurado hasta hoy día proveyendo un servicio que, a pesar de sus carencias, es esencial para miles de puertorriqueños. Entonces, en marzo de 2024, la Autoridad de Transporte Integrado (ATI) anunció la provisión gratuita de los servicios de transporte en el área metropolitana por los próximos seis meses, situación que se ha extendido hasta nuevo aviso. La novedad del transporte gratuito atrajo un incremento sustancial en la cantidad de usuarios e inspiró el origen de este trabajo.9
METODOLOGÍA
Para el desarrollo de este artículo se realizaron 35 cuestionarios a usuarios del TP en Puerto Rico mientras transitaban sus rutas. Con ese fin el investigador transitó las rutas de guagua10 pública T21, T9, T3, T2, E10 (tonos azules en Figura 2) y El Tren Urbano desde Sagrado Corazón hasta la Estación de Bayamón ida y vuelta (línea roja en Figura 2). Los cuestionarios fueron realizados en el mes de diciembre del año 2024 durante dos días de semana de trabajo regular en el horario entre 7:00 de la mañana y 1:00 de la tarde. 17 cuestionarios fueron completados en el sistema de transporte de autobuses (guaguas) durante el primer día de recopilación mientras que 18 fueron completados en el Tren Urbano durante el segundo día de recopilación de datos. El enfoque de este cuestionario fue recoger la perspectiva sobre la pobreza entre los transeúntes del transporte colectivo
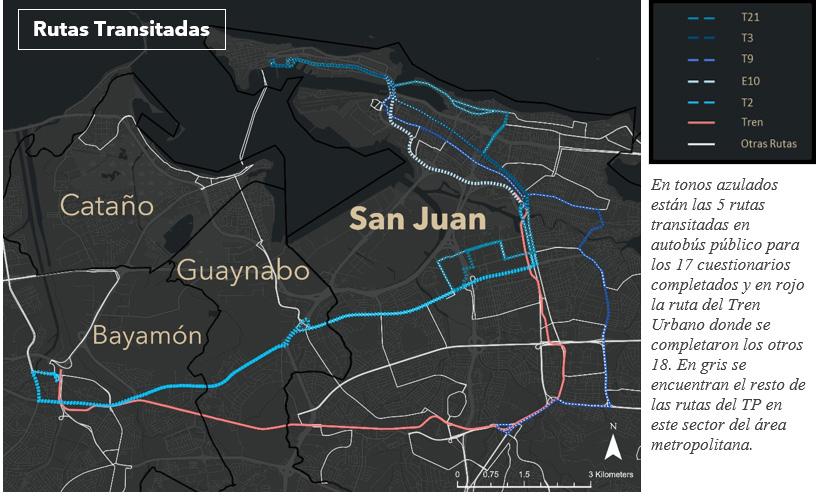
del área metropolitana de Puerto Rico de acuerdo con su perfil socioeconómico.
En el cuestionario se realizaron preguntas concernientes al estatus socioeconómico de los participantes, con la intención de distinguir las clases sociales según definidas por la muestra. Esto se debe a no existe una definición oficial de clases sociales y la interpretación puede variar de acuerdo con las experiencias individuales. Para efectos de este artículo resulta esencial entender cómo se definen las clases sociales según los participantes, ya que de ahí se puede definir con mayor fundamento la percepción que hay sobre la pobreza en el país de acuerdo con la población muestral. Así mismo, fue la intención de este estudio que el cuestionario fuera lo más breve y conciso posible por la naturaleza de su mod de recopilación. Para estos fines se desarrolló un cuestionario de unas 10 preguntas más una sección de información personal, lo que en total ocupó una hoja. El análisis propuesto es uno descriptivo a partir
de los resultados de la muestra que incluye una mezcla de información tanto cualitativa como cuantitativa. Con la literatura disponible sobre el tema se pretende analizar los resultados y llegar a conclusiones iniciales. La primera parte de la encuesta buscaba establecer un perfil demográfico y de frecuencia de uso del TP por parte del entrevistado. La segunda sección intentó capturar la perspectiva de los usuarios respecto a la magnitud de la pobreza en Puerto Rico, así como el impacto, si alguno, que viajar en TP ha tenido sobre esa percepción.
RESULTADOS
PERFIL MUESTRAL
Como se muestra en la Tabla 2 el 60% de las personas encuestadas se identificaron como mujeres. Por otro lado, el 70% de los encuestados indicó no tener acceso a un vehículo propio. Cuando miramos las estadísticas relacionadas al color de piel (Tabla 3) notamos una muestra diversa. Nueve adjetivos distintos surgieron como respuesta a esta interrogante siendo “blanca/o” el más frecuente.
En cuanto a las variables de clase social e ingreso anual aproximado (Tabla 4), cerca del 40% de los encuestados contestó ingresar menos de $10 mil al año, lo que se considera por debajo de los estándares de pobreza en Estados Unidos. Sin embargo, solo el 20% indicó considerarse parte de la clase baja. Así mismo, 13 personas que también indicaron ganar menos de $20 mil anuales se identificaron como miembros de la clase media. Por otro lado, cerca del 65% de los encuestados se identifican como miembros de la clase media, entre ellos solo seis personas (17%) reportaron ingresos entre $20 mil y $50 mil al año. Nadie reportó ingresos mayores a $50 mil anuales y tampoco hubo algún participante que se considerara parte de la clase alta.
PERCEPCIÓN DE LA POBREZA
Cuando se le preguntó a los encuestados cuan grave consideraban el problema de la pobreza en Puerto Rico en comparación a otros países latinoamericanos y a otros estados de EE. UU. las respuestas no demostraron grandes diferencias entre las comparativas. Comparado con países de Latinoamérica las respuestas promediaron un 3.22 con una desviación estándar de 1.20 en una escala del uno al cinco, donde cinco es lo más grave y uno lo menos grave, siendo la pobreza en Puerto Rico el enfoque. Mientras que al compararlo con otros estados de los Estados Unidos el promedio de las respuestas fue 3.53 con una desviación estándar de 1.18. Esta estadística solo considera a las personas que se autodenominaron puertorriqueñas en la pregunta de nacionalidad, aunque cuando se incluyen personas de otras nacionalidades el patrón es similar. No obstante, como se muestra en la Figura 3 cuando reagrupamos las respuestas de acuerdo con la variable de clase social con la que se identificaron los participantes vemos un cambio en el patrón de respuesta. Entre los participantes que indicaron pertenecer a la clase baja, sin
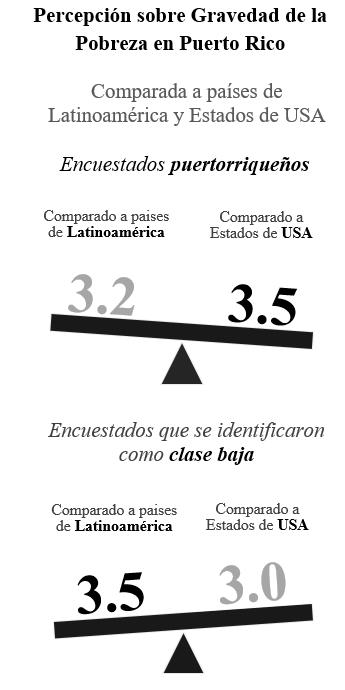
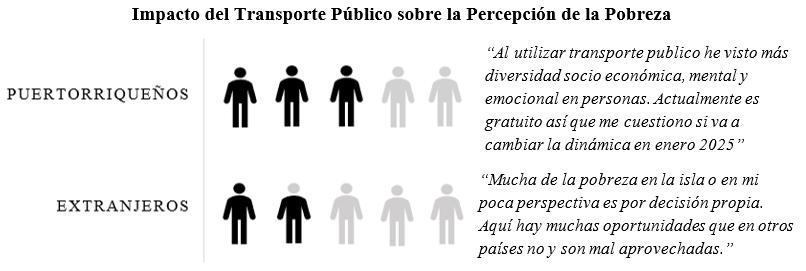
4. Proporción de pasajeros locales y extranjeros en que opinan que el TP ha impactado su percepción de la pobreza (en color negro). Aproximadamente 3 de cada 5 puertorriqueños contestaron si mientras que cerca de 2 de cada 5 extranjeros hicieron lo mismo. Se incluye citas directas de participantes que explicaron su respuesta. Creación original.
importar su nacionalidad, la gravedad de la pobreza en Puerto Rico promedió un 3.5 en comparación a otros países de Latinoamérica frente a un 3.0 en comparación a Estados de Estados Unidos.
De forma similar, cuando se le preguntó a la muestra como comparan el nivel de pobreza observado en un viaje en carro con un viaje en TP solo 6% de la muestra contestó que observaba menos pobreza en el viaje en carro. En este renglón, alrededor de un 59% (19 personas) de la muestra, restando los que dejaron la pregunta en blanco, observa más pobreza en el TP que en el viaje en carro. Por otro lado, el 34% (11 personas) indicó que se ve igual en ambos casos.
Sobre el impacto que tiene el TP en la percepción de la pobreza, alrededor del 49% de los encuestados indicaron que no tenía efecto, mientras que el 46% indicó que sí. Cuando esta pregunta se limita por la variable de nacionalidad el patrón cambia como se observa en la Figura 4. Entre las personas que se identificaron como puertorriqueñas el 64% (12 personas) indicó que viajar en TP si ha impactado su perspectiva sobre la pobreza en el país y el 37% (7 personas) indicó que no. Así mismo, cuando se enfoca en nacionalidades extranjeras se observa que fuera de la República Dominicana (donde una persona piensa que si ha tenido impacto y dos piensan que no), el resto opina que el TP no tiene un impacto en su percepción de la pobreza.
DISCUSIÓN
PERFIL MUESTRAL
Los resultados del cuestionario nos permiten establecer un perfil muestral de mayoría femenina, racializada, sin carro propio y con ingresos por debajo de los $20 mil anuales. Dentro de este panorama y en base a las respuestas de los participantes es difícil definir la clase media y la clase empobrecida. Para ello podría ser importante tomar otras variables en cuenta e implementar otras estrategias investigativas. Sin embargo, no hay duda de que el perfil muestral es uno empobrecido según los estándares de ingreso estipulados por las agencias públicas pertinentes en Puerto Rico11. Igualmente, sorprende la presencia de personas extranjeras quienes componen cerca de un 30% de la muestra.
PERCEPCIÓN DE LA POBREZA
Entre la población muestral no queda claro si en efecto la pobreza en Puerto Rico es percibida como un problema de mayor o menor magnitud al compararla con Estados de Estados Unidos o países latinoamericanos. Aun así, el notar una distinción en el patrón de la respuesta entre las personas que se consideran de clase media y las que se consideran de clase baja es un hallazgo significativo pues alerta sobre una disonancia en los discursos dominantes relativos a la pobreza entre
distintas clases sociales. Igualmente, abre paso a uno de los resultados más importantes de este estudio:
los participantes de esta encuesta ven más pobreza en viaje en TP que en el viaje en carro.
Sobre cómo el TP impacta la percepción de la pobreza resaltan las diferencias de opinión por nacionalidad. Mientras entre puertorriqueños alrededor de un 63% de la muestra indicó que viajar en TP si ha impactado su percepción de la pobreza, entre extranjeros el patrón es inverso. Una persona puertorriqueña que explicó su razonamiento para contestar “Sí” a la pregunta indicó: “Usando el transporte público nos exponemos a escenarios que al viajar en auto individual era[n] ajenos. Vemos personas que no tienen hogares durmiendo en el tren, personas discapacitadas que tienen poca o nula atención medica e incluso personas de edad muy avanzada (deberían ser acompañados) solos.”
Esta explicación, resume el sentir de las personas puertorriqueñas que contestaron “Sí” la interrogante y permite interpretar el TP como una zona de contacto entre clases sociales que ha impactado la percepción de ciertos pasajeros sobre la pobreza en Puerto Rico, especialmente desde que se ofrece el servicio de manera gratuita. Sin embargo, uno de los participantes que contestó “No” a esta interrogante explicó: “… la ruta del tren no pasa por esas áreas de pobreza. Es lógico que no se va a ver tanto” (Ver en Figura 5). Así mismo, otros participantes señalaron que la pobreza es mayor en el interior de la isla grande de Puerto Rico. Las explicaciones brindadas a estas respuestas negativas, aunque aisladas, proveen otra perspectiva de importante análisis a futuro.
Por otro lado, las opiniones de personas extranjeras que contestaron que el TP no ha impactado su perspectiva sobre la pobreza levantan interrogantes sobre el perfil
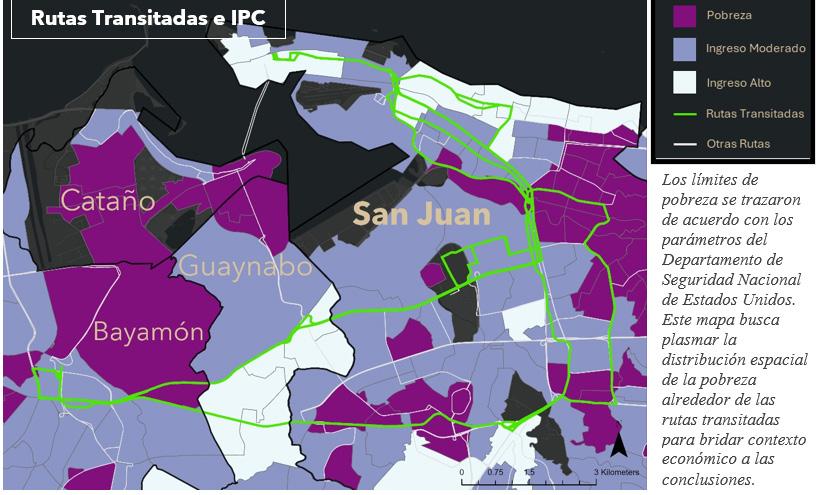
de la población inmigrante que utiliza el TP en Puerto Rico y su percepción del fenómeno de la pobreza en sus países de origen.
Otro resultado que llama la atención es la diferencia entre la cantidad de personas en la muestra que opinaron ver más pobreza en el TP a la vez que indicaron que esto no ha impactado su percepción de la pobreza en Puerto Rico. En estos casos una de las participantes contestó: “Se ve diario en el trabajo. Depende de donde transites en el carro.” Igualmente podríamos pensar que esto es un efecto del horario y momento en que se recogió la muestra por ser día de semana laboral. A futuro una posible avenida de estudio sería recoger la opinión de transeúntes en fines de semana y horarios no laborables donde el perfil de la muestra podría variar. Igualmente, es importante reiterar que el perfil muestral aquí recogido es uno sumamente empobrecido lo que implica que gran parte de la muestra ha tenido una gran exposición a la pobreza en sus contextos cotidianos.
CONCLUSIONES
A modo de resumen enlistamos aquí los hallazgos principales de este estudio:
• Definir las clases sociales en Puerto Rico es una tarea que debe considerar un mayor número de variables y participantes, así como un acercamiento más profundo al tema.
• La exposición previa de los participantes a poblaciones empobrecidas en Puerto Rico se presenta como un factor importante en su percepción de la magnitud de la pobreza.
• Se entiende que hay una influencia importante de las variables “clase social” y “nacionalidad” sobre la percepción de la gravedad de la pobreza en Puerto Rico comparado a otros lugares. Se entiende que la variable de “nacionalidad” también afecta la opinión sobre el impacto que ha tenido viajar en TP en lugar del carro sobre la percepción de la magnitud de la pobreza en el país.
• Cerca del 59% de la población muestral piensa que en el viaje en TP se ve “más pobreza” o “mucha más pobreza” que en el viaje en carro mientras que solo alrededor del 6% ve más pobreza en el viaje en carro. Esto nos permite comenzar a explorar las capacidades del transporte colectivo como agente de cambio en el imaginario colectivo sobre la pobreza en Puerto Rico.
Las implicaciones de estos hallazgos tienen diversas ramificaciones, entre ellas el autor propone revaluar el diseño del tránsito urbano. Mientras perdure un sistema de tránsito individualizado en la ciudad será sumamente difícil encontrar soluciones a los problemas colectivos, máxime tomando en consideración el modo de estratificación de las relaciones de poder en nuestra democracia. Para erradicar la pobreza es necesario entenderla.
Más aún, es a través de la política pública, y por ende de quienes ocupan los puestos de servicio público que se puede impactar de manera más rápida el tema de la pobreza. Por ello, valdría la pena considerar estos hallazgos a la hora de invertir en un rediseño del tránsito urbano. Partiendo de la experiencia expuesta por la población muestral, crear zonas de contacto entre clases sociales a través del transporte colectivo podría ser una herramienta poderosa para el fortalecimiento de la cohesión social y la reconstrucción del imaginario colectivo sobre el problema de la pobreza en Puerto Rico. Ante todo, porque no podemos solucionar lo que no reconocemos como un problema.
SESGOS
El horario y los días escogidos para tomar esta muestra puede ser uno de los mayores sesgos de este estudio. El investigador entiende que de haberse realizado el mismo en días de fin de semana se habría contactado a una población con un perfil distinto.
• Entre encuestados puertorriqueños cerca del 63% indicó que viajar en TP ha impactado su percepción de la pobreza en Puerto Rico comparado al viaje en carro.
NOTAS FINALES
1. Término desarrollado por Mary Louise Pratts (1991), se refiere a espacios de encuentro e intercambio entre distintas culturas en los que los actores se influencian mutuamente. Sus planteamientos han fundamentado estudios de diversa naturaleza y se han extrapolado a otro tipo de diferenciaciones identitarias como las de clase, raza y género (Pratts 1991).
2. En su escrito Identidad latinoamericana y sistemas de transporte. Notas para una semiótica de las identidades geo-culturales (2021) los autores proponen “que los sistemas de transporte latinoamericanos, al mismo tiempo que reflejan ciertas características discursivamente asociadas a la identidad considerada distintiva de América Latina, funcionan como un marcador más para la construcción de ese conjunto de discursos e imaginarios que es la idea de una identidad latinoamericana” (Montoro y Moreno 2021).
3. Medio de transporte colectivo administrado de manera privada en Puerto Rico. Consiste en autobuses de menor tamaño que típicamente brindan servicio a sectores que no cubre el TP o en donde su cobertura no es eficiente (Stinson 2012).
4. También conocido como Estado del Bienestar, es definido por el Diccionario Panhispánico del Español Jurídico como: “Organización del Estado en la que este tiende a procurar una mejor redistribución de la renta y mayores prestaciones sociales para los más desfavorecidos.”
5. “El 2 de mayo de 1992, se firma un acuerdo trascendental en la historia de la vivienda en Puerto Rico entre el Departamento de Vivienda y Desarrollo Urbano Federal (HUD) y el gobierno de Puerto Rico para mejorar las condiciones y la calidad de vida de los residentes de todos los proyectos de vivienda pública subsidiados con fondos federales. El propósito de este acuerdo era trasladar la administración y mantenimiento de todos los proyectos operados por el gobierno estatal o municipal a manos de contratistas privados de forma tal que se descentralizara tanto la agencia como el programa de vivienda pública.” (Lozada 2005)
6. Se decide comparar con países latinoamericanos y estados de EE. UU. por la particular condición política de Puerto Rico. Mientras Puerto Rico preserva cierta capacidad decisional propia en términos políticos, la autoridad sobre la cual está constituida esa autonomía proviene del Congreso de EE. UU. Por esto se establece una comparativa entre los estados de EE. UU. por tener mayor relación a los marcos legales que rigen las políticas públicas puertorriqueñas y países latinoamericanos con mayor similitud cultural al pueblo puertorriqueño.
7. En el 2023 se registraron 17,772 nacimientos en Puerto Rico, cifra más baja desde 1888 y que contrasta con los cerca de 60,000 reportados para el año 2000. (Rodríguez 2024)
8. Se estima que Puerto Rico gastó cerca de $2.25 mil millones en la construcción del Tren Urbano. La expectativa de transporte era de unas 125 mil personas al día, pero en 2022 transportaba cerca de 6 mil. (Ávila-Claudio 2023)
9. “…el patrocinio del Tren Urbano aumentó significativamente al sobrepasar el 1.7 millón de pasajeros, en poco más de 5 meses. Esta cifra sobrepasa la del mismo período en 2023, de 1.04 millones, lo cual representa un aumento de 62% de patrocinio, aproximadamente.” (Telemundo, Puerto Rico 2024)
10. En Puerto Rico a los autobuses se les llama guaguas.
11. De acuerdo con el Departamento de Seguridad Nacional de EE. UU. (Department of Homeland Security) en 2025 se considera bajo nivel de pobreza cualquier hogar, ocupado por una persona, que ingrese menos de $15,650 al año. Hogares de dos y tres personas se consideran bajo pobreza si ingresan menos de $21,150 y $26,650 respectivamente.
BIBLIOGRAFÍA
Ávila-Claudio, Rosa. “El moderno tren en el que Puerto Rico gastó más de US$2.000 millones y que ‘no llega a ninguna parte’.” BBC News Mundo, 2023. https://www. bbc.com/mundo/articles/c907jdep35xo
Colom Braña, Guillermo. “Everything but the Car: The Carport as Social Space in Puerto Rican Domestic Architecture.” Material Culture Review / Revue de la culture matérielle 90-91 (2019): 43–58. https://doi. org/10.7202/1076797ar
Cordero Mercado, Damaris. “Nivel crítico de nacimientos impide reemplazo generacional en Puerto Rico.” El Nuevo Día, 2024. https://www.elnuevodia.com/noticias/locales/ notas/puerto-rico-alcanza-nivel-critico-de-baja-ennatalidad/
Departamento de la Vivienda. La vivienda de interés social en Puerto Rico. Editado por José I. Alameda Lozada y Carlos A. Rivera Galindo. 2005. https:// estadisticas.pr/files/BibliotecaVirtual/estadisticas/ biblioteca/AVP_LaViviendaInteresSocialPR_2005.pdf. aInteresSocialPR_2005.pdf
Comisión Económica para América Latina y el Caribe (CEPAL). Anuario Estadístico de América Latina y el Caribe, 2024 (LC/PUB.2024/26-P). Santiago, 2025
Gobierno de Puerto Rico. Ley de la Autoridad de Transporte Integrado de Puerto Rico, Ley Núm. 123 de 3 de Agosto de 2014, según enmendada. 2014. https:// docs.pr.gov/files/ATI/INICIO/Ley%20de%20la%20 Autoridad%20de%20Transporte%20Integrado%20 de%20Puerto%20Rico.pdf
Government of Puerto Rico, Department of Transportation and Public Works. “DTOP.” Official Portal of Government of Puerto Rico, 2023. https:// www.tuextension.pr.gov/
Montoro, Juan M., y Sebastián Moreno Barreneche. “Identidad latinoamericana y sistemas de transporte: notas para una semiótica de las identidades geoculturales.” DeSignis 34 (2021): 67–82
Peña Rivera, Nilda I., y Kevien Ramos Jusino. Hacia una sociedad más justa y equitativa: Transformando la movilidad social en Puerto Rico. Escuela Graduada de Planificación, Universidad de Puerto Rico; y Cultura Bicicleta, 2021. https://pactosecosocialespr.com/ ensayos/11-hacia-una-sociedad-mas-justa-y-equitativatransformado-la-movilidad-social-en-puerto-rico/
Pratt, Mary Louise. “Arts of the Contact Zone.” Profession (1991): 33–40. http://www.jstor.org/stable/25595469
Real Academia Española. “Estado del bienestar.” En Diccionario panhispánico del español jurídico, 2023. https://dpej.rae.es/lema/estado-del-bienestar
Rivera, Carlos M. G., José G. Sánchez, y Daniel F. Luyanda. Perfil del usuario de Tren Urbano: Días de semana vs. Fines de semana y/o eventos especiales. 2007
Sánchez Hernández, María M. Me dejó la guagua: análisis del acceso al mercado laboral por transporte colectivo en el área de servicio de la AMA. Tesis doctoral, Universidad de Puerto Rico, 2021
Santamaría García, Antonio. Los ferrocarriles de servicio público de Puerto Rico (1870-1990). 1994. https:// revistas.ucm.es/index.php/RCHA/article/download/ RCHA9494110207A/29232/30393
Sanz Fernández, José, Antonio Santamaría García, Ángel Rodríguez Carrasco, Francisco Polo Muriel, Carlos Aycart Luengo, José R. Campos Álvarez, y Marcela A. García Sebastiani. Guía histórica de los ferrocarriles de Iberoamérica, 1835-1995. 1998
U.S. Census Bureau. Poverty Status in the Past 12 Months (ACS 5-Year Estimates Subject Tables, Table S1701). American Community Survey, 2022. https://data.census. gov/table/ACSST5Y2022.
U.S. Department of Health and Human Services, Office of the Assistant Secretary for Planning and Evaluation. Poverty Guidelines. 2025. https://aspe.hhs.gov/topics/ poverty-economic-mobility/poverty-guidelines