Dynamic Learning is an online subscription solution that supports teachers and students with high quality content and unique tools. Dynamic Learning incorporates elements that all work together to give you the ultimate classroom and homework resource.
AQA A-level Economics Fourth Edition is available as a Whiteboard eTextbook which is an online interactive version of the printed textbook that enables teachers to:
Display interactive pages to their class
Add notes and highlight areas
Add double-page spreads into lesson plans
Additionally the Student eTextbook of AQA A-level Economics Fourth Edition is a downloadable version of the printed textbook that teachers can assign to students so they can:
Download and view on any device or browser
Add, edit and synchronise notes across two devices
Access their personal copy on the move
To find out more and sign up for free trials visit: www.hoddereducation.co.uk/dynamiclearning
AQA
A-level
Economics
Fourth Edition
Ray
Powell James Powell
Approval message from AQA
The core content of this digital textbook has been approved by AQA for use with our qualification. This means that we have checked that it broadly covers the specification and that we are satisfied with the overall quality. We have also approved the printed version of this book. We do not however check or approve any links or any functionality. Full details of our approval process can be found on our website.
We approve print and digital textbooks because we know how important it is for teachers and students to have the right resources to support their teaching and learning. However, the publisher is ultimately responsible for the editorial control and quality of this digital book.
Please note that when teaching the AQA A-level Economics course, you must refer to AQA’s specification as your definitive source of information. While this digital book has been written to match the specification, it cannot provide complete coverage of every aspect of the course.
A wide range of other useful resources can be found on the relevant subject pages of our website: www.aqa.org.uk
Every effort has been made to trace all copyright holders, but if any have been inadvertently overlooked, the Publishers will be pleased to make the necessary arrangements at the first opportunity.
Although every effort has been made to ensure that website addresses are correct at time of going to press, Hodder Education cannot be held responsible for the content of any website mentioned in this book. It is sometimes possible to find a relocated web page by typing in the address of the home page for a website in the URL window of your browser.
Hachette UK’s policy is to use papers that are natural, renewable and recyclable products and made from wood grown in well-managed forests and other controlled sources. The logging and manufacturing processes are expected to conform to the environmental regulations of the country of origin.
Orders: please contact Bookpoint Ltd, 130 Park Drive, Milton Park, Abingdon, Oxon OX14 4SE. Telephone: (44) 01235 827827. Fax: (44) 01235 400401. Email education@bookpoint.co.uk Lines are open from 9 a.m. to 5 p.m., Monday to Saturday, with a 24-hour message answering service. You can also order through our website: www.hoddereducation.co.uk
All rights reserved. Apart from any use permitted under UK copyright law, no part of this publication may be reproduced or transmitted in any form or by any means, electronic or mechanical, including photocopying and recording, or held within any information storage and retrieval system, without permission in writing from the publisher or under licence from the Copyright Licensing Agency Limited. Further details of such licences (for reprographic reproduction) may be obtained from the Copyright Licensing Agency Limited, www.cla.co.uk
Typeset by Integra Software Services Pvt. Ltd., Pondicherry, India
Printed in Italy
A catalogue record for this title is available from the British Library.
Get the most from this book
This textbook has been tailored explicitly to cover the content of the AQA specification for the A-level course. The book is divided into two parts, one covering microeconomics and the other macroeconomics.
The text provides the foundation for studying AQA economics, but you will no doubt wish to keep up to date by referring to additional topical sources of information about economic events. This can be done by reading the serious newspapers, visiting key sites on the internet and reading such magazines as Economics Review
●Key terms
Clear, concise definitions of essential key terms where they first appear and as a list at the end of each section.
Study tips
Short pieces of advice to help you present your ideas effectively and avoid potential pitfalls.
Learning objectives
A statement of the intended learning objectives for each chapter.
Special features
Case studies
Case studies to show economic concepts applied to real-world situations.
Quantitative skills
Worked examples of the quantitative skills that you will need to develop.
Synoptic links
Connections between different areas of economics are highlighted to help improve your overall understanding of the subject.
Test yourself Exercises to provide active engagement with economic analysis.
Extension material
Extension points to stretch your understanding.
Summaries
Bulleted summaries of each topic that can be used as a revision tool.
Revision questions
Revision questions are provided at the end of each section to help you check your knowledge and understanding of the topics you have covered within each chapter.
Practice questions
There is a section at the back containing questions for you to practise.
Answers are online at: www.hoddereducation.co.uk/AQAEconomics
5.7 Oligopoly
5.9
6.1
6.2
6.3
6.4
6.5
6.6
6.7
8.1
Part 2 Macroeconomics
Microeconomics Individuals, firms, markets and market failure
1 Economic methodology and the economic problem
Economics is the study of choice and decision making in a world with limited resources. It tries to explain the economic behaviour of both individuals and groups of people, and the economic relationships between individuals and groups. Related to the noun ‘economics’ is the verb ‘to economise’. In large part, economics is the study of economising — the study of how people make choices about what to produce, how to produce and for whom to produce, in a world in which most resources are limited or scarce. How best can people make decisions on how scarce resources should be allocated among competing uses so as to improve and maximise human happiness and welfare? This is the economic problem, which is the main focus of this introductory chapter.
LEARNING OBJECTIVES
These are to understand:
● important aspects of economic methodology
● the nature and purpose of economic activity
● how resources are used to produce goods and services
● the importance of scarcity, choice and resource allocation
● the significance of production possibility diagrams
1.1 Economic methodology
●
Economics as a social science
When answering the question ‘What is economics?’, a good place to start is the fact that economics is a social science. Social science is the branch of science that studies society and the relationships of individuals within a society. Besides economics, psychology, sociology and political science are also social sciences, as are important elements of history and geography.
Psychology studies the behaviour and mental processes of an individual Sociology studies the social relationships between people in the context of society. By contrast, economics, as the name suggests, studies the economic behaviour of both individuals and groups of people, and the economic relationships between individuals and groups.
Let us give you two examples of what we mean. Our first example (about individual behaviour) is from an important part of economics known as demand theory, which is covered in Chapter 3. The theory addresses consumer behaviour, or how we behave when we go shopping. Why, for example, do people generally buy more strawberries as the price of strawberries falls?
TEST YOURSELF 1.1
study of?
●
Our second example introduces an important economic relationship. Having explained demand, we must go a stage further and look at how consumers interact with firms or producers. Firms supply and sell the goods that consumers buy, and economists call the ‘place’ in which goods are bought and sold a market. Indeed, before you started this economics course, you may well have heard the words ‘supply and demand’ and thought that is what economics is about. Well, in large measure that is true, particularly in the early chapters of this book, which cover Unit 1 of the specification.
Economics and scientific methodology
The essentials of scientific methodology, in the context of the demand theory we will look at in Chapter 3, are shown in the flowchart in Figure 1.1. Scientists start off by observing some aspect of the universe (in the natural sciences), or some aspect of human behaviour, in the case of the social sciences. In the case of demand theory, the starting point — shown in the uppermost box of Figure 1.1 — is observations of how individual consumers react to changes in the prices of the goods and services they buy. Demand theory then develops from the making of a tentative description, known as a hypothesis, of what has been observed. Hypothesis construction is depicted in the second box from the top in the flowchart. In the third box, predictions about human behaviour are deduced from the hypothesis, such as that an individual will always respond to a lower price by demanding more of the good in question.
This prediction is then tested against collected evidence about how individuals behave in the market place (the fourth box from the top). At this stage, the hypothesis becomes a theory. (The difference between the two is that whereas a hypothesis is a proposed explanation for something, a theory is when a hypothesis is tested and survives the test.)
At this stage, we are in the bottom left-hand box of Figure 1.1. However, this does not mean that the theory is true in all circumstances. All it says is that the hypothesis has survived the test or tests to which it has been exposed. It might not survive stronger tests, which may not yet have been devised. Scientific method is based on the possibility of falsification or refutation of a hypothesis.
TEST YOURSELF 1.2
Give
If a hypothesis fails to survive the tests to which it is exposed, one of two things can happen. The bottom right-hand box of Figure 1.1 shows the first possibility: outright rejection of the hypothesis. For example, a hypothesis that consumers always respond to price cuts by demanding less would surely be rejected (as would the hypothesis that consumers always respond to a price cut by demanding more of a good). The other possibility, which often occurs in economics, is that the hypothesis is changed, usually by watering it down, so as to make it less deterministic. In the case of demand theory, as the extension material on page 49 in Chapter 3 explains, watering down means that demand theory predicts that in most but not all cases, consumers respond to price cuts by demanding more of a good. Watered down in this way, the demand hypothesis survives the tests to which it is exposed, and becomes ‘the first “law” of demand’.
predictions
Concluding that the evidence supports the hypothesis, which now becomes the theory of demand
The evidence does not support the predictions, so the hypothesis is amended or rejected
New or revised hypothesis
Figure 1.1 Scientific method
TEST YOURSELF 1.3
The study of economics can be helped by looking at other relevant social sciences. Can you name three?
Social sciences and natural sciences
In 1905, the world-famous physicist, Albert Einstein, developed a theory of gravitation which predicted, among other things, that as it approaches Earth, light from a distant star is ‘bent’ by the gravitational pull of the sun. However, Einstein’s theory could not be tested until 1919 when there was a general eclipse of the sun. The theory survived the 1919 test, although much more recent tests have thrown doubt on parts of it. As is the case with Einstein’s theory, natural science theories are usually much ‘harder’ than the theories associated with ‘softer’ social sciences such as economics. As we have noted, economic theories often survive only through allowing a significant number of exceptions to their central predictions, which, according to critics, turns the theories into little more than generalisations.
To quote the economist Ha-Joon Chang, economics is not a science like biology is a science. In his book Economics: The User’s Guide, Chang argues that many economists believe, and tell other people, that economics is a ‘value-free’ science, like physics or chemistry. However, Chang argues that economics is a fundamentally political and moral subject in relation to choosing the best option. Whereas the particles and compounds studied by natural scientists do not hold political and moral views, human beings who populate the economy do, and so we cannot fully understand the economy without understanding politics and ethics. No economic argument can be free from politics and ethics: for example, the economic case for trying to persuade people to buy fair-trade products.
Very often economists respond to the criticism that their subject is ‘soft’ by arguing that they are only concerned with ‘positive economics’, which they claim is based on quite strict use of scientific methodology. Positive economics is concerned with ‘what is’ and ‘what will happen’ if a course of action is taken or not taken. In contrast, ‘normative economics’ is concerned with ‘what should or ought to be’.
The difference between positive and normative statements
KEY TERMS
positive statement a statement of fact that can be scientifically tested to see if it is correct or incorrect.
normative statement a statement that includes a value judgement and cannot be refuted just by looking at the evidence.
A lot of economics is concerned with what people ought to do. This is particularly true of the government. Ought the government to try to reduce unemployment, control inflation and achieve a ‘fair’ distribution of income and wealth? Most people probably think that all these objectives are desirable. However, they all fall within the remit of normative economics. Normative economics is about value judgements and views, but because people have different views about what is right and wrong, normative statements cannot be scientifically tested.
By contrast, a positive statement can be tested to see if it is incorrect. If a positive statement does not pass the test, it is falsified. A positive statement does not have to be true, however. For example, the statement that the Earth is flat is a positive statement. Although once believed to be true, the statement was falsified with the growth of scientific evidence. The key point is that positive statements can in principle be tested and possibly falsified, while normative statements cannot. Normative statements include ethical, or moral, judgements. Words such as ought, should, better and worse often provide clues that a statement is normative.
To take an economic example, consider the statement ‘If the state pension were to be abolished, a million older people would die of hypothermia.’ This is a positive statement which could be tested, though few if any people would
STUDY TIP
Make sure you understand fully the difference between a positive and a normative statement.
want to do this. By contrast, the statement ‘The state pension ought to be abolished because it is a waste of scarce resources’ is normative, containing an implicit value judgement about the meaning of the word ‘waste’.
TEST YOURSELF 1.4
Which one of the following is an example of a normative economic statement?
A Increased use of diesel-engine cars will lead to more atmospheric pollution.
B Higher taxes always lead to higher prices.
C The government should spend more on roads.
D Consumers generally act rationally.
How value judgements influence economic decision making and policy
Economists emphasise the distinction between normative and positive economics, but they often forget that the decision to study one over the other is itself a value judgement, and therefore a normative decision. A value judgement is about whether something is desirable or not — if we believe it is more desirable to study what is happening in the economy rather than what ought to happen, we have made a value judgement. Economics necessarily requires that government ministers make value-based judgements when deciding on economic policies. Despite this, economists often wrongly insist that the subject is value-judgement free.
Several years ago, the then chancellor of the exchequer, the UK government minister in overall charge of economic policy, said: ‘Rising unemployment and the recession have been the price that we have had to pay to get inflation down. That price is well worth paying.’ Government ministers are seldom as frank as this, knowing that their political opponents and the media will immediately seize on the argument that those in power are uncaring and cynical people. However, the quote does serve to illustrate how decision makers make value judgements when making economic policy decisions.
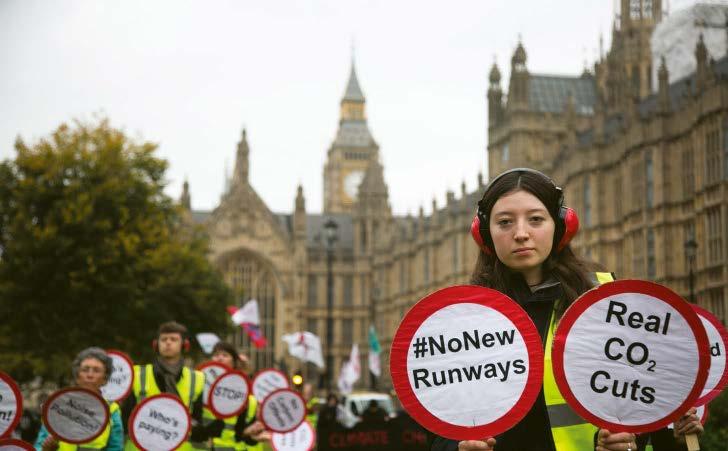
On occasion, government ministers make decisions on issues such as where a new airport should be located or whether high-speed trains are worthwhile. Before making decisions on issues such as these, the policy-makers know in advance that large swathes of the population will strongly oppose whatever decision is eventually made. To ward off public hostility, government ministers usually create the illusion that the decision-making process is completely scientific and objective. To do this, they hire independent ‘experts’ to provide advice. But the choice of expert in itself involves a value judgement. Do you choose someone you know in advance is sympathetic to the government’s cause, or are you more willing to go for an independent maverick? Whichever way you go, the so-called scientific processes used by the ‘experts’ to reach their conclusions may be riddled with value judgements. A classic case involved weighing up the costs and benefits of the location of a third London airport, which ultimately depended on putting money values on an hour of a business person’s time, and an hour of a holidaymaker’s time. It was quickly found that when different values were put on these, the airport location recommended by the experts would have ‘lost out’ under different costing criteria. (By the time the decision was made in 2016 to choose to build a new
STUDY TIP
Make sure you understand fully how value judgements link to normative statements.
runway at Heathrow rather than to expand Gatwick or Stanstead, the use of cost–benefit analysis had gone out of fashion for UK governments.)
The impact of moral and political judgements
Whatever decision is eventually made in the course of framing government economic policy, there will always be winners and losers who gain or suffer as a result of the decision. Governments often claim they have a moral right to make such decisions. They argue that their political manifesto published before the previous general election gives them the mandate, supported by the voters, to carry out their policies, regardless of the fact that among the electorate there will inevitably be some losers.
One example is provided by US President Donald Trump’s decision in 2018 to implement a ‘zero tolerance’ policy on illegal immigration into the USA. The policy involved splitting adult illegal migrants from their children, however young they may have been, and keeping the children in wire cages along the US border with Mexico. On humanitarian grounds the policy was so unpopular in the USA that it was quickly abandoned in a policy ‘U-turn’, though the other parts of Trump’s extreme anti-immigrant policy still remained in place.
SECTION 1.1 SUMMARY
• Economic methodology involves the application of tested economic theories to explain real-world economic behaviour.
• It is important to understand the difference between positive and normative statements. A positive statement can be tested to see if it is correct or false; a normative statement is a statement that includes a value judgement which cannot be refuted purely by looking at the evidence.
• A value judgement is about whether something is desirable or not.
• Government ministers make value-based judgements when deciding on economic policies.
• There will always be winners who gain and losers who suffer as a result of government policy decisions.
Protest against third runway at Heathrow
1.2 The nature and purpose of economic activity
● Needs and wants
The production of goods and services to satisfy people’s needs and wants is the central purpose of economic activity. A need is something people must have, something that they cannot do without. Food provides an example. If people starve, they will eventually die. By contrast, a want is something people would like to have, but which is not essential for survival. It is not absolutely necessary, but it is a good thing to have. Books provide an example. Some people might argue that books are a need because they think they can’t do without them. But they don’t need literature to survive. They do need to eat. (It is worth noting that food can be both a need and a want, depending on the type of food. Protein and vitamins are needs, but bars of chocolate are wants. People don’t need to eat chocolate to survive.)
Satisfying people’s needs and wants means improving economic welfare Welfare is a concept bandied about a lot by economists, but often without a clear indication of what the concept means. Welfare basically means human happiness — anything that makes a person happier improves their economic welfare, though obviously we must ignore activities such as theft where one person becomes better off through stealing from other people. Short-term happiness may be at the expense of long-term happiness. The consumption of more material goods and services usually improves economic welfare, though, in the long term, consuming more and more food, and the wrong type of food, can lead to health problems.
KEY TERMS
need something that is necessary for human survival, such as food, clothing, warmth or shelter.
want something that is desirable, such as fashionable clothing, but is not necessary for human survival.
economic welfare the economic well-being of an individual, a group within society, or an economy.
STUDY TIP
Make sure you can explain the meaning of the term ‘economic welfare’.
There are also important elements of human happiness and welfare that have nothing to do with the consumption of material goods. These include quality of life factors, such as the pleasure gained from family and friends or from contemplating a beautiful view.
TEST YOURSELF 1.5
With an example of each, explain the difference between a need and a want.
● The key decisions of what and how to produce
We mentioned at the beginning of this chapter that decisions are made about what to produce, how to produce and who is to benefit from the goods and services produced. How these decisions are made depends upon the nature of the economic system within the economy. The set of institutions within which a community decides what, how and for whom to produce is called an economic system. Although the problem of scarcity is fundamental and common to all forms of human society, from humble tribal groupings of hunters or gatherers in the Amazonian forest, to rich national states such as the United States of America, different economic systems have evolved in different societies.
SYNOPTIC LINK
The key economic concept of scarcity is explained in section 1.4 of this chapter, and also in section 1.3, in the context of scarce environmental resources.
Perhaps the most widely used method of defining and classifying economic systems is according to the way or mechanism through which scarce resources reach the people who eventually consume or use them. Although there are a variety of ways in which wealth and purchasing power can be allocated amongst individuals, including inheritance and other types of gift, theft and luck or chance, such as winning a fortune on the National Lottery, the two mechanisms by which economic systems are defined are the market mechanism (or price mechanism) and the command mechanism (or planning mechanism). An economic system in which goods and services are purchased through the price mechanism in a system of markets is called a market economy, whereas one in which government officials or planners allocate economic resources to firms and other productive enterprises is called a command economy (or planned economy).
Between these extremes, many economies, particularly those of the developed countries of western Europe such as the United Kingdom, are called mixed economies. A mixed economy, as the name suggests, is a mixture of different types of economic system. A mixed economy contains both a large market sector and a large non-market sector in which the planning mechanism operates. Figure 1.2 illustrates mixed economies in relation to planned and market economies.
In which the planning mechanism allocates scarce resources to their final uses
In which the price mechanism allocates scarce resources in the system of markets which makes up the economy
Figure 1.2 Command economies, mixed economies and market economies
TEST YOURSELF 1.6
To what extent is the UK economy a mixed economy?
CASE STUDY 1.1
KEY TERMS
economic system the set of institutions within which a community decides what, how and for whom to produce.
market economy an economy in which goods and services are purchased through the price mechanism in a system of markets.
command economy (also known as a planned economy ) an economy in which government officials or planners allocate economic resources to firms and other productive enterprises.
mixed economy an economy that contains both a large market sector and a large non-market sector in which the planning mechanism operates.
Allocating resources through the price mechanism and the planning mechanism
In a pure market economy, the price mechanism performs the central economic task of allocating scarce resources among competing uses through the markets which make up the economy. Transport costs and lack of information may create barriers that separate or break up markets. In past centuries, such barriers often prevented markets from operating outside the relatively small geographical area of a single country or even a small region within a country.
However, while some markets exist in a particular geographical location — for example, a street market or until quite recently the london Stock Exchange — many markets do not. In recent years, modern developments have allowed goods to be transported more easily and at lower cost, and have helped in the transmission of market information via telephone and the internet. This has enabled many markets, especially commodity and raw material markets and markets in financial services, to become truly global or international markets functioning on a worldwide basis.
A complete command economy is an economy in which all decisions about what, how, how much, when, where and for whom to produce are taken by a central planning authority, issuing commands or directives to all the households and producers in the society. Such a system could only exist within a very rigid and controlled political framework because of the restrictions on individual decision making that are implied.
In much the same way as a pure market economy, in which the price mechanism alone allocates resources, is a theoretical abstraction, so no economy in the real world can properly be described as a complete or pure planned economy. Before the collapse of the communist political system around 1990, the countries of eastern Europe were centrally planned economies. However, they were not pure planned economies. Production but not consumption was planned. Consumers often had to queue to get consumer goods, whose prices were fixed by the planners. Shortages resulted, which, together with the generally inferior quality of consumer goods, contributed to the breakdown of the command economies.
Some communist countries still exist, namely the People’s Republic of China, north Korea, Vietnam and Cuba. However, all these countries, with the exception until recently of north Korea, have encouraged the growth of markets to a greater or lesser extent. They have communist political systems, but they have moved away from being pure command economies. In a sense, China is now more capitalist than the USA and the mixed economies of western Europe. The term ‘state-capitalism’ is now used to describe much of China’s economy.
Follow-up questions
1 Distinguish between a pure market economy and the market sector of a mixed economy.
2 What is the other name of a planned economy?
3 With the help of Chapter 3, explain how the price mechanism allocates scarce resources between competing uses.
4 Why did the command economies of central and eastern Europe, such as the old Soviet Union, break up?
CASE STUDY 1.2
The UK as a mixed economy
The UK economy developed into a mixed economy after the Second World War ended in 1945, when a number of important industries such as coal, rail and steel were nationalised and taken into public ownership. Previously, the 1944 Education Act had extended state provision of education, and the creation of the national Health Service in 1948 did the same for healthcare.
For about 30 years after the end of the Second World War, from the 1940s to the 1970s, the majority of UK citizens (and the major political parties) agreed that the mixed economy was working well. Most people believed that certain types of economic activity, particularly the production and distribution of consumer goods and services, were best suited to private enterprise and the market economy. But people also accepted that utility industries such as gas and electricity should be nationalised, and that important services such as education, healthcare and roads should in part be provided by government, outside the market, and financed through the tax system. In short, a consensus existed around the belief that the mixed economy was right for the UK.
However, from about 1980 onwards, many economists and politicians began to blame the mixed economy for the UK’s deteriorating economic performance relative to that of its main competitors in western Europe and Japan. Critics argued that the public and non-market sectors of the economy were inefficient and wealth consuming rather than wealth creating. They had become too big and needed cutting down to size. Critics of the mixed economy argued that a concerted effort should be made to change the nature of the UK economy fundamentally, by increasing private ownership and market production.
Successive governments implemented policies that changed the nature of the mix in favour of private ownership and market forces, at the expense of public ownership and state planning. The UK economy is now much closer to being a pure market and private enterprise economy than it was 45 years ago. The three main policies used to change the nature of the UK economy have been privatisation, marketisation and deregulation, polices which collectively can be called economic liberalisation.
Privatisation involved the sale of state-owned assets such as nationalised industries to private owners. This was often accompanied by marketisation (or commercialisation), whereby prices are charged for goods and services that the state previously provided free of charge. Deregulation, the third aspect of liberalisation, attempts to remove barriers to entry and government red tape and bureaucracy from the operation of markets.
Follow-up questions
1 Critics of the UK economy have called it a ‘mixed-up’ economy rather than a ‘mixed economy’. What do you think they mean?
2 What is meant by the term ‘private enterprise’?
3 Distinguish between privatisation and marketisation.
4 Do you think that there is now a case for increasing rather than reducing state ownership of UK industry? Justify your answer.
SECTION 1.2 SUMMARY
• A need is something people must have, something that they cannot do without.
• A want is something people would like to have, but which is not essential for survival.
• How decisions are made about what to produce, how to produce and who is to benefit from the goods and serv ices produced depends upon the nature of the economic system.
• Market economies, command economies and mixed economies are examples of economic systems, defined in ter ms of whether or not the price mechanism or the planning mechanism allocates scarce resources among competing uses.
• Economic systems can also be defined in terms of who owns the means of production.
• The UK economy is often called a mixed economy, being on the one hand a mix of market and non-market sectors and on the other hand a mix of privately owned and publicly owned sectors.
KEY TERMS
production converts inputs or factor services into outputs of goods and services.
capital good (also known as a producer good) a good which is used in the production of other goods or services.
consumer good a good which is consumed by individuals or households to satisfy their needs or wants.
1.3 Economic resources
For most people, most of the time, increased consumption of material goods is an important part of improving economic welfare. Most of the goods we consume must first be produced. This requires the use of economic resources. These goods are scarce in relation to demand, which gives rise to the need for rationing and economising in their use.
The basic nature of production is shown in Figure 1.3. Production is a process, or set of processes, that converts inputs into outputs. The eventual outputs are the consumer goods and services that go to make up our standard of living, though inputs are of course also used to produce the capital goods that are necessary for the eventual production of consumer goods
KEY TERM
factors of production inputs into the production process, such as land, labour, capital and enterprise.
STUDY TIP
It is important to understand how factors of production are inputs used to produce output of goods and services.
Figure 1.3 The basic nature of production
The factors of production
Economists call the inputs into the production process, which are shown in Figure 1.3, the factors of production. Four factors of production are usually identified. These are land, labour, capital and enterprise, the last often being called the entrepreneurial input.
Entrepreneurs are different from the other factors of production. They are the people who address the issues introduced earlier, deciding what to produce, how to produce it and for whom to produce it. An entrepreneur decides how much of the other factors of production, including labour, to employ. The costs of employing land, labour and capital, together with the cost of the entrepreneur’s own services, become the firm’s costs of production. In essence, the entrepreneur is a financial risk taker and decision maker. Profit, which is the entrepreneur’s financial reward, results from successful decision making. Entrepreneurial profit is the profit left over after the cost of employing the other factors of production is deducted from the sales revenue gained from selling the goods and services the entrepreneur decides to produce.
The environment as a scarce resource
Environmental resources comprise all the natural resources that are used or can be used in the economic system. These are:
● physical resources, such as soil, water, forests, fisheries and minerals
● gases, such as hydrogen and oxygen
● abstract resources, such as solar energy, wind energy, the beauty of the landscape, good air and clean water
Output of goods or services for sale in markets
KEY TERMS
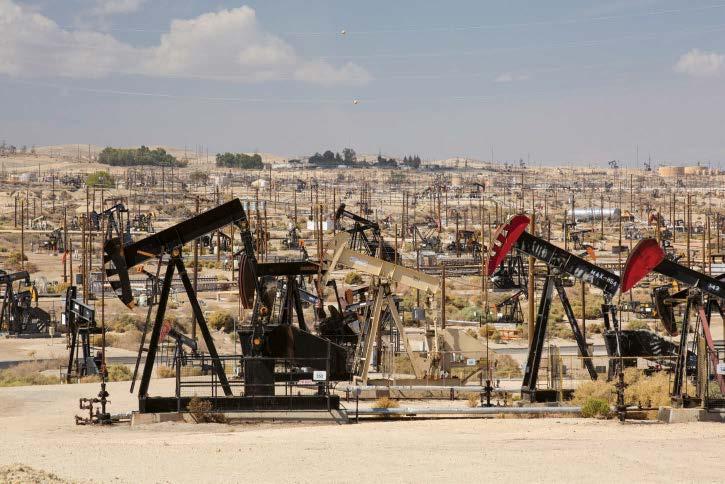
renewable resource a resource, such as timber, that with careful management can be renewed as it is used. non-renewable resource (also known as a finite resource) a resource, such as oil, which is scarce and runs out as it is used.
Environmental resources can be split into renewable and non-renewable resources, with the latter further divided into recyclable and non-recyclable resources. Renewable resources , which are reproducible and perpetually maintainable, include forests, animals and water. The availability of these resources depends, however, on their management by humans. By contrast, non-renewable resources , such as oil, gas and minerals, cannot be regenerated or their regeneration is so slow that the stock of resources cannot meaningfully be increased. These are finite resources . Recyclable non-renewable resources such as minerals, paper and glass can be reused in the economic system. In theory, all of these resources can be recycled but it is not always possible and economic to recycle more than a small fraction. Non-recyclable resources such as coal, gas and oil are finite in the sense that, once used, their stock is no longer available for future use.
TEST YOURSELF 1.7
Distinguish between a nonrenewable and a renewable environmental resource.
Environmental resources are part of the factor of production, land. Some environmental resources, such as the air we breathe and the water we drink, are often described as the ‘free gifts of nature’. However, this view can be questioned. In most countries and regions where large numbers of people live, clean air and drinkable water are scarce commodities and not the ‘free gifts of nature’. Resources which could be put to other uses are used instead to produce clean air and water. The need to get rid of the effects of pollution created by humankind means that clean air and water are scarce and not free. Production and consumption activities taking place in the economy affect and often damage the natural environment.
Oil is a non-renewable resource
CASE STUDY 1.3
George Monbiot on how we are trashing the planet
George Monbiot is a British writer known for his environmental, political activism. He writes a weekly column for the Guardian newspaper.
In november 2017, George Monbiot published an article about how humankind is trashing planet Earth. He argued that economics teaches us to believe in the holy grail of economic growth. Monbiot argued that ‘already we are bursting through the physical limits of the planet that sustains us’. Monbiot rejects the view that, through green consumerism, we can reconcile perpetual growth with planetary survival. One recent article, published in the journal Environment and Behaviour, finds that those who identify themselves as conscious consumers use more energy and carbon than those who do not.
The richer we are, the bigger our ecological footprint, regardless of our good intentions. Those who see themselves as green consumers, the paper found, ‘mainly focus on behaviours that have relatively small benefits’.
A global growth rate of 3% means that the size of the world economy doubles every 24 years. This causes environmental crises to accelerate at a rate that cannot be sustained.
To read George Monbiot’s article in full, access www.monbiot.com and search for ‘Everything must go’. You can access all of Monbiot’s articles on the same site.
Follow-up questions
1 What is meant by economic growth?
2 Economists generally seem to think that economic growth is a good thing and that we must always aim for more growth. Explain why you think this is good or bad.
3 Discuss the environmental effect of people choosing to drink bottled water in preference to tap water.
4 Should all of your reading be conducted online without the use of printed textbooks such as this one?
SECTION 1.3 SUMMARY
• Increased consumption of material goods is an important part of improving economic welfare.
• Most of the goods we consume must first be produced.
• This requires the use of economic resources.
• These goods are scarce in relation to demand, which gives rise to the need for rationing and economising in their use.
• Production is a process, or set of processes, that converts inputs into output s.
• Inputs are called factors of production and are economic resources.
• l and, labour, capital and enterprise (often called the entrepreneurial input) are the factors of production.
• The entrepreneur is the factor of production that decides what to produce, how to produce and for whom to produce.
• Inputs are also used to produce the capital goods that are necessary for the eventual production of consumer goods and services.
• Environmental resources comprise all the natural resources that are used or can be used in the economic system.
1.4 Scarcity, choice and the allocation of resources
● Scarcity: the fundamental economic problem
We have already mentioned that we live on a finite planet in which most economic resources are limited. As we have seen, their use usually has to be rationed either by the price mechanism or by the planning mechanism. The fundamental economic problem is therefore scarcity. In a world of scarcity, people (even the very rich) have limited incomes, which means that they face a budget constraint. When the price mechanism is rationing scarce resources between competing uses, a budget constraint represents all the combinations of goods and services that a consumer may purchase given current prices and their limited income.
KEY TERMS
fundamental economic problem how best to make decisions about the allocation of scarce resources among competing uses so as to improve and maximise human happiness and welfare. scarcity results from the fact that people have unlimited wants but resources to meet these wants are limited. In essence, people would like to consume more goods and services than the economy is able to produce with its limited resources.
● The need for choice
KEY TERM
choice choosing between alternatives when making a decision on how to use scarce resources.
If goods are scarce and incomes are limited, a choice or choices have to be made. Consider, for example, a family with a weekly income of £1,200. The family currently spends £350 on housing, £350 on food, £300 on other goods and services, including heating and lighting, and £100 on entertainment. The family’s total weekly spending on goods and services is thus £1,100, meaning the family manages to save £100. Suddenly, the cost of housing rises to £550. To avoid getting into debt, and assuming that family income cannot increase, one or more probably unpleasant choices will have to be made. An obvious possibility is to cut down on entertainment, such as visits to the cinema. Other possibilities could be spending less on home heating, buying cheaper food, cutting down on alcoholic drink and stopping saving. Something will have to be given up. Unless the family gets into debt or its income increases, it will have to economise on its spending and saving decisions.
You must also appreciate the fact that, even without an increase in house prices, scarcity means that individuals and households are constantly making choices about how to spend their limited incomes and how to make the best use of their time. A decision to spend more on a holiday, for example, means that a family chooses to spend less on other goods, or to save less.
●
KEY TERM
opportunity cost the cost of giving up the next best alternative.
TEST YOURSELF 1.8
What is meant by rational economic behaviour?
Choices have an opportunity cost
A need for choice arises whenever an economic agent (for example, an individual, a household or a firm) has to choose between two or more alternatives which are mutually exclusive, in the sense that it is impossible or impractical to achieve both at the same time. In the jargon of economics, an opportunity cost is involved.
If you ask friends who haven’t studied economics the meaning of the word ‘cost’, typically they will answer that cost is the money cost either of producing a good or of buying a good. Economists, by contrast, focus on opportunity cost. The opportunity cost of any choice, decision or course of action is measured in terms of the alternatives that have to be given up.
SYNOPTIC LINK
The assumption that people are always rational when making choices is questioned in the discussion of behavioural economics in Chapter 2.
Economists generally assume that people behave rationally. Rational behaviour means people try to make decisions in their self-interest or to maximise their private benefit. When a choice has to be made, people always choose what they think at the time is the best alternative, which means that the second best or next best alternative is rejected. Providing people are rational, the opportunity cost of any decision or choice is the next best alternative sacrificed or forgone. For example, if you choose to spend half an hour watching EastEnders on TV, the opportunity cost is the lost opportunity to spend this time reading a magazine or book.
STUDY TIP
Make sure you can link together the three concepts of scarcity, choice and opportunity cost.
TEST YOURSELF 1.9
Can you explain one factor that in real life may prevent a person from making a rational decision?
EXTENSION MATERIAL
Rational behaviour and opportunity cost
look carefully at the sentence in the previous paragraph about opportunity cost: When a choice has to be made, people always choose what they think at the time is the best alternative, which means that the second best or next best alternative is rejected. The words ‘think at the time’ are quite important. Suppose you decide to see a film, believing at the time you are going to enjoy the film. Two hours later, coming out of the cinema, you say ‘that was a load of rubbish, I wish I hadn’t bothered’. nevertheless, at the time the decision was made, deciding to watch the film was a rational decision because you believed you would enjoy watching it. Having left the cinema, irrational behaviour would be going back to the box office and paying good money to see the film again. Even if the film can be watched freely on television, there is still an opportunity cost, though in this case it only involves time. Time is scarce, and the 2 hours spent watching the film cannot be spent on some other activity such as reading a book. A choice has to be made between the two activities. Of course, the way the choice is exercised will differ for different people, even if everyone enjoys both watching films and reading. People with plenty of time to spare — for example, retired or unemployed people — value time less highly than a City trader working in a dealing room from 7 a.m. until 9 p.m.
Going to a cinema to watch a film is, of course, a consumer activity. People have to think carefully about how they spend their limited incomes. In economics this is known as a budget constraint. Money spent on one good cannot be spent on another good. But there is always an opportunity cost when deciding to consume a good, involving time if not money.
TEST YOURSELF 1.10
Give an example of an opportunity cost facing an A-level student when choosing to spend a whole evening playing computer games.
Firms also have to make choices about what and how to produce. Consider a textile manufacturer who can produce either shirts or dresses from the same production line, but not both goods at the same time. In this situation, the opportunity cost of producing more shirts is the number of dresses sacrificed or forgone. Suppose also that both shirts and dresses can be produced using one of two different technologies. These are a labour-intensive technology involving lots of workers but very little capital equipment, and a capitalintensive technology in which there are very few workers but expensive automated capital equipment. Given the budget constraint facing the firm, the opportunity cost of choosing one method of production is the sacrificed opportunity to use the other method.
A further example of opportunity cost arises when a teenager makes a decision about whether to leave school and get a job, or to go to university. Very often this involves the choice between income now and income in the future.
Economists call this inter-temporal choice, or choice over time.
SYNOPTIC LINK
Rational and irrational behaviour are key concepts in behavioural economics, described in Chapter 2.
QUANTITATIVE SKILLS 1.1
Worked example: calculating an opportunity cost
A small electrical goods manufacturer can produce either TV sets or radio sets using all its available resources. Table 1.1 shows the different combinations of the two goods the firm can produce.
Table 1.1 Production possibilities for TVs and radio sets
What happens to the opportunity cost of TV sets in terms of radios, as TV set production increases from zero to seven sets?
If the firm chooses to produce only one TV set, its opportunity cost is one radio set foregone (30 minus 29 radio sets). Performing a similar calculation when TV set production is increased by an extra unit, the opportunity cost of the second TV set is two radio sets. All the opportunity costs are set out in Table 1.2:
Table 1.2 Opportunity costs of producing an extra TV set
1st TV set1 radio set (30 − 29)
2nd TV set2 radio sets (29 − 27)
3rd TV set3 radio sets (27 − 24)
4th TV set4 radio sets (24 − 20)
5th TV set5 radio sets (20 − 15)
6th TV set6 radio sets (15 − 9)
7th TV set9 radio sets (9 − 0)
The data show an increasing opportunity cost in terms of radio sets forgone as production of TV sets increases.
KEY TERMS
production possibility frontier
a curve depicting the various combinations of two products (or types of products) that can be produced when all the available resources are fully and efficiently employed.
technical progress: new and better ways of making goods and new techniques for producing more output from scarce resources.
STUDY TIP
Make sure you understand and can distinguish between the words ‘micro’ and ‘macro’. ‘Micro’ means small, whereas ‘macro’ means large. Microeconomics, which is covered in the first eight chapters of this book, looks at the ‘little bits’ of the economy: for example, individual markets, firms and consumers. By contrast, macroeconomics, covered in Chapters 9–15, looks at the ‘aggregate economy’ or the economy ‘as a whole’.
SECTION 1.4 SUMMARY
• The economic problem is how limited resources are used in relation to people’s desires and wants.
• The economic problem results from relative scarcity.
• Scarcity results in the need for choice.
• Whenever a choice has to be made, there is an opportunity cost.
• The opportunity cost of any decision is the next best alternative forgone.
• Economists generally assume that people are rational, choosing the best alternative available.
1.5 Production possibility diagrams
So far, we have focused mainly on how scarcity and choice may affect firms, families and individuals at the microeconomic level. In much the same way, but on a far grander scale, the economy of the nation as a whole faces a similar need for choice. To explain how the economic problem affects the whole economy, we will use a diagram which you will come across again and again in your economics course — a production possibility diagram.
The key feature of a production possibility diagram is a production possibility frontier (PPF) or production possibility curve. A PPF illustrates the different combinations of two goods, or two sets of goods, that can be produced with a fixed quantity of resource, providing we assume that all available resources are being utilised to the full. The PPF in Figure 1.4 illustrates the different combinations of capital goods and consumer goods that the whole economy can produce when all the economy’s resources are employed, with no spare capacity. To put it another way, the PPF shows what the economy can produce, assuming that all the labour, capital and land at the country’s disposal are employed to the full, and assuming a given state of technical progress.
Figure 1.4 Using a production possibility frontier diagram to illustrate the economic problem
Given that resources and capacity are limited, a choice has to be made about the type of good to produce. Look closely at points X and Y on the diagram. Point X shows the maximum possible output of consumer goods, assuming that the economy only produces consumer goods (i.e. no capital goods are produced). Likewise, point Y shows the maximum possible output of capital goods, assuming that the economy only produces capital goods. In fact, points X and Y show the two extreme production possibilities, since all goods are either consumer goods or capital goods. Finally, the line drawn between points X and Y in Figure 1.4 is the economy’s production possibility frontier. The PPF shows all the different combinations of consumer goods and capital goods
STUDY TIP
you must learn to draw and interpret production possibility diagrams, which are important in both microeconomics and macroeconomics. At the micro level they can be used to illustrate scarcity, choice, opportunity cost and productive efficiency. At the macro level, they can be used to illustrate economic growth, and full employment and unemployment.
that can be produced, given the assumptions mentioned earlier about full employment of available resources and the state of technical progress. Point A, for example, shows K1 capital goods and C1 consumer goods being produced. An increase in capital goods production to K2, shown at point B, means that consumer goods production falls to C2 C1 − C2 is the opportunity cost of producing K2 − K1 additional capital goods. Whichever combination of capital and consumer goods is actually chosen reflects decisions made in society about allocating scarce resources between competing uses.
QUANTITATIVE SKILLS 1.2
●Figure 1.5 Production possibilities for apples and pears
A country is currently producing 3.2 million tons of apples and 3.5 million tons of pears. Calculate the opportunity cost in terms of apples of increasing pear production to 5 million tons.
The opportunity cost of increasing pear production by 1.5 million tons is the sacrifice of 1.2 million tons of apples.
SYNOPTIC LINK
As we explain below, production possibility diagrams can also be used to illustrate economic growth. This is revisited in Chapter 11. Chapter 10 explains another way of illustrating economic growth, in terms of aggregate demand and supply or AD/AS analysis.
Macroeconomic PPF diagrams
The production possibility frontier in Figure 1.4 shows the economy as a whole, which means that the PPF depicts the macro economy. Before we look at some microeconomic production possibility frontiers, we shall explain two important ways in which macroeconomic PPF diagrams can be used.
Using a PPF diagram to show economic growth
Figure 1.6 shows how a PPF diagram can be used to illustrate economic growth. There are two forms of economic growth, which are explained in detail in Chapter 11. These are long-run economic growth and short-run economic growth.
Figure 1.6 Long-run and short-run economic growth
Economic growth is defined as the increase in the potential level of real output the economy can produce over a period of time: for example, a year. Strictly, this is long-run economic growth, which is not the same as short-run economic growth. If the economy’s production possibility
KEY TERM
economic growth the increase in the potential level of real output the economy can produce over a period of time.
KEY TERMS
full employment when all who are able and willing to work are employed.
unemployment when not all of those who are able and willing to work are employed.
TEST YOURSELF 1.11
Illustrate full employment and unemployment on a production possibility frontier diagram.
frontier is PPF1 initially, short-run economic growth is shown by the movement from point C inside the frontier to a point, such as point A, on the frontier. Long-run economic growth is shown by the outward movement of the frontier to PPF2. The movement from point A to point B depicts long-run economic growth. Short-run growth makes use of spare capacity and takes up the slack in the economy, whereas long-run growth increases total productive capacity.
Using a PPF diagram to show full employment and unemployment
As mentioned earlier, all points on a production possibility frontier show full employment of available resources. For a macroeconomic production possibility frontier, this means full employment of labour as well as other resources that can be used in the course of production. Thus, points A and B in Figure 1.7 show full employment when the economy’s production possibility frontier is in the position indicated. By contrast, a point inside the PPF, such as point X, shows that some resources, including labour, are not being employed. There is unused capacity in the economy. (Note that if long-run economic growth were to move the PPF outward to a new position, points A and B on the ‘old’ production possibility frontier would now be points of unemployment, as they would be located inside the new ‘further out’ frontier.)
SYNOPTIC LINK
Full employment and unemployment feature in Chapters 11, 12 and 3.
Figure 1.8 The production possibility frontier facing a firm producing mobile phones and laptop computers
economy
Microeconomic PPF diagrams
Look carefully at the microeconomic production possibility frontier in Figure 1.8. We can tell this is a microeconomic diagram because of the labels on the two axes of the graph. The diagram depicts a situation in which a firm can produce both mobile phones and laptop computers from the resources it has available. As in Figure 1.4, points X and Y show the extreme possibilities facing the firm. Point X on the horizontal axis shows the maximum possible output of laptop computers — providing no mobile phones are produced. This means that all available resources are devoted to the production of laptop computers. Conversely, point Y on the vertical axis shows the opposite situation: the maximum possible output of mobile phones when zero laptop computers are produced. As was the case in the macroeconomic production possibility diagrams, all points on the PPF between X and Y show different combinations of the two goods being produced between the two extreme possibilities.
We can use Figure 1.8 to explain a number of important economic relationships. These are described overleaf.
All points on the frontier such as A and B show full employment
Figure 1.7 Using a production possibility curve diagram to show full employment and unemployment in the
TEST YOURSELF 1.12
Provide another example of a production possibility frontier diagram illustrating a microeconomic idea or concept.
SYNOPTIC LINK
link the microeconomic use of production possibility frontier diagrams to the coverage of the price mechanism in Chapter 3 and to production, costs and revenue in Chapter 4.
Scarcity, resource allocation and choice (revisited)
A PPF diagram such as Figure 1.8 shows different possible ways in which scarce resources can be allocated between competing uses. This involves choice. Compared to the resource allocation at point A, point B shows the effect of shifting more resources into the production of mobile phones, with fewer resources being allocated to laptop computer production.
KEY TERM
resource allocation the process through which the available factors of production are assigned to produce different goods and services, e.g. how many of society’s economic resources are devoted to supplying different products such as food, cars, healthcare and defence.
Opportunity cost (revisited)
Production possibility diagrams provide a very good way of illustrating opportunity cost. Suppose, for example, that the firm in Figure 1.8 initially produces MP1 mobile phones and LC1 laptop computers. This combination of the two goods is shown at point A in the diagram. A decision by the manufacturer to increase production of mobile phones from MP1 to MP2 means that computer production falls by LC1 − LC2. Moving from point A to point B on the curve, the fall in computer production is the opportunity cost of the increase in phone production.
A large company such as Apple must decide how to allocate its resources
Look now at the shape of the PPF in Figure 1.8. You can see that the slope of the curve falls, moving up the curve from point A to point B, and indeed to all other points further up the curve. There is a reason for this. The slope shows the opportunity cost of producing more mobile phones in terms of the laptop computers that have to be sacrificed. When mobile phone production increases from MP1 to MP2 laptop computer production falls by LC1 − LC2 This is the opportunity cost involved. But suppose mobile phone production increases again by the same amount as before (which means that MP3 − MP2
is the same as MP2 − MP1). In this situation, shown at point C on the curve, more laptop computers than before have to be given up. LC3 − LC2 is larger than LC2 − LC1. The slope of the curve of the production possibility frontier shows that the opportunity cost of producing mobile phones increases as more mobile phones are produced. A greater number of laptop computers have to be sacrificed whenever an extra mobile phone is produced.
●KEY TERM
productive efficiency for the economy as a whole occurs when it is impossible to produce more of one good without producing less of another. For a firm it occurs when the average total cost of production is minimised.
Productive efficiency and production possibility diagrams
You will come across the concept of economic efficiency on numerous occasions as you proceed through the course and this book. There are a number of different measures of economic efficiency, one of which is productive efficiency. Chapter 5 explains productive efficiency in terms of a firm minimising the average cost of producing a good. In this chapter, we focus on two other ways of explaining the concept, both of which are illustrated by the production possibility curve in Figure 1.9.
Productive efficiency occurs when output is maximised from available inputs. But we know already that a PPF shows maximisation of output from available inputs at every point on the curve, though the combination of the two goods (in this case, capital goods and consumer goods) varies at different points on the curve. This means that all points on the economy’s production possibility frontier shown in Figure 1.9, including points A and B, are productively efficient. By contrast, all points inside the PPF are productively inefficient, including point Z. Productive inefficiency occurs when output is not maximised from available inputs. At point Z, the economy is not employing all the available resources, including, of course, labour. Productive inefficiency is often associated with unemployment.
Consider now a movement along the PPF from point A to point B. The diagram is telling us that, when on the PPF, more capital goods can be produced only by giving up the production of some consumer goods. This is another way of explaining productive efficiency. Productive efficiency occurs when producing more of one good involves reducing production of other goods. By contrast, when the economy is productively inefficient at point Z, more capital goods and consumer goods can be produced by taking up the slack in the economy and making use of idle resources.
SYNOPTIC LINK
As noted, there are various types of economic efficiency you need to learn and understand as you proceed through the course. One type is productive efficiency, first introduced in this chapter, which can be illustrated on a production possibility frontier diagram. Other types of efficiency are best learnt later in the course. One of these is allocative efficiency. Chapter 5 explains in some detail the meaning of allocative efficiency (and productive efficiency) in the context of two market structures known as perfect competition and monopoly. Chapter 8 also considers allocative efficiency, this time in the context of market failure. Allocative efficiency is a welfare concept rather than a production concept.
Figure 1.9 Productive efficiency and the economy’s PPF
TEST YOURSELF 1.13
A production possibility frontier can be used to show all the following except:
A all the different combinations of two goods that can be produced from avail able inputs
B all the productively efficient combinations of output that can be produced from available inputs
C the opportunity cost of producing more of a particular good
D the economic welfare a consumer gains from different combinations of goods
QUANTITATIVE SKILLS 1.3
Worked example: drawing a PPF from given data
Draw a production possibility frontier using the data below.
Table 1.3 Production possibility schedule for producing tanks and military aircraft
Figure 1.10 PPF for tanks and military aircraft
The PPF drawn from these data is shown in Figure 1.10.
Unlike all the PPFs shown earlier in this chapter, this one shows a constant opportunity cost of 10 military aircraft whenever 10 extra tanks are produced. This means that the PPF is a straight line, positioned between the two production possibility extremes of zero tanks and 100 military aircraft, and 100 tanks and zero military aircraft.
TEST YOURSELF 1.14
Suppose the opportunity cost of producing one extra unit of a good in terms of another good sacrificed fell as more of the good was produced. In what w ay would the shape of the PPF differ from those shown in this chapter?