A Cornerstone in Luxury Real Estate for Over One Hundred Years Dolores South of Seventh ■ P.O. Drawer C ■ Carmel-by-the-Sea, California 93921 | 831.622.1000 ■ CarmelRealtyCompany.com | DRE#01871627 CARMEL-BY-THE-SEA, CARMEL POINT, GREATER CARMEL, CARMEL VALLEY, PEBBLE BEACH, CARMEL HIGHLANDS, BIG SUR & SOUTH COAST 2022 Annual Market Report CARMEL REALTY COMPANY Mark Ryan ■ 831.238.1498 REALTOR® | DRE#01458945 Paul Brocchini ■ 831.601.1620 Broker Associate | DRE#00904451 Presented by

2 Our Featured Listings 26320
Road,
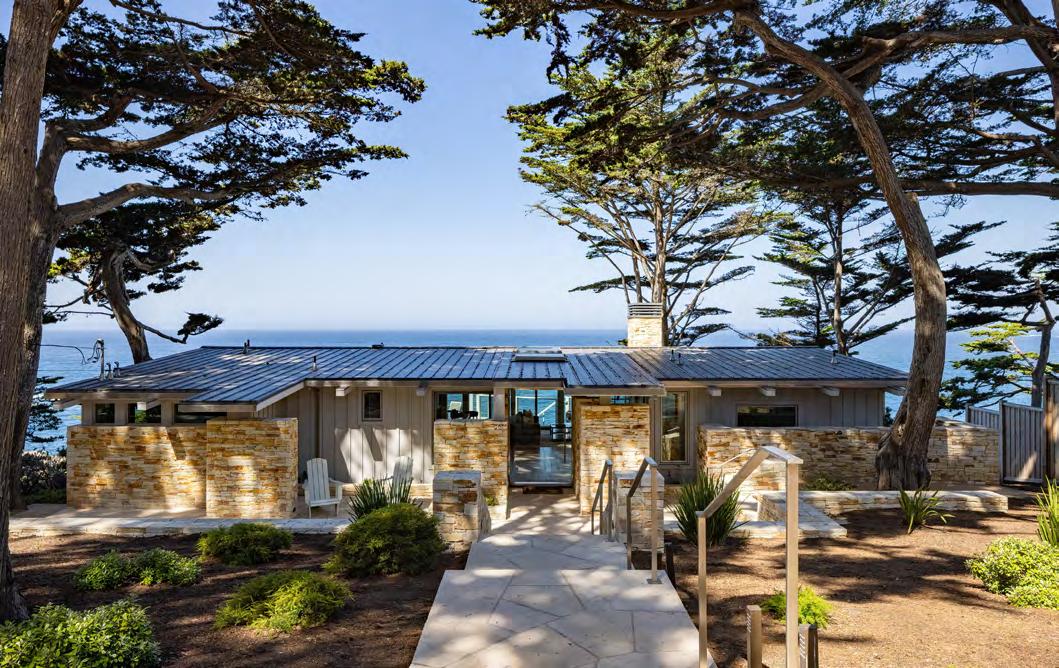
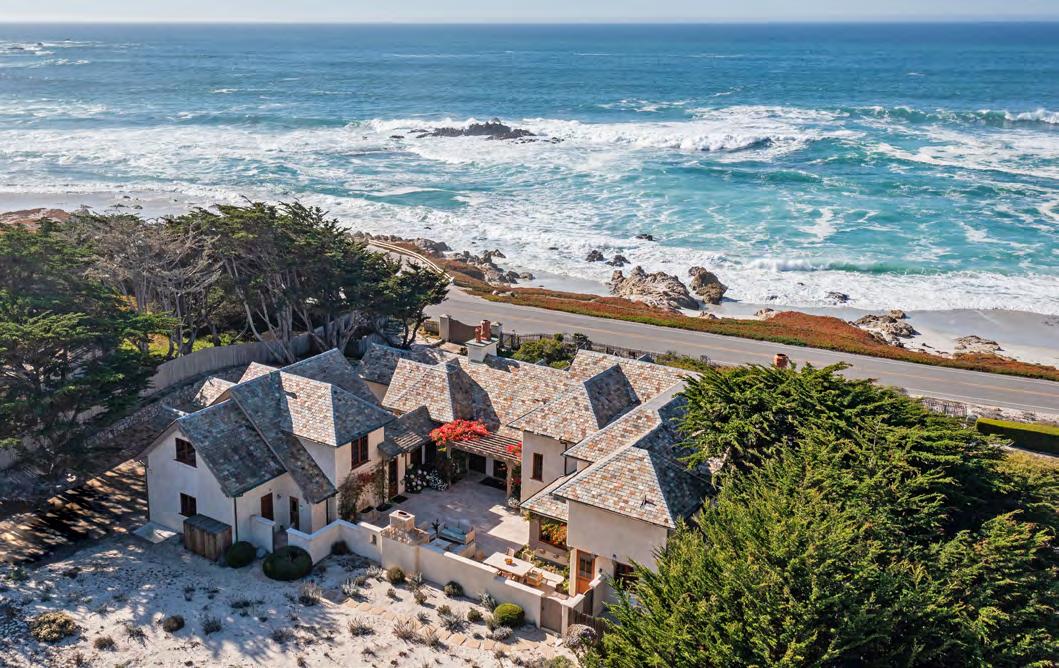
3422 17 Mile Drive,
3908
3225 17 Mile Drive,
36228
1,
2817 17 Mile Drive Drive,
Featured Listings
Scenic
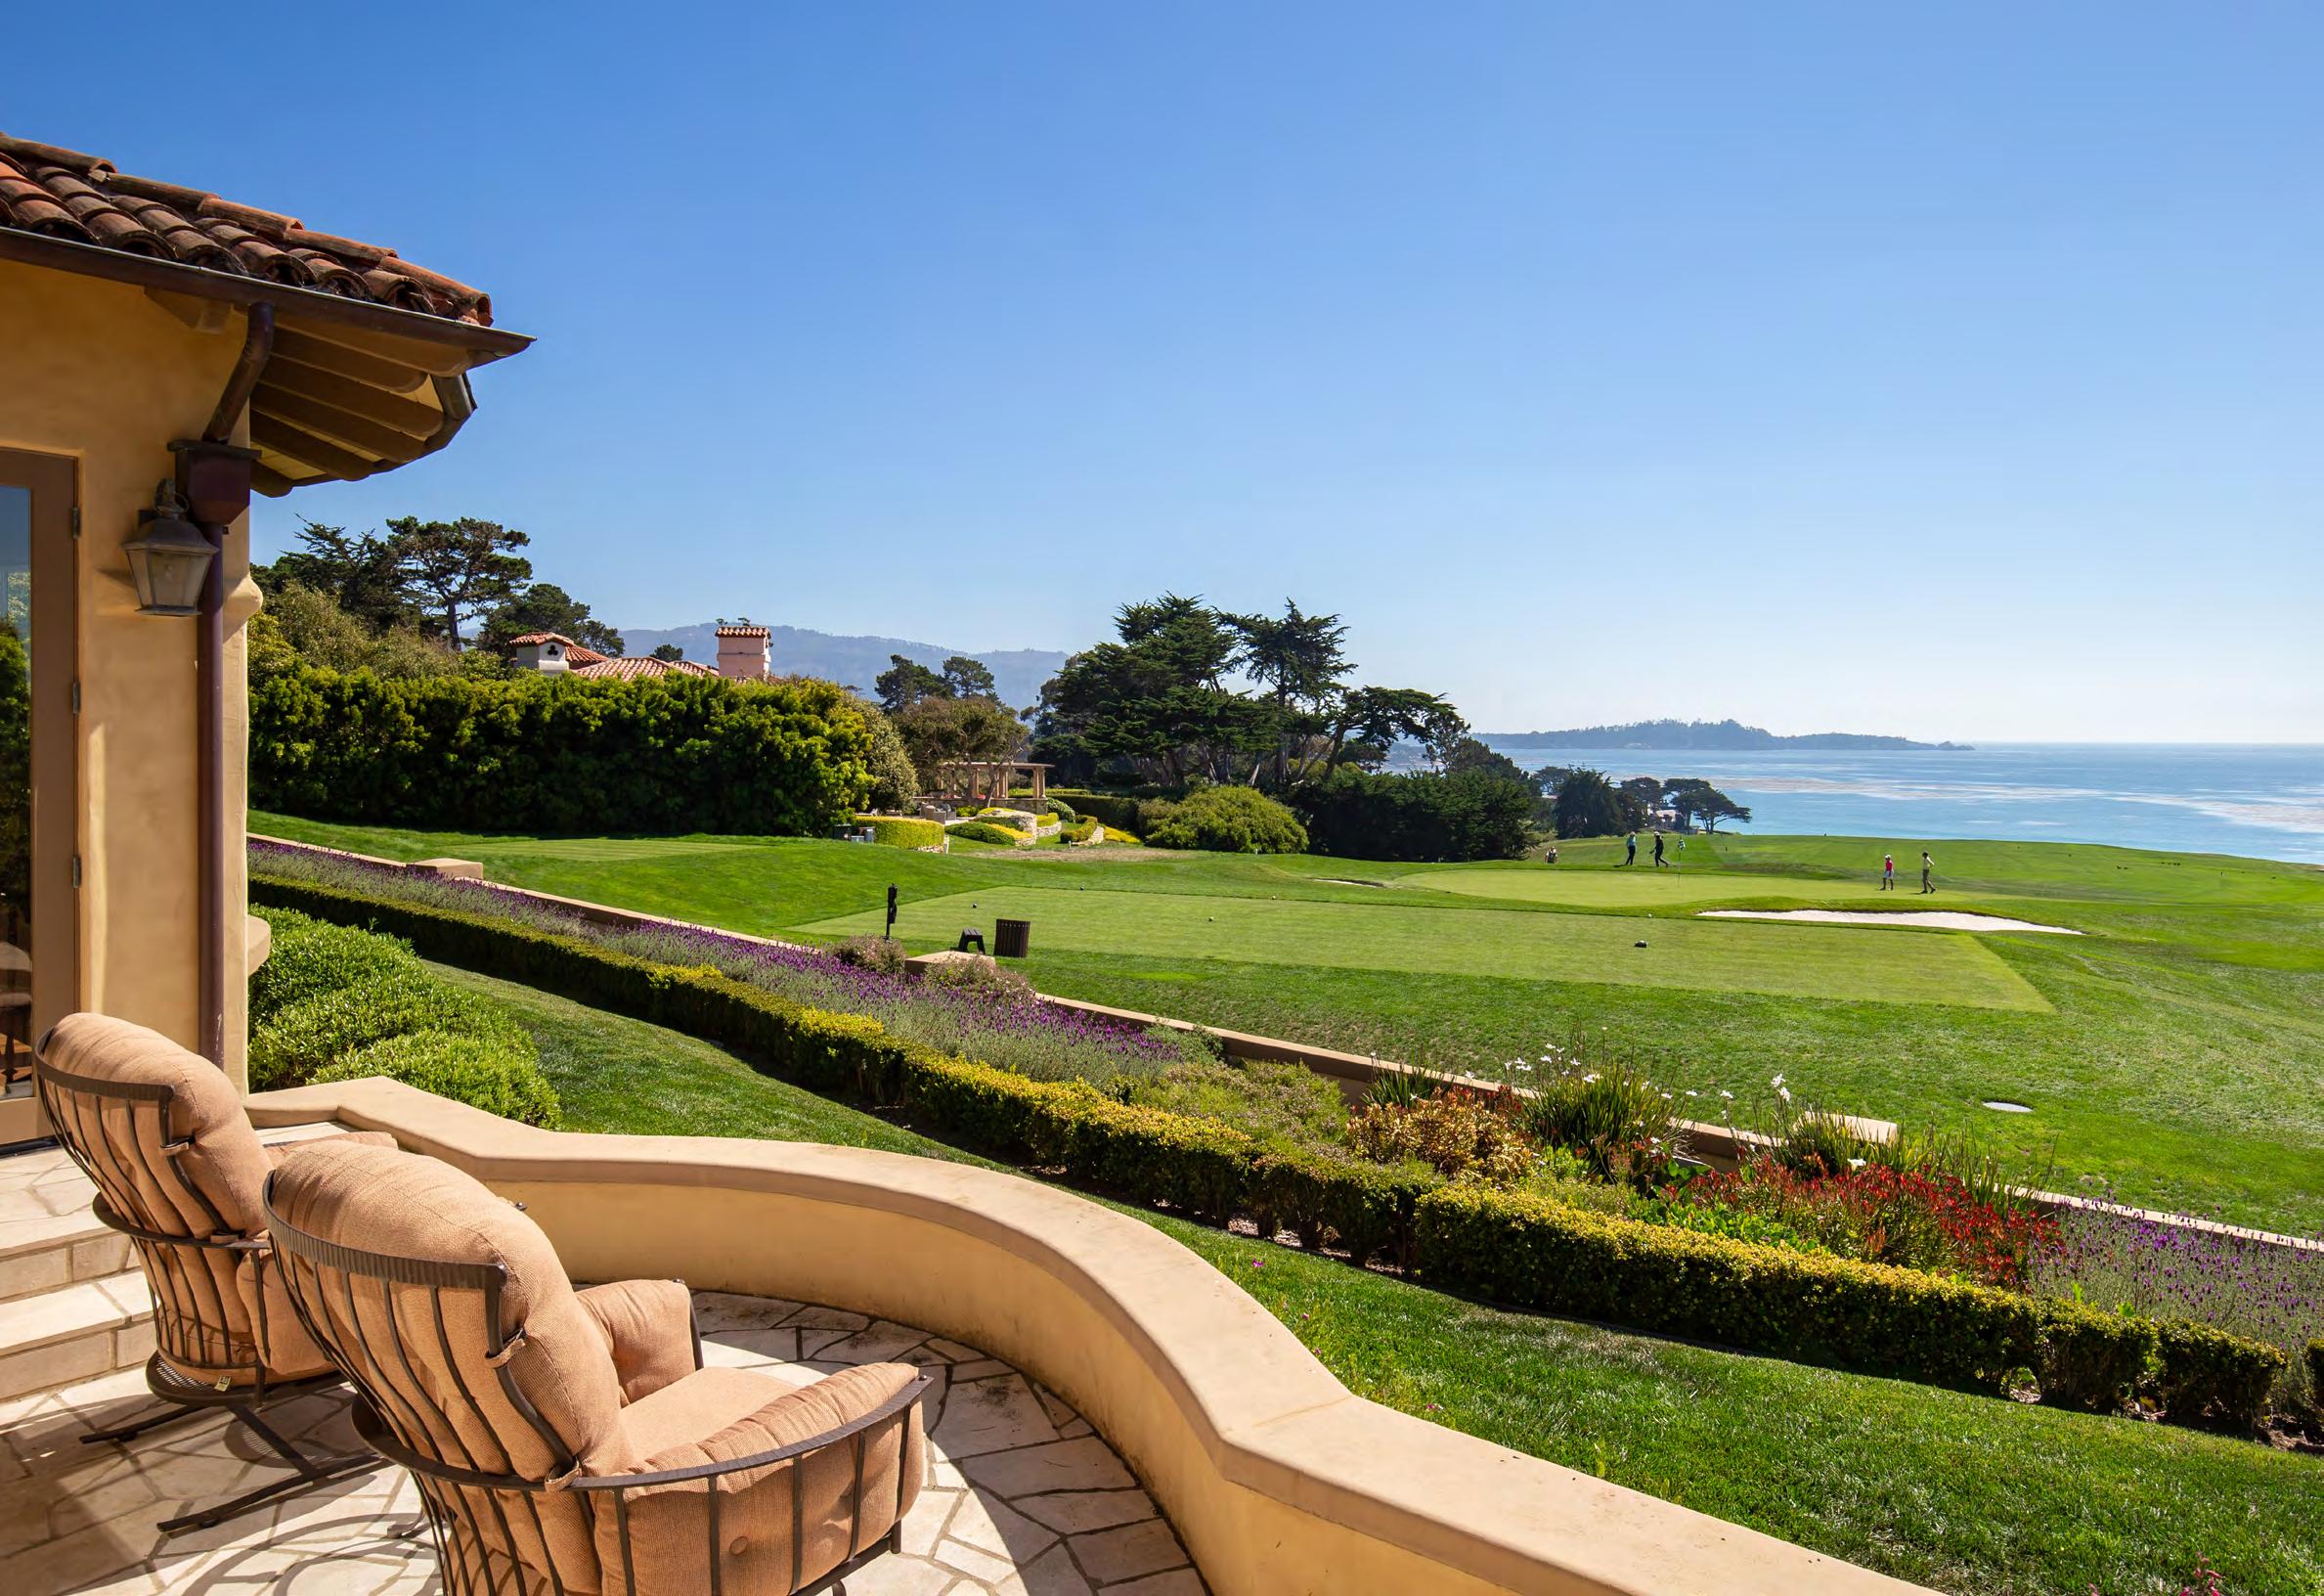
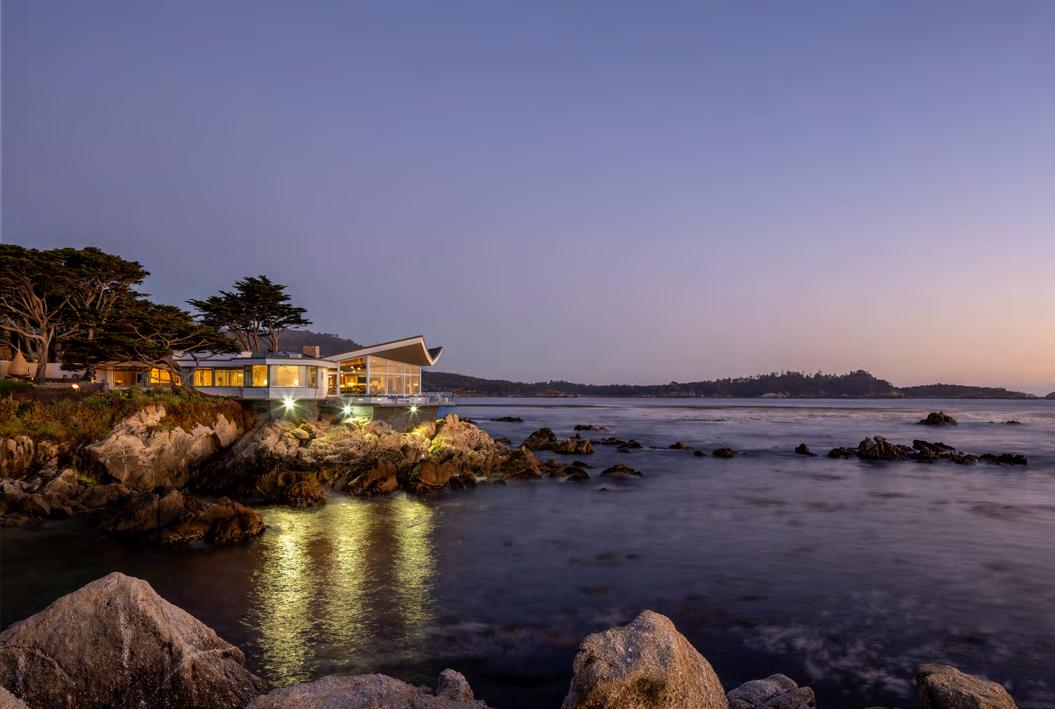
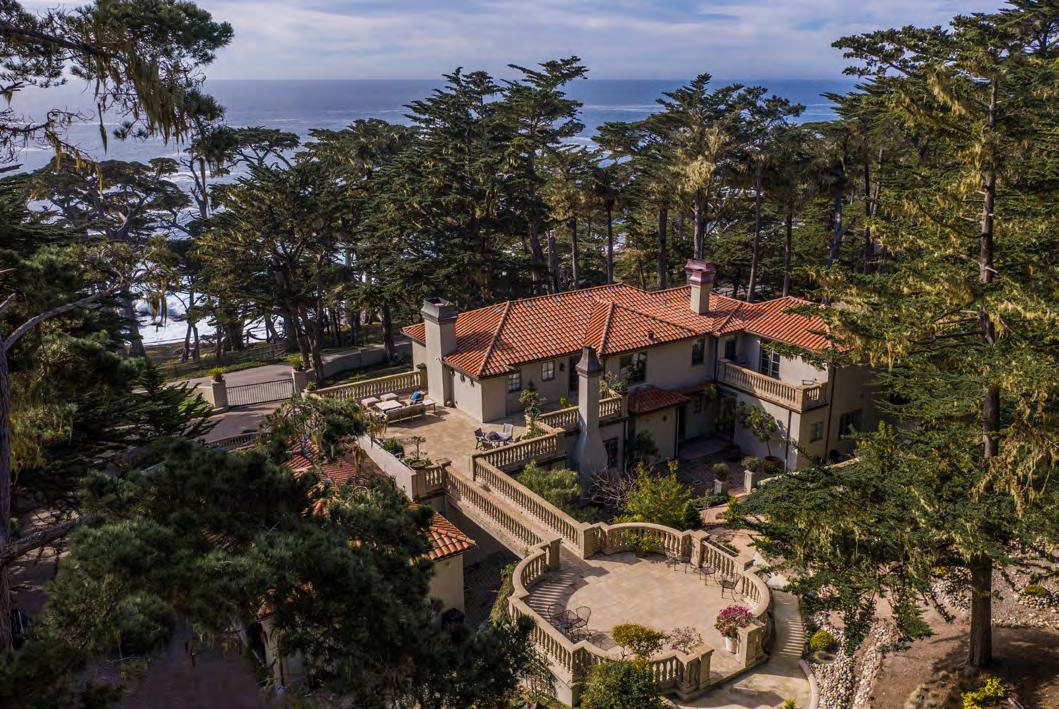
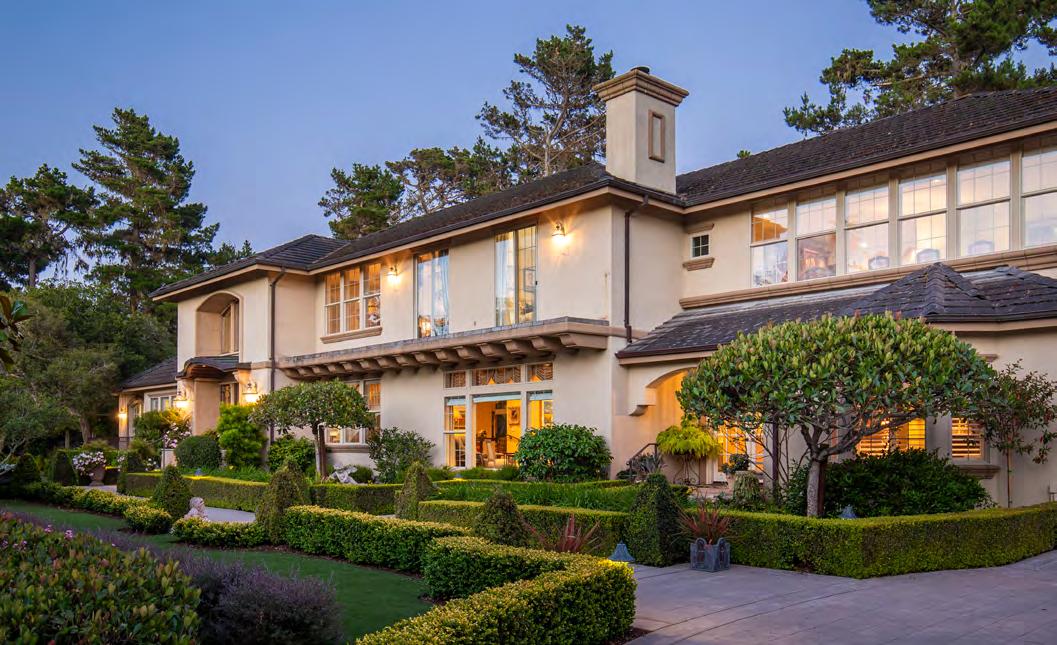
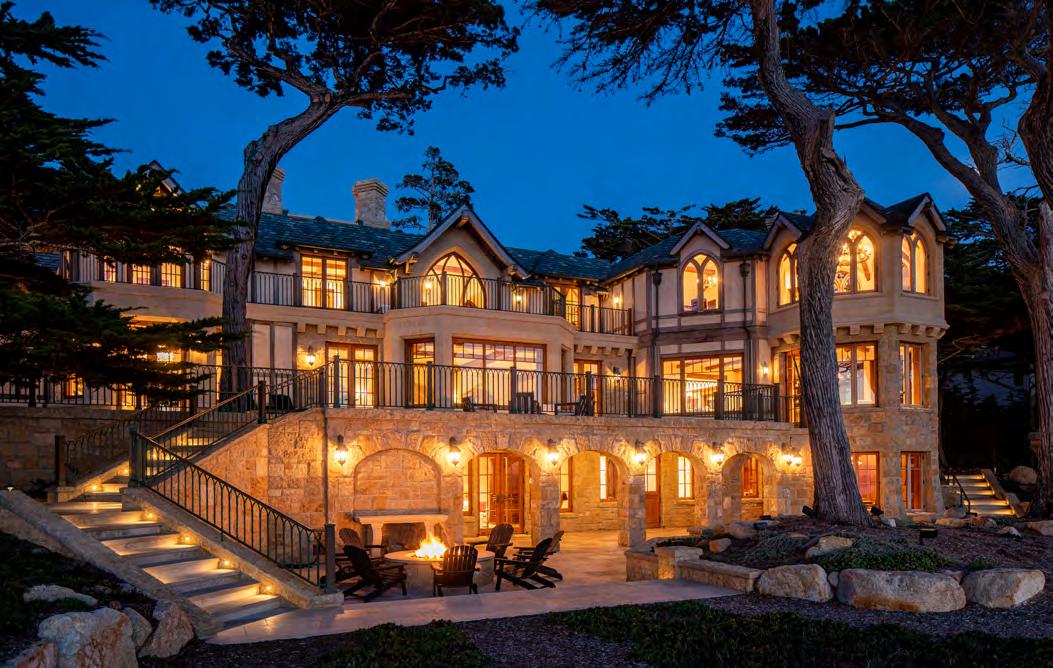
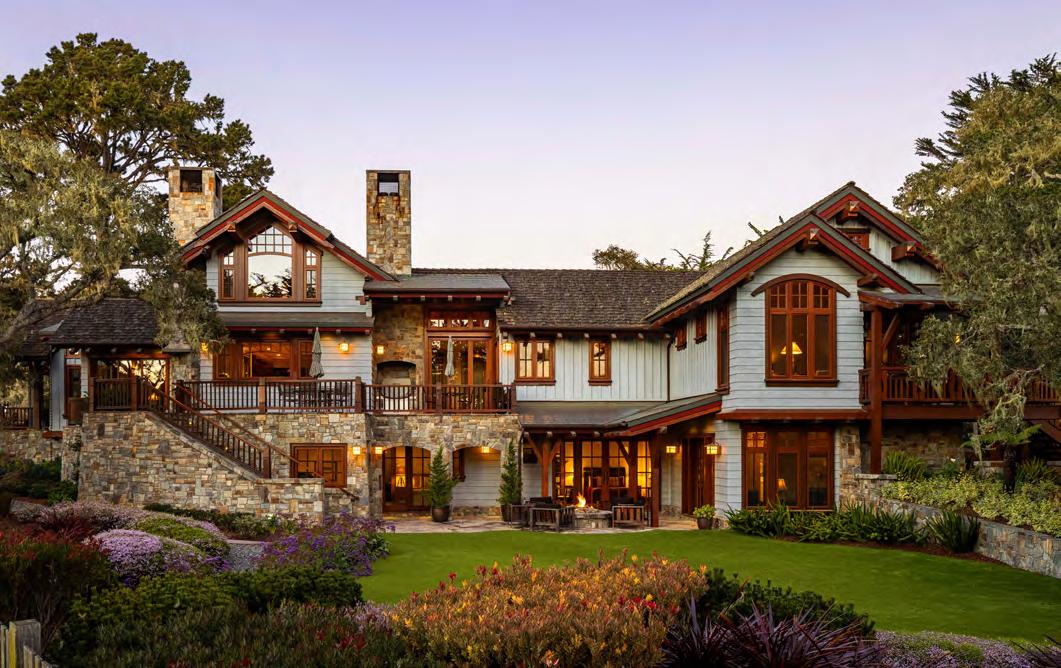
Carmel ■ $40,000,000
Pebble Beach ■ $31,000,000
Ronda Road, Pebble Beach ■ $19,000,000
Pebble Beach ■ $12,950,000
Highway
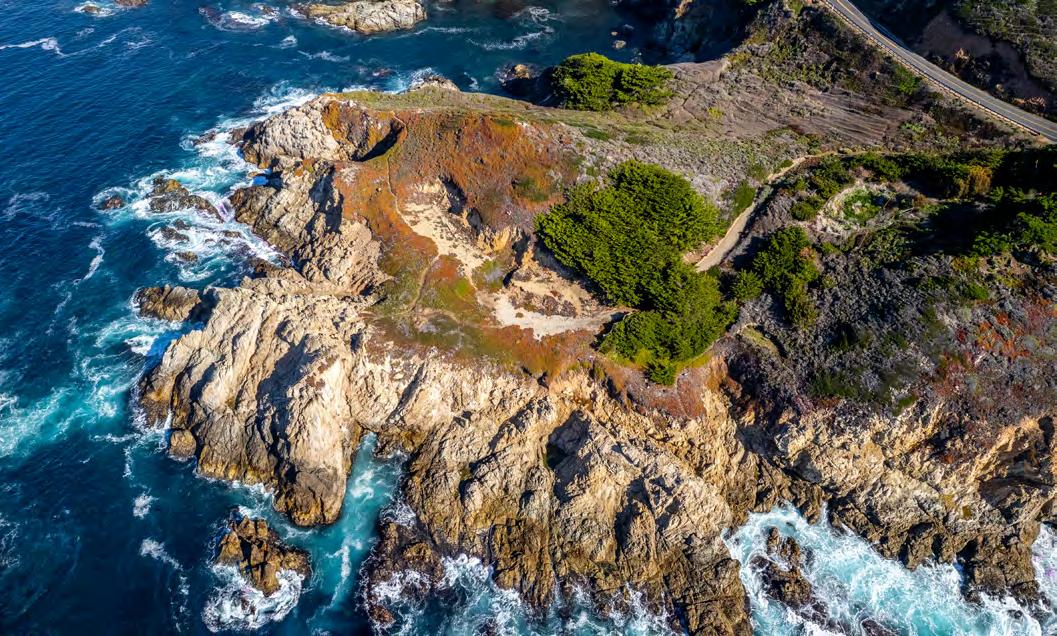
Carmel Highlands ■ $9,000,000
Pebble Beach ■ $7,000,000 Carmel Realty
3 2022 ANNUAL MARKET REPORT Dolores
of Seventh ■ P.O.
C ■ Carmel-by-the-Sea, California 93921 831.622.1000 ■ CarmelRealtyCompany.com
2022
South
Drawer
Our Signi cant Sales of
3184 17 Mile Drive, Pebble Beach ■ SP: $36.28M Represented Seller
3210 Whitman Place, Pebble Beach ■ SP: $18.5M Represented Buyer
162 Spindri Road, Carmel ■ SP: $12.74M Represented Buyer
3105 17 Mile Drive, Pebble Beach ■ $12.887M Represented Buyer & Seller
1605 Sonado Road, Pebble Beach ■ SP: $12M Represented Buyer & Seller
Record-Breaking Sale
2022
3200 Palmero Way, Pebble Beach ■ SP: $12M Represented Buyer
Carmel Realty Significant Sales of
Market Overview
Following two years of extraordinary growth, the real estate market on the Monterey Peninsula has normalized. e number of transactions, total dollar volume and average sale prices all hit record highs beginning in the second half of 2020 and continuing into the rst half of 2022. However, beginning in the summer of 2022, the number of transactions and total sales dollar volume has returned for the most part to pre-COVID levels. e positive news is that while transaction volume is down signi cantly from the previous two-year peak, home values on the Peninsula are holding up nicely. In this regard, once again, our market is greatly outperforming most markets across the country.
Across the markets we track here on the Peninsula, the number of units sold was down 31% in 2022 over 2021, and total sales dollar volume was down 25% in the same period. With the slowdown in sales beginning in summer, the Q4 year-over-year comparison is even more dramatic. e number of sales in Q4 2022 was 235, compared to 478 homes being sold in Q4 2021. Total sales dollar volume in the market in Q4 2022 compared to 2021 was nearly cut in half as well.
While we are clearly being a ected by economic pressure, our market was also down in sales due to historic low inventory levels. With continued healthy demand to live on the Peninsula, home values have remained strong. While it is di cult to measure value in real time, our analytics team has run a variety of analysis that all point to pricing holding up much better than transaction volume. We believe that home prices remain steady in some markets across the Peninsula and are down just a bit in others. Considering the value appreciation we experienced in home prices in 2020 and 2021, any small correction we experience now will be much less, and home values will remain well ahead of where they were prior to the pandemic related spike.
With so many drivers a ecting our market right now, it is essential to work with an experienced and informed agent. Our agents have extensive hands-on local knowledge about every market across the Peninsula. Moreover, they are supported by a dedicated marketing and analytics team that allows for clients to make informed decisions and to maximize value when buying or selling.
e following report breaks out ve of the markets we track with additional performance detail. We hope you will nd this report informative. As always, please be sure to contact us if there is anything we can do to help you, or your friends and family, with real estate plans in our marketplace.
4
5 Dolores South of Seventh ■ P.O. Drawer C Carmel-by-the-Sea, California 93921 831.622.1000 ■ CarmelRealtyCompany.com Dolores South of Seventh ■ P.O. Drawer C ■ Carmel-by-the-Sea, California 93921 831.622.1000 ■ CarmelRealtyCompany.com Carmel-by-the-Sea & Carmel Point ........................................... 6 Greater Carmel ....................................... 8 e areas outside of Carmel-by-the Sea & Carmel Point Carmel Valley ......................................... 10 Including e Santa Lucia Preserve Pebble Beach ........................................... 12 Carmel Highlands, Big Sur & South Coast .......................... 14 Table of Contents
CARMEL-BY-THE-SEA

Market Update
$4,614,105
4 of 2022 in Carmel-by-theSea experienced what many areas saw in terms of number of sales falling. Just 19 homes sold during the quarter, down 32% from Q3 2022 and 60% from Q4 of 2021. Although the number of sales fell, the sales mix involved more higher priced sales than usual. is resulted in a record-high average sales price of $4.6M. Even with this high average price, total sales volume was at its lowest point since Q2 of 2020.
Quarter
7.7% 2022 vs 2021
21.3% Q4 2022 vs Q4 2021
$87.7M
25.4% 2022 vs 2021
52% Q4 2022 vs Q4 2021
DAYS ON MARKET Q4 SALES BY SEGMENT
Q4


41
6.9% 2022 vs 2021
10.8% Q4 2022 vs Q4 2021
Q4 UNITS SOLD
19
30.8% 2022 vs 2021
60.4% Q4 2022 vs Q4 2021
6
Q4 SALES VOLUME
Q4 AVERAGE SELLING PRICE
32% 37% 21% 11% <$1M - 0 $1M-$2M - 2 $2M-$3M - 4 $3M-$5M - 7 $5M+ - 6
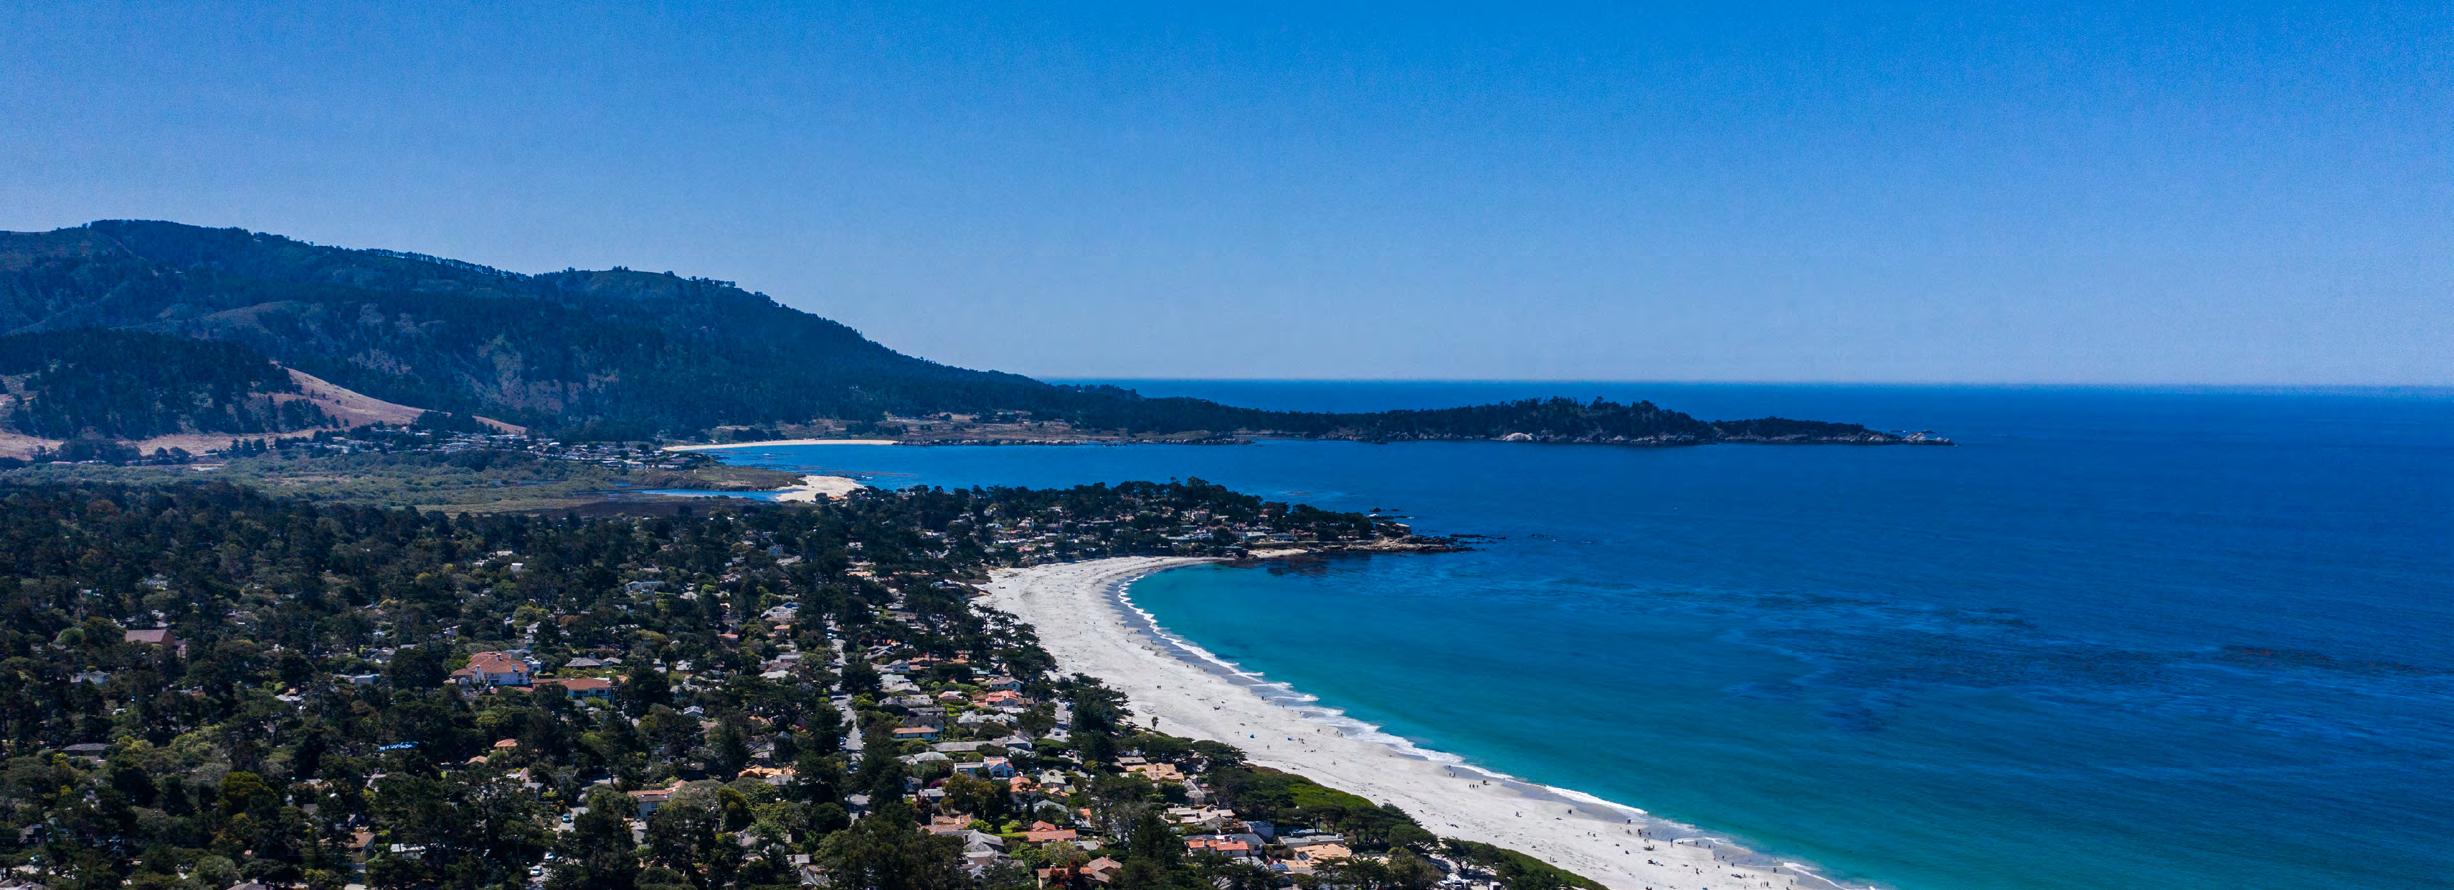
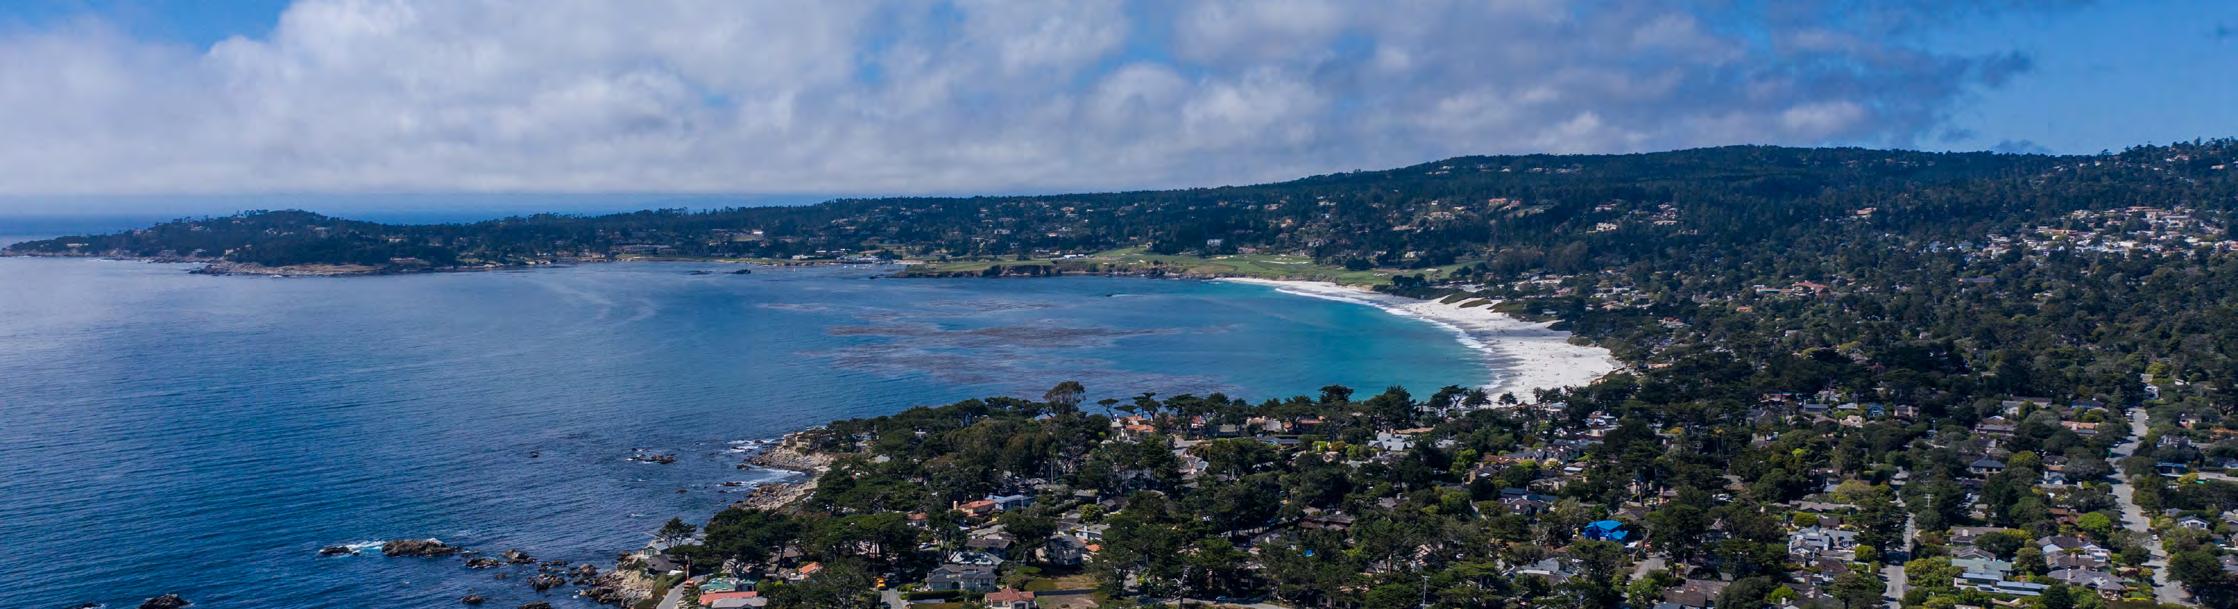
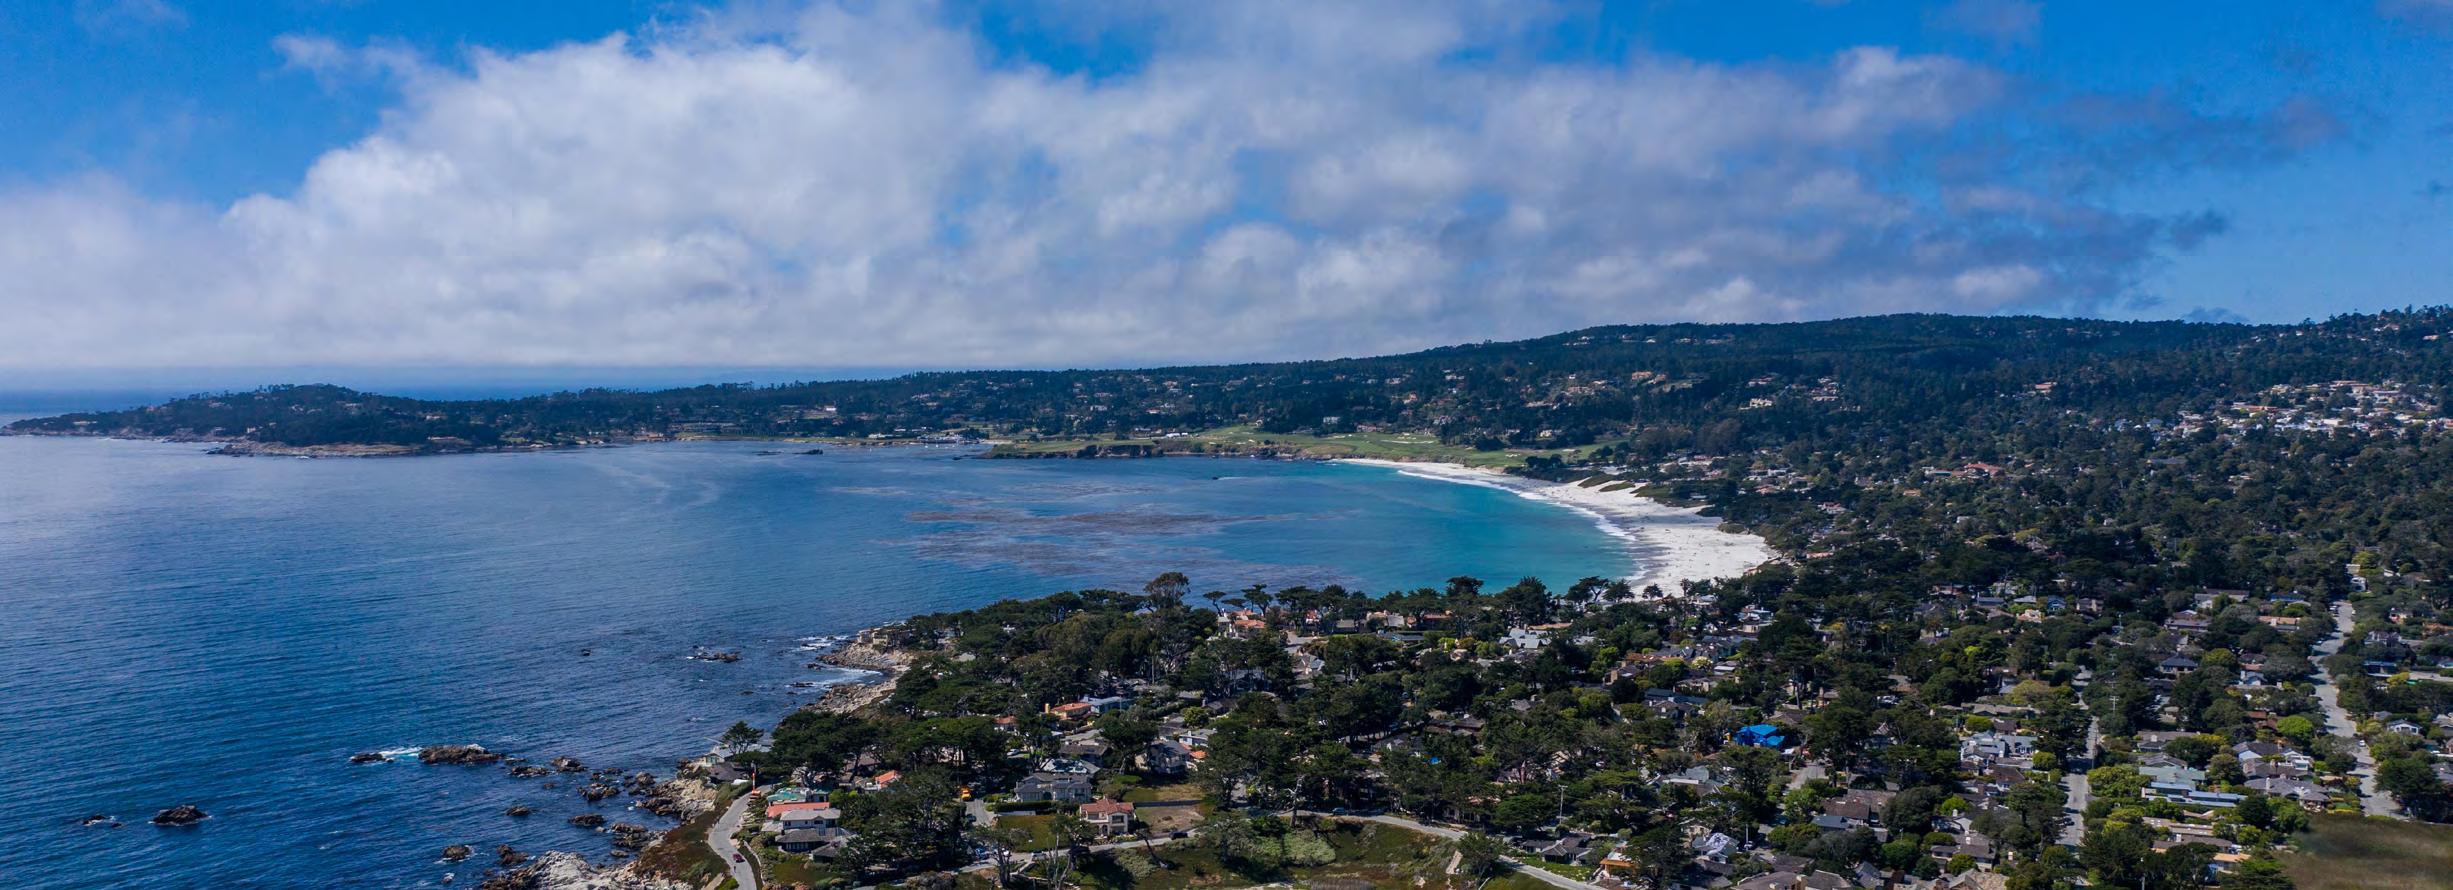
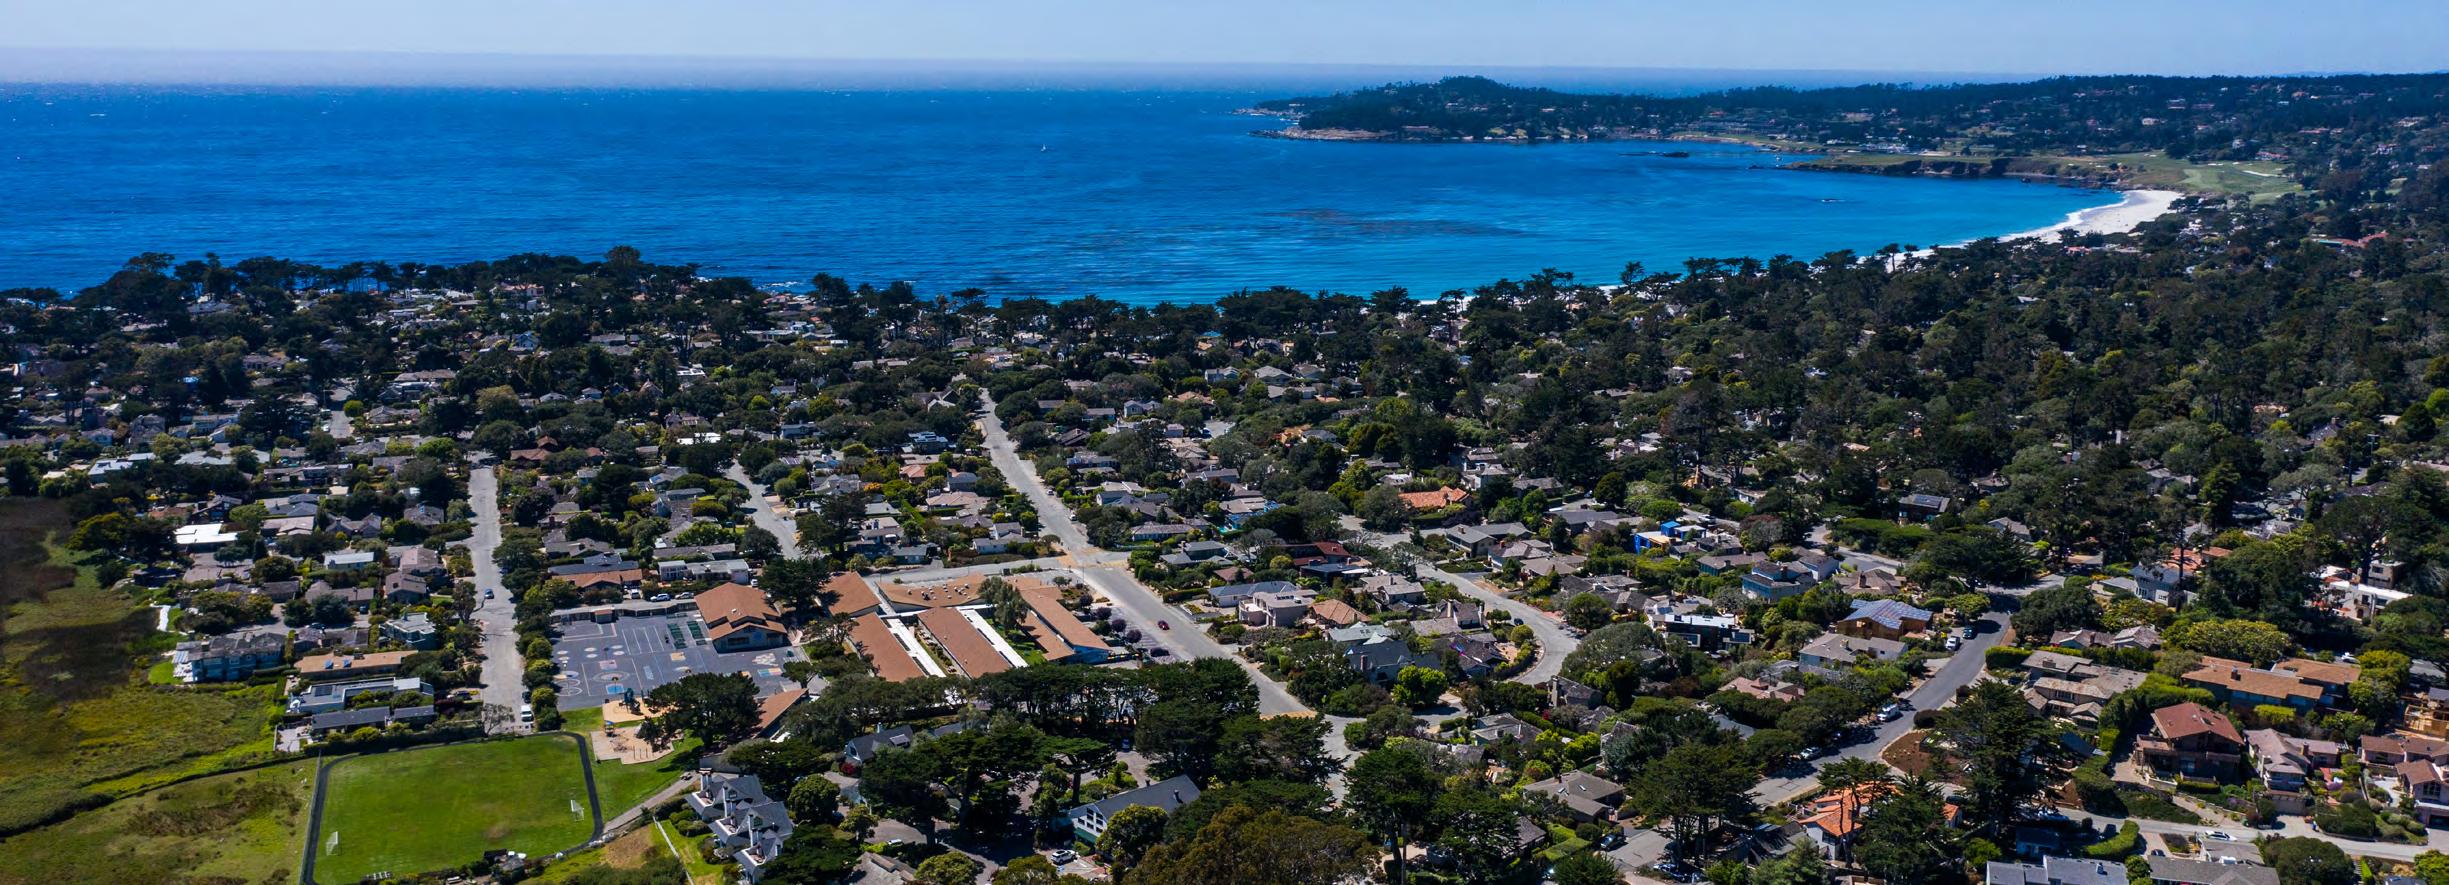
Carmel-by-the-Sea & Carmel Point
7 2022 ANNUAL MARKET REPORT Dolores South of Seventh ■ P.O. Drawer C ■ Carmel-by-the-Sea, California 93921 831.622.1000 ■ CarmelRealtyCompany.com AVERAGE VS MEDIAN SALES PRICE DAYS ON MARKET CLOSED SALES VOLUME BY QUARTER CLOSED SALES BY QUARTER AVERAGE VS MEDIAN SALES PRICE BY QUARTER
Days on Market 0 10 20 30 40 50 Q4 2021 Q1 2022 Q2 2022 Q3 2022 Q4 2022 Average vs Median Sales Price $2M $2.75M $3.5M $4.25M $5M Q4 2021 Q1 2022 Q2 2022 Q3 2022 Q4 2022 Average Median Closed Sales by Quarter 10 20 30 40 50 Q1 Q2 Q3 Q4 2021 2022 Closed Sales Volume by Quarter $70M $100M $130M $160M $190M Q1 Q2 Q3 Q4 2021 2022 Average vs Median Sales Price by Quarter $2M $2.75M $3.5M $4.25M $5M Q1 Q2 Q3 Q4 2021 Average 2021 Median 2022 Average 2022 Median
GREATER CARMEL
Market Update
Greater Carmel had just 10 sales in the quarter and 73 for all of 2022, the lowest of any full year since 2011. 59 average days on market was over double what we have seen in the area over the past three quarters. Total sales volume of $166M during 2022 was down from the last two years, but still up substantially over every year prior to 2020.
$1,760,000
13.5% 2022 vs 2021
1.9% Q4 2022 vs Q4 2021
$17.6M 14.6%
vs 2021
vs
59 40% 2022 vs 2021
20.4% Q4 2022 vs Q4 2021
10


24.7% 2022 vs 2021 54.5% Q4 2022 vs Q4 2021

8
Q4 UNITS SOLD Q4 DAYS ON MARKET Q4 SALES BY SEGMENT Q4 AVERAGE SELLING PRICE 10% 20% 60% 10% <$1M - 1 $1M-$2M - 6 $2M-$3M - 2 $3M-$5M - 1 $5M+ - 0
Q4 SALES VOLUME
55.4% Q4 2022
Q4
2022
2021
9 2022 ANNUAL MARKET REPORT Dolores South of Seventh ■ P.O. Drawer C ■ Carmel-by-the-Sea, California 93921 831.622.1000 ■ CarmelRealtyCompany.com AVERAGE VS MEDIAN SALES PRICE DAYS ON MARKET CLOSED SALES VOLUME BY QUARTER CLOSED SALES BY QUARTER AVERAGE VS MEDIAN SALES PRICE BY QUARTER Greater Carmel Days on Market 0 15 30 45 60 Q4 2021 Q1 2022 Q2 2022 Q3 2022 Q4 2022 Average vs Median Sales Price $800K $1.41M $2.03M $2.64M $3.25M Q4 2021 Q1 2022 Q2 2022 Q3 2022 Q4 2022 Average Median Closed Sales by Quarter 0 10 20 30 Q1 Q2 Q3 Q4 2021 2022 Closed Sales Volume by Quarter 0 $20M $40M $60M $80M Q1 Q2 Q3 Q4 2021 2022 Average vs Median Sales Price by Quarter $1.25M $1.75M $2.25M $2.75M $3.25M Q1 Q2 Q3 Q4 2021 Average 2021 Median 2022 Average 2022 Median e areas outside of Carmel-by-the Sea & Carmel Point
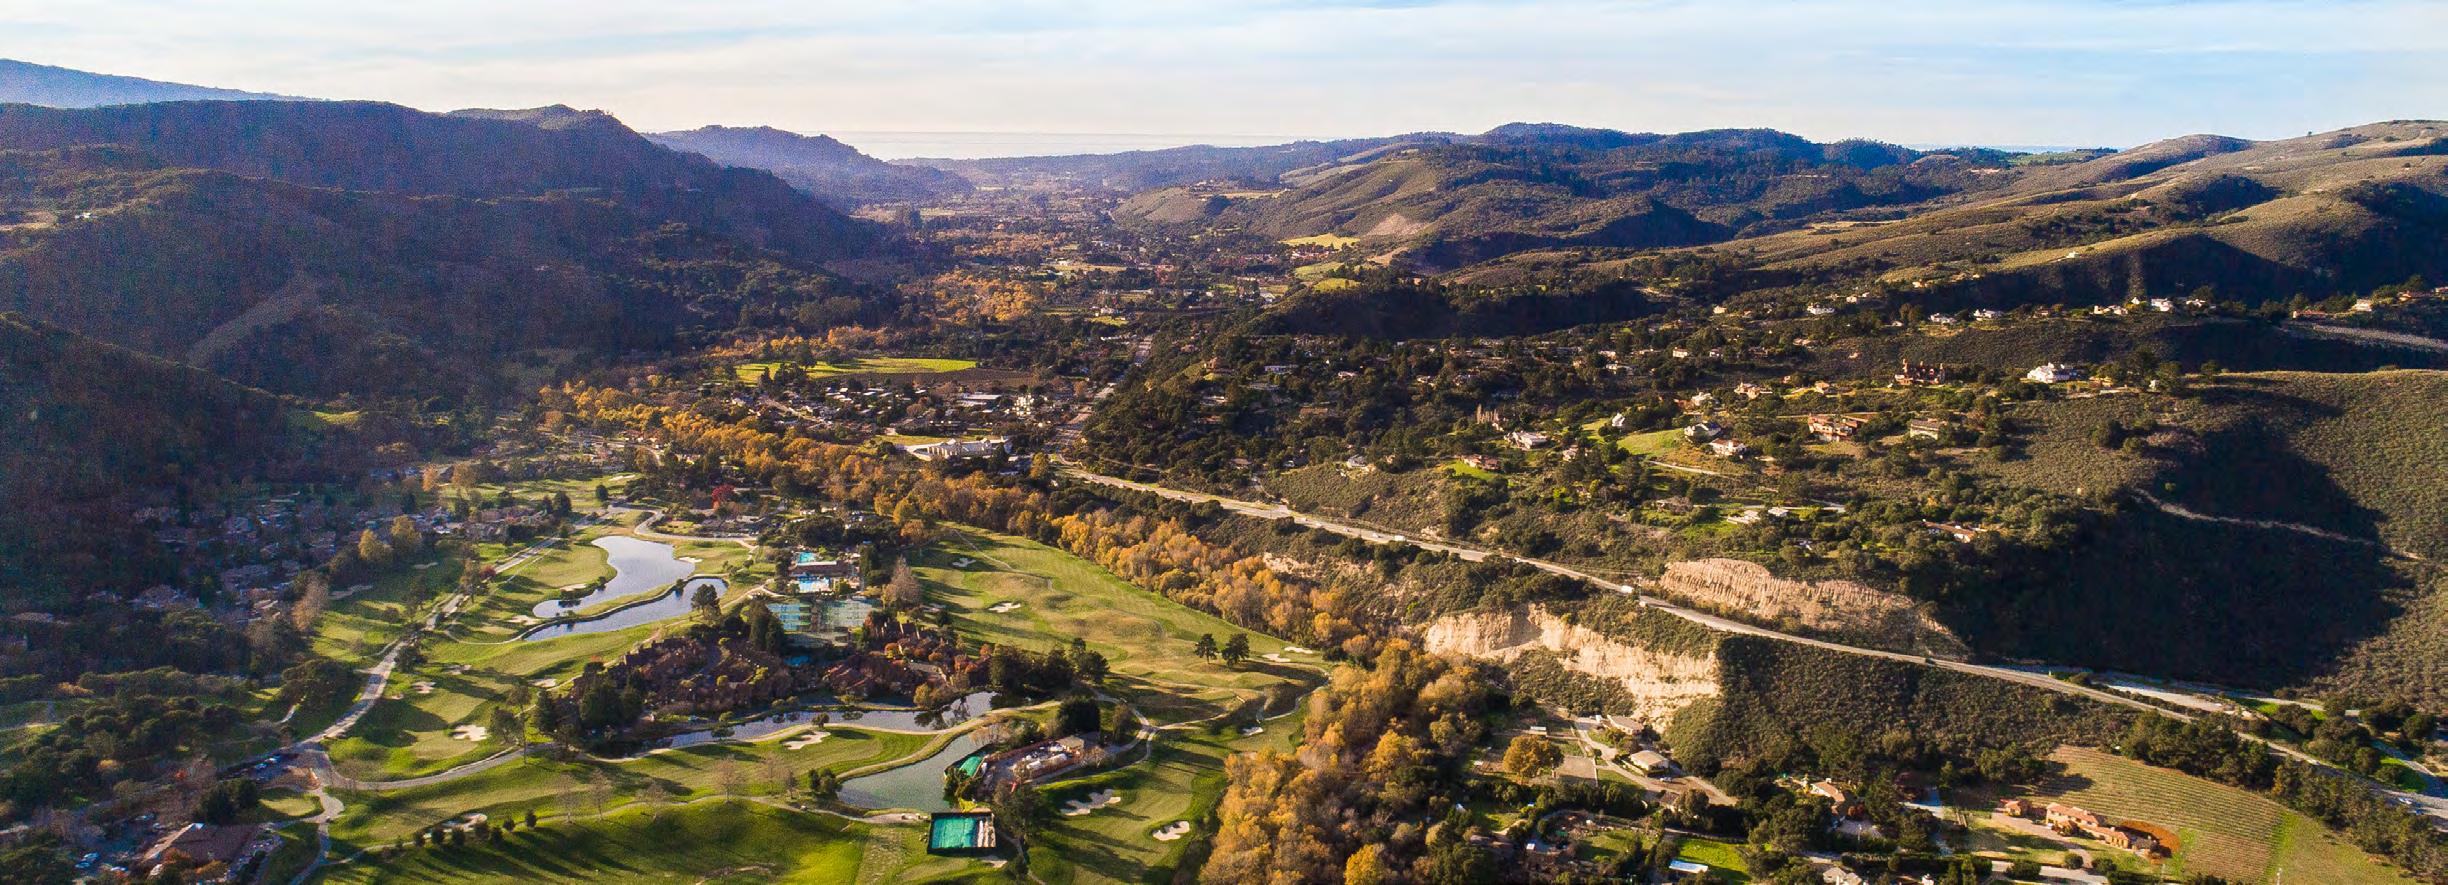
CARMEL VALLEY
Market Update
Carmel Valley experienced a di cult fourth quarter with only 34 sales, lower than every quarter since Q1 of 2019. For the year, units sold was down 36.5% and total sales volume down 34.4% versus 2021. While we saw average sale price come down a bit near the end of the year, Carmel Valley still set a yearly record in the category, topping $1.9M for the rst time.
$1,867,699 3.2%


Q4 SALES VOLUME
10
AVERAGE
Q4 UNITS SOLD Q4 DAYS ON MARKET Q4 SALES BY SEGMENT 9% 9% 6% 47% 29% <$1M | 10 $1M-$2M | 16 $2M-$3M | 2 $3M-$5M | 3 $5M+ | 3
Q4
SELLING PRICE
2022
2021
Q4 2022
Q4 2021
2022
Q4 2022
Q4
2022
55.8% Q4 2022
Q4
34.4% 2022
2021 53.9% Q4 2022 vs Q4 2021
vs
4.4%
vs
41 20.5%
vs 2021 5.1%
vs
2021 34 36.5%
vs 2021
vs
2021 $63.5M
vs
11 2022 ANNUAL MARKET REPORT Dolores South of Seventh ■ P.O. Drawer C ■ Carmel-by-the-Sea, California 93921 831.622.1000 ■ CarmelRealtyCompany.com AVERAGE VS MEDIAN SALES PRICE DAYS ON MARKET CLOSED SALES VOLUME BY QUARTER CLOSED SALES BY QUARTER AVERAGE VS MEDIAN SALES PRICE BY QUARTER Carmel Valley Including e Santa Lucia Preserve Days on Market 25 30 35 40 45 Q4 2021 Q1 2022 Q2 2022 Q3 2022 Q4 2022 Average vs Median Sales Price $1M $1.25M $1.5M $1.75M $2M $2.25M Q4 2021 Q1 2022 Q2 2022 Q3 2022 Q4 2022 Average Median Closed Sales by Quarter 30 45 60 75 90 Q1 Q2 Q3 Q4 2021 2022 Closed Sales Volume by Quarter $50M $80M $110M $140M $170M Q1 Q2 Q3 Q4 2021 2022 Average vs Median Sales Price by Quarter $1.25M $1.5M $1.75M $2M $2.25M Q1 Q2 Q3 Q4 2021 Average 2021 Median 2022 Average 2022 Median
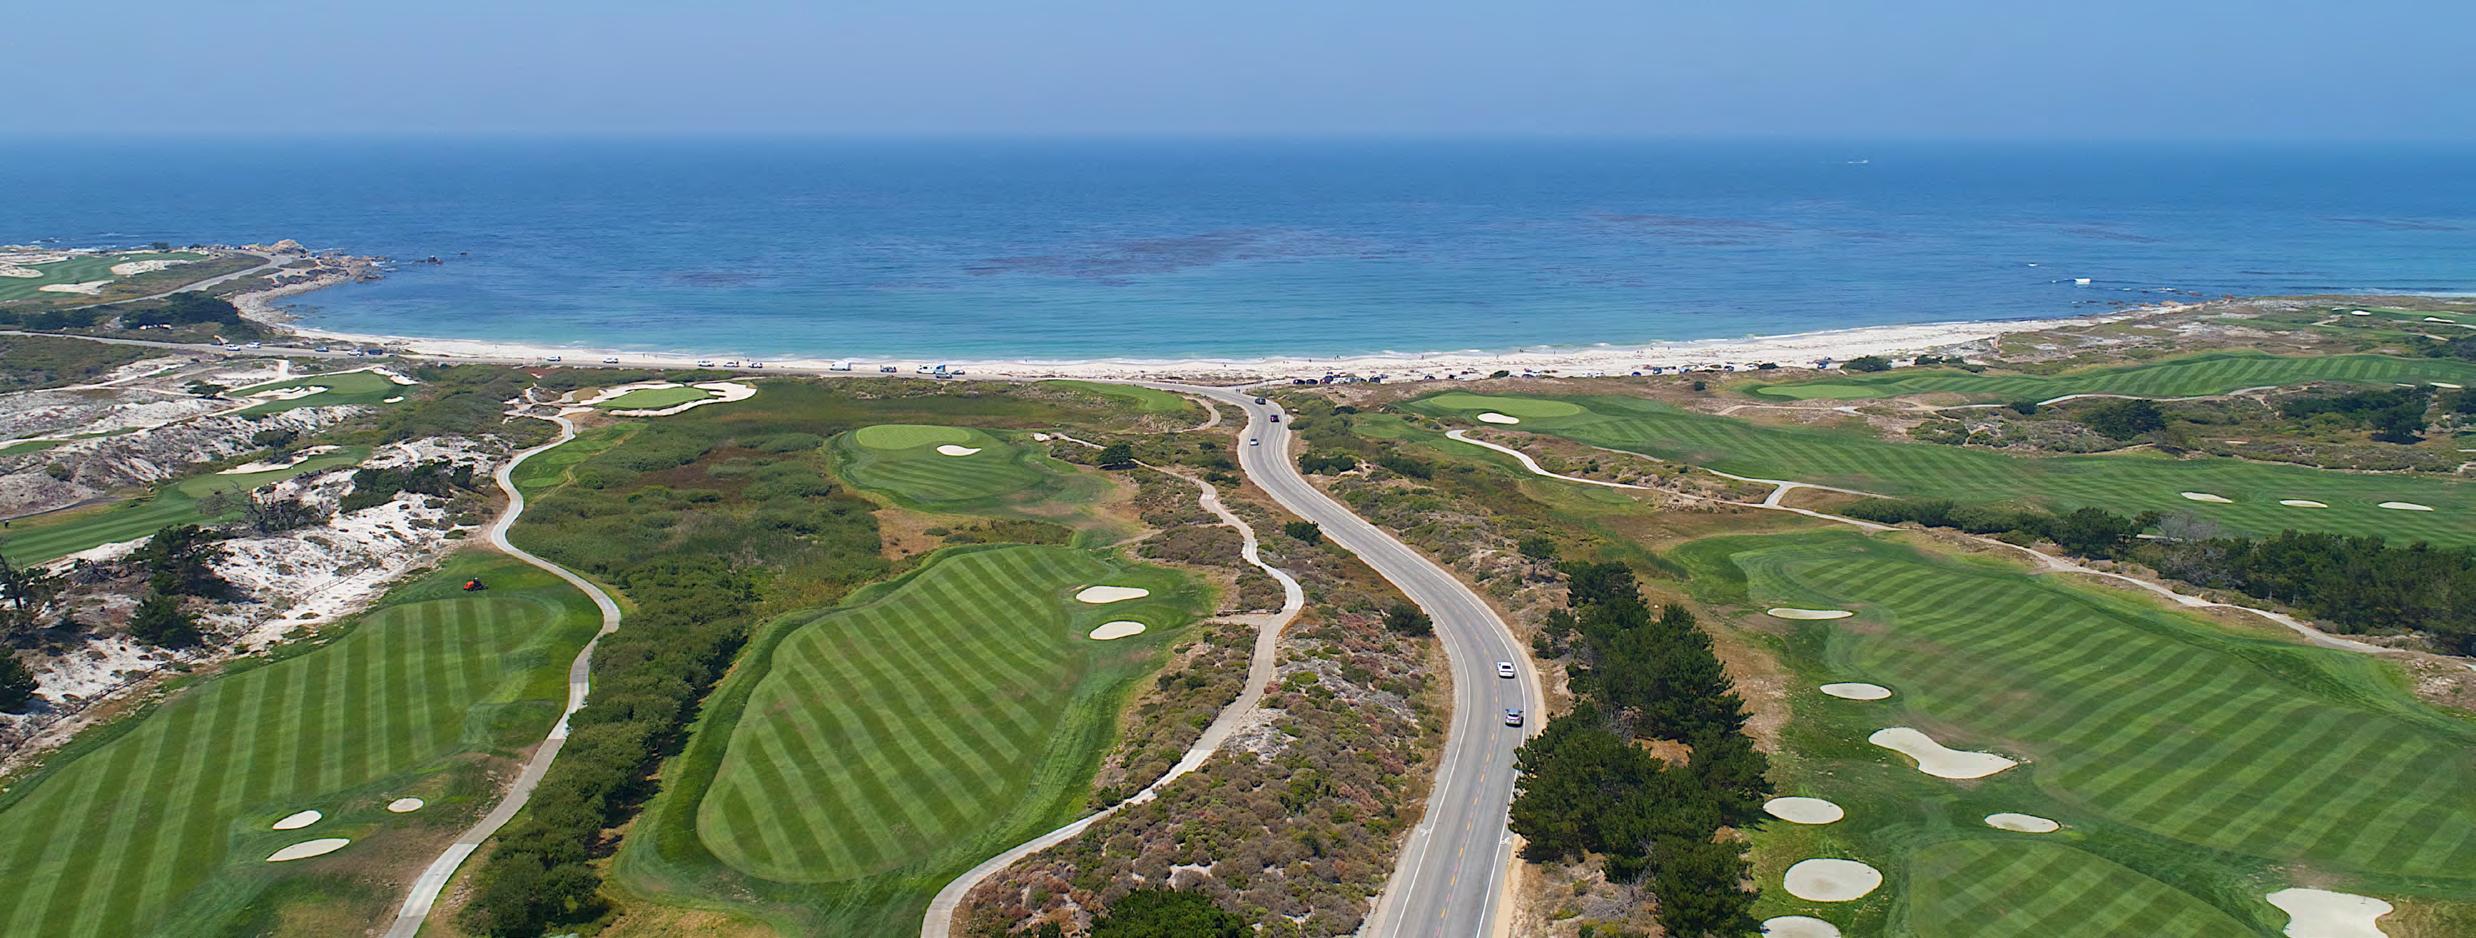
Market Update

The sales mix in Pebble Beach turned up several higher price sales in Q4 of 2022 versus the previous quarter, resulting in average sales price increasing 29.3% quarter over quarter. Seven out of 22 homes sold in the quarter topped the $5M mark. For the year, Pebble Beach saw only 94 homes sold. is was the rst time under 100 sales for the year since 2011. Average sale price for the year was $5.6M, up over 31% from 2021. Total sales volume for the year was $532M, down 20% from last year, and yet the second highest on record.
12
Q4 UNITS SOLD Q4 DAYS ON MARKET Q4 SALES BY SEGMENT Q4 AVERAGE SELLING PRICE 32% 14% 36% 18% <$1M | 0 $1M-$2M | 4 $2M-$3M | 8 $3M-$5M | 3 $5M+ | 7
Q4 SALES VOLUME
31.1% 2022 vs 2021 28.5% Q4 2022 vs Q4 2021 60 2.3% 2022 vs 2021 30.4% Q4 2022 vs Q4 2021
39% 2022 vs 2021 43.6% Q4 2022 vs Q4 2021
20% 2022 vs 2021 27.5% Q4 2022 vs Q4 2021
PEBBLE BEACH
$5,069,378
22
$111.5M
13 2022 ANNUAL MARKET REPORT Dolores South of Seventh ■ P.O. Drawer C ■ Carmel-by-the-Sea, California 93921 831.622.1000 ■ CarmelRealtyCompany.com AVERAGE VS MEDIAN SALES PRICE DAYS ON MARKET CLOSED SALES VOLUME BY QUARTER CLOSED SALES BY QUARTER AVERAGE VS MEDIAN SALES PRICE BY QUARTER
Days on Market 20 30 40 50 60 70 Q4 2021 Q1 2022 Q2 2022 Q3 2022 Q4 2022 Average vs Median Sales Price $2M $3.75M $5.5M $7.25M $9M Q4 2021 Q1 2022 Q2 2022 Q3 2022 Q4 2022 Average Median Closed Sales by Quarter 10 20 30 40 50 Q1 Q2 Q3 Q4 2021 2022 Closed Sales Volume by Quarter $75M $125M $175M $225M Q1 Q2 Q3 Q4 2021 2022 Average vs Median Sales Price by Quarter $2M $3.75M $5.5M $7.25M $9M Q1 Q2 Q3 Q4 2021 Average 2021 Median 2022 Average 2022 Median
Pebble Beach
CARMEL HIGHLANDS

Market Update

Withonly four sales and $14M in total sales volume during Q4, this area had its worst statistical quarter since the pandemic. For the year, average sale price was up over 25% versus 2021, the second highest increase of any are we track, behind only Pebble Beach. To begin 2023, 16 homes remain on the market, showing signs that this coming quarter and year has potential for an increase in sales.
14
Q4 UNITS SOLD Q4 DAYS ON MARKET Q4 SALES BY SEGMENT Q4 AVERAGE SELLING PRICE 25% 50% 25% <$1M - 1 1M-2M - 0 2M-3M - 0 3M-5M - 2 5M+ - 1
Q4 SALES VOLUME
$3,587,500 25.4% 2022 vs 2021 12.2% Q4 2022 vs Q4 2021 189 31% 2022 vs 2021 152% Q4 2022 vs Q4 2021 4 37% 2022 vs 2021 71.4% Q4 2022 vs Q4 2021 $14.4M 21% 2022 vs 2021 74.9% Q4 2022 vs Q4 2021
Carmel Highlands, Big Sur & South Coast
15 2022 ANNUAL MARKET REPORT Dolores South of Seventh ■ P.O. Drawer C ■ Carmel-by-the-Sea, California 93921 831.622.1000 ■ CarmelRealtyCompany.com AVERAGE VS MEDIAN SALES PRICE DAYS ON MARKET CLOSED SALES VOLUME BY QUARTER CLOSED SALES BY QUARTER AVERAGE VS MEDIAN SALES PRICE BY QUARTER
Days on Market 0 50 100 150 200 Q4 2021 Q1 2022 Q2 2022 Q3 2022 Q4 2022 Average vs Median Sales Price $1.5M $3M $4.5M $6M Q4 2021 Q1 2022 Q2 2022 Q3 2022 Q4 2022 Average Median Closed Sales by Quarter 0 4 8 12 16 20 Q1 Q2 Q3 Q4 2021 2022 Closed Sales Volume by Quarter 0 $15M $30M $45M $60M $75M Q1 Q2 Q3 Q4 2021 2022 Average vs Median Sales Price by Quarter $1.5M $3M $4.5M $6M Q1 Q2 Q3 Q4 2021 Average 2021 Median 2022 Average 2022 Median


A Cornerstone in Luxury Real Estate for Over One Hundred Years Dolores South of Seventh ■ P.O. Drawer C ■ Carmel-by-the-Sea, California 93921 | 831.622.1000 ■ CarmelRealtyCompany.com Mark Ryan 831.238.1498 MarkRyan@CarmelRealtyCompany.com REALTOR® | DRE#01458945 Paul Brocchini 831.601.1620 PaulB@CarmelRealtyCompany.com Broker Associate | DRE#00904451
