Sustainability Report 2024


We acknowledge the Traditional Custodians of this land and their continuing connection to land, sea and community.
We pay our deepest respects to the elders and ancestors of the Wurundjeri people of the Kulin Nation, whose Country is home to our Kew, Donvale and Bulleen campuses; the Tatungalung Clan of the Gunaikurnai people, where Camp Toonallook lies; and the Djiru people, Traditional Custodians of the Mission Beach area where Carey Zero lies.
We recognise the injustices endured by the First Nations peoples of this country.
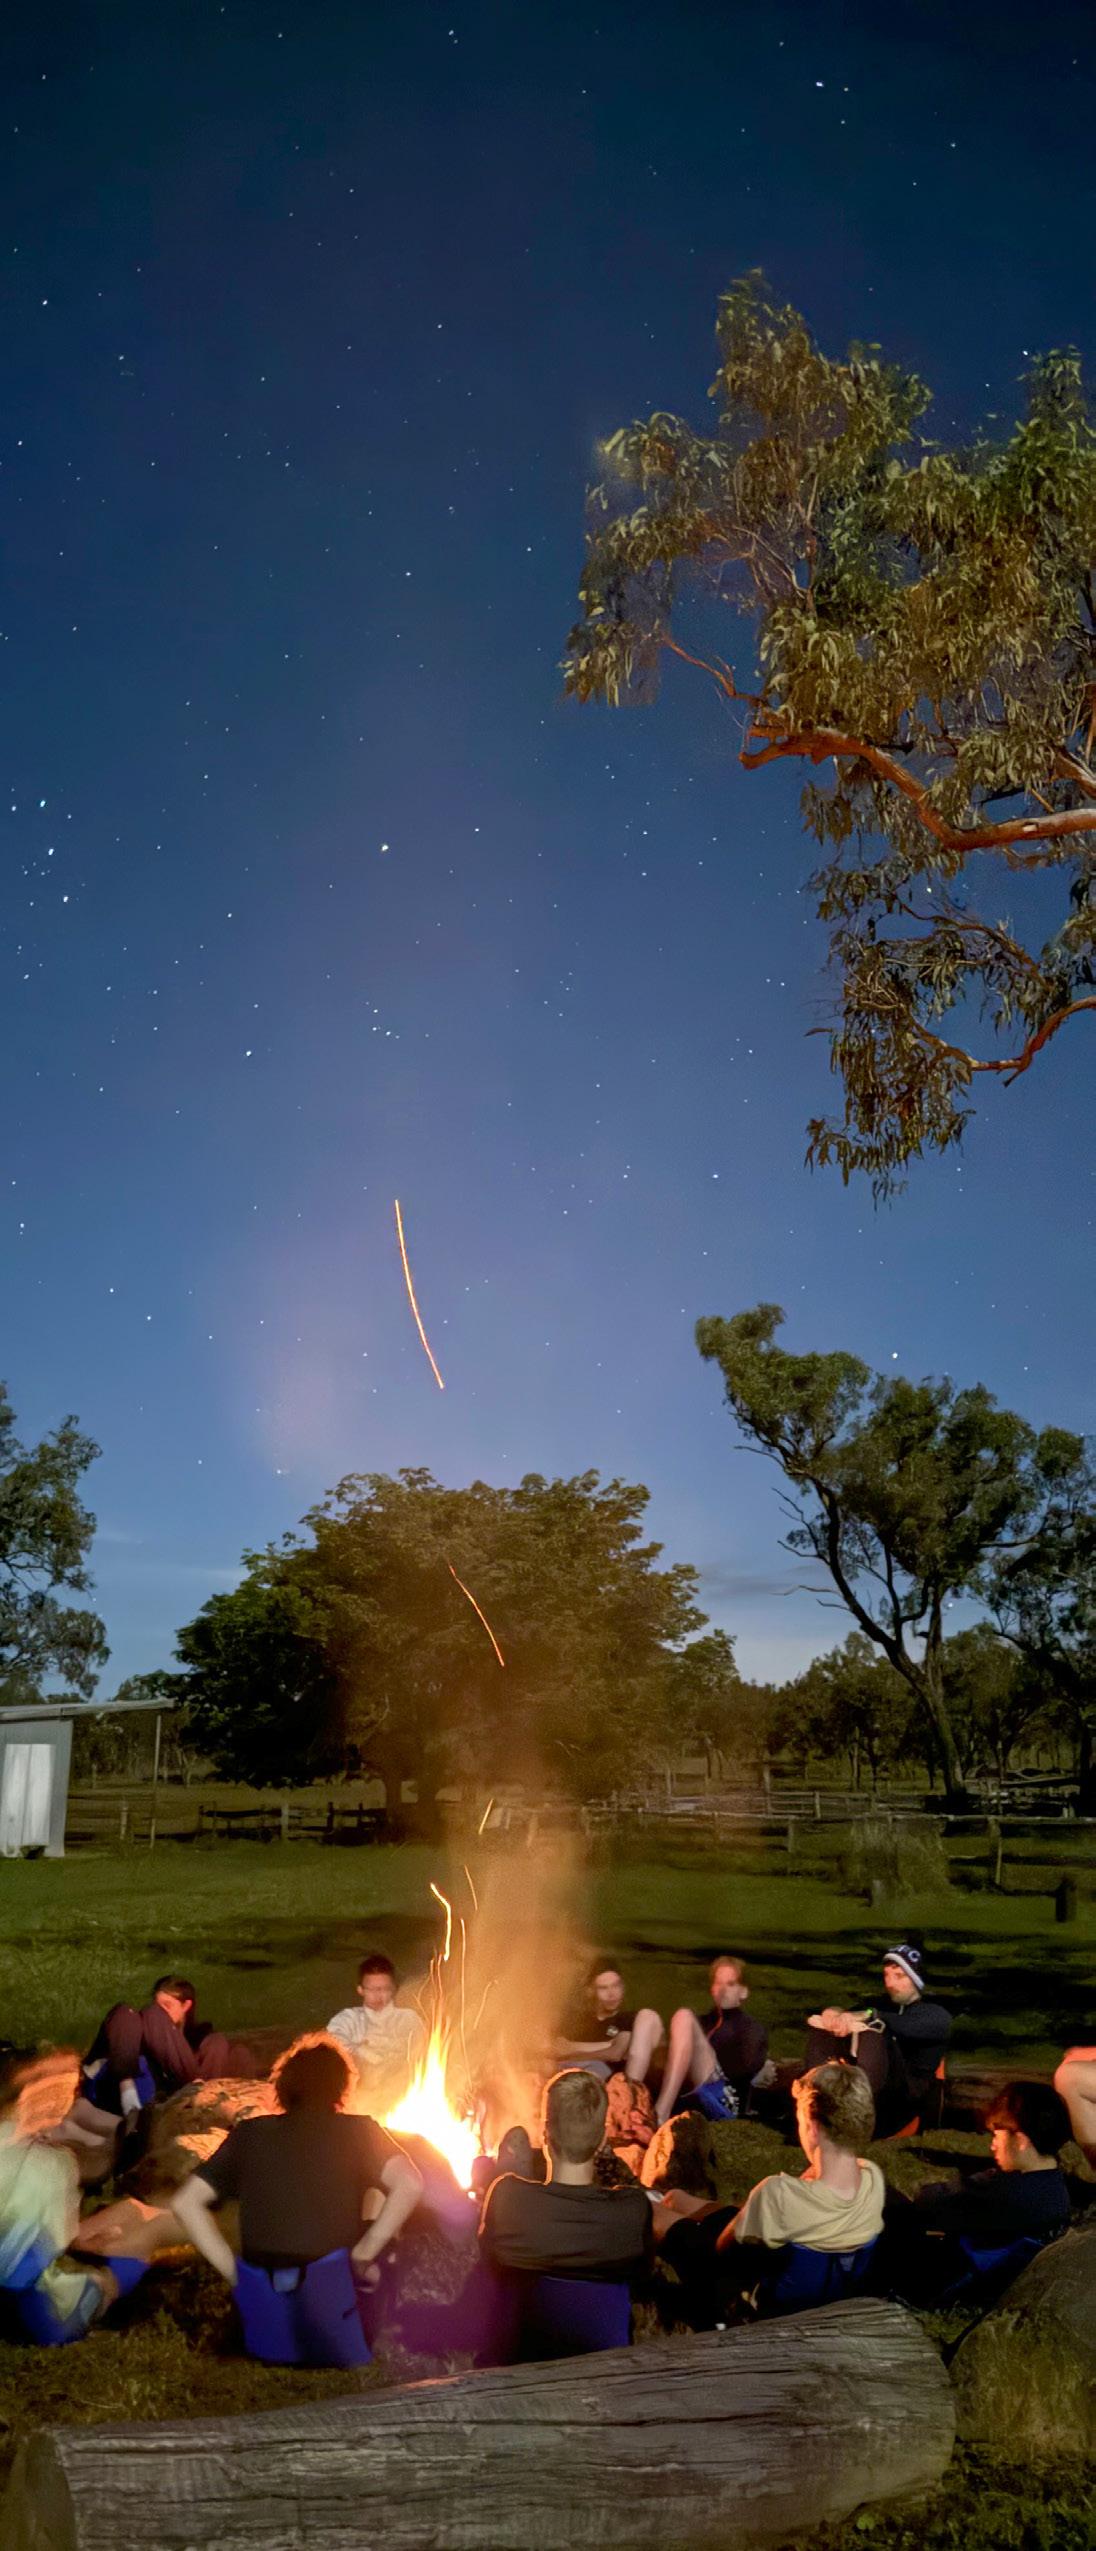
At Carey, sustainability is a shared commitment that shapes our values, learning and everyday actions. In 2024, we made significant progress through impactful initiatives across energy, waste, water, transport, procurement and green spaces.
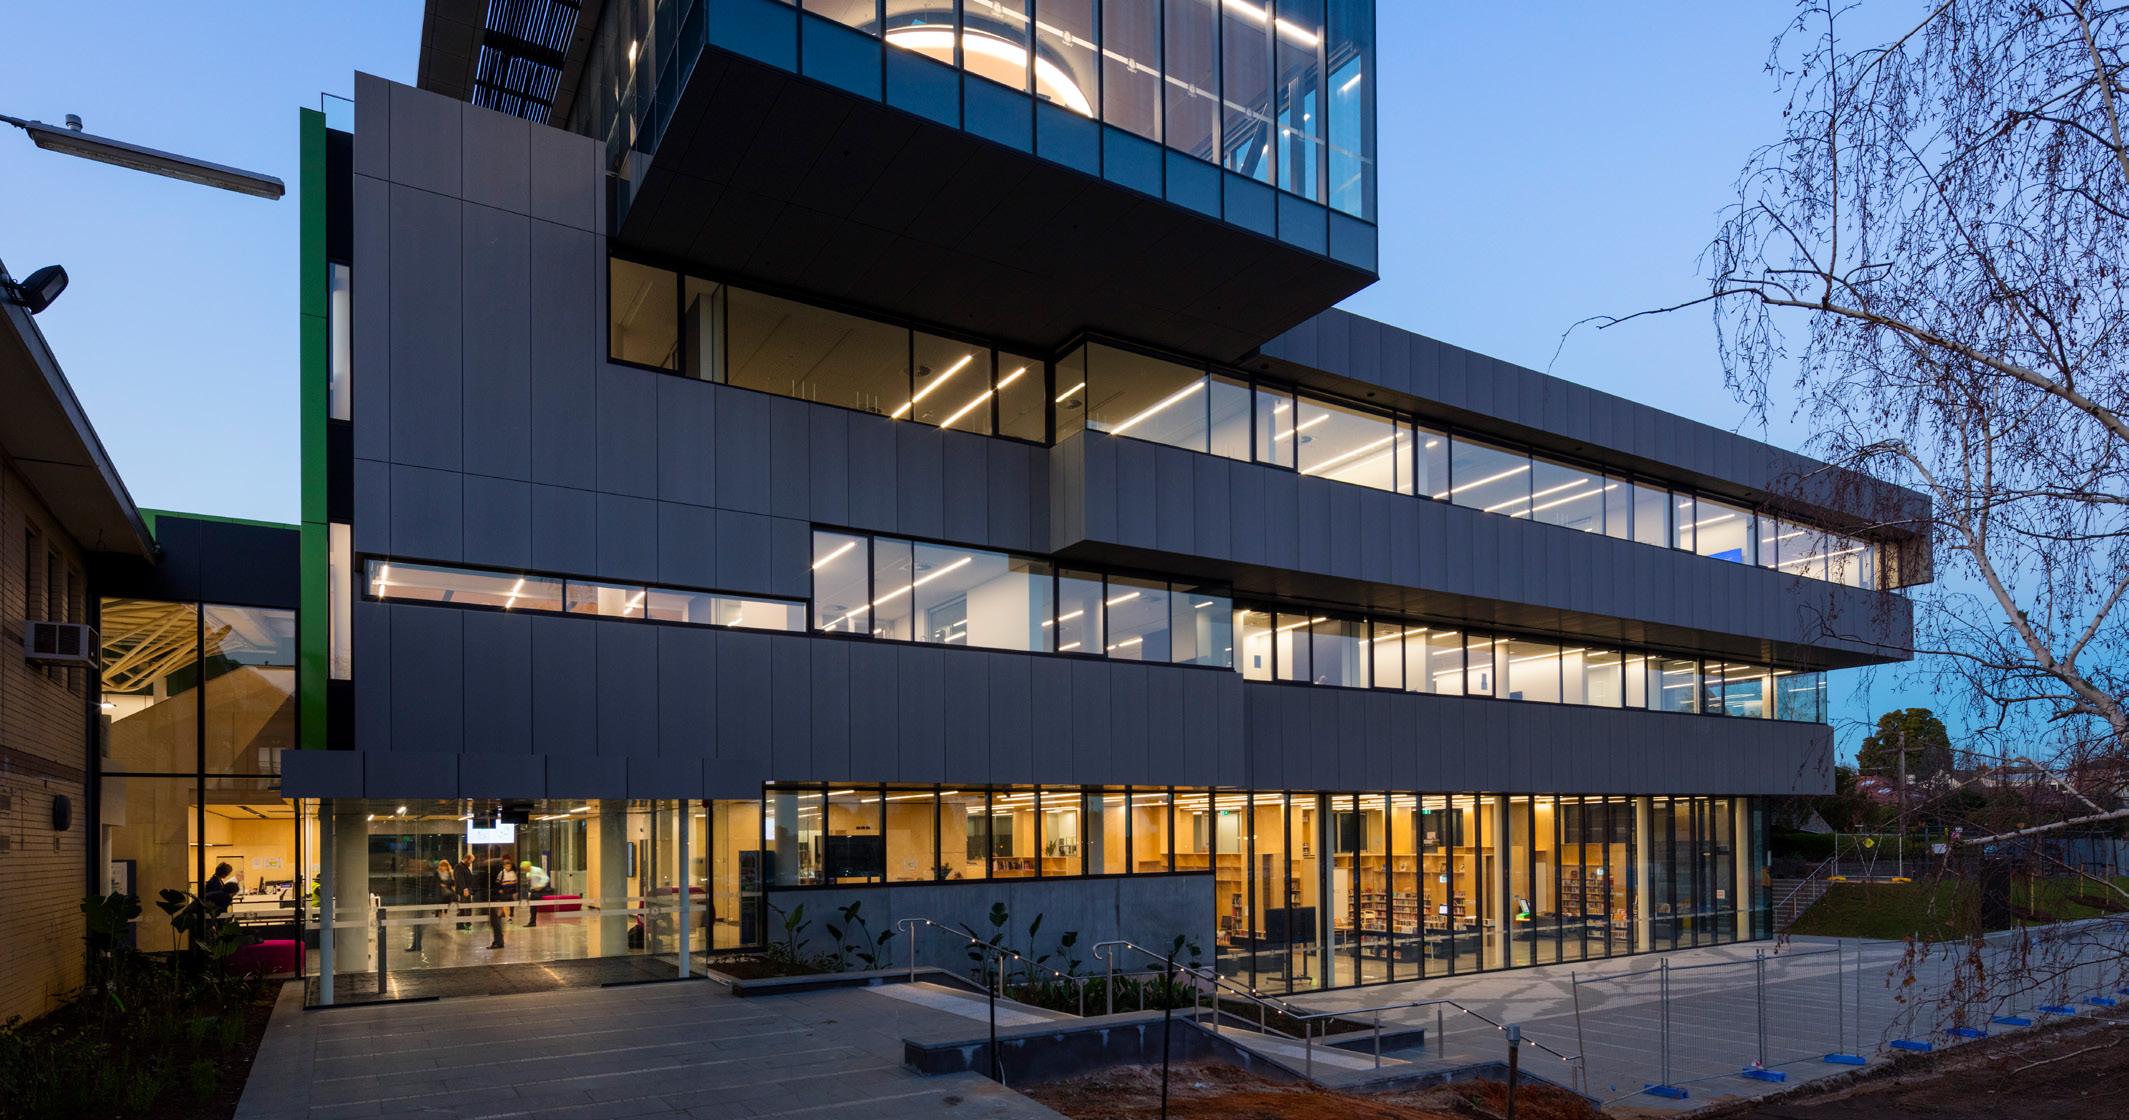
Major achievements included the installation of two solar systems – 39.6kW at Carey Zero and 90.5kW on the De Young Centre for Performing Arts – expanding our renewable energy capacity. We introduced Solar Cones for onsite composting, began transitioning to reusable packaging in the canteen and launched soft plastics and e-waste recycling trials. We found a new home for preloved uniforms in communities overseas, and those that can’t be reused are recycled, ensuring textiles are diverted from landfill. A new wildlife garden was created through a council grant, and biodiversity audits now guide green space planning across campuses.
Behind the scenes, we laid the groundwork for future improvements by initiating water audits and transport data analysis. Through student engagement, infrastructure upgrades and strategic planning, we are embedding sustainability in every corner of school life preparing our community to lead in a changing world and shape a more sustainable future.
Michelle Kafer Director–Finance and Operations
Carey Baptist Grammar School has a strong commitment to sustainability and environmental stewardship. Through quality education, community engagement and sustainable campus operations, Carey will help to pave the way for a more sustainable future.
Sustainability is embedded in the School’s strategic priority of Sustainable Futures. Carey is working towards the goal of Net Zero by 2035 to showcase our dedication. This decision reflects our steadfast commitment to leading positive change and reducing our carbon footprint, and highlights our dedication to sustainability and environmental stewardship. By setting ambitious goals and implementing comprehensive plans, Carey is raising its benchmark to a higher standard.
This strategic approach, led by Carey’s School Leadership Team, fosters staff and student leadership to address integration of sustainability in education and community programs, and ensure sustainability is embedded within all aspects of Carey’s operations and culture.
In 2024, Carey has taken significant steps to embed sustainability into its culture, operations and learning environments. The School is building on past initiatives to create a clear roadmap toward a more sustainable future. This year’s efforts reflect a whole-of-school approach, integrating sustainability into decision-making, infrastructure improvements and student-led initiatives.
A key milestone has been Carey’s collaboration with CERES, a respected leader in sustainability education, to guide the School through the development of our Sustainability Plan. Carey’s Sustainability Plan sets out targets and milestones to drive progress. This plan aligns with broader strategic goals, ensuring that sustainability is embedded across operations, curriculum and community engagement.
To track and enhance the impact of these initiatives, Carey is streamlining data collection processes for 2025, improving measurement and reporting of key sustainability indicators. By refining how data is gathered and used, the School can make informed decisions that support longterm sustainability objectives.
Carey’s approach ensures that sustainability is not just a concept but an active commitment, empowering students, staff and community to contribute. Through collaboration, innovation and accountability, 2024 marked a turning point in the School’s sustainability journey.
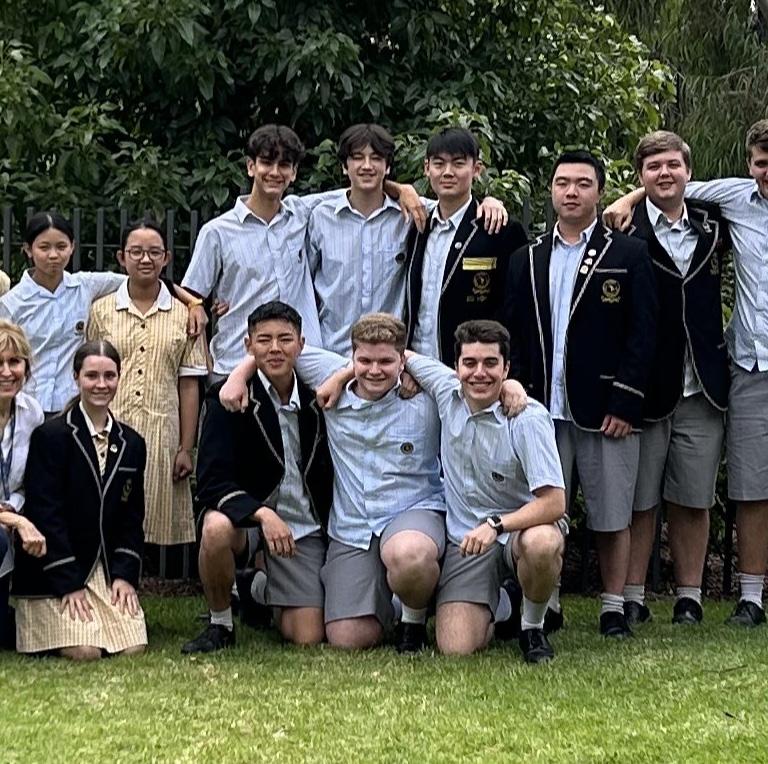
Hamish, our inaugural Senior School Environment Captain, has embraced his role with passion, building upon years of dedication to the Middle and Senior School Eco-Warriors. His vision centres on tangible environmental impact and student empowerment.
This year, Hamish is working with the Middle and Senior School Eco-Warriors to support the next phase in the development of the wildlife garden. Students hope this will include boulders, a water feature and extended plantings to foster habitat for native wildlife, including lizards, terrapins, birds and insects.
Senior School Eco-Warriors are also launching a targeted plastic bottle recycling program which supports the targets Carey has set within our Sustainability Plan to reduce waste to landfill and increase recycling.
Hamish’s leadership underscores a commitment to raising environmental awareness and promoting regenerative practices. He envisions a future where Carey students actively contribute as responsible environmental custodians. Both Middle and Senior School Eco-Warriors exemplify this dedication.
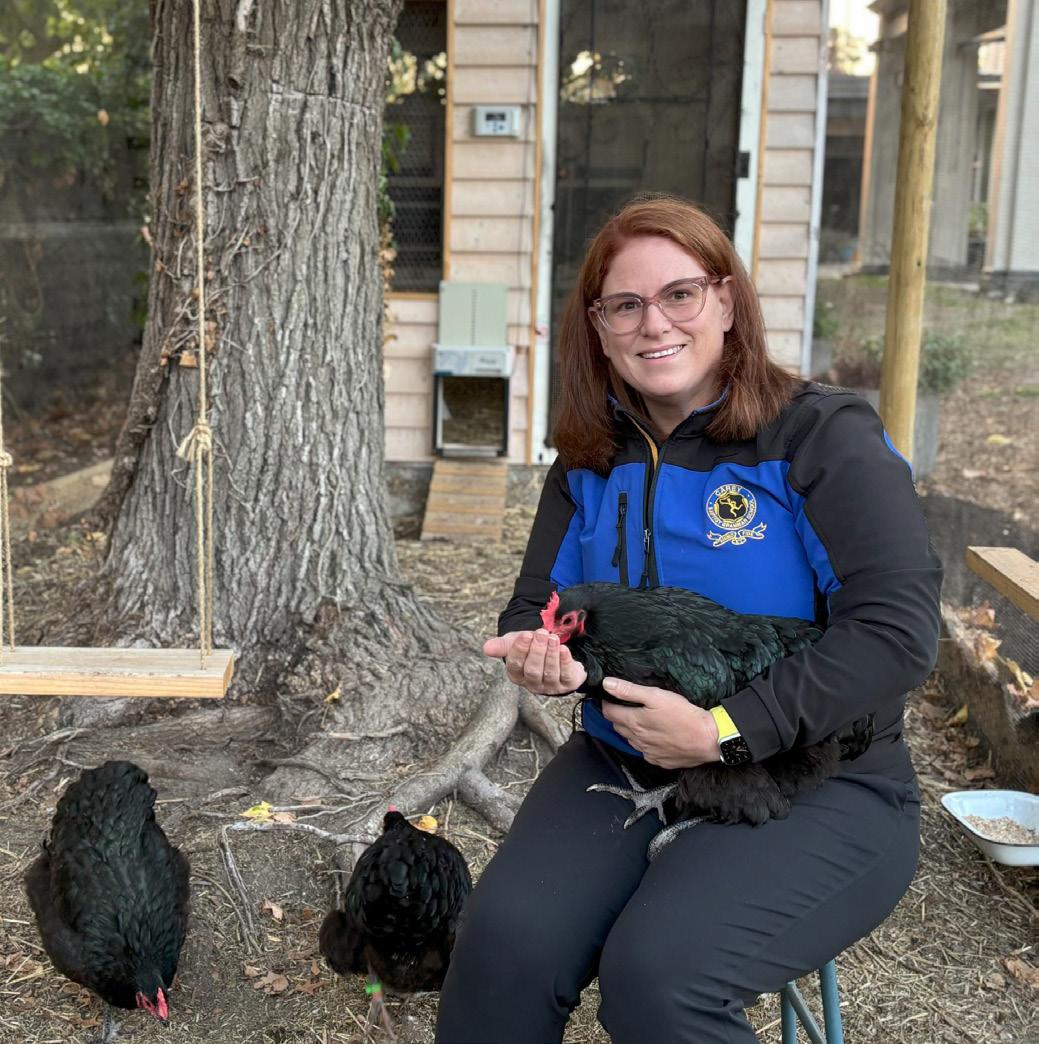
Kitchen Garden Program Co-ordinator
Eleanor Burns
Eleanor’s leadership has made a significant impact in our Junior School, where sustainability is integrated into everyday learning. As our dedicated Kitchen Garden Program Co-ordinator, she has created much more than a garden – she has built a vibrant, hands-on learning space where students connect deeply with nature, their food and their community.
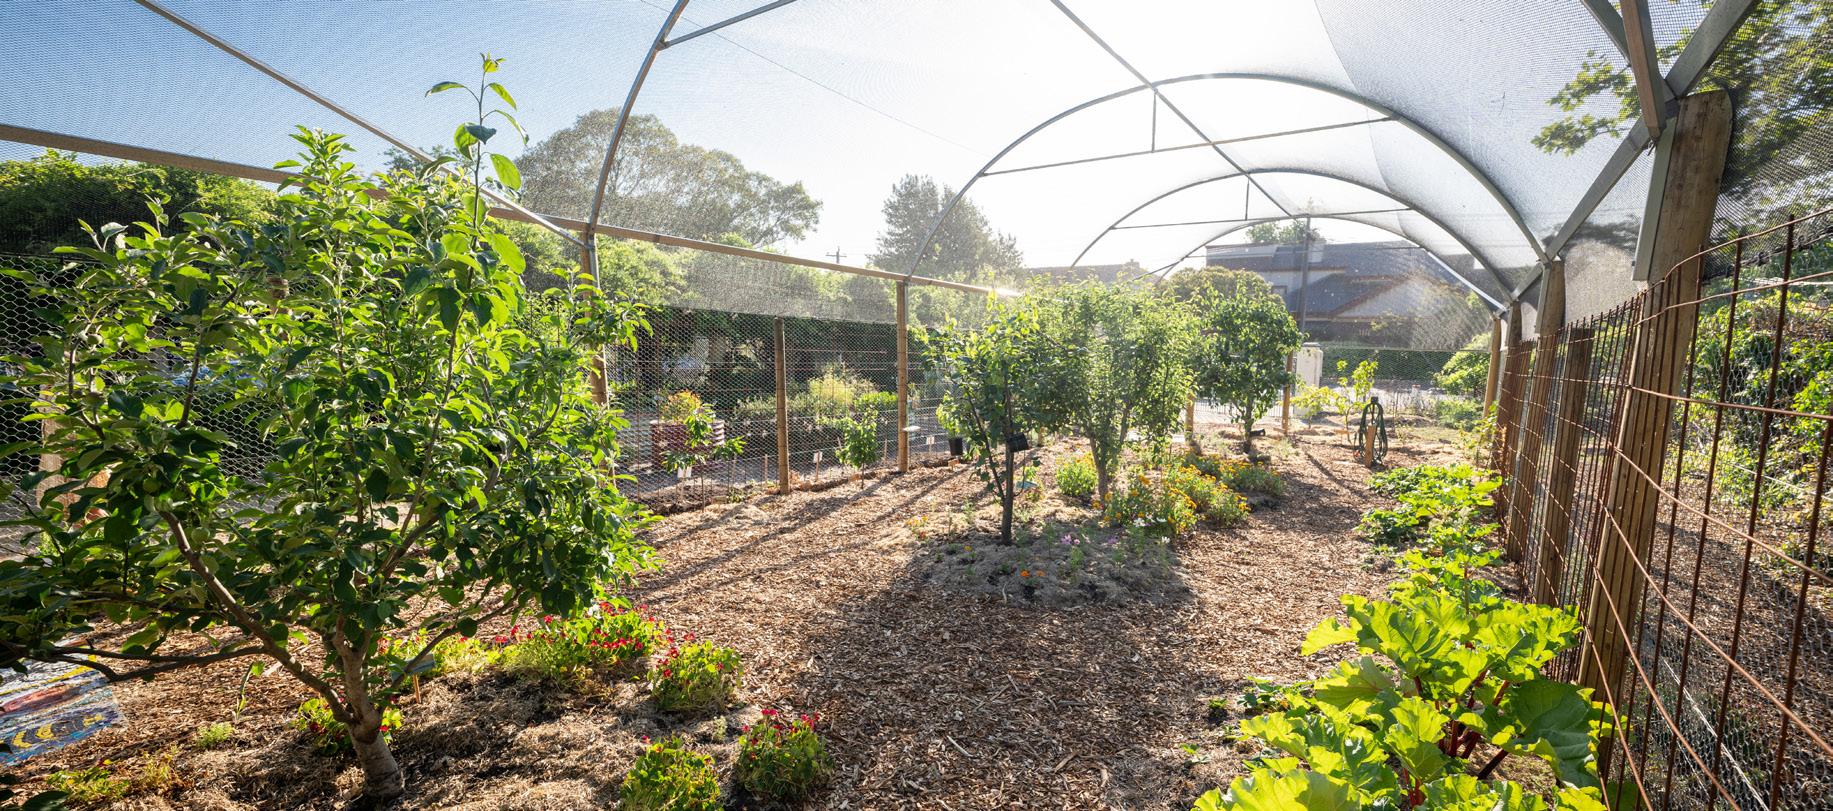
Thanks to Eleanor, the Junior School orchard is growing into a thriving outdoor classroom. What started as a small group of fruit trees is now a space where students learn about biodiversity, seasonal change and how food systems work. Her vision has helped bring outdoor learning to life in a meaningful, grounded way.
One standout project is the chicken coop, built in part with recycled material. It is a great example of how creativity and sustainable thinking can be used to reduce waste. The chickens are now part of the garden ecosystem, contributing their nutrient rich waste to compost and offering students a hands-on way to learn about care, responsibility and the food cycle.
Eleanor played a key role in expanding Carey’s composting systems, substantially increasing the School’s composting capacity by building composting bays out of recycled pallets. The system now plays a vital part in reducing waste and enriching the soil. It’s another step toward creating a closed-loop garden where nothing goes to waste and everything serves a purpose.
Eleanor also plays an important mentoring role, guiding and supporting our dedicated Year 6 Sustainability Captains, Chloe and Juni. With her encouragement and expertise, these student leaders are empowered to develop their own initiatives and see them through – from idea to impact – gaining confidence and making meaningful contributions to our Junior School’s sustainability journey. Current projects include the launch of the Carey Clean Up Club and a studentled, sustainability-focussed House session, both of which are set to begin in Term 2, 2024.
At the heart of it all is Eleanor’s genuine passion for the environment and for teaching. Her work is impactful – combining innovation, education and joy. She is a true sustainability champion, and her leadership continues to inspire lasting change within our Junior School community.
Reduction targets were set for 2024 based on performance in baseline years and best practice. Recycling, Paper Procured, Transport and Water sectors met the target, while Biodiversity, Gas, Electricity and Landfill sectors did not meet the target.
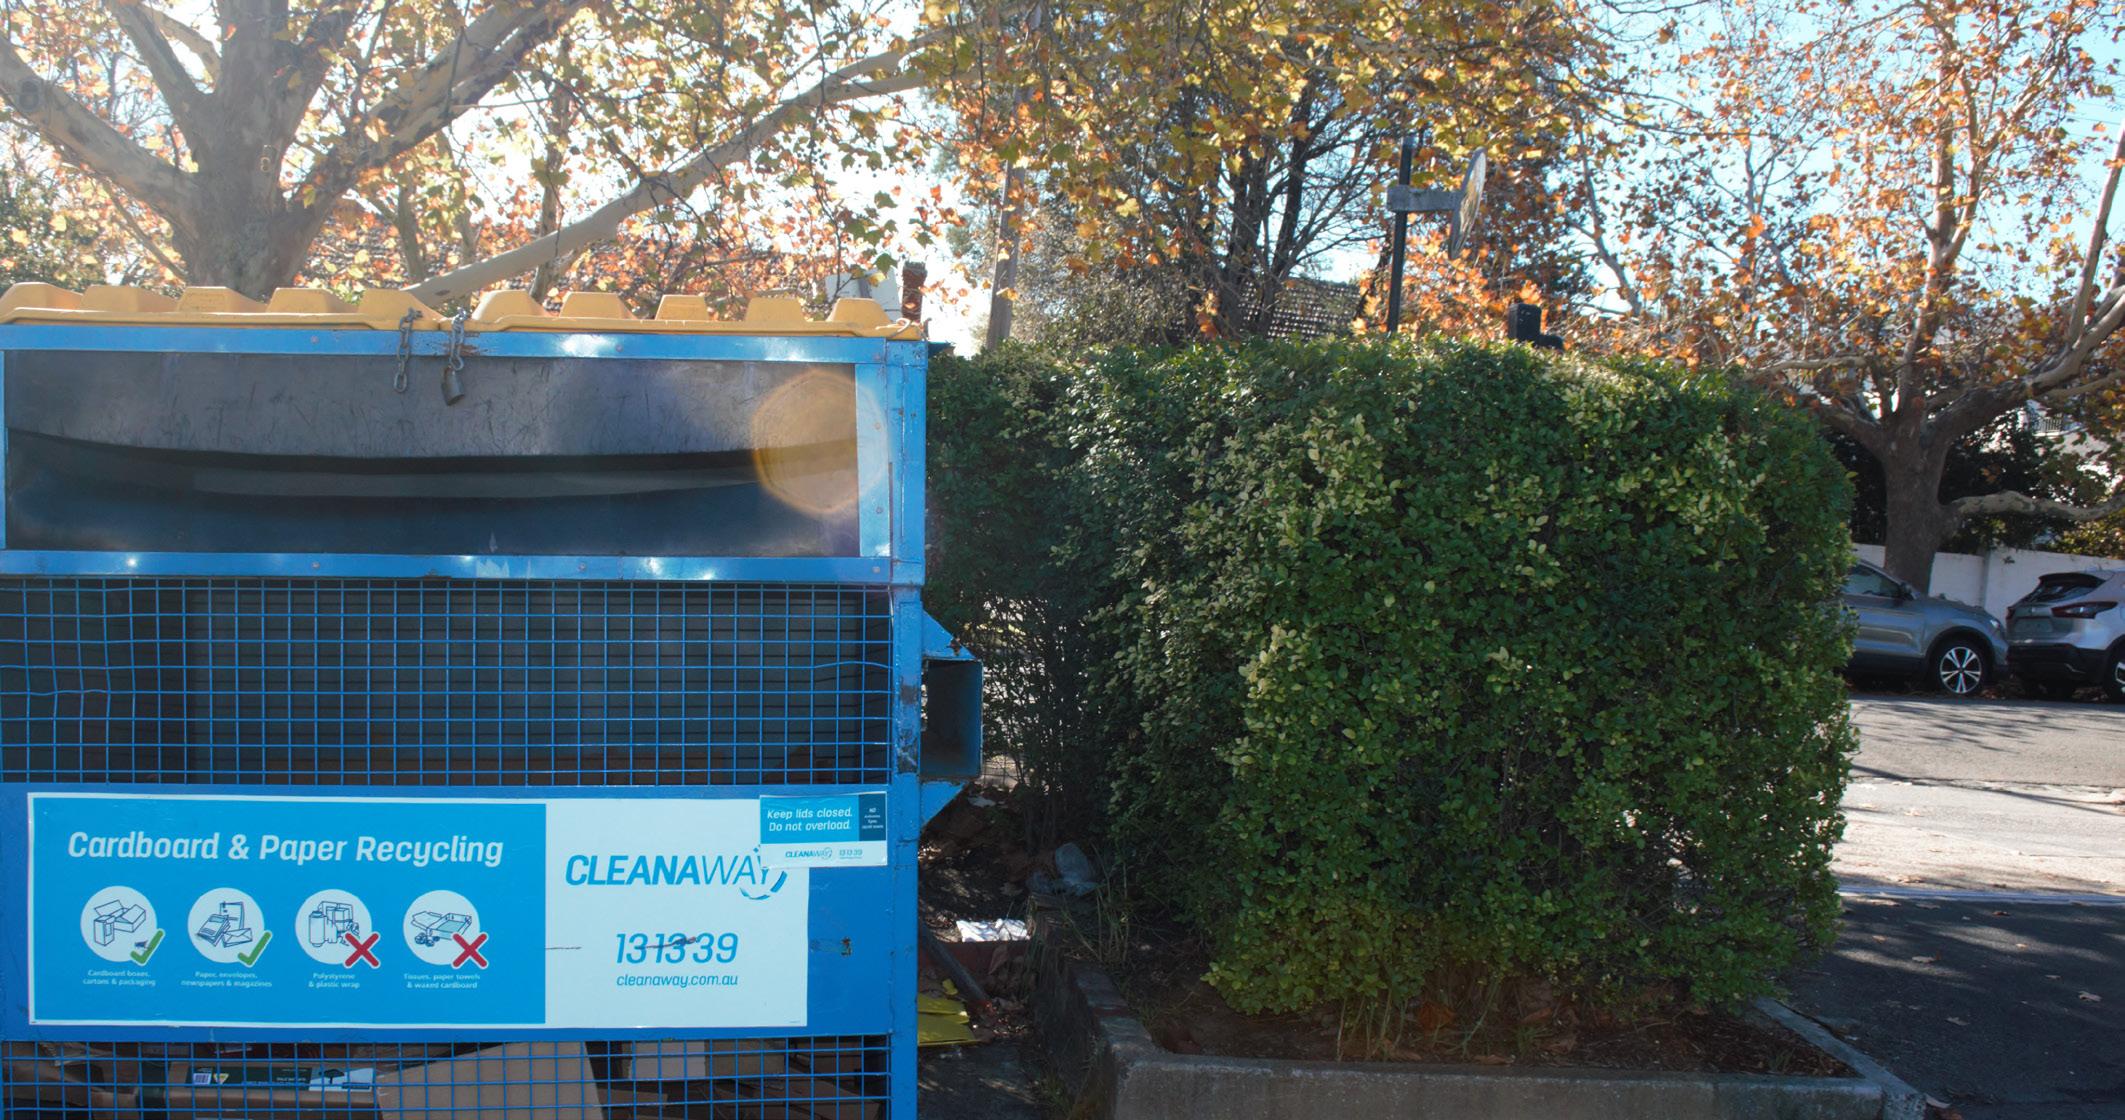
Recycling
137 t 28.3% recycled 125% above target
Baseline year: 2022
Paper
2,148,471 sheets
43% below target
Baseline year: 2022
Transport
36,998 L 100.6 tCO2e 10% below target
Baseline year: 2022
Water
20,413 L 26.9 tCO2e
3.5% below target
Baseline year: 2022
Biodiversity
Kew: 57 Donvale: 73 18 and 2 below target
Baseline year: 2024
Gas
9,739,908 MJ 502 tCO2e
6.5% above target
Baseline year: 2022
Electricity
2,290,995 kWh 33.6 tCO2e 15% above target
Baseline year: 2022
Landfill
347 t 552.1 tCO2e
62.1% above target
Baseline year: 2022
In this report, we have assessed our progress in 2024 for each sector of the Sustainability Plan. As the Plan was published mid-2024, the focus has been on setting up and developing plans for each milestone for implementation beginning in 2025. The status of each sector and its related milestones primarily focuses on whether plans have been developed and current stage of planning.
Please refer to the following matrix for status:
Plan and/or project to address the milestone has been completed.
There is a plan in place to address the milestone and implementation is underway.
Project plans are being developed to address this milestone.
Plans exist but are currently deferred due to technological, logistical, cultural or resource constraints.
No actions have been taken yet, with progress depending on other achievements or technological, logistical, cultural or resource developments.
In Alignment with SDGs:


Spotlight
This represents the school emitting 18.3% more GHG than the annual target.
1538 tonnes of carbon dioxide (CO2) equivalent emissions were generated by Carey Baptist Grammar School.
Since baseline 2022, there has been a 52% decrease in GHG emission.
Addressing climate change is central to our sustainability efforts. In 2024, we continued to embed emissions reduction into our operations, programs and planning. Key initiatives – such as expanding our solar infrastructure, improving waste and resource management, and reviewing transport and procurement practices – are all part of a broader strategy to reduce our emissions.
We are also working to better understand our complete emissions profile to inform our path toward net zero.
Greenhouse gas emissions by activity sector by year at Carey Baptist Grammar School.
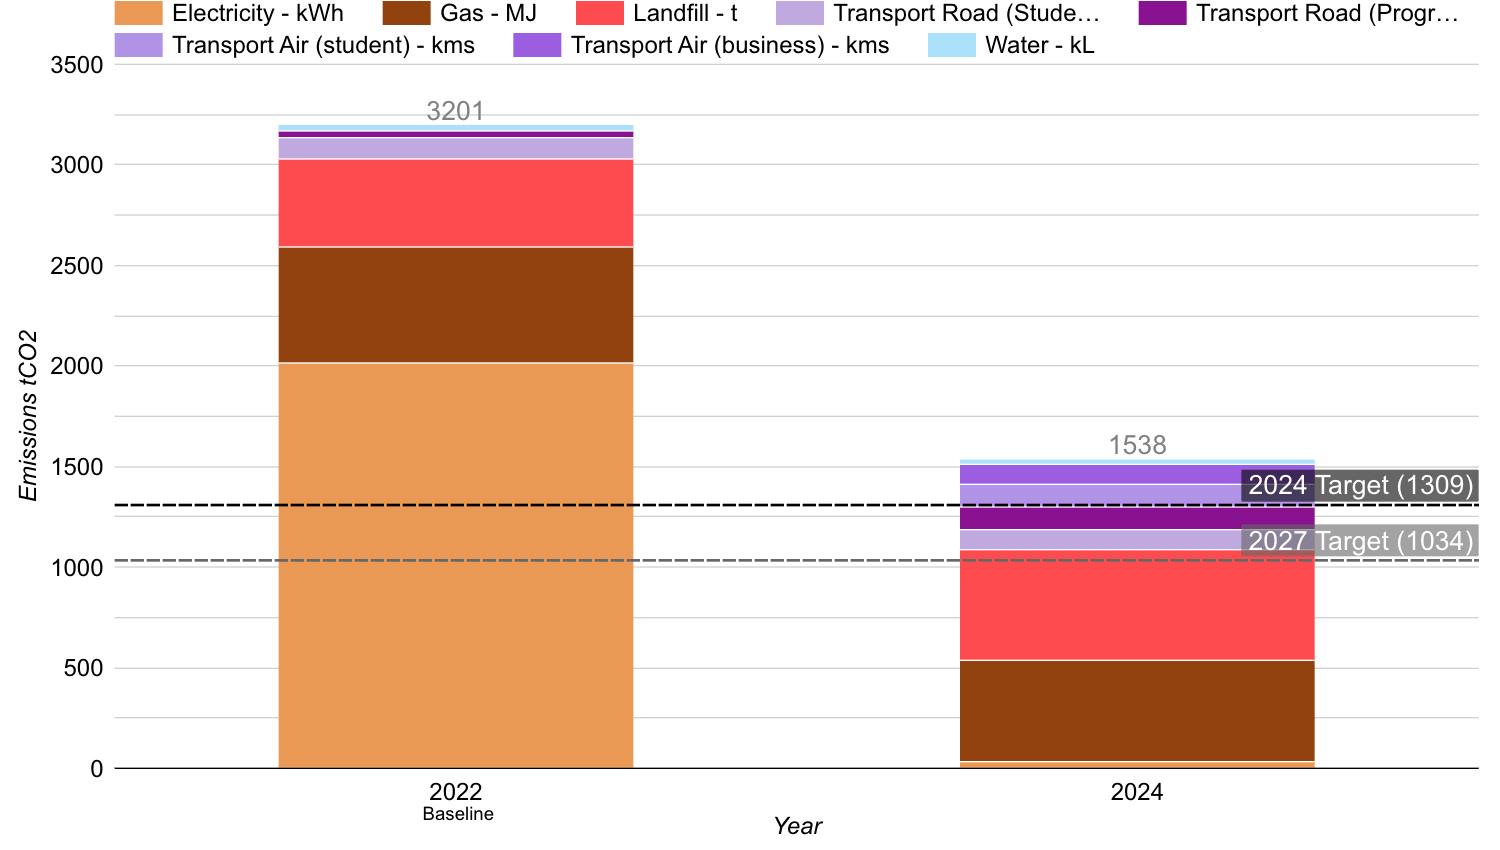
Figure 1 accounts for Scope 1, 2 and 3 greenhouse gas emissions. In 2024, 1538 tonnes of carbon dioxide (CO2) equivalent emissions were generated by Carey Baptist Grammar School. This underperformed against the 2024 target of 1309 tonnes by 17.5% and is a 52% reduction from the baseline year.
*See Appendix A for further information on GHG emissions inclusions and exclusions, Appendix B for relevant GHG emissions factors, and Appendix C for any data assumptions made.
Milestone
Governance structure oversees emission reduction and mandatory climate disclosure requirements.
Scope 1–3 emissions profile expanded.
Emission reductions policies and actions implemented at each campus.
Governance structure to manage climate and sustainability projects and budgeting with clear distribution and delegation of responsibility and internal processes.
Sustainability training provided to staff and stakeholders. 2026
Working with CERES to build an inventory of Scope 1–3 emissions at the School. 2026
Purchase of 100% GreenPower across all main Carey campuses.
+15% This represents the School using 15% more electricity than the annual target
In 2024, our commitment to clean energy took a major leap forward with the installation of two significant solar systems.
A 39.6kW solar array was installed at our Carey Zero campus, supporting hands-on sustainability education while reducing reliance on grid energy. At our Kew campus, a 90.5kW system now powers the De Young Centre for Performing Art, helping to lower our carbon footprint and operational costs.
+6.5% This represents the School using 6.5% more gas than the annual target.
Together, these systems are projected to generate over 170,000 kWh annually – enough to power 30 average homes – while supporting our long-term goal of achieving net zero emissions.
These projects demonstrate our practical approach to sustainability: combining infrastructure improvements with student learning opportunities.
Energy audits conducted at each campus to identify low efficiency and gas infrastructure.
Inventory of energy assets and infrastructure completed at each campus.
Power consumption standards set and policies to lead energy conservation.
Conduct a comprehensive energy audit to identify buildings of high energy use at each campus.
Create a shutdown procedure and establish guidelines for energy behaviour and use, e.g. HVAC temperature settings, lighting schedules, using the building management system.
Set up a procurement policy to ensure highestenergy-rated infrastructure and appliances are in place upgrading new appliances (e.g. LEDs only).
Design an energy conservation campaign with students and staff to promote behaviour change based on the recommendations of energy audits.
Shift from gas to electric appliances after exploring their feasibility, i.e. electrify inefficient and end-of-life gas heaters and gas hot water units.
Explore upgrading aquatic facilities with non-gas alternatives like PVC/thermal solar-assisted heat pump (PVT-SAHP), water solar-assisted heat pump (W-ASHP), or a waste heat recovery system.
Sustainability Policy sets clear power consumption standards, optimising building management systems and promoting energy-efficient practices across the School.
Figure 2.
Electricity consumption by year.
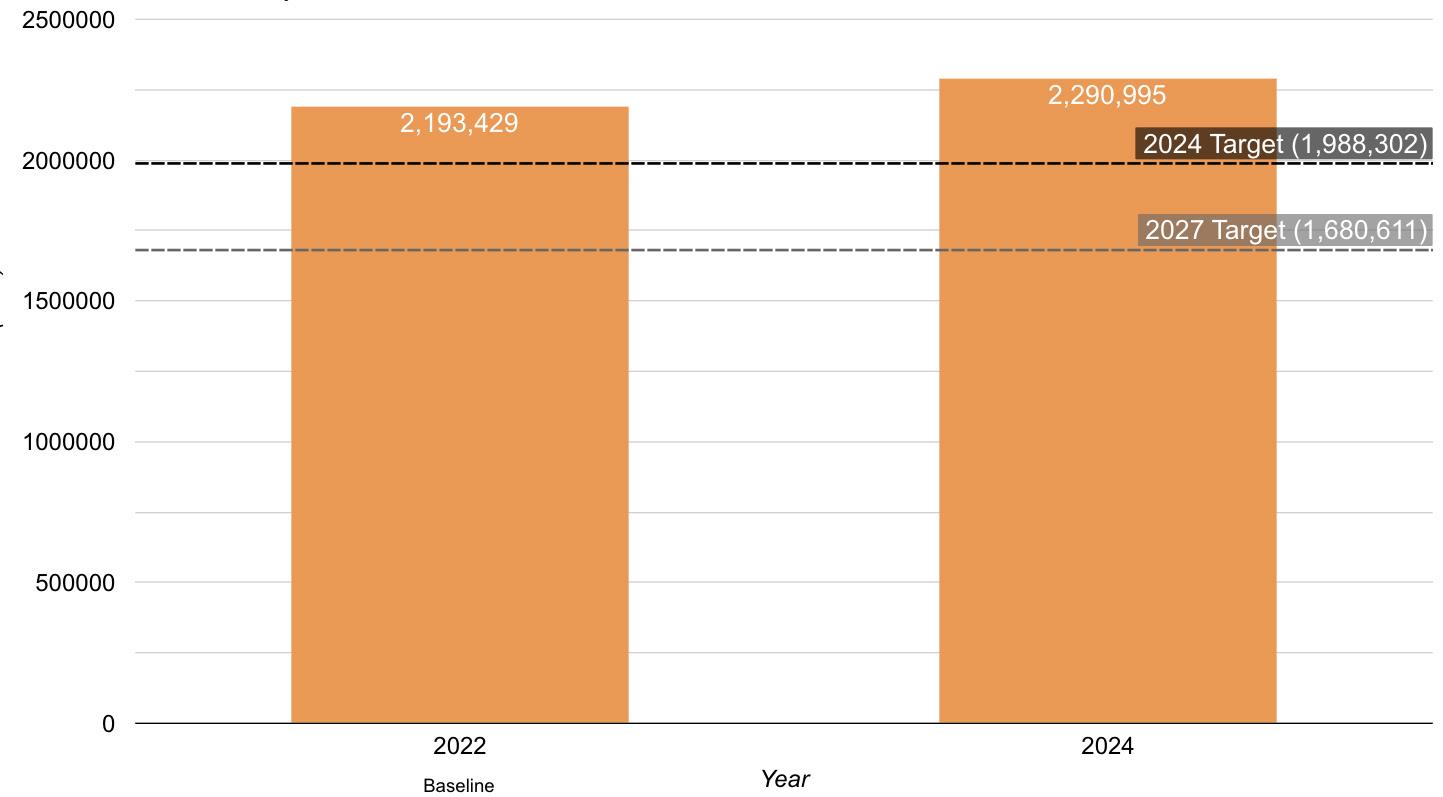
Figure 2 illustrates the School’s electricity consumption. This underperformed against the 2024 target by 15% and is a 4.45% increase from the baseline year.
Carey switched to 100% GreenPower in 2024 for all campuses, and Camp Zero from October 2024. This switch had a significant impact on our emissions profile as 98% of our electricity now comes from renewable energy sourced through GreenPower.
Over the next three years, we will focus on further understanding our energy infrastructure, and develop policies and programs with the School community to support energy conservation across all campuses.
2,290,995 kWh
2,290,995 kWh was consumed from grid including GreenPower.
Since baseline 2022, there has been a 4.45% increase in electricity consumption.
Figure 3.
Gas consumption by year.
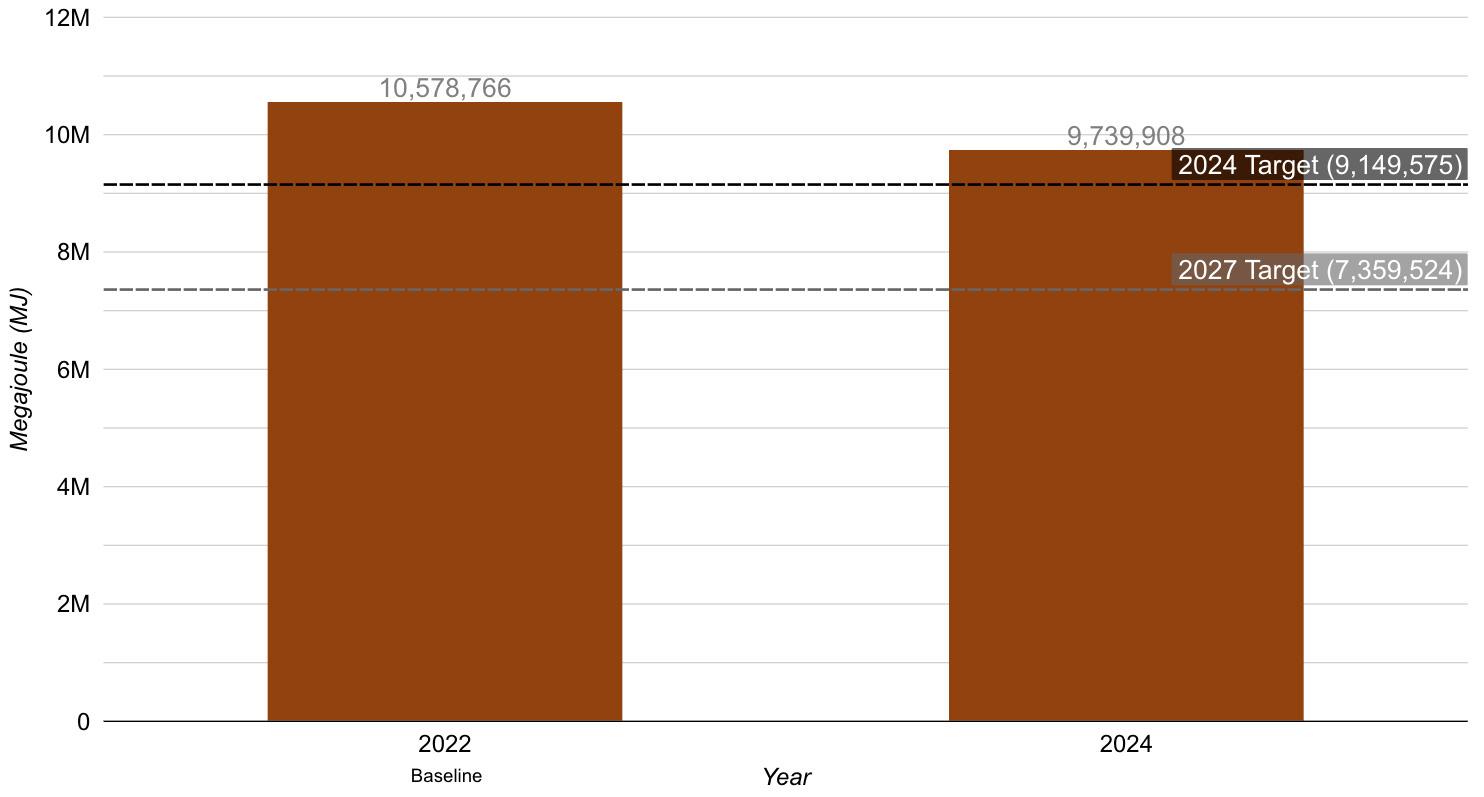
Figure 3 shows the proportion of gas consumed in 2024 compared to baseline year (2022). This underperformed against the 2024 target by 6.5% and is an 8% reduction from the baseline year.
9,739,908 MJ
9,739,908 MJ of gas was consumed in 2024.
Since the 2022 baseline, there has been an 8% decrease in gas consumption.
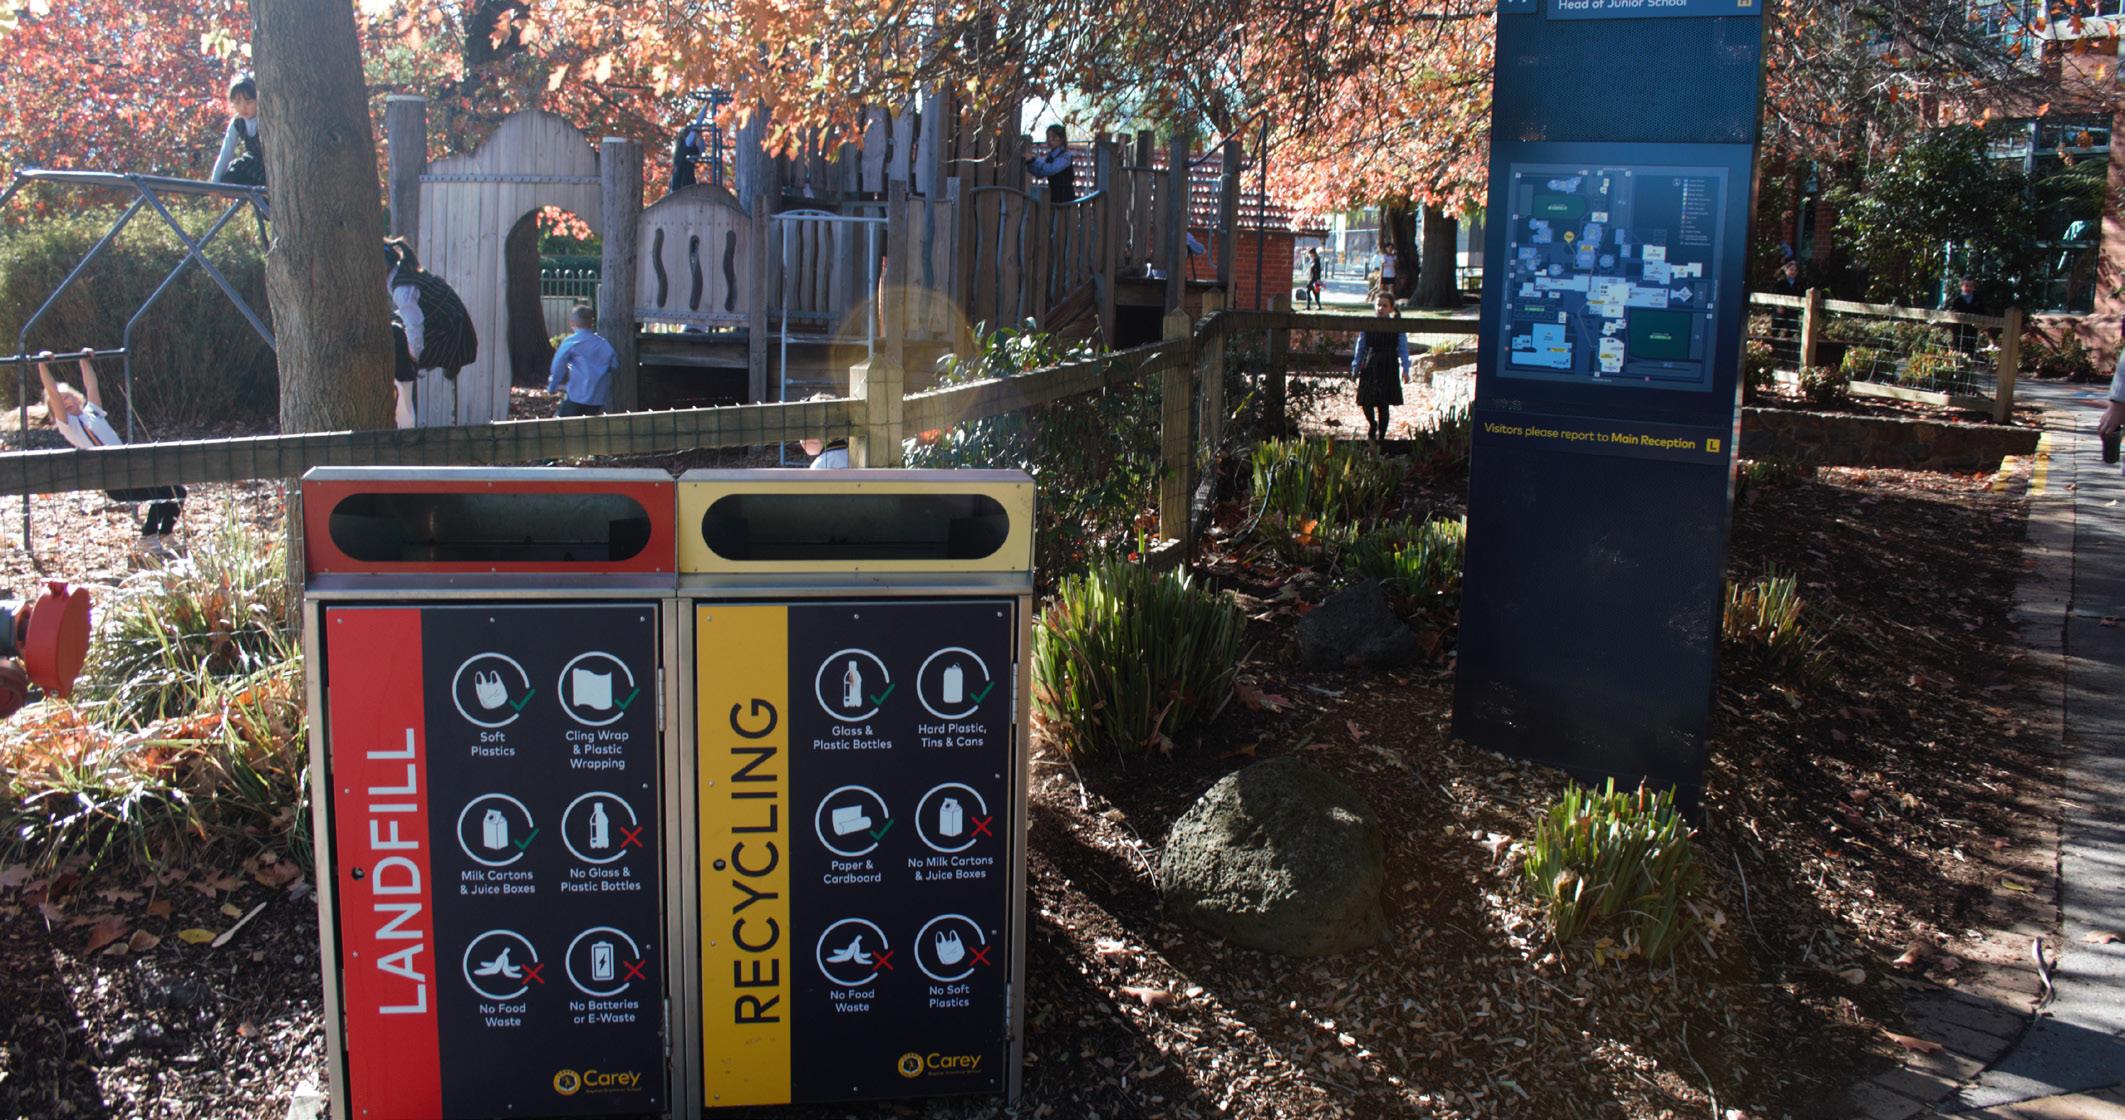
Resource Recovery Spotlight
This year, we’ve taken bold steps to close the loop on waste across our campuses. This includes a focus on eliminating waste at its source, and prioritising reuse and recycling. These efforts will help to reduce Carey's waste to landfill which has increased by 27.1% from the 2022 baseline year.
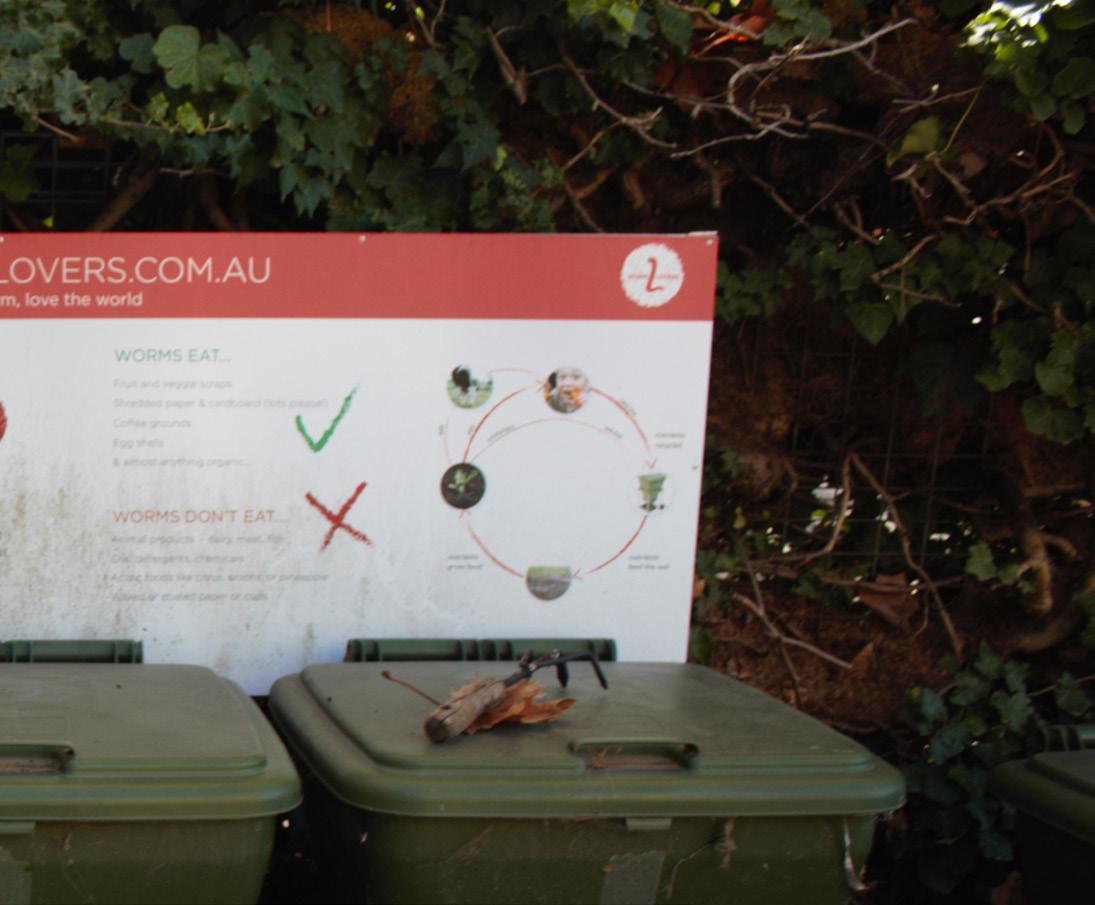
Solar Cones are being trialed at Carey Zero, Camp Toonallook and the Carey Sports Complex – Bulleen to compost food scraps onsite, transforming waste into valuable compost. In our ongoing effort to reduce landfill, we’ve transitioned to reusable or recyclable packaging for canteen and event catering.
The Carey Swap Shop continues to thrive, promoting a culture of reuse among students and staff. In 2024
484 tonnes
This represents the School generating 81.3% more waste than the 2024 annual target 484 tonnes of landfill and recycling waste was generated.
Proportion of total waste has increased by 65.8% since 2022 (baseline year).
we found a new home for pre-loved uniforms in communities overseas, and those that can’t be reused are recycled, ensuring textiles are diverted from landfill.
A soft plastics collection trial with RecycleSmart is underway at Bulleen, while e-waste – including batteries and old computer bags – is now being collected and responsibly recycled.
Meanwhile, our Kew campus launched a reusable cup initiative, reducing reliance on single-use items. These initiatives reflect our holistic approach to resource recovery – reducing waste, rethinking consumption and engaging our community in sustainable habits.
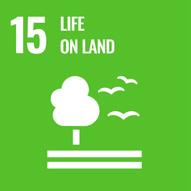
Figure 4.
Waste & Recycling streams by year.
Landfill – t Recycling (comingle) – t Recycling (e-waste) – t
Recycling (green waste) – t Recycling (food waste) – t
Recycling (paper and cardboard) – t
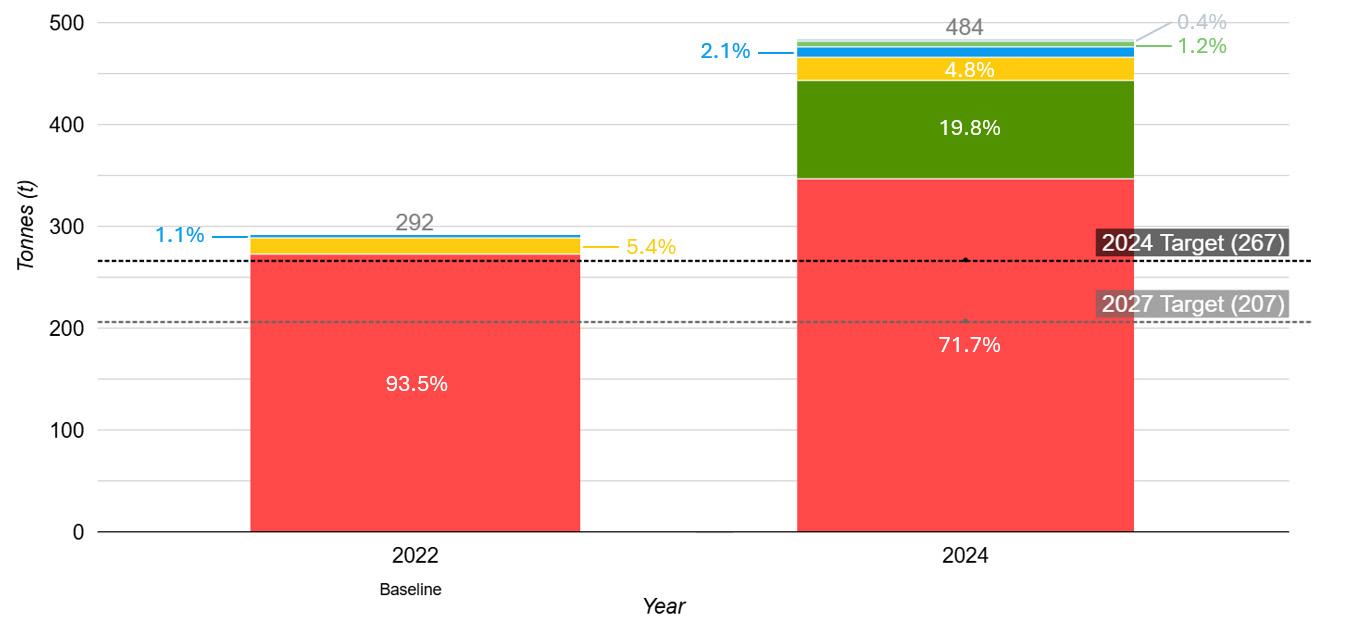
Figure 4 shows the contribution of landfill, co-mingled, FOGO, paper and cardboard and e-waste to total waste collection. 2024 recycling includes a breakdown of recycling streams which were not available in the 2022 baseline. This underperformed against the 2024 target by 81.3% and is a 65.8% increase of total waste from the baseline year.
Milestone
Organics and commingled materials recycled at all campuses.
Action
Recycle garden waste at the School through FOGO bins and compost bins.
Awareness and education towards placing the waste in correct bins.
Timeframe
Ongoing
Ongoing
Status
Packaging of major supplies and regular purchases are made from resusable and/or recyclable materials.
Design tailored signage and an education campaign in collaboration with students and staff. Ongoing Install signage to help educate students and staff on correct bins to use.
Trial Waste-Free events using Green My Cup to reduce waste from single-use items at large events.
Work with the canteen and event catering to find alternatives to single-use packaging and increase recycling of food waste.
Ongoing
Ongoing
2025
Annual waste audits conducted at each campus, identify reduction of landfill and increase in recycling. Ongoing
Figure 5.
Landfill by year.
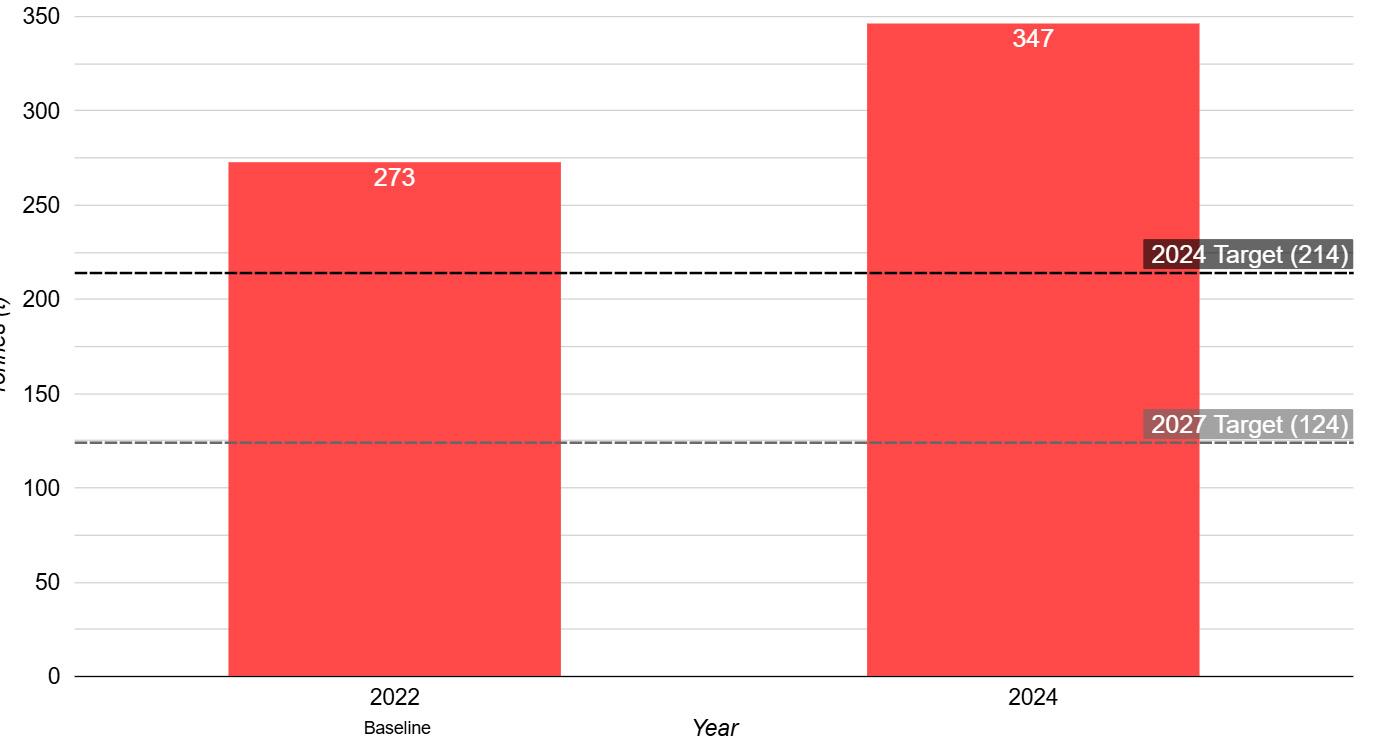
Figure 5 shows landfill waste per year. This underperformed against the 2024 target by 62.1% and is a 27.1% increase from the baseline year.
As Carey has exceeded the 2024 set target, the discussion about eliminating waste at its source, prioritising reuse and achieving high levels of recycling, will be picked up in 2025.
This represents the School generating 62.1% more landfill than the 2024 annual target.
This represents the amount of landfill produced by the School in 2024.
Since baseline 2022, there has been a 27.1% increase in landfill production.

Recycling by year.
Recycling (comingle) – t
Recycling (food waste) – t
Recycling (e-waste) – t
Figure 6. Figure 6 shows the recycling rate per year. The recycling rate is the percentage of total waste that has been diverted from landfill and recycled in the streams of FOGO (Food Organics and Garden Organics), paper and cardboard, co-mingled and e-waste.
Recycling (green waste) – t
Recycling (paper and cardboard) – t
In 2024, 137 t of recycling was diverted from landfill. This is a 125% increase from the annual recycling target of 53 t, which contributes to higher total waste produced overall, when the goal is to reduce total waste while increasing the recycling component.
137 tonnes
137 tonnes of recycling was diverted from landfill.
This represents the increase from the 2024 target for recycling.
This represents the School using 43% less paper sheets than the 2024 annual target.


Sustainable purchasing practices are key to reducing our environmental impact. This year, we focussed on eliminating non-biodegradable single-use items, including disposable coffee cups, from our canteen operations – supporting a shift toward reusable alternatives.
In staff rooms, we replaced individually-wrapped items with bulk purchases of staples like coffee, sugar and biscuits, significantly cutting down on unnecessary packaging. These changes reflect our commitment to responsible procurement that prioritises waste reduction, cost efficiency and long-term sustainability.
2,148,471 sheets
2,148,471 sheets of paper were consumed.
Since 2022, there has been a 50% decrease in paper consumption (sheets).
Figure 7.
Paper printing (number of sheets) by year.
Paper – sheet
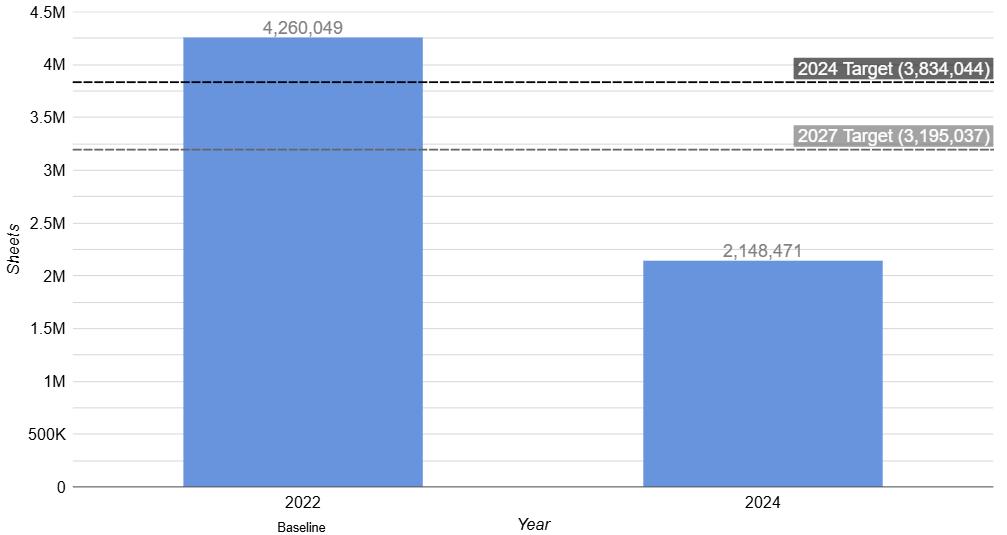
Figure 7 illustrates the School’s paper usage. This overperformed against the 2024 target by 43% and is a 50% reduction from the baseline year.
Milestone Action
Sustainable Purchasing and Procurement Policy informs all operations and events.
Inventory of Scope 3 emissions in School’s supply chain.
Products and consumables are sourced from suppliers committed to sustainability.
Review procurement processes and create criteria to guide the Sustainable Purchasing and Procurement Policy.
Create a Sustainable Purchasing and Procurement Policy for use in all operations and events.
Align purchase of packaging with recycling streams in commingled or FOGO to avoid waste to landfill.
Procure paper made from 100% recycled paper with carbon neutral certification to avoid deforestation.
Switch to digital resources where possible and continue to reduce printed materials.
2025
2025
Ongoing
2026
Ongoing
This represents the School using 10% less fuel than the annual target.
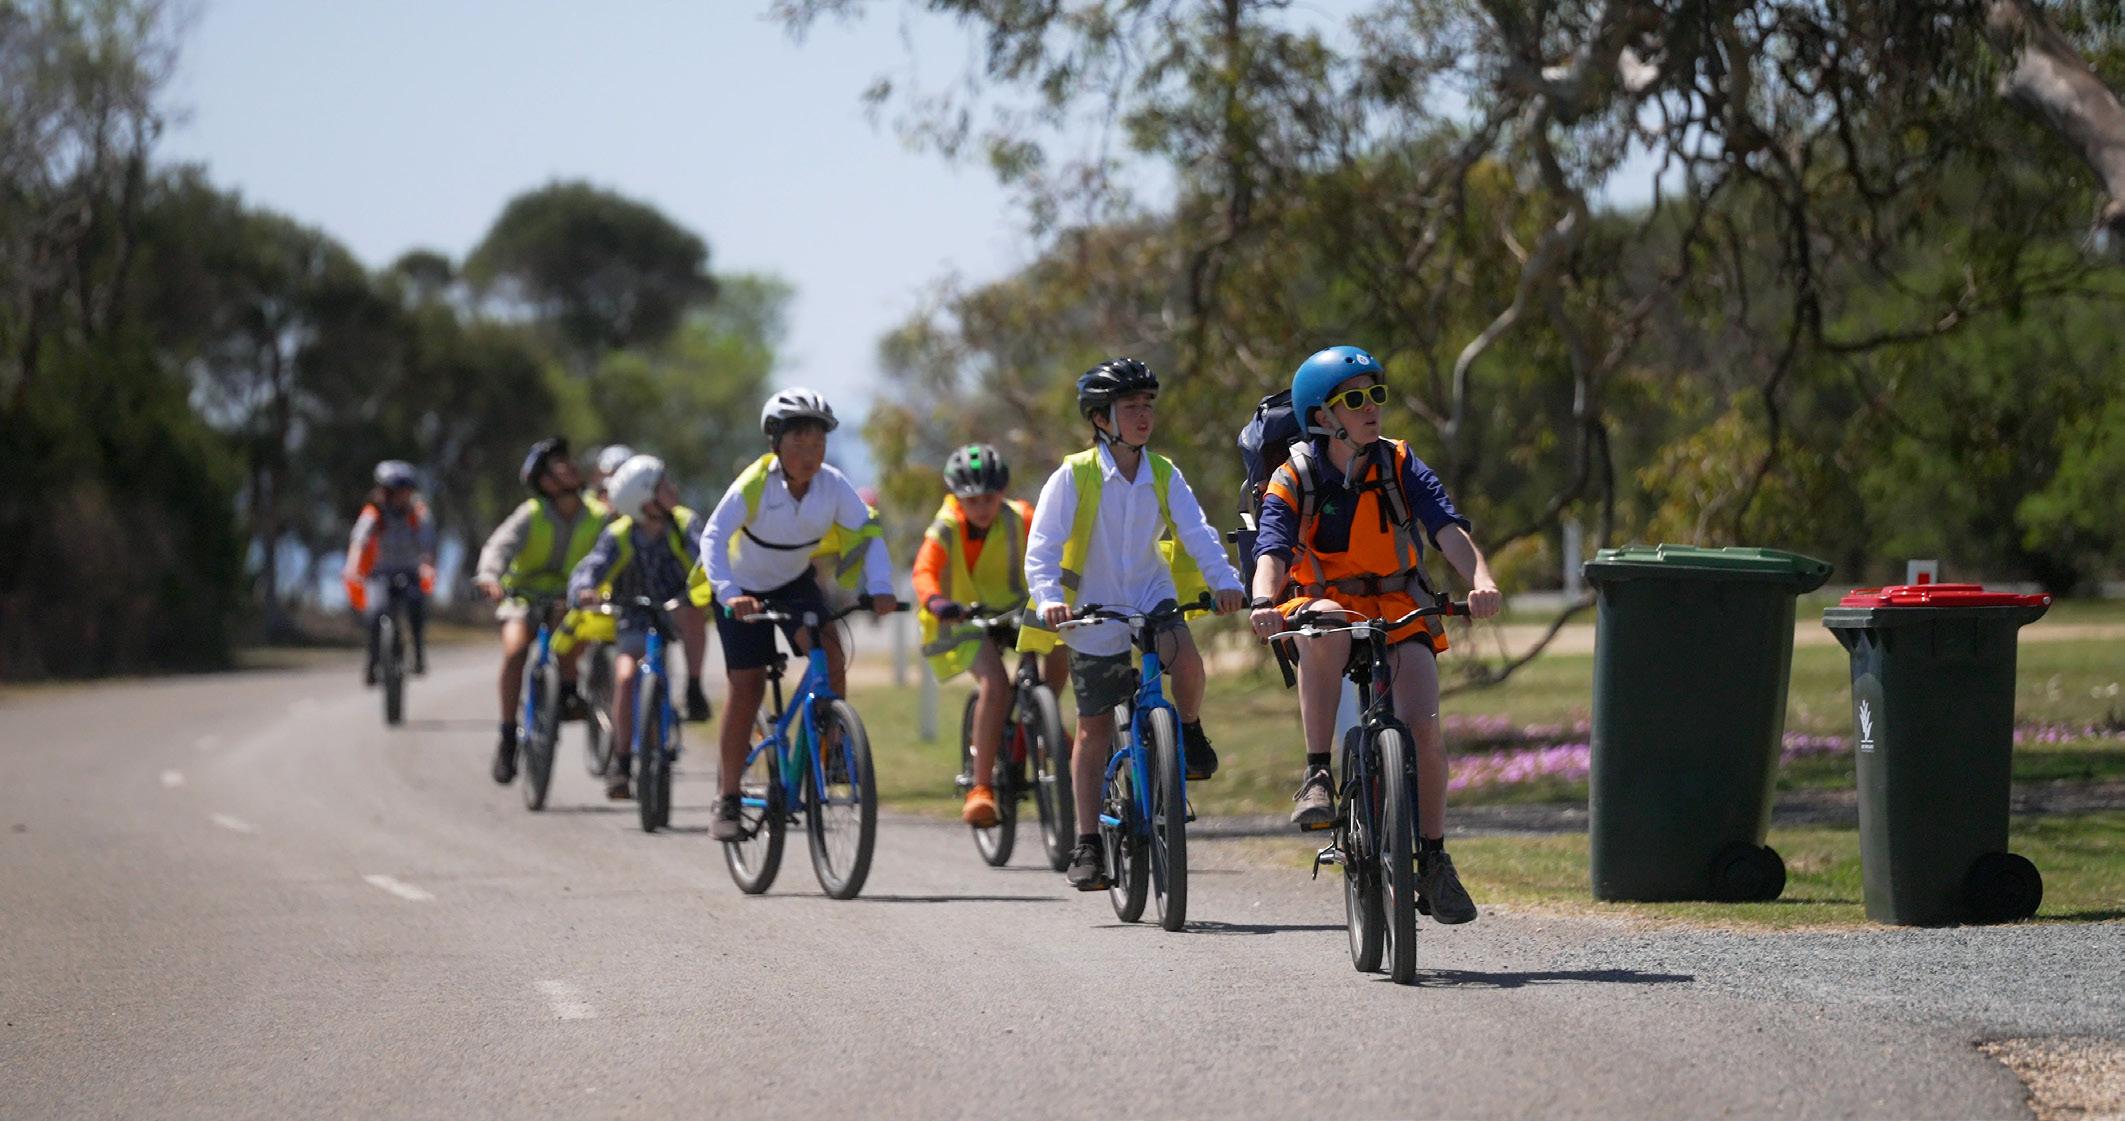
In 2024, we began work on understanding how our community travels to and from school, as well as to offsite programs and events. This datagathering phase will help us identify opportunities to reduce emissions, ease congestion and encourage more sustainable transport choices.
With these insights, we aim to develop and implement targeted transport initiatives in 2025 that support our sustainability goals and promote healthier, low-impact travel options for students, staff and families.
36,998 Litres
36,998 L of fuel was consumed in 2024.
Since 2022, there has been a 10% decrease in fuel consumption.
Figure 8.
Fuel consumption from student road transport by year.
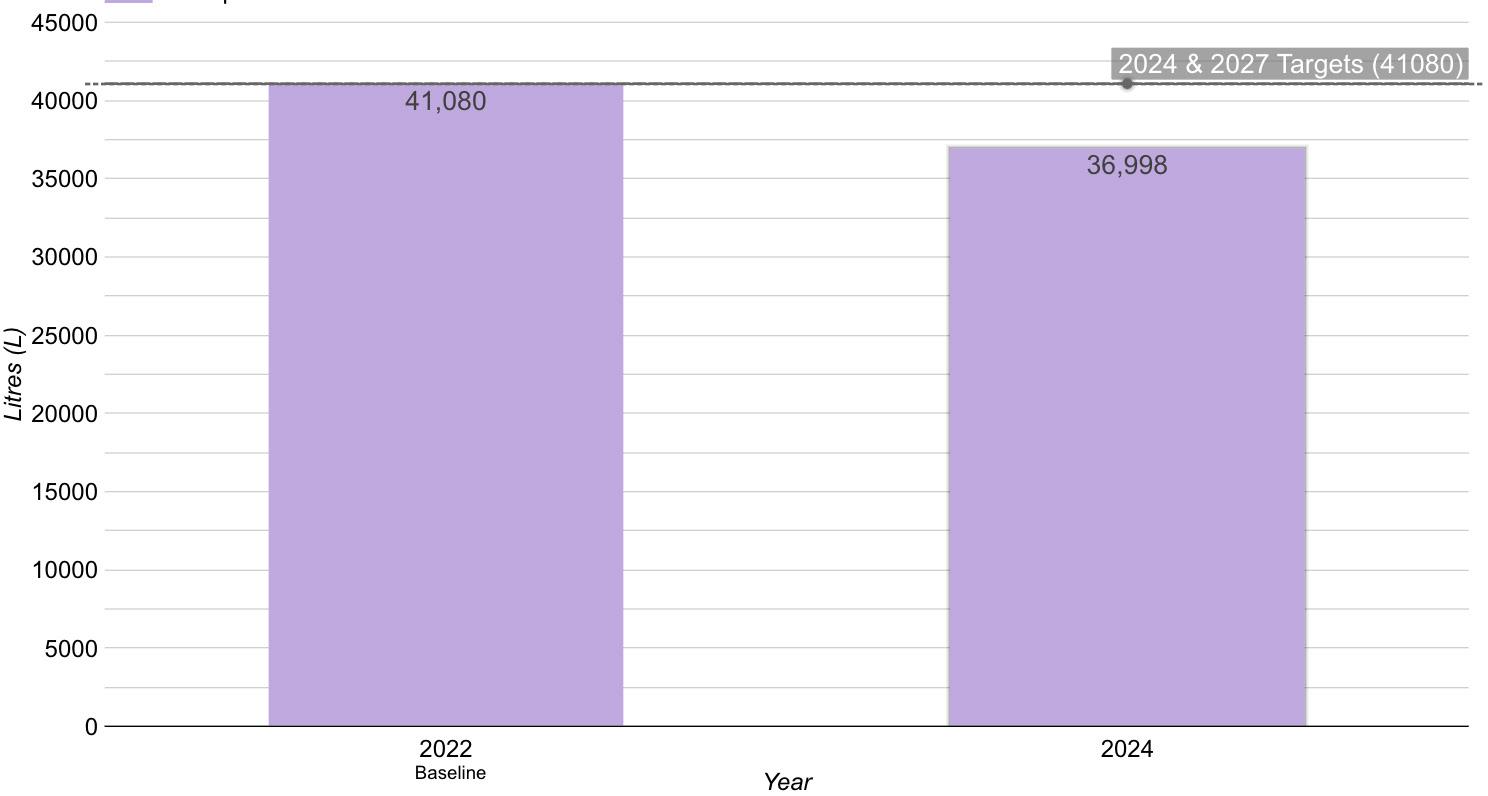
Figure 8 shows fuel consumption (Litres) from student road travel in 2024 with 2022 as the Baseline year. This overperformed against the 2024 target by 10% or 4082 L.
Milestone
Sustainable and Active Transport Policy defines principles to plan infrastructure.
Hybrid or electric vehicles are hired or purchased for education and business travel.
Sustainable and active transport is accessible and attractive to users.
Incorporate EV charging infrastructure on campus. 2027
Provide infrastructure for sustainable and active transport at each campus. 2027
Switch to hire of hybrid/EV buses and cars where available. Ongoing
Ensure hired buses and cars match size to the number of travellers to reduce emissions from the fleet. Ongoing
Implement and promote transport strategies at each campus for sustainable and active transport–walking, cycling, public transport and ride sharing.
2026
Figure 9.
Fuel consumption from program and maintenance road transport by year.
Figure 9 shows fuel consumption (Litres) from program and maintenance road travel (comprising leased and owned cars and owned tractors and mowers) in 2024. There is no target set in 2024 as this year establishes the baseline. Transport Maintenance – L
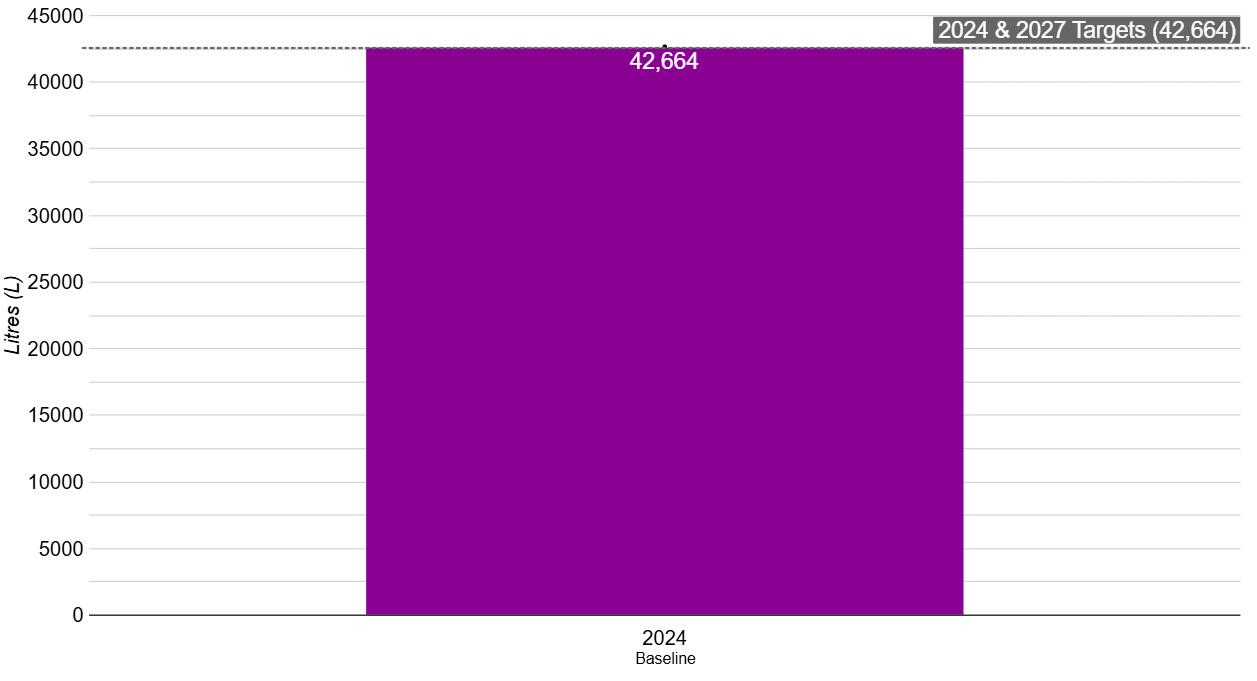
42,664 Litres
This represents the School consuming 42,664 L of fuel for program and maintenance road transport in 2024.
Distance travelled for air transport in 2024. Figure 10.
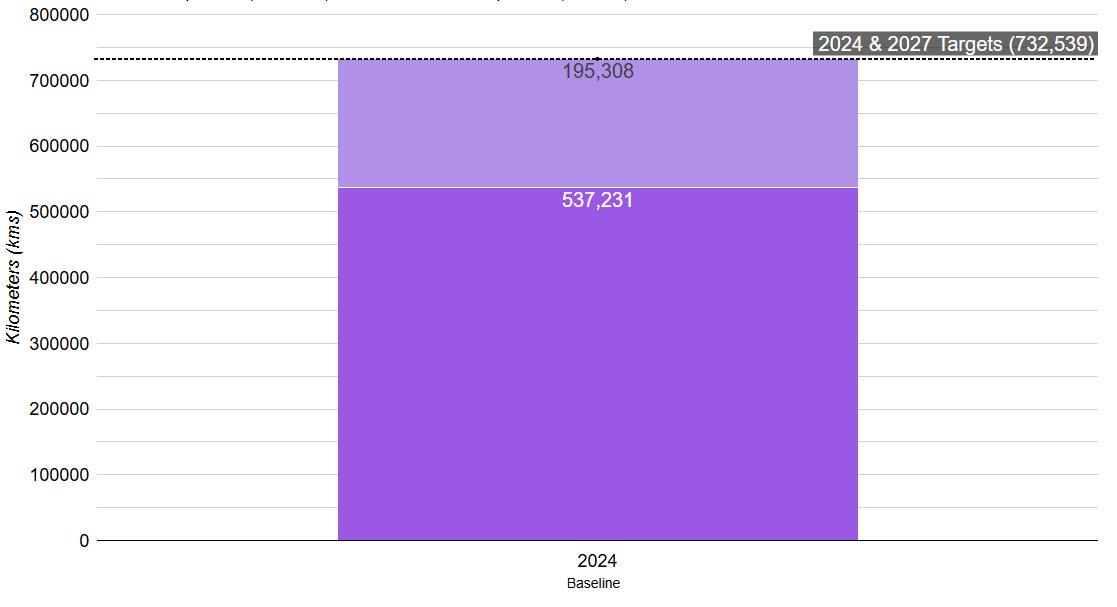
Figure 10 illustrates the total distance (km) of air transport in 2024. There is no target set in 2024 as this year establishes the baseline.
The data has been split into 2 categories: business which includes kms travelled by staff and student which includes kms travelled by students.
195,308 Litres
This represents the School consuming 195,308 L of fuel for student air transport in 2024.
537,231 Litres
This represents the School consuming 537,231 L of fuel for business air transport in 2024.
This represents the School consuming 3.5% less water than the annual target.
In 2024, we committed to better understanding our water use and infrastructure across all campuses. As part of this, we will conduct comprehensive water audits to map existing rainwater, stormwater and drainage systems.
These audits will help us identify opportunities to improve water efficiency, increase rainwater capture, and reduce runoff. The insights gained will guide future upgrades and initiatives to support more sustainable water management across the chool.
20,413 kL
20,413 kL of water was consumed.
Proportion of water usage has decreased by 17% since 2022 (baseline year).
Figure 11.
Water consumption (kL) by year.
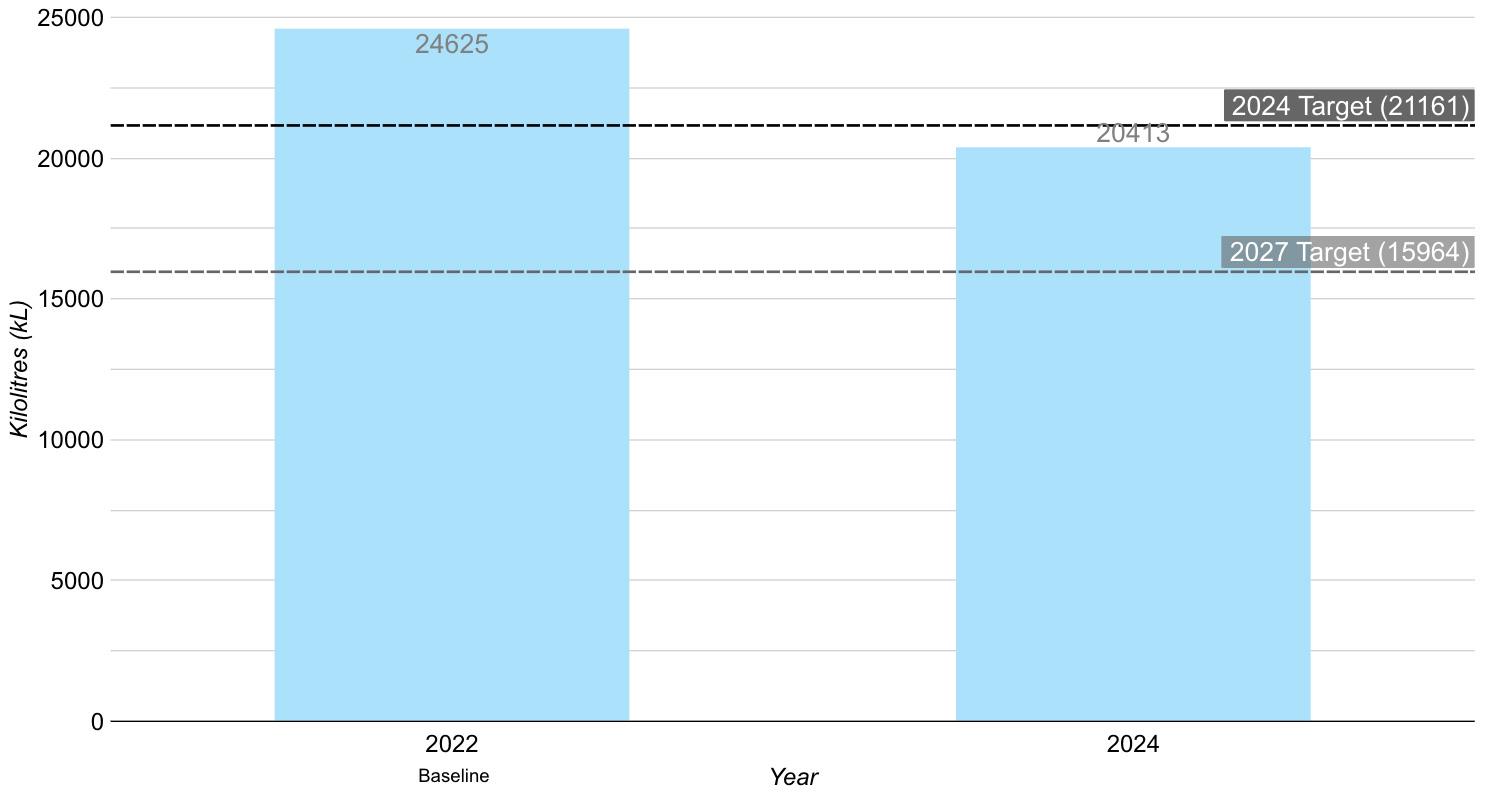
Figure 11 illustrates the annual water usage. This overperformed against the 2024 target by 3.5% and is a 17% decrease from the baseline year.
Water audits conducted at each campus to identify infrastructure and consumption.
Identify existing rainwater, stormwater and drainage infrastructure and areas for improvement. 2026
Conduct water-conservation and water-saving activities with students. 2026
Inventory of water assets and infrastructure at each campus. Include water-saving and water-efficiency infrastructure guidelines in the Sustainable Purchasing and Procurement policy. 2025
Design standards for sustainability in the masterplan to inform minimum water conservation initiatives for future renovation and building works. 2026
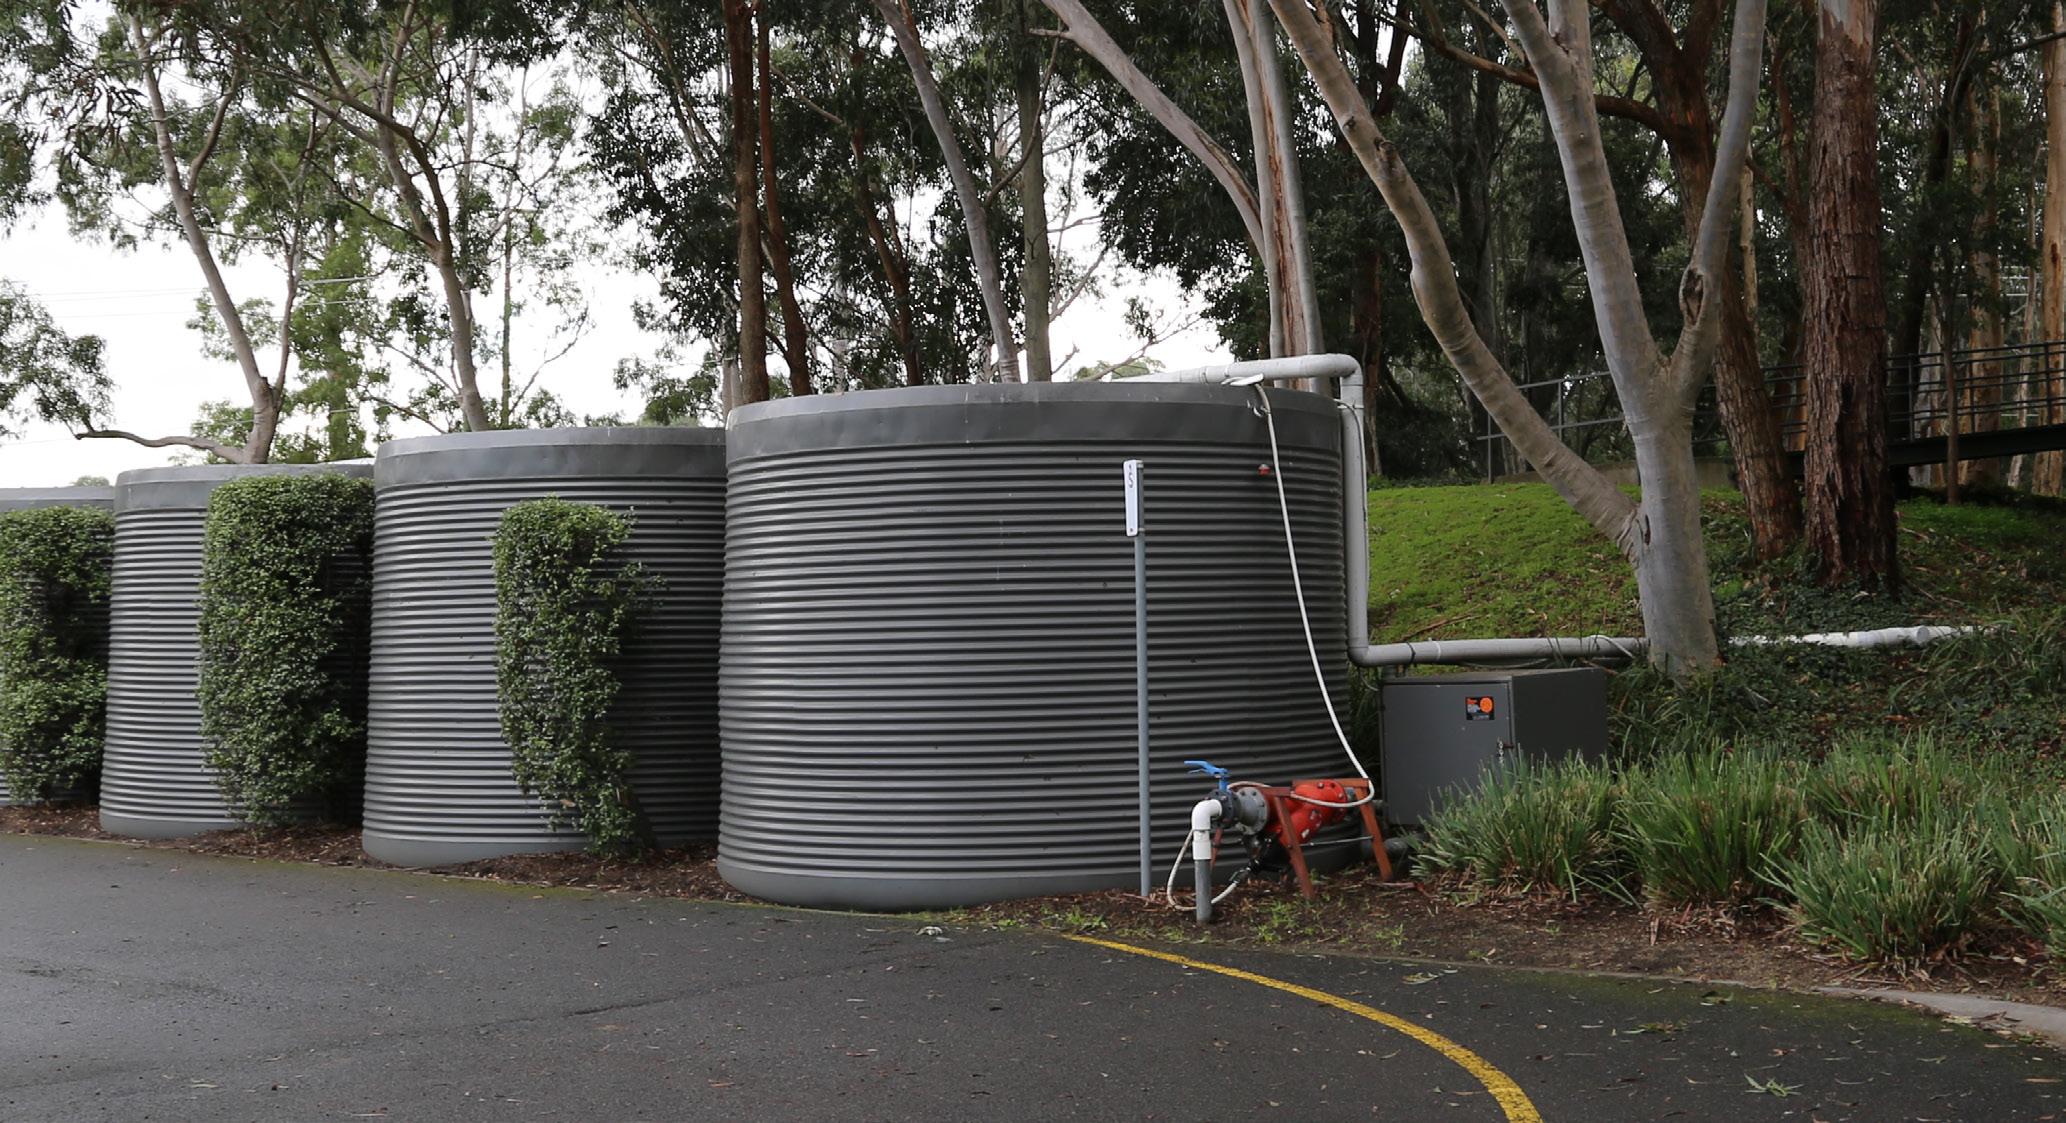
Water infrastructure expanded to rainwater catchment and reuse.
Create and implement a water-sensitive, integrated water management strategy to reduce mains water usage, improve water efficiency data and systems and protect local waterways and resources (e.g. toilets flushed with rainwater, irrigation connected to rainwater tanks).
Bulleen pool rainwater tanks to be connected to a filter and used to supplement pool water.
2026
2026
2 points
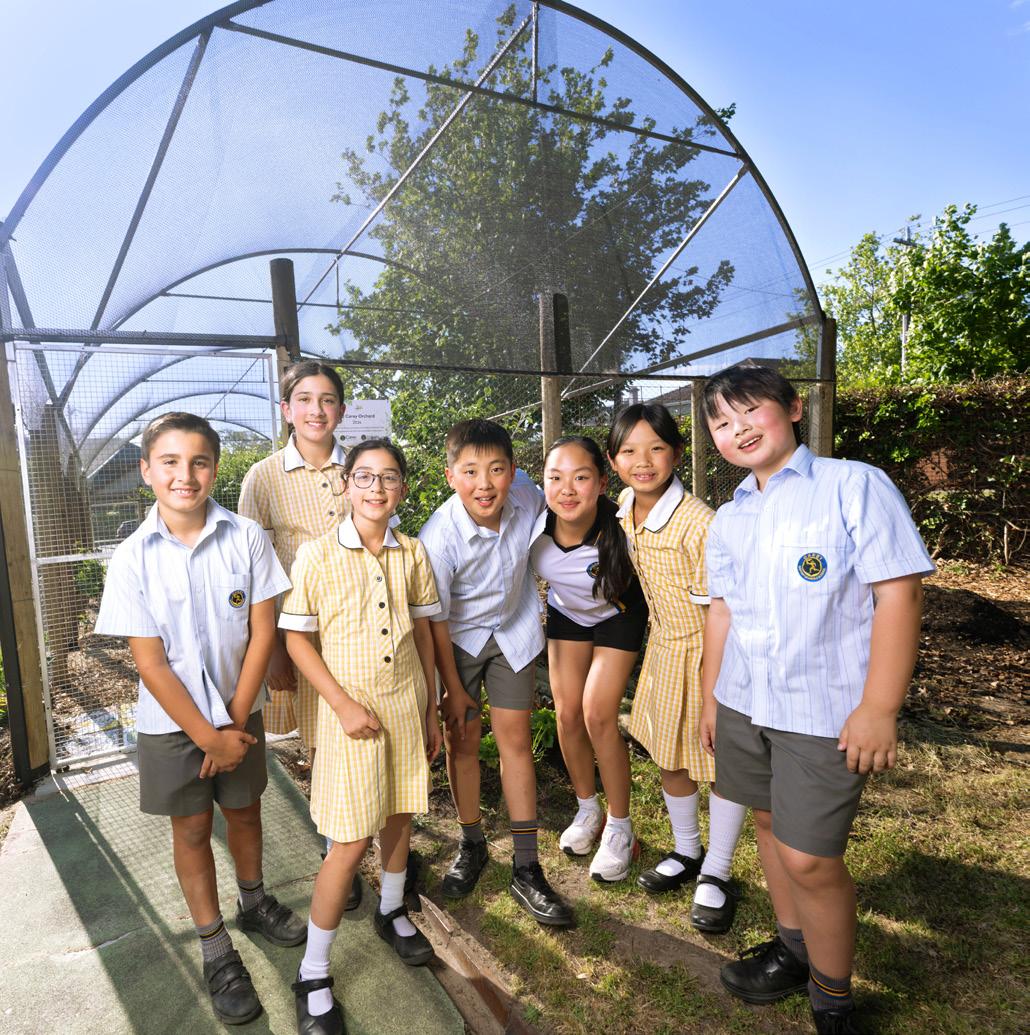
Our green spaces continue to grow – both in size and in impact. In 2024, a new wildlife garden was established in the Middle School, supported by a City of Boroondara Council grant. This space provides vital habitat for local species and a hands-on learning opportunity for students.
Annual biodiversity audits at all campuses help us monitor ecological health and guide future planting and conservation efforts. Through the Carey Zero program, students are actively engaged in exploring and understanding the value of green spaces, fostering a deeper connection to nature and environmental stewardship.
18 points
The Donvale campus HQAS is just two points short of the 2024 target.
The Kew campus HQAS is 18 points short of the 2024 target.
Figure 12.
Biodiversity habitat quality improvement.
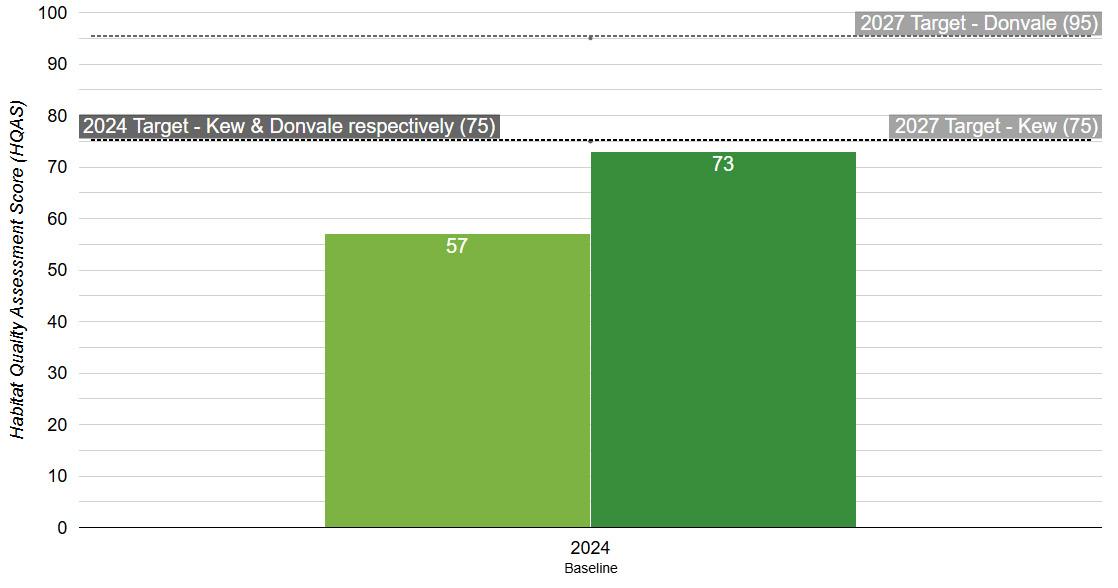
Figure 12 shows the Habitat Quality Assessment Score (HQAS): baseline score for Kew (57/100) and Donvale (73/100) set in 2024. A 2027 target of 75/100 and 95/100 respectively, reflects a 30% improvement.
Milestone
Green Spaces Improvement Plan leads to increased habitat quality at each campus.
Grounds planning includes climate resilient and watersensitive landscapes to meet climate adaptation needs.
Student and staff learning utilises green spaces to nurture nature connection and wellbeing.
Create clear planning and procurement guidelines to protect and enhance climate-resilient, watersensitive and biodiverse green spaces.
Conduct Annual Biodiversity Audits at all campuses.
Increase the quality of habitat to help native plant and animal species and local ecosystems thrive, with native plants, pollinator gardens and soil management programs prioritised.
Create a wildlife garden in the Middle School through a City of Boroondara Council grant.
Engage students to increase their awareness levels of green spaces through Carey Zero.
Connect the School community to local places by learning about native plant and animal species found in adjacent parks.
Help care for Country by partnering with local First Nations communities and learning from and celebrating their ecological and cultural knowledge.
2027
Ongoing
Ongoing
2025
2025
2025
Ongoing

April 2025
Disclaimer
CERES Consulting has prepared this document for Carey Baptist Grammar School, hereinafter “the Client”, based on an agreed scope of work and acts in all professional matters as an advisor to the Client and exercises all reasonable skill and care in the provision of its professional services in a manner consistent with the level of care and expertise exercised by members of the environmental profession.
The document is commissioned by and prepared for the exclusive use of the Client. This is subject to and issued in accordance with the agreement between the Client and CERES Consulting. No responsibility is accepted for the use of or reliance upon this document in whole or in part by the Client or any third party. The document is prepared with information supplied by the client and other stakeholders. While care is taken to ensure the veracity of information sources, no responsibility or liability (including arising from negligence) is accepted for information that is withheld, incorrect or that is inaccurate. This document has been compiled at the level of detail specified in the scope of work and no responsibility is accepted for interpretations made at more detailed levels than so indicated, by the Client or by other parties.
CERES Consulting is not responsible and will not be liable to any other person or organisation for or in relation to any matter dealt within this document, or for any loss or damage suffered by any other person or organisation arising from matters dealt with or conclusions expressed in this document (including without limitation matters arising from any negligent act or omission of CERES Consulting or for any loss or damage suffered by any other party relying upon the matters dealt with or conclusions expressed in this document). The concepts and information contained in this document are the property of CERES Consulting unless otherwise stated. Use or copying of this document in whole or in part without the written permission of CERES Consulting constitutes an infringement of copyright.
External facilities
Investments
Operational Boundary 1–3
Activity and assets at Carey Baptist Grammar School.
Focus is on campus operations with Scope 3 inventory being built out. Energy 1–3
Scope 2 and 3 of purchased electricity.
Scope 1 of purchased gas.
Scope 3 fuel consumption of vehicles hired by the school for student road transport, and program and maintenance road transport using leased vehicles.
Office supplies and consumables
Services such as printing, catering, courier and marketing
Electricity purchased from Grid is 100% GreenPower. This applies to all campuses with Camp Zero joining from October 2024.
Transport 1 and 3
Scope 1 fuel consumption of vehicles owned by the school for program and maintenance road transport.
Scope 3 emissions of air travel for student activities and business purposes.
Staff and student commuting
Consolidation of emissions from program and maintenance road transport commenced in 2024.
Consolidation of emissions from student and business air transport commenced in 2024.
All Scope 3 categories not mentioned in inclusions above
Assumed 0 GHG emissions from food waste composting.
No data collected as of 2024.
Discussed with School possible inclusions of Scope 3 in the future.
Table 2. Greenhouse Gas Emissions Factors for 2024.
National Greenhouse Accounts Factors: August 2023, Table 1 p.7 August 2024, Table 1 p.8
National Greenhouse Accounts Factors: August 2023, Table 1 p.7 August 2024, Table 1 p.8
Table 2 (Cont.). Greenhouse Gas Emissions Factors for 2024.
National Greenhouse Accounts Factors: August 2023, Table 9 p.24
August 2024, Table 9 p.25
National Greenhouse Accounts Factors: August 2023, Table 9 p.24
August 2024, Table 9 p.25
For business transport: Using DEFRA factors with RF. Excludes overseas hotel and car rental associated emissions as minimal.
For student transport: Relevant factors from the International Civil Aviation Organisation (ICAO) emissions calculator.
School’s travel agent for business.
ICAO Carbon Emissions Calculator (Flights) for students.
Greenhouse gas (GHG) inventory and management plan 2020-2021.
Please note that since the Department of Climate Change, Energy, Environment and Water (DCCEEW) publishes the Australian National Greenhouse Accounts Factors for 2024 in August 2024, all the emission factors for first two quarters (Q1 and Q2) of the Report use 2023 factors, while the emission factors used for Q3 and Q4 use 2024 factors.
For GHG emissions factors used before 2023-24, please contact consulting@ceres.org.au for the relevant data.
Table 3. Data assumptions and changes for 2024.
Targets
Baseline year (2022)
Assumptions and Changes
• 2027 targets based on student numbers use 2692 (2024 student numbers).
• Emissions target for 2027 is based on the most recent emissions factors when Baseline Report was released (2022). Note these are still the same for gas, water, landfill and diesel/ ULP in 2024.
• 2024 Transport Program and Maintenance target updated to 2024 actual fuel use (first year of complete data)
• Transport Program and Maintenance targets do not change up to 2027, thereby 10% reduction each year for 2028 to 2030.
• Recycling target: Slight variation from baseline report as 2022 recycling rate was previously calculated as the average of all campus vs actual rate for all campus combined.
• 2024 Biodiversity Target: For both Kew and Donvale campuses = 75/100.
• No air transport targets were set at the time of the ‘Carey Performance against Targets-2024’ presentation. 2024 was the first year of complete data therefore 2024 target updated to actual emissions and kms. There are no reduction targets for kms of air travelled. Carey confirming plan for air travel offset (target emissions to be updated accordingly).
• Electricity target (previously 0) now reflects Camp Zero moving to GreenPower only after October 2024.
• Gas targets updated to exclude decommissioned Cluney gas meter, previously included in baseline.
• Water targets updated due to update to one of the two 20 Wrixon St, Kew meters which was not read between April 2022 and July 2024. Associated portion of usage added to 2022. This affected calculations of the subsequent targets.
• Road Transport (student) reductions are from 2028–30 (on the basis that a new sports facility is being constructed by 2028). No reduction target between 2022 and 2027 (4% yearly reduction from 2028 to 2030).
• A second gas meter prev under Cluny ‘53104895589’ has been demolished–hence removed from reporting and baseline as requested by Carey.
• Water meter #YGA0178T usage added in 2025 – meter had not been read since 6 October 2022 until August 2024. Added to relevant months of baseline.
• Transport Program and Maintenance baseline is 2024 (first year of complete data). 2022 data was based on a fleet of only 12 vehicles and actual fuel usage wasnt available at the time (estimated instead) whereas 2024 data contains actual fuel usage from 27 vehicles (leased and owned) plus the School’s own tractors and mowers – therefore 2024 actual data is significantly higher and more reliable.
• Air Transport baseline is 2024 (first year of complete data).
Gas: December Camp Zero tank usage.
Transport maintenance: only two vehicles have data for November and there are no data for December (2024).
Data missing at the time of this report
Other assumptions
Water:
• 2024 Donvale Meter – November and December no bill provided.
• Bulleen River pump not in use since late 2023. No usage for 2024.
• 2024 Toonallook Meter – November and December bill not provided.
• 2024 Bulleen Meter, 169 Bulleen Rd – November and December bills missing.
• 2024 Camp Zero – Bills missing for period June to December.
• Road transport student: assumptions for gaps in Panorama data – used average l/kms of existing data for litres missing, used similar routes kms for missing kms and/or used destination location, and multiplied by two when two coaches.
• Maintenance 2024 fuel usage data also includes school program vehicles, these have been kept separate from ‘Transport Road Student’ data (from Panorama) and are included in the Transport Program and Maintenance category.
• Waste: Bin weights are missing regularly from data provided. In those instances, a NGA waste density factor was used to estimate and assume bins are full.
• Waste: No monthly data available for Toonallook campus.
• Monthly P&C recycling estimated based on fortnightly collection during program only –approx 100 days per year or seven collections per year of 2 x 1100 L bins. Same weight applied every month 2024.
• Green waste accounts for 70% of total recycling. Carey confirmed this data is correct and reflects the high volume of lawn clippings.
Figure 13.
Total electricity (kWh) consumption by campus.
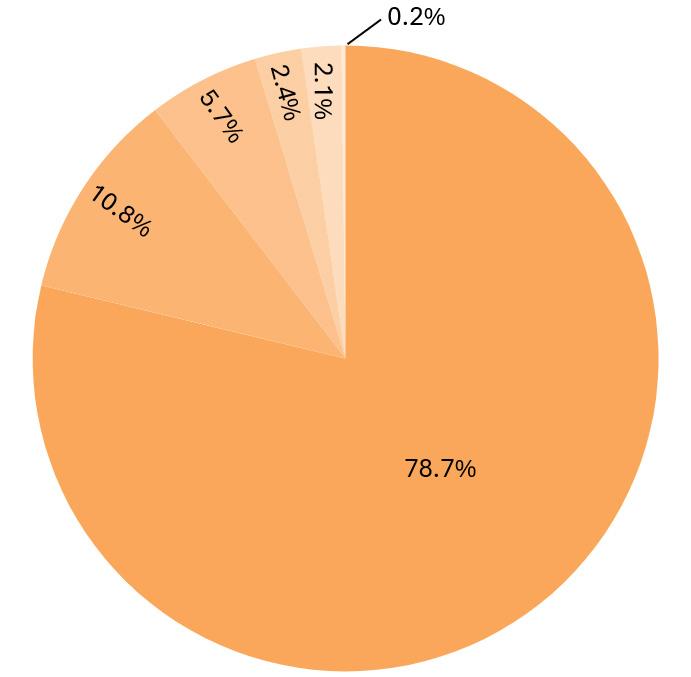
Figure 13 shows the breakdown of electricity consumption in 2024 across all campuses and sites. The Kew campus is the most significant electricity user, taking up 79% of electricity consumption in 2024, followed by Bulleen with 11%.
Figure 14.
2024 Electricity (kWh) consumption by month.
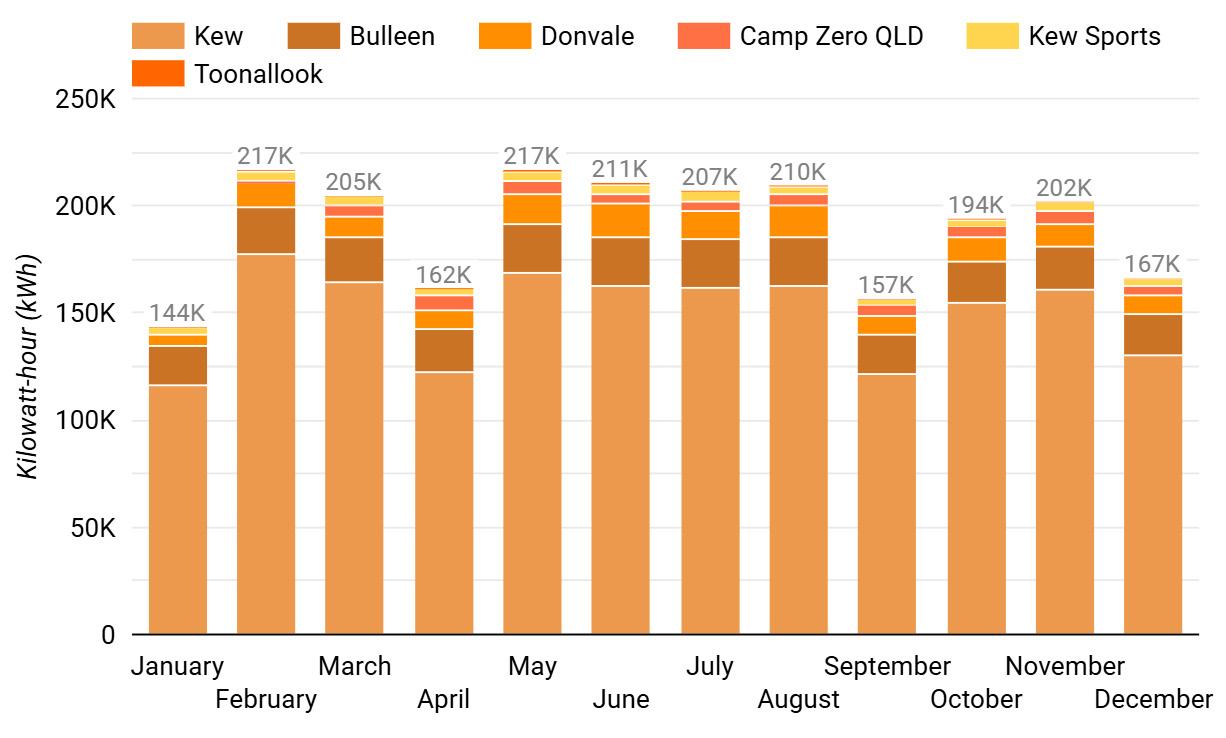
Figure 14 shows the monthly breakdown of electricity consumption in 2024 across all campuses and sites, with the least intensive months coinciding with term breaks and fewer staff and students on campus.
Figure 15.
Total Gas (MJ) consumption by campus.
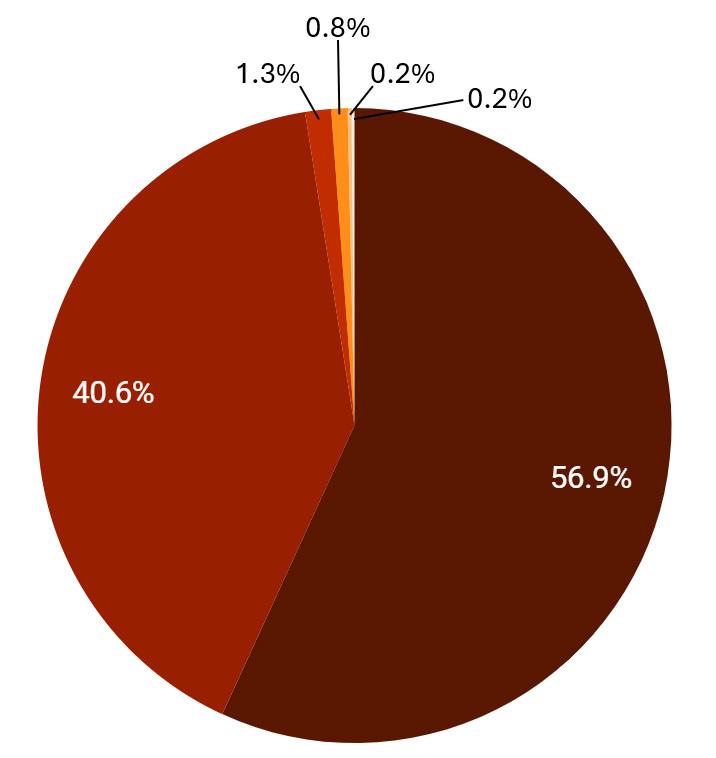
Figure 15 shows the breakdown of gas use in 2024 across all campuses and sites. The Kew campus has the highest gas consumption, taking up 57% of gas consumption, and Bulleen following with 41%.
Figure 16.
2024 Gas (MJ) consumption by month.
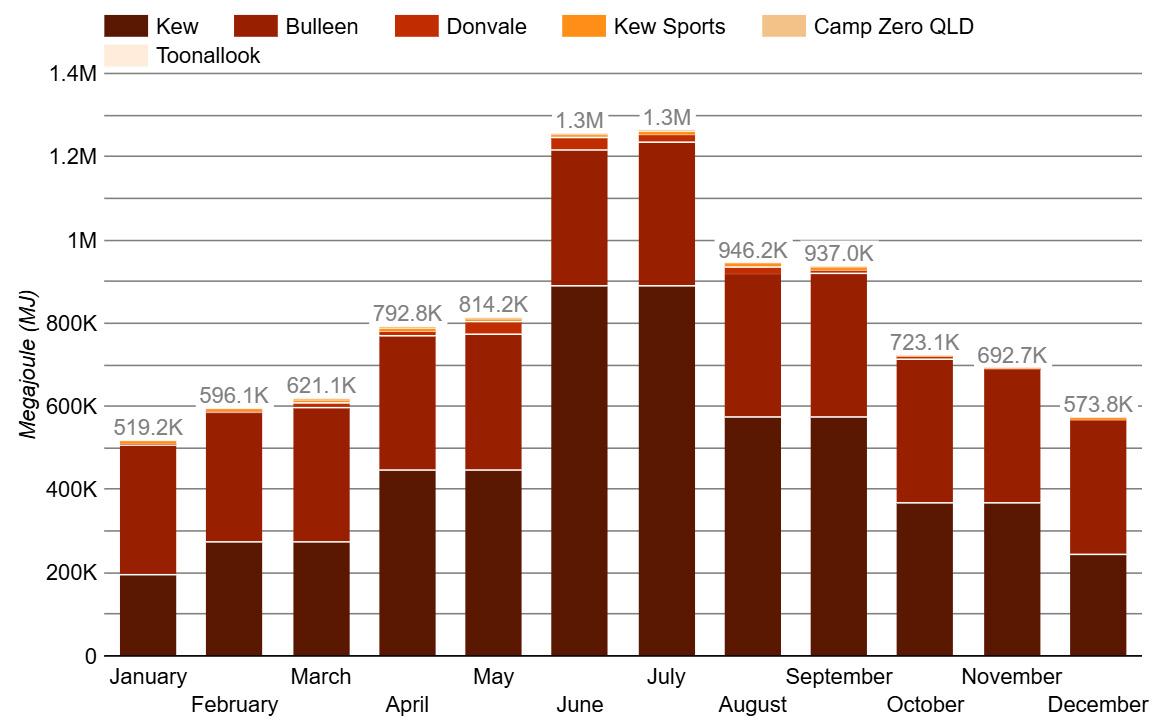
Figure 16 shows the monthly breakdown of gas use in 2024 across all campuses and sites, with the most intensive months coinciding with winter heating.
17.
Total Landfill (t) consumption by campus.
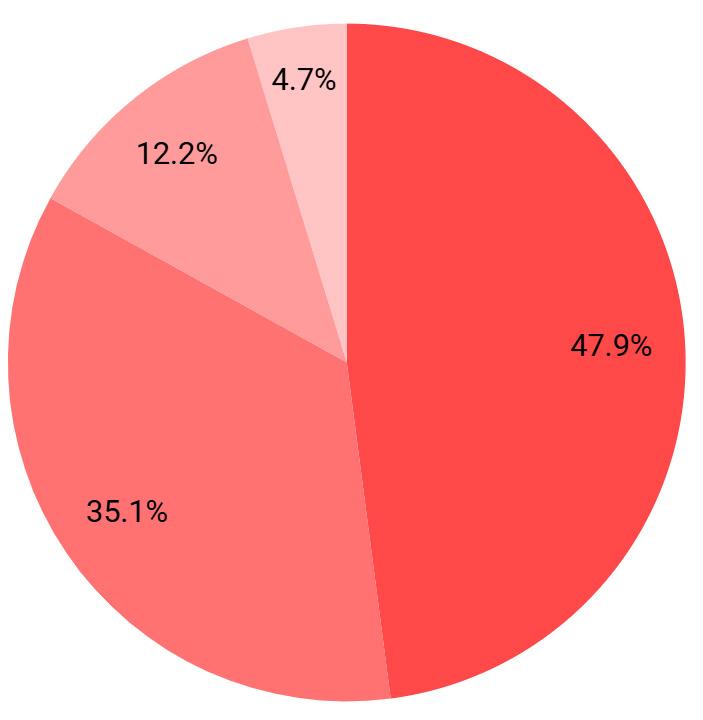
Figure 17 shows the breakdown of waste to landfill in 2024 across all campuses excluding Camp Zero QLD. The Kew campus has the highest generation, making up 48% of landfill waste, and Donvale following with 35%.
18.
2024 Landfill (t) generation by month.
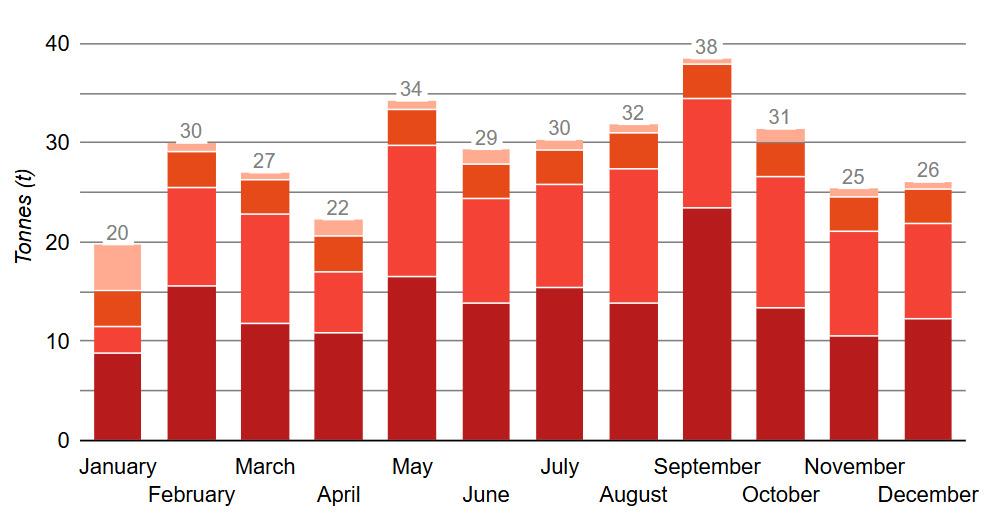
Figure 18 shows the monthly breakdown of waste to landfill in 2024 across all campuses excluding Camp Zero QLD.
19.
Total Recycling (t) by campus.
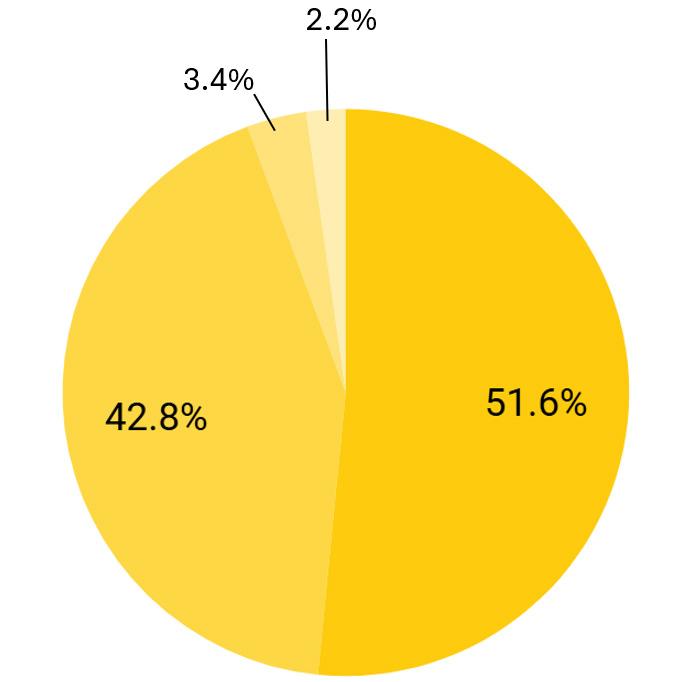
Figure 19 shows the breakdown of recycling in 2024 across all campuses excluding Camp Zero QLD. The Kew campus has the highest generation, making up 48% of landfill waste, and Donvale following with 35%.
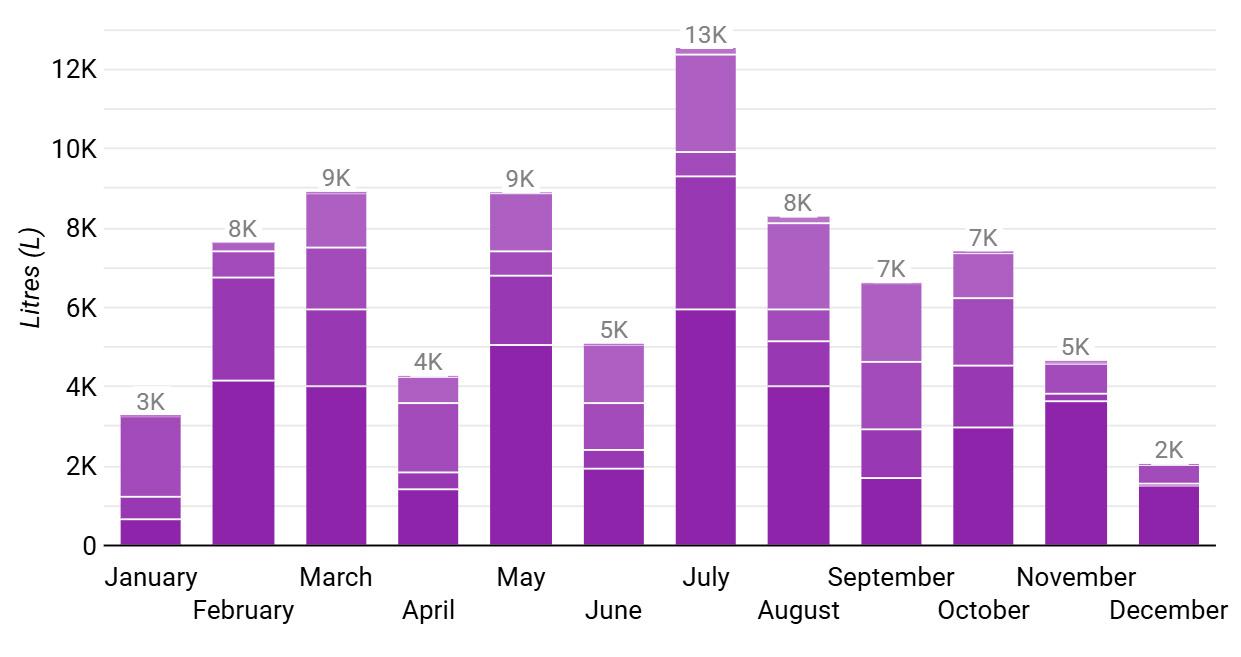
20.
(t) streams by month.
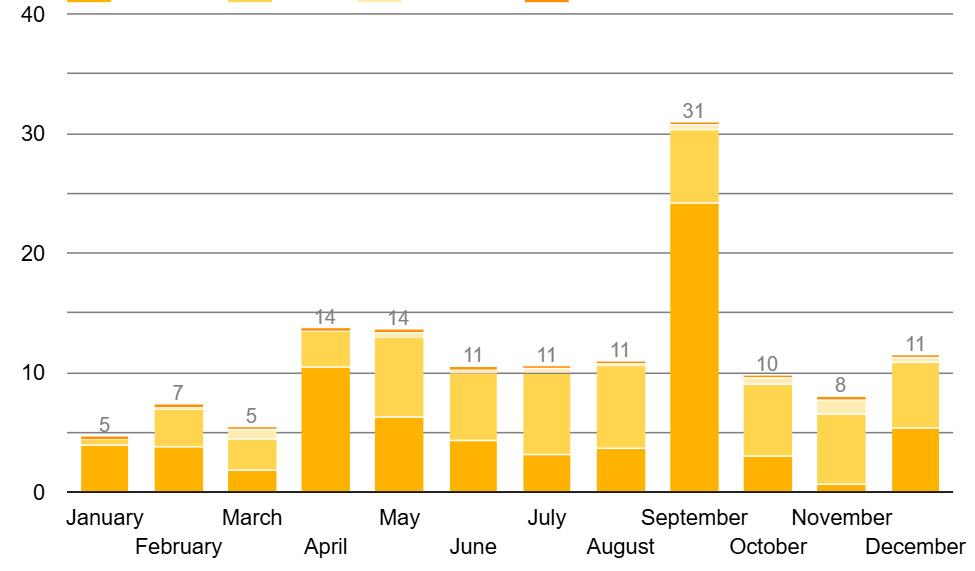
Figure 20 shows the monthly breakdown of recycling streams in 2024. The largest stream of materials or resources is Green Waste from lawn clippings which makes up 70% of all recycling in 2024. To help close the loop on FOGO (Food Organics and Garden Organics), a green waste composting facility will be installed at the Kew campus.
Figure 21.
Total 2024 Paper (sheets) consumption by month.
– sheet
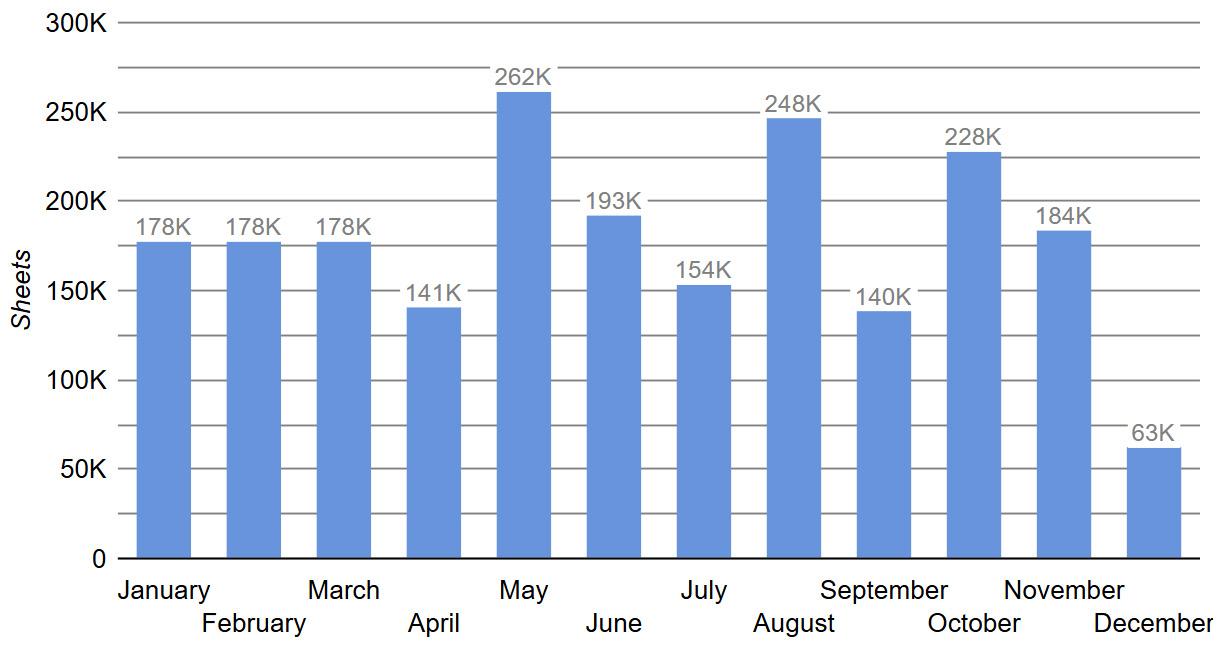
Figure 21 shows the breakdown of paper (sheets) in 2024 by month.
Note: Paper data is provided for all campuses combined (breakdown per campus is not available from the Paper Cuts reports used). Q1 monthly paper usage was estimated from the quarterly total provided.
Figure 22.
Total Fuel consumption (L) from road transport by month.
22 shows the breakdown of fuel consumption by month.
Figure 23.
Total Fuel consumption (L) from road transport by campus.
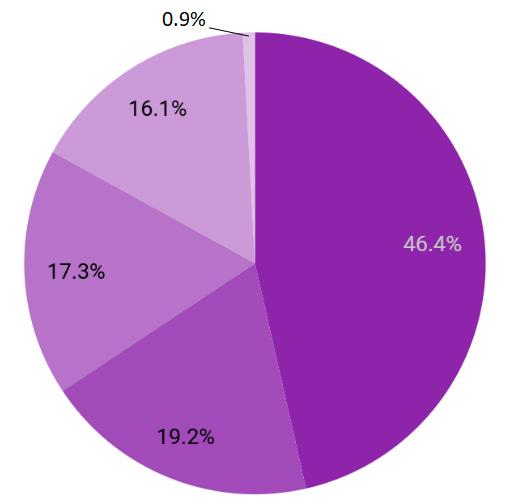
Figure 23 shows the breakdown of fuel consumption across all campuses.
Note: 'All' refers to student transport fuel usage school-wide and accounts for 46% of all transport fuel usage. The usage shown for each campus refers to fuel usage associated with Transport for Program and Maintenance (53.5% of all transport fuel usage in total) – Kew, Bulleen and Camp Zero each use 17.5% of all transport fuel use on average and the Donvale campus use is minimal.
Figure 24.
Total distance (km) travelled for Air Transport in 2024 by month.
Air (student) – kms
Transport Air (business) – kms
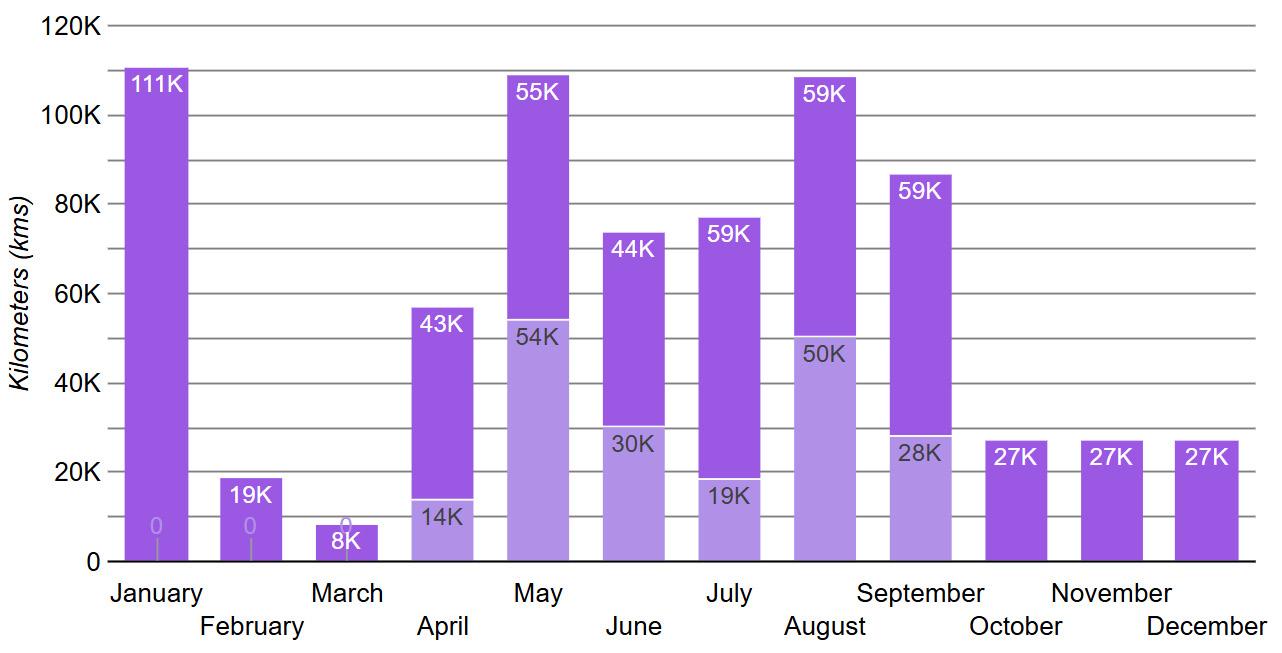
Figure 24 shows the monthly breakdown of distance (km) travelled for air transport by students and staff business in 2024.
Note: All Air Transport data is allocated to the Kew campus as directed. January air transport (111,000 kms) is very high as it includes trips to the UK and USA.
25.
Total 2024 Water (kL) consumption by month.
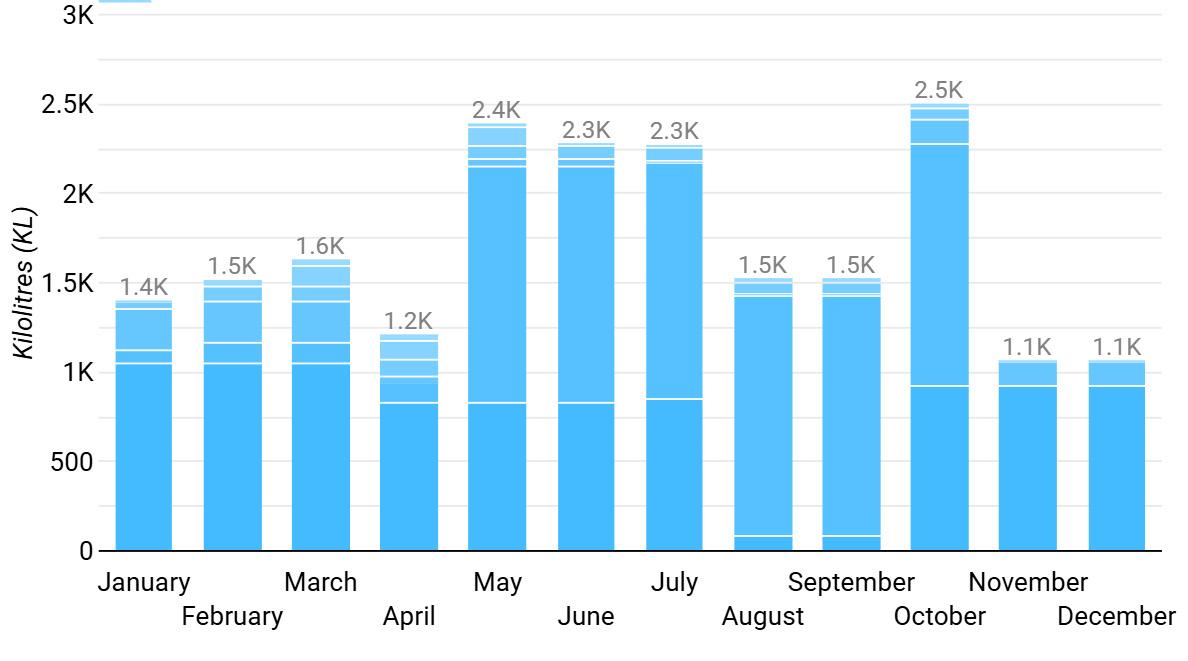
Figure 25 shows the monthly breakdown of water consumption across all campuses.
26.
Total 2024 Water (kL) consumption by campus.
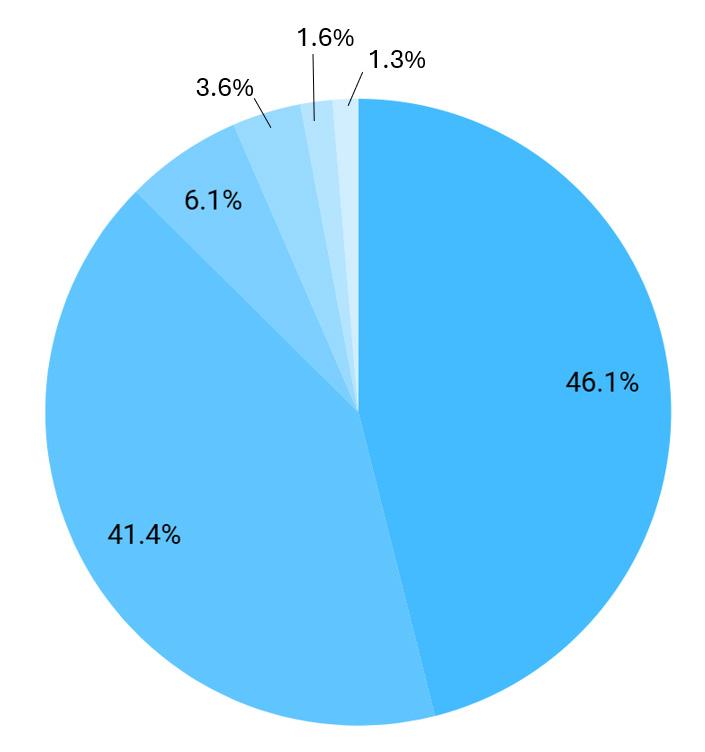
Figure 26 shows the breakdown of water consumption (L) in 2024 across all campuses and sites. The Kew campus is consuming the most water at 46%, followed by Bulleen at 41%.