Workflow process
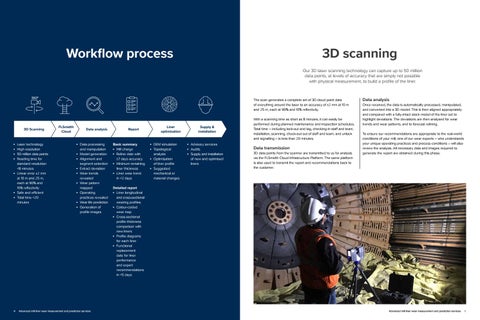
3D scanning Our 3D laser scanning technology can capture up to 50 million data points, at levels of accuracy that are simply not possible with physical measurement, to build a profile of the liner.
The scan generates a complete set of 3D cloud point data of everything around the laser to an accuracy of ±2 mm at 10 m and 25 m, each at 90% and 10% reflectivity.
3D Scanning
■ ■ ■ ■
■
■ ■
Laser technology High resolution 50 million data points Reading time for standard resolution <8 minutes Linear error ±2 mm at 10 m and 25 m, each at 90% and 10% reflectivity Safe and efficient Total time <20 minutes
FLSmidth Cloud
Data analysis
■
■ ■
■ ■
■
■
■ ■
4
Data processing and manipulation Model generation Alignment and segment selection Extract deviation Wear trends revealed Wear pattern mapped Operating practices revealed Wear life prediction Generation of profile images
Advanced mill liner wear measurement and prediction services
Liner optimisation
Report
Basic summary Mill charge ■ Reline date with ±7 days accuracy ■ Minimum remaining liner thickness ■ Liner wear trend in <2 days ■
■ ■
■
■
EM simulation D Topological analysis Optimisation of liner profile Suggested mechanical or material changes
Supply & installation
■ ■ ■
dvisory services A Audits Supply and installation of new and optimised liners
With a scanning time as short as 8 minutes, it can easily be performed during planned maintenance and inspection schedules. Total time – including lock-out and tag, checking-in staff and team, installation, scanning, check-out out of staff and team, and unlock and signalling – is less than 20 minutes.
Data transmission
3D data points from the scanner are transmitted to us for analysis via the FLSmidth Cloud Infrastructure Platform. The same platform is also used to transmit the report and recommendations back to the customer.
Data analysis
Once received, the data is automatically processed, manipulated, and converted into a 3D model. This is then aligned appropriately and compared with a fully-intact stock model of the liner set to highlight deviations. The deviations are then analysed for wear trends and wear patterns, and to forecast relining. To ensure our recommendations are appropriate to the real-world conditions of your mill, one of our wear experts – who understands your unique operating practices and process conditions – will also review the analysis. All necessary data and images required to generate the report are obtained during this phase.
Detailed report ■ Liner longitudinal and cross-sectional wearing profiles. ■ Colour-coded wear map ■ Cross-sectional profile thickness comparison with new liners ■ Profile diagrams for each liner ■ Functional replacement date for liner performance and expert recommendations in <5 days
Advanced mill liner wear measurement and prediction services
5
