HARRINGTON PARK - Sales Statistics (Houses)

Median Sale Price
Suburb Growth

Year # Sales Median Low Growth High 2005 170 $ 490,000 $ 45,000 $ 752,000 0.0 % 2006 151 $ 475,000 $ 25,469 $ 1,000,000 -3.1 % 2007 184 $ 455,750 $ 144,000 $ 795,000 -4.1 % 2008 129 $ 447,500 $ 5,100 $ 700,000 -1.8 % 2009 216 $ 479,975 $ 115,000 $ 715,000 7.3 % 2010 167 $ 540,000 $ 32,500 $ 920,000 12.5 % 2011 173 $ 545,000 $ 5,000 $ 1,050,000 0.9 % 2012 144 $ 538,750 $ 4,900 $ 1,475,000 -1.1 % 2013 183 $ 559,000 $ 130,000 $ 1,200,000 3.8 % 2014 284 $ 643,000 $ 73,471 $ 1,430,000 15.0 % 2015 264 $ 779,995 $ 100,000 $ 1,400,000 21.3 % 2016 207 $ 868,000 $ 255,000 $ 2,150,000 11.3 % 2017 198 $ 920,750 $ 65,000 $ 2,345,000 6.1 % 2018 146 $ 887,500 $ 8,200 $ 1,950,000 -3.6 % 2019 178 $ 915,000 $ 9,500 $ 9,322,550 3.1 % 2020 208 $ 1,032,500 $ 375,000 $ 2,650,000 12.8 % 2021 265 $ 1,300,000 $ 138,000 $ 2,780,000 25.9 % 2022 176 $ 1,462,500 $ 477,500 $ 5,500,000 12.5 % 2023 57 $ 1,530,000 $ 281,250 $ 2,880,000 4.6 %
+0.3% Previous Median Price: $1,470,000 Current Median Price: $1,475,000 Based on 355 recorded House sales compared over the last two rolling 12 month periods
$1.48m Based on 134 recorded House sales within the last 12 months (Financial Year 2023) Based on a rolling 12 month period and may differ from calendar year statistics Prepared on 12/07/2023 by Camden Property Agents. © Property Data Solutions Pty Ltd 2023 (pricefinder.com.au) The materials are provided as an information source only. © The State of New South Wales (Land and Property Information - LPI) July/2023. Contains property sales information provided under licence from the Department of Finance and Services, Land and Property Information (LPI) Issue Date: 10/07/23 and may be combined with property attribute data and photographs from other third party data sources. Ownership information derived from Non-Government sources. Please use as a guide only. Neither Veda nor LPI make any representations or warranties about accuracy, reliability, completeness or suitability of the data for any particular purpose and disclaims all responsibility and all liability (including without limitation, liability in negligence) for all expenses, losses, damages (including indirect or consequential damage) and costs which might be incurred as a result of the data being inaccurate or incomplete in any way and for any reason. Veda is authorised as a Property Sales Information provider of the Department of Finance and Services, Land and Property Information.


HARRINGTON PARK
Prepared on 12/07/2023 by Camden Property Agents. © Property Data Solutions Pty Ltd 2023 (pricefinder.com.au) The materials are provided as an information source only. © The State of New South Wales (Land and Property Information - LPI) July/2023. Contains property sales information provided under licence from the Department of Finance and Services, Land and Property Information (LPI) Issue Date: 10/07/23 and may be combined with property attribute data and photographs from other third party data sources. Ownership information derived from Non-Government sources. Please use as a guide only. Neither Veda nor LPI make any representations or warranties about accuracy, reliability, completeness or suitability of the data for any particular purpose and disclaims all responsibility and all liability (including without limitation, liability in negligence) for all expenses, losses, damages (including indirect or consequential damage) and costs which might be incurred as a result of the data being inaccurate or incomplete in any way and for any reason. Veda is authorised as a Property Sales Information provider of the Department of Finance and Services, Land and Property Information.
HARRINGTON PARK - Peak Selling Periods (3 years)
- Price Range Segments (12
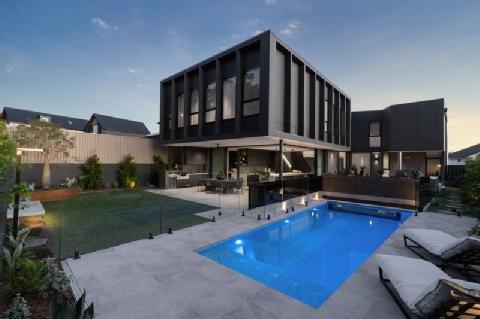


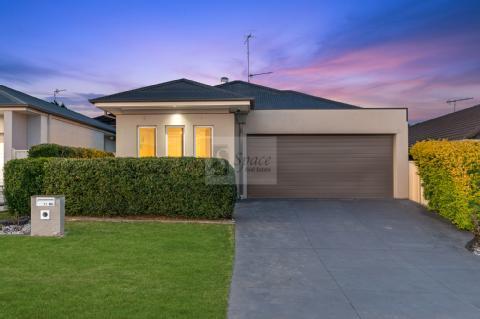


HARRINGTON PARK - Recently Sold Properties # Sold Properties 134 Based on recorded House sales within the 12 months (Financial Year 2023) Based on a rolling 12 month period and may differ from calendar year statistics Suburb Growth +0.3% Previous Median Price: $1,470,000 Current Median Price: $1,475,000 Based on 355 recorded House sales compared over the last two rolling 12 month periods Median Sale Price $1.48m Based on 134 recorded House sales within the last 12 months (Financial Year 2023) Based on a rolling 12 month period and may differ from calendar year statistics 12 HUGHES AVE 6 4 5 704 m² $3,550,000 Jul 2023 N/A 71 TURBOTT AVE 2 2 3 354 m² $1,015,000 Jun 2023 16 Days 7 GURGAR PL 2 2 4 574 m² $1,315,000 Jun 2023 49 Days 24 WILLIAM CAMPBELL AVE 2 2 4 510 m² $1,000,000 Jun 2023 28 Days 11 SORELL WAY 2 2 4 780 m² $1,470,000 Jun 2023 30 Days 16 HICKSON CCT 2 2 4 416 m² $1,125,000 Jun 2023 38 Days 2 JUSTIS DR 3 3 4 678 m² $1,720,000 Jun 2023 114 Days 5 DARLING CRES 2 2 4 413 m² $1,101,000 Jun 2023 19 Days 49 FORESTGROVE DR 3 5 4 700 m² $1,960,000 Jun 2023 21 Days Prepared on 12/07/2023 by Camden Property Agents. © Property Data Solutions Pty Ltd 2023 (pricefinder.com.au) The materials are provided as an information source only. © The State of New South Wales (Land and Property Information - LPI) July/2023. Contains property sales information provided under licence from the Department of Finance and Services, Land and Property Information (LPI) Issue Date: 10/07/23 and may be combined with property attribute data and photographs from other third party data sources. Ownership information derived from Non-Government sources. Please use as a guide only. Neither Veda nor LPI make any representations or warranties about accuracy, reliability, completeness or suitability of the data for any particular purpose and disclaims all responsibility and all liability (including without limitation, liability in negligence) for all expenses, losses, damages (including indirect or consequential damage) and costs which might be incurred as a result of the data being inaccurate or incomplete in any way and for any reason. Veda is authorised as a Property Sales Information provider of the Department of Finance and Services, Land and Property Information.


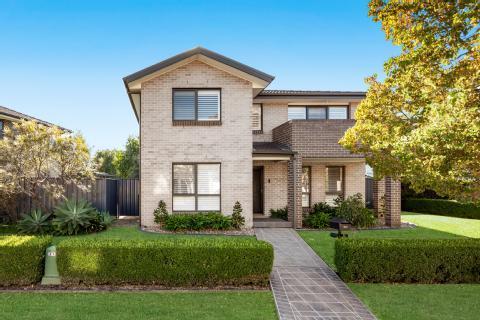
50 ALEXANDRA CRES 3 2 5 717 m² $1,725,000 May 2023 9 Days 26 RUTHERFORD CCT 2 2 4 702 m² $2,125,000 May 2023 117 Days 1 TIFFEN ST 2 2 4 800 m² $1,469,220 May 2023 4 Days 5 GRETA AVE 3 4 6 773 m² $2,000,000 May 2023 11 Days 29 ROYAL GEORGE DR 3 2 5 707 m² $1,495,000 May 2023 6 Days 41 ROYAL GEORGE DR 2 2 4 545 m² $1,015,000 May 2023 5 Days 8 MEEHAN TCE 2 2 4 508 m² $1,100,000 May 2023 6 Days 3 LOWRY CL 3 3 5 895 m² $1,850,000 May 2023 188 Days 5 YELLILONG PL 4 6 7 939 m² $2,660,000 May 2023 26 Days 74 JENOLAN CCT 4 2 4 900 m² $1,863,000 May 2023 19 Days 13 ABERCROMBIE PL - - - 3,331 m² $1,500,000 Apr 2023 N/A 7 MELVILLE CRT 2 2 4 697 m² $1,600,000 Apr 2023 59 Days Prepared on 12/07/2023 by Camden Property Agents. © Property Data Solutions Pty Ltd 2023 (pricefinder.com.au) The materials are provided as an information source only. © The State of New South Wales (Land and Property Information - LPI) July/2023. Contains property sales information provided under licence from the Department of Finance and Services, Land and Property Information (LPI) Issue Date: 10/07/23 and may be combined with property attribute data and photographs from other third party data sources. Ownership information derived from Non-Government sources. Please use as a guide only. Neither Veda nor LPI make any representations or warranties about accuracy, reliability, completeness or suitability of the data for any particular purpose and disclaims all responsibility and all liability (including without limitation, liability in negligence) for all expenses, losses, damages (including indirect or consequential damage) and costs which might be incurred as a result of the data being inaccurate or incomplete in any way and for any reason. Veda is authorised as a Property Sales Information provider of the Department of Finance and Services, Land and Property Information.

