UK INNOVATION REPORT 2023


Benchmarking the UK’s industrial and innovation performance in a global context
Institute for Manufacturing, University of Cambridge

March 2023


2 Table of contents List of charts 3 Introducing the UK Innovation Report 4 What makes the report different? 5 Introduction 6 Contributors and acknowledgments 7 Executive Summary 8 Theme 1: Structure and performance of the UK economy 12 Theme 2: Investment in innovation 25 Theme 3: Industrial performance – focus on the aerospace and food & beverages manufacturing sectors 44 Theme 4: Science and engineering workforce 86 Theme 5: Environmental innovation 95
List of charts
Theme 1: Structure and performance of the UK economy
Chart 1.1. Structure of the UK economy

Chart 1.2. Labour productivity by country and region
Chart 1.3. Sectoral labour productivity by country and region
Chart 1.4. Sectoral labour productivity growth by country and region
Chart 1.5. Value-added and employment shares by sector, country and region
Chart 1.6. Change in value-added and employment shares by sector, country and region
Chart 1.7. Intra-industry productivity growth effect: top and bottom five sectors in the UK
Chart 1.8. Allocation effect: top and bottom five sectors in the UK
Chart 1.9. Total sectors’ contribution to aggregate labour productivity growth: top and bottom five sectors in the UK
Appendix 1.1 Sectors’ classification and statistical codes
Appendix 1.2 Decomposition of productivity growth
Theme 2: Investment in innovation
Chart 2.1. R&D intensity: international comparison (1/2)
Chart 2.2. R&D intensity: international comparison (2/2)
Chart 2.3. ONS revision of BERD methodology
Chart 2.4. UK BERD by company employment size
Chart 2.5. UK BERD by broad product group
Chart 2.6. UK BERD by detailed product group
Chart 2.7. UK BERD by Standard Industry Classification
Chart 2.8. Manufacturing R&D: international comparison
Chart 2.9. Government expenditure on R&D
Chart 2.10. Flows of research and development funding in the United Kingdom
Chart 2.11. Top R&D-investing companies in the world
Chart 2.12. Top 100 companies investing in R&D
Chart 2.13. Top origins of patent applications
Chart 2.14. Top 100 patent applicants at USPTO and EPO
Chart 2.15. Top 10 UK patent applicants at USPTO and EPO
Explainer: The “new” ONS methodology to calculate R&D expenditure in the United Kingdom
Theme 3: Industrial performance –focus on the aerospace and food and beverages manufacturing sectors
Chart 3.1. Aerospace manufacturing – value added and employees
Chart 3.2. UK aerospace – value added
Chart 3.3. UK aerospace – employees
Chart 3.4. UK aerospace – productivity
Chart 3.5. Aerospace manufacturing – trade balance
Chart 3.6. Aerospace manufacturing – global export market share
Chart 3.7. UK aerospace – trade balance
Chart 3.8. Aerospace – business spending on R&D (a)
Chart 3.9. Aerospace – business spending on R&D (b)
Chart 3.10. Food and beverages manufacturing – value added and employees
Chart 3.11. UK food and beverages manufacturing – value added
Chart 3.12. UK food and beverages manufacturing– employees
Chart 3.13. UK food and beverages manufacturing – productivity
Chart 3.14. Food manufacturing –trade balance
Chart 3.15. Beverages manufacturing –trade balance
Chart 3.16. Food manufacturing – global export market share
Chart 3.17. Beverages manufacturing – global export market share
Chart 3.18. UK food and beverages manufacturing – trade balance
Chart 3.19. UK food and beverages manufacturing – top export and import products
Chart 3.20. Food and beverages – business spending on R&D
Chart 3.21. UK food and beverages – business spending on R&D (BERD)
Appendix 3.1 Stakeholder consultation – aerospace and food and beverages manufacturing sectors
Theme 4: Science and engineering workforce
Chart 4.1. Graduates by subject area
Chart 4.2. Women in STEM tertiary education
Chart 4.3. International students in the UK
Chart 4.4. Graduates entering the workforce in the UK
Chart 4.5. Engineering profession salaries
Chart 4.6. Researchers by sector of employment
Chart 4.7. Women researchers
Theme 5: Environmental Innovation (special theme in this edition)
Chart 5.1. UK carbon emissions by sector
Chart 5.2. Government budget allocations for R&D (environment and energy innovation)
Chart 5.3. Innovation in environment-related technologies
Chart 5.4. Eco-innovation performance
Chart 5.5. UK environmental goods and services sector (EGSS)
Chart 5.6. UK environmental goods and services sector (EGSS) –international comparison
3
4
What makes the report different?
The aim of the UK Innovation Report is to facilitate policy discussions on innovation and industrial performance – and the interplay between them. While numerous sources of data on the topic of innovation exist, the UK Innovation Report aims to make a contribution by bringing together, in a single place, innovation and value-added indicators in a concise and accessible format.
Instead of structuring the report according to traditional input and output indicators, the intention of the report is to include data that provides rich quantitative representations of the vitality of both the UK’s innovation activity and its industrial performance in an international context.
An important theme throughout the report is the analysis of sectoral and regional data to better understand the drivers of national performance and provide more granular policy insights. While the report does not make specific policy recommendations, it does highlight areas where additional evidence and policy action may be required.
Motivation
To review the UK’s innovation and industrial performance and compare it with that of other selected countries;
To facilitate discussions on the relation between innovation and sectoral competitiveness; and
To contribute to the evidence base that is available to inform industrial and innovation policy.
5
Introduction
The UK Innovation Report 2022 reported last year a new Innovation Strategy, a new Office for Science and Technology Strategy and a new National Science and Technology Council. This year, the major institutional change has been the ministerial restructure in February 2023.
A new Department for Science, Innovation and Technology (DSIT) was created with the mandate to ensure the UK is “the most innovative economy in the world” and a “science and technology superpower”. DSIT published its Science and Technology Framework in March 2023 which identifies five critical technologies that the UK should focus on to build strategic advantage and commits £250m to ‘technology missions’ in three of them: artificial intelligence, quantum technologies and engineering biology. Among other changes, a new Department for Business and Trade has been created bringing together the business focused functions of the former Department for Business, Energy and Industrial Strategy (BEIS) and the Department for International Trade (DIT).
In November 2022 the Office for National Statistics (ONS) introduced a major revision to the methodology used to estimate R&D expenditure in the UK to give better coverage of smaller businesses, which have accounted for a growing amount of R&D activity.
What is new in this edition of the report?
Against this changing institutional context, the UK Innovation Report 2023 maintains last year’s core policy guiding questions but uses new datasets to address them from different angles. The report uses new indicators and longer time series, integrates additional data sources, and deep dives into different sectors.
Section 1 explores how productivity trends vary across UK regions and countries and the role of sector dynamics in these differences.
Section 2 analyses the latest data on R&D expenditure in the UK, discussing the implications of recent methodological changes introduced by the ONS.
Section 3 focuses on the performance of the aerospace and food & beverages sectors, incorporating insights from consultations with industry experts.
Section 4 updates the analysis of UK graduates in science, technology, engineering and mathematics (STEM) comparing the UK with international peers.
Section 5 analyses the UK’s economic and innovation performance in the environmental goods and services sector.
6
Contributors and acknowledgements
Cambridge Industrial Innovation Policy
Cambridge Industrial Innovation Policy (CIIP) is a global, not-for-profit policy group based at the Institute for Manufacturing (IfM), University of Cambridge. CIIP works with governments and global organisations to promote industrial competitiveness and technological innovation. We offer new evidence, insights and tools based on the latest academic thinking and international best practices. This report was delivered through IfM Engage, the knowledge transfer arm of the Institute for Manufacturing (IfM), University of Cambridge
IfM Engage, 17 Charles Babbage Road, Cambridge, CB3 0FS, United Kingdom www.ciip.group.cam.ac.uk
Contributors
The contributors to this report are: Jennifer Castaneda-Navarrete, Zongshuai Fan, Mateus Labrunie, David Leal-Ayala, Carlos López-Gómez and Michele Palladino. Research assistance was provided by Guendalina Anzolin (Institute for Manufacturing). Cover design by Ella Whellams. Copy-editing by Elizabeth Tofaris and Amanda George.
Acknowledgements
The authors would like to thank Tim Minshall and Eoin O’Sullivan, who provided comments and suggestions and reviewed earlier versions of this report . We would also like to thank all of the organisations from the private and public sectors who provided valuable time and insights during the interviews and workshops carried out to inform the report.
Disclaimer
Names of countries and territories follow widely accepted conventions and do not imply the expression of any opinion whatsoever on the part of the authors or their affiliated institutions concerning the legal status of any country, territory, city or area, or of its authorities. Any mention of firm names or commercial products does not constitute an endorsement by the authors or their affiliated institutions.
For further details, please contact: ifm-policy-links@eng.cam.ac.uk
Please reference this report as: Cambridge Industrial Innovation Policy (2023). UK Innovation Report 2023. IfM Engage. Institute for Manufacturing, University of Cambridge.
7
Executive summary
UK INNOVATION REPORT 2023
8
Executive summary (1/3)
1 Structure and performance of the UK economy
How does productivity vary across UK regions and countries?
How has the economic structure of the UK regions changed in the last few years?
Are these changes affecting economic performance?
Disparities between UK regions and countries are large and widening: in 1999 labour productivity in Wales represented 65% of that observed in London; however, in 2019 Wales’ productivity was only 58% of that of London.
Regional analysis confirms that in the last two decades, the expansion of service sectors at the expense of higher productivity sectors, such as manufacturing, has slowed overall productivity growth and contributed to widening productivity gaps across the UK.
2 Investment in innovation
Is the UK spending enough on R&D?
How do the public and private sectors contribute to national expenditure on innovation?
How does the UK compare with other countries?
A new methodology introduced by the Office for National Statistics (ONS) has pushed the estimated UK expenditure on R&D as percentage of GDP for 2019 from 1.7% to 2.7%.
While this means that the 2.4% target has been achieved, the UK remains well behind countries such as Germany, the United States and South Korea, which invested between 3.2% and 4.6% of GDP on R&D.
At 0.12% the UK government’s expenditure on R&D in 2019 was still half the OECD average of 0.24%.
9
Key
Key
Theme
policy questions addressed
findings
Executive summary (2/3)
Theme Key policy questions addressed Key findings
Are UK sectors becoming more or less competitive internationally?
The UK’s aerospace manufacturing sector was the third largest in the OECD in 2019, behind only the United States and France.
3.1
–
How are UK sectors performing in terms of productivity, value added and employment?
Are UK sectors investing enough in R&D compared to their international competitors?
The UK’s aerospace manufacturing sector specialises in engines and other aircraft components such as wings; its trade surplus (US$14.7 billion) was the third largest in the world in 2021.
14,000 jobs were lost in the sector in 2020–21 due a collapse in demand driven by the Covid-19 pandemic, which let to company restructuring and accelerated supply chain consolidation.
UK aerospace competitiveness is underpinned by advanced R&D and innovation capabilities, with UK business expenditure on aerospace R&D ranking third among OECD countries and growing steadily in the last decade.
The UK’s food and beverages manufacturing sector was the sixth largest in the OECD in 2019, behind the United States, Japan, Mexico, France and Germany.
Demand in the food and beverages sector has proven to be highly resilient to recessions and disruptive events, including the financial crisis, the COVID-19 pandemic and Brexit, as reflected by the sector’s growth in value added over the last decade and its stable productivity levels during this period.
Are UK sectors becoming more or less competitive internationally?
3.2
–
How are UK sectors performing in terms of productivity, value added and employment?
Are UK sectors investing enough in R&D compared to their international competitors?
Most food and beverages manufacturers are focused on meeting domestic UK demand and have limited incentives to export. The UK produces around 60% of its domestic food consumption by economic value though imports are an essential part of the industry due to geography, weather and land availability. The UK’s food and beverage sector has one of the largest trade deficits in the world, though it remains a leading exporter in high value niches such as whiskey.
UK business expenditure on food and beverages R&D has increased steadily during the last decade, reaching levels comparable to other leading OECD nations.
Product innovation is a key focus of the UK food and beverages sector. However, economic and demand uncertainty may be hindering investment in innovation. Industry consultations suggest that opportunities exist to increase the adoption of digital and automation solutions, particularly among SMEs.
Unfilled vacancies have been a long-standing issue in the sector, with vacancies per 100 employees increasing to 9.1 in Q3 2022, from 6.3 in Q2 2022, which is more than double the UK average of 4.1.
10
Industrial performance
focus on the aerospace manufacturing sector
Industrial performance
focus on the food and beverages manufacturing sector
Executive summary (3/3)
4 Science and engineering workforce
Is the UK producing enough scientists and engineers?
Is the UK government investing enough in technical and vocational education?
How does this compare with other countries?
Although science, technology, engineering, and mathematics (STEM) graduates in the UK accounted for 41% of total graduates – above countries such as France and Canada, and similar to the United States – the share of graduates in the STEM sub-discipline of engineering, manufacturing and construction represented only 9% of graduates, well below comparator countries such as Germany (26%) and Korea (21%).
The UK had a relatively low share of researchers working in the business sector in 2020 (42%), below Korea (82%), Japan (75%), the United States (72%), France (63%) and Germany (60%).
Although women account for 39% of total researchers, placing the UK in the top 10 of OECD countries, female graduates are under-represented in some STEM disciplines in the UK, particularly in engineering, manufacturing and construction.
5 Environmental Innovation
How does the UK compare in environmental and energy technology research and development (R&D) investment?
How is R&D expenditure translating into patenting performance?
Is the UK capturing the economic potential of the transition towards environmental sustainability?
Gross value added in the UK environmental goods and services sector (EGSS), as defined by the ONS, was estimated to be £45.2 billion in 2019 (up 5.4% from 2018). The sector’s employment is estimated at 394,900 full-time equivalent employees in 2019 (down 4.7% from 2018).
The OECD estimates that at 6%, the UK had the sixth highest government budget allocation for R&D in environment and energy innovation among OECD countries in 2020. This is higher than that of the United States (3%), but lower than Japan (8%), Germany (8%), Korea (8%), and France (9%).
The UK ranks seventh among OECD countries in patent applications for the group of technologies defined by the OECD as “environment-related technologies”.
11
Theme Key policy questions addressed Key findings
Theme 1: Structure and performance of the UK economy
UK INNOVATION REPORT
Theme 1: Structure and performance of the UK economy
Key policy questions addressed
How does productivity vary across UK regions and countries?
How has the economic structure of the UK regions changed in the last few years?
Are these changes affecting economic performance?
Key findings
Substantial and widening productivity gaps are observed between London and the rest of the UK.
London and the South East of England are the UK regions with the highest labour productivity levels, showing annual values of £80,034 and £59,709 value added per job in 2019. In contrast, Wales, the North East of England, and Yorkshire and the Humber have among the lowest productivity levels, around £47,000 in 2019.
In 1999 labour productivity in Wales represented 65% of that observed in London; however, in 2019 Wales’ productivity accounted for only 58% of that of London.
Spatial disparities in sectoral productivity levels are particularly large in agriculture, forestry and fishing; arts, entertainment and recreation; professional, scientific and technical activities; and financial and insurance activities.
London’s sectoral productivity levels are above the UK average for all sectors except manufacturing and agriculture. The productivity of London’s professional, scientific and technical activities is 2.4 times larger than that observed in Wales, the UK area with the lowest productivity level in this sector.
Substantial gaps are also observed in the pace of productivity growth in the information and communication sector. The North East of England (16.2%) and Wales (13.6%) saw the fastest growth between 1999 and 2019. In contrast, London saw the slowest growth (6.0%).
In the last two decades, the expansion of service sectors at the expense of higher productivity sectors, such as manufacturing, has slowed down overall productivity growth and contributed to widening productivity gaps across the UK.
Between 1999 and 2019 knowledge- and labour-intensive services expanded, while manufacturing reduced its participation in the UK economy. However, since service activities tend to have productivity levels below the average of the total economy and show slower productivity growth, their expansion has slowed down productivity growth.
The most negative impacts from the shrinkage of manufacturing are observed in the East Midlands, the North West, the North East and the West Midlands, where the decline of manufacturing cost these regions a percentage point, on average per year, between 1999 and 2019.
13
Chart 1.1. Structure of the UK economy, 2021
Gross value added, employment, exports and business R&D expenditure (BERD) [1]
Low/medium-tech
Both knowledge-intensive[1] and labour-intensive services [1] represented around 80% of the gross value added and employment of the UK economy in 2021.
Although medium/high-tech manufacturing [1] accounts for 5% of the gross value added and 3% of employment, this sector accounts for the largest share of exports: 37% in 2020 and the second largest share of business R&D expenditure, around 35%, in 2021.
The manufacturing sector as a whole accounts for less than 10% of the UK’s value added. However, the size of the manufacturing sector varies across UK regions and countries.
Knowledge-intensive services
Labour-intensive services
Note: [1] Export data corresponds to 2020, industry percentages based on Office for National Statistics experimental data. Appendix
1.1 presents definitions of these classifications of sectors. Source: Office for National Statistics.
Note: [1] Appendix 1.1 presents definitions of these classifications of sectors.
14
£2,105 billion 30.9 million £610 billion
£46.9 million 0% 10% 20% 30% 40% 50% 60% 70% 80% 90% 100% Gross value added Employment Exports BERD Unknown industry Agriculture, forestry and fishing Mining and quarrying Utilities
manufacturing
Medium/high-tech
manufacturing Construction
Chart 1.2. Labour productivity by country and region
Gross value added per job, 1999–2020
Source: Authors’ calculations, based on data from the Office for National Statistics.
Substantial productivity gaps are observed between UK regions and countries. In 2019 London and the South East of England were the UK regions with the highest labour productivity levels, with annual values of £80,034 and £59,709 per job. In contrast, Wales, the North East of England, and Yorkshire and the Humber had the lowest productivity levels, at around £47,000.
Productivity gaps have widened in the last two decades. In 1999 labour productivity in Wales represented 65% of that observed in London; however, in 2019 productivity in Wales accounted for only 58% of that of London.
Between 1999 and 2019 London and Scotland were the regions and countries that experienced the fastest productivity growth, with rates of 1% and 0.8%, respectively.
Scotland also fared better during the financial crisis of 2008/9; it did not experience a fall in productivity levels in this period like the rest of the UK did.
A reduction in productivity levels was observed across the board in 2020, as a result of the COVID-19 pandemic and related impacts.
15
London South East England United Kingdom Scotland East of England North West West Midlands South West Northern Ireland East Midlands Yorkshire and the Humber North East Wales £40,000 £45,000 £50,000 £55,000 £60,000 £65,000 £70,000 £75,000 £80,000 £85,000 1999 2001 2003 2005 2007 2009 2011 2013 2015 2017 2019 Annual value added per job (chained volume measures in 2019 money value)
Chart 1.3. Sectoral labour productivity by country and region
GVA per job of market sectors (excluding utilities), thousand £ per job per year, 2019
Chart 1.3 presents labour productivity levels across the UK regions and countries of sectors where transactions occur predominantly in the market, excluding electricity, gas and water supply.
Across the UK regions and countries, financial and insurance activities, information and communication, manufacturing and construction have among the highest productivity levels.
In comparison, labour-intensive services, such as accommodation and food-service activities, entertainment and recreation, and administrative and support-service activities, tend to have some of the lowest productivity levels.
Spatial disparities are particularly large in agriculture, forestry and fishing (38% of the UK value); arts, entertainment and recreation (28% of the UK value); professional, scientific and technical activities (23% of the UK value); and financial and insurance activities (21% of the UK value).[1]
London stands out for productivity levels above the UK average with between 27% (information and communication) and 67% (arts, entertainment and recreation) across most sectors, with the exception of manufacturing and agriculture, which have productivity levels below the UK average.
The productivity of London’s professional, scientific and technical activities is 2.4 times larger than that observed in Wales, the UK area with the lowest productivity level in this sector.
The North East of England has the highest productivity levels in agriculture, forestry and fishing, 2.3 times larger than those in Northern Ireland. Meanwhile, the South East of England and Scotland have the highest productivity levels in manufacturing, more than 30% higher than those observed in Northern Ireland.
Note: [1] UK values include extraterritorial activities not assigned to a specific region.
Source: Authors’ calculations, based on data from the Office for National Statistics.
Note: [1] Standard deviation of English regions, Northern Ireland, Scotland and Wales as proportion of the UK value.
16
Sector England East Midlands East of England London North East North West South East South West West Midlands Yorkshire and the Humber Northern Ireland Scotland Wales UK[1} Financial and insurance activities 148.3 92.1 110.4 207.1 110.8 111.0 112.6 109.0 108.7 100.2 86.8 134.9 111.6 145.1 Manufacturing 74.0 68.1 80.8 68.7 73.3 81.2 86.2 66.5 70.4 66.2 62.8 84.3 77.2 74.4 Mining and quarrying 76.8 102.0 58.2 80.0 97.3 66.9 69.3 102.9 35.1 68.9 66.5 46.0 67.3 353.6 Information and communication 85.9 58.9 69.9 105.5 68.0 69.3 92.2 58.5 78.8 59.5 57.7 59.3 59.9 83.1 Construction 56.1 52.7 63.5 72.8 48.9 52.6 58.4 45.3 46.3 46.1 57.1 51.0 45.6 55.3 Transportation and storage 44.6 35.3 41.9 62.0 36.3 38.1 52.5 37.5 33.2 39.8 48.2 47.5 35.8 44.6 Wholesale and retail trade; repair of motor vehicles 42.7 37.7 42.8 53.8 32.0 38.0 50.7 36.7 38.3 37.4 45.1 39.8 33.0 42.1 Professional, scientific and technical activities 47.7 33.3 35.0 71.0 36.5 36.9 48.6 35.2 35.1 35.2 39.7 44.6 29.1 46.9 Agriculture, forestry and fishing 36.1 48.6 39.5 16.3 57.1 28.3 25.5 37.7 33.0 43.5 24.5 47.7 14.8 34.5 Other service activities 36.7 32.9 33.7 47.8 33.6 33.4 38.7 33.3 37.2 25.7 24.4 33.7 37.9 36.2 Administrative and supportservice activities 34.8 28.1 31.5 46.6 26.1 32.5 36.3 35.4 27.1 25.8 22.4 28.8 27.0 33.9 Arts, entertainment and recreation 33.2 26.6 30.5 52.4 25.4 28.7 32.1 17.4 29.9 24.2 26.0 21.4 19.4 31.4 Accommodation and food-service activities 24.1 20.2 22.8 32.1 17.2 22.3 23.5 21.0 23.2 20.4 22.9 23.1 19.5 23.7 Total 57.1 47.7 52.6 80.0 47.3 50.3 59.7 48.6 49.0 47.4 48.5 53.7 46.7 56.7
Chart 1.4. Sectoral labour productivity growth by country and region
Average annual growth of output per job of market sectors (excluding utilities), 1999–2019
Among market sectors, and excluding electricity, gas and water supply, information and communication, agriculture, mining and quarrying, and manufacturing tend to show faster labour productivity growth, while construction, transportation and storage, and professional, scientific and technical activities show weaker and even negative growth rates.
London
North East
North West
South East
South West
West Midlands
Yorkshire and the Humber
Northern Ireland
Scotland
Wales UK
Source: Authors, based on data from the Office for National Statistics.
Differences are observed across UK countries and regions, particularly in the pace of productivity growth in information and communication, agriculture, and mining and quarrying. However, the contribution of the latter is negligible across most of the UK regions and countries, since most mining activities are assigned to specific regions in official statistics.
Between 1999 and 2019 the UK areas that saw the fastest productivity growth rates of the information and communication sector include the North East of England (16.2%) and Wales (13.6%). In contrast, London saw the slowest growth (6.0%).
During the same period, the fastest labour productivity growth in agriculture was observed in London (13.3%) and the North East (12.2%). However, as presented in Chart 1.3, London’s labour productivity in agriculture was the lowest across regions. In comparison, Scotland had the most modest growth (3.3%).
-5.0% -3.0% -1.0% 1.0% 3.0% 5.0% 7.0% 9.0% 11.0% 13.0% 15.0% 17.0% 19.0% Average annual growth (1999 –2019)
England East Midlands East of England
17
Chart 1.5. Value-added and employment shares by sector, country and region, 2019
Value-added shares of sectors in each UK country and region, 2019
Across countries and regions, labour-intensive services[1] account for around half of the total UK value added and employment. This category groups together activities such as accommodation and food services, entertainment and recreation, and administrative and support-service activities, which, as shown in Charts 1.3 and 1.4, tend to have among the lowest productivity levels and slower productivity growth.
In 2019 Northern Ireland saw the largest share of value added (56.5%) of these activities, while London saw the smallest share (47.2%). In terms of employment, the largest shares of these services are seen in the North East of England (62.3%) and Scotland (61.1%).
Employment shares
sectors in each UK country and region, 2019
Knowledge-intensive services[1] account for around a quarter of the value added and employment of the total economy across regions and countries. Larger financial, and professional and scientific sectors, in comparison with other UK areas, mean that London has the largest share of these activities (44.9% value added and 35.3% employment). In comparison, Northern Ireland, Wales and the East Midlands have particularly low shares of these activities.
Source: Office for National Statistics. Regional gross value added (balanced) by industry.
Manufacturing is the third largest contributor to UK value added and employment among the economic activity groups examined. In terms of value added, it is particularly important in Wales (16.9%), the East Midlands (16.8%), and the West Midlands (15.5%); meanwhile, in terms of employment, the largest shares are seen in the East (11.8%) and West Midlands (10.8%), and in Yorkshire and the Humber (10.7%). In comparison, London has the lowest shares of manufacturing in the UK (2.0% value added and 2.3% employment).
18
Country/region Agriculture, forestry and fishing Mining and quarrying Manufacturing Utilities Construction Knowledgeintensive services Labour-intensive services England 0.6% 0.1% 9.6% 2.5% 6.5% 29.0% 51.7% East Midlands 1.3% 0.4% 16.8% 3.6% 7.3% 18.6% 52.1% East of England 1.0% 0.1% 10.9% 2.4% 9.2% 22.8% 53.6% London 0.0% 0.0% 2.0% 1.0% 4.9% 44.9% 47.2% North East 0.6% 0.3% 14.6% 4.1% 6.4% 20.7% 53.3% North West 0.4% 0.1% 14.4% 2.5% 6.3% 22.2% 54.1% South East 0.4% 0.1% 8.7% 3.1% 7.0% 26.9% 53.8% South West 1.4% 0.2% 11.1% 3.4% 7.0% 22.1% 54.8% West Midlands 0.8% 0.1% 15.5% 3.5% 6.4% 21.1% 52.5% Yorkshire and the Humber 0.9% 0.1% 14.9% 3.2% 6.5% 22.4% 52.1% Northern Ireland 1.7% 0.3% 13.7% 3.0% 7.7% 17.2% 56.5% Scotland 1.7% 1.0% 10.4% 4.4% 6.0% 24.1% 52.5% Wales 0.9% 0.3% 16.9% 4.3% 6.4% 18.5% 52.8% United Kingdom 0.7% 1.1% 9.3% 3.1% 6.2% 27.8% 51.8%
of
Region Agriculture, forestry and fishing Mining and quarrying Manufacturing Utilities Construction Knowledgeintensive services Labour-intensive services England 0.9% 0.1% 7.4% 1.0% 6.6% 25.4% 58.6% East Midlands 1.3% 0.2% 11.8% 1.3% 6.6% 20.5% 58.5% East of England 1.3% 0.1% 7.1% 1.0% 7.7% 24.8% 58.1% London 0.1% 0.0% 2.3% 0.5% 5.4% 35.3% 56.4% North East 0.5% 0.1% 9.4% 1.4% 6.2% 20.0% 62.3% North West 0.8% 0.1% 8.9% 1.1% 6.1% 22.2% 60.9% South East 1.0% 0.1% 6.0% 1.1% 7.2% 26.9% 57.8% South West 1.8% 0.1% 8.1% 1.1% 7.5% 22.4% 58.9% West Midlands 1.2% 0.1% 10.8% 1.1% 6.8% 20.3% 59.7% Yorkshire and the Humber 0.9% 0.1% 10.7% 1.0% 6.7% 21.8% 58.8% Northern Ireland 3.3% 0.2% 10.6% 1.0% 6.5% 18.4% 60.0% Scotland 1.9% 1.1% 6.6% 1.2% 6.3% 21.7% 61.1% Wales 2.7% 0.2% 10.2% 1.4% 6.6% 19.5% 59.4% United Kingdom 0.7% 0.2% 7.7% 1.5% 4.8% 25.0% 60.0% Note: [1] Appendix 1.1 presents definitions of these classifications of sectors.
Chart 1.6. Change in value-added and employment shares by
sector, country and region, 1999–2019
Change in value-added shares, 1999–2019
As highlighted in the 2022 edition of the UK Innovation Report, a key change observed in the structure of the UK economy in recent decades is the decline in the participation of manufacturing and the consequent increase in the size of service activities.
The regions that saw the greatest decline in manufacturing activities between 1999 and 2019 include: the North West of England (-7.2 pp. in value added and -7.5 pp. in employment); the East Midlands (-6.4 pp. in value added and -8.2 pp. in employment); and the West Midlands (-6.1 pp. in value added and -10.5 pp. in employment).
Knowledge-intensive services [1] experienced a substantial expansion between 1999 and 2019, particularly in London (5.6 pp. in value added and 4.4 pp. in employment) and Scotland (5.5 pp. in value added and 4.0 pp. in employment). This expansion was mainly driven by the growth of professional, scientific and technical activities.
Change in employment shares, 1999-2019
The second largest expansion across sectors is observed in labour-intensive services[1] and explained by the growth of human health and social work activities and administrative and support-service activities. This trend is especially pronounced in Northern Ireland in terms of value added (3.4 pp.) and in the West Midlands in terms of employment (7.4 pp.).
In comparison, the shrinkage of wholesale and retail trade in London has meant the largest decline in the contribution of these activities (-2.7 pp. value added and
pp. employment).
Northern Ireland experienced the fastest decline in the participation of agriculture in the regional economy (-1.3 pp. in terms of value added and -2.8 pp. in employment shares).
Source: Office for National Statistics. JOBS05 Workforce jobs by region and industry.
Note: [1] Appendix 1.1 presents definitions of these classifications of sectors.
19
-1.2
-10 -8 -6 -4 -2 0 2 4 6 8 10 England East Midlands East of England London North East North West South East South West West Midlands Yorkshire and the Humber Northern Ireland Scotland Wales UK Percentage points Agriculture, forestry and fishing Mining and quarrying Manufacturing Utilities Construction Knowledge-intensive services Labour-intensive services -15 -10 -5 0 5 10 15 England East Midlands East of England London North East North West South East South West West Midlands Yorkshire and the Humber Northern Ireland Scotland Wales UK Percentage points
Chart 1.7. Intra-industry productivity growth effect: top and bottom five sectors in the UK
Percentage points, average 1999–2019
Chart 1.7 shows the top and bottom five sectors by their contributions to labour productivity growth in the UK via the intraindustry productivity growth effect. The intra-industry productivity growth effect measures how fast the productivity of a sector grows weighted by its value-added share (see Appendix 1.2).
Between 1999 and 2019 the North East, North West and London regions stood out for having the largest intra-industry productivity growth effects in the UK.
Across countries and regions, manufacturing and information and communication account for the largest contributions to productivity growth via intra-industry growth effect.
In relative terms, that is, as a percentage of the intra-industry growth effect of the total economy, the largest contributions to aggregate productivity growth from manufacturing are observed in Wales (124.7%) and the East Midlands (95.8%).
In the case of information and communication, the largest contributions via intra-industry productivity growth effect are observed in the South East of England (73%) and the North East (56.9%).
In some countries and regions, such as Northern Ireland (0.12 pp., 24.8% in relative terms), the South West of England (0.08 pp., 10.8% in relative terms) and the East Midlands (0.09 pp., 10.2% in relative terms), agriculture – a sector that has shown fast productivity growth in recent decades (Chart 1.4) – also appears among the top five sectors based on its intra-industry productivity growth effect.
In comparison, with the exception of London, where they account for 0.08 pp., real-estate activities have made negative contributions to labour productivity growth across the UK. Caution is needed, however, when analysing this sector, since imputed rents from owner-occupied dwellings are included in the value added.
20
Sector
East
Top five sectors Manufacturing 0.53 0.89 0.58 0.15 0.81 0.81 0.44 0.51 0.77 0.74 0.43 0.64 0.81 0.53 Information and communication 0.57 0.27 0.62 0.66 0.75 0.47 0.78 0.40 0.46 0.41 0.27 0.32 0.38 0.53 Wholesale and retail trade; repair of motor vehicles 0.10 0.07 0.16 0.04 0.06 0.12 0.13 0.09 0.13 0.15 0.24 0.09 0.11 0.10 Financial and insurance activities 0.09 0.03 0.04 0.18 0.04 0.06 0.03 0.06 0.06 0.04 0.02 0.13 0.09 0.09 Public administration and defence 0.08 0.07 0.10 0.06 0.11 0.10 0.05 0.10 0.08 0.08 0.09 0.11 0.14 0.08 Bottom five sectors Professional, scientific and technical activities -0.05 -0.06 -0.14 0.03 0.00 -0.06 -0.07 -0.08 -0.04 -0.03 -0.05 -0.01 -0.03 -0.04 Construction -0.05 -0.06 -0.03 -0.01 0.00 -0.05 -0.04 -0.06 -0.07 -0.09 -0.05 -0.05 -0.04 -0.05 Education -0.08 -0.06 -0.08 -0.06 -0.09 -0.09 -0.10 -0.07 -0.07 -0.08 -0.13 -0.08 -0.12 -0.08 Mining and quarrying 0.00 0.01 0.01 0.00 0.02 0.01 0.01 -0.01 0.00 0.01 0.01 0.03 0.00 -0.09 Real-estate activities -0.17 -0.28 -0.34 0.08 -0.29 -0.10 -0.16 -0.19 -0.21 -0.12 -0.53 -0.17 -0.65 -0.20 Intra-industry productivity growth effect of the total economy 0.99 0.93 0.95 1.20 1.32 1.23 1.06 0.76 1.14 1.12 0.48 1.11 0.65 0.85
England
Midlands East of England London North East North West South East South West West Midlands Yorkshire and the Humber Northern Ireland Scotland Wales UK
Source: Authors’ calculations, based on data from the Office for National Statistics.
Chart 1.8. Allocation effect: top and bottom five sectors in the UK
Percentage points, average 1999–2019
Source: Authors’ calculations, based on data from the Office for National Statistics.
Chart 1.8 shows the top and bottom five sectors by their relative contributions to labour productivity growth in the UK via the allocation effect. The allocation effect measures how the expansion or reduction of sectors contributes to productivity growth. Sectors with higher productivity levels receive higher weights in this measure (see Appendix 1.2).
Between 1999 and 2019, except for Northern Ireland, all of the UK countries and regions experienced negative allocation effects. In other words, shifts in the size of sectors had a negative net effect on overall labour productivity growth. The decline in the size of manufacturing (employment) and information and communication (relative prices) account for most of this negative effect.
The most negative impacts from the shrinkage of manufacturing between 1999 and 2019 are observed in the East Midlands, the North West, the North East and the West Midlands, where the decline of manufacturing cost these regions a percentage point, on average per year, between 1999 and 2019.
Other sectors that have shrunk in the last 2 decades, and thus reduced their contributions to overall labour productivity growth, include: wholesale and retail, particularly in London (-0.16 pp.), public administration and defence, and agriculture, particularly in Northern Ireland (-0.15 pp. and -0.19 pp.).
In comparison, sectors such as real estate, professional, scientific and technical activities, education, human health and construction saw their contributions to aggregate productivity growth increase from 1999 to 2019. However, as these sectors tend to show productivity levels below the average, their expansion has not compensated for the contraction of manufacturing and information and communication and thus the negative total allocation effect.
21
Sector England East Midlands East of England London North East North West South East South West West Midlands Yorkshire and The Humber Northern Ireland Scotland Wales UK Top five sectors Real-estate activities 0.20 0.24 0.33 0.15 0.26 0.05 0.11 0.09 0.15 0.06 0.42 0.22 0.34 0.19 Professional, scientific and technical activities 0.18 0.14 0.20 0.19 0.07 0.18 0.16 0.17 0.12 0.13 0.11 0.14 0.08 0.16 Education 0.17 0.18 0.18 0.14 0.21 0.16 0.19 0.14 0.18 0.21 0.12 0.17 0.20 0.16 Human health and social-work activities 0.16 0.17 0.18 0.10 0.23 0.21 0.14 0.15 0.21 0.20 0.18 0.18 0.21 0.15 Construction 0.15 0.15 0.19 0.10 0.09 0.12 0.16 0.16 0.15 0.16 0.15 0.11 0.11 0.13 Bottom five sectors Agriculture, forestry and fishing -0.04 -0.14 -0.12 0.00 -0.06 -0.03 -0.02 -0.08 -0.04 -0.09 -0.19 -0.08 -0.05 -0.05 Public administration and defence -0.05 -0.05 -0.06 -0.04 -0.06 -0.06 -0.08 -0.11 -0.03 -0.04 -0.15 -0.01 -0.01 -0.06 Wholesale and retail trade; repair of motor vehicles -0.11 -0.03 -0.14 -0.16 -0.05 -0.08 -0.13 -0.11 -0.11 -0.12 -0.04 -0.11 -0.08 -0.13 Information and communication -0.50 -0.24 -0.64 -0.58 -0.69 -0.41 -0.68 -0.40 -0.41 -0.36 -0.24 -0.28 -0.33 -0.47 Manufacturing -0.74 -1.10 -0.83 -0.29 -1.03 -1.05 -0.66 -0.75 -1.02 -0.91 -0.59 -0.88 -0.94 -0.77 Allocation effect of the total economy -0.31 -0.38 -0.54 -0.23 -0.69 -0.65 -0.59 -0.54 -0.54 -0.57 0.01 -0.32 -0.18 -0.38
Chart 1.9. Total sectors’ contribution to aggregate labour productivity growth: top and bottom five sectors in the UK
Percentage points, average 1999–2019
Source: Authors’ calculations, based on data from the Office for National Statistics.
Chart 1.9 shows the top and bottom five sectors by their total contributions to aggregate labour productivity growth in the UK. This is the sum of the intra-industry productivity growth effect (Chart 1.7) and the allocation effect (Chart 1.8) (see Appendix 1.2).
Between 1999 and 2019 sectors such as human health and social-work activities, professional, scientific and technical activities, and administrative and supportservice activities, with slower productivity growth (Chart 1.4) and productivity levels below the average of the total economy (Chart 1.3), were among the top five sectors contributing to productivity growth. The largest relative contributions of these sectors are observed in the South West of England, the region with the slowest labour productivity growth in the UK between 1999 and 2019.
Because of its reduction in size, manufacturing has contributed negatively to aggregate productivity growth, despite having relatively high productivity levels (Chart 1.3) and experiencing fast productivity growth (Chart 1.4). The most negative contributions (relative to the productivity growth of the total economy) are observed in the South West of England (-108.7%) and the East of England (-61.4%). This means that, in the case of the South West, if manufacturing had not declined, labour productivity in this region would have grown more than twice as fast.
22
Sector
Top five sectors Human health and social-work activities 0.14 0.17 0.13 0.10 0.20 0.19 0.13 0.11 0.17 0.16 0.17 0.21 0.19 0.13 Professional, scientific and technical activities 0.14 0.08 0.07 0.22 0.07 0.13 0.09 0.09 0.08 0.10 0.06 0.14 0.05 0.12 Financial and insurance activities 0.13 0.03 0.03 0.28 0.09 0.08 0.03 0.07 0.08 0.08 0.07 0.18 0.14 0.12 Construction 0.10 0.10 0.16 0.09 0.09 0.07 0.12 0.10 0.08 0.07 0.10 0.06 0.07 0.08 Administrative and supportservice activities 0.09 0.09 0.11 0.06 0.07 0.10 0.07 0.11 0.10 0.10 0.06 0.09 0.07 0.08 Bottom five sectors Real-estate activities 0.03 -0.05 -0.01 0.23 -0.04 -0.05 -0.05 -0.10 -0.06 -0.06 -0.11 0.05 -0.31 -0.01 Mining and quarrying -0.01 -0.01 0.00 0.00 0.00 0.00 0.00 -0.02 -0.01 -0.01 0.00 -0.03 0.00 -0.01 Agriculture, forestry and fishing -0.01 -0.05 -0.05 0.00 0.00 0.00 0.00 0.00 0.00 -0.03 -0.07 -0.02 -0.02 -0.02 Wholesale and retail trade; repair of motor vehicles -0.01 0.03 0.02 -0.11 0.00 0.04 0.00 -0.03 0.02 0.02 0.20 -0.01 0.03 -0.03 Manufacturing -0.22 -0.21 -0.25 -0.14 -0.22 -0.24 -0.21 -0.24 -0.25 -0.17 -0.16 -0.24 -0.13 -0.24 Average annual growth rate 0.68 0.55 0.41 0.97 0.64 0.58 0.48 0.22 0.60 0.55 0.49 0.79 0.47 0.47
England East Midlands East of England London North East North West South East South West West Midlands Yorkshire and the Humber Northern Ireland Scotland Wales UK
Appendix 1.1
Sectors’ classification and statistical codes
Classification of sectors based on the UK Standard Industrial Classification (SIC)
Section Division Description
C 10–12 Food products, beverages and tobacco
C 13–15 Textiles, wearing apparel, leather and related products
C 16–18 Wood and paper products, and printing
Knowledgeintensive services
Section Division Description
J 58–63 Information and communication
K 64–66 Financial and insurance activities
M 69–82 Professional, scientific and technical activities
Low/medium-tech manufacturing
C 22–23 Rubber and plastics products, and other non-metallic mineral products
C 24–25 Basic metals and fabricated metal products, except machinery and equipment
C 31–33 Furniture; other manufacturing; repair and installation of machinery and equipment
C 19 Coke and refined petroleum products
C 20 Chemicals and chemical products
C 21 Basic pharmaceutical products and pharmaceutical preparations
Labour-intensive services
P 85 Education
G 45–47 Wholesale and retail trade, repair of motor vehicles and motorcycles
H 49–53 Transportation and storage
I 55–56 Accommodation and food service activities
L 68 Real-estate activities
N 77–82 Administrative and support service activities
Medium/high-tech manufacturing
C 26 Computer, electronic and optical products
C 27 Electrical equipment
C 28 Machinery and equipment n.e.c
C 29 Motor vehicles, trailers and semi-trailers
C 30 Other transport equipment
A 01–03 Agriculture, hunting, forestry and fishing
B 05–09 Mining and quarrying
O 84 Public administration and defence; compulsory social security
Q 86–88 Human health and social work activities
R 90–93 Arts, entertainment and recreation
S 94–96 Other service activities
T 97–98 Activities of households as employers; undifferentiated activities of households for own use
Other production
D 35 Electricity, gas, steam and air conditioning supply
E 36–39 Water supply; sewerage, waste management and remediation activities
F 41–43 Construction
23
Appendix 1.2
Decomposition of productivity growth
Economic sectors contribute disparately to aggregate productivity growth, depending on their productivity gains over time, as well as their relative weight in the total economy and relative productivity differences.
In order to understand the extent and nature of these contributions, we decompose labour productivity growth rates into sectoral contribution effects, as described in Tang and Wang (2004):
• An intra-industry productivity growth effect that captures the productivity growth of each economic sector, given the relative importance in the economy (within effect). The intra-industry productivity growth effect of a given sector ���� takes positive (negative) values whenever the sector shows positive (negative) productivity growth. Its magnitude depends on the productivity growth rate and how large the sector is in relation to other sectors in the economy.
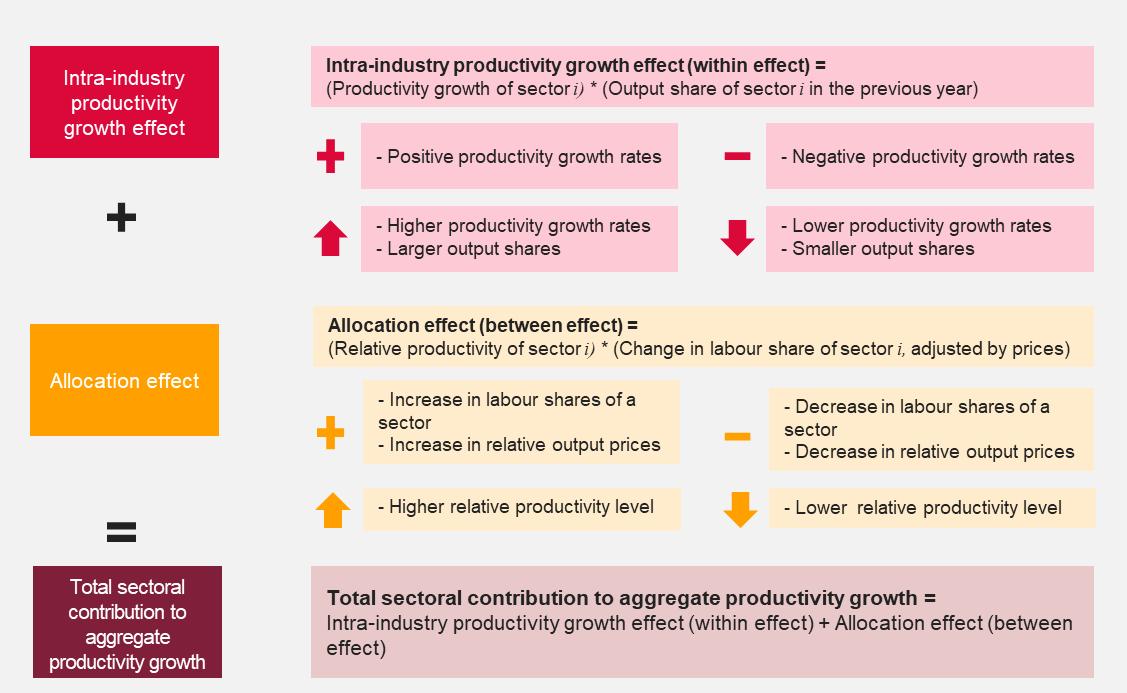
• An allocation effect (between-industries effect) that captures the effects of changes in the relative size of sectors. The allocation effect takes positive (negative) values if the sector increases (decreases) in size. The relative size is determined by changes in labour shares and relative output prices of sector ����. By changes in relative output prices, we mean how much the output prices in sector ���� change in relation to changes in the output prices of the whole economy.
24
Theme 2: Investment in innovation
INNOVATION REPORT
UK
Theme 2: Investment in innovation
Key policy questions addressed
Is the UK spending enough on R&D?
How do the public and private sectors contribute to national expenditure on innovation?
How does the UK compare with other countries?
Key findings
A new methodology introduced by ONS has pushed the estimate of UK expenditure on R&D up by 55%
The UK’s gross domestic expenditure on R&D (GERD) as a percentage of GDP was thought to be around 1.7%.
The Office for National Statistics (ONS) has introduced a major revision, which has pushed this figure up to 2.7%.
The UK still lags behind Germany, the US and South Korea, which invested between 3.2% and 4.6% of GDP on R&D.
The UK government’s expenditure on R&D remains relatively low compared to
OECD countries
The ONS revised methodology has not impacted the estimate of R&D performed by the UK government.
In 2019 UK government expenditure on R&D as a share of GDP was 0.12%, well below the OECD average of 0.24%.
In the UK the business sector is the main contributor to R&D performance (71.2% in 2020), and non-business R&D is concentrated around the higher education sector (22.5% in 2020).
Few firms with headquarters in the UK are among the world’s top R&D investors and patent applicants
In 2021, 95 of the world’s 2,500 top R&D-investing companies were headquartered in the UK, behind the US (822), China (678), Japan (233) and Germany (114).
The UK hosted only 3 of the top 100 R&D-investing firms in the world in 2021.
In 2021 there were no UK-headquartered applicants among the top 100 applicants at the United States Patent and Trademark Office (USPTO) and only 1 among the top 100 applicants at the European Patent Office (EPO).
26
Chart 2.1. R&D intensity: international comparison (1/2)
Gross domestic expenditure on R&D (GERD) as a share of GDP, 2019
+10 positions
Note: For the UK, the value of gross domestic expenditure on R&D as a share of GDP was estimated by the Department for Science, Innovation and Technology (DSIT) to be between 2.6% and 2.7% in 2019, based on the ONS methodological revision of BERD methodology. (For 2020, DSIT estimated UK R&D intensity to be between 2.9% and 3.0%, a value that is relatively high as a result of the contraction of GDP associated with COVID-19 lockdowns).
Source: OECD (2022). Main Science and Technology Indicators. For the DSIT estimate of UK R&D as a share of GDP value, see Nurse P. (2023). Independent Review of the Research, Development and Innovation Organisational Landscape – Final Report and Recommendations.
The UK’s gross domestic expenditure on R&D (GERD) as a percentage of GDP was thought for many years to be around 1.7%.
In November 2022 the Office for National Statistics (ONS) introduced a major revision to the methodology used to estimate R&D performed by businesses and the higher education sector. [1]

Using the “new” revised methodology, for 2019:
o UK GERD goes up to £59.7 billion (55% more than using the “old” methodology).
o UK GERD as a share of GDP for 2019 goes up to 2.7% (above the OECD average of 2.5%).
o The UK gains 10 positions in the OECD ranking of R&D intensity for 2019.[2]
o The UK still lags behind Germany, the US and South Korea, which invested between 3.2% and 4.6% of GDP on R&D.
Note: [1] ONS (2022). Gross domestic expenditure on research and development, UK: 2020 (published on 22 November 2022). [2] OECD (2022). Main Science and Technology Indicators.
27
2.7% 2.5% 1.7% 0.0% 1.0% 2.0% 3.0% 4.0% 5.0% 6.0% “New” methodology “Old” methodology
Chart 2.2. R&D intensity: international comparison (2/2)
Gross domestic expenditure on R&D (GERD) as a share of GDP, 2021 or latest available
The latest edition of the OECD Science, Technology and Innovation Outlook 2023, released in March 2023, provides updated estimates of gross domestic expenditure on R&D (GERD) as a share of GDP for OECD member states and partner countries.
Taking into account the ONS methodological revisions, the OECD estimated the value of UK GERD as a share of GDP to be 2.93% for 2020, above the OECD average of 2.71%.
This is in line with the estimation provided by the UK’s Department for Science, Innovation and Technology (DSIT), which is between 2.9% and 3.0% for 2020.[1]
The relatively large values for 2020 reflect the contraction of UK GDP associated with COVID-19 lockdowns.
���� Related insight
The ONS methodological revisions to estimate the gross domestic expenditure on R&D performed in the UK were also justified by the need to be aligned to methodologies used by other countries, particularly with respect to the sampling method used. [2] Following the ONS revisions effective from 2018, data series for previous years related to the UK R&D were suppressed from the data available to OECD.[3]
Note: Data for the United Kingdom refer to 2020.
Source: OECD (2023). OECD Science, Technology and Innovation Outlook 2023: Enabling Transitions in Times of Disruption, OECD Publishing, Paris.
Note: [1] Nurse: P. (2023). Independent Review of the Research, Development and Innovation Organisational Landscape – Final Report and Recommendations.
[2] ONS (2022). Options for transformation of business enterprise research and development statistics (published on 22 November 2022).
[3] OECD (2023). OECD Science, Technology and Innovation Outlook 2023: Enabling Transitions in Times of Disruption, OECD Publishing, Paris.
28
2.93% 2.71% 0.0% 1.0% 2.0% 3.0% 4.0% 5.0% 6.0%
Chart 2.3. ONS revision of BERD methodology
Business expenditure on R&D (BERD), the United Kingdom, 2018–2020
Source: ONS (2022). Business enterprise research and development (R&D), UK: 2021 (published on 22 November 2022); and ONS (2021). Research and development in UK Businesses, 2020 – Datasets.
Using the new ONS methodology, expenditure on R&D performed by UK businesses in 2018, 2019 and 2020 was £15.8 billion, £16.1 billion and £17.1 billion (respectively) higher than previously published.
29
25.2 26.0 26.9 41.0 42.2 44.0 0 5 10 15 20 25 30 35 40 45 50 2018 2019 2020 £ billion (current prices) BERD using "old" methodology BERD using "new" methodology
Chart 2.4. UK BERD by company employment size
Business expenditure on R&D (BERD), the United Kingdom, 2019–2020
Source: ONS (2022). Business enterprise research and development (R&D), UK: 2021 (published on 22 November 2022); and ONS (2021). Research and development in UK Businesses, 2020 (Table b: Additional datasets).
Small and medium enterprises (0–249 employees) account for more than 95% of the increase in R&D expenditure using the new ONS methodology.
30
6.0 7.1 20.1 19.8 21.4 23.3 20.8 20.7 0 5 10 15 20 25 2019 2020 2019 2020 0
249
250
£ billion (current prices)
to
employees
employees and over
BERD using "old" methodology BERD using "new" methodology
Business expenditure on R&D (BERD), the United Kingdom, 2018–2020
BERD using "old" methodology BERD using "new" methodology
Note: Other sectors include: agriculture, hunting and forestry; fishing, extractive industries, electricity, gas and water supply; waste management; and construction.
Source: ONS (2022). Business enterprise research and development (R&D), UK: 2021 (published on 22 November 2022); and ONS (2021). Research and development in UK Businesses, 2020 – Datasets.
Services account for 85% of the total increase in R&D expenditure under the ONS revised methodology for 2020, while manufacturing accounts for 11% and other sectors for 4%.
Whereas R&D expenditure in services used to be around half of manufacturing R&D expenditure using the old methodology, it is roughly one-third higher under the new methodology.
31
Chart 2.5.
UK BERD by broad product group
16.3 16.4 16.3 8.0 8.7 9.5 0.8 0.9 1.1 18.5 18.2 18.2 21.2 22.5 24.0 1.3 1.5 1.8 0 5 10 15 20 25 30 2018 2019 2020 2018 2019 2020 2018 2019 2020 Manufacturing Services Other sectors £ billion (current prices)
Chart 2.6. UK BERD by detailed product group
Business expenditure on R&D (BERD), the United Kingdom, 2020
Computer programming and information service activities; Software development
Miscellaneous business activities; Technical testing and analysis
Public administration
Wholesale and retail trade
Research and development services
Telecommunications
Transport and storage, incl. postal and courier activities
Chemicals and pharmaceuticals
Transport
Other manufacturing
Electrical machinery
Mechanical engineering
Aerospace
Construction
Agriculture, hunting and forestry; Fishing
Electricity, gas and water supply; Waste management
Extractive Industries
BERD using "old" methodology BERD using "new" methodology
Source: ONS (2022). Business enterprise research and development (R&D), UK: 2021 (published on 22 November 2022); and ONS (2021). Research and development in UK Businesses, 2020 – Datasets.
Four service product groups account for 85% of the £17.1 billion increase in R&D expenditure under the “new” ONS methodology for 2020:
o computer programming and informationservice activities, software development;
o miscellaneous business activities, technical testing and analysis;
o public administration; and
o wholesale and retail trade.
32
0.0 2.0 4.0 6.0 8.0 10.0
£ billion (current)
Chart 2.7. UK BERD by Standard Industry Classification
Business expenditure on R&D (BERD), the United Kingdom, 2020
£ billion (current prices)
Professional, scientific and technical activities
Information and communication
Manufacturing
Wholesale and retail trade; repair of motor vehicles and motorcycles
Administrative and support service-activities
Construction
Arts, entertainment and recreation
Financial and insurance activities
Human health and social-work activities
Public administration and defence; education; compulsory social security
Mining and quarrying
Agriculture, forestry and fishing
Other sectors
BERD using "old" methodology BERD using "new" methodology
Note: Other sectors include: accommodation and food-service activities; real-estate activities; water supply, sewerage, waste management and remediation activities; transportation and storage; electricity, gas, steam and air conditioning supply; other service activities; activities of households as employers and of extraterritorial organisations and bodies.
Source: ONS (2022). Business enterprise research and development (R&D), UK: 2021 (published on 22 November 2022); and ONS (2021). Research and development in UK Businesses, 2020 (Table b: Additional datasets).
Two sectors explain over 60% of the increase in business R&D expenditure under the “new” methodology:
o Information and communication activities account for 39% of the increase (£6.9 billion).
o Professional, scientific and technical activities account for 22% of the increase (£3.9 billion).
33
0.0 2.0 4.0 6.0 8.0 10.0 12.0 14.0
Chart 2.8. Manufacturing R&D: international comparison
Business expenditure on R&D (BERD), by product, selected countries, 2019 or latest available
Share of BERD using "old" methodology
Note: Data for Italy, Poland, and Spain refer to 2018
Share of BERD using "new" methodology
Source: OECD (2022). Business enterprise R&D expenditure by industry – Dataset; ONS (2022). Business enterprise research and development (R&D), UK: 2021 (published on 22 November 2022); and ONS (2021). Research and development in UK Businesses, 2020 (Table b: Additional datasets)
Following ONS revisions of methodology to estimate R&D conducted by businesses in the UK, manufacturing is not anymore the main contributor to business R&D performed in the country.
In 2019, the contribution of manufacturing to total business R&D conducted in the UK was 43%, equivalent to 20 percentage points below what previously published.
34
63% 73% 69% 66% 65% 62% 47% 45% 43% 41% 0% 10% 20% 30% 40% 50% 60% 70% 80% Italy Finland Belgium Slovak Republic Czech Republic Portugal Spain United Kingdom Poland % of manufacturing R&D on total BERD
Chart 2.9. Government expenditure on R&D
Government expenditure on R&D (GOVERD) as a share of GDP, selected countries, 2019
Source: OECD (2022). Main Science and Technology Indicators.
The recent methodological revisions have not impacted the estimate of the UK government’s spend on R&D.[1]
In 2019 UK government expenditure on R&D as a share of GDP was 0.12%, well below the OECD average of 0.24%.
Note: [1] ONS (2022). Gross domestic expenditure on research and development, UK: 2020 (published on 22 November 2022).
The ONS has indicated that official GOVERD figures will be published by the end of 2023.
35
0.24% 0.12% 0.00% 0.05% 0.10% 0.15% 0.20% 0.25% 0.30% 0.35% 0.40% 0.45% 0.50%
Chart 2.10. Flows of research and development funding in the
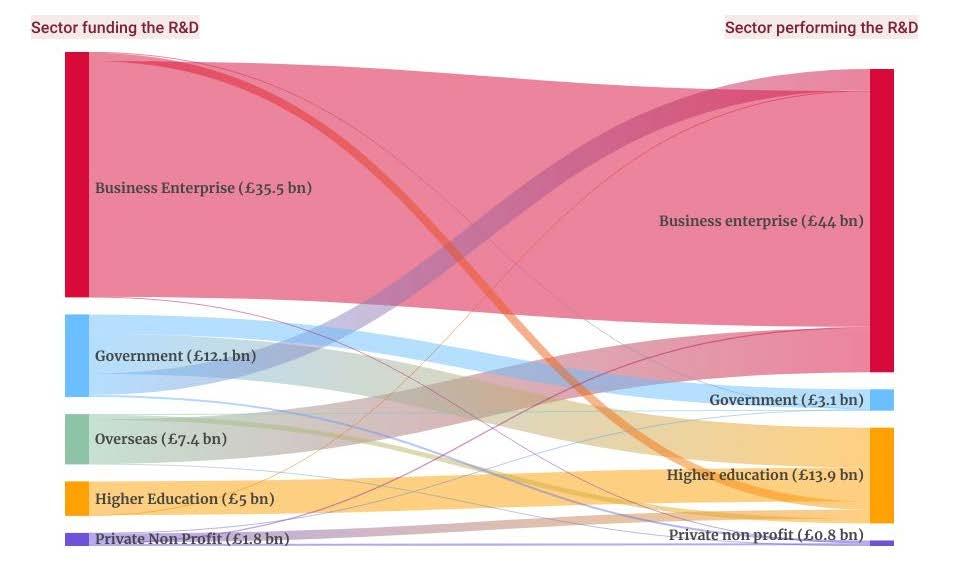
United Kingdom, 2020
Note: The chart is based on the ONS revised methodology to estimate research and development expenditure in the UK introduced in November 2022; government includes government, UK Research and Innovation and Higher Education Funding Councils.
Source: ONS (2022). UK gross domestic expenditure on research and development (R&D), 2020, published on 22 November 2022.
In 2020 the business sector performed 71.2% (£44 billion) of the total R&D in the UK, based on the ONS revised methodology to estimate R&D expenditure.
In the UK non-business R&D is concentrated in the higher education sector (22.5%), while the UK government performs only 5% of total R&D.
���� Related insight
According to Sir Paul Nurse’s Independent Review of the UK’s Research, Development and Innovation Organisational Landscape, many factors explain the concentration of nonbusiness R&D in the higher education in the UK, but a major reason is “past policy choices by government to channel R&D funding through universities, rather than a wider set of Government funded Research Performing Organisations”.[1]
Note: [1] Nurse P. (2023, p. 37). Independent Review of the Research, Development and Innovation Organisational Landscape - Final Report and Recommendations.
36
Chart 2.11. Top R&D-investing companies in the world
Number of companies, countries by headquarters, top 15 countries, 2021
Source: European Commission (2022). The 2022 EU Industrial R&D Investment Scoreboard.
A total of 95 of the world’s 2,500 top R&D-investing companies are headquartered in the UK, behind the US (822), China (678), Japan (233) and Germany (114).
Together, the US and China’s headquartered firms account for 60% of the world’s top 2,500 R&D-investing companies.
Pharmaceuticals and biotechnology and software and computer service firms account for 19.5% and 18.3%, respectively, of the total R&D expenditure conducted by the 2,500 top R&D-investing companies in 2021. [2]
Note: [1] The 2022 EU Industrial R&D Investment Scoreboard provides economic and financial information on the world’s top 2,500 firms investing in R&D. These companies have headquarters in 41 countries and represented 86.3% of the world’s expenditure in R&D funded by the business sector in 2021. See European Commission (2022). The 2022 EU Industrial R&D Investment Scoreboard.
[2] Industries are defined according to the Industry Classification Benchmark (ICB) FTSE International.
37
822 678 233 114 95 84 57 55 53 38 28 26 25 24 24 US China Japan Germany UK France Taiwan Switzerland Denmark South Korea India Netherlands Canada Sweden Ireland Number of companies
[1]
Chart 2.12. Top 100 companies investing in R&D
Note: Others include: Switzerland and France (two companies each); Finland, Sweden, India, Ireland, Denmark (one company each). Source: European Commission (2022). The 2022 EU Industrial R&D Investment Scoreboard
The UK hosted only 3 of the top 100 R&D-investing firms in the world in 2021. [1]
Together, the US and China hosted more than half of these firms.
���� Related insight
In 2021 the top three R&D-investing companies in the world were based in the US, namely, Alphabet (the parent company of Google), Meta (formerly Facebook) and Microsoft, which that year invested €27.9 billion, €21.8 billion and €21.6 billion, respectively.
The top three R&D-investing firms headquartered in the UK in 2021 were AstraZeneca and GSK (pharmaceuticals and biotechnology) and HSBC (banking).
Note: [1]R&D-investing companies are the 2,500 firms that invested the largest sums in R&D worldwide in 2021, as defined in the 2022 EU Industrial R&D Investment Scoreboard. Those companies have headquarters in 41 countries and represented 86.3% of the world’s expenditure in R&D funded by the business sector in 2021.
38
Number of companies, countries by headquarters, 2021 38 US 16 China 12 Germany 12 Japan 4 South Korea 3 UK 3 Netherlands 3 Taiwan 9 Others*
.
Chart 2.13. Top origins of patent applications
Top 20 countries of origin* of patent applications**, 2021
In 2021 UK-based applicants filed 53,608 patents globally, behind Germany (165,656 applications) and France (66,087 applications) but more than Switzerland, Italy, the Netherlands and Sweden.
The top five origins in 2021 were China, the United States, Japan, the Republic of Korea and Germany. These have been the top five origins for almost 20 years.
While China is the top origin of patent applications in the world, its share of applications filed abroad is much lower than other top origins, at 7.3%.
Note:
^Applications filed by applicants at a national or regional office (resident applications) or at a foreign office (applications abroad) are referred to as origin data. Here, patent statistics based on the origin of residence of the first named applicant are reported in order to complement the picture of patent activity worldwide.
*Origin: the country of residence (or nationality, in the absence of a valid residence) of the first-named applicant of an IP application. Country of origin is used to determine the origin of the IP application.
Source: World Intellectual Property Office (September 2022). World Intellectual Property Indicators 2022.
**Applications filed at regional offices (e.g. European Patent Office (EPO)) are considered equivalent to multiple applications in the relevant member states. Hence, the data for patent applications in this table is based on equivalent, not absolute, counts. For example, because the UK is one of EPO’s member states, the resident application data for the UK (17,215) is the sum of the number of patent applications filed with the UK’s Intellectual Property Office by the UK resident patent applicants (11,592) and the number of patent applications filed with EPO by the UK resident patent applicants (5,623).
39
Rank by total Origin Resident^ Abroad^ Share of abroad Total 1 China 1,426,644 111,905 7.3% 1,538,549 2 US 262,244 247,609 48.6% 509,853 3 Japan 222,452 190,399 46.1% 412,851 4 Republic of Korea 186,245 81,272 30.4% 267,517 5 Germany 65,757 99,899 60.3% 165,656 6 France 24,036 42,051 63.6% 66,087 7 UK 17,215 36,393 67.9% 53,608 8 Switzerland 9,732 38,512 79.8% 48,244 9 India 26,267 16,866 39.1% 43,133 10 Italy 15,205 18,961 55.5% 34,166 11 Netherlands 8,648 24,122 73.6% 32,770 12 Sweden 6,721 21,080 75.8% 27,801 13 Canada 4,710 21,794 82.2% 26,504 14 Russian 20,001 5,880 22.7% 25,881 15 Israel 1,592 15,749 90.8% 17,341 16 Denmark 3,710 10,373 73.7% 14,083 17 Belgium 3,285 10,674 76.5% 13,959 18 Finland 3,665 9,157 71.4% 12,822 19 Australia 2,966 9,855 76.9% 12,821 20 Spain 3,258 7,617 70.0% 10,875
Chart 2.14. Top 100 patent applicants at USPTO and EPO
Number of firms, country by headquarters, top patent applicants by the number of patents filed in 2021, United States Patent and Trademark Office (USPTO) and European Patent Office (EPO)
Others*:
Saudi Arabia, Ireland, Cayman Islands, Sweden, Finland (1 each)
Others^:
South Korea, Sweden, Saudi Arabia (2 each) Finland, UK, Liechtenstein, Ireland, Belgium, India (1 each)
Source: European Patent Office (cut-off date for data: 24 Jan 2022), Top 100 applicants 2021; the patent data for USPTO was retrieved from Lens.org on 22 February 2023.
In 2021 there were no UK-headquartered applicants among the top 100 applicants at the United States Patent and Trademark Office (USPTO); and only 1 among the top 100 applicants at the European Patent Office (EPO).
Note: USPTO
• The ranking of top 100 applicants at USPTO in 2021 is based on the number of patent applications filed with USPTO in 2021 (first-named applicant principle).
• The applicants in this ranking are not consolidated.
• If a subsidiary company is located in a different country from its parent company, it is separately allocated to the countries where its headquarters are.
• The countries refer to the country of residence of the headquarters.
EPO
• The ranking of top 100 consolidated applicants at EPO in 2021 (first-named applicant principle).
• The EPO ranking is based on European patent applications filed with EPO, which include direct European applications and international (PCT) applications that entered the European phase during the reporting period.
• Applications by identifiable subsidiaries, not necessarily located in the same country, are allocated to the consolidated applicants.
• The countries refer to the country of residence of the headquarters.
Patent application in 2021
• There is an 18-month publication lag between the earliest filing date of a patent and its publication date. However, the patent can be published earlier upon request from the applicant.
• There might be some patents that were filed in 2021 but which have not been published by the cut-off date for data extraction.
40
10 44 South Korea China Japan US 28 9 2 Taiwan 2 Germany 5 Others* 14 US 25 10 17 8 Japan 6 Germany China Netherlands 8 France Switzerland 12 Others^ Top 100 Applicants at EPO2 Top 100 Applicants at USPTO1
Chart 2.15. Top 10 UK patent applicants at USPTO and EPO
Firms with headquarters in the United Kingdom, top 10 applicants by the number of patents filed in 2021, United States Patent and Trademark Office (USPTO) and European Patent Office (EPO)
Number of patent applications
Rolls-Royce (aerospace) was the UK-based company that filed the most patents with the United States Patent and Trademark Office (USPTO) in 2021, followed by Imagination Tech (Semiconductor), Cirrus Logic Int. UK (Semiconductor) and ARM (semiconductors).
Unilever (consumer goods) was the UK-based company that submitted the most patent applications with the European Patent Office (EPO) in 2021, way ahead of Nerudia (tobacco) and British American Tobacco (tobacco).
Top 10 UK Applicants at USPTO1
Rolls-Royce was the only company to appear in both rankings, filing 67 more patents with USPTO compared to EPO.
The University of Oxford was the only research institute across both the USPTO and EPO rankings.
Note: USPTO
• The ranking of top 100 applicants at USPTO in 2021 is based on the number of patent applications filed with USPTO in 2021 (first-named applicant principle).
• The applicants in this ranking are not consolidated.
• If a subsidiary company is located in a different country from its parent company, it is separately allocated to the countries where its headquarters are.
Top 10 UK Applicants at EPO2
• The countries refer to the country of residence of the headquarters
• The ranking of top 100 consolidated applicants at EPO in 2021 (first-named applicant principle).
• The EPO ranking is based on European patent applications filed with EPO, which include direct European applications and international (PCT) applications that entered the European phase during the reporting period.
• Applications by identifiable subsidiaries, not necessarily located in the same country, are allocated to the consolidated applicants.
• The countries refer to the country of residence of the headquarters.
Patent application in 2021
Source: European Patent Office (cut-off date for data: 1 February 2022), Key data for selected countries United Kingdom 2021. The patent data for USPTO was retrieved from Lens.org on 22 February 2023.
• There is an 18-month publication lag between the earliest filing date of a patent and its publication date. However, the patent can be published earlier upon request from the applicant.
• There might be some patents that were filed in 2021 but which have not been published by the cut-off date for data extraction.
41
218 216 196 154 GSK Rolls-Royce Linde Unilever University Of Oxford Nerudia British American Tobacco BAE Systems Johnson Matthey British Telecommunications 524 178 90 88 84 83 162 60 59 57 53 47 0 50 100 150 200 250 300 350 400 450 500 550 Cirrus Logic International UK Rolls-Royce Illumina Cambridge Airbus Operations Imagination Tech ARM Jaguar Land Rover Graphcore Nicoventures Sophos 221 193 188 44
EPO
Explainer: The “new” ONS methodology to calculate R&D expenditure in the United Kingdom (1/2)
In November 2022, the Office for National Statistics (ONS) introduced a major revision to the methodology used to estimate R&D performed by businesses and the higher education sector.
The rationale behind ONS methodological revisions of business R&D relies on the need to take into account R&D activities conducted by small and medium enterprises (SMEs), underestimated under the methodology that was previously employed.
Discrepancies were found between ONS Business Enterprise Research and Development (BERD) statistics and HM Revenue and Customs (HMRC) research and development (R&D) statistics, which are based on a different population of companies and use different methodologies.
The revisions introduced align ONS methodology to methodologies used by other countries, particularly with respect to the sampling method employed. [1] While HMRC R&D statistics are based on administrative data provided by both large companies and SMEs claiming R&D tax relief, the population of ONS BERD statistics is composed of large companies (with more than 250 employees) and a random sample of SMEs. Therefore, under ONS BERD statistics, many SMEs conducting R&D activities risk being under-represented. [2]
The ONS also introduced methodological improvements to better capture the R&D performed by the higher education sector. Methods previously employed focused on assessing the flow of funding into higher education for R&D to be performed, but they were unable to capture the R&D actually performed (and funded) within the sector. Using a new methodology that also relies on a new data source – the Transparent Approach to Costing (TRAC) – the ONS is now also able to account for R&D performed within higher education and funded within the sector using its own funding sources. [3]
[1] ONS (2022). Options for transformation of business enterprise research and development statistics (published on 22 November 2022).
[2] ONS (2022). Comparison of ONS business enterprise research and development statistics with HMRC research and development tax credit statistics (published on 29 September 2022).
[3] ONS (2022). Gross domestic expenditure on research and development, UK: 2020 (published on 22 November 2022).
42
Explainer: The “new” ONS methodology to calculate R&D expenditure in the United Kingdom (2/2)
Comparing UK GERD using ONS “old” and “new” methodology, 2019 (£ billion, current prices)
GERD using "new" methodology Difference
According to the OECD’s Frascati Manual that sets up the guidelines to collect and report R&D data, the gross domestic expenditure on R&D (GERD) is the total inhouse expenditure on R&D performed in the national territory in a given time period.
GERD measures the total domestic R&D performed by the following sectors:
o The business enterprise sector (BERD)
o The government sector (GOVERD)
o The higher education sector (HERD)
Source: ONS (2022). UK gross domestic expenditure on research and development (R&D), 2020, published on 22 November 2022; ONS (2021). UK gross domestic expenditure on research and development (R&D), 2019 (published on 4 August 2021).
o The private non-profit sector (PNPRD)
43
Sector Difference on total (%) Government and UKRI (GOVERD) 2.7 2.7 0.0 0.0% Business enterprise (BERD) 26.0 42.2 16.2 76.7% Higher education (HERD) 9.1 14.0 4.9 23.4% Private non-profit (PNPRD) 0.84 0.82 -0.02 -0.1% TOTAL 38.6 59.7 21.1 100%
performing the R&D GERD using "old" methodology
Theme 3: Industrial performance –focus on the aerospace and food and beverages manufacturing sectors
UK INNOVATION REPORT 2023
44
The aerospace manufacturing sector
UK INNOVATION REPORT 2023
45
Theme 3a: Industrial performance – focus on the aerospace manufacturing sector
Key policy questions addressed
Are UK sectors becoming more or less competitive internationally?
How are UK sectors performing in terms of productivity, value added and employment?
Are UK sectors investing enough in R&D compared to their international competitors?
Key UK aerospace manufacturing trends in the last decade Drivers identified in literature review and sector expert consultations
Value added and productivity
Value added for UK aerospace manufacturing experienced a fall between 2006 and 2015, followed by a partial recovery until 2021. The UK ranked third among OECD member countries for aerospace manufacturing by value added in 2019, behind the US and France.
Value added for maintenance, repair and operations (MRO) has decreased by around two-thirds since 2010. MRO value added had previously remained stable between 1990 and 2010.
A decrease of 14,000 employees was observed in 2020–21 for aerospace manufacturing. Employee numbers had remained stable at around 90,000 employees between 2012 and 2020.
Labour productivity in UK aerospace manufacturing increased between 2012 and 2021. Sector productivity is the third highest in the OECD, behind France and the US.
The UK has one of the highest aerospace trade surpluses among comparator countries. The UK was the third largest net exporter of aerospace products in 2021, with a surplus of US$14.7 billion.
UK business R&D expenditure grew steadily between 2010 and 2019. The sector spent 37% more in 2019 than it did in 2010, compared to increases of 199% in Japan and 15% in Italy. The US and Germany had negative growth, while France remained stable.
The aerospace market is typically cyclical and sensitive to global crises, with the cycles closely linked to global economic performance.
Long-term order and contract pipelines shape investment planning and add resilience to the sector.
Demand from a handful of mostly foreign-owned OEMs has a significant effect on the whole UK aerospace supply chain, while investment decisions are often made abroad.
Company restructuring and supply chain consolidation were responsible for the recent fall in the number of sector employees.
Workforce know-how and closeness to leading R&D hubs anchors operations to the UK.
Competitive challenges and opportunities driving policy and industrial strategies include the market shift towards single-aisle aircraft, competition from low-cost economies, domestic supply chain development needs, trade restrictions, geopolitical issues, and input cost pressure on margins.
Trade
The UK’s specialisation in engines and aircraft components drives its high exports. R&D and innovation
Sector competitiveness is underpinned by its advanced R&D and innovation capabilities.
Government is a key enabler of sectoral R&D, innovation and competitiveness.
Continuous investment in innovation will be needed to seize the opportunities arising from emerging market and technology trends such as the transition from fossil fuels to zero-carbon aircraft, the emergence of new aircraft segments, industrial digitalisation, and space tourism.
46
Chart 3.1. Aerospace manufacturing – value added and employees
Top OECD countries by value added in 2019, aerospace manufacturing only, excluding maintenance, repair and operations (MRO)
Based on OECD data, the UK ranked third among member countries for aerospace manufacturing by value added in 2019. This is roughly 10 times lower than the value added reported by the United States at the top of the ranking.
France takes second place in this ranking, with total value added of US$18.3 billion, while Germany ranks just below the UK with a value added of US$12.6 billion.
The UK has the second-largest number of employees among top-performing countries, at 86,900 employees, below the United states (533,000) and above Germany (86,000) and France (64,000).
Note: [1] United Kingdom employee data for 2018.
[2] OECD provides the value added for each country in its national currency; these were converted into USD by referring to annual exchange rates provided by OECD.
Source: OECD STAN, ISIC4, Code D303 – air and spacecraft and related machinery; OECD, MEI, exchange rates (USD monthly averages). Accessed February 2023.
France reported the highest level of productivity, measured by value added per employee (US$285,900), followed by the US (US$251,600) and the UK (US$149,600).
47
Rank Country Value added^ Employees Productivity[2] (value added per employee) Billions US$, 2019 Thousand persons, 2019 Thousand US$, 2019 1 United States 134.1 533.0 251.6 2 France 18.3 64.0 285.9 3 United Kingdom[1] 13 86.9 149.6 4 Germany 12.6 86.0 146.5 5 Canada 8.0 60.8 131.7 6 Japan 6.9 56.0 123.2 7 Italy 4.7 42.8 109.8
Chart 3.2. UK aerospace – value added
Aerospace manufacturing and maintenance, repair and operations (MRO) (£ billion in Chained Volume Measure – CVM)
According to ONS data, value added for UK aerospace manufacturing experienced a fall between 2006 and 2015, followed by a partial recovery between 2015 and 2021.
Value added for maintenance, repair and operations (MRO) remained stable between 1990 and 2010, despite a short-term decrease during the 2008 financial crisis. MRO value added decreased by around two-thirds after 2010, reaching £0.9 billion in 2021, compared to £3.3 billion in 1990.
As suggested by consulted stakeholders, the demand for air travel drives the demand for aircraft, and this can easily be disrupted by external events.
For example, the demand for aircraft fell as a result of the 2001 global economic slowdown, further affected by events such as the conflict in the Middle East, the SARS crisis in Asia and the 9/11 terrorist attacks [House of Commons, 2005].
The 2008 financial crisis generated a lower impact in UK aerospace manufacturing, potentially due to a combination of government support and historically large order books from the larger manufacturers [House of Commons, 2017].
Source: ONS, GDP output approach – low-level aggregates (updated version: 22 December 2022); aerospace manufacturing (SIC 2007 Code 3030 for the manufacture of air and spacecraft and related machinery), MRO (SIC 2007 Code 3316 for the repair and maintenance of aircraft and spacecraft).
Data from civil aircraft manufacturers shows that both Boeing and Airbus had fewer aircraft deliveries during the COVID-19 pandemic, although this trend started to recover in 2021 [JADC, 2022].
48
8.0 0.9 0 2 4 6 8 10 12 14 16 1990 1991 1992 2000 1993 1994 1995 2002 2008 2009 2014 2003 2005 2015 2016 2011 2007 2017 2021 2001 1999 2012 1998 2019 2004 1997 2020 2006 2010 2013 1996 2018 Billion pounds (£) in chained v olume m easure (CVM) 10.2 3.3 CAGR (1990–2021) -3.9% CAGR (1990–2021):
+0.8%
Aerospace manufacturing Maintenance, repair and operations (MRO)
Chart 3.3. UK aerospace – employees
Note: [1] Data for aerospace manufacturing is at UK level; data for MRO is at GB level.
Source: ONS, Business Register and Employment Survey (BRES) in thousands; aerospace manufacturing (SIC 2007 Code 3030 for the manufacture of air and spacecraft and related machinery), MRO (SIC 2007 Code 3316 for the repair and maintenance of aircraft and spacecraft). Accessed February 2023.
The number of employees in the UK’s aerospace manufacturing sector remained stable at around 90,000 employees between 2012 and 2020.
The number of employees in maintenance, repair and operations (MRO) saw little change between 2009 and 2021, remaining just below 20,000 employees until 2019.
A decrease of 14,000 employees was observed in 2020–21 for aerospace manufacturing, attributed by the consulted stakeholders to redundancies in OEMs such as Airbus and Rolls-Royce, among others, due to company restructuring associated with lower production levels during the COVID-19 pandemic in 2020–21 [BusinessLive, 2021; BBC, 2020].
Despite OEMs cutting jobs in response to external events, the impact on direct employment is potentially limited, as firms aim to retain their skills base and manufacturing capacity. For example, Airbus’ 2021 revenue was 30% below that realised in 2019, but its workforce was only 15% smaller [Airbus, 2022].
49
manufacturing and maintenance, repair and operations (MRO)[1] 0 20 40 60 80 100 2009 2010 2011 2012 2013 2014 2015 2016 2017 2018 2019 2020 2021 Employees (thousands) Aerospace manufacturing Maintenance, repair and operations (MRO)
Aerospace
Chart 3.4. UK aerospace – productivity
Aerospace manufacturing and maintenance, repair and operations (MRO), value added (VA) per employee (£ thousand in Chained Volume Measure – CVM)
Based on the value added and number of employee trends observed in Charts 3.2 and 3.3, the following productivity trends can be observed (measured in value added per employee):
o Productivity in maintenance, repair and operations (MRO) activities in the UK decreased between 2012 and 2021, presenting a compound annual growth rate (CAGR) of -11.7% during this time period.
o In contrast, productivity in aerospace manufacturing increased between 2012 and 2021, with a 3.4% CAGR, from a lower baseline in 2012 compared to MRO.
Aerospace
Source: ONS, GDP output approach – low-level aggregates (updated version: 22 December 2022), ONS, Business Register and Employment Survey (BRES); Aerospace Manufacturing (SIC 2007 Code 3030 for the manufacture of air and spacecraft and related machinery), MRO (SIC 2007 Code 3316 for the repair and maintenance of aircraft and spacecraft).
50
0 20 40 60 80 100 120 140 160 2012 2013 2014 2015 2016 2017 2018 2019 2020 2021 Thousand pounds ( £) per employee in CVM
CAGR (2012–21): +3.4%
CAGR (2012–21): -11.7%
manufacturing Maintenance, repair and operations (MRO)
Chart 3.5. Aerospace manufacturing – trade balance
Global ranking by trade balance in aerospace manufacturing (excluding MRO)
2011
2021
The UK maintained its trade competitiveness in aerospace products from the perspective of trade balance over the 2011–21 period.
The UK moved up in the ranking as a net exporter of aerospace products, from fourth place in 2011, with a surplus of US$10.7 billion, to third place in 2021, with a surplus of US$14.7 billion.
The top five net exporters coincide with the top five manufacturers presented in Chart 3.1.
The improvement of the UK’s position in the trade balance ranking is driven by a slight increase in exports (US$2.4 billion) and a small decrease in imports (US$-1.6 billion) between 2011 and 2021.
Source: UN Comtrade (accessed in December 2022), HS 2017. Aircraft, spacecraft and parts thereof (Code 88); aircraft engines and parts thereof (Code 840710, 840910, 841111, 841112, 841121, 841122, 841191, 841210); aircraft seats and parts thereof (Code 940110).
The UK’s specialisation in engines and aircraft parts is reflected in exports, accounting for 79% of all UK aerospace overseas sales in 2016 (with 35% of those parts being wings, fuselage, doors, control surfaces, landing gear and fuel tanks, 23% being turbojet engines and 20% engine parts) [Make UK, 2019].
51
Rank Country US$ billion 1 USA 48.8 2 France 22.9 3 United Kingdom 14.7 4 Germany 9.4 5 Canada 4.4 6 Italy 2.6 7 Russian Federation 1.9 8 Israel 1.7 9 Spain 1.5 10 Poland 1.2 11 Mexico 0.8 12 India 0.5 13 Austria 0.5 14 Finland 0.4 15 Czechia 0.2 UK
2011 (US$ billion) 2021 (US$ billion) CAGR (2011–21) 32.4 34.8 0.7%
exports
2011 (US$ billion) 2021 (US$ billion) CAGR (2011–21) 21.7 20.1 -0.8%
UK imports
Rank Country US$ billion 1 USA 53.8 2 France 23.9 3 Germany 11.1 4 United Kingdom 10.7 5 Canada 4.1 6 Italy 3.0 7 Spain 2.4 8 Israel 1.3 9 Ukraine 0.7 10 Russian Federation 0.6 11 Mexico 0.5 12 Netherlands 0.5 13 India 0.4 14 Poland 0.2 15 Belgium 0.2
Chart 3.6. Aerospace manufacturing – global export market share
Top countries by export market share in 2021, excluding MRO (worldwide share = 100%)
The US had the largest aerospace products global export market share between 2011 and 2021, with a total share of 28.6% in the last recorded year.
Although France maintained its second place during the same time period, it experienced a fall from 19% in 2011 to 13.3% in 2021.
The UK surpassed Germany to occupy third place in this ranking in 2021, with a 10.8% export market share, while Germany’s share diminished from 14.2% in 2011 to 10% in 2021.
Source: UN Comtrade (accessed in December 2022), HS 2017. Aircraft, spacecraft and parts thereof (Code 88); aircraft engines and parts thereof (Code 840710, 840910, 841111, 841112, 841121, 841122, 841191, 841210); aircraft seats and parts thereof (Code 940110).
Singapore’s export market share grew from 2.4% in 2011 to 4.6% in 2021, occupying fifth position in this ranking. Breaking down the aerospace product categories exported by Singapore, the value of aircraft engines was US$10.5 billion in 2021, accounting for 71.4% of the total value of its aerospace exports that year.
52
0% 5% 10% 15% 20% 25% 30% 35% 40% 2011 2012 2013 2014 2015 2016 2017 2018 2019 2020 2021 Global export market share UK US France Germany Singapore
Chart 3.7. UK aerospace – trade balance
UK aerospace manufacturing, £ billion in CVM (excluding MRO)
The UK recorded positive trade balances in aerospace products between 2005 and 2021.
Despite two low points in 2010 and 2016, the UK recorded a more positive trade balance in aerospace products in 2021 than in 2005.
The outbreak of COVID-19 hindered the positive trend in trade balance, which was driven by the reduction of imports and the growth of exports.
Exports peaked in 2019, whereas the highest imports were recorded in 2016.
The value of aerospace exports in 2021 (£25.46 billion) was lower than a decade before, whereas the value of aerospace imports in 2021 (£15.93 billion) was only £0.76 billion higher than a decade before.
Exports Imports Balance
Source: ONS, UK trade in goods by classification of product by activity time series (updated version: 15 December 2022); aerospace manufacturing (SIC 2007 Code 3030 for the manufacture of air and spacecraft and related machinery).
53
0 5 10 15 20 25 30 35 40 2005 2006 2007 2008 2009 2010 2011 2012 2013 2014 2015 2016 2017 2018 2019 2020 2021 Billion pounds (£ billion) in CVM
Chart 3.8. Aerospace – business spending on R&D (a)
Business enterprise expenditure on R&D (BERD) in air and spacecraft and related machinery, top OECD countries
Business enterprise expenditure on R&D (BERD) (US$ million, 2015 PPP)
Business enterprise expenditure on R&D (BERD) growth (2010 = 100)[1]
As suggested by the consulted stakeholders, UK aerospace is a high-value sector driven by innovation. The ability to innovate has ensured the international competitiveness of the sector by staying at the forefront of technological development.
In absolute terms, business enterprise R&D expenditure in UK aerospace was the third highest in the OECD ranking in 2018, behind the US and France but ahead of Germany, Italy, Canada and Japan.
The US maintains a dominant position with aerospace business R&D expenditure in a different order of magnitude than comparator countries.
Note: [1] Data for Canada starts in 2014 and has been excluded from the BERD growth chart on the right, which takes 2010 as the reference year. Source: OECD Research and Development Statistics, ISIC Rev. 4, Code D303: air and spacecraft and related machinery. Accessed in March 2023.
Using 2010 as the reference year, the UK had the second-largest growth in BERD among the examined countries in 2019 (37%). Japan had the largest BERD expansion in 2019 (199%), while Italy had the third-largest growth (14%). In contrast, the US and Germany experienced reductions in business R&D expenditure between 2010 and 2018–19, while France had near-zero growth in 2017 after a few years of positive BERD expansion.
54
1,000 2,000 3,000 26,000 0 31,000 32,000 28,000 30,000 25,000 29,000 33,000 27,000 24,000 Canada Italy UK France Germany USA Japan 2010 2012 2014 2016 2018 2020 0 100 200 300 400 500 2012 2013 2018 2014 2015 2019 2016 2010 2020 2011 2017 UK, 137 Japan, 499 UK US France Germany Italy Japan
Chart 3.9. Aerospace – business spending on R&D (b)
UK business enterprise expenditure on R&D (BERD) by product group classification[1]
(£ billion in current prices)
Aerospace BERD with updated ONS methodology, £1.59 billion
ONS sectoral BERD data by product group classification shows that there was an overall reduction in UK aerospace BERD between 2005 and 2010, mostly driven by a fall in defence BERD.
BERD in defence aerospace diminished from £1.3 billion in 2005 to £0.4 billion in 2010, and has remained roughly stable after that.
In contrast, BERD in civil aerospace has shown a positive trend since 2000, with the overall aerospace sector BERD trend (in red) mirroring the civil aerospace trend (in green) since 2011.
Note: Civil and defence data combined do not always add up to the sector total because of rounding and different estimation.
ONS sectoral BERD data estimated with an updated methodology for 2018–21 shows a similar trend (dotted blue line) to data calculated using the previous methodology. The overall aerospace sector BERD was £1.59 billion in 2021.
Source: ONS, total intramural R&D – aerospace, total intramural R&D – civil aerospace, total intramural R&D – defence aerospace, business enterprise research and development, UK (designated as national statistics).
Note: [1] Developed by ONS, the term "product group" refers to business R&D expenditure allocated to the product group that best describes the subject type of R&D activities carried out by firms, rather than being based on the economic activities SIC classification.
0 0.5 1 1.5 2 2.5 1989 1990 1991 1992 1993 1994 1995 1996 1997 1998 1999 2000 2001 2002 2003 2004 2005 2006 2007 2008 2009 2010 2011 2012 2013 2014 2015 2016 2017 2018 2019 2020 2021 Billion pounds (£ billion) in current prices (CP)
Aerospace
55
Aerospace (sector total)
(Defence) Aerospace (Civil) Aerospace BERD with updated ONS methodology
Drivers behind the trends in the aerospace manufacturing sector
Insights from the literature review and consultations with sector experts
56
What is driving value added, productivity and trade trends in aerospace manufacturing? (1)
Value added for UK aerospace manufacturing experienced a fall between 2006 and 2015, followed by a partial recovery until 2021.
Key trend identified
A decrease of 14,000 employees was observed in 2020–21 for aerospace manufacturing.
While productivity in aerospace manufacturing has increased slightly since 2012, productivity in MRO has deteriorated significantly.
The UK has one of the highest aerospace trade surpluses among comparator countries.
The aerospace market is typically cyclical and sensitive to global crises, with the cycles closely linked to global economic performance
As suggested by the consulted stakeholders, the demand for air travel drives the demand for aircraft, and this can easily be disrupted by external events.
For example, the demand for aircraft fell as a result of the 2001 global economic slowdown, further affected by events such as the conflict in the Middle East, the SARS crisis in Asia and the 9/11 terrorist attacks. Together, these events led to a slowdown in passenger air travel and a decline in UK aerospace output [House of Commons, 2005].
Potential drivers identified from the literature review and consultations with sector experts (see Appendix 3.1 for details)
The 2008 financial crisis generated a lower impact in UK aerospace manufacturing, potentially due to a combination of government support and historically large order books from the larger manufacturers [House of Commons, 2017].
Data from civil aircraft manufacturers shows that both Boeing and Airbus had fewer aircraft deliveries during the COVID-19 pandemic, although this trend started to recover in 2021 [JADC, 2022]. In the case of Boeing, aircraft deliveries fell substantially in 2018 and 2019, following the suspension of deliveries of the 737MAX as the result of a series of safety concerns.
The defence aerospace market is typically less cyclical than civil aerospace, with performance more closely linked to a country’s defence budget than its economy [House of Commons, 2005].
Long-term order and contract pipelines shape investment planning and add resilience to the sector
A key point expressed by the consulted stakeholders, who differentiate between aerospace and other manufacturing sectors, is the clear visibility of the long-term order pipeline. In this regard, the backlog for global jet production increased by 645 to 14,060 between 2020 and 2021 [JADC, 2022].
New aircraft orders commit original equipment manufacturers (OEMs) and their key suppliers to long-term contracts, providing companies across the supply chain with the certainty to invest and innovate in the long term [Make UK, 2019]. Timeframes for aircraft development and production are long as a result of the complexity and safety requirements of modern commercial aircraft, with only a few aircraft development programmes running for decades within OEMs [House of Commons, 2017].
57
What is driving value added, productivity and trade trends in aerospace manufacturing? (2)
Value added for UK aerospace manufacturing experienced a fall between 2006 and 2015, followed by a partial recovery until 2021.
Key trend identified
A decrease of 14,000 employees was observed in 2020–21 for aerospace manufacturing.
While productivity in aerospace manufacturing has increased slightly since 2012, productivity in MRO has deteriorated significantly.
The UK has one of the highest aerospace trade surpluses among comparator countries.
Demand from a handful of mostly foreign-owned OEMs has a significant effect on the whole UK aerospace supply chain, while investment decisions are often made abroad
As identified by the interviewees, the UK aerospace sector is dominated by clusters of companies that produce complex aircraft components for original equipment manufacturers (OEMs), both in the UK and overseas.
A 2017 report by the House of Commons estimated that there were approximately 2,500 aerospace companies in the UK, 2,300 of which had fewer than 10 employees [House of Commons, 2017].
Overall, UK aerospace manufacturers feed into Airbus, Boeing, Bombardier, GKN, BAE Systems and Leonardo for aircraft programmes, and Rolls-Royce for engines [Make UK, 2019].
Potential drivers identified from the literature review and consultations with sector experts (see Appendix 3.1 for details)
A key OEM for UK aerospace is Airbus, with an estimated contribution to the UK economy of £5.6 billion in 2021, working with more than 2,000 UK suppliers and supporting over 86,000 jobs across the supply chain [Airbus, 2022].
Similarly, Boeing spent £1.4 billion with UK suppliers in 2014, supporting 12,700 jobs in the country, in addition to more than 2,000 direct jobs in early 2016 [Boeing, 2017].
The consultees indicated that, given that many of the aerospace manufacturing firms based in the UK are foreign-owned, investment decisions are typically made in headquarters abroad (usually in France, Germany or the US).
UK aerospace exports are driven by the sector’s specialisation in engines and aircraft components such as wings
As highlighted by the consulted stakeholders, the sector is highly export-intensive, with 59% of production exported (by value), the highest of any manufacturing sector [Make UK, 2019].
The UK’s specialisation in engines and parts of aircraft is reflected in exports, accounting for 79% of all UK aerospace overseas sales in 2016 (with 35% of those parts being wings, fuselage, doors, control surfaces, landing gear and fuel tanks, 23% being turbojet engines and 20% engine parts) [Make UK, 2019].
In contrast, 47% of the total supply into production was imported in 2014, highlighting the need for seamless trade in the sector [Make UK, 2019].
58
What is driving
value
Value added for UK aerospace manufacturing experienced a fall between 2006 and 2015, followed by a partial recovery until 2021.
A decrease of 14,000 employees was observed in 2020–21 for aerospace manufacturing.
added, productivity and trade trends in aerospace manufacturing? (3) Key trend identified
While productivity in aerospace manufacturing has increased slightly since 2012, productivity in MRO has deteriorated significantly.
The UK has one of the highest aerospace trade surpluses among comparator countries.
The recent fall in aerospace manufacturing employees is mostly related to COVID-19 company restructuring and supply chain consolidation
The consulted stakeholders highlighted that companies such as Rolls-Royce and Airbus underwent restructuring associated with lower production levels during the COVID-19 pandemic in 2020–21, reportedly cutting 8,500 and 1,700 jobs, respectively [BusinessLive, 2021; BBC, 2020].
OEMs seeking production efficiencies and cost reductions have started to outsource the development of entire sub-systems, as opposed to single components, in order to reduce the number of suppliers [Make UK, 2019]. Top-tier suppliers have consolidated the industry in recent years by offering manufacturing services that go from system to component level, largely eliminating the need for OEMs to seek out hundreds of suppliers to complete a new aircraft design [Partstat, 2018].
Potential drivers identified from the literature review and consultations with sector experts (see Appendix 3.1 for details)
Highly specialised workforce know-how
and closeness to world-leading R&D hubs anchor operations to the UK
The consulted stakeholders suggested that, although there are some benefits to overseas production, high costs and the risk of losing accumulated know-how could act as a disincentive for moving operations abroad. The high levels of technological skill involved in aerospace manufacturing mean that companies often benefit from keeping their manufacturing sites located close to where they do R&D, helping to anchor production in the UK in the near future [House of Commons, 2017].
Despite OEMs cutting jobs in response to external events, the impact on direct employment is potentially limited, as firms aim to retain their skills base and manufacturing capacity. For example, Airbus’ 2021 revenue was 30% below that realised in 2019, but its workforce was only 15% smaller [Airbus, 2022].
The UK MRO industry is expected to see growth in the coming years, despite pressures from European competitors
The UK has the largest MRO market share in Europe by revenue, above France, Germany, Russia and the rest of Europe, with UK-based Rolls-Royce and BAE Systems among the top five MRO market players in Europe [Mordor Intelligence, 2023].
The fleet age of major airlines such as Jet2, British Airways, Eastern Airways and Loganair (13.5 years, 13.6 years, 18 years and 23.4 years, respectively) is expected to generate demand for new aircraft-maintenance contracts [Mordor Intelligence, 2023].
The key challenge for the UK MRO sector is to prepare and position attractively for the more technology-intensive aircraft, for example: increased use of composites; increased use of electrical power; introduction of health monitoring, diagnostic and prognostic technologies; and enhanced cabin environment and interiors [BIS, 2016].
59
What is driving value added, productivity and trade trends in aerospace manufacturing? (4)
Value added for UK aerospace manufacturing experienced a fall between 2006 and 2015, followed by a partial recovery until 2021.
Key trend identified
A decrease of 14,000 employees was observed in 2020–21 for aerospace manufacturing.
While productivity in aerospace manufacturing has increased slightly since 2012, productivity in MRO has deteriorated significantly.
The UK has one of the highest aerospace trade surpluses among comparator countries.
A number of challenges/opportunities are driving policy and industrial strategies to ensure future aerospace sector growth Market shift towards single-aisle aircraft
The consulted stakeholders recognised the need for UK suppliers to respond to a market shift towards narrow-bodied, single-aisle aircraft. Single-aisle orders placed in the first 10 months of 2022 were the highest year-to-date figure for single aisles since 2014, with wide-body aircraft orders behind the pre-COVID level [ADS, 2022; Make UK, 2019].
Competition from emerging markets and highly productive advanced economies
Potential drivers identified from the literature review and consultations with sector experts (see Appendix 3.1 for details)
A 2016 government study reported that, based on data from prime contractors and major Tier 1 suppliers, the procurement spend in the UK grew by 1.4% from 2013 to 2014, compared to 5.2% for the rest of the world, signalling an increasing challenge from emergent competitors in lower-cost and developing economies [BIS, 2016].
Examples of emerging competitors in the civil aerospace market include Chinese, Japanese and Russian efforts to develop regional jet programmes [House of Commons, 2005].
Domestic supply chain development
To compete with low-cost emerging markets and highly productive advanced economies, continuous improvements and investments in quality and productivity are needed in order to benefit from new technologically evolved aircraft programmes [BIS, 2016].
Although the UK is known for its competence in areas such as engines and aerostructures, areas of opportunity exist in the development of capabilities and skills for other supply chain segments [Make UK, 2019].
Trade restrictions, geopolitical issues and input cost pressure on margins
As indicated by the consulted stakeholders, rising energy prices and the depreciation in sterling is putting significant upward pressure on manufacturers’ input costs and could put pressure on smaller companies that are less well positioned to absorb these increases.
Geopolitical issues such as the Russia–Ukraine war could impact the purchase of raw materials and the sales of commercial airplanes. For example, the consulted stakeholders stated that the war in Ukraine has disrupted the supply chain of raw materials such as titanium.
Competitors could try to encourage governments to find loopholes to raise the cost of production for UK businesses, for example, by removing EU exemptions for raw materials to raise the cost of production in the UK [Make UK, 2019].
60
What is driving business R&D expenditure trends in aerospace manufacturing? (1)
Key trend identified UK business expenditure on aerospace R&D grew on average between 1990 and 2020
The competitiveness of the UK aerospace manufacturing sector is underpinned by its advanced R&D and innovation capabilities
As suggested by the consulted stakeholders and other sources, UK aerospace is a high-value sector driven by innovation. The ability to innovate has ensured the international competitiveness of the sector by staying at the forefront of technological development.
Moving forward, the UK’s future competitiveness will depend on the sector’s ability to maintain a technological advantage in areas such as engines, wings and advanced systems. In addition, the UK is one of the few nations with the capabilities to design and build advanced helicopters [House of Commons, 2017].
Potential drivers identified from the literature review and consultations with sector experts (see Appendix 3.1 for details)
The government has played a key role in supporting sectoral R&D, innovation and competitiveness
Various government initiatives have been fundamental to maintaining competitiveness in the sector, including (non comprehensive list):
o The UK Aerospace Research and Technology (UKART) Programme, also known as the ATI Programme, founded in 2012–13 with a £3.9 billion joint government and industry investment to 2026 [ATI, 2021].
o The Aerospace Sector Deal (part of Industrial Strategy) focused on three grand challenges in the civil aerospace sector in December 2018 (i.e. artificial intelligence and data, clean growth and the future of mobility). The Industrial Strategy Challenge Fund committed a £125 million investment, backed by £175 million from industry, to support the Future Flight Challenge, aimed at exploring aircraft electrification and autonomy [BEIS, 2020].
o The Aerospace Growth Partnership (AGP) is a strategic partnership between the UK government, industry and other key stakeholders to tackle the barriers to growth through working groups focused on four main themes: UK aerospace strategy; manufacturing and supply chain competitiveness; sector skills; and engagement and communications. The AGP also supports the Sharing in Growth Programme, which has helped SMEs to secure contracts worth over £1 billion [Make UK, 2019].
61
What is driving business R&D expenditure trends in aerospace manufacturing? (2)
Key trend identified UK business expenditure on aerospace R&D grew on average between 1990 and 2020
Continuous government support is needed to seize the opportunities from emerging technology trends
A key message from the expert consultations is that government support programmes are critical for manufacturers to increase their competitiveness, and continuous support is needed to capture the opportunities related to emerging technologies and net-zero targets.
The consulted stakeholders suggested that, despite its strong international position, the sector could reinforce training/education for new skills requirements (e.g. data security, composite manufacturing and telecommunications) arising from the introduction of new technologies.
Similarly, the interviewees suggested that government support and funding for late-stage product development and commercialisation could be boosted, although support for early-stage technological innovation is strong with the help of AGP and ATI.
Emerging market and technology trends have shaped the direction of innovation efforts in recent years
Potential drivers identified from the literature review and consultations with sector experts (see Appendix 3.1 for details)
The transition from fossil fuels to zero-carbon aircraft: The UK aerospace industry can seize nearly 18% of the global market for more energy-efficient commercial aircraft, potentially worth £4.3 trillion in 2050 [ATI, 2022b]. Sustainable aviation fuels (SAFs), electric batteries and hydrogen are three alternatives to fossil fuels that are being explored by the aviation industry to achieve its decarbonisation targets. Technologies relating to highly-efficient and lightweight aircraft and near-net-shape manufacturing are also key enablers of this target [ATI, 2022].
Emergence of new aircraft segments: Drones for cargo or surveillance purposes, electric vertical take-off and landing (eVTOL) aircraft providing short journeys for fewer than 10 passengers, and regional air mobility providing short/medium trips for 10+ passengers are key emerging segments [ATI, 2022]. The ATI predicts that over the long term the conventional aircraft market will continue to retain the largest market share. However, this share is expected to gradually decline in volume and value with the electric aircraft, drone, eVTOL and regional air-mobility market growing. However, the consulted stakeholders suggested that the manufacturing of drones might not necessarily be conducted in the UK, as it is seen as a commoditised process.
Digitalisation of manufacturing: Digitalisation could benefit the aerospace sector by supporting new product design and development and supply chain integration for manufacturing and MRO. For example, virtual certification can reduce the cost of new product development, and virtual reality (VR) technology helps engineers to verify the feasibility of the maintenance related to new product designs [Airbus, 2019].
Space tourism: Despite being in its infancy, the commercial spaceflight market is expected to grow to £25 billion over the next 20 years. In 2017 the UK government announced that grants worth up to £10 million were being made available to help develop commercial launch capability for spaceflight to seize this opportunity [Make UK, 2019].
62
The food and beverages manufacturing sector
UK INNOVATION REPORT
63
Theme 3b: Industrial performance – focus on the food and beverages manufacturing sector
Key policy questions addressed
Are UK sectors becoming more or less competitive internationally?
How are UK sectors performing in terms of productivity, value added and employment?
Are UK sectors investing enough in R&D compared to their international competitors?
The value added of the UK food and beverages sector has increased during the last decade, while its productivity has remained roughly stable. The UK ranked sixth among OECD member countries for food and beverages manufacturing in 2019 by value added.
The UK has one of the largest food trade deficits among comparator countries, while it remains a leading exporter of beverages. The UK occupied the lower part of the global food trade balance ranking in 2021, with a total deficit in food trade balance of US$24.6 billion in 2021. In contrast, the UK ranked ninth in the global beverages trade balance ranking in 2021, with a surplus of US$1.25 billion.
UK business expenditure on food and beverages R&D has increased steadily during the last decade, comparable to other leading OECD nations. R&D expenditure by UK food and beverages firms was 36% higher in 2019 than in 2008, compared to increases of 283% in China and 142% in Korea, whereas the Netherlands recorded growth below UK levels.
Value added and productivity
The demand for food and beverages is inherently resilient to recession and external events.
Alcoholic beverages and other food products have been key to sector growth.
Ready-meals market growth correlates positively to post-2008 financial crisis recovery.
The long-term sustainability of the sector depends on its ability to tackle concerns such as inflation and rising energy costs, sterling depreciation, labour shortages, and threats such as climate change.
Trade
The sector’s domestic orientation contributes to resilience and food security, while it diminishes the appetite for export markets.
Food and drink exports reflect niche strengths in high-value segments for the UK.
Imports are a necessary and inevitable part of the UK food and beverages sector. R&D and innovation
Innovation is a key focus for the UK food and drink industry, with R&D investments driven by the need to create a more resilient and nutritious food supply.
Emerging regulations and high-level policy targets have partly shaped the direction of innovation efforts (e.g. the sugar tax, sustainability and net-zero targets, plastic packaging tax and related initiatives, food-waste targets).
Automation and digitalisation are seen as key to increasing sectoral productivity. However, economic uncertainty may diminish business confidence and investment in these solutions.
64
Key UK food and beverages manufacturing trends in the last decade Drivers identified in literature review and sector expert consultations
Chart 3.10. Food and beverages manufacturing – value added and employees
Top OECD countries by value added in 2019
The UK ranked sixth among OECD member countries for food and beverages manufacturing in 2019 by value added in US$. This is nearly three times lower than the value added reported by Japan and more than five times lower than the United States, which leads the ranking.
The UK’s food and beverages manufacturing sector had the lowest number of employees among the top-performing countries, with 409,000 employees in 2019.
Note: [1] Mexico value-added data for 2018, and Mexico employee data is unavailable.
[2] United Kingdom employee data for 2018.
[3] OECD provides the value added for each country in its national currency; these value added were converted into USD by referring to annual exchange rates provided by OECD.
The UK’s productivity (i.e. value added per employee) in food and beverages manufacturing was the second highest among top OECD performers, at US$96,200 per employee in 2019, below the US$112,700 per employee reported by the United States.
Source: OECD STAN, ISIC4, D10T11: food products and beverages; OECD, MEI, exchange rates (USD monthly averages). Accessed February 2023.
65
Rank Country Value added^ Employees Productivity[3] Value added per employee Billions US$, 2019 Thousand persons, 2019 Thousand US$, 2019 1 United States 215.3 1,911.0 112.7 2 Japan 111.4 1,736.0 64.2 3 Mexico[1] 53.8 N/A N/A 4 France 51.0 606.0 84.2 5 Germany 47.8 896.0 53.4 6 United Kingdom[2] 39.3 409.0 96.2
Chart 3.11. UK food and beverages manufacturing – value added
Food and beverages manufacturing (£ billion in CVM)
Manufacture of food products
Manufacture of beverages
Source: ONS, GDP output approach – low-level aggregates (updated version: 22 December 2022); manufacture of food products (SIC 2007 Code 10), manufacture of beverages (SIC 2007 Code 11).
According to ONS data, both the manufacture of food products and the manufacture of beverages have increased their overall value added since 2012 in the UK, after experiencing drops in value added between 2008 and 2012. Both sub-sectors reached their historical high points in 2021 (1990–2021 period of analysis).
Value added for food manufacturing was £25.4 billion in 2021, with a compound annual growth rate (CAGR) of 1.1% between 1990 and 2021.
Value added for beverages manufacturing was £7.1 billion in 2021, with a compound annual growth rate (CAGR) of 2.9% during the same time period.
Sector resilience was demonstrated during the 2008 financial crisis, when the production index for food and drink fell by 1.9 between May 2008 and May 2009, compared to 13.1 for manufacturing overall [IfM, 2010].
Similarly, UK household and eating-out expenditure on food and drink increased between 2001 and 2020 (including during the 2008 financial crisis) [DEFRA, 2022; DEFRA, 2023].
66
1995 1991 22 2008 2000 1990 1992 1993 1994 2006 2021 2017 1997 2001 2007 1996 2005 1998 2020 2011 2012 2016 2003 2002 26 0 2014 2 2018 2010 4 1999 2009 6 2013 18 2019 24 20 2015 2004 18.0 Billion pounds (£ billion) in chained v olume m easure (CVM) 7.1 25.4 2.9
CAGR
(1990–2021): +1.1% CAGR (1990–2021): +2.9%
Chart 3.12. UK food and beverages manufacturing– employees
The number of employees involved in UK food manufacturing increased by 10% between 2011 and 2019, surpassing 390,000 employees.
However, a drop of 2,800 employees was recorded for food manufacturing between 2019 and 2021.
There was a surge in the number of employees observed in food manufacturing during 2014–15, with total employees increasing by 29,500 within one year.
The number of employees involved in beverages manufacturing in the UK increased by 25% between 2011 and 2019, from 36,800 to 46,100.
Consulted stakeholders agree that unfilled vacancies remain a significant issue for UK food and drink manufacturers. For example, an industrial survey by the Food and Drinks Federation found that the number of vacancies per 100 employees increased to 9.1 in Q3 2022, from 6.3 in Q2 2022, while 76% of respondents reported vacancy rates of 0–10% [FDF, 2022b].
67
Thousands of employees, 2009–2021 2011 2012 2013 2014 2015 2016 2017 2018 2019 2020 2021 30 40 370 20 380 390 0 360 350 10 400 Employees (thousands) Changes (2011–19): +10% Changes (2011–19): +25% -2.8k (-0.7%)
of food products Manufacture of beverages
Manufacture
Source: ONS, Business Register and Employment Survey (BRES); manufacture of food products (SIC 2007 Code 10), manufacture of beverages (SIC 2007 Code 11).
Chart 3.13. UK food and beverages manufacturing – productivity
Manufacture of food and beverages, thousand £ per employee (in CVM)
Based on the value added and number of employee trends observed in Charts 3.11 and 3.12, the following productivity trends (measured in thousand pounds per employee) can be observed:
o The productivity of the UK beverages manufacturing sector diminished between 2011 and 2019, presenting a compound annual growth rate of -0.8% during this period, from £150,791 per employee in 2017 to £132,733 per employee in 2019.
Manufacture of food products
Source: ONS, GDP output approach – low-level aggregates (updated version: 22 December 2022); ONS, Business Register and Employment Survey (BRES); manufacture of food products (SIC 2007 Code 10), manufacture of beverages (SIC 2007 Code 11).
o The productivity of the UK food manufacturing sector increased slightly between 2009 and 2021, with a compound annual growth rate of 0.8%, totalling £65,100 per employee in 2021.
68
2009 2010 2011 2012 2013 2014 2015 2016 2017 2018 2019 2020 2021 110 90 40 100 50 60 70 80 120 130 150 140 160 Thousand pounds (£) in CVM per employee CAGR (2011–19): -0.8% CAGR (2009–21): +0.8%
Manufacture
of beverages
Chart 3.14. Food manufacturing –trade balance
Global ranking by trade balance in food manufacturing (excluding beverages)
2009 food
2021 food
The UK occupied the lower part of the global food trade balance ranking in both 2009 and 2021, with a total deficit in food trade balance of US$24.6 billion in 2021 (UK food exports totalled US$15.73 billion in 2021, compared to US$40.33 billion in imports).
Both UK food exports and imports increased between 2009 and 2021. The compound annual growth rate in food exports was 2.15% between 2009 and 2021, while imports recorded a 1.44% CAGR during the same period.
The UK produces around 60% of its domestic food consumption by economic value, part of which is exported, including the majority of grains, meat, diary and eggs [DEFRA, 2022b]. However, consulted stakeholders shared the view that the UK cannot produce all of the food it consumes because of geography, weather and/or resource and land availability and suitability.
Source: UN Comtrade (accessed in December 2022), HS 2007.
According to an industry survey by the FDF, the majority of manufacturers are focused on meeting local UK demand, with exports accounting for under 10% of their UK turnover for 58% of the sample [FDF, 2017].
69
Rank Country US$ billion 1 Brazil 38.85 2 New Zealand 34.53 3 Indonesia 29.49 4 Netherlands 26.79 5 Argentina 18.68 6 Thailand 17.65 7 Spain 14.10 8 Malaysia 13.00 9 Poland 12.73 10 Canada 11.37 … 134 Rep. of Korea -18.17 135 United Kingdom -24.60 136 USA -27.64 137 Japan -38.83 138 China -41.39 UK exports 2009 (US$ billion) 2021 (US$ billion) CAGR (2009–21) 12.18 15.73 2.15% UK imports 2009 (US$ billion) 2021 (US$ billion) CAGR (2009–21) 33.99 40.33 1.44%
Rank Country US$ billion 1 Brazil 27.29 2 Argentina 18.86 3 Netherlands 18.10 4 Thailand 15.69 5 Indonesia 10.97 6 New Zealand 9.30 7 Malaysia 9.01 8 Denmark 6.73 9 Ireland 6.30 10 Belgium 6.29 … 173 Saudi Arabia -6.93 174 Rep. of Korea -7.83 175 Russian Federation -12.37 176 United Kingdom -21.82 177 Japan -34.37
Chart 3.15. Beverages manufacturing –trade balance
(excluding food)
The UK ranked ninth in the global beverages trade balance ranking in 2021, after recording a significant improvement in its position compared to 2009, going from a total balance of US$0.03 billion in 2009 to US$1.25 billion in 2021.
Both UK beverages exports and imports increased between 2009 and 2021; however, the compound annual growth rate (CAGR) of beverage exports was over 1% larger than that of imports during this time period.
In 2021 the UK exported beverages totalling US$9.81 billion, while imports totalled US$8.57 billion.
France, Italy, Mexico, Spain and Austria were the top five performing countries in terms of beverages trade balance in 2021.
Source: UN Comtrade (accessed in December 2022), HS 2007.
Alcoholic beverages represented the thirdlargest share of businesses in the sector in 2017, with roughly the second-highest turnover and highest profits before taxes, above meat and meat product businesses, which had the fifth-highest profits before tax [FDF, 2017].
70
Global ranking by trade balance in beverages manufacturing
Rank Country US$ billion 1 France 17.27 2 Italy 9.97 3 Mexico 8.04 4 Spain 3.45 5 Austria 2.71 6 Netherlands 2.05 7 New Zealand 2.04 8 Thailand 1.38 9 United Kingdom 1.25 10 Chile 1.23 11 Belgium 1.13 12 Argentina 1.03 13 Portugal 0.93 14 Ireland 0.88 15 South Africa 0.61 UK exports 2009 (US$ billion) 2021 (US$ billion) CAGR (2009–21) 7.99 9.81 1.72% UK imports 2009 (US$ billion) 2021 (US$ billion) CAGR (2009–21) 7.96 8.57 0.62%
2021 beverages
Rank Country US$ billion 1 France 9.95 2 Italy 4.78 3 Mexico 1.65 4 Spain 1.42 5 Chile 1.29 6 Austria 1.26 7 Netherlands 1.15 8 Australia 1.01 9 Argentina 0.84 10 Ireland 0.82 11 Portugal 0.64 12 New Zealand 0.48 13 South Africa 0.39 14 Ukraine 0.25 15 Uruguay 0.15 … 29 United Kingdom 0.03
2009 beverages
Chart 3.16. Food manufacturing – global export market share
Top countries by export market share in 2021 plus the UK (worldwide share = 100%)
The US had the largest global export market share (7.5%) in food products in 2021, followed by Germany (6.6%), the Netherlands (6.4%), China (5%) and Brazil (4.2%).
The UK’s global market share in food exports decreased from 2% in 2010 to 1.5% in 2021. Between 2009 and 2020 the UK’s market share fluctuated around 1.9%, with a noticeable reduction recorded in 2020–21.
China surpassed Brazil as the fourth-largest global export market share in 2013, maintaining that position until 2021, with a 5% share above Brazil’s 4.2%.
Source: UN Comtrade (accessed in December 2022), HS 2007.
71
2009 2010 2011 2012 2013 2014 2015 2016 2017 2018 2019 2020 2021 6% 1% 7% 0 4% 5% 8% 9% Max: 2% in 2010 Global export market share Min: 1.5% in 2021
US Brazil Germany Netherlands China United Kingdom
Chart 3.17. Beverages manufacturing – global export market share
Top countries by export market share in 2021 (worldwide share = 100%)
France had the largest global export market share in beverages in 2021, with 16.3%, followed by Italy (9.1%), the UK (7.3%), Mexico (6.9%), the US (6.6%) and Germany (5.2%).
The UK’s global market share in beverage exports decreased from 11.2% in 2011 to 7.3% in 2021. Italy surpassed the UK’s export market share in 2019 and has maintained the secondlargest share in beverage exports since then.
Mexico has recorded an upward trend since 2014, surpassing Germany in 2019 and the United States in 2021, with a global beverages export market share just below that of the UK for the last recorded year.
Source: UN Comtrade (accessed in December 2022), HS 2007.
72
2009 2010 2011 2012 2013 2014 2015 2016 2017 2018 2019 2020 2021 0 2% 4% 6% 8% 10% 12% 14% 16% 18% Global export market share Max: 11.2% in 2011 Min: 7.3% in 2021 France Italy United Kingdom US Germany Mexico
Chart 3.18. UK food and beverages manufacturing – trade balance
Food and beverages, £ billion in CVM
The UK recorded large trade deficits in food products between 1997 and 2021.
The UK also recorded small trade deficits in beverages between 1998 and 2010, followed by small surpluses since then.
Export (Food)
Import (Food)
Max. surplus (beverages in 2019): £1.35 billion
The UK’s food trade deficit peaked in 2016 with a value of £19.46 billion, while the country’s beverages trade surplus reached a maximum of £1.35 billion in 2019.
Max. deficit (food in 2016): £-19.46 billion
Export (Beverages)
Import (Beverages)
Balance (Food)
Balance (Beverages)
Source: ONS, UK trade in goods by classification of product by activity time series (updated version: 15 December 2022); food (SIC 2007 Code 10), beverages (SIC 2007 Code 11).
Since the COVID-19 pandemic in 2020, the surplus in beverages trade balance has decreased by £0.49 billion, while the deficit in the food trade balance has reduced by £1.65 billion.
73
30 10 -10 -20 20 40 0 2009 2016 1999 2018 2017 2004 1997 1998 Billion pounds (£ billion) in CVM 2000 2001 2002 2003 2005 2007 2008 2006 2010 2011 2014 2015
2012 2019 2020 2021 2013
Chart 3.19. UK food and beverages manufacturing – top export and import products
Top 10, 2021
Top 10 export products in 2021 (£ million) Top 10 import products in 2021 (£ billion)
Whisky represents the top export product from the UK, with an export value of £4.6 billion in 2021, followed by chocolate exports worth £756 million during the same year.
Soft drinks are the only product that experienced positive growth in exports between 2019 and 2021 and 2020 and 2021, despite the COVID-19 pandemic.
Fruits, wine and vegetables were the top three import products in 2021. Of these, only wine imports have increased since 2020.
Wine is also the only beverage among the top 10 import products. Imports of various top products such as vegetables, pork and chicken have diminished since 2020.
Food Beverages
Source: Food and Drink Federation (FDF), 2021 Trade Snapshot.
74
4,600 542 474 467 756 736 565 490 448 5% -5% 0 -20% 20% -30% 0 -25% -15% -10% 5% 15% 25% -15 -10% 10% -5% Pork Changes (2019–21) Whisky Changes (2020 –21) Breakfast cereals Chocolate Salmon Cheese 553 Gin Soft drinks Wine Beef 4.0 2.5 1.7 1.5 1.4 1.4 1.3 1.2 0 25% 5% -10% 20% -20% -5% -20% -15% 15% -5% 0 -15% 5% -10% 10% 15% 10% Chicken Beef Pork Vegetables Chocolate Fruit Changes (2019–21) Changes (2020 –21) Cheese Wine 3.4 1.7 Vegetable oils Savoury snacks
Chart 3.20. Food and beverages – business spending on R&D
Business enterprise expenditure on R&D (BERD) in food products and beverages, top OECD countries[1]
In absolute terms, the UK had the third-largest business R&D expenditure among the OECD data sample in 2019 , while China maintains a dominant position, with a significantly larger business R&D expenditure than comparator countries (US data unavailable).
UK food and beverages businesses invest in R&D at a similar absolute level as those in the Netherlands. However, the Netherlands had the fourth-best trade balance in food and sixth in beverages in 2021, highlighting an export vocation.
R&D expenditure by UK food and beverages businesses recorded positive yearly growth from 2011 to 2019.
Overall R&D expenditure by UK food and beverages businesses was 36% higher in 2019 than in 2008, compared to increases of 283% in China, 146% in Korea, and 22% in the Netherlands. Mexico recorded negative yearly growth in business R&D expenditure between 2010 and 2019.
Note: [1] US BERD data unavailable.
Source: OECD Research and Development Statistics, ISIC Rev.4, Code D10T11: food products and beverages.
75
0 100 200 300 400 500 2008 2009 2010 2016 2013 2018 2014 2012 2019 2015 2020 2017 2011 China, 383 UK, 136 China Korea UK Netherlands Mexico
Business enterprise expenditure on R&D (BERD) growth (2008 = 100)
10,000 7,000 1,000 11,000 9,000 0 12,000 13,000 8,000 Korea UK Netherlands Mexico China 2009 2011 2013 2015 2017 2019
Business enterprise expenditure on R&D (BERD) (US$ million, 2015 PPP)
Chart 3.21. UK food and beverages – business spending on
R&D (BERD)
BERD by product group classification[1] (£ million in current prices)
Based on ONS data, UK business expenditure on R&D (BERD) in food manufacturing has increased since 2010, with a compound annual growth rate of 8.6% between 2010 and 2020 and a total BERD of £310 million in 2020.
Regarding beverages manufacturing, the ONS publishes annual BERD updates for beverage and tobacco products combined.
• BERD in this category (beverage and tobacco manufacturing) decreased after 2014, with a compound annual growth rate of -15.8% between 2010 and 2020 and a total BERD of £17 million in 2020.
Product innovation is a core strength of a sector that demands constant improvement to update and introduce new products, which require significant innovation beyond simple repackaging or rebranding [IfM, 2010].
Just over 11,600 new food and drink products were introduced in the UK in 2021, which reflects the highly competitive nature of the industry [Mintel, 2023].
Source: ONS, business enterprise research and development, UK (designated as national statistics) (updated version: 22 November 2022); manufacture of food products (SIC 2007 Code 10), manufacture of beverage and tobacco products (SIC 2007 Code 11 and 12).
Note: New BERD data for 2018–21 under the updated ONS methodology only provides estimates for the manufacturing sector as a whole (Code 10 to 33).
Note: [1] Developed by the ONS, the term "product group" refers to business R&D expenditure allocated to the product group that best describes the subject type of R&D activities carried out by firms, rather than based on the economic activities SIC classification.
76
310 95 0 50 100 150 200 250 300 350 2010 2011 2012 2013 2014 2015 2016 2017 2018 2019 2020 Million pounds (£ million) in current prices 136 17 CAGR (2010–20): +8.6 % CAGR (2010–20): -15.8% Manufacture of beverage and tobacco products Manufacture of food products
Drivers behind the trends in the food and beverages manufacturing sector
Insights from the literature review and consultations with sector experts
77
What is driving value added, productivity and trade trends in food and beverages manufacturing? (1)
Key trend identified
The value added of the UK food and beverages sector has increased during the last decade, while its productivity remained roughly stable
The UK has one of the largest food trade deficits among comparator countries, while it remains a leading exporter of beverages
Demand for the food and beverages sector is inherently resilient to recession and external events
The consulted stakeholders largely agreed that because food and beverages are essential customer goods, domestic demand for UK food and beverages tends to be more stable than products from other sectors.
Competition in the grocery retail sector helps to push prices down and shapes consumer preferences based on the highest-value propositions on offer [Make UK, 2020].
Sector resilience was demonstrated during the 2008 financial crisis. Between May 2008 and May 2009 the production index for food and drink fell by 1.9, compared to 13.1 for manufacturing overall. Exports grew by 5.4% in the first 9 months of 2009, compared with the same period in 2008, compared with the -14.3% performance for all UK commodity exports during the same period [IfM, 2010].
Potential drivers identified from the literature review and consultations with sector experts (see Appendix 3.1 for details)
UK household and eating-out expenditure on food and drink increased between 2001 and 2020 (including during the 2008 financial crisis). Although expenditure reduced in 2021 because of COVID-19, this is attributed to a fall in food and beverages eaten out of the household as a result of restaurants and other licensed premises being shut for large parts of the 2020–21 pandemic period [DEFRA, 2022; DEFRA, 2023].
Stakeholders also highlighted that UK food and beverage sector resilience is supported by adaptable and flexible supply chains, which have traditionally been capable of resisting external shocks (e.g. economic, climate, trade, transportation, labour) [DEFRA, 2021].
In addition, close collaboration between the government and the private sector to monitor, anticipate and respond to risks adds to the resilience of UK food and beverages supply chains [DEFRA, 2021].
The sector’s domestic orientation contributes to resilience and food security, while it diminishes the appetite for export markets
The UK produces around 60% of its domestic food consumption by economic value, part of which is exported, including the majority of grains, meat, diary and eggs, rising to 75% for food that can be grown in the country [DEFRA, 2022b]. This strong and consistent domestic production, combined with a diversity of international supply sources that avoids over-reliance on any one source, translates into a resilient UK food supply, albeit one that is not fully self-sufficient.
The interviewees suggested that food and drink manufacturers see exports as a secondary priority given the large and consistent domestic market.
For example, according to an industry survey by FDF, the majority of manufacturers are focused on meeting local UK demand, with exports accounting for under 10% of their UK turnover for 58% of the sample [FDF, 2017]. Potential export barriers identified by stakeholders included product shelf life and the fragile nature of their products [FDF, 2017].
78
What is driving value added, productivity and trade trends in food and beverages manufacturing? (2)
Key trend identified
The value added of the UK food and beverages sector has increased during the last decade, while its productivity remained roughly stable
The UK has one of the largest food trade deficits among comparator countries, while it remains a leading exporter of beverages
(continued)
The share of domestically produced food consumed in the UK increased from 51.1% in 2009 to 53.9% in 2020 [DEFRA, 2021].
Domestic production has been stable, with consumer demand balanced by imports and exports [DEFRA, 2021].
For the remaining share coming from abroad, the UK has diverse and longstanding trade links that meet consumer demand for a range of products at all times of the year. However, trade is dominated by countries in the European Union supply chain (28% of UK domestic consumption came from the EU in 2020, while the remaining 18% came from the rest of the world), which has exposed the UK to potential disruptions in the immediate aftermath of the exit from the EU [DEFRA, 2021].
Food and drink exports reflect niche strengths in high-value segments for the UK, which can be expanded to new markets
Potential drivers identified from the literature review and consultations with sector experts
(see Appendix 3.1 for details)
As suggested by the FDF and the consulted stakeholders, the UK’s export strengths in food and drink are often driven by innovation built on long-term past investment in food and beverages production processes, brands and local product identities [FDF, 2022].
Although the EU is still the largest market in the food and drink sector, there is an untapped export potential in non-EU markets, where exports grew 8% in 2021 compared to 2020. Overall, exports to the non-EU market accounted for 44.3% of total UK exports in 2021. New trade agreements such as the UK-Singapore Digital Economy Agreement and UK-South Korea Trade Agreement could further boost exports in the future [FDF, 2021].
Imports are a necessary and inevitable part of the UK food and beverages sector
The consulted stakeholders shared the view that the UK cannot produce all of the food it consumes because of geography, weather and/or resource and land availability and suitability. This means that, inevitably, some ingredients and products will have to be imported.
The production to supply ratio has remained stable over the last 2 decades, and for crops that can be commercially grown in the UK this has been around 75% [DEFRA, 2021].
Products that cannot be produced in the UK, such as rice, have to be imported. These are not only important products for consumer consumption but they also constitute key inputs for UK manufacturing industries such as the milling industry [DEFRA, 2002b].
Furthermore, imported products and raw materials that are not produced in the UK, such as tropical ingredients, help to extend the availability of produce outside their growing season in the UK [FDF, 2022].
79
What is driving value added, productivity and trade trends in food and beverages manufacturing? (3)
Key trend identified
The value added of the UK food and beverages sector has increased during the last decade, while its productivity remained roughly stable
The UK has one of the largest food trade deficits among comparator countries, while it remains a leading exporter of beverages
Ready-meal market growth correlates positively to post-2008 financial crisis sectoral recovery
The consulted stakeholders highlighted that the last decade saw a move by food retailers towards the introduction of ready meals at scale that most likely supported the overall growth of the food and drinks manufacturing sector in the aftermath of the 2008 financial crisis.
The UK ready-meal market experienced significant growth between 2008 and 2022, with sales of ready meals totalling £3,733 million in 2022, compared to £2,450 million in 2008 [Euromonitor Database, 2023]. The top three retailers by share of ready-meal sales in 2022 included Tesco (17.8%), Marks & Spencer (12.2%) and Sainsbury’s (10.7%) [Euromonitor Database, 2023].
Alcoholic beverages and other food products have been key drivers of sectoral turnover and profitability
Alcoholic beverages represented the third-largest share of businesses, with roughly the second-highest turnover and highest profits before taxes, above meat and meat product businesses, which had the fifth-highest profits before tax [FDF, 2017].
Potential drivers identified from the literature review and consultations with sector experts (see Appendix 3.1 for details)
The sub-sector known as other food products* not only had the largest share of businesses in the sector over the 2013–15 period but also generated the highest turnover and second-highest profits before taxes, only after the profitability of alcoholic beverage manufacturers [FDF, 2017].
*The other food product sub-sector includes the manufacture of sugar, cocoa, chocolate and sugar confectionery, the processing of tea and coffee, the manufacture of condiments and seasonings, the manufacture of prepared meals and dishes, the manufacture of homogenised food preparations and dietetic food.
A number of concerns are driving policy and industrial strategy to ensure future sector growth
Inflation and rising energy costs:
As suggested by the consulted stakeholders, the cost of food and beverages manufacturing is intrinsically linked to energy and input costs. Rises in energy and input prices through 2021–22 have been transferred to the food prices paid by consumers [DEFRA, 2023b]. The energy crisis that started in 2022 represents a challenge for food and beverages manufacturing businesses, particularly major energy users such as bakers and millers.
ONS data shows that higher energy prices had already impacted the production and/or supply of around 60% of food manufacturers back in March 2022, compared to only 38% of all UK businesses [FDF, 2022b].
Sterling depreciation:
The depreciation of sterling against the dollar since the start of 2022 has driven up the cost of imported ingredients and raw materials. A 2022 industry survey by the Food and Drink Federation found that around 57% of surveyed businesses reported being greatly impacted by the depreciation of sterling [FDF, 2022b].
80
What is driving value added, productivity and trade trends in food and beverages manufacturing? (4)
Key trend identified
The value added of the UK food and beverages sector has increased during the last decade, while its productivity remained roughly stable
The UK has one of the largest food trade deficits among comparator countries, while it remains a leading exporter of beverages
(continued)
Labour shortages:
The consulted stakeholders agree that unfilled vacancies remain a significant issue for UK food and drink manufacturers. For example, an industrial survey by the Food and Drinks Federation found that the number of vacancies per 100 employees increased to 9.1 in Q3 2022, from 6.3 in Q2 2022, while 76% of respondents reported vacancy rates of 0–10% [FDF, 2022b].
Potential drivers identified from the literature review and consultations with sector experts (see Appendix 3.1 for details)
Vacancies cover a wide range of roles and skills, including: high-skilled workers such as engineers, R&D scientists, area supervisors and sales administrators; technical specialists such as food and packaging technologists; and production operatives such as warehouse operators, machine operators, drivers, packers and seasonal workers [FDF, 2022b].
The consulted stakeholders highlighted automation as key to addressing labour shortages, although this can also lead to a need for upskilling the existing workforce. As suggested by the interviewees and the FDF, more sector-wide efforts are required to better connect the education system and industry to provide skills for the future [FDF, 2017].
Long-term threats
The consulted stakeholders highlighted a few potential risks to the stability and long-term sustainability of food ingredients and inputs, including: climate change, biodiversity loss, soil and water-quality degradation, and over-exploitation of natural capital resources, including fish stocks and water resources. This view was also shared by DEFRA’s Food Security Report 2021 [DEFRA, 2021].
The stakeholders viewed climate change as a major factor in medium- to long-term risks to the production of domestic UK food and beverages.
For example, wheat yields dropped by 40% in 2020 because of heavy rainfall and droughts during the growing season. The concern is that these events could become more frequent and unpredictable in the future, reducing the resilience of the UK food system [DEFRA, 2021].
81
What is driving business R&D expenditure trends in food and beverages manufacturing? (1)
Key trend identified UK business expenditure on food and beverages R&D has increased steadily during the last decade, comparable to other leading OECD nations
Product innovation is a key focus for the UK food and drink industry
Just over 11,600 new food and drink products were introduced in the UK in 2021, which reflects the highly competitive nature of the industry [Mintel, 2023].
Product innovation is a core strength of a sector that demands constant improvement to update and introduce new products, which require significant innovation beyond simple repackaging or rebranding. This competitive need is driving a sectoral push for investment in design and technology research and development (R&D) [IfM, 2010].
UK business and government R&D investments are driven by the need to create a more resilient and nutritious food supply
Potential drivers identified from the literature review and consultations with sector experts (see Appendix 3.1 for details)
The Knowledge Transfer Network (KTN) has identified five areas driving food and drink R&D efforts: i) healthier and more nutritious food; the use of agricultural and food-processing side-stream materials to produce nutritious food ingredients; the development of products based on sustainable sources of new materials and protein; flexible and scalable manufacturing solutions; and digital manufacturing [KTN, 2018].
The consulted stakeholders also highlighted low-emission production systems, food safety, packaging, recycling and lightweighting, and CO2 traceability as key R&D areas for the future.
In particular, the consulted stakeholders see biotechnology for new food and drink products as a key innovation trend in recent years and one where the UK can become a global leader. Biotechnology for agriculture and food and drink manufacturing includes areas such as biopesticides, biofertilisers, the production of cultured meat, genetic engineering for agrifood, bioagrochemicals, biotech-produced flavours and fragrances, and viticulture and plant-based proteins for yogurt, milk, egg and cheese products as an alternative to dairy and egg-based goods, among others [IfM, 2023].
Emerging regulations and high-level policy targets have partly shaped the direction of innovation efforts
The sugar tax: Introduced in April 2018, the tax was aimed at incentivising drink manufacturers to reduce the sugar content of soft drinks as a way to protect the public from excessive sugar consumption. The effect on beverage manufacturers’ recipes was significant: even before its imposition, over 50% of manufacturers took action to cut sugar in their products [Make UK, 2020].
Plastic packaging tax and related initiatives: Implemented in April 2022, the plastic packaging tax is aimed at reducing the use of plastics and increasing its recycling and collection [HMRC, 2022]. A previous initiative, the UK Plastics Pact, was launched in April 2018 by WRAP and supported by DEFRA, to set targets to reduce single-use packaging and increase the use of recyclable plastic packaging [WRAP, 2023]. In addition, the new extended producer responsibility (EPR) for packaging came into effect on 1 January 2023 to reduce unnecessary packaging and increase packaging recyclability [HMG, 2023].
82
What is driving business R&D expenditure trends in food and beverages manufacturing? (2)
Key trend identified
UK business expenditure on food and beverages
R&D has increased steadily during the last decade, comparable to other leading OECD nations
(continued)
Sustainability and net-zero targets: The UK’s net-zero emissions targets, which passed into law in 2019, require major changes in the food system, with many UK-based food and drinks companies establishing net-zero targets (e.g. Danone, Innocent, McCain, Nestlé, Tate & Lyle). This involves addressing key emissions sources in food ingredients, packaging, manufacturing, and distribution and storage, among other areas. Key areas of net-zero innovation for manufacturers include energy efficiency, electricity decarbonisation, process heat decarbonisation and the creation of sustainable refrigerants, as well as opportunities to extend shelf life, cut waste, increase efficiency of refrigeration and replace single-use plastics [FDF, 2021b]. Failure to comply with net zero standards could lead to competitiveness losses against foreign producers, as suggested by consulted stakeholders.
Potential drivers identified from the literature review and consultations with sector experts (see Appendix 3.1 for details)
Food-waste targets: Roughly 16% (1.5 million tonnes) of total UK food waste was caused by food manufacturers in 2018 [WRAP, 2020]. The UK government has committed to meeting the UN Sustainable Development Goal to halve per capita food waste and reduce food loss by 2030; in line with this, the Waste and Resources Action Programme and the Institute for Grocery Distribution launched the Food Waste Reduction Roadmap in 2018, establishing a series of milestones for retailers, food producers, manufacturers and hospitality and food-service companies to meet in order to tackle food waste in the UK. By 2020, 162 food producers and manufacturers representing 50% of the entire sector (by turnover) had joined this initiative [WRAP, 2020].
Automation and digitalisation are seen as opportunities to increasing sectoral productivity. However, economic and demand uncertainty may diminish business confidence and investment in these solutions
According to the consulted stakeholders, the implementation of automation solutions and other digital technologies has been a consistent innovation trend in the sector in recent years. Data from the British Automation and Robot Association (BARA) indicates that sales of individual robots to domestic food and beverages manufacturers had an annual growth of 35% in 2020 and 21% in 2021 [Food Manufacture, 2022].
However, investment confidence in the food and drink manufacturing industry has fallen in the last couple of years, with the FDF’s net confidence tracker reaching a record low of -79% in Q3 2021. Furthermore, short-term contracts with retailers might not provide the necessary long-term security to commit to high capital investments in automation, as suggested by consulted stakeholders.
This highlights an environment of business uncertainty fuelled by events such as the ongoing war in Ukraine and rising energy prices and inflation rates. According to FDF’s State of the Industry Report 2022 Q3, low confidence has prevented some food and drink businesses from investing in the adoption of automation to solve labour shortages, while over half of businesses in the FDF survey sample have prioritised investment in energy efficiency and fuel-switching over automation as a way to reduce costs [FDF, 2022b].
83
References
Sectoral analyses
Aerospace manufacturing sector analysis
ADS (2022). ADS Commercial Aircraft & Engine Data October 2022 results.
Airbus (2019). Stepping into the virtual world to enhance aircraft maintenance.
Airbus (2022). The Impact of Airbus on the UK Economy.
ATI (2021). Annual Review 2020/21.
ATI (2022b). Destination Zero.
BBC (2020). Coronvarius: plane-maker Airbus to cut 15,000 jobs.
BEIS (2020). Aerospace Sector Deal.
BIS (2016). UK Aerospace Maintenance, Repair, Overhaul and Logistics Industry Analysis.
Boeing (2017). Boeing in the UK.
BusinessLive (2021). Brolls-Royce to have cut 8,500 jobs by end of 2021 as restructure delivers savings.
House of Commons (2005). The UK Aerospace Industry.
House of Commons (2017). Aerospace Sector Report.
JADC (2022). Worldwide Market Forecast.
MakeUK (2019). Sector Bulletin: Aerospace.
Mordor Intellingence (2023). Europe Aircraft MRO Market - Growth, Trends, Covid-19 Impact, And Forecasts (2023 - 2028).
Partstat (2018). The Consolidation of the Aerospace Supply Chain.
Food and beverages manufacturing sector analysis
DEFRA (2021). Food Security Report 2021.
DEFRA (2022). Family Food 2020/21.
DEFRA (2022b). Government Food Strategy.
DEFRA (2023). Family Food Datasets.
DEFRA (2023b). Food Statistics in your Pocket.
Euromonitor Database (2023). Ready Meals in the United Kingdom.
FDF (2017). FDF Economic Contribution and Growth Opportunities.
FDF (2021). Trade Snapshot 2021.
FDF (2021b). Roadmap to Net Zero: Overview for the Uk Food and Drink Sector.
FDF (2022). A UK Trade and Investment Strategy for Food and Drink.
FDF (2022b). State of Industry Report.
Food Manufacture (2022). Robotics in UK food manufacturing: what are the latest trends?
HMG (2023). Packaging Waste: Prepare for Extended Producer Responsibility.
HMRC (2022). Plastic Packaging Tax: Steps to Take.
IfM (2010). Value of Food & Drink Manufacturing to the UK.
IfM (2023). Life sciences beyond human health: modern industrial biotechnology in the UK.
KTN (2018). Food & Drink Sector R&D Needs and Priorities: Alignment with the Industrial Strategy.
Make UK (2020). Sector Bulletin: Food and Drink 2020 Update.
Mintel (2023). Food and Drink Industry.
WRAP (2020). Food Waste Reduction Roadmap Progress Report 2020.
WRAP (2023). The UK Plastics Pact.
84
Appendix 3.1
Stakeholder consultation – aerospace and food and beverages manufacturing sectors
In an attempt to understand the reality behind the data, Theme 3 was informed by a reduced number of interviews with key UK stakeholders from industry and government – including R&I funding programme management agencies, industry associations and key private-sector organisations. The consultation included representatives from the following organisations:
Aerospace manufacturing sector analysis
ADS
Airbus
ATI
CloudNC
Deloitte
Department for Business and Trade (formerly BEIS)
GKN
LISI Aerospace
Make UK
Rolls-Royce
Food and beverages manufacturing sector analysis
Britvic Soft Drinks
Clegg Food Projects
DEFRA
Food and Drinks Federation (FDF)
Innovate UK
Knowledge Transfer Network (KTN)
PepsiCo
Raynor Foods
Red Tractor
Samworth Brothers
University of Lincoln
University of Manchester
85
Theme 4: Science and engineering workforce UK INNOVATION REPORT
Theme 4: Science and engineering workforce
Theme Policy questions and key messages
Key policy questions addressed
Is the UK producing enough scientists and engineers?
Is the UK government investing enough in technical and vocational education?
How does this compare with other countries?
Key findings
The UK has relatively high shares of graduates in STEM disciplines, but the share of graduates in the STEM sub-discipline of engineering, manufacturing and construction remains relatively low
In 2020 STEM (science, technology, engineering and mathematics) graduates in the UK accounted for 41% of total graduates, above countries such as France (35%), Canada (39%), and similar to the US.
The share of graduates in engineering, manufacturing and construction in the UK, at 9%, is low compared with countries such as Germany (26%) and Korea (21%).
The UK higher education system has been continuously attracting international students who show a preference for non-science fields of study
In 2020 the share of international students enrolled in tertiary education courses in the UK was 20.1%, against an OECD average of 10.1%.
Between 2017/18 and 2021/22, the number of international students enrolled in the UK increased by 45%.
For the academic year 2018/19, 61% of international students were enrolled in non-science subject courses. The UK has a relatively low share of researchers working in the business sector, and women researchers are under-represented
In 2020 the business sector in the UK employed 42% of researchers, below Korea (82%), Japan (75%) and the US (72%) but also below countries such as France (63%) and Germany (60%).
In 2019 women accounted for 39% of total researchers, placing the UK in the top 10 of OECD countries.
In the UK female graduates are under-represented in some STEM disciplines, particularly in engineering, manufacturing and construction.
87
Chart 4.1. Graduates by subject area
Bachelor degrees or equivalent, selected countries, 2020
90%
80%
70%
60%
50%
40%
30%
20%
10%
The UK has historically had relatively high levels of tertiary education attainment. In 2021 the level of tertiary education attainment in the UK was 50.1%, well above the OECD average (39.7%). [1]
In 2020 STEM (science, technology, engineering, and mathematics) graduates in the UK accounted for 41% of total graduates. The value was above comparator countries such as France (35%), Canada (39%), and similar to the US (41%).
12% 14%
5% 14% 14% 17%
62% 65% 57% 53% 59% 59% 0%
100% Canada France Germany Korea United Kingdom United States Natural sciences, mathematics and statistics ICTs Engineering, manufacturing and construction Agriculture and related subjects Health Non-STEM
Note: [1] Tertiary education attainment is measured as the percentage of the population aged 25–64, in the same age group, with a Bachelor’s degree or above. Source: OECD (2023). Adult education level (indicator). 5% 4% 5% 5% 5% 5% 9% 7% 26% 21% 9% 8%
The share of graduates in engineering, manufacturing and construction remains relatively low in the UK, at 9%, especially compared to countries such as Germany (26%) and Korea (21%).
88
Note: Non-STEM subject areas include: arts and humanities; social sciences, journalism and information; business, administration and law; education; generic programmes and qualification; field unknown. Source: OECD (2022). Education at a Glance database. 12% 10% 5% 6% 12% 11%
Chart 4.2. Women in STEM tertiary education
Female graduates, share of total graduates, selected countries, 2020
While women have tertiary education attainment levels that are higher than men, they are usually under-represented in some STEM disciplines, in both the UK and most OECD countries. [1]
In 2020, in the UK, women represented 26% of graduates in engineering, manufacturing and construction degrees, against the 27% OECD average. In ICT disciplines, women represented 21% of graduates, against the OECD average of 22%.
Natural sciences, mathematics and statistics are the fields of study that have higher shares of female graduates among STEM disciplines. In 2020 the share of female graduates among natural sciences, mathematics and statistics graduates in the UK was 46%, below the OECD average (53%).
Source: OECD (2022). Education at a Glance database.
Note: [1] Engineering UK (2022). Trends in the engineering workforce between 2010 and 2021.
89
53% 46% 22% 21% 27% 26% 0% 10% 20% 30% 40% 50% 60% 70% 80% % of female graduates
sciences, mathematics and statistics ICTs Engineering, manufacturing and construction
Natural
Chart 4.3. International students in the UK
Number of students from abroad enrolled in UK higher education institutions
International student enrolment by subject area (%) in UK higher education institutions – 2018/19
In 2020 the share of international students enrolled in tertiary education courses in the UK was 20.1%, against an OECD average of 10.1%.[1]
Only Luxemburg (48.8%) and Australia (26%) had a higher proportion of international tertiary students enrolled in 2020.
The UK higher education system has been continuously attracting international students. Between the academic years of 2017/18 and 2021/22, the number of international students enrolled in the UK increased by 45%, despite the decrease in new students coming from the EU.
For the academic year 2018/19, 61% of international students showed a preference for non-science subject areas.
In the academic year 2018/19, the share of international students enrolled in engineering, technology and construction was 14%.
Source: HESA (2022). Figure 9 – HE student enrolment by domicile.

Source: HESA (2022). Table 22 – HE student enrolment by subject of study and domicile.
Note: [1] OECD (2023). International student mobility (indicator).
90
1% 5% 6% 13% 14% 61% 0% 20% 40% 60% 80% Agriculture and reated subjects Computer science Physics and mathematics Health Engineering, technology and construction Non-science subject areas % of international students 143 120 326 560 0 100 200 300 400 500 600 700 800 2017/18 2021/22 Thousands Non-EU students EU students Total international students
Chart 4.4. Graduates entering the workforce in the UK
Graduates entering work in the UK by field of study and economic sector, 2019/2020
Field of study
The chart on the left shows which economic sectors STEM graduates entering work in the UK are employed in, by subject area of degree for the academic year 2019/20, for example:
o Engineering and technology graduates: 24% work in manufacturing; 21% in professional and scientific activities; and just 3% in finance and insurance.
o Physics graduates: 21% work in professional and scientific activities; 17% in education; 14% in manufacturing; and 11% in information and communication.
o Mathematics graduates: 19% work in finance and insurance; 18% in education; 17% in professional and scientific activities; and 16% in information and communication.
o Computing graduates: high concentration in the information and communication sector (41%).
Note: Other sectors include: mining and quarrying; electricity, gas, steam and air conditioning supply; water supply; sewerage, waste management and remediation activities; transportation and storage; accommodation and food-service activities; real-estate activities; administrative and support-service activities; and arts, entertainment and recreation; other service activities; activities of households as employers; undifferentiated goods- and services-producing activities of households for own use; and the activities of extraterritorial organisations and bodies.
Source: HESA (2022) Figure 11 – standard industrial classification of graduates entering work in the UK by subject area of degree – higher education providers (HEPs) – academic year 2019/20
91
Agriculture and related studies Physics Mathematics Engineering and technology Computing Architecture Natural sciences Economic sector Information and communication 1% 11% 16% 8% 41% 1% 5% Other sectors 20% 9% 8% 12% 9% 11% 17% Wholesale and retail trade; repair of motor vehicles and motorcycles 12% 7% 6% 7% 9% 4% 10% Professional, scientific and technical activities 15% 21% 17% 21% 8% 45% 24% Education 8% 17% 18% 7% 8% 3% 12% Financial and insurance activities 1% 5% 19% 3% 8% 1% 4% Manufacturing 14% 14% 4% 24% 6% 2% 3% Public administration and defence; compulsory social security 4% 6% 5% 4% 4% 7% 10% Human health and social work activities 5% 7% 3% 2% 3% 2% 5% Administrative and support service activities 2% 2% 3% 3% 3% 2% 4% Construction 1% 1% 1% 9% 1% 22% 5% Agriculture, forestry and fishing 17% 0% 0% 0% 0% 0% 1%
Chart 4.5. Engineering profession salaries
Gross annual salary, median, full-time employees, 2022
Electrical engineers
IT business analysts, architects and systems designers
Research and development (R&D) managers
Electronics engineers
Engineering project managers and project engineers
Cyber-security professionals
Programmers and software development professionals
Quality assurance and regulatory professionals
Civil engineers
IT quality and testing professionals
Aerospace engineers
Information technology professionals n.e.c.
Engineering professionals n.e.c.
Production and process engineers
Mechanical engineers
Quality control and planning engineers
IT network professionals
Web design professionals
Environment professionals
Median gross annual salary
Note: Standard Occupational Classification (SOC) codes for the engineering professions are based on Engineering UK (2018). The State of Engineering 2018; SOC2010 Codes were updated to SOC2020 Codes based on ONS (2022). SOC 2020 Volume 2: the coding index and coding rules and conventions.
Source: ONS (2022). Annual Survey of Hours and Earnings (ASHE) – Table 14.7a.
In 2022 the median salaries for engineering occupations in the UK were higher than the average in the job market.
In 2022 the median for engineering professionals’ gross annual salaries was £42,986, against £33,000 of all UK workers.
£- £10,000 £20,000 £30,000 £40,000 £50,000
92
salary –all employees £33,000
salary
engineering professions £42,986
Median
Median
–
Chart 4.6. Researchers by sector of employment
% of total researchers, FTE, selected countries, 2020 or latest available
Compared to key competitor countries, the UK has a relatively low share of researchers working in the business sector.
In 2020 the business sector in the UK employed 42% of researchers, below the share employed by Korea (82%), Japan (75%) and the US (72%) but also below countries such as France (63%) and Germany (60%).
Roughly 2% of UK researchers worked in the government sector in 2020, below comparator countries such as Italy (15%), Germany (14%) and France (9%).
The UK stands out for the share of researchers working in higher education (55%), the highest among comparator countries, followed by Switzerland (50%), Canada (35%) and Italy (35%).
Note: For Switzerland, the UK and the US, data refers to 2019; for the US, data is only available for business enterprises. Source: OECD (2022). R&D personnel by sector and function database.
93
82% 75% 72% 63% 60% 60% 48% 47% 42% 6% 4% 9% 5% 14% 1% 15% 2% 10% 20% 26% 35% 26% 50% 35% 55% 0% 10% 20% 30% 40% 50% 60% 70% 80% 90% 100% Korea Japan United States France Canada Germany Switzerland Italy United Kingdom Business enterprise Government Higher education Private non-profit
Chart 4.7. Women researchers
% of total researchers, headcount, top 15 countries, 2019
% of total researchers
Note: Data for the US not available.
Source: OECD (2022). Main Science and Technology Indicators.
In 2019 the UK had a relatively high share of women researchers, featuring in eighth place among OECD countries where data is available.
94
50.6% 49.1% 42.8% 42.4% 41.3% 41.0% 39.0% 39.0% 38.6% 38.1% 37.6% 37.0% 35.8% 35.3% 34.8% 0% 10% 20% 30% 40% 50% 60% Latvia Lithuania Portugal Estonia Spain Slovak Republic Greece United Kingdom Norway Ireland Poland Türkiye Switzerland Denmark Chile
Theme 5: Environmental Innovation
UK INNOVATION REPORT
For many, the greatest challenge of the 21st century is climate change and environmental sustainability. Markets for new technologies that can help businesses and countries to achieve sustainability targets are expanding; therefore, they are a key area in which innovative activity has the potential to contribute to national economic growth and competitive advantage.
Our 2023 Innovation Report has environmental innovation as a topic in focus, to highlight how the UK is performing in what has the potential to be a high-growth economic sector. While environmental goods, services and technologies are not clearly classified within typical economic indicators, this section brings together available data from the ONS, OECD and the EU to provide a snapshot of whether environmental innovation is translating into economic growth in the UK.
Special theme
Theme 5: Environmental innovation
Key policy questions addressed
How does the UK compare in environmental and energy technology research and development (R&D) investment?
How is R&D expenditure translating into patenting performance?
Is the UK capturing the economic potential of the transition towards environmental sustainability?
Key findings
The government R&D budget allocated to environment and energy innovation in the UK (as a share of total R&D budget) is similar to other leading nations, and has a positive correlation with the country’s ranking in environment-related patent applications
The UK had the sixth highest government budget allocation for R&D in environment and energy innovation among OECD countries in 2020. This represented 6% of the UK’s total budget allocation for R&D, higher than that of the United States (3%), but lower than Japan (8%), Germany (8%), Korea (8%), and France (9%).
The UK ranked seventh in the world by the number of environment-related patent applications according to OECD data, behind Japan, the US, Germany, Korea, China, and France, and ahead of Taiwan, Canada and Italy.
Half of the environmental goods and services sub-sectors in the UK have grown over the last decade (2010-2019) in terms of GVA, while the rest have declined
Output in the UK environmental goods and services sector (EGSS) was estimated to be £89.0 billion in 2019 (up 4.4% from 2018), while gross value added was estimated to be £45.2 billion in 2019 (up 5.4% from 2018), and employment registered 394,900 full-time equivalent employees in 2019 (down 4.7% from 2018).
The production of renewable energy was the activity in 2019 with the largest share of total EGSS output (22.5%) and GVA (26.4%).
The activity of waste had the largest share of total EGSS employment (29.3%) and the second-largest share of total EGSS output (17.8%) in 2019.
The UK environmental goods and services sector performs strongly at European level, ranked 2nd by GVA only behind Germany
Output in the UK environmental goods and services sector was the 3rd highest in Europe in 2019, after Germany and France.
Gross value added in the UK EGSS was the 2nd largest in Europe in 2019, after Germany.
Exports from the UK EGSS were the 3rd largest in Europe in 2019, after Germany and Austria.
Employment in the UK EGSS was the 5th highest in Europe in 2019, after Germany, France, Spain and Italy.
96
UK emissions of greenhouse gases by industry, share of total emissions in 2019
The UK emissions were the 18th largest In the world in 2019. [1]
Total UK emissions in 2019: 440,080 ktCO2e [1]
The UK is one of the top 20 emitters globally and has aboveaverage emissions per capita, even before accounting for emissions embedded in imported goods. The UK’s emissions were the 18th largest in the world in 2019.[1]
In 2019, four industry sections accounted for 73% of carbon emissions in the UK: consumer expenditure (26%); electricity, gas, steam and air conditioning supply (16%); transport and storage (16%); and manufacturing (15%).
Carbon emissions abatement represents a significant challenge but also a significant opportunity for innovation, together with other legally binding environmental targets set by the government’s Environment Act:[2]
o Halt the decline in species populations by 2030;
o Restore precious water bodies to their natural state;
o Deliver net zero ambitions and boost nature recovery by increasing tree and woodland cover to 16.5% of total land area in England by 2050;
o Halve the waste per person that is sent to residual treatment by 2042;
o Cut exposure to the most harmful air pollutant to human health – PM2.5;
o Restore 70% of designated features in Marine Protected Areas to a favourable condition by 2042.
Note: UK resident basis, greenhouse gases under the Kyoto Protocol
Source: ONS (2022). Atmospheric emissions: greenhouse gases by industry.
Note: [1] World Bank (2022) Total greenhouse gas emissions (kt of CO2 equivalent), 2019 figures. [2] DEFRA (2023) . Environment Act.
26% 16% 16% 15% 9% 5% 4% 3% 2% 0% 5% 10% 15% 20% 25% 30% Consumer expenditure (travel and not travel) Electricity, gas,
and
conditioning
Transport
steam
air Construction Sector emissions as % total UK emissions in 2019 97
supply
and storage Manufacturing Agriculture, forestry and fishing
Water supply; sewerage, waste management and remediation activities
Mining and quarrying Wholesale and retail trade; repair of motor vehicles and motorcycles
Chart 5.1. UK carbon emissions by sector
Chart 5.2 Government budget allocations for R&D (environment & energy innovation)
2020, top countries (2015 US Dollars)

In absolute numbers, the UK had the sixth highest government budget allocation for R&D in environment and energy innovation among OECD countries in 2020.[1]
This represented roughly 6% of the UK’s total budget allocation for R&D. This share is higher than that of the United States (3%), but lower than other leading countries such as Japan (8%), Germany (8%), Korea (8%), and France (9%).
Government budget allocations for R&D in environmental innovation are significantly lower than allocations for energy R&D in all leading nations, except for Italy where both categories show similar budget allocations in absolute numbers.
Note: [1] The OECD presents data on Government budget allocations for R&D (GBARD) by socio-economic objective (SEO), using the NABS 2007 classification. Geographic coverage includes OECD members plus Romania, Russian Federation and Chinese Taipei.
0% 1% 2% 3% 4% 5% 6% 7% 8% 9% 10% 0 1,000 2,000 3,000 4,000 5,000 6,000 7,000 8,000 Japan United States Germany Korea France Italy US Dollar, Millions, 2015 Energy Environmental Share of total R&D budget 98
Source: OECD.Stat. Accessed on 30 January 2023.
Chart 5.3 Innovation in environment-related technologies
Top countries by total number of patent applications, 2010-2019 (patent families by inventor country)
The UK ranks seventh in the world by the number of environment-related patent applications, behind Japan, the US, Germany, Korea, China, and France, but ahead of Taiwan, Canada and Italy. [1]
Technologies covered under the OECD’s “environment-related technologies” group include:
o Environmental management;
o Climate change mitigation technologies related to energy generation, transmission and distribution;
o Capture, storage, sequestration or disposal of greenhouse gases;
o Climate change mitigation for transport;
o Climate change mitigation for buildings;
o Wastewater treatment and waste management;
o Climate change mitigation in the production or processing of goods;
o Climate change mitigation in information and communication technologies.
Source: OECD.Stat. Accessed on 30 January 2023.
Note: [1] The patent family concept (defined as all patent applications protecting the same ‘priority’) is applied to all statistics presented here (i.e. counts of patent families by inventor country). Consistent with other patent statistics provided in OECD.Stat, only published applications for "patents of invention" are considered (i e excluding utility models, petty patents, etc.). The relevant patent documents are identified using search strategies for environment-related technologies.
99
0 10,000 20,000 30,000 40,000 50,000 60,000 70,000 80,000 90,000 100,000 Japan United States Germany Korea China France United Kingdom Taiwan Canada Italy Total environmentrelated patent applications (20102019)
Chart 5.4 Eco-innovation performance
EU 28 Eco-Innovation Index for the year 2019
The Eco-Innovation Index gathers data on eco-innovation performance across the EU and beyond, thus helping to monitor and evaluate progress made since 2010.[1]
The Index included data for the UK up to 2019. In this year, the highest (aggregated) Eco-Innovation Index belonged to Luxemburg (index value: 165, EUaverage=100), followed by Denmark, Finland, Sweden, Austria, Germany and the UK.
The UK’s position on the Eco-Innovation Index increased from 11th to 7th between 2017 and in 2019.
Among the indicators for the Eco-Innovation Index, the UK showed a strong performance in resource efficiency (i.e. material-, water- and energy productivity, and GHG intensity), where it ranked 3rd in 2019.
The UK was above the EU average in environmental and energy R&D, R&D personnel, early stage green investments, innovating enterprises obtaining environmental benefits, and ISO 14001 companies.
The country ranked slightly below the EU average for relevant patents and academic publications per million inhabitants, media coverage of eco-innovation topics per electronic media source, exports, revenues and employment from the eco-industries and circular economy.
Note: UK data no longer available after 2019.
Source: European Commission (2023). Eco-innovation scoreboard 2019.
100
0 20 40 60 80 100 120 140 160 Bulgaria Hungary Cyprus Romania Poland Slovakia Croatia Estonia Malta Greece Lithuania Belgium Latvia Slovenia Czech Republic Ireland Portugal Spain France Netherlands Italy UK Germany Austria Sweden Finland Denmark Luxembourg Index value (0165), EU average = 100
Chart 5.5
UK environmental goods & services sector (EGSS)
Output, GVA and exports in current £ million, employment in full-time equivalents
The environmental goods and services sector (EGSS) estimates from the ONS follow the UN System of Environmental- Economic Accounting (SEEA). It measures 17 activities across the economy that produce goods and services for environmental protection and resource management purposes.[1]
As defined by the ONS and international guidelines, the environmental goods and service sector includes "areas of the economy engaged in producing goods and services for environmental protection purposes, as well as those engaged in conserving and maintaining natural resources“. These areas of the economy must also produce the goods and services for primarily environmental reasons.
Output in the UK environmental goods and services sector (EGSS) was estimated to be £89.0 billion in 2019, up 4.4% from 2018. [2]
Gross value added (GVA) in the UK EGSS was estimated to be £45.2 billion in 2019, up 5.4% from 2018. [2]
Employment in the UK EGSS was estimated to be 394,900 fulltime equivalent (FTE) employees in 2019, down 4.7% from 2018. [2]
The production of renewable energy was the activity in 2019 with the largest share of total EGSS output (22.5%) and GVA (26.4%).[2]
The activity waste had the largest share of total EGSS employment (29.3%) and the second-largest share of total EGSS output (17.8%) in 2019. [2]
Note: [1] EGSS estimates use a range of data sources, including the ONS’ low carbon and renewable energy (LCREE) estimates, supply and use tables (SUT), the annual business survey (ABS), and the business register and employment survey (BRES).
Source: ONS (2022). Environmental goods and services (EGSS) estimates.
101
Activities Output (£ million) GVA (£ million) Exports (£ million) Employment (fulltime equivalents) 2010-2019 average CAGR 2010-2019 average CAGR 2010-2019 average CAGR 2010-2019 average CAGR Wastewater 9,291.4 1.7% 7,759.7 1.3% - - 20,060 2.3% Water quantity management 9,491.8 3.0% 6,702.7 2.3% 4.8 6.4% 31,210 5.6% Waste 13,170.3 5.0% 5,241.2 4.4% 3,624.7 0.6% 107,640 2.0% Production of renewable energy 8,012.6 29.0% 4,483.1 31.9% 161.3 22.2% 9,570 19.3% Environmental related construction 7,023.5 -2.6% 2,799.1 -3.1% - - 52,550 -2.1% Recycling 7,945.0 -2.1% 1,880.9 -4.5% 2,852.1 0.3% 23,600 -1.2% Low emission vehicles, CCS, and inspection and control 4,921.6 6.7% 1,841.7 6.9% 2,781.9 7.3% 17,030 4.2% Environmental charities 2,279.4 0.0% 873.7 -0.2% - - 21,540 8.8% Energy saving and sustainable energy systems 1,722.6 -1.0% 766.6 1.1% 158.5 4.1% 15,870 -0.4% Managerial activities of government bodies 1,523.1 -2.7% 587.2 -3.0% - - 21,540 -4.7% Environmental consultancy and engineering 988.6 -4.5% 579.1 -5.3% 79.9 7.8% 10,400 -6.7% In-house environmental activities 732.5 -8.0% 572.7 -9.8% - - 5,240 -9.4% Management of forest ecosystems 1,224.9 5.3% 487.0 7.1% 8.2 -2.4% 8,760 2.4% Production of industrial environmental equipment 1,276.1 1.4% 474.8 1.7% 296.4 0.8% 9,640 -0.5% Insulation activities 933.1 0.5% 339.2 -1.0% 237.6 7.9% 6,680 -0.7% Organic agriculture 668.2 -2.5% 336.1 -1.9% 69.4 -1.3% 9,740 -4.0% Environmental related education 342.1 4.9% 142.5 14.4% - - 2,260 3.1% [2] ONS (2022). Environmental goods and services (EGSS) estimates.
Chart 5.6
UK environmental goods & services sector (EGSS) – International comparison
Top European countries per category (2019). Output, GVA and exports in current € million; employment in full-time equivalents [1]
Source: Eurostat (2023). Accessed 30 January 2023.
Note: [1] Eurostat data coverage includes EU27 countries plus selected European nations.
The UK performs strongly in terms of EGSS output, GVA, exports and employment when compared to other leading European nations.
Output in the UK environmental goods and services sector (EGSS) was the 3rd highest in Europe in 2019, after Germany and France.
Gross value added (GVA) in the UK EGSS was the 2nd largest in Europe in 2019, after Germany.
Exports from the UK EGSS were the 3rd largest in Europe in 2019, after Germany and Austria.
Employment in the UK EGSS was the 5th highest in Europe in 2019, after Germany, France, Spain and Italy.
102
[2] UK data for 2018. Country Output (€ million) GVA (€ million) Exports (€ million) Employment (full-time equivalents) 2019 Ranking 2019 Ranking 2019 Ranking 2019 Ranking Germany 197,379.4 1 68,023.1 1 39,992.7 1 657,035 1 France 115,464.7 2 44,920.3 3 9,568.8 5 610,099 2 United Kingdom [2] 98,386.5 3 47,773.3 2 12,736.9 3 404,199 5 Italy 81,482.6 4 34,063.0 4 5,476.8 9 435,677 4 Spain 62,684.4 5 28,002.8 5 6,515.6 8 436,661 3 Austria 41,570.9 8 16,734.9 8 13,356.7 2 183,507 7 Denmark 34,793.1 11 10,438.7 12 11,504.5 4 79,123 15
Cambridge Industrial Innovation Policy
Cambridge Industrial Innovation Policy (CIIP) is a global, not-for-profit policy group based at the Institute for Manufacturing (IfM), University of Cambridge. CIIP works with governments and global organisations to promote industrial competitiveness and technological innovation. We offer new evidence, insights and tools based on the latest academic thinking and international best practices. This report was delivered through IfM Engage, the knowledge transfer arm of the Institute for Manufacturing (IfM), University of Cambridge
IfM Engage, 17 Charles Babbage Road, Cambridge, CB3 0FS, United Kingdom www.ciip.group.cam.ac.uk
For further details, please contact: ifm-policy-links@eng.cam.ac.uk
Please reference this report as: Cambridge Industrial Innovation Policy (2023). UK Innovation Report 2023. IfM Engage. Institute for Manufacturing, University of Cambridge.
103

