

Table of Contents
Summary
to Navigate this
What is the WellbeingAssessment and Improvement Process at CHA?
Basis and Structural Context
and Scope
Definition of Communities Served
and Collaboration
and Guiding Principles
Process and Methods
Design
Conceptual Framework:THRIVE
Design
Board Design
Data Collection Methods, Sources, and Limitations
Primary Data Collection Methods and Sources
Data Collection Methods and Sources
CollaborativeAnalysis
Findings: Strengths and Challenges
Environment | PEOPLE
Connectedness and Civic Engagement
Equity, and Inclusion
Collective Care, and Healing
Spotlight on: Caring forYoung People in our Communities
and Built Environment
Resilience
Water, and Land
PLACE
Systems and Food Security
Education, and Resource Environment
and Quality Housing
Executive
4 How
Report 5 Background 6
6 Regulatory
7 Purpose
7
7 Partnership
8 Values
9
10
10
10 Participatory
11 CommunityAdvisory
12
12
12 Secondary
14 Limitations 15
16 Prioritization 17 Our Communities: Population Characteristics 18 Key
22 Results 28 Social
29 Community
30 Diversity,
34 Safety,
40
44 Natural
|
48 Climate
50 Air,
53 Food
59 Transportation 63 Economic,
| EQUITABLE OPPORTUNITY 69 Affordable
70 2
Spotlight on: Childhood Lead Poisoning
Poverty, Income, and Employment
Spotlight on: Immigrants and Workers Rights
Caregiving and Support
Information,Access, and Navigation
Spotlight on: Homelessness and Healthcare
Healthcare and Health Outcomes
Preventive Health Care
Chronic Non-communicable Diseases
Cancer
Cardiovascular Health
Obesity
Diabetes
Asthma
Chronic Obstructive Pulmonary Disorder (COPD)
Sexual and Reproductive Health
Pregnancy and Birth Outcomes
SexuallyTransmitted Infections (STIs)
Use
Health
Appendix
Appendix
Appendix
Appendix
Appendix
79
82
92
94
97
106
108
109
111
111
114
119
120
122
124
125
125
127 Substance
130 Mental
135 COVID-19 139 Priorities for CollaborativeAction 143 Equity Principles 143 FocusAreas 144 Authors and Editors 146 Acknowledgements 146 Glossary of Terms 147 Appendices 150 AppendixA: CommunityAdvisory Board Membership
B: Organizations Involved in Data Collection &Analysis
C: CHARegional WellbeingAssessment & Improvement Framework
D: Complementary CHNAReports in CHAPrimary ServiceArea
E: Data Collection Methods andTools
F: Primary Data Results Appendix G: Secondary Data Results Appendix H: Summary Products Appendix I: Prioritization Process 3
Executive Summary
The Cambridge HealthAlliance (CHA) is pleased to present the 2022 Community Health Needs Assessment (CHNA) report This report is the product of a collaborative process that centered community voices to examine the strengths and challenges of CHAservice area communities, with the purpose of taking action to positively change the factors that influence individual and community health
We work to achieve sustainable positive change in the health of CHA’s service area communities by engaging community members closest to the impact of inequities, sharing knowledge, aligning resources, and addressing root causes of health inequities.
The design of the assessment was informed by a conceptual framework called theTool for Health and Resilience in Vulnerable Environments (THRIVE) and an approach called ParticipatoryAction Research (PAR) CommunityAdvisory Boards (CABs) were also key to the design of the assessment
The findings from the 2022 CHNAprocess will guide the development of the Implementation Strategy (IS), or how we will work together to address the priority areas for collaborative action identified in this report The top key issues include four priority focus areas and three equity principles. The priority areas define what will be addressed during the Implementation Strategy planning process, while the equity principles will guide how the four focus areas will be addressed The Implementation Strategy planning process will focus on developing or supporting policies and practices that foster and promote equity principles in the focus areas outlined below.
The 4 focus areas that will be collaboratively addressed over the next three years will be Housing, Equitable Economies, Equity andAccess to Care, and Climate Health and Justice. These four areas of focus will be guided through ensuring 3 equity principles are integrated into the planning process.These 3 equity principles are: Language Justice, Inclusion of Under Represented Voices in Leadership and Decision Making, and Environments that Acknowledge Unique Stressors on Diverse Communities to Promote Collective Care Working groups will be formed to set goals, objectives, and strategies, and begin action plans for each focus area Afull Community Health Implementation Strategy will be published in Winter 2023
4
How to Navigate this Report
This report is intended to serve as a resource for all who live, work, and serve in Cambridge HealthAlliance’s (CHA’s) service area communities
For readers interested in CHA’s approach to conducting this assessment:
● Visit the Background section and Values and Guiding Principles section to learn how CHAdefines a Community Health NeedsAssessment, the purpose and scope, and the communities and partners involved.
● Visit the Process and Methods sections to learn about how CHAdesigned the assessment, the methods used to collect, analyze, and interpret data, the people who participated in the assessment, and how we identified priorities for collaborative action
For readers interested in demographic data and key community health statistics:
● Visit the Our Communities: Population Characteristics section for demographic data that helps to describe the communities in this assessment.
● Visit Appendix G to access Community Data Profiles for each municipality
For readers interested in an overview of the results of the assessment:
● Visit the Key Findings: Strengths and Challenges section for an overview of the major themes of the report, top priorities for improvement identified by Community Wellbeing Survey participants, and summaries of the nine Key Findings The nine Key Findings are elaborated in further details in the Results sections of the report
● Visit Appendix H for two page overviews and data summary slide decks
For readers interested in detailed results of the assessment:
● Visit the Results landing page for an overview of the four sections into which the complete assessment results are organized.These four sections are Social Environment; Natural and Built Environment; Economic, Education, and Resource Environment; and Healthcare and Health Outcomes Each section of the Results is indicated by a different color banner at the bottom of each page.
● Each section begins with a landing page to briefly describe the topics included. Each topic covers key takeaways, supporting data, and a “Community Voices” sub section that highlights ideas and suggestions coming directly from community members who participated in focus groups and interviews. Key terms, links to additional resources, and footnotes are included to help readers explore areas of interest more deeply
● Some topics could fit in more than one section We have arranged topics for ease of navigation, and encourage readers to consider the interconnectedness of topics within and across sections.
For readers interested in the next steps from this assessment process:
● Visit the Priorities for Collaborative Action section, which describes four Priority Focus Areas and three Equity Principles which will guide the development of an Implementation Strategy
5
Background
What is the WellbeingAssessment and Improvement Process at Cambridge Health Alliance?

Cambridge HealthAlliance (CHA) has a long history of working alongside communities to improve community health and wellbeing The way in which CHAdoes this is through a WellbeingAssessment and Improvement Process.This includes a Community Health Needs Assessment (CHNA), which is a process to analyze community needs and strengths and identify priorities for improvement, and a Community Health Implementation Strategy (IS), which is a set of goals, objectives, and activities to address the needs identified during the CHNA 1 This report represents the findings from the 2022 CHNAprocess We will refer to this as the “assessment process” throughout the report. Understanding community health needs and strengths has always been a part of how CHAlives out our mission to Care forAll.
Our assessment process examines the strengths and challenges of the community, with the purpose of taking action to positively change the factors that influence people’s health This process engages community members closest to the impact of inequities and works with them to understand and address important health issues Engaging and listening to the community is key to our process Community participants are able to tell their own stories, elevate the priorities that matter to them, and collaborate to create solutions that improve the health of their communities This lays the groundwork for development of the Implementation Strategy (IS), which is created to address the priorities identified by community members during the assessment process.
This report focuses on what emerged from the Community Health NeedsAssessment process the community conditions that influence people’s wellbeing.Acommunity’s natural and built environment, economic and educational environment, and civic and social environment all affect the physical and mental health of community members. The assessment incorporates equity principles, acknowledging that health and illness are not solely a result of individual choices or characteristics, but rather a result of inequity in systems and resources
1 Commonwealth of Massachusetts,Attorney General’s Office. (n.d.) Community Benefits Guidelines. https://www.mass.gov/service-details/community-benefits-guidelines
6
Regulatory Basis and Structural Context
Under the federal Patient Protection andAffordable CareAct (ACA), all non profit hospitals in the United States are required to complete a Community Health NeedsAssessment (CHNA) and Implementation Strategy (IS) every three years and file it with the Internal Revenue Service 2 Massachusetts non profit hospitals also file the CHNA/IS with the Massachusetts Office of theAttorney General to comply with Community Benefits guidelines 3 As a public entity, unlike non-profit hospitals, CHAis not subject to theACA’s CHNArequirement, nor to Massachusetts Community Benefits guidelines However, a CHNA/IS is necessary to meet other state regulatory requirements, such as the Massachusetts Department of Public Health (MDPH) Determination of Need (DoN),4 and to enable the CHA Board ofTrustees to fulfill its governance responsibilities as required by Chapter 147 of theActs of 1996, as amended by Chapter 365 of theActs of 1998 (the “CHAEnablingAct”) The Health ImprovementTeam in the Department of Community Health Improvement (CHI) at CHAis responsible for coordinating a process that meets these regulations and supports CHA’s mission The full CHA Regional Wellbeing Assessment and Improvement Framework is available in Appendix C.
Purpose and Scope
The purpose of the 2022 assessment was to examine and understand the strengths and challenges of our communities with the goal of taking action to positively change the factors that influence people’s health The assessment was conducted between Summer 2021 and Fall 2022, in the midst of the COVID 19 pandemic that had reached our communities in Spring 2020. COVID-19 has exposed and exacerbated the impacts of poverty, structural racism, and other systemic forms of oppression on community health, including in the greater burden of COVID 19 infection, hospitalization, and death shouldered by communities of color and lower income members of our communities. In this context, the scope of the assessment included community conditions and root causes of inequity, in addition to the exposures, risk factors, and outcomes experienced by members of our communities.
Definition of Communities Served
CHA’s Primary ServiceArea (PSA) includes Cambridge, Chelsea, Everett, Malden, Medford, Revere, Somerville, and Winthrop. Historically, CHAhas conducted city-specific Wellbeing Assessments in Everett, Malden, and Somerville In 2018 2019, CHAparticipated in the North Suffolk Public Health Collaborative’s first integrated regional CHNA, encompassing the communities of Chelsea, Revere, and Winthrop.The following year, in 2019-2020, CHApiloted
2 Internal Revenue Service. (2022). Community Health Needs Assessment for Charitable Hospital OrganizationsSection 501(r)(3) https://www.irs.gov/charities-non-profits/community-health-needs-assessment-for-charitablehospital-organizations-section-501r3
3 Commonwealth of Massachusetts,Attorney General’s Office. (2018, February) Community Benefits Guidelines for Non-Profit Hospitals. https://www.mass.gov/service-details/community-benefits-guidelines
4 Cambridge Public Health Commission. (n.d.) Description of Community Health Improvement Activities. https://www.mass.gov/doc/cambridge-health-alliance-community-health-initiative-activities/download Submitted for 2019 Determination of Need (DoN), available at: https://www.mass.gov/lists/don-cambridge-publichealth-commission-dba-cambridge-health-alliance-don-required-equipment
7
a two-city approach in Everett and Malden in partnership with Massachusetts General Hospital and MelroseWakefield Healthcare Reports from these past assessments are available on the Community Health Data and Reports page of the CHA website
The current assessment represents CHA’s effort to unify all service area communities into the same three-year CHNA/IS cycle. This report includes in-depth assessment results for the communities of Everett, Malden, Medford, and Somerville. Results for Chelsea, Revere, and Winthrop are presented in the 2022 North Suffolk Public Health Collaborative (NSPHC) CHNAReport, available in Appendix D.The 2020 City of Cambridge Community Health Assessment provides the most recent results for Cambridge, also available in Appendix D

Partnership and Collaboration
For this 2022 assessment, CHAcame together with several health systems and municipal public health partners who planned to conduct comprehensive CHNAs We aligned data collection tools and analytic approaches, recognizing that our overlapping service areas created an opportunity to coordinate, rather than duplicate, efforts. In order to implement a standardized approach to the assessment while still honoring the uniqueness of each community, we grouped our PSAinto three subregions Each subregion had a CommunityAdvisory Board (CAB)5 or
As displayed in the map above:
● In the Medford and Somerville subregion, CHAcoordinated with Beth Israel Lahey Health (BILH), as MountAuburn Hospital overlaps with this part of our primary service area We received seed grant funding from theTisch College Community Research
A for CAB membership.
5 See Appendix
8
Center (TCRC) atTufts University to pilot ParticipatoryAction Research (PAR) approaches in this subregion, and partnered with the City of Somerville’s assessment efforts related to the use ofAmerican Rescue PlanAct (ARPA) funds
● In the Everett and Malden subregion, CHAcoordinated with Mass General Brigham (MGB), as Massachusetts General Hospital overlaps with this part of our primary service area. We partnered with CHA’s Department of Dental Medicine and Oral Health to coordinate our respective community assessments and share data and resources
● In the Chelsea, Revere, and Winthrop subregion, CHA partnered with the North Suffolk Public Health Collaborative (NSPHC) and its Steering Committee CHA, Beth Israel Lahey Health, and Mass General Brigham are all members of the NSPHC, which carried out the CHNAwith facilitation by the MetropolitanArea Planning Council (MAPC)
● In Cambridge, the Cambridge Public Health Department, which is a part of Cambridge HealthAlliance, completed a comprehensive assessment in 2020 as part of its public health accreditation process
Values and Guiding Principles
Equity: In all aspects of assessment design, implementation, evaluation, planning, and engagement with the community, we intentionally apply an equity lens 6 We acknowledge the context of structural racism, systemic discrimination of oppressed identities, and intersectionality the multi dimensional overlapping of identities and experiences within a person or community by raising these questions throughout the assessment process: 1) Who benefits? 2)Are there differential impacts? and 3) What is missing that would reduce inequities?7

In health care, the focus is often on individual health behavior choices, like smoking, eating healthy, exercising, or going to the doctor.There may be a focus on family medical history and genetic predisposition to illness. Ahealth equity lens, on the other hand, asks us to consider how unfair and unjust distributions of power, money, and resources influence the conditions in which people are born, live,
6 Centers for Disease Control and Prevention. (n.d.) Using a Health Equity Lens. https://www.cdc.gov/healthcommunication/Health_Equity_Lens.html
7
ForwardThrough Ferguson. (n.d.). The Commission https://forwardthroughferguson.org/report/executive-summary/the-commission/
9
work, learn, play, and age.These conditions, in turn, shape health outcomes and health equity. Ahealth equity lens asks us to consider social, economic, and political factors, instead of individual behaviors alone, to promote health and wellbeing for all
Inclusive Participation: We take intentional action to elevate underheard voices, with attention to engaging those most impacted by inequity in developing solutions and taking action. Strengths-Based: While illuminating needs and disparities, we are asset-oriented rather than deficit oriented We recognize that assets can be leveraged to help solve needs and seek to identify and amplify community members’existing power
Rigor: We use a mixed methods approach to both quantify the health landscape and gain deeper understandings of community members' lived experiences. We aim to develop methods that are reproducible and transparent We use creative and interdisciplinary approaches to solve challenges. We plan for communication, implementation, and evaluation from the start.
Respect and Stewardship: We respect community members’ time and participation and exercise good stewardship of our and our partners’time and resources. Our goal is for the assessment process to be an important part of a broader mission of improving community health.This involves engaging partners who complement one another’s expertise and leveraging resources strategically
Process and Methods Design
The design of the assessment was informed by a conceptual framework called theTool for Health and Resilience in Vulnerable Environments (THRIVE) and an approach called ParticipatoryAction Research (PAR). CommunityAdvisory Boards (CABs) were also key to the design of the assessment.
Conceptual Framework:THRIVE
The concepts that the assessment explores and integrates are based on theTool for Health and Resilience in Vulnerable Environments (THRIVE) 8 THRIVE was developed by the Prevention Institute with support from the U S Office of Minority Health Since 2002, it has been widely used in a variety of public health assessment and implementation initiatives to advance health equity CHAevaluated multiple assessment and implementation models and choseTHRIVE for its explicit focus on equity and the community conditions that contribute to health inequities
THRIVE identifies three domains of community conditions that are influenced by structural drivers The three domains are People, Place, and Equitable Opportunity Each domain includes factors that research and experience have shown are associated with health and wellbeing outcomes This assessment was organized around examining factors within each of the
8 Prevention Institute. (n.d.). THRIVE: Tool for Health & Resilience in Vulnerable Environments https://www.preventioninstitute.org/tools/thrive-tool-health-resilience-vulnerable-environments
10
THRIVE domains, in addition to key health outcomes.TheTHRIVE domains and factors are displayed in the diagram below

Notes: *To highlight the role of access to resources and essential services in promoting equitable opportunity, CHA added this factor to the model for purposes of this assessment
THRIVE is a tool that helps engage community members in assessing community level factors that contribute to illness, injury, and inequity, and determining where and how to take action to impact interacting factors.This tool elevates community voice and knowledge and focuses on those closest to the impact of inequities THRIVE is also a framework that illustrates how structural drivers like racism, ableism, sexism, and other forms of oppression shape community conditions.THRIVE acknowledges how policies and practices may privilege people of certain identities and marginalize or exclude people of other identities, leading to unjust differences in the environments of different communities.These unjust differences lead to inequities in health.
Participatory Design
We used an approach called ParticipatoryAction Research (PAR) to inform the design and implementation of this assessment. PAR emphasizes community participation and leadership in designing research questions, conducting data collection and analysis, and taking action informed by the results We recognize that research and assessment have often been done “to” communities in ways that fail to benefit or are even harmful to them. PAR offers a different approach which focuses on lifting up the knowledge, experience, and power of people who are closest to the topic being explored For this assessment,THRIVE offered the conceptual model for centering community voices and perspectives and PAR approach offered the path to do so in practice Cambridge HealthAlliance is grateful toTisch College Community Research Center at Tufts University for seed funding to pilot the PAR approach. We also acknowledge the Healthy Neighborhood Study9 for inspiration
9 Healthy Neighborhoods Study. (2020, July). A Participatory Action Research Field Guide. https://www.clf.org/publication/field-guide-for-participatory-action-research/
Image Source: Prevention Institute, THRIVE: Tool for Health & Resilience in Vulnerable Environments11
CommunityAdvisory Board Design
CommunityAdvisory Board (CAB) members were invited due to their deep personal and professional connections to the communities CAB meetings were conducted periodically to inform the design of the assessment, support data collection and community engagement, and explore data and findings The membership listing of each CAB can be found in AppendixA
Data Collection Methods, Sources, and Limitations
This assessment draws on many data sources. Different types of data are useful for different kinds of assessment questions and require particular methods of collection and analysis All types of data have certain limitations, some of which are explained below.
Key Terms
● Quantitative data can be counted or measured using numbers They are used to answer questions like “how much?” or “how many?”
● Qualitative data describe characteristics or concepts. They are used to answer questions like “why?” or “what meaning?”
● Primary data is information we collect ourselves Primary data can be quantitative or qualitative We collect primary quantitative data using methods like surveys, with multiple choice questions or rating scales to quantify respondents’experiences. We collect primary qualitative data using methods like focus groups and interviews, to explore and understand people’s perspectives, experiences, and priorities
● Secondary data are data that have been collected by others Secondary data can also be quantitative or qualitative. We use secondary quantitative data like demographic data from the Census Bureau, disease and hospitalization rate data from the Department of Public Health, or economic data from the Bureau of Labor Statistics to analyze trends across populations We use secondary qualitative data like coalition reports, advocacy campaigns, narratives and stories, and even music and art to build on an existing knowledge base and wisdom.
Primary Data Collection Methods and Sources
We conducted a community survey, focus groups, and one on one interviews to engage and listen directly to community members.The complete data collection and analysis protocol is available in Appendix E Data collection was carried out by Community Researchers, who participated in a two day training to learn about the principles of PAR, understand research ethics and assessment methods, discuss health and environment priorities to explore, and practice data collection processes Data collection was also carried out by CHAstaff, university interns, and community partners.Afull list of organizations that participated in data collection is available in Appendix B.
12
The Community Wellbeing Survey (Appendix E) asked about people’s knowledge and lived experiences related to the factors in theTHRIVE model The survey was available in English, Chinese, Haitian Creole, Portuguese, and Spanish, in digital and hard copy formats Working with CAB members, we distributed the survey through online platforms and social media used by people in the populations and communities of interest for this assessment We administered the survey in person during community events and at locations where people already gather. Survey participants were entered into a $100 grocery store gift card raffle in appreciation of their time and participation

Focus groups were conducted using a semi structured discussion guide (Appendix E) We asked questions about the meaning of community health and wellbeing, factors that facilitate health or are barriers to health, and participants’priorities for advancing community health. We worked closely with community partners to engage people whose voices were less represented in the survey and whose experiences may not be visible in secondary data.All focus group participants received a $30 grocery store gift card in appreciation of their participation.
Interviews were conducted with leaders and experts in particular content areas to explore underlying causes, policies, and systems that affect community health and wellbeing Using our interview guide (Appendix E), we were intentional about elevating the experiences and knowledge of people who are affected by and involved in addressing key equity issues such as racial justice, poverty, food systems, environmental justice, and mental health, among others
Community Engagement in Primary Data Collection
Notes: The Community Wellbeing Survey was administered from October December 2021 Interviews and focus groups were conducted from October 2021 February 2022 In addition to participation from Everett, Malden, Medford, and Somerville community members, the North Suffolk Public Health Collaborative engaged participants from Chelsea, Revere, and Winthrop, whose contributions are included in the 2022 NSPHC CHNA Report (Appendix D).
13
The sample of survey participants is intentionally not representative of the full municipal population Agoal of the survey was to elevate the voices of people closest to the impact of inequity including people of color, people who speak languages other than English, older adults, LGBTQ+ individuals, and persons with disabilities. Full details on the characteristics of survey participants are available in the CHACommunity Wellbeing Survey Results Frequency Tables in Appendix F.To summarize our survey sample, compared to the total population10 of each community:
● Older adults were underrepresented among Everett and Somerville participants, and overrepresented among Malden and Medford participants
● Participants who identify as women were overrepresented among participants in all four communities
● Persons with disabilities were overrepresented among participants in all four communities
● Immigrants were overrepresented among participants in all four communities.
● People who speak languages other than English were overrepresented among participants in all four communities.
● Parents or caregivers of children under the age of 18 were overrepresented among Everett participants
● Hispanic or Latino individuals were overrepresented among participants in all four communities, and White individuals were underrepresented Black individuals were underrepresented among Malden participants, and represented proportionally among Everett, Medford, and Somerville participants. Asian individuals were underrepresented among Everett, Medford, and Somerville participants, and overrepresented among Malden participants
● American Indian orAlaska Native (AIAN) and Native Hawaiian or Pacific Islander (NHPI) individuals were overrepresented among participants in all four communities
Secondary Data Collection Methods and Sources
Secondary data was drawn from over 40 national, state, regional, and municipal sources We developed a framework of over 120 indicators based on public health, socioeconomic, and demographic data sources such as the Massachusetts Department of Public Health, US Census Bureau, and Centers for Disease Control and Prevention. Wherever possible, we stratified the data by racial or ethnic group, income, and other variables to identify possible areas of inequity Our team also reviewed reports and other materials released by community-based organizations, research institutions, advocacy groups, and others in order to build on the existing knowledge base A full list of secondary data sources can be found in Appendix E
10 Population data used for comparison are based on US Census Bureau,American Community Survey, 2015-2019 5-Year Estimates.

14
Limitations
All data sources and types have limitations. Using complementary data sources and types helps to account for the limitations of any single one
For primary data, three main limitations should be considered
● First, the findings of our survey represent the experiences of the people who participated, and are not generalizable to the entire population Similarly, the findings from focus groups and interviews may not represent the experiences or priorities of the entire community Our methods aimed to engage people who belong to groups that are disproportionately impacted by health inequity However, unless every person in the population had an equal probability of being selected to participate, we cannot generalize the results beyond the sample This is a common limitation of primary data and does not invalidate the important insights shared by the people who participated Primary data provides first person stories and perspectives that secondary data cannot.
● Second, primary data collection was conducted between October December 2021 (for the survey) and between October 2021 February 2022 (for focus groups and interviews) The information that participants shared may be shaped by the context of that time period, most notably that it was during the COVID-19 pandemic.
● Third, even with groups that were intentionally oversampled, caution must still be exercised.As several of these communities are relatively small proportions of our communities' total populations, a larger survey sample size would be necessary to more fully understand these groups' experiences
For secondary data, four main limitations apply
● First, data based on population surveys, like the US Census Bureau’sAmerican Community Survey (ACS), use a probability sampling approach to enable the results to be generalized to the entire population of interest However, there is always a margin of error to a given estimate, depending on the response rate and other factors It is possible that some people are more or less likely to participate in the survey than others, introducing non-response bias into the results How the population of interest is defined matters too: for example, if the survey is not disseminated in certain languages, people who speak non included languages cannot be considered part of the sampling frame.
● Second, data based on administrative records, like hospitalization rates or mortality rates from the Massachusetts Department of Public Health or Registry of Vital Statistics, often take multiple years to

15
be collected, analyzed, and published.The statistics may therefore be outdated by several years It is possible that certain people or outcomes are incorrectly diagnosed or missed, introducing misclassification bias For rare outcomes, there may be insufficient data to calculate reliable statistics or to report without compromising individuals’identities
● Third, data based on self report like theYouth Health Survey or Behavioral Risk Factor Surveillance System Survey may be subject to recall bias or social desirability bias
● Fourth, the ways in which demographic data are collected matter for analyzing data with an equity lens Some secondary data sources do not include information about the racial or ethnic group identity of the individuals in the data set, or the racial or ethnic composition of a geographic area Racial or ethnic group categories may be overly broad and obscure meaningful within group differences Small groups may also be combined with other small groups, erasing between group differences. Lastly, the categories of analysis may not accurately represent how people identify themselves For example, if a secondary data source only includes information about males and females, the experiences of people who identify outside of a gender binary cannot be analyzed.
The organizations we draw on for secondary data take evidence based steps to reduce bias and ensure timely, accurate data Still, it is important to keep these limitations in mind
CollaborativeAnalysis
One way to address the power dynamics that may exist between organizations leading assessments and the communities being assessed is to ensure community members are part of how the data are collected and analyzed The current assessment integrated several opportunities for CAB members and other community groups to provide feedback, analyze data, and make sense of results in collaborative ways

First, the CHAteam conducted initial analyses to a) identify themes from focus groups and interviews, b) calculate statistics from primary survey data, and c) compile statistics from secondary data Key findings and trends were summarized for review These analyses were conducted with an equity lens to identify trends that may vary based on the experiences of different communities.
Second, a CAB meeting for each sub-region was held to review the preliminary analyses of primary data CAB members discussed which themes and data points resonated with them, what questions they would like to explore more deeply, and what themes were missing CAB members’ comments and questions were incorporated to improve primary data analysis, explore additional data stratifications, and inform the integration of secondary data.
16
Third, collective sense-making sessions were conducted with community groups outside of the CABs to ask for feedback and interpretation of preliminary results In some cases, we returned to groups who had participated in initial data collection phases (Appendix B) In other cases, CAB members suggested groups whose additional insights would help to inform the interpretation These conversations helped further elevate the voices of people closest to the impact of health inequity, and emphasized that these data belong to, and are best interpreted by, members of the community
The results presented in this report are the culmination of this process of iterative and collaborative analysis
Prioritization
An important step in the assessment process is to review the results of the assessment and identify priorities for collaborative action Afull description of the prioritization process is available in Appendix I
The CHAteam distilled the main themes from primary and secondary data, along with feedback from the collaborative analysis sessions, to create an initial list of key issues for prioritization CAB members then engaged in a three phase process to determine priority areas for collaborative action In the first phase, each CAB member individually ranked initial key issues in order of priority. In the second phase, CAB members came together to discuss and reach consensus In the third phase, CAB members again completed an individual ranking to allow for individual feedback For each phase, CAB members considered the feasibility of addressing each key issue and the anticipated impact of doing so. Feasibility and impact statements were used as a guiding framework to align CAB members’prioritization decisions
Feasibility Statements:
There are groups across sectors willing and able to work together on this issue
This issue can be addressed given current infrastructure, capacity, and resources
Impact Statements:
Addressing this issue substantially benefits those most in need (maximizes equitable outcomes)
Addressing this issue now works towards short term and long term, upstream change
The CHAteam summarized the discussions and final rankings of the key issues to develop the four priority areas and equity principles found in the Priorities for Collaborative Action section of this report.
1
2
1.
2
17
Our Communities: Population Characteristics
The communities of Everett, Malden, Medford, and Somerville are woven together by people of diverse identities, backgrounds, and experiences 11
Population Size and Nativity | As a proportion of the total population in each community, immigrants make up a larger share in Everett (43%) and Malden (43%), compared to Medford (22%) and Somerville (25%)

Country of Origin | The countries of origin of each community’s immigrant populations are diverse, and there are regional patterns Across the communities, countries of LatinAmerica and the Caribbean are among the top 3 countries of origin for immigrant populations, with significant proportions of immigrants born in Brazil, El Salvador, and Haiti In Malden, Medford, and Somerville, China is also among the top 3 countries of origin for immigrant populations.At least 15 other countries of origin are represented among the top 10 across Everett, Malden, Medford, and Somerville
Top 10 Countries of Origin Among population born in another country

11 Data source for all population characteristics: US Census Bureau,American Community Survey, 2015 2019 5 Year Estimates 18
Languages Spoken | In Everett and Malden, more than 50% of residents ages 5 and older speak a language other than English at home In Medford and Somerville, around 30% of residents ages 5 and older speak a language other than English at home. For comparison, in Massachusetts as a whole, 24% of residents ages 5 and older speak a language other than English at home

Dozens of languages are spoken among our communities’residents, as shown below in the Languages Spoken at Home chart Spanish is among the top 3 languages other than English spoken in Everett, Medford, and Somerville. Chinese (including Mandarin and Cantonese) is among the top 3 in Malden and Somerville The US Census Bureau’sAmerican Community Survey (ACS) only provides broad categories for certain languages at the municipal level. For example, the chart shows that large proportions of residents speak “French, Haitian, or Cajun” and “Other Indo European languages ” Given that the most common countries of origin among immigrants in our communities include Haiti and Brazil, it is reasonable to estimate that residents who speak Haitian Creole compose the majority of those in the “French, Haitian, or Cajun” group, and residents who speak Portuguese compose the majority of those in the “Other Indo European languages” group. However, other languages may be represented as well.
Languages Spoken at Home (excluding English) Among population ages 5 years and older

19
Age | The age composition of our communities varies. In the Population by Age Group chart, bars in blue shades include age groups 17 years of age and younger; orange and yellow shades include age groups from 18 to 64 years of age; and green shades include age groups 65 years of age and older.The chart shows that children and adolescents compose a greater share of the population in Everett and Malden compared to other communities, and older adults compose a greater share of the population in Medford compared to other communities.
Population by Age Group
Racial and Ethnic Group | Each of the four communities have a diverse racial and ethnic group composition The Population by Racial Group and Hispanic Ethnicity chart shows that no single racial/ethnic group represents more than 7 in 10 people in any community

There are several implications of the broad racial/ethnic categories used by the US Census Bureau, which may not capture the diverse ways in which people identify themselves First, in the United States as a whole, the proportion of people who identify as two or more races, or a race not included as a selection option, has grown over the last several decades. Second, the federal Office of Management and Budget, which sets the requirements for Census data collection, considers the category “Hispanic” to be an

20
“ethnicity” separate from “race,” even as the construct of Hispanic or Latino identity12 is an evolving concept Third, broad racial/ethnic categories obscure meaningful differences in identity and experience within those groups On the other hand, there may be a risk of erasure when more specifically defined groups make up relatively small proportions of the population. For example,American Indian orAlaska Native, and Native Hawaiian or Pacific Islander racial groups are included in the “Other races (combined)” category in the chart.
Race is socially constructed, not biologically determined.13 We consider the racial and ethnic group composition of our communities because racism and discrimination have real consequences for people’s health and wellbeing We use the term “racial group” to emphasize that “race” is not a genetic or biological characteristic, but rather a label assigned to groups of people Structural racism the policies, practices, and norms embedded in institutions and societies that privilege people of certain racial groups, and marginalize or exclude people of other racial groups shapes the distribution of health outcomes and health equity that this report examines 14
To explore more of the demographic composition of our communities, visit the CHA Health Improvement Team Tableau Public site at this link: https://bit.ly/CHA-Community-Health-Tableau-Public
12 We recognize that language and terminology are evolving as well, and are important in affirming identity. For example, ”Latinx” and “Latiné” have emerged as gender-neutral and inclusive terms. In this report, the terms “Hispanic” and “Hispanic or Latino” will be used for consistency, unless a specific data source or quote uses a different term. For more information about the history and use of these terms, see Noe-Bustamante, L. et al. (August 2020). About One-in-Four U.S. Hispanics Have Heard of Latinx, but Just 3% Use It. Pew Research Center https://wwwpewresearch org/hispanic/2020/08/11/about one in four u s hispanics have heard of latinx but just 3 use it/
13 Jones, C.P. (2001). “Race,” Racism, and the Practice of Epidemiology American Journal of Epidemiology
14
For further reading on forms of racism, connections to health equity, and issues of racial group categories in data, see Jones, C.P. (2000). Levels of Racism:ATheoretic Framework and a Gardener’sTale. American Journal of Public Health; Bailey, Z.D. et al. (2021). How Structural Racism Works – Racist Policies as a Root Cause of U.S. Racial Health Inequities. New England Journal of Medicine; and Krieger, N. (2021). Structural Racism, Health Inequities, and theTwo-Edged Sword of Data: Structural Problems Require Structural Solutions. Frontiers in Public Health.
21
Key Findings: Strengths and Challenges
Our communities and institutions have many strengths. Overall, the people who participated in the assessment feel a sense of belonging in their communities They tend to agree their communities are good places to live, grow, and age However, people voice concerns rooted in systemic challenges facing our world, nation, and local communities, like the erosion of social connectedness and trust, barriers to accessing resources and opportunities, and structural inequity present in institutional policy and practice.These challenges show up in ways that have consequences for health, mental health, and wellbeing The impacts of inequity are pronounced for groups that are structurally marginalized from power and privilege, including youth, older adults, immigrants, persons with disabilities, gender expansive individuals, language communities other than English, and people of racial and ethnic groups impacted by structural racism Despite the challenges, including in the context of COVID 19, assessment participants emphasized that we can work to address these concerns by building on our strengths.
Data Point | Participants in the CHA Community Wellbeing Survey were asked to identify the most important things to improve in their community Among Everett, Malden, Medford, and Somerville participants, more affordable housing was the top priority for improvement. Other top priorities included transportation infrastructure, access to quality jobs, schools, and health care, and respect and inclusion for diverse community members. Many other areas emerged among the 10 most common priorities in each community, as displayed in the charts below
Data Source: CHA Community Wellbeing Survey 2021
Notes: Survey participants could select more than one priority, so proportions will not add to 100%.

22
Data Source:
Community Wellbeing Survey 2021
Notes: Survey participants could select more than one priority, so proportions will not add to 100%
These top priorities for improvement reflect the perspectives of those who participated in the survey, and are not necessarily representative of the total population. The purpose of the survey was to elevate the experiences of people closest to the impact of social, economic, racial, and health inequities in our communities. Indeed, the people who participated in the survey included more people of color, more immigrants, more people who speak languages other than English, and more disabled persons relative to the populations of each municipality 15 While not generalizable, the survey participants’priorities echo the priorities that emerged throughout the assessment process from complementary secondary data sources, and provide a foundation for the Key Findings
These nine Key Findings are presented in the order in which they are discussed in depth in the Results section of this report The order is not intended to imply order of importance or priority
These strengths have grown and been heavily utilized during the COVID 19 pandemic and in solidarity with movements for racial justice, immigrant rights, reproductive rights, and violence prevention Intentionally investing in these strengths is a leverage point for systemic change
15 To review who participated in the survey, see pages 13-14. For detailed statistics on survey participants, see Appendix F for the Community Wellbeing Survey Frequency Tables.

CHA
Key Finding #1 | The communities have strong social networks, community organizing skills, cultures of civic engagement, and support for getting involved in policy advocacy.
23
Data Point | Most participants in the Community Wellbeing Survey reported satisfaction with several indicators of community wellbeing, such as quality of life, raising children, growing old, and accessing resources. These are strengths to build on.
Data Source: CHA Community Wellbeing Survey 2021
Notes: Percentages include participants who selected Agree or Strongly Agree, excluding those who selected Don’t Know.
Key Finding #2 | Assessment participants believe that those who are closest to the impact of inequity must be at the center of how decisions are made, how systems operate, and how resources are allocated.

Deep and long-term changes in culture and systems are required in order to advance health equity and justice Changes in institutional and government processes and structures are possible, and are already being demonstrated in each of the communities
Key Finding #3 | There is a need for safe, culturally responsive spaces for healing and collective care.
The intersecting crises of racism, political discord, violence, and COVID-19 raise growing concerns about impacts on the mental health and wellbeing of community members While access to mental health care is an essential need, this challenge cannot be the responsibility of therapists alone to solve. Participants reflected on how collective care means not only creating intentional spaces and resource centers for people to come together, but imagining systems that ensure safety from violence and discrimination, that foster belonging and healing, and that promote public spaces that equitably reflect the priorities and preferences of diverse
24
communities.As defined by the Ugandan feminist organization Raising Voices, “Collective care is seeing others' well being as a shared responsibility of the group
Key Finding #4 | Environmental justice is needed to advance health equity in our communities.
Environmental justice was a common thread tying together concerns related to climate change, air and water quality, land use, food systems, and transportation.There are strong community organizations and experts dedicated to addressing these issues in our communities, particularly regarding climate resilience and food security. Still, inequities within and between communities in terms of awareness of climate change preparedness, exposure to pollution and environmental hazards, experiences of hunger and food insecurity, and access to safe, reliable transportation emphasize the importance of systems approaches, collaboration, and community engagement and leadership
Key Finding #5 | Equitable access to affordable, safe, high quality housing is a significant concern.
Across all communities, participants in the Community Wellbeing Survey identified more affordable housing as the most common priority for improvement.This trend remained fairly consistent regardless of age group, racial group, ethnicity, language, or immigration history The cost of housing takes up large proportions of families’income, particularly among lower-income households and in neighborhoods with higher concentrations of residents who are people of color The risk of eviction is a growing worry as COVID era moratoria and financial assistance programs expire.The housing stock in our communities is among the oldest in the state of Massachusetts, increasing the risk of maintenance related safety and quality issues, and of exposure to toxins like lead Housing concerns are rooted in structural issues Among these concerns include the history of racial residential segregation, discriminatory housing policies, and the financialization of real estate (i e the treatment of housing primarily as a financial asset rather than a human right; an example being the acquisition of housing by financial firms to generate profit).17 Policy and program solutions to strengthen housing security are being developed and implemented in our communities, and are a high priority to continue investing in
16 Billing, L. et al. (2022). Creating and maintaining a culture of self and collective care at Raising Voices. Sexual Violence Research Initiative: Pretoria, SouthAfrica. https://raisingvoices.org/resources/culture-of-self-and-collective-care-at-raising-voices/
17 United Nations Human Rights Office of the High Commissioner (OHCHR). (n.d.). Financialization of housing https://www.ohchr.org/en/special-procedures/sr-housing/financialization-housing
”16
25
Key Finding #6 | Poverty, income inequality, and wealth inequality continue to burden members of the community, exacerbated by the economic consequence of the COVID-19 pandemic.
In most of our communities, the proportion of residents living below the federal poverty level is higher relative to the Massachusetts statewide average Further, residents of color are more likely than White residents to live below the federal poverty level. Over time, the proportion of residents living below poverty has declined slightly or stayed the same, even as median family and household income has increased, suggesting the gap between low income and high income households has widened. Good jobs with living wages and benefits, as well as safe working conditions, are not equitably accessible within or between communities Structural barriers to economic mobility and intergenerational wealth creation are significant concerns.
Key Finding #7 | Economic and social support for families and caregivers is insufficient.
Caregiving directly impacts, and is impacted by, employment, economic security, and social connectedness Participants noted a need for caregiving solutions that promote community level resilience and capacity for collective care, emphasizing the lack of systems and supports that enable people to give and receive the care they need across their life courses and circumstances Since the COVID 19 pandemic, parents, care workers, and caretakers especially women and the Hispanic or Latino community have been heavily impacted by job loss and reduced hours, adding more financial strain to existing stressors
Key Finding #8 | People face multi faceted barriers to accessing information and resources related to health care, education, social services, economic opportunities, and other essential systems.
Accessing essential information and resources often requires navigating multiple complicated systems, and there is insufficient support for people who could benefit from guidance Although resources for navigating systems do exist, greater attention to language, culture, stigma, disability, and technology is needed to ensure equitable access. In addition to the important role of system navigation, participants in the assessment emphasized how simplifying application processes, streamlining eligibility criteria, and integrating strategies between organizations and service providers could reduce complexity in the first place Designing systems in collaboration with the people who use them is key to equitably increasing accessibility Beyond system design, other major barriers include the costs of services, limited transportation options to physically access services, traumatic experiences of discrimination and harm, and limited availability in the supply of services and resources
26
Of the selected health outcomes reviewed for the assessment, we found that the burden of disease is especially concerning for several adverse health outcomes, including heart disease, diabetes, asthma, pre term and low birthweight births, sexually transmitted infections, opioid overdoses, mental health crises, and COVID 19 Inequities in each of these health outcomes are strongly influenced by the social determinants of health explored in this report. While mortality is a lagging indicator, it is also a telling one. In each of the communities, all cause mortality rates increased from 2019 to 2020, and at the state level, mortality increased most sharply among communities of color.These trends are attributed directly and indirectly to COVID 19, and the ways the pandemic has exacerbated the impacts of underlying inequities
Data Source: Massachusetts Registry of Vital Records and Statistics, Selected Causes of Death, 2016 2020.
Notes: In each line chart by community, a gray dotted line represents the age adjusted rate for the state of Massachusetts Mortality rates by racial/ethnic group are not available at the municipal level due to small numbers Mortality rates at the state level are not available for racial/ethnic groups other than those identified in these charts due to small numbers.

Key Finding #9 | Health inequities within and between communities are significant concerns. As the consequences of the COVID-19 pandemic continue to emerge, there are risks that inequities will grow.
27
Results
The assessment results are organized into four sections based on theTHRIVE framework. Each section is indicated by a different color banner at the bottom of each page Each section summarizes results for several topics, including key takeaways, supporting data, and a “Community Voices” sub section that highlights ideas and suggestions from community members who participated in focus groups and interviews TheTHRIVE framework acknowledges that community conditions are interconnected, and that some topics could fit in more than one section We have arranged topics for ease of navigation, and we encourage readers to consider the interconnectedness of topics within and across sections
Social Environment
The Social Environment includes patterns of civic engagement and public participation, social norms and cultures, social networks, and trust. This section highlights community connectedness and civic engagement; diversity, equity and inclusion; and safety, collective care, and healing, with a spotlight on caring for young people in our communities.

Natural and Built Environment
The Natural and Built Environment includes all of the physical spaces in our community in which we live, work, and play.This section highlights our communities’climate resilience; air and water quality; access to green space; food systems and food security; and transportation infrastructure
Economic, Education, and Resource Environment


The Economic, Education, and Resource Environment includes the opportunities that enable communities to grow and thrive This section highlights the housing landscape, including a spotlight on childhood lead poisoning; the distribution of poverty, income, and job opportunities, including immigrants and workers’rights; the caregiving landscape; and systems of information, access, and navigation, including a spotlight on homelessness and healthcare
Healthcare and Health Outcomes
The Healthcare and Health Outcomes section summarizes key data on preventive health care, utilization of health care services, and the distribution of health conditions in our communities

28
Social Environment | PEOPLE
The social environment includes patterns of civic engagement and public participation, social norms and cultures, social networks, and trust.


29
Community Connectedness and Civic Engagement
Key Takeaway
Our communities have strong social networks, community organizing skills, cultures of civic engagement, and support for getting involved in policy advocacy.These strengths have grown and been heavily utilized during the COVID 19 pandemic and in solidarity with movements for racial justice, immigrant rights, reproductive rights, and violence prevention. Intentionally investing in these strengths is a leverage point for systemic changes that impact health outcomes
Strong community networks and organizers, especially among immigrant communities, people of color, and parents, facilitate mutual aid and advocacy for change.

Interview and focus group participants emphasized the value of networks and trust in promoting wellbeing Information sharing networks have grown as self organized platforms for people to share knowledge, experiences, and resources, like a WhatsApp group for Latino parents in Somerville and centers for immigrant communities in Everett Mutual aid networks were formed in all of CHA’s service area communities during the COVID 19 pandemic, providing essential connections and support through solidarity. Parents have come together to support children across the community, spearheading efforts like those in Medford to gather resources for tutoring and technology assistance for students. Renters facing housing instability and eviction have come together in online spaces to learn about and advocate for their rights as tenants
People who have faced homelessness, substance use disorders, and mental health crises are involved in peer support and recovery coaching emphasizing the importance of lived experience People in our communities demonstrate resilience, knowledge, and empathy through a readiness to help others facing similar challenges.
30
Although public health protections like physical distancing restricted communities’ability to gather in person during COVID 19, the pandemic also brought communities closer together, including across cultures Faith based organizations that play an important role in fostering engagement and belonging for many residents have also deepened their work during the pandemic


Examples inAction
● Everett CommunityAid Network (ECAN), Malden Neighbors Helping Neighbors (MNHN), and MutualAid for Medford and Somerville (MAMAS)
● La Comunidad, Inc
● Medford Health Matters
● Malden Cares
● Somerville Renters Group, convened by the CommunityActionAgency of Somerville (CAAS)
● The Welcome Project
Participants in the assessment offered examples and stories of how civic engagement has grown in the last several years This growth is not attributable to any single cause, but rather to a confluence of forces which include the context surrounding the COVID-19 pandemic and the arc of movements for racial, social, and economic justice.Themes around this finding included the importance of intergenerational organizing, cross sector coalitions, and issue specific training, education, and mobilization. New social and cultural norms around public participation were described by some residents as an “awakening ”
A groundswell of civic engagement and participation in public processes, including advocating for policy priorities, reflects a sense of hope and belief in individual and collective power to drive change.
31
There is interest in creating an authentic role for civic engagement in decisions around how funding for COVID response and recovery is channeled.Across communities, people want to ensure that the systems created during COVID function more equitably compared to those before the pandemic These include the equitable distribution of resources and thoughtful coordination of plans across sectors. Programs and policies created during COVID showed promise for addressing community needs, such as expanding eligibility and increasing per person resources for rental assistance (such as ResidentialAssistance of Families in Transition, or RAFT) and for food (such as Supplemental NutritionAssistance Program, or SNAP, and Pandemic EBT, or P-EBT). Creating mechanisms for continuing these successful demonstration projects was described as a challenge, but there is energy to advocate for doing so and to advance positive change more broadly For example, in each community, more than 9 in 10 participants in the Community Wellbeing Survey believe that all residents, including themselves, can make the community a better place to live

Examples inAction
● In Somerville, cross sector coalitions and municipal community initiatives focus on developing strategies to advance progressive housing policies, such as theTenant Opportunity to PurchaseAct at the state level and inclusionary zoning at the local level.
●
In Everett, education and organizing campaigns focus on immigrant rights.Training and support is offered to immigrant workers to seek collective bargaining agreements

32
Assessment participants emphasized the importance of collaboration in order to be responsive to community priorities and fill gaps in needed services From enhancing after school programs and opportunities for youth; to addressing hunger among students and increasing access to culturally relevant food in the community; to providing coordinated services to people experiencing homelessness, substance use, and mental health concerns, cross sector partnerships were viewed as essential.
During COVID, increased attention and resources were directed to preventing eviction and displacement One example is the strengthened collaboration between the Somerville Office of Housing Stability, the CommunityActionAgency of Somerville (CAAS), and the Somerville Community Corporation (SCC) to expand access to legal help for tenants facing eviction and to connect residents to expanded programs for rental assistance The COVID response reflected foundational infrastructure and systems developed long before the pandemic
Collaboration to address hunger and food security, including during COVID, was identified as a strength across our communities Examples include Mobile Farmers’Markets, SNAP/EBT match programs at farmers’markets, community fridge sites, food distribution networks, and the Women, Infants, and Children Nutrition Program (WIC)
Intentional collaboration among social service, health care, and community-based organizations contributes to leveraging resources to provide needed services.
33
Diversity, Equity, and Inclusion
Key Takeaway
People in our communities emphasize the importance of actively incorporating values of diversity, equity, and inclusion into how decisions are made, how systems operate, and how leaders are empowered. Deep and long-term changes in culture and systems are required in order to advance health equity and justice. Still, change must begin within our institutions.

A lack of representativeness among leaders and decision-makers in terms of racial and ethnic group background, language, socioeconomic position, and age is a concern for many people in our communities.
Assessment participants explained that a lack of representation among leaders shapes what perspectives and information decisions are based on When those decisions impact people whose experiences were unaccounted for or dismissed, it can result in experiencing distrust, stigma, language barriers, and other barriers when trying to participate in civic, economic, and political life Concerns about representativeness were raised in the contexts of municipal government agencies, schools, and healthcare institutions
Participants emphasized how important it is that efforts to ensure institutional structures and policies include leadership perspectives of people who are directly affected by inequity; how even with the best of intentions, progressive ideals are less likely to be translated into real change if the people in positions of power and authority do not change, too The difference between being consulted on an issue and being empowered to make decisions about that issue was identified by participants as influencing the level of ownership and pride they had over community processes.
34
Systems for ensuring municipal agencies, healthcare providers, schools, and elected officials are responsive and accountable do not always work to elevate the priorities of community members who are closest to the impact of inequity.

Accountability is essential to building trust. Assessment participants described experiences of having their voices not be heard or actively ignored when working to raise awareness of issues of importance to them and their communities While civic and community engagement processes may be created for people to share their opinions and be involved in decisions, those processes are not always designed with the needs and priorities of those very people in mind When those processes do not fulfill their intended purpose, trust can be easily eroded, leading to community members choosing not to engage.The relationship between civic participation, health, and wellbeing has been well researched; in addition to the direct benefit that civic participation provides to the community, it can also produce secondary health benefits, such as increased social capital, better psychological well being and positive emotional health.18

18
U.S. Department of Health and Human Services, Office of Disease Prevention and Health Promotion. Civic Participation. Healthy People 2030. https://health.gov/healthypeople/priority-areas/social-determinants-health /literature-summaries/civic-participation
35
Data Point | Community Wellbeing Survey participants were asked if they have experienced discrimination in housing, health care, jobs, and other areas of social and economic life. Those who reported experiences of discrimination were asked what they believe the cause of that experience to be. Across all of our communities, racism was the most common reason cited for experiences of discrimination
Data Source: CHA Community Wellbeing Survey 2021
Notes: Survey participants could select more than one reason for their experience, so proportions will not add to 100%
Data Point | Among youth survey participants, more than half cited racism as the reason for ha ing e perienced discrimination a higher proportion than an other age gro p


Data Source: CHA Community Wellbeing Survey 2021.
Notes: Survey participants could select more than one reason for their experience, so proportions will not add to 100% Survey participants from four communities (Everett, Malden, Medford, and Somerville) are combined to ensure an adequate sample size. Results based on smaller sample sizes (n < 30) should be interpreted with particular caution.
36
Data Point | Experiences of discrimination varied for survey participants who are newer immigrants, more established immigrants, or non immigrants Nearly half of established immigrants who have experienced discrimination cited racism as the reason, compared to less than one third of newer immigrants and non immigrants. Nearly one in five immigrants, regardless of length of time in the US, cited xenophobia. Discrimination on the basis of religion was among the top five reasons cited for experiences of discrimination among immigrants, but not among non-immigrants. Across all groups, more than one in four survey participants cited discrimination on the basis of income or education.

Data Source: CHA Community Wellbeing Survey 2021
Notes: Survey participants could select more than one reason for their experience, so proportions will not add to 100% Established immigrant is defined as having lived in the US for more than 6 years. Newer immigrant is defined as having lived in the US for 6 years or fewer Survey participants from four communities (Everett, Malden, Medford, and Somerville) are combined to ensure an adequate sample size
Data Point | Experiences of discrimination varied for survey participants of different ethnic group identities. Among participants who identified their ethnicity as African American, Brazilian, Chinese, Haitian, or Salvadoran, Guatemalan, or Honduran,19 racism was the most or second most common reason cited. Sexism was the most common reason cited among those who identified their ethnicity as European. This may be influenced by the gender identity composition of European survey participants. As with all survey results exploring experiences of discrimination, it is important to consider that people hold multiple identities, some of which may be privileged and some of which may be oppressed.
19 In analyses of Community Wellbeing Survey results, we combine participants who identify as Salvadoran, Guatemalan, or Honduran into a single group. The NorthernTriangle countries of El Salvador, Guatemala, and Honduras share certain political, cultural, and socioeconomic dynamics that shape the experiences of immigrants in our communities. While this approach obscures differences between groups, combining participants of these ethnicities also allows for a larger sample size for analytic purposes. In charts, this group is labeled as “Salv.Guat.Hond” for space purposes.
37
Data Source: CHA Community Wellbeing Survey 2021
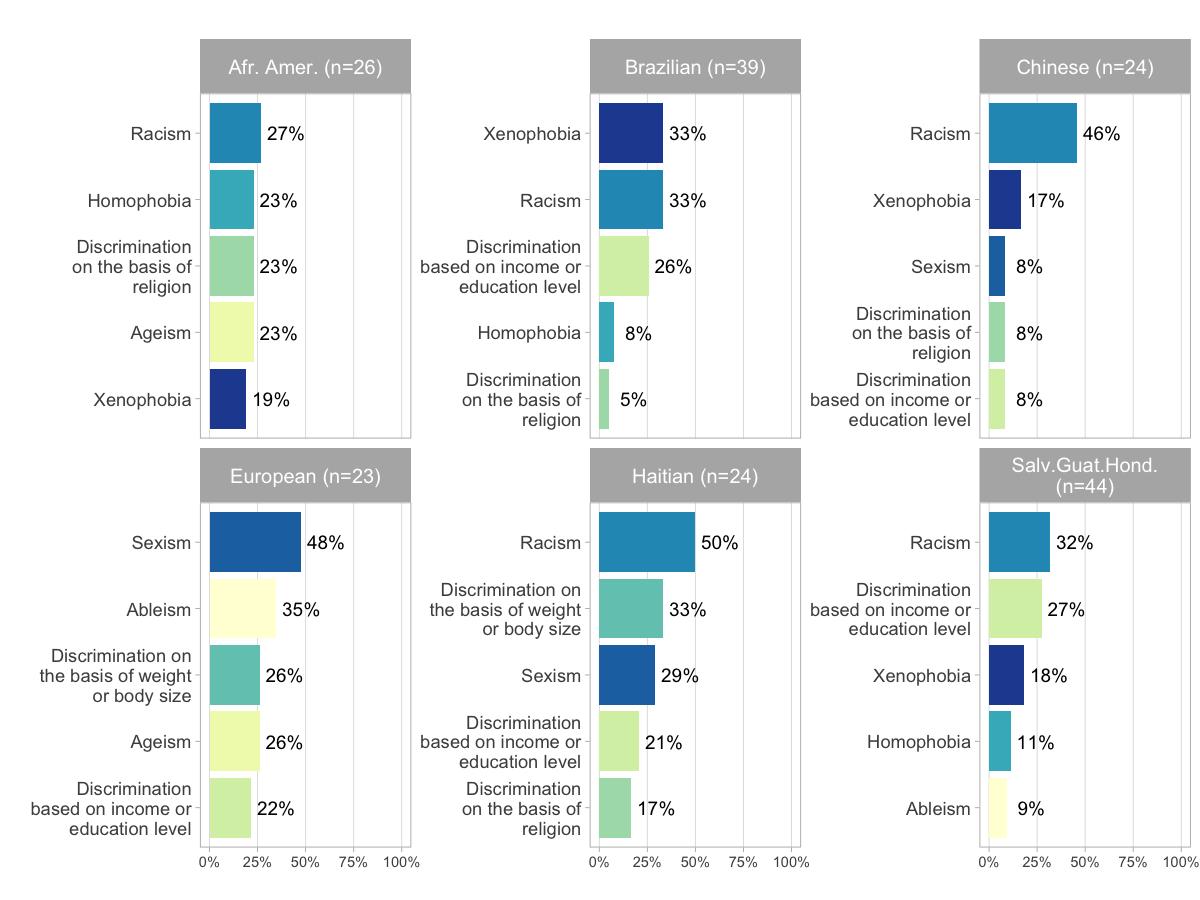
Notes: Survey participants could select more than one reason for their experience, so proportions will not add to 100%. Survey participants could select more than one ethnicity to describe their identity For survey analysis, ethnicity groupings were constructed based on unique combinations selected by participants, so may not align with Census Bureau demographic categories Survey participants from four communities (Everett, Malden, Medford, and Somerville) are combined to ensure an adequate sample size. Results based on smaller sample sizes (n < 30) should be interpreted with particular caution.
Assessment participants reflected candidly on issues such as racism as a public health crisis, wealth inequity and ownership of land and property, the legacy of colonialism in our country, and the histories of immigration in our communities Participants noted that they appreciated these opportunities for open and respectful dialogue with other community members, and would welcome additional avenues for these types of discussions Social media and online commentary were noted as key barriers to engaging in meaningful dialogue about systems change While dialogue is not sufficient in itself, participants felt it was an essential component to support actions for more inclusive and equitable communities
Respectful listening and dialogue are essential ingredients to advancing equity and inclusion – beyond words, and into practice.
38
Community Voices
Ideas for Advancing Diversity, Equity, and Inclusion
● Invest in increasing representativeness of leaders and decision-makers in terms of racial and ethnic background, language, socioeconomic position, and age. This was noted as especially important in municipal government, education, and health care sectors
● Create mechanisms for power sharing and community participation in decision-making to change the dynamics around priority setting and resource allocation. Invest in participatory processes and information transparency, particularly about where funds are spent, who manages them, and who is accountable for their use Such mechanisms will help ensure the culture and priorities of people who live in a community are reflected in the physical space and how the community looks and functions

● Promote participatory approaches to engage community members in conversation at the very beginning of planning and throughout all stages of projects and initiatives. At the same time, do not point to community engagement practices as a replacement for promoting people of diverse identities and experiences to positions of power and decision-making Hold community forums where people already gather, or partner with cultural events, interfaith events, arts venues, or community action projects to hold space to engage people, share information, and receive feedback If forums must be held separately, remove as many barriers to access as possible: provide childcare, interpretation, food, and consider location accessibility by public transit and for persons with disabilities
● Listen to young people when making decisions that impact them. Be authentic in creating structures for meaningful youth participation, rather than tokenizing youth voice
● Use data to set benchmarks for changes at the community level. Help people build their capacity for understanding and using data to hold their community accountable for closing gaps or improving performance
● Invest in training and education about anti-racism, cultural humility, acknowledging and addressing bias, and dismantling structural forms of discrimination. Emphasize the importance of sharing stories and speaking truth across lines of difference. Invest in facilitating dialogue and in encouraging residents to use their voices
39
Safety, Collective Care, and Healing
Key Takeaway
The intersecting national crises of racism, political discord, violence, and COVID 19 raise growing concerns about local impacts on the mental health and wellbeing of community members. While access to mental health care is an essential need, this challenge cannot be the responsibility of therapists alone to solve.There is a need for safe, culturally responsive spaces for healing and collective care As defined by the Ugandan feminist organization Raising Voices, “Collective care is seeing others' well-being as a shared responsibility of the group.”20 Participants reflected on how collective care means not only creating intentional spaces and resource centers for people to come together, but imagining systems that ensure safety from violence and discrimination, that foster belonging and healing, and that promote public spaces that equitably reflect the priorities and preferences of diverse communities
What is collective care?
Collective care is rooted in the perspectives, practice, and movement building of Black feminists, disability justice advocates, queer organizers, and Indigenous peoples.There are many definitions and examples, including these selections
20 Billing, L. et al. (2022). Creating and maintaining a culture of self and collective care at Raising Voices. Sexual Violence Research Initiative: Pretoria, SouthAfrica. https://raisingvoices.org/resources/culture-of-self-andcollective-care-at-raising-voices/

40
Participants in the assessment noted that while they are deeply concerned about the mental health of community members, they are wary of solutions that focus only on access to therapy or other forms of mental health treatment Equity in access to mental health care is important in and of itself. However, participants pointed to the root causes of declining community mental health as individual, community, and intergenerational exposure to racism, political discord, violence, and trauma compounded by the present crisis of COVID 19 Stress, anxiety, and depression are reasonable reactions to experiencing the impacts of structural racism and other forms of oppression
Data Point | We asked Community Wellbeing Survey participants if they feel there are people or organizations in their community that support them during times of stress or need. The proportion of participants who agreed with this statement varied by community from 68% in Medford, to 69% in Everett, 74% in Malden, and 84% in Somerville This is a strength to build upon in developing community health initiatives and systems that promote collective care.


Data Point | Participants in the Community Wellbeing Survey were asked to identify the most important things to improve in their community. Reducing crime and violence was selected as a top priority by around 30% of participants from Everett and Malden. In addition, reducing crime and violence was among the top priorities for survey participants who identified their ethnicity as African American (33% selected this priority) or Chinese (38%). Experiences of racist acts of violence, both physical and verbal, were noted in interviews and focus groups, reinforcing these survey findings.

To reduce stress, anxiety, and depression, we must address the root sociocultural, economic, and political causes.
41
Data Source: CHA Community Wellbeing Survey 2021

Notes: Survey participants could select more than priority, so proportions will not add to 100%. Survey participants could select more than one ethnicity to describe their identity For survey analysis, ethnicity groupings were constructed based on unique combinations selected by participants, so they may not align with Census Bureau or other common demographic categories Survey participants from four communities (Everett, Malden, Medford, and Somerville) are combined to ensure an adequate sample size. Results based on smaller sample sizes (n < 30) should be interpreted with particular caution.
Interview and focus group participants noted a lack of systems oriented thinking around promoting community level resilience and capacity for collective care Community resource centers likeThe Welcome Project were described as valuable places for people to gather and exchange information, but focus group participants noted there are not enough of these spaces in their communities Healing from trauma was described as a community process, with individual trauma inseparable from intergenerational and community-level experiences, but there are too few integrated approaches As an example, strategies to promote safety that focus only on police and law enforcement interventions were cited as inadequate ways of addressing the underlying need for healing, support, and community wellbeing. Focus groups and interview
Healing and support that focus only on the individual may overlook community interdependence and the need for systems of care.
42
participants also emphasized that fostering a sense of safety and belonging in a community involves recognizing, respecting, and cultivating interdependence among community members. However, there was agreement around the lack of systems and supports that enable people to give and receive the care they need across their life courses and circumstances.
The COVID-19 pandemic has highlighted the need for collective care and healing.

The COVID-19 pandemic has highlighted our society’s interdependence. However, the pandemic has also led to greater isolation The power of misinformation and fear, as well as public health protections like physical distancing, have created separations both political and physical, with devastating consequences for wellbeing across our communities. Participants in the assessment noted these harms have been particularly significant among young people, older adults, and immigrant communities that are traditionally tight knit

43
Community Voices
Ideas for Addressing Concerns about Safety, Collective Care, and Healing
● Develop policies and practices that promote environments that are safe, inclusive, and free from discrimination Consider safety, inclusion, and freedom from discrimination on the basis of race or ethnicity, immigration background, language, age, gender, sexual orientation, socioeconomic position, and disability
● Explore what spaces of collective care would look and feel like from the perspective of different communities and people of diverse identities. Consider intergenerational wellbeing, including maintaining cultural traditions between youth and elders, as a component of promoting mental health and sense of belonging
● Strengthen social and economic support for parents and families. Collective care ensures parents and families have the social support and economic resources they need to thrive Pay particular attention to the needs of immigrant communities
● Invest in mental health services, but clarify the line between providing equitable access to care, and merely helping people cope with injustice. Participants emphasized that stress and anxiety are reasonable responses to experiencing racism, political oppression, and a pandemic The solution is to address root causes
Spotlight on: Caring for Young People in our Communities
As participants in focus groups, young people shared many insights and experiences related to collective care, safety, and healing Youth are not a singular group, and are diverse in racial and ethnic background, gender identity, sexual orientation, culture and language, and many other aspects of identity.Young people’s experiences, strengths, needs, and priorities are diverse too.
Young people are concerned about mental health – their own, and among their friends and their family members. Caring for young people’s mental health includes increasing equity in access to therapy, and investing in collective care approaches.
Youth participants in the assessment noted that promoting mental health involves expanding training around trauma and trauma-informed approaches for educators, community members, and social service providers It involves investing in equitable access to youth sports, quality afterschool and vacation programming, and arts and music It also involves promoting systems of care to support the adults in their lives – helping to ensure those adults can in turn support children and youth
44
Data Point | For young people, having a trusted adult to talk to is a protective factor a condition that mitigates the impact of stress and trauma and reduces the risk of negative health outcomes. The proportion of middle school and high school students who report having a trusted adult to talk to varies across our communities. In general, students are more likely to report having a parent or adult family member to talk to than they are to report having a teacher or other school adult to talk to.
Data Source: 2019 Everett Student Health Survey (Grades 6 12); 2018 Malden Middle School and High School Health Surveys (Grades 7 12); 2019 Medford High School Communities that Care Youth Survey; 2019 Medford Middle School Communities that Care Youth Survey; 2020 Somerville High School Health Survey (Grades 9 12); 2019 Somerville Middle School Health Survey (Grades 6 8)

Notes: These items were not included on the Massachusetts High School Youth Risk Behavior Survey There is no Massachusetts Middle School Youth Risk Behavior Survey Malden Middle School and Somerville Middle School surveys did not include the item asking about a parent or other adult family member to talk to
Youth participants in the assessment described how the rising costs of housing increase the risk of displacement for their families, and how a lack of community involvement in decisions affecting their neighborhoods exacerbates gentrification and displacement Youth whose families are immigrants described the structural barriers their parents face, and how challenging it can be to feel responsible for helping their families navigate new systems in the US even as they express the desire and commitment to use their language, technological, and other skills to do so The unique stressors that the COVID 19 pandemic has exerted on young people were noted in multiple areas, including in how education policies influence their mental health.
Young people are attuned to the social, economic, and policy forces that impact their lives and communities.
45
Data Point | Participants in the Community Wellbeing Survey were asked to identify the most important things to improve in their community Among all age groups except those 75 years and older, more affordable housing was the top priority for improvement and among youth ages 17 24, a higher proportion of participants selected this priority (69%) compared to any other age group. Youth identified other top priorities as making the environment cleaner, improving public transportation and road safety, and increasing access to good jobs.
Data Source: CHA Community Wellbeing Survey 2021.


Notes: Survey participants could select more than one priority, so proportions will not add to 100% Survey participants from four communities (Everett, Malden, Medford, and Somerville) are
to ensure
combined
an adequate sample size 46
Bullying and cyber bullying were raised as increasing concerns in our school communities.Youth voiced concerns that inadequate attention is paid toward addressing violence and discrimination in schools.

Concerns about pre teens and young teens “falling through the cracks” were echoed in several communities.
Data Point | Bullying and cyber bullying can reflect environments that are not conducive to mental health, wellbeing, and safety In our communities, bullying tends to be more common among middle school students compared to high school students, with variation between communities. While cyberbullying tends to be less common than bullying overall, a similar pattern exists between middle school students and high school students in most communities.
Data Source: 2019 Everett Student Health Survey (Grades 6 12); 2018 Malden Middle School and High School Health Surveys (Grades 7 12); 2019 Medford High School Communities that Care Youth Survey; 2019 Medford Middle School Communities that Care Youth Survey; 2020 Somerville High School Health Survey (Grades 9 12); 2019 Somerville Middle School Health Survey (Grades 6 8); 2019 Massachusetts High School Youth Risk Behavior Survey (CDC)

Notes: There is no Massachusetts Middle School Youth Risk Behavior Survey
Youth voice is an essential part of promoting community health and wellbeing.
In addition to this Spotlight, youth perspectives, ideas, and health outcomes are incorporated throughout this report Youth voice is significant to all of the community conditions examined in this assessment.
Young people are concerned about gaps in resources and priority focus areas, particularly for addressing interpersonal violence and discrimination, and for supporting middle school-age youth.
47
Natural and Built Environment | PLACE
The Natural and Built Environment includes all of the physical spaces in our community in which we live, work, and play. The natural environment encompasses aspects such as green spaces, the geography and landscape of our communities, and our water and air. The built environment includes the human made aspects of our communities, such as buildings, retail and commercial spaces, food systems, and transportation systems.

48
Our health is affected by the natural and built environment in multiple interconnected ways. Exposure to hazardous environments is a significant health equity issue.
● Exposure to outdoor air pollution from vehicles and industrial sources has been associated with an increased risk of cardiovascular disease21 and lung cancer 22 Air pollution has also been associated with higher COVID-19 death rates.23
● Cancer incidence has been associated with environmental exposures to chemical toxins, such as arsenic, benzene, cadmium, nitrate, and radon, even as genetic and behavioral factors play a role in cancer risk 24
● Cardiovascular conditions including high blood pressure, high cholesterol, and coronary heart disease are associated with diet and physical activity.These individual risk factors are influenced by community conditions: the food retail environment, the affordability and accessibility of healthy and culturally appropriate food, the accessibility and safety of open space, and neighborhood walkability and transit options.25,26
● Adverse cardiovascular outcomes such as heart attacks have been associated with hotter temperatures, and access to emergency care can be impaired by extreme weather events associated with climate change 27
● Obesity and diabetes have been associated with environmental exposures to endocrine disrupting chemicals (EDCs), even as individual risk factors such as diet and physical activity play a role as well 28
● Indoor air pollution from secondhand smoke, chemicals, mold, and pests can cause and exacerbate asthma These exposures are worsened by poor ventilation Chronic obstructive pulmonary disorder (COPD) is mainly caused by tobacco smoking, but can be exacerbated by environmental exposures 29
Kaufman, J.D. et al. (2016).Association between air pollution and coronary artery calcification within six metropolitan areas in the USA(the Multi-Ethnic Study ofAtherosclerosis andAir Pollution):Alongitudinal cohort study The Lancet.
Turner, M.C. et al. (2020). Outdoor air pollution and cancer:An overview of the current evidence and public health recommendations. CA: A Cancer Journal for Clinicians.
Petroni, M. et al. (2020). Hazardous air pollutant exposure as a contributing factor to COVID-19 mortality in the United States. Environmental Research Letters.
National Cancer Institute. (2021). Cancer Trends Progress Report: Chemical and Environmental Exposures.
American Public HealthAssociation. (2019). Addressing Environmental Justice to Achieve Health Equity
Munzel,T. et al. (2021). Environmental risk factors and cardiovascular diseases:Acomprehensive expert review Cardiovascular Research.
US Global Change Research Program. (2016). The Impacts of Climate Change on Human Health in the United States: A Scientific Assessment.
Gupta, R. et al. (2020). Endocrine disruption and obesity:Acurrent review on environmental obesogens. Current Research in Green and Sustainable Chemistry
M. et al. (2012). Respiratory health and indoor air pollutants based on quantitative exposure assessments. European Respiratory Journal.
29 Hulin,
28
27
26
25
24
23
22
21
49
Climate Resilience
Key Takeaway
People of color, people who speak languages other than English, and lower income families are disproportionately residents of neighborhoods at higher risk of climate related hazards, which the Massachusetts Executive Office of Energy and EnvironmentalAffairs defines as Environmental Justice populations.30 Engaging the people who are most likely to be impacted by climate change is necessary to develop plans that are equitable in implementation, and that lead to equitable outcomes.
Our communities are vulnerable to the effects of climate change.
The Climate Vulnerability Index, developed by the MetropolitanArea Planning Council (MAPC), is used to identify neighborhoods that are vulnerable to climate hazards The index incorporates data on social, economic, health, housing, and workforce factors, alongside data about temperature, flood zones, and coastal flood modeling.
Data Mapping | The Climate Vulnerability Index rates most areas of Everett and Malden as moderate to moderately high risk, and most areas of Medford and Somerville as moderate to low risk Across all communities, including surrounding municipalities, there are equity concerns with heat islands and local flooding.

30 An Environmental Justice (EJ) population is a neighborhood where one or more of the following criteria are true: 1) the annual median household income is 65% or less of the statewide annual median household income; 2) minorities make up 40% or more of the population; 3) 25% or more of households identify as speaking English less than "very well"; 4) minorities make up 25% or more of the population and the annual median household income of the municipality in which the neighborhood is located does not exceed 150% of the statewide annual median household income For more information, see: https://wwwmass gov/info details/environmental justice populations in massachusetts
 Data and Image Source: Flingai, Seleeke. (December 2019). Social Vulnerability to Climate Change in Greater Boston. Metropolitan Area Planning Council, Boston, MA.
50
Data Point | Among participants in the Community Wellbeing Survey, only about half of participants in each municipality reported having reliable access to options for staying cool during extreme heat. Across communities, newer immigrants, Hispanic or Latino residents, and Black residents were less likely than other groups to report having reliable access to options for staying cool.

Data Source: CHA Community Wellbeing Survey 2021

Notes: For analysis by demographic variables, survey participants from four communities (Everett, Malden, Medford, and Somerville) are combined to ensure an adequate sample size. Survey participants could select more than one racial group to describe their identity AIAN or NHPI indicates American Indian or Alaska Native, combined with Native Hawaiian or Pacific Islander Hispanic or Latino was offered as a selection for racial group Newer immigrant is defined as having lived in the US for 6 years or fewer. Established immigrant is defined as having lived in the US for more than 6 years.
There is deep expertise in our communities related to climate change preparedness and resilience.The plans and work of Medford
 The Climate Vulnerability Index can be explored interactively at this website: https://climate-vulnerability.mapc.org/
Community members are often not aware of local efforts to promote resilience and preparedness for climate change.
51
Resilience Hubs, Somerville Climate Forward, and the Resilient Mystic Collaborative strive to achieve carbon neutrality, finance and promote clean energy technology, mitigate flood risks, and expand and protect tree cover Involving renters, low income residents, communities of color, and immigrant communities in developing plans to mitigate climate and environmental hazards is recognized as essential but has not yet been achieved equitably.
Data Point | Among participants in the Community Wellbeing Survey, between 22% (in Malden) and 39% (in Somerville) of residents in each municipality did not know if their community was prepared to protect itself during climate disasters. Across communities, established immigrants and Hispanic or Latino residents were more likely than other groups to report not knowing about their community’s climate disaster preparedness level.

Data Source: CHA Community Wellbeing Survey 2021
Notes: For analysis by demographic variables, survey participants from four communities (Everett, Malden, Medford, and Somerville) are combined to ensure an adequate sample size Survey participants could select more than one racial group to describe their identity AIAN or NHPI indicates American Indian or Alaska Native, combined with Native Hawaiian or Pacific Islander Hispanic or Latino was offered as a selection for racial group Newer immigrant is defined as having lived in the US for 6 years or fewer. Established immigrant is defined as having lived in the US for more than 6 years.

52
Community Voices: Ideas for Addressing Climate Change Concerns
● Tailor communication about key climate hazards and city ordinances related to climate change goals to communities most likely to be impacted This includes translation of materials, utilizing communities' preferred communication channels, and developing messages that speak to community concerns
● Advance the goals outlined in municipal climate plans with an equity lens. This includes engaging residents closest to the impact of climate change in planning efforts, and ensuring their interests are centered in goals, monitoring, and mitigation priorities
● Consider how institutions across sectors can play a role in mitigating the impacts of climate change and avoid contributing further to climate change. Healthcare institutions, for example, have a role to play in addressing the health impacts of exposure to extreme heat, injury or illness sustained in storms, and reduced access to health care and medication that may result from extreme weather and disasters At the same time, healthcare institutions can reduce their contributions to climate change by reducing greenhouse gas emissions, transitioning to sustainable food options, examining supply chains and procurement practices, developing procedures to reduce medical waste, and other operational and policy steps to decrease healthcare’s carbon footprint.
Air, Water, and Land
Key Takeaway
Exposure to environmental health hazards and pollution is an equity concern in our communities Engaging the people who are most directly impacted by environmental injustice is necessary to repair and mitigate harm, prevent future damage, and promote environmental health.
Results from the Community Wellbeing Survey, interviews, and focus groups point to inequities in experiences of air quality, water quality, and green space.
Particularly in Everett and Malden, interview participants noted inequities in lack of green space, localized flooding, and exposure to pollution from trucking traffic in industrial areas, which are disproportionately sited near low income neighborhoods Due to historical segregation and environmental racism, households in these same neighborhoods are disproportionately immigrants and people of color
53
Data Point | Community Wellbeing Survey participants’ perceptions of access to green spaces, air quality, and water quality varied by community The proportions of participants who did not know if the air or water was safe were much larger than the proportions of participants who did not know about access to safe, clean parks and open spaces.
Newer immigrants were less likely to report confidence that the air in their community is healthy to breathe, and that the water is safe to drink. There were no notable differences in perceptions of access to green space by immigrant history.


54
There was also variation in perceptions by racial group Hispanic or Latino participants were more likely than other groups to report not knowing if the air is healthy to breathe or the water is safe to drink. Black participants were more likely than other groups to report the water is not at all safe to drink, and the air not at all healthy to breathe.
Data Source: CHA Community Wellbeing Survey 2021

Notes: For analysis by demographic variables, survey participants from four communities (Everett, Malden, Medford, and Somerville) are combined to ensure an adequate sample size. Survey participants could select more than one racial group to describe their identity AIAN or NHPI indicates American Indian or Alaska Native, combined with Native Hawaiian or Pacific Islander Hispanic or Latino was offered as a selection for racial group Newer immigrant is defined as having lived in the US for 6 years or fewer Established immigrant is defined as having lived in the US for more than 6 years
Air pollution is a concern in our communities.
Vehicle emissions are a major source of the type of ultrafine particles that are most strongly associated with adverse health outcomes The Pollution Proximity Index (PPI) developed by the MetropolitanArea Planning Council (MAPC) uses traffic and spatial data to categorize geographic areas using a score of 0 (lowest exposure to emissions) to 5 (highest exposure).
Data Mapping | Many neighborhoods in our communities are exposed to the highest levels of emissions, shown in purple in the map below, on the left The graph below, on the right shows that people of color are more likely to live in neighborhoods with higher pollution intensity. Across the Greater Boston region, shown at the far right, 34% of residents live in areas with the highest PPI score the deep purple bar segment. Moving to the left, we can see how the proportion of residents in each racial/ethnic group who live in the neighborhoods with the highest PPI score changes: over 50% of Latino residents, over 45% of Asian and Black residents, and less than 30% of White residents.
55
Inequities in exposure to air pollution have also been highlighted through community based participatory research projects under the CommunityAssessment of Freeway Exposure and Health (CAFEH) Study,31 notably in East Somerville

Through the Massachusetts Water ResourcesAuthority (MWRA) Lead Service Line Replacement Loan Program and other efforts, many of our communities have made progress in removing lead service lines that provide water to homes and businesses.32 There is not a standardized way in which municipalities report on lead service line replacement efforts, so it is not possible to compare the proportion of lead service lines that have been replaced between communities. However,Annual Drinking WaterTest Results published for each community offer insight into actions taken in recent years 33

31 For more information on the CommunityAssessment of Freeway Exposure and Health (CAFEH) Study, visit https://www.cafehresearch.org/
32 Massachusetts Water ResourcesAuthority (MWRA). (n.d.). Lead Service Line Replacement Loan Program or Lead Loan Program (LLP). https://www.mwra.com/comsupport/llp/llpprogram.html
33 Lead service line replacement details are available by community at https://www.mwra.com/water/html/awqr.htm
Data and Image Source: Racial Disparities in the Proximity to Vehicle Air Pollution in the MAPC Region Metropolitan Area Planning Council, May 2020.Drinking water quality is a concern in some of our communities, despite progress that has been made to reduce exposure to toxins such as lead.
56
The US Environmental ProtectionAgency (EPA) and the Massachusetts Department of Environmental Protection (DEP) require MWRAand local municipal water departments to test tap water each year by collecting samples from homes that have a higher risk of lead contamination.To meet public health standards, 9 out of 10 homes tested must have lead levels below the action level of 15 parts per billion (ppb).
In 2021, samples from Malden and Medford exceeded the lead action level threshold. Following intervention in these communities, subsequent water sampling in Spring 2022 showed that lead levels had fallen below the action level Still, it is notable that in all of our communities, and in the MWRAsystem, lead levels were higher in 2021 compared to 2020.

Data Source: Massachusetts Water Resources Authority (MWRA), Annual Drinking Water Test Results, 2020 and 2021
Notes: Following intervention, subsequent sampling in Spring 2022 found lead levels in Malden to have fallen to 6 6 ppb, and in Medford to 7.67 ppb.
In Everett, Medford, and Somerville, routine weekly water sampling during Fall 2021 identified coliform bacteria in more than 5% of weekly samples, activating a requirement to conduct assessments to identify and correct problems in water treatment or distribution 34 Coliform bacteria are naturally present in the environment, but when present in drinking water, serve as an indicator that harmful waterborne pathogens may be present or that there is potential for contamination of the drinking water system.Assessments were completed in all three communities, and corrective actions completed in Somerville Information on corrective actions completed in Everett and Medford were not available during the assessment Hotter summers leading to higher water temperatures and heavier rainfall can contribute to the presence of coliform bacteria in drinking water
Trees and green space are not equitably distributed in our communities.
Urban tree canopy cover including tree-lined streets, parks, and trees on residential or commercial property provides environmental, health, and social and economic benefits to
34 Massachusetts Water ResourcesAuthority (MWRA). (2022).Annual Drinking WaterTest Results, 2021 Available at https://www.mwra.com/annual/waterreport/2021results/2021results.htm
57
communities 35 TheTree Equity Score developed byAmerican Forests combines measures of tree canopy cover with climate, demographic, and socioeconomic data to identify neighborhoods that are disproportionately exposed to a lack of urban trees 36 The score ranges from 0 (least equity) to 100 (full equity) and is calculated at the Census Block Group level.
Data Mapping | Neighborhoods with higher concentrations of households experiencing poverty and higher concentrations of residents who are people of color tend to be the same neighborhoods with fewer trees. In this map, brighter orange indicates areas with lower Tree Equity Scores, and brighter green indicates areas with higher Tree Equity Scores.

Equity Scores for
region, including how
are
with
this website:
Data and Image Source: American Forests, Tree Equity Score Tree
our
scores
associated
neighborhood-level characteristics, can be explored interactively at
https://wwwtreeequityscore org/map/#11/42 4018/ 71 0382 36 American Forests. (n.d.) Tree Equity Score Methodology https://www.treeequityscore.org/methodology/ 35 Vibrant Cities Lab. (n.d.) Climate & Health Action Guide. https://www.vibrantcitieslab.com/guides/ climate-health-action-guide/ 58
Food Systems and Food Security
Key Takeaway
Our communities understand access to healthy food as part of a broader conversation about justice and equity In addressing the challenges of hunger and food insecurity, it is important to consider how food is grown and produced, who is growing and producing it, how and where food is distributed, how costs are subsidized or passed to consumers, how cultural relevance is considered, and how food waste is handled Food insecurity is associated with poor health outcomes, such as diabetes, poor oral health, pediatric asthma, nutrient deficiencies, and poor mental health 37 Leaders and advocates for equitable food systems are strong in our communities, both in working toward long term change and in addressing emergency conditions such as those created by the COVID-19 pandemic.
Attention and resources directed to addressing hunger and food insecurity increased during COVID, building on partnerships and systems developed long before the pandemic.
The COVID 19 Community Impact Survey found almost 1 in 3 Everett residents, 1 in 5 Malden and Medford residents, and over 1 in 10 Somerville residents were concerned about getting food or groceries in Fall 2020. Our communities responded in multiple ways. Community members organized mutual aid efforts to purchase and deliver groceries to people in need Food security and hunger organizations expanded and opened new food bank locations Coalitions advocated for expanded access to food purchasing assistance benefits such as the Supplemental NutritionAssistance Program (SNAP), Healthy Incentives Program (HIP), and new P EBT(Pandemic EBT) program. Non profit organizations, local businesses, community groups, and others across sectors leveraged and created new partnerships and supply chain processes to source and deliver food, identifying and supporting people in need through schools, faith communities, healthcare systems, and more
Data Source: Massachusetts Department of Public Health, COVID 19 Community Impact Survey (CCIS), Fall 2020
Notes: The CCIS was conducted online from September through November 2020 by the Massachusetts Department of Public Health The purpose of the survey was to understand the needs and experiences of populations that have been disproportionately impacted by the pandemic The survey was NOT designed to be fully representative of residents of a given community, so results should be interpreted with caution White non Hispanic residents were overrepresented among survey respondents in Malden, Medford, and Somerville, but not in Everett. Low income residents were underrepresented among survey respondents in all four communities The total sample size was over 33,000 residents (adults over age 25), including 156 from Everett, 319 from Malden, 322 from Medford, and 566 from Somerville
 37 Gunderson, C. and Ziliak, J.P. (2015). Food Insecurity and Health Outcomes. Health Affairs.
59
Data Point | More people in our communities are enrolling in the Supplemental Nutrition Assistance Program (SNAP) After an initial sharp increase in the number of SNAP recipients in the spring and early summer of 2020, the number of SNAP recipients has continued to increase in each of our communities.
Comparing the number of SNAP recipients in March 2020 to the number in October 2021, SNAP enrollment increased by 45% in Everett, 44% in Malden, 36% in Medford, and 34% in Somerville

Data Source: Massachusetts Department of Transitional Assistance
Despite increasing SNAP enrollment and strong efforts to address hunger, food insecurity remains a persistent equity concern as the impacts of the COVID-19 pandemic continue to unfold.
As of December 2020, the percentage of individuals who are eligible for SNAPbut not accessing benefits a measure known as the SNAPGap was higher in all four communities compared to the state The reasons for not accessing SNAP may include stigma, lack of information and assistance with the application, lack of language access, low perceived benefits of SNAP, and concerns about eligibility requirements, particularly among immigrants 38, 39

38 Avila, M. et al. (2021) Barriers to SNAP. Project Bread, Boston MA. https://www.projectbread.org/uploads/ attachments/ckrupoiyh0lbsgl9havs9lxj2-boston-snap-survey-research-brief-2021.pdf
39
The MassINC Polling Group. (2021). Lessons from P-EBT to IncreaseAccess to SNAP https://www.massincpolling.com/the-topline/survey-p-ebt-helped-thousands-of-families-access-food-but-as-food-insec urity-remains-high-other-assistance-programs-are-underutilized
60
According to the Greater Boston Food Bank’s annual statewide survey on food access,40 32% of Massachusetts adults experienced food insecurity in 2021 an increase from 19% in 2019 and from 30% in 2020 Inequities remain prevalent, with higher rates of food insecurity among Latinx adults (61%), Black adults (53%), LGBTQ+ adults (51%), and households with children (40%) compared to the statewide average.Adults experiencing food insecurity also reported experiencing discrimination at a much higher rate (86%) compared to adults not experiencing food insecurity (50%). Experiences of discrimination may add to stigma associated with seeking food assistance, thereby contributing to food access barriers
As the Greater Boston Food Bank pointed out in its findings, at a national level, grocery prices increased by 6 5% from January to December 2021 the largest year over year increase in more than a decade Combined with the expiration of COVID era federal assistance programs at the end of 2021, such as supplemental pandemic unemployment benefits and the Expanded ChildTax Credit, people with lower incomes and people of color have been disproportionately burdened by the impact of rising food prices and declining financial assistance.
Neighborhood-level access to healthy food is patterned by structural racism, both historically and in the present day.
For any neighborhood, the food retail environment is influenced by historical patterns of segregation, often encoded in zoning or incentive policies.The changing composition of a neighborhood in terms of racial or ethnic identity, cultural identity, or socioeconomic position also influences the food retail environment, as consumer purchasing power shifts demand.
Assessment participants discussed how ideas of what “healthy food” means can be associated with wealth, gentrification, and whiteness as such, interventions to expand access to healthy food can perpetuate structural racism and inequity, even as an unintended consequence.
The concentration of affordable, fresh produce at only certain grocery stores limits access, especially when transportation and cost are concerns Focus group and interview participants discussed the interconnections between cost, quality, and access to nutritious food as fundamentally shaped by structural racism
40 Zack R, Marriott J, Lynn C, et al. (2022). Opportunities to Improve FoodAccess Equity and Experiences in Massachusetts.The Greater Boston Food Bank, Boston, MA. http://www.gbfb.org/wp-content/uploads/ 2022/06/GBFB_Food-Access_Report22_FINAL_6.6.22-1.pdf

61
Food is deeply intertwined with culture. Equitable food systems must provide options that are acceptable and relevant to diverse communities.

Food systems can foster belonging and community. For new immigrants, assessment participants shared the importance of their engagement in efforts to strengthen access to healthy food, including developing urban farming initiatives, diversifying products available at food banks, and helping owners of culturally-specific grocery stores to incorporate SNAPand WIC into their businesses
Community Voices:
Ideas for Addressing Food Systems and Food Security Concerns
● Develop food systems interventions that acknowledge the connections between income, employment, housing, transportation, and food access. Policy and planning interventions that work to increase income, make housing more affordable, and ensure reliable, safe transportation also support healthy food access in our communities.
● Reduce barriers to growing one’s own food and expand education and support for households interested in home gardening. This may include zoning changes to promote urban agriculture, use of rooftop gardens, use of container gardening, expansion of community gardens, and training and tools for households
● Consider the unintended consequences of interventions. Consider the ways in which efforts to increase food security could perpetuate inequity for example, if community garden plots are taken only by higher income households.
● Promote community-driven efforts to shape the food landscape. Promote acceptability of culturally diverse foods
● Expand the reach of Mobile Farmers’Markets. Consider both location (for example, to more low income housing developments) and time (for example, during winter)
● Expand policy solutions to lower the costs of produce and non-processed foods. Prioritize lowering costs in ways that preferentially benefit lower income people, such as the Healthy Incentive Program (HIP) which provides SNAPfamilies with additional benefits when they purchase fresh produce at farmers markets and through community supported agriculture (CSA) shares

62
Transportation
Key Takeaway
Transportation is a vital resource that contributes to the quality of life and health of a community. Residents must have reliable access to different modes of transportation, including options for pedestrians, people who use mobility aids or devices, cyclists, motorists, and public transit riders of all ages and mobility needs.Alack of reliable and affordable transportation impacts community members’ability to access jobs, school, recreation, food, and other resources and services, with disproportionate effects for older adults, youth, low-income adults, and persons with disabilities The development of community partnerships to improve and expand transportation accessibility is beneficial for community wellbeing Acommunity’s economic stability and future growth are closely aligned to its ability to provide safe and affordable transportation
Neighborhood design and transit infrastructure directly impact residents’ ability to get around, influencing their ability to participate in opportunities and access the resources they need.
Communities that are pedestrian friendly, are well served by public transit, and are safe and convenient for cyclists offer residents a range of health and economic benefits including proximity to other people, reduced emissions, lower transportation costs, and access to community and business resources
Walk Score41 has developed three indices to capture the mobility infrastructure of a community The first index utilizes data on pedestrian routes to different amenities, population density, and road metrics to calculate a “Walk Score” on a scale of 0 (car-dependent) to 100 (a “walker’s paradise”) The second index measures the usefulness of nearby transit routes, based on the frequency of rail or bus service and the distance to nearest stops, to calculate a “Transit Score” on a scale of 0 (minimal transit) to 100 (a “rider’s paradise”).The third index measures cycling infrastructure, hills, road connectivity, and the number of bike commuters to calculate a “Bike Score” on a scale of 0 (somewhat bikeable) to 100 (a “biker’s paradise”). Scores are calculated at city block levels, weighted by population density, and aggregated to neighborhood or community levels
41 Walk Score. (2022). Walk Score Methodology https://www.walkscore.com/methodology.shtml 63
Data Point | Everett, Malden, and Somerville are very walkable cities, with scores in the range of 70 89. Everett, Malden and Somerville have good transportation accessibility, with scores in the range of 50 69. Somerville is rated as a “biker’s paradise,” with a score in the 90 100 range, while Everett, Malden, and Medford scoring as less bikeable
Data Source: Walk Score (2022)
Not all neighborhoods within each community are equally pedestrian, transit, and cyclist friendly To explore neighborhood level maps for each community, visit the Walk Score website at these links: Everett | Malden | Medford | Somerville

Assessment participants discussed the regional nature of transportation, which can limit localized decision-making but also create opportunities for collaboration and advocacy Participants also emphasized that transportation development must consider climate impacts, and pay particular attention to inequities in exposure to air pollution and noise that could result from expansions of roads or public transportation options.

64
Data Point | Results from the Community Wellbeing Survey reflect equity concerns regarding transportation By municipality, similar proportions of respondents selected “better access to public transportation” as a priority. However, disparities emerged after stratifying the results by age group, immigrant group, ethnicity, and racial group. 39% of participants ages 17 24 years selected this priority a larger proportion than any other age group. Established immigrants were more likely (35%) to select this priority than newer immigrants (28%) or non-immigrants (27%). By ethnicity, 49% of Chinese participants and 43% of Haitian participants selected this priority a greater proportion than any other ethnicity group. By racial group, 47% of Asian participants and 34% of Black participants selected this priority
 Data Source: CHA Community Wellbeing Survey 2021
65
Data Point | The patterns shift when analyzing respondents who selected “better roads” as a priority for improvement Based on qualitative responses to the survey, some of the feedback on better roads reflected drivers and car owners’ concerns, whereas other feedback reflected cyclists and pedestrians’ concerns with road safety and accidents.

Data Source: CHA Community Wellbeing Survey 2021
Notes: For analysis by demographic variables, survey participants from Everett, Malden, Medford, and Somerville are combined to ensure an adequate sample size Newer immigrant is defined as having lived in the US for 6 years or fewer Established immigrant is defined as having lived in the US for more than 6 years Survey participants could select more than one racial group and more than one ethnicity to describe their identity. For racial group abbreviations, AIAN or NHPI indicates American Indian or Alaska Native, combined with Native Hawaiian or Pacific Islander Hispanic or Latino was a selection for racial group For ethnicity abbreviations, Afr American indicates participants who selected their ethnicity as African American Salv Guat Hond indicates participants who selected their ethnicity as Salvadoran, Guatemalan, or Honduran Results based on smaller sample sizes (n < 30) should be interpreted with particular caution.
66
According to the MITLiving Wage Calculator,42 a household with 2 employed adults and 2 children in Middlesex County typically spends $11,565 per year on transportation In order for this to be affordable, alongside other typical expenses, each adult would need to earn an hourly wage of $32 46 more than double the current minimum wage of $14 25
For lower-income residents, lack of affordable transportation options can have consequences for many areas of health and wellbeing Assessment participants described examples of the intersection of transportation and food security: when affordable grocery stores are not located nearby, the cost of transportation can limit a household’s ability to purchase nutritious food and groceries, which increases the risk of food insecurity.

Transportation barriers are a common reason why people in our communities are unable to access needed healthcare.
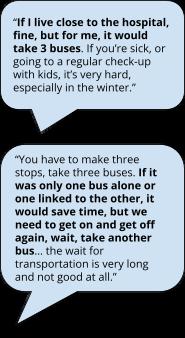
Among participants in the Community Wellbeing Survey who were unable to access various types of health care,43 lack of transportation was among the most common barriers cited It was among the top 3 barriers for reproductive health care (27 8%), emergency care for a mental health crisis (37.3%), mental health care (20 4%), and treatment for substance use disorders (27 8%) Transportation was a less common barrier for dental care (11 3%) and vision care (12 6%) Lack of transportation may therefore contribute to missed appointments, delayed care, and adverse
42 GlasmeierA.K. (2022). Living Wage Calculation for Middlesex County, Massachusetts. Massachusetts Institute of Technology https://livingwage.mit.edu/counties/25017
43 For more results on barriers to healthcare access from the CHACommunity Wellbeing Survey, see the Information, Access, and Navigation section of this report.
The financial and time costs of transportation can make it difficult to access services and opportunities, particularly for families and lower-income residents.
67
health outcomes, with particular concern for reproductive health, mental health, and substance use disorders.
Focus group and interview participants described how challenging it can be for residents who must travel long distances or transfer between multiple bus or subway lines to get to health care sites that provide specialty care, or to services that are culturally and linguistically appropriate
Community Voices Ideas for Addressing Transportation Concerns
● Offer free transportation to grocery stores. Shuttles or other transportation options could be arranged a few times a week from particular locations, with attention to accessibility for older adults, persons with disabilities, and families with children
● Prioritize transportation improvements based on where the people who rely on public transportation need to get to. Where people live and work may cross multiple cities, emphasizing the importance of regional planning. Where people go for grocery shopping, health care, childcare, and school should also be considered regionally. Adding bus lines, increasing the frequency of key routes, and expanding service hours should be done with an equity lens.
● Improve public transportation access to health care services. The time required to travel to health care services is a barrier to care, particularly when it is necessary to transfer between lines that may have varying schedules and frequency.
● Maintain roads and bike routes to ensure safety for everyone. As motorists, pedestrians, cyclists, and people who use mobility devices share roads, trails, and sidewalks, maintaining and improving infrastructure oriented toward safety and accident prevention is increasingly important
68
Economic, Education, and Resource Environment | EQUITABLE OPPORTUNITY

The Economic, Education, and Resource Environment includes the opportunities that enable communities to grow and thrive. It includes the quality and availability of affordable housing, jobs, opportunities to build wealth and contribute to sustainable local economies, the quality of schools and adult education opportunities, and the accessibility of essential services.

69
Affordable and Quality Housing
Key Takeaway
The limited availability and affordability of quality, safe housing is a significant barrier to community health and wellbeing Housing concerns are rooted in structural issues, such as the history of racial residential segregation, discriminatory housing policies, and the financialization of real estate (i.e. the treatment of housing primarily as a financial asset rather than a human right; an example being the acquisition of housing by financial firms to generate profit) The needs of people most impacted by housing instability must be centered in developing and advocating for policies that promote and protect housing security
Housing is a health equity issue.

Our housing affects our health in multiple, interconnected ways.

Rising costs of housing in our communities disproportionately impact renters, seniors, lower-income families, immigrants, people with disabilities, and people of color.
Participants in the Community Wellbeing Survey consistently reported that it is a top priority to make housing more affordable
Across cities, age groups, ethnic backgrounds, and racial groups, affordable housing was the most commonly selected issue for improvement. However, the housing crisis does not impact all groups equally and is highlighted as a key equity concern
70
One indicator of the housing crisis facing our communities is the percentage of households that spend high proportions of their income on housing costs This is especially true for those on fixed incomes or with structurally limited employment options, such as older adults and persons with disabilities, as well as young people, students, and others who are entering the workforce.The U.S. Department of Housing and Urban Development (HUD) uses a benchmark that defines housing as “affordable” if it costs no more than 30% of household income Spending more than 30% but less than 50% is considered a housing cost burden; spending 50% or more is considered a severe housing cost burden
Data Point | In all four communities and in Massachusetts overall, renter households are more likely to be severely cost burdened compared to owner households. At the state level and in Malden and Somerville, renter households are also more likely to be cost burdened compared to owner households
In both Everett and Malden, more than half of all renter households are housing cost burdened or severely housing cost burdened a higher percentage than the overall Massachusetts average. One in four renter households spends between 30 and 49% of their income on housing, and another one in four (slightly more in Everett) spends 50% or more of their income on housing In both Medford and Somerville, the overall percentage of renter households that are cost burdened or severely cost burdened is lower than the state average.

While the housing cost burden is important to understand at the city level, it does not tell us the whole story. When we dig deeper, there are patterns of unequal distribution within our communities
 Data Source: US Census Bureau, American Community Survey 2015 2019 5 Year Estimates, Table B25070
71
Data Mapping | Across CHA’s primary service area, the burden of unaffordable housing varies by neighborhood For each Census tract in this map, darker colors indicate a greater proportion of renter households are severely cost burdened. Lighter colors indicate a smaller proportion of renter households are severely cost burdened.
 https://bit.ly/CHA-Community-Health-Tableau-Public

Data Point | Within each community, lower income households are disproportionately likely to pay 50% or more of their income toward housing. Even middle-income households are highly likely to pay at least 30% of their income toward housing.

72
Notably, even though a smaller proportion of renter households in Medford and Somerville overall experience a housing cost burden, the proportions of low income and middle income households who are housing cost burdened or severely housing cost burdened are nearly as large and sometimes larger as among households of the same income levels in Everett and Malden.

There is not enough safe, affordable housing for those who need it.
In Massachusetts, the Subsidized Housing Inventory (SHI) measures a community's stock of low- or moderate-income housing for purposes of Chapter 40B, the Comprehensive Permit Law. Housing that qualifies for inclusion on the SHI must be restricted to households earning less than 80% of area median income (AMI), who must pay no more than 30% of their monthly income toward housing costs.44 The SHI does not include unsubsidized rental housing that happens to be relatively affordable Such low cost rental units on the private market may come with quality and safety concerns, such as lack of maintenance and risk of displacement 45
44 Massachusetts Department of Housing & Community Development. (2014, December). Guidelines, G.L. C.40B Comprehensive Permit Projects and Subsidized Housing Inventory https://www.mass.gov/service-details/ comprehensive-permit-information
45 For more information, see King, S. (2017). Thoughts on the Unnatural Occurrence of Cheap Housing. Shelterforce. https://shelterforce.org/2017/04/25/thoughts-unnatural-occurrence-cheap-housing/
Data Source: US
Census Bureau,
American Community Survey 2015 2019 5 Year
Estimates,
Table B25070
73
Data Point | How has the quantity of housing units defined as “affordable” in each community changed over time from 2011 to 2020? In the charts that follow, the height of each bar reflects the proportion of total housing defined as affordable for a given year. The value displayed on each bar is the actual number of housing units defined as affordable.

In Everett, the proportion of all housing units defined as “affordable” under Chapter 40B declined from 7.8% in 2011 to 5 2% in 2020, representing a 33% decline in the actual number of affordable units (from 1,304 to 875 units). In Malden, the affordable housing stock declined slightly during this nine year period, remaining around 10% of all housing units (just over 2,500 units)
In Medford and Somerville, the affordable housing stock increased by less than half a percentage point from 2011 to 2020, representing only a 4 5% increase in the actual number of affordable units As of 2020, 7 2% of all housing in Medford (1,719 units) and 9 7% of all housing in Somerville (3,250 units) was defined as affordable.
Interview participants emphasized that the SHI's definition of “affordable” still underestimates the housing crisis.The U.S. Department of Housing and Urban Development (HUD) designates regions called HUD Metro Fair Market Rent (FMR)Areas, or HMFAs, to calculateAMI for different parts of the United States In the Boston Cambridge Quincy HMFA, in which all CHA communities fall,AMI for a 4-person household was $120,800 in 2021.This is among the highestAMI of any area in Massachusetts, obscuring the fact that thousands of people in our communities live near or below the federal poverty guideline a reality only possible given wide income inequality. With this highAMI, the 80% threshold for defining affordable housing would be $101,050 for a 4 person household 46
46 MassHousing. 2021 Income & Rent Limits for 19 Massachusetts Income Limit Areas. Available at https://masshousing.com/developers/developer-library
74
When “affordable” for a 4 person household is set based on a household income of $101,050, families with incomes near the federal poverty guideline just $26,500 for a 4 person household in 202147 are less likely to find housing that is truly affordable for them Subsidy and voucher programs exist for households with extremely low incomes, defined as 30%AMI, but supply is limited. Furthermore, 30%AMI for a 4 person household was $40,250 in 2021 still far higher than the federal poverty level at which thousands of people in our communities live Assessment participants discussed other notable barriers and limitations related to the supply of safe, affordable housing:

Data Point | Among participants in the Community Wellbeing Survey, between 31% (in Malden) and 49% (in Somerville) reported it is not at all true that housing in their community is affordable. Residents of Everett and Somerville were less likely than residents of Malden and Medford to report that safe, good quality housing was reliably accessible.
Data Source: CHA Community Wellbeing Survey 2021.
Services, Office of
Assistant Secretary
Planning
Evaluation. (n.d.)
https://aspe.hhs.gov/topics/poverty-economic-mobility/poverty-guidelines/

47 US Department of Health & Human
the
for
and
2021 Poverty Guidelines
75
Cross-sector coalitions and municipal and community efforts to advance progressive housing policies such as rent stabilization, the Tenant Opportunity to PurchaseAct at the state level, and inclusionary zoning at the local level were emphasized as strengths in several communities. Still, the power imbalance between communities that have been historically marginalized and those who hold political, financial, and social capital influences how public policies and private investments shape the housing landscape.

More supportive services are needed to help people facing eviction and housing instability, in addition to more shelters and temporary housing for people experiencing homelessness.
Despite the challenges, interview and focus group participants noted heightened support for preventing displacement during COVID, including state and local eviction moratoriums, expanded access to legal help, and rental assistance. While evictions have returned to pre pandemic levels in some communities, the combination of policies worked to reduce evictions during a critical time in the ongoing public health emergency Assessment participants emphasized that state and local policy, individual advising and advocacy, and financial assistance are all essential ingredients Focus group participants shared experiences that exemplify why these efforts are critical: being told by a landlord that they need to leave, or being served with a NoticeTo Quit or Summons and Complaint, can be an overwhelming stressor and make renters feel they have no option but to move.Access to legal help to understand their rights as tenants, connection to financial resources, and mental health support can all help to prevent displacement.

The development of affordable housing options and the ability to advocate for fair and safe living conditions are directly connected to power and structural inequity.
76
Data Point | From October 2020, when the statewide COVID era eviction moratorium ended, through 2021, rates of evictions varied by community and in comparison to the Massachusetts average. In these charts, we used data from the state’s Eviction Diversion Initiative to calculate the rate of eviction filings and executions per 1,000 renter households in each community (shown as a solid color bar) and for the state as a whole (shown as a gray bar) We grouped the data into three month periods or quarters
Eviction filings by quarter (October 2020 December 2021)
Eviction executions by quarter (October 2020 December 2021)

Data Source: Massachusetts Trial Court, Department of Research & Planning: Summary Process Executions Issued, Summary Process Tableau Dashboards; US Census Bureau, American Community Survey 2015 2019 5 Year Estimates, Table B25070

Notes: *For eviction executions, 2020 Q4 data begin on October 19, 2020, following the end of the statewide moratorium. For eviction filings, 2020 Q4 data include the full month, beginning October 1, 2020, since eviction filings could still occur during the moratorium For both sets of charts, Q1 refers to January March; Q2 refers to April June; Q3 refers to July September; and Q4 refers to October December Gray bars refer to the Massachusetts average rate

77
In addition to the statewide moratorium that ended in October 2020, Malden and Somerville had local eviction moratoriums in place through the end of 2021 (and beyond)48 to prevent residents from being removed from their homes All four communities invested in resources to prevent displacement. In Everett, eviction filings declined over the course of the pandemic. Eviction executions increased in mid 2021 and declined in the last quarter of the year. In Malden, eviction filings declined in early 2021, and have remained stable since then Eviction executions increased in the last half of 2021. In Medford and Somerville, rates of eviction filings and executions have been lower than in Everett and Malden throughout the pandemic, but began to rise in Medford inApril June 2021 Across all four communities, eviction rates have been lower than the Massachusetts average throughout the pandemic. Somerville’s previously-established Office of Housing Stability was noted by several interview participants as a key to consistently low rates of eviction filings and executions in the city
For unsheltered residents, additional and complementary resources are needed Participants in the assessment noted a critical gap in the availability of shelter beds, shelter space, and temporary housing designed for the realities of people experiencing homelessness as critical steps in the pathway to permanent stable housing Barriers also included an absence of day centers where unsheltered residents can meet with social workers and clinicians; have safe spaces to store belongings, safely store medications, and rest; and have space and equipment like phones and computers to address personal business
Community Voices Ideas for Addressing Housing Concerns
● Develop accessible down payment assistance programs to help low-income residents access home ownership. At the same time, acknowledge the limitations of home ownership as a wealth building strategy. Under current affordable homeownership programs, homeowners are only able to build equity at a fixed rate, below inflation Tying wealth and economic stability to home ownership is not a complete solution.
● Ensure that tenants have access to legal counsel and other supportive services. Rental assistance is important, but tenants may need legal advocacy, financial education or products, employment search assistance, or connections to health care or social service resources to promote long term housing stability
● Continue to explore municipal policy interventions like zoning and new revenue sources to facilitate the creation of more affordable housing.
● Train healthcare providers about connecting patients to housing navigation resources. The healthcare system is an entry point for people facing housing insecurity.
● Support the creation of day centers, medical respites, and human-centered spaces for people experiencing homelessness and substance use disorders.
48
Malden’s eviction moratorium ended in February 2022. Somerville’s eviction moratorium ended in June 2022.
78
Spotlight on: Childhood Lead Poisoning
Exposure to lead during childhood can cause severe and permanent harm to physical and mental development, even at low levels In Massachusetts, lead paint accounts for nearly 90% of all lead poisoning cases among children, as almost 70% of housing units in the Commonwealth were built before 1978 when lead based paint was banned 49 Elevated blood lead levels (BLLs) and lead poisoning are a concerning health equity issue in our state The most recent Childhood Lead Poisoning Surveillance Report50 found that children living in low income communities are nearly 4 times more likely to have elevated BLLs than children in high income communities Black children are nearly 2 times more likely to have lead poisoning than White children, with multi racial children having 3 times the risk compared to White children
Each year the Massachusetts Department of Public Health identifies communities with a higher risk of childhood lead poisoning. Everett and Malden are defined as high risk, but other CHAcommunities are not without risk While the disparity in the prevalence of childhood lead poisoning between high-risk communities and all other communities had been narrowing steadily since 2016, the COVID 19 pandemic reversed the trend. In high risk communities statewide, the prevalence of lead poisoning increased from 4 per 1,000 in 2019 to 5.2 per 1,000 in 2020. In contrast, in all other communities statewide, the prevalence of lead poisoning decreased from 2 per 1,000 in 2019 to 1.8 per 1,000 in 2020.51
The Massachusetts Lead Poisoning Prevention and Control Regulation (also called the Lead Law) requires all children to be screened periodically for lead exposure through the ages of 3 or 4, in order to connect children with medical care and families with resources to remove lead from their home environment. Screening rates plummeted during the first wave of the pandemic in March May 2020, resulting in 15% fewer children screened statewide in 2020 compared to 2019 52
Department of Public Health. (2021). 2020 Annual Childhood Lead Poisoning Surveillance Report. https://www.mass.gov/doc/2020-annual-childhood-lead-poisoning-surveillance-report/download

52 Ibid. 51 Ibid. 50 Ibid. 49 Massachusetts
79
Data Point | While rates of elevated blood lead levels (BLL) have declined in all communities since 2012, rates increased from 2019 to 2020 in Everett (by 68%), Medford (by 37%), and Somerville (by 7%). The rate continued to decline in Malden (by 18%). These charts display the prevalence of elevated BLL from 2012 to 2020 in each community (shown as a solid line), alongside the Massachusetts state average (shown as a dotted line).


Data Source: Childhood Lead Poisoning Prevention Program (CLPPP), Massachusetts Environmental Public Health Tracking (MEPHT), 2012 2020.
Notes: Rates are calculated per 1,000 children between the ages of 9 months and four years old, among those who had their blood screened for lead exposure
Data Point | Rates of childhood lead poisoning have varied since 2012 in all of our communities. In 2020, rates of childhood lead poisoning in all of our communities were equal to or higher than the state average (2.9 per 1,000). However, rates remained lower than the average for “high risk” communities (5.2 per 1,000). These charts display the prevalence of lead poisoning from 2012 to 2020 in each community (shown as a solid line), compared to the Massachusetts average (shown as a dotted line).
Data Source: Childhood Lead Poisoning Prevention Program (CLPPP), Massachusetts Environmental Public Health Tracking (MEPHT), 2012 2020
Notes: Rates are calculated per 1,000 children between the ages of 9 months and four years old, among those who had their blood screened for lead exposure
80
Data Point | After maintaining lead screening rates near or above 75% since 2012, screening declined from 2019 to 2020 in all of our communities The decline resulted in 19% fewer children screened in Everett; 15% fewer children screened in Malden; 18% fewer children screened in Medford, and 21% fewer children screened in Somerville. These charts display screening rates from 2012 to 2020 in each community.

Data Source: Childhood Lead Poisoning Prevention Program (CLPPP), Massachusetts Environmental Public Health Tracking (MEPHT), 2012 2020; Massachusetts Department of Public Health, 2020 Annual Childhood Lead Poisoning Surveillance Report
Notes: Rates are calculated as a percentage of all children between the ages of 9 months and four years old For 2020 screening rates, values reported in the 2020 Annual Childhood Lead Poisoning Surveillance Report were used in case of any discrepancy with the MEPHT database
81
Poverty, Income, and Employment
Key takeaway
Poverty and income inequality continue to burden members of our community, exacerbated by the economic consequence of the COVID 19 pandemic In most of our communities, the proportion of residents living below the federal poverty level is higher relative to the Massachusetts statewide average. Further, residents of color are more likely than White residents to live below the federal poverty level Over time, the proportion of residents living below poverty has declined slightly or stayed the same, even as median family and household income has increased, suggesting the gap between low income and high income households has widened Good jobs with living wages, benefits, and safe working conditions are not equitably accessible within or between communities. Structural barriers to economic mobility and intergenerational wealth creation are significant concerns for health and wellbeing
Money and jobs are health equity issues.
Economic security impacts our health in many important ways Assessment participants emphasized many community health concerns that can be fundamentally traced to a lack of income and economic stability.
Participants in the assessment discussed how well-paying, meaningful jobs are connected to mental health For many people, a good job provides a sense of purpose, of being able to contribute to the community and economy as well as one’s own family Conversely, a lack of employment is connected to depression and anxiety not only due to financial stress but to a loss of sense of purpose For example, the most common healthcare provider referrals to the Somerville Community Corporation’s workforce training and job search services are from mental health therapists.

82
Poverty, income, and employment have changed in our communities over time and in complex ways, exacerbated by the COVID-19 pandemic.


When considering poverty and income at the community level, it is important to keep in mind that people move in and out of communities Increasing median household income does not necessarily mean that the people living in that community earn more income over time. It could mean that families with lower incomes are moving out of the community, and families with higher incomes are moving in This is why we look to multiple indicators in order to understand the picture of economic stability and mobility in communities.
Data Point | In Everett, Malden, and Somerville, poverty rates are higher than the Massachusetts state average for the overall population, children, families, and older adults
The percentage of residents living below the federal poverty level declined slightly from 2015 to 2019 in Everett, Medford, and Somerville, and stayed the same in Malden Within each of our communities, poverty rates tend to be higher among children, compared to families or older adults. Poverty among older adults in Malden is notably high.
In 2019, the federal poverty level was $25,926 for a family of 4 (with 2 adults and 2 children). The economic consequences of COVID likely increased poverty in our communities While 2020 community level data were not yet available during the assessment process, the US poverty rate increased by 1.0 percentage point to 11.4% between 2019 and 2020, with inequities along racial and ethnic group lines 53 It is important to note that these rates refer to the Official Poverty
Data Source: US Census Bureau, American Community Survey (ACS) 5 Year
Estimates
(intervals ending 2015, 2017, and 2019)
53 US Census Bureau, Income and Poverty in the United States: 2020. https://www.census.gov/library/publications/2021/demo/p60-273.html 83
Measure An alternative measure of poverty called the Supplemental Poverty Measure (SPM) shows a decline in poverty in 2020.54 This is because the SPM accounted for COVID related economic stimulus payments and expanded unemployment insurance benefits, which provided essential, though temporary, financial support to families.
Data Point | In each of our communities, residents of color are more likely than White residents to live below the federal poverty level. Poverty rates are highest among Hispanic or Latino residents in Everett and Malden, Asian residents in Medford, and Black or African American residents in Somerville. Across all of our communities, the highest rates of poverty are among Black residents in Somerville
Data Source: US Census Bureau, American Community Survey (ACS) 2015 2019 5 Year Estimates
Notes: Individuals who identify with other racial/ethnic groups besides Asian, Black, or White are not included in this chart due to small numbers

Data Point | Median family income increased from 2015 to 2019 in all of our communities In Everett and Malden, median income was still more than 25% below the state median. As poverty rates remain high, especially in Everett, Malden, and Somerville, this may reflect growing income inequality. In addition, disparities in median family income exist along the lines of race and ethnicity in our communities and in the state of Massachusetts overall.
54 US Census Bureau,The Supplemental Poverty Measure: 2020. https://www.census.gov/library/publications/2021/demo/p60-275.html

84
In Malden, the disparity in median family income between Black, Latino, orAsian families, compared to White families, has remained or even widened in the last several years. In Medford and Somerville, the disparity between Black or Latino families, compared toAsian or White families, has also remained or widened. In Everett, median income has trended up for all groups assessed exceptAsian families As of 2019, median family income among Black and Latino families is higher than among White andAsian families in Everett
It is important to note that family income differs from household income, and patterns could vary depending on the racial/ethnic distribution of non family households in each community The Census Bureau defines “family” as two or more people related by birth, marriage, or adoption who share the same housing unit, whereas “household” is defined as people who occupy a housing unit regardless of relationship In general, median family income tends to be higher than median household income, since non family households tend to be single persons, older adults living alone, or lower income persons or young people living as roommates.

It is also important to note that these racial and ethnic group categories are broad and obscure differences within groups These categories also do not include people ofAmerican Indian or Alaska Native ancestry nor Native Hawaiian or Pacific Islander ancestry, who make up small but important proportions of our communities.
 Data Source: US Census Bureau, American Community Survey (ACS) 5 Year Estimates (intervals ending 2015, 2017, and 2019)
85
Data Point | In our communities, there are differences in which industries those who live here work in (regardless of where those workers commute to), and which industries employ workers locally (regardless of where those workers commute from).
Among workers who live in each community, industry distributions are similar, with Health Care and SocialAssistance;Accommodations and Food Services; Professional and Scientific Services; and RetailTrade among the top 5 industries This reflects that workers who live in our communities are part of a regionalized job market.

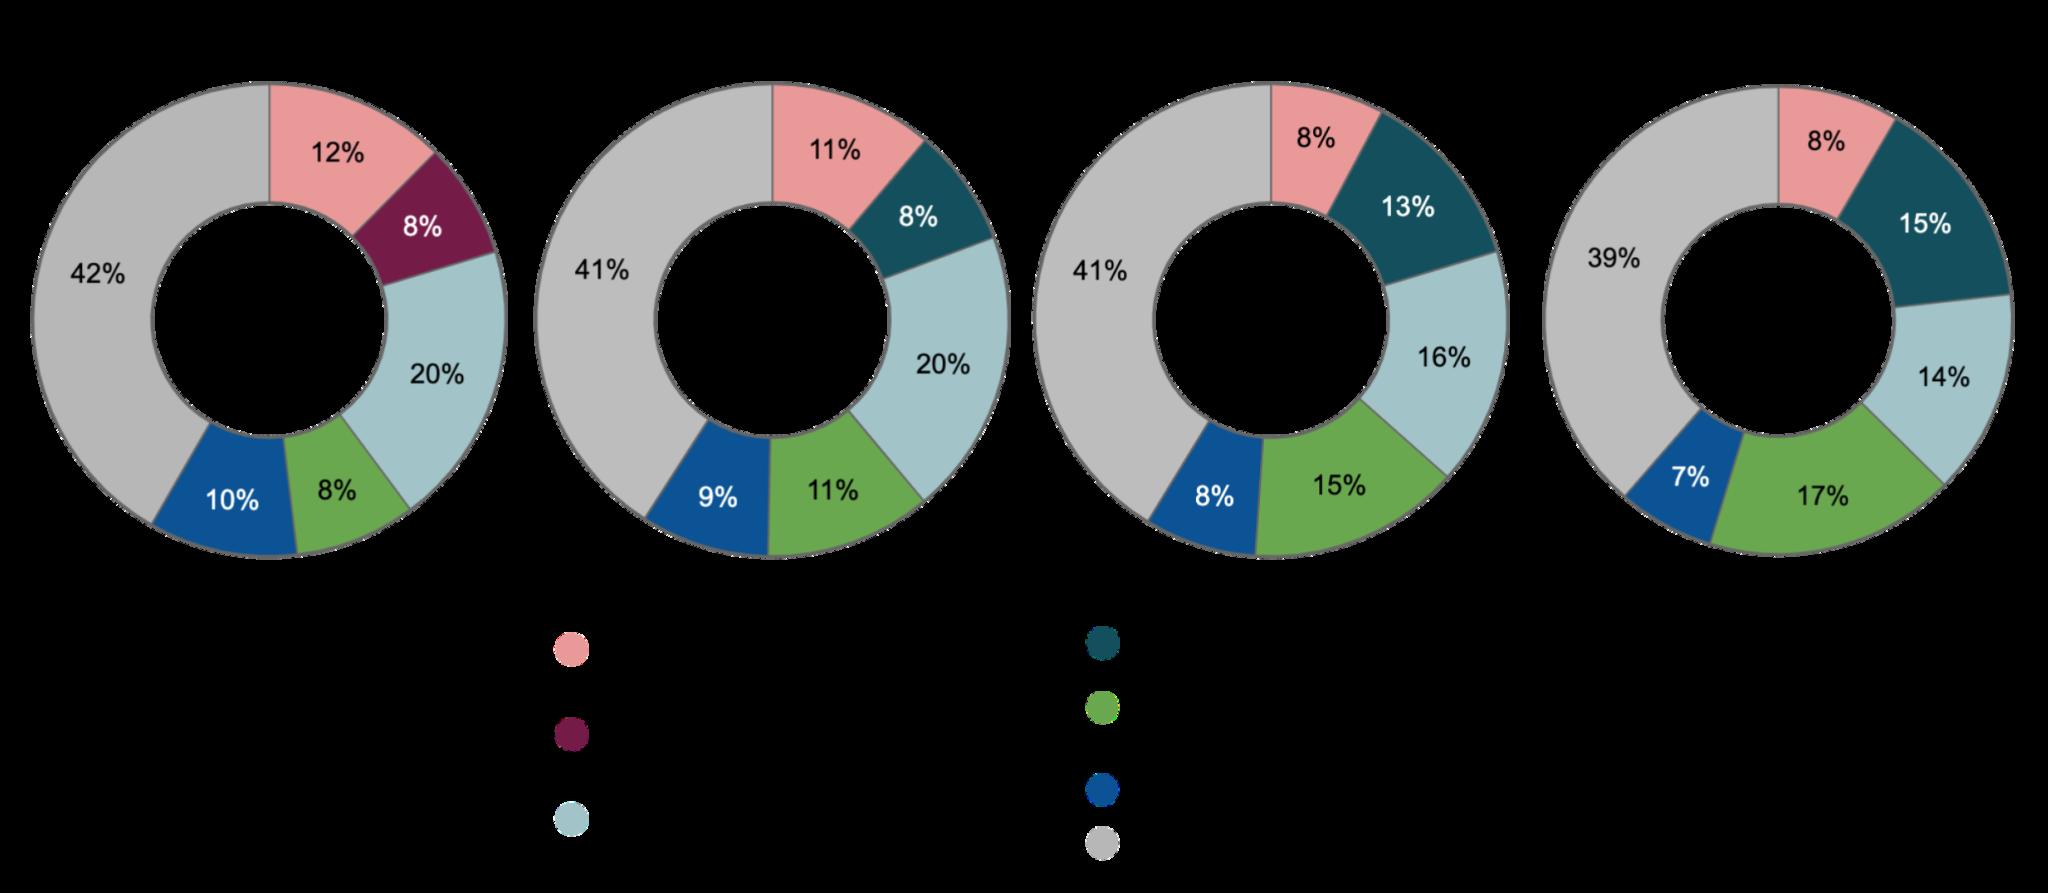
Among workers who are employed in each community, the top 5 industries in all communities include Health Care and SocialAssistance, and RetailTrade. However, there is variation in other industries that offer jobs in each community
Data Source: US Census Bureau, Longitudinal Employer Household Dynamics (LEHD) Origin Destination Employment Statistics, 2019
86
The industry distribution shapes the wage distribution, providing insight into who can afford to live in each community.

Data Source: US Census Bureau, Longitudinal Employer Household Dynamics (LEHD) Origin Destination Employment Statistics, 2019.
Low wage jobs are more prevalent among workers who are employed in Malden, Medford or Somerville compared to workers who live in these same communities This suggests that many jobs available in Malden, Medford and Somerville may not pay enough for workers to afford to live there In contrast, Everett has a reverse pattern: low wage jobs are more prevalent among workers who live in Everett, compared to workers who are employed in Everett This suggests the community may be more affordable for workers employed locally however, it may also suggest risk of displacement for the low wage workers who currently live there These trends are based on 2019 data and do not reflect major workforce environment changes in the last few years, such as the opening of the casino.
The COVID-19 pandemic drastically impacted workers. Before the pandemic, unemployment rates in all four communities had been lower than the state average of 4% From March toApril 2020, unemployment increased to 18 6% in Everett and 20 5% in Malden, higher than the state average, and continued to exceed the state average until late 2021. Unemployment increased in Medford and Somerville as well, though remained below the state average
87
Data Source: Massachusetts Department of Unemployment Assistance, Economic Research Department, Local Area Unemployment Statistics (LAUS), 2019 2021
As of December 2021, unemployment was still 70% higher in Everett; 63% higher in Malden; 39% higher in Medford; and 44% higher in Somerville, compared to their respective rates in February 2020 One of the reasons for these trends is that theAccommodations and Food Services, Health Care and SocialAssistance, and RetailTrade industries were hit especially hard by job loss in Massachusetts, according to data from the US Census Bureau’s Current Employment Statistics 55 These industries are among the top 5 that employ residents in our communities.Another reason is that workers in low-wage jobs were especially impacted by job loss, and there are inequalities in the distribution of low wage jobs between our communities
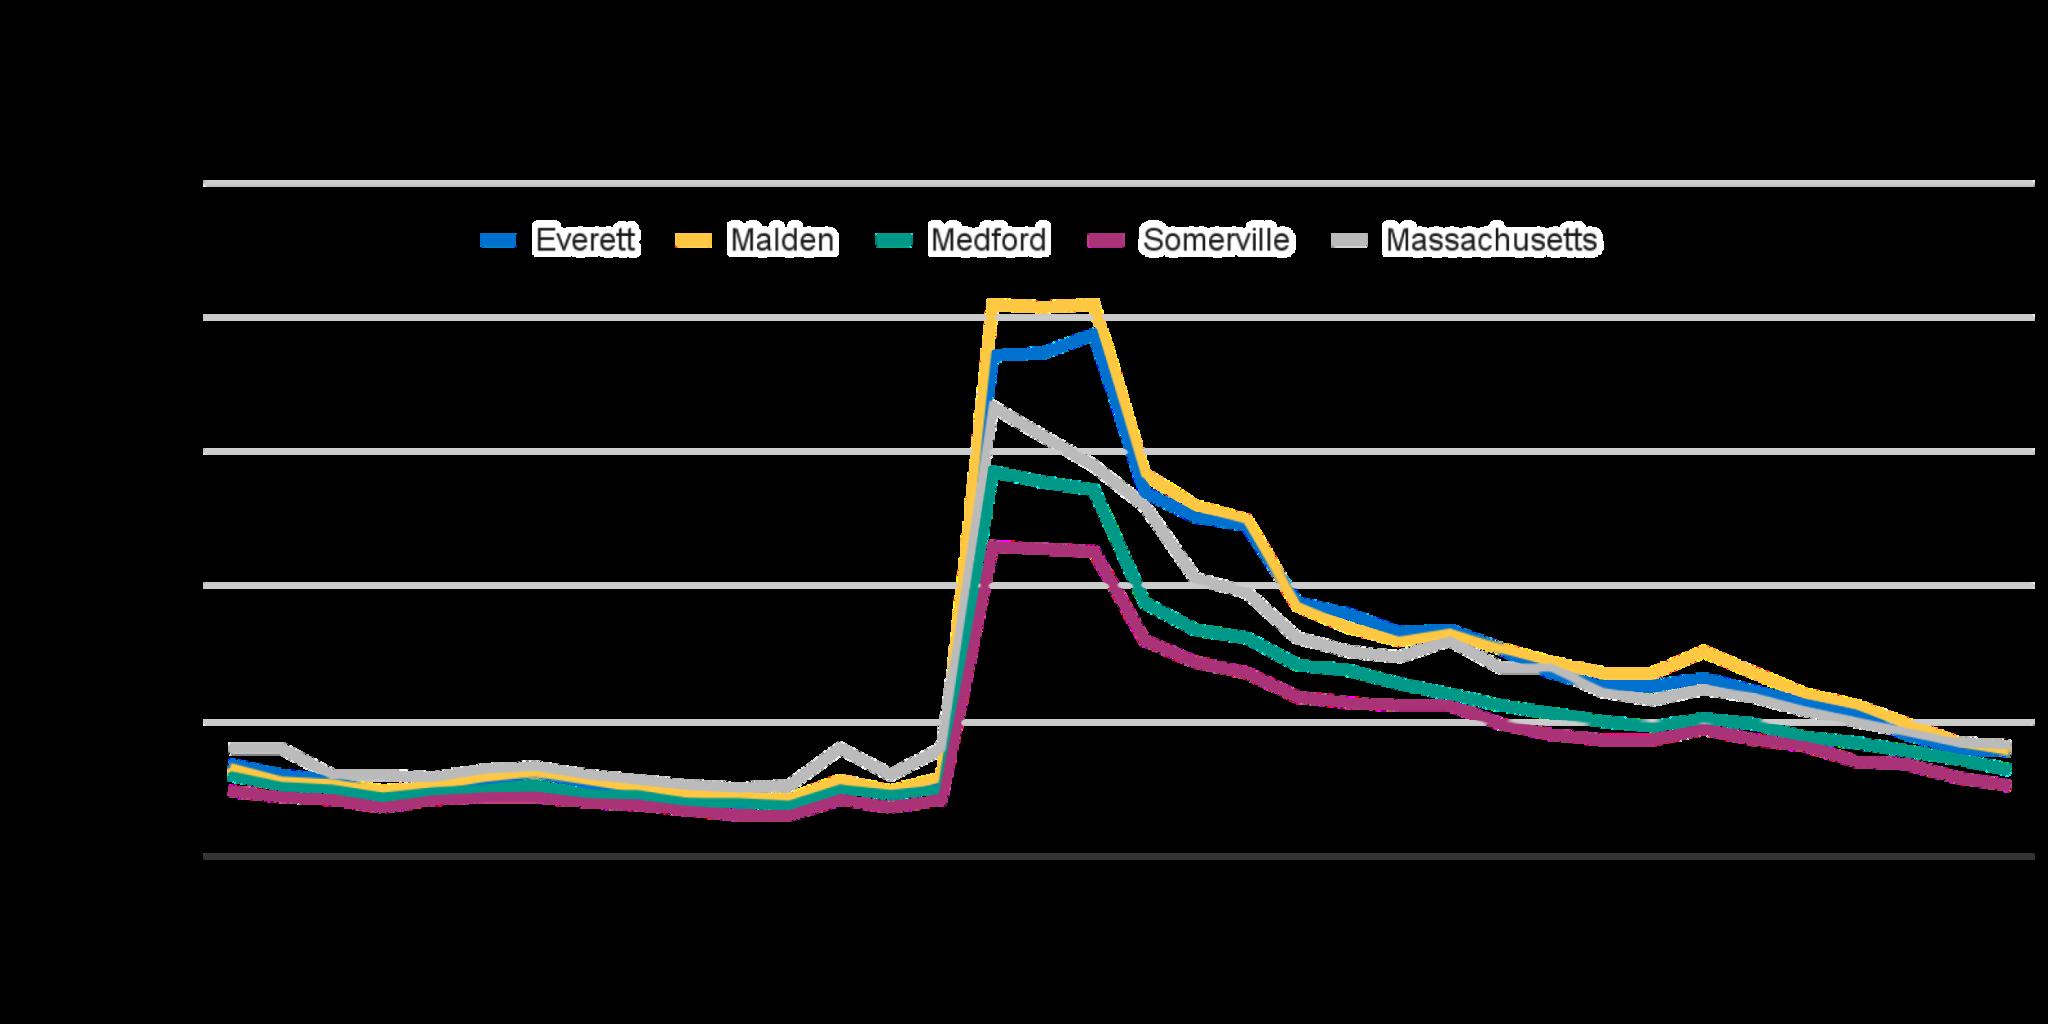
Structural racism manifests in the inequitable distribution of income, wealth, and resources.
Employers hold the power in sectors of the economy that many immigrants and people without socioeconomic privileges are restricted to.This makes options for stable, safe jobs with living wages, health insurance, paid leave, and other essential benefits inaccessible Jobs such as house cleaning, food services, and manual labor are disproportionately held by people of color, reflecting persistent structural racism in the US economic system.

Access to investment opportunities, like homeownership and business ownership, are similarly shaped by structural racism.
55 To explore more data about employment and workforce in our communities, visit the CHACommunity Health Tableau Public page: https://bit.ly/CHA-Community-Health-Tableau-Public
88
Data Point | Among participants in the Community Wellbeing Survey, residents of Everett were most likely to report it is not at all true that good local jobs with living wages and benefits are accessible. Residents of Somerville were most likely to report it is not at all true that home ownership and business ownership opportunities are accessible.

Patterns in perceptions of access to good jobs, homeownership, and business ownership opportunities varied between newer immigrants, established immigrants, and non immigrants

89
Hispanic or Latino participants were more likely than other groups to report it is not at all true that good local jobs with living wages and benefits are accessible Black and Hispanic or Latino participants were more likely than other groups to report it is not at all true that home ownership and business ownership opportunities are accessible.
Data Source: CHA Community Wellbeing Survey 2021

Notes: For analysis by demographic variables, survey participants from four communities (Everett, Malden, Medford, and Somerville) are combined to ensure an adequate sample size. Survey participants could select more than one racial group to describe their identity AIAN or NHPI indicates American Indian or Alaska Native, combined with Native Hawaiian or Pacific Islander Hispanic or Latino was offered as a selection for racial group Newer immigrant is defined as having lived in the US for 6 years or fewer Established immigrant is defined as having lived in the US for more than 6 years
Community Voices: Ideas for Addressing Income and Wealth Inequality, and Creating Better Jobs
● Ensure workers’rights and income equality. Provide training about workers’rights and labor organizing Investigate pay discrimination, promote salary transparency, and promote pay equity audits to address disparities by race, ethnicity, and gender.
● Expand scholarship opportunities for young people to pursue higher education. At the same time, expand opportunities for adult education, including training to advance or pursue new career opportunities Account for ways in which cultural and gender norms may stigmatize pursuing further education.As important as it is to lift wages and expand benefits in jobs that are disproportionately held by people of color and people without socioeconomic privileges, it is also important to ensure that adults who want to pursue new careers have the opportunity to do so
90
● Create new jobs that are culturally relevant and capitalize on the expertise and knowledge of diverse communities.The World Farmers Program at Groundwork Somerville provides one example
● Invest in community wealth-building alternatives. Municipalities can look to innovative models for progressive tax revenue reinvestment in real estate and business development that benefit communities that have been historically excluded from wealth building opportunities Acknowledge that there is a level of equity that can only be achieved through policy change, not programming alone.
● Invest in supporting community-based systems that respond to economic priorities. For example, the lack of affordable childcare and the underpayment of workers leads to scarcity in available slots and times available for people who work outside of “9-5” hours. Communities create systems for watching each others’kids in response These community based systems could be offered resources to help realize their own visions: for example, to formalize as a co op and ensure safety measures
● Lower barriers to connecting people to income-maximizing benefits for which they are eligible, such as SNAP, WIC, and EITC. Tailor outreach to new immigrants and new parents especially, who may not be connected into existing systems
● Channel resources to minority and women-owned businesses This includes increasing awareness of financing options designed for small business owners.
91
Spotlight on: Immigrants and Workers Rights
Across our communities, assessment participants emphasized concerns about inequity, discrimination, and violence directed toward immigrants Immigration in the US is deeply tied with labor and workers’rights, as well as education, housing, and healthcare.The precarity facing undocumented immigrants is especially severe
Data Point | Participants in the Community Wellbeing Survey were asked to identify the most important things to improve in their community. Better access to good jobs was among the top 5 priorities for improvement for established immigrants (34%) and newer immigrants (43%), but not for non immigrants
Data Source: CHA Community Wellbeing Survey 2021
Notes: Survey participants could select more than one priority, so proportions will not add to 100%. Established immigrant is defined as having lived in the US for more than 6 years Newer immigrant is defined as having lived in the US for 6 years or fewer Survey participants from four communities (Everett, Malden, Medford, and Somerville) are combined to ensure an adequate sample size
The Community Wellbeing Survey results reflect the priorities of immigrants in other areas besides jobs as well More affordable housing was the top priority for improvement for established immigrants (60% selected this priority), newer immigrants (48%), and non immigrants (62%). Better access to public transportation was a top priority for established immigrants (35%) and newer immigrants (28%), in contrast to better roads being a top priority for non-immigrants (42%). Better access to health care also appears among the top 5 priorities for immigrants, but not for non immigrants Lastly, more arts and cultural events appear among the top 5 priorities for newer immigrants only
Assessment participants emphasized that federal immigration laws and labor policies shape workforce opportunities and protections Abuse, sexual harassment, wage theft, and job loss were all described by assessment participants as particular concerns for immigrant workers.

92
For immigrant workers, the chilling effect of the Public Charge rule remains a barrier to accessing social programs People fear providing personal information to determine if they are eligible for certain benefits, never mind participating in benefits if they qualify, out of concern that it will jeopardize their safety or immigration cases.
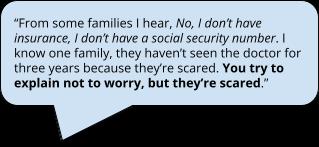


Assessment participants shared examples of immigrant workers being intimidated and discouraged from seeking health care for injuries or illnesses sustained on the job. Unscrupulous employers have told immigrant workers that U S Immigration and Customs Enforcement (ICE) can gain access to personal information provided to hospitals The fear of being deported or otherwise entangled in the immigration system presents a significant barrier to health care access for undocumented immigrants, including workers
The structural barriers facing immigrant workers, including undocumented immigrants, must be accounted for in developing solutions to community health concerns Participants noted the importance of considering eligibility criteria, any interfacing with police or government officials, language access and literacy, and disclosure of personal information Participants also suggested communicating changes in rules like Public Charge intentionally and with empathy for the fact that building trust in untrustworthy (historically or presently) systems can only be earned slowly
93
Caregiving and Support
Key Takeaway
Working families with children or other dependents must have reliable, affordable caregiving options Caregiving directly impacts, and is impacted by, employment and economic security Additionally, caregiving and support are intimately connected to mental health Similarly to findings in the Safety, Collective Care, and Healing section, there is more to addressing this issue than simply adding more of the same services Participants in the assessment noted a need for systems-oriented thinking around promoting community-level resilience and capacity for collective care There was agreement around the lack of systems and supports that enable people to give and receive the care they need across their life courses and circumstances Since the COVID-19 pandemic, parents, care workers, and caretakers especially women and the Hispanic or Latino community have been heavily impacted by job loss and reduced hours, adding more financial strain to existing stressors 56
Caregiving and support directly impact, and are impacted by, employment and economic security.
According to the MITLiving Wage Calculator,57 childcare in Middlesex County costs $31,333 per year on average for a working family with two children In order for this expense to be considered affordable, in a household with two working adults, each adult would need to earn $32.46 per hour more than double the Massachusetts minimum wage of $14 25 per hour
Assessment participants stated that increasing costs of food, housing, transportation, medication, and health care (even with insurance) make it extremely difficult to provide for a family with multiple children, especially with a lower income job.They discussed how economic security, living wages, and not having to make choices between paying for caregiving versus food, rent, or medicine, have important health impacts Further, it is well established that access to quality childcare has short and long-term benefits for children’s developmental outcomes and for the stability of parental employment and, ensuring high quality childcare also involves ensuring adequate workplace conditions and pay for childcare workers.58
56 Commonwealth of Massachusetts. (n.d.) CCIS Spotlight: Social Determinants of Health. https://www.mass.gov/info-details/ccis-spotlight-social-determinants-of-health
57 Massachusetts Institute of Technology. (n.d.) Living Wage Calculation for Middlesex County https://livingwage.mit.edu/counties/25017
58 Chang, D. (2020). Connecting The Dots: Improving Child Care Workers’Conditions LeadsTo Better Health, Economic Stability,And Greater Equity Health Affairs.

94
Assessment participants emphasized the challenges facing families with children For parents of children with disabilities, the lack of resources tailored particularly to their needs and priorities reflects a significant equity concern Focus group participants’stories show how providing support for families could prevent cascading consequences.
The COVID 19 pandemic exacerbated economic precarity for families with children.According to the COVID-19 Community Impact Survey (CCIS),59,60 among employed respondents who reduced their hours or took leave, nearly 1 in 3 did so at least in part to take care of children. Nearly 1 in 5 who lost their jobs cited needing to take care of children as a reason. Females were twice as likely as males, and Hispanic/Latinx respondents were almost twice as likely as White, non Hispanic/Latinx respondents to change the status or nature of their employment in order to take care of children.


In July 2020, the Massachusetts Immigrant and RefugeeAdvocacy (MIRA) Coalition conducted a community survey in partnership with member organizations to quantify the disproportionate impact of the pandemic on immigrants across Massachusetts Of the 433 respondents from immigrant households,61 76% reported at least one job loss; among households with undocumented members, it was 84%.The most frequently cited reason for job losses was a temporary closure or layoff; among households with undocumented members, the loss of informal caregiving jobs (e g , house cleaning and elder care), was the second most frequently cited reason for job loss, at 30% Another significant reason for job loss was lack of child care: 15% of households reported having to leave a job for lack of child care Overall, 70% of households with small children reported having no access to child care; 13% had child care through a facility, and 17% through
59 Commonwealth of Massachusetts. (n.d.) About the COVID Community Impact Survey (CCIS). https://www.mass.gov/info-details/about-the-covid-community-impact-survey-ccis
60 Commonwealth of Massachusetts. (n.d.) CCIS Spotlight: Social Determinants of Health. https://www.mass.gov/info-details/ccis-spotlight-social-determinants-of-health
61 Of the 433 respondent households, 37% included at least one undocumented member, and 62% included at least one U.S. citizen.
Caregivers and care workers have been among the most impacted by the COVID-19 pandemic.
95
a friend or relative 62 Working from home was not a viable solution to childcare: only 15 respondents, or 3% of all survey respondents, said they could work from home.
The Community Wellbeing Survey illustrates these equity concerns as well, with “more affordable childcare” named as one of the top 5 priorities for improvement among specific groups, including 30% of participants ages 25 44 years; 31% of participants who identified their ethnicity as Brazilian, and 32% who identified their ethnicity as Salvadoran, Guatemalan, or Honduran; 34% of participants who primarily speak Portuguese; and 37% of participants who primarily speak Spanish
Community Voices
Ideas for Improving Equitable Access to Caregiving and Support
● Develop programs for youth with disabilities across the age spectrum. Parents described the challenges of finding supportive after school programs for children and youth with disabilities. Sports, arts, clubs, and other activities that support social and emotional learning and are equitably accessible for young people with disabilities offer important support to parents and caregivers
● Channel economic resources to the unique needs of families with children, including those with disabilities. Families with children face additional and often unexpected expenses related to transportation, education, healthcare, food, and housing. Policies like the ChildTax Credit and Earned IncomeTax Credit provide examples of directing economic resources to families Expanding childcare vouchers and investing in quality childcare are important mechanisms for supporting the economic wellbeing of families.
● Invest in schools’existing Parent Information/Welcome Centers and organizations already focused on the wellbeing of parents, children, and families, such as the Somerville Family Learning Collaborative and Medford Family Network. Assessment participants emphasized the importance of building relationships and connections with other parents and adults in their children’s lives. Existing organizations offer important platforms for new parents, newcomers to the community, and caregivers in general to strengthen social connectedness and build knowledge and skills
● Invest in community-based systems of care. Caregiving is an essential service and capacity not only for children, but for older adults, persons with disabilities, and any person who needs care, whether temporarily or long term Investing in systems of care includes normalizing the use of the Family Medical LeaveAct (FMLA), advocating for strong paid leave policies, increasing pay and benefits for care workers, and supporting co op models for childcare and other caregiving structures within communities.
62 MIRA(2020). The Impact of COVID-19 on Immigrants in Massachusetts: Insights from our Community Survey https://www.miracoalition.org/wp-content/uploads/2020/08/MIRA-COVID-19-survey-report-Aug2020.pdf 96
Information,Access, and Navigation
Key Takeaway
Access to essential services, such as healthcare, schools, and municipal resources, requires more than the presence of those services In physical or virtual spaces, access includes considerations around language, disability, culture, literacy, location, hours, staffing, costs, quality, and more not only to ensure people have the information they need at the time they need it, but to ensure people feel welcome, that they belong in such spaces, and that they can be confident in the opportunities available. For systems that are complicated, navigation is essential to increase accessibility in equitable ways At the same time, simplifying complex systems is frequently cited as a more permanent solution to challenges with equity in access

Our communities experience barriers to equity in health care access.
Assessment participants emphasized the difficulties of navigating complicated health care systems. It can be overwhelming and intimidating to begin the process of identifying providers, learn what services are available, understand new financial, insurance, and medical terminology, and handle logistics while also facing illness for oneself, children, or other family members.
Health insurance coverage is an important element of access. Compared to the uninsurance rate in Massachusetts overall (2.7%), greater proportions of residents do not have health insurance in Everett (6 9%) and in Malden (4.3%). While the uninsured population is lower in Medford (2.5%) and Somerville (3 1%), disparities exist on the basis of racial/ethnic group, immigration history, educational attainment, and income
Data Source: US Census Bureau, American Community Survey (ACS) 2015 2019 5 Year Estimates

97
Assessment participants shared experiences of discrimination in health care. Particularly among immigrants and people of color, participants described a lack of language accessibility, inadequate treatment or poorer quality of care, and experiences of medical harm Many shared experiences of feeling dismissed for not speaking English fluently In addition to the fear of being misunderstood,Arabic speakers described how concerns with being placed in an uncomfortable power dynamic due to gender norms creates a barrier to prioritizing preventive care
In focus groups conducted in Spanish, Portuguese, and Haitian Creole, participants noted the critical importance of having live interpreters or providers who speak one’s language Even with translation technology and computer-assisted devices, being able to converse in one’s language about concerns as personal as health care was emphasized as a priority This was discussed from a language comprehension and cultural understanding standpoint. Even if a computer can reliably interpret the meaning of words and sentences, the cultural implications of concerns related to mental health, children’s health, reproductive health, and other areas require providers and interpreters with shared cultural knowledge and experiences.

 Data Source: US Census Bureau, American Community Survey (ACS) 2015
2019 5
Year Estimates
98
Data Point | Community Wellbeing Survey participants were asked if they needed any of the following types of healthcare in the last 12 months, and if so, whether they could access that care. In all of our communities, dental and vision care were the most common types of care needed by residents. However, there are patterns of unmet care needs.
Residents of Medford were more likely than residents of other communities to report unmet needs for emergency care for mental health care, including mental health crises Residents of Everett were more likely than residents of other communities to report unmet needs for dental care. Residents of Malden were more likely than residents of other communities to report unmet needs for reproductive health care and treatment for substance use disorders Residents of Somerville reported the lowest rates of unmet care needs.
Data Source: CHA Community Wellbeing Survey 2021.

99
Data Point | We also found patterns of unmet care by immigrant groups Across communities, newer immigrants experienced higher unmet care needs rates than established immigrants and non immigrants, for all types of care assessed. Notably, 29% needed emergency mental health care but could not access it, compared to just 4 6% among the other groups; 23% needed mental health care but could not access it, more than double the rate among the other groups.
Data Source: CHA Community Wellbeing Survey 2021
Notes: For analysis by demographic variables, survey participants from four communities (Everett, Malden, Medford, and Somerville) are combined to ensure an adequate sample size Newer immigrant is defined as having lived in the US for 6 years or fewer Established immigrant is defined as having lived in the US for more than 6 years
In terms of racial and ethnic groups, we also found thatAmerican Indian andAlaska Native and Native Hawaiian Pacific Islander participants, and Black participants, tended to experience higher rates of unmet care needs than other racial groups 63 However, small sample sizes in the number of participants who reported unmet care needs suggest this insight should be interpreted with caution.
For complete Community Wellbeing Survey results, please see the frequency tables in Appendix

63
F 100
Participants who indicated they needed a given type of care but could not access it were asked to select one or more reasons for not getting the care they needed.The tables below show the proportion of participants who chose each reason, from most common to least common Costs, transportation, or available hours were among the top 3 barriers across all types of care. When asked to elaborate on other reasons not listed as selection options, common responses described waiting lists, no available appointments, and staffing capacity issues
Dental care (n=159)
Unable to afford the costs 44.7%
Reproductive health care (n=54) Vision care (n=95)
Unable to get transportation 27.8%
Hours did not fit my schedule 18.2% Hours did not fit my schedule 24.1%
Fear or distrust of the health care system 15 1%
Another reason not listed here 15 1%
Unable to afford the costs 20 4%
Unable to afford the costs 31.6%
Hours did not fit my schedule 21.1%
Another reason not listed here 13 7%
Fear or distrust of the health care system 14 8% Unable to get transportation 12 6%
Concern about COVID exposure 13 2% Another reason not listed here 13 0%
Concern about COVID exposure 10 5%
Unable to get transportation 11 3% Concern about COVID exposure 11 1% No providers speak my language 8 4%
No providers speak my language 5.0% No providers speak my language 7.4%
Emergency care for a mental health crisis (n=59)
transportation
afford the
Hours did not fit my schedule
Fear or distrust of the health care system
Concern about COVID exposure
No providers speak my language
Data Source:
Notes:
Mental health care (n=93)
Fear or distrust of the health care system 6.3%
Treatment for a substance use disorder (n=36)
Unable
transportation
Hours
schedule
Unable to afford the costs
Fear
of the health care system
Concern about COVID exposure
Hours did not fit my schedule
No providers speak my language
Fear or distrust of the health care system
No providers speak my language
Another reason not listed here
Concern about COVID exposure
Unable to get
37 3% Another reason not listed here 33 3%
to get
27 8% Another reason not listed here 23.7% Unable to afford the costs 20.4%
did not fit my
27.8% Unable to
costs 20 3% Unable to get transportation 20 4%
25 0%
20 3%
or distrust
11 8%
16 7%
11 9%
10 8%
13 9%
8 5%
9 7%
8 3%
1.7%
8.6%
2.8%
CHA Community Wellbeing Survey 2021
Survey participants from four communities (Everett, Malden, Medford, and Somerville) are combined to ensure an adequate sample size 101
In spite of challenges to equitable access to health care, participants also shared positive experiences Being treated with dignity is a patient right.These examples also affirm how treating patients with care, equity, and dignity encourages them to feel they belong and can reach out for support and assistance


The complexity of navigating social service, education, and municipal resources and information creates inequitable impacts.
Navigating systems was discussed in the context of privilege and connections Participants in the assessment shared how challenging it can be to know where to even begin to find information and resources, especially for new immigrants. For undocumented immigrants, fear of the risk of deportation is an especially relevant factor that limits seeking information, resources, and help, even for services they may be eligible for or in emergency situations.
While support for navigating complicated systems is critical, participants raised questions and ideas about why such systems are so complicated in the first place Interview and focus group participants discussed ideas for simplifying processes by centering the people who utilize various programs to co design systems that work more efficiently Challenges across sectors and programs included application processes that are time consuming, intrusive, and complicated; and benefits “cliffs,” where earning more income leads to loss of means-tested benefits like cash assistance, housing vouchers, or MassHealth
102
Digital equity is an essential component of equity in access to information and resources – but, it is important to consider the risks of promoting too much dependence upon the virtual environment.
Although new resources made available during the pandemic were identified as a strength, participants also discussed how accessing these resources was challenging for those with limited access to the internet and internet-connected devices or pre-existing knowledge of navigating application systems The proportion of households who lack access to digital devices, like computers, or subscriptions, like broadband internet, varies by community In Everett and Malden, the proportion of households with digital equity concerns tends to be higher or similar to the statewide average
However, there are equity concerns within our communities as well. For example, in Somerville, the proportion of low and middle income households who lack an internet subscription is higher than the corresponding statewide averages

 Data Source: US Census Bureau, American Community Survey (ACS) 2015 2019 5 Year Estimates
Data Source: US Census Bureau, American Community Survey (ACS) 2015 2019 5 Year Estimates
Data Source: US Census Bureau, American Community Survey (ACS) 2015 2019 5 Year Estimates
103
Community Voices
Ideas for Improving Equitable Access to Healthcare and Other Essential Resources
● Name and acknowledge trauma in health care. People have been harmed by health care systems and by providers It is important to acknowledge this and commit to doing better.
● Work to dispel misinformation about the risks of seeking health care for undocumented immigrants. Post flyers that emphasize the safety and confidentiality of clinics where people are likely to see them in daily life, such as in supermarkets.
● Strengthen cultural and linguistic diversity among health care providers, social workers, case managers, and interpreters, including for mental health. Invest in hiring and training more interpreters for more languages Invest in hiring health care workers of diverse cultural and ethnic backgrounds.
● Reduce barriers to making appointments. Streamline the process of needing a primary care referral for access to mental health care Expand hours and locations Reduce waiting times as much as possible
● Create clear procedures for patients to file complaints and have them be heard and addressed. Procedures for handling complaints in the health care system and holding medical providers accountable for harm should center the patient’s humanity.
● Find ways to reduce the out-of-pocket costs of healthcare. Connect people to health insurance and find ways to reduce co pays and medication costs Addressing costs will have a positive impact on immigrants and people who have lower incomes.
● Create mechanisms to bring health care services directly into communities. Although telehealth has been an important advancement in increasing access to care, people with limited access to technology or limited digital literacy are not well served by telehealth options Advertising services in ways that require people to call a phone number or visit a website to make an appointment is inaccessible to people with limited access to technology and limited literacy (digital and otherwise). Community-based access would be highly valuable, particularly for vaccines and mental health Co locating health services in places where people go to access other resources is a promising idea
● Prioritize free preventive care Screening for sexually transmitted infections (STIs), providing COVID testing and vaccination, and other essential preventive care services should be prioritized and invested in
● Develop and disseminate health education resources This includes educational resources about navigating the health care system and what constitutes preventive care Immunization schedules for children and adolescents, screening recommendations for adults, and increasing dental and vision care access should be prioritized Education resources must attend to linguistic and cultural appropriateness.
104
● Invest in community and employer partnerships and strengthen transitions between health care and social service providers. The health care system can be a gateway to connect with social service providers and other resources To capitalize on this opportunity, invest in well-coordinated models for referral and case management. Partnering with local employers and job sites provides another opportunity for connection, such as arranging for on site financial literacy workshops, dental consultations, vaccine clinics, or information fairs.
● Create centralized or common applications. Simplify forms and make online applications easier for people with lower digital literacy skills Have phone numbers for people to call to get help from knowledgeable volunteers or staff on completing forms and applications.
● Establish resource centers where people can get help with general questions, referrals, and navigating systems. Co locate these resource centers in places people are already accustomed to visiting and where there is a consistent, trusted presence The Mystic Learning Center in Somerville offers an example. Ensure these places are safe spaces with information in multiple languages that are relevant to the needs of undocumented immigrants and people of diverse identities
● Tap into existing communication channels and networks to share information about resources and priority issues. Even though establishing a “one stop” resource center may often be a good solution, information changes rapidly and people have diverse interests and needs that a universal information resource may not be realistic Partnering with liaisons to existing networks centers the communication norms of diverse communities instead of the norms of the supplier of that information. For example, sharing information via an active WhatsApp group, instead of (or in addition to) posting information on a city website.
● Tailor outreach strategies for people who may not be connected to an existing communication channel. This is particularly relevant for undocumented immigrants, new immigrants, and older adults Ideas included providing information about resources and issues on flyers in relevant languages posted in places where people are likely to see them in the course of daily life. Schools and Parent Information/Welcome Centers can be leveraged to engage parents, using opportunities like parent teacher conferences and community events when people are already gathered to provide access to information. Understanding the audience of any message is especially important: for example, information about how privacy is maintained should be explained intentionally upfront for undocumented immigrants.
105
Spotlight on: Homelessness and Healthcare
For people experiencing homelessness, access to healthcare is a significant equity concern. Assessment participants emphasized that the mainstream healthcare system does not adequately address unsheltered residents' complex health challenges. Expanding access in ways that meet people where they are is essential
Participants emphasized that healthcare often implicitly assumes access to safe, sanitary living conditions In fact, people who are sleeping outside have limited access to water for personal hygiene, cleaning wounds, and drinking Access to toilets is not ensured and refrigeration for medications is likely unavailable. For people sleeping in shelters, a safe space to store medication during the day may be unavailable even if there are overnight lockers for personal belongings.The conditions of living, sleeping, eating and maintaining personal hygiene while unsheltered make following a medical provider’s recommendations extremely difficult Many unsheltered residents face multiple health conditions that interact in uniquely challenging ways, often involving mental health, substance use, and chronic physical health conditions, exacerbated by years of living outdoors, exposed to extreme weather and conditions
The design of substance use disorder treatment options was discussed as an example of how policies systematically exclude unsheltered residents from necessary care Aperson experiencing homelessness may be admitted to a local hospital following a substance overdose or other acute medical incident.After being stabilized, the individual may be discharged but still need detox care However, detox options are unavailable for medically complex patients, as detox programs are not resourced or qualified to care for individuals with complex medical needs appropriately. Further, hospital policies may prevent keeping an individual admitted once they are medically stable As such, the individual will be discharged without a place to go, returning them to the same unsheltered conditions they had been in previously This was brought up as a longstanding gap and equity concern.

106
Currently, methamphetamine use is growing and presents an acute challenge for substance use treatment.64 As participants described with reference to individuals experiencing homelessness and addiction, there are no approved medications and few detox programs

Participants also discussed how health care provider participation in community based networks of services and care is critical to meeting the needs of people facing substance use disorders and complex social and medical needs.
Community Voices
Ideas for Increasing Equity in Health Care Access for Unsheltered Residents
● Establish clear communication systems, continuity of care, and referral protocols between emergency departments, substance use prevention programs, treatment programs, and homelessness services providers. Ahub model could help to identify and coordinate care plans for unsheltered residents across multiple service providers
● Expand education about fentanyl. There is increasing concern with the dangers of fentanyl-laced substances that are not opioids such as cocaine. Educating people who do not use opioids that they should still possess and learn how to use Narcan is a potentially life saving intervention
● Create mechanisms for medical providers to be able to provide health care directly where people experiencing homelessness already are. Encouraging unsheltered residents to come to a clinic site is still important, and can be paired with on-site direct health care provision.Treating wounds and infections are particularly important to address on site to prevent additional harms.
● Support the creation of day centers, medical respites, and human-centered spaces for people experiencing homelessness and substance use disorders.
64 Bebinger, M. (May 12, 2022). As cocaine and meth use rise in Mass., state commission outlines action plan. WBUR https://www.wbur.org/news/2022/05/11/massachusetts-meth-commission-recommendations
107
Healthcare and Health Outcomes
The Healthcare and Health Outcomes section summarizes key data on preventive health care, utilization of health care services, and distribution of health conditions in our communities.

108
Preventive Health Care
Preventive health care is important for staying healthy and detecting early signs of illness. It includes things like routine primary care check ups, routine dental care, vaccinations, and completing recommended screening tests and procedures throughout the lifespan
Before the COVID 19 pandemic, an estimated 1 in 5 adults in our communities had not visited a medical provider for a routine check-up in the last year.The proportion of adults who had not visited a dentist in the last year was estimated as 1 in 3 in Everett and Malden, and 1 in 4 in Medford and Somerville


Screening rates for cancers vary across our communities Before the pandemic, estimated cervical cancer screening rates were higher in our communities compared to the Massachusetts state average Breast cancer screening rates and colorectal cancer screening rates were estimated to be lower compared to the state average
Data Source: Centers for Disease Control and Prevention (CDC) PLACES, 2021; Behavioral Risk Factor Surveillance System (BRFSS) 2018
Notes: For indicators at the community level, data were sourced from the CDC PLACES 2021 release, a dataset containing Census tract and city/town level estimates of health outcomes, preventive care, and health behavior indicators Estimates are modeled using BRFSS results extrapolated based on the demographic composition of the geographic area. They are NOT direct survey results, so should be interpreted with caution For indicators at the state level, data were sourced directly from the BRFSS Prevalence and Trends Tool, which provides direct estimates at the state level
109
Screening rates for high cholesterol were estimated to be relatively high across all of our communities Almost 9 in 10 adults were estimated to have been screened in the last 5 years a prevalence similar to the state of Massachusetts overall.
Data Source: Centers for Disease Control and Prevention (CDC) PLACES, 2021; Behavioral Risk Factor Surveillance System (BRFSS), 2019.
Notes: For indicators at the community level, data were sourced from the CDC PLACES 2021 release, a dataset containing Census tract and city/town level estimates of health outcomes, preventive care, and health behavior indicators Estimates are modeled using BRFSS results extrapolated based on the demographic composition of the geographic area They are NOT direct survey results, so should be interpreted with caution. For indicators at the state level, data were sourced directly from the BRFSS Prevalence and Trends Tool, which provides direct estimates at the state level
The COVID 19 pandemic has impacted preventive care utilization, raising concerns about chronic disease management and undetected illness.According to the COVID 19 Community Impact Survey, 1 in 4 respondents from Malden and Somerville reported not having received needed medical care due to the pandemic. Smaller proportions of respondents in Everett (12%) and Medford (16%) reported not receiving needed medical care.
Data Source: Massachusetts Department of Public Health, COVID 19 Community Impact Survey (CCIS), Fall 2020

Notes: The CCIS was conducted online from September through November 2020 by the Massachusetts Department of Public Health. The purpose of the survey was to understand the needs and experiences of populations that have been disproportionately impacted by the pandemic The survey was NOT designed to be fully representative of residents of a given community, so results should be interpreted with caution White non Hispanic residents were overrepresented among survey respondents in Malden, Medford, and Somerville, but not in Everett Low income residents were underrepresented among survey respondents in all four communities. The total sample size was over 33,000 residents (adults over age 25), including 156 from Everett, 319 from Malden, 322 from Medford, and 566 from Somerville

110
Chronic Non-communicable Diseases
Cancer
For cities and towns, the Massachusetts Cancer Registry releases data on the incidence (the occurrence of new cases over a specific period of time) of cancer every few years, with the most recently available data covering the 5-year period of 2011 2015 Standardized Incidence Ratios (SIRs) provide insight into how the burden of cancer in each community compares to the statewide average.

The table below displays the SIRs for each type of cancer in each community.The values indicate the direction of cancer burden in comparison to the state The colors indicate statistical significance based on 95% confidence intervals.
● SIRs above 100 indicate incidence for the given cancer among females or males is higher than expected. Orange indicates the difference is statistically significant.
● SIRs below 100 indicate incidence for the given cancer among females or males is lower than expected. Green indicates the difference is statistically significant.
● No color indicates the difference is not statistically significant
Standardized Incidence Ratios (SIRs) for Selected Cancers
Females
Males
Everett Malden Medford Somerville
Cancer (all sites) 89 0 97 3 103 5 97 3 Breast cancer 90 6 89 9 99 6 87 8 Colorectal cancer 66.8 119.1 113.4 78.9 Lung cancer 102 8 98 9 124 7 101 4 Melanoma 43 0 41 3 55 6 83 4
Cancer (all sites) 96 2 99 9 97 0 95 9 Colorectal cancer 99 9 122 4 105 8 95 1 Lung cancer 104 0 132 1 106 8 134 1 Melanoma 88 1 30 0 47 3 84 1 Prostate cancer 79.2 94.6 92.9 92.2 Data Source: Massachusetts Cancer Registry, Cancer Incidence in Massachusetts, City/Town Supplement 2011 2015 Notes: The MA Cancer Registry reports cancer statistics by male or female sex SIRs based on gender identity are not available The SIRs for several cancers in addition to those selected above were statistically significantly higher than expected in Everett and Malden, but not in Medford or Somerville. 111
Standardized Incidence Ratios (SIRs) for Cancers of Concern
Everett Malden
Cervix Uteri (Females)
Stomach (Males)
Liver (Males)
Data Source: Massachusetts Cancer Registry, Cancer Incidence in Massachusetts, City/Town Supplement 2011
Liver (Females)
Cervix Uteri (Females)
Stomach (Males)
Non Hodgkin Lymphoma (Males)
Lung (Males)
Liver (Males)
Esophagus (Males)
The National Cancer Institute (NCI) provides age adjusted cancer incidence rates by racial and ethnic groups for the state of Massachusetts overall Age-adjusted rates are possible to calculate, rather than SIRs, at higher levels of geography such as counties or states.

Cancer incidence rates in Massachusetts by racial/ethnic group Age-adjusted rates per 100,000 (2000–2018)

219 1
244 8
179.6
188.5
164 3
169 9
2015
157 5
132.1
157 7
164 4
112
When interpreting trends in cancer incidence by racial/ethnic group, it is important to keep in mind that inequity in access to care can influence incidence rates. Without equitable access to health care and preventive screening, individuals who belong to one group may be diagnosed with cancer at a later stage than individuals in another group. In such cases, low incidence rates may signal limited access to screening and diagnostic care, rather than a low burden of cancer

Data Point | Compared to the state of Massachusetts overall, the 5 year average age adjusted cancer mortality rate (combining all types of cancers) is higher in Malden and Somerville, and lower in Everett and Medford. Over time, cancer mortality has declined most sharply in Everett. From 2019 to 2020, capturing the first year of the COVID 19 pandemic, cancer mortality declined in Everett and Malden and did not change in Medford or Somerville

Data Source: Massachusetts Registry of Vital Records and Statistics, Selected Causes of Death, 2016 2020 Notes: In each chart, a gray dotted line represents the age adjusted rate for the state of Massachusetts.
Equity Lens | In Massachusetts overall, the cancer mortality rate is highest among White non Hispanic residents, and lowest among Hispanic residents. From 2019 to 2020, capturing the first year of the COVID 19 pandemic, cancer mortality increased among Asian/Pacific Islander residents and Black non Hispanic residents.
113
Data Source: Massachusetts Registry of Vital Records and Statistics, Selected Causes of Death, 2016 2020.
Notes: Mortality rates by racial/ethnic group are not available at the municipal level due to small numbers Mortality rates at the state level are not available for racial/ethnic groups other than those identified in these charts due to small numbers In each chart, NH refers to non Hispanic groups.
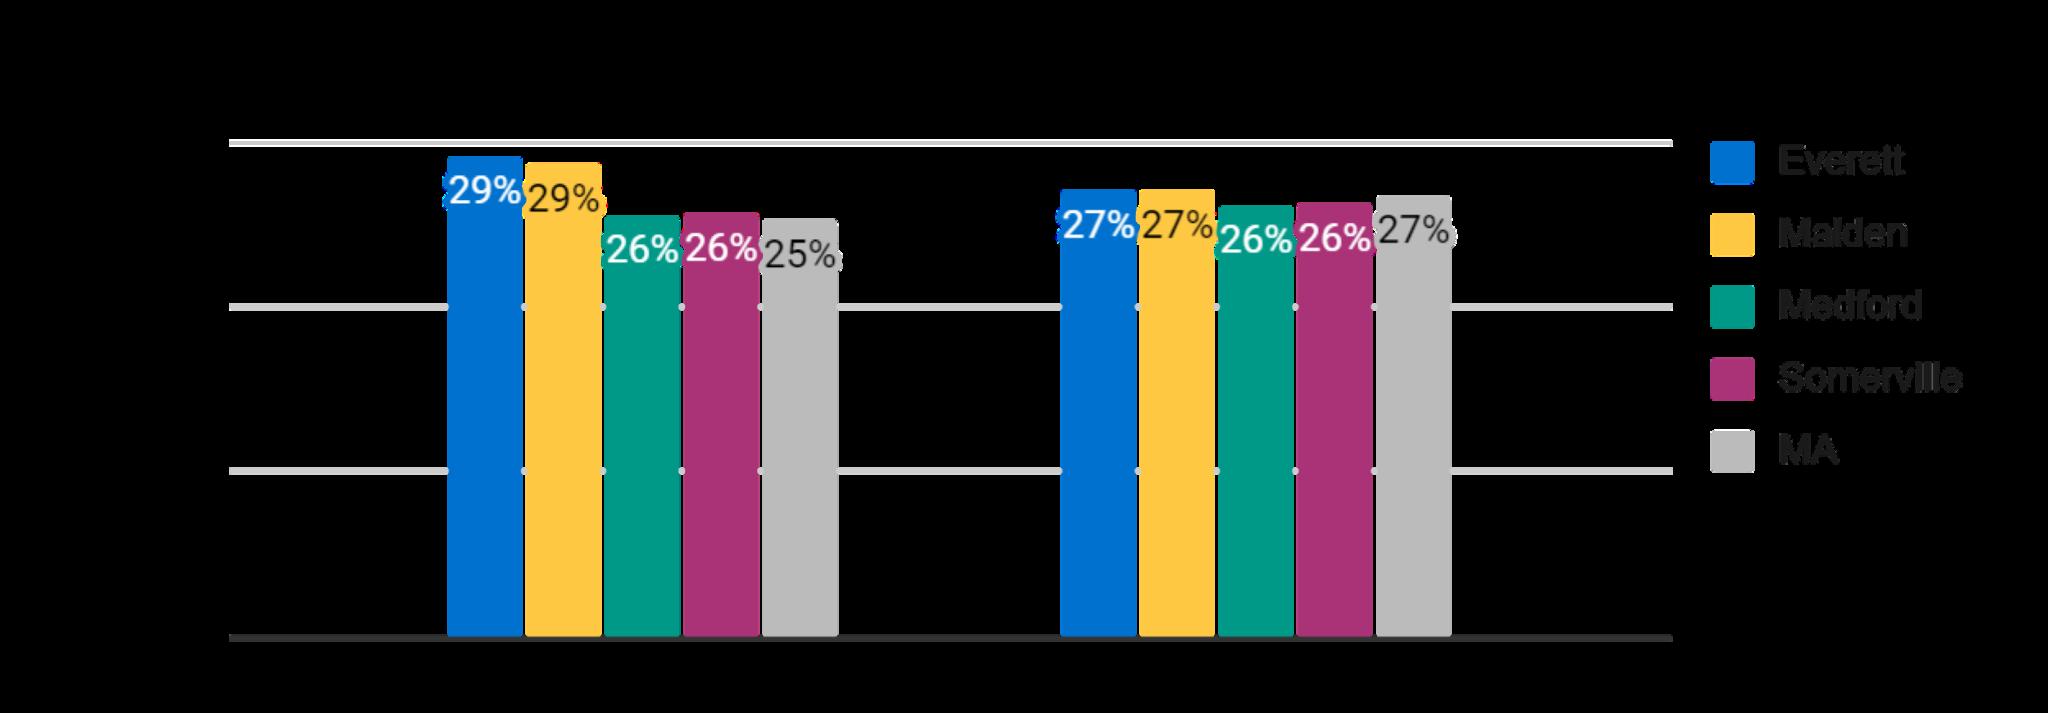

Cardiovascular Health
It is estimated that nearly 30% of adults in Everett and Malden have high blood pressure, a rate higher than the state average.Approximately 1 in 4 adults in Medford and Somerville have high blood pressure, a rate similar to the state average In all four communities, among adults who have had their blood cholesterol screened in the last 5 years, more than 1 in 4 are estimated to have been diagnosed with high cholesterol.
Data Source: Centers for Disease Control and Prevention (CDC) PLACES, 2021; Behavioral Risk Factor Surveillance System (BRFSS), 2019
Notes: For indicators at the community level, data were sourced from the CDC PLACES 2021 release, a dataset containing Census tract and city/town level estimates of health outcomes, preventive care, and health behavior indicators Estimates are modeled using BRFSS results extrapolated based on the demographic composition of the geographic area They are NOT direct survey results, so should be interpreted with caution For indicators at the state level, data were sourced directly from the BRFSS Prevalence and Trends Tool, which provides direct estimates at the state level.
114
Data Point | Compared to the state average, the age adjusted rate of hospitalizations due to heart disease is higher in Everett, Malden, and Medford, and lower in Somerville.
Stratifying age adjusted hospitalization rates by racial group allows us to identify disparities that are not due to age differences alone. We use a measure called an Incidence Rate Ratio (IRR) to quantify how much higher or lower rates are for a given group compared to a reference group


Equity Lens | Black residents in our communities have high heart disease hospitalization rates, but those rates are lower than the state average for Black residents. Heart disease hospitalization rates among Asian residents tend to be higher in our communities compared to the state average for Asian residents.
Heart Disease: Age adjusted hospitalization rates are In Everett:
Highest among White residents.
Lower forAsian residents of Everett compared toAsian residents of MAoverall
10% lower among Black residents compared to White residents.

In Malden:
Highest among Black residents.
Higher forAsian residents of Malden compared toAsian residents of MAoverall
30% higher among Black residents compared to White residents
In Medford:
Highest among Black residents.
Higher forAsian residents of Medford compared toAsian residents of MAoverall
40% higher among Black residents compared to White residents
In Somerville:
Highest among Black residents.
Higher forAsian residents of Somerville compared toAsian residents of MAoverall
70% higher among Black residents compared to White residents
Data source: Center for Health Information and Analysis (CHIA), Massachusetts Acute Hospital Case Mix Database, 2016 2019.
Notes: Individuals of Hispanic or Latino origin may be included in any racial group Individuals who identify with other racial groups besides Asian, Black, or White are not included in this data set due to small numbers
115
Data Point | Compared to the state of Massachusetts overall, the 5 year average age adjusted heart disease mortality rate is higher in Everett and Somerville, and lower in Malden and Medford. Over time, heart disease mortality has declined in all of our communities except Somerville, where mortality has increased. From 2019 to 2020, capturing the first year of the COVID 19 pandemic, heart disease declined in all of our communities except Everett, where mortality increased slightly
Data Source: Massachusetts Registry of Vital Records and Statistics, Selected Causes of Death, 2016 2020
Notes: In each chart, a gray dotted line represents the age adjusted rate for the state of Massachusetts

Equity Lens | In Massachusetts overall, the 5 year average heart disease mortality rate is highest among White non Hispanic residents, and lowest among Asian/Pacific Islander non Hispanic residents From 2019 to 2020, capturing the first year of the COVID 19 pandemic, heart disease mortality increased among Black non Hispanic, Hispanic, and Asian/Pacific Islander non Hispanic residents, and declined among White non Hispanic residents. It is notable that the heart disease mortality rate among Black residents exceeded that of White residents in 2020, for the first time in recent years.

116
Data Source: Massachusetts Registry of Vital Records and Statistics, Selected Causes of Death, 2016 2020.
Notes: Mortality rates by racial/ethnic group are not available at the municipal level due to small numbers Mortality rates at the state level are not available for racial/ethnic groups other than those identified in these charts due to small numbers

Data Point | Compared to the Massachusetts average, the age adjusted rate of hospitalization due to stroke is slightly higher in Everett and Malden, and slightly lower in Medford and Somerville. There are racialized health inequities within and between communities, particularly in Medford and Somerville.

Data source: Center for Health Information and Analysis (CHIA), Massachusetts Acute Hospital Case Mix Database, 2016 2019
Notes: Individuals of Hispanic or Latino origin may be included in any racial group. Individuals who identify with other racial groups besides Asian, Black, or White are not included in this data set due to small numbers
Equity Lens | Stratifying stroke hospitalization rates by racial group provides insight into disparities Comparing age adjusted hospitalization rates allows us to identify disparities between racial groups that are not due to age differences alone.
117
Stroke: Age adjusted hospitalization rates are In Everett:
Highest among Black residents, and lowest amongAsian residents
Lower forAsian residents of Everett compared toAsian residents of MAoverall
Within 1% for Black residents compared to White residents
In Malden:
Highest among Black residents, and lowest among White residents
Slightly higher for Asian residents of Malden compared to Asian residents of MA overall
20% higher among Black residents compared to White residents.
In Medford:
Highest amongAsian residents, and lowest among White residents
Higher forAsian residents of Medford compared toAsian residents of MAoverall 2.1 times higher amongAsian residents and 2 times higher among Black residents compared to White residents
In Somerville:
Highest among Black residents, and lowest among White residents

Higher forAsian residents of Somerville compared toAsian residents of MAoverall 1.8 times higher amongAsian residents and 2.9 times higher among Black residents compared to White residents
Data Point | Compared to the state of Massachusetts overall, the 5 year average age adjusted stroke mortality rate is lower in all four communities. Over time, stroke mortality has fluctuated in all of our communities. This may be due in part to a relatively small number of stroke deaths per year, which means a small change in that number has a large impact on the rate. From 2019 to 2020, capturing the first year of the COVID 19 pandemic, stroke mortality declined in Everett and Somerville, and increased in Malden and Medford
Data Source: Massachusetts Registry of Vital Records and Statistics, Selected Causes of Death, 2016 2020
Notes: In each chart, a gray dotted line represents the age adjusted rate for the state of Massachusetts

118
Equity Lens | In Massachusetts overall, the 5 year average stroke mortality rate is highest among Black non Hispanic residents, and lowest among Hispanic residents From 2019 to 2020, capturing the first year of the COVID 19 pandemic, stroke mortality declined or did not change notably for all racial/ethnic groups assessed.
Data Source: Massachusetts Registry of Vital Records and Statistics, Selected Causes of Death, 2016 2020. Notes: Mortality rates by racial/ethnic group are not available at the municipal level due to small numbers Mortality rates at the state level are not available for racial/ethnic groups other than those identified in these charts due to small numbers

Obesity
For children and adolescents, obesity is defined as having a Body Mass Index (BMI) value that is at or above the 95th percentile for their age For adults, obesity is defined as having a BMI at or above 30.0 kg/m2 . BMI is an imperfect indicator of individual health, as it is calculated based on height and weight It does not take into account body fat percentage, muscle mass, bone density, or body fat distribution Still, it can be used to measure population level trends

Obesity rates among children and adolescents range from 23% in Malden, Medford and Somerville, to 26% in Everett. Obesity rates among adults range from 24% in Medford and Somerville, to 25% in Malden, to 28% in Everett Compared to the state average, obesity among youth is higher in all of our communities Compared to the state average, obesity among adults is higher in Everett, similar in Malden, and slightly lower in Medford and Somerville.
Data Source: Massachusetts Department of Public Health (DPH), Results from the Body Mass Index Screening Massachusetts Public School Districts, 2017; Centers for Disease Control and Prevention (CDC) PLACES, 2021; Behavioral Risk Factor Surveillance System (BRFSS), 2019
119
Notes: Child obesity data were sourced from height/weight screening conducted by public school districts for students in grades 1, 4, 7, and 10 Adult obesity data at the community level were sourced from the CDC PLACES 2021 release, a dataset containing Census tract and city/town level estimates of health outcomes, preventive care, and health behavior indicators Estimates are modeled using BRFSS results extrapolated based on the demographic composition of the geographic area. They are NOT direct survey results, so should be interpreted with caution Adult obesity data at the state level were sourced directly from the BRFSS Prevalence and Trends Tool, which provides direct estimates at the state level
Diabetes
In our communities, diabetes outcomes reflect stark racial disparities Considering emergency department visits due to diabetes, rates are significantly higher among Black residents compared to White residents: 3.5 times higher in Everett, 3.2 times higher in Malden, 6.8 times higher in Medford, and 4.8 times higher in Somerville
Data Source: Center for Health Information and Analysis (CHIA), Massachusetts Acute Hospital Case Mix Database, 2016 2019

Notes: Individuals of Hispanic or Latino origin may be included in any racial group Individuals who identify with other racial groups besides Asian, Black, or White are not included in this data set due to small numbers. Data are suppressed for counts less than 5 In Everett and Medford, there were fewer than 5 diabetes emergency department visits for Asian residents, so rates were not calculated
Data Point | Compared to the state of Massachusetts overall, the 5 year average age adjusted diabetes mortality rate is higher in Everett, Malden, Medford, and Somerville. Over time, diabetes mortality has declined in Medford, and fluctuated in our other communities. From 2019 to 2020, capturing the first year of the COVID 19 pandemic, diabetes mortality increased in all communities except Medford

120
Data Source: Massachusetts Registry of Vital Records and Statistics, Selected Causes of Death, 2016 2020
Notes: In each chart, a gray dotted line represents the age adjusted rate for the state of Massachusetts

Equity Lens | In Massachusetts overall, the 5 year average diabetes mortality rate is highest among Black non Hispanic residents, and lowest among Asian/Pacific Islander non Hispanic residents From 2019 to 2020, capturing the first year of the COVID 19 pandemic, diabetes mortality increased among all racial/ethnic groups assessed, with the largest rates of increase among people of color.
Data Source: Massachusetts Registry of Vital Records and Statistics, Selected Causes of Death, 2016 2020
Notes: Mortality rates by racial/ethnic group are not available at the municipal level due to small numbers. Mortality rates at the state level are not available for racial/ethnic groups other than those identified in these charts due to small numbers

121
Asthma
Asthma rates among children declined in Everett and Medford from the 2013 14 school year to the 2016 17 school year (the most recent data available). Rates stayed fairly level in Malden and Somerville and at the state level
Data Source: Massachusetts Department of Public Health, Bureau of Environmental Health, Pediatric Asthma 2016 2017
Notes: In each chart, a gray dotted line represents the percentage of children screened in the state of Massachusetts overall.


Among adults, the prevalence of asthma is slightly lower than the state average in Medford and Somerville, and similar to the state average in Everett and Malden
Data Source: Centers for Disease Control and Prevention (CDC) PLACES, 2021; Behavioral Risk Factor Surveillance System (BRFSS), 2019
Notes: For indicators at the community level, data were sourced from the CDC PLACES 2021 release, a dataset containing Census tract and city/town level estimates of health outcomes, preventive care, and health behavior indicators Estimates are modeled using BRFSS results extrapolated based on the demographic composition of the geographic area They are NOT direct survey results, so should be interpreted with caution For indicators at the state level, data were sourced directly from the BRFSS Prevalence and Trends Tool, which provides direct estimates at the state level.
122
Data Point | In Everett, the age adjusted rate of emergency department (ED) visits due to asthma is higher than the state average In Malden, the rate is similar to the state average In Medford and Somerville, the rate is lower compared to the state average. When stratified by racial group, after adjusting for age, the ED visit rates in each community are highest among Black residents, reflecting stark disparities.
Asthma: Age adjusted emergency department visit rates are
In Everett:
Highest among Black residents
Higher among White andAsian residents compared to the rates among White andAsian residents of MAoverall.
2 times higher among Black residents compared to White residents
In Malden: Highest among Black residents
Higher among White andAsian residents compared to the rates among White andAsian residents of MAoverall.

2 times higher among Black residents compared to White residents
In Medford:
Highest among Black residents
Similar or lower among White andAsian residents compared to the rates among White andAsian residents of MAoverall
2.7 times higher among Black residents compared to White residents.
In Somerville:
Highest among Black residents
Lower among White residents and higher amongAsian residents compared to the rates among White andAsian residents of MAoverall
3.4 times higher among Black residents compared to White residents.
Data Source: Center for Health Information and Analysis (CHIA), Massachusetts Acute Hospital Case Mix Database, 2016 2019.
Notes: Individuals of Hispanic or Latino origin may be included in any racial group Individuals who identify with other racial groups besides Asian, Black, or White are not included in this data set due to small numbers
123
Chronic Obstructive Pulmonary Disorder (COPD)
Compared to the state, the age adjusted rates of hospitalizations due to COPD are higher in Everett and similar in Malden. In Medford and Somerville, rates are lower compared to the state.
Chronic Obstructive Pulmonary Disease (COPD): Age adjusted hospitalization rates are…
In Everett:
Highest among White residents
Rate among White residents is higher compared to White residents of MAoverall Rates are higher amongAsian residents and lower among Black residents, compared to the corresponding state race specific rates
In Malden:
Highest among White residents
Rates are higher amongAsian residents and lower among Black residents, compared to the corresponding state race-specific rates
In Medford: Highest among White residents
Rate among Black residents is lower compared to Black residents of MAoverall
In Somerville: Highest among White residents Rate among Black residents is lower compared to Black residents of MAoverall
Data Source: Center for Health Information and Analysis (CHIA), Massachusetts Acute Hospital Case Mix Database, 2016 2019.
Notes: Individuals of Hispanic or Latino origin may be included in any racial group Individuals who identify with other racial groups besides Asian, Black, or White are not included in this data set due to small numbers Data are suppressed for counts less than 5. In Medford and Somerville, there were fewer than 5 COPD hospitalizations for Asian residents, so rates were not calculated

124
Sexual and Reproductive Health Pregnancy and Birth Outcomes
Compared to the state of Massachusetts, the 5 year average percentage of babies born with low birthweight is higher in Everett and Malden and lower in Medford and Somerville. Racial and ethnic inequities are reflected in birth outcomes at the state level Black non Hispanic babies are more likely to be born with low birthweight compared to other racial and ethnic groups


Data source: Massachusetts Registry of Vital Records and Statistics, Births, 2016 2020.
Notes: Low birthweight is defined as less than 2,500 grams, or 5 5 pounds
Compared to the state, the 5-year average percentage of babies born preterm is higher in Everett, and lower in Malden, Medford, and Somerville Similar inequities by racial and ethnic group are seen for preterm births as for low birthweight births
Data source: Massachusetts Registry of Vital Records and Statistics, Births, 2016 2020
Notes: Preterm birth is defined as less than 37 weeks gestation
125
Trends in pregnancy among teenagers can be assessed using age specific birth rates The 5 year average rate of births to females ages 15-19 is higher in Everett compared to the state of Massachusetts, and lower in Malden, Medford, and Somerville.The annual teen birth rate has declined between 2016 and 2020 in all four communities Relative to the state rate, shown as a gray dotted line in the charts below, trends have varied in each community


Data source: Massachusetts Registry of Vital Records and Statistics, Births, 2016 2020 Annual Average
Notes: Births to teens are defined as births to females ages 15 19 years Data are suppressed for counts less than 5 In Medford, there were fewer than 5 births to female teens in 2019, so a rate was not calculated.
At the state level, the 5 year average rate of births to females ages 15 19 is highest among Hispanic teens Annual teen birth rates have declined between 2016 and 2020 among all racial and ethnic groups assessed.
Data source: Massachusetts Registry of Vital Records and Statistics, Births, 2016 2020.
Notes: Births to teens are defined as births to females ages 15 19 years
126
Sexually Transmitted Infections (STIs)
Across all of our communities, chlamydia is the most common STI, followed by gonorrhea. While syphilis and HIV are less common, trends in the burden of illness are important to understand.There are concerns that decreased access to STI screening and testing during the COVID 19 pandemic has led to undiagnosed STIs, not only in our communities, but across the state and country These trends will be important to monitor in the years ahead
Data Point | Compared to the statewide average, the 5 year average age adjusted incidence rate for chlamydia is higher in Everett and Malden, and lower in Medford and Somerville. Chlamydia diagnoses increased in all four communities from 2016 to 2019. The decline from 2019 to 2020 may be due to decreased access to STI screening in the first year of the COVID 19 pandemic, rather than a true decline in chlamydia incidence.
Data Source: Massachusetts Department of Public Health, Bureau of Infectious Disease and Laboratory Sciences, 2016 2020 Notes: In each chart, a gray dotted line represents the age adjusted rate for the state of Massachusetts.
Data Point | Compared to the statewide average, the 5 year average age adjusted incidence rate for gonorrhea is higher in Everett, Malden, and Somerville, and slightly lower in Medford. There was a net increase in gonorrhea diagnoses from 2016 to 2019, though incidence had begun to decline in Everett, Medford and Somerville by 2019. It will be important to monitor if these trends continue, or if declines in incidence in 2020


127
are actually artifacts of limited STI testing during the first year of the COVID 19 pandemic Notably, gonorrhea incidence in Everett increased slightly from 2019 to 2020, which may suggest an area of concern.
Data Source: Massachusetts Department of Public Health, Bureau of Infectious Disease and Laboratory Sciences, 2016 2020. Notes: In each chart, a gray dotted line represents the age adjusted rate for the state of Massachusetts
Data Point | Compared to the statewide average, the 5 year average age adjusted incidence rate for syphilis is higher in all four of our communities. Declines from 2019 to 2020 may be due to decreased access to STI screening in the first year of the pandemic, rather than true declines in syphilis. Syphilis incidence in Malden continued to increase from 2019 to 2020, which may suggest an area of concern.

Data Source: Massachusetts Department of Public Health, Bureau of Infectious Disease and Laboratory Sciences, 2016 2020. Notes: In each chart, a gray dotted line represents the age adjusted rate for the state of Massachusetts


128
Data Point | Compared to the statewide average, the 5 year average age adjusted incidence rate for HIV is higher in Everett and Malden, and lower in Medford and Somerville. Declines from 2019 to 2020 may be due to decreased access and availability of HIV testing in the first year of the COVID 19 pandemic, rather than true declines in HIV incidence.


Data Source: Massachusetts Department of Public Health, Bureau of Infectious Disease and Laboratory Sciences, 2016 2020 Notes: In each chart, a gray dotted line represents the age adjusted rate for the state of Massachusetts Data are suppressed for counts <5. There were fewer than 5 diagnosed cases of HIV in Medford in 2016 and 2020, and in Somerville in 2019 and 2020, so rates were not calculated
Equity Lens | Stratifying HIV incidence rates by racial/ethnic group provides insight into disparities in the burden of HIV. Comparing age adjusted incidence rates allows us to identify disparities between groups that are not due to age differences alone. We use a measure called an Incidence Rate Ratio (IRR) to quantify how much higher or lower rates are for a given group compared to a reference group.

129
HIV: Age adjusted HIV incidence rates are…
In Everett:
Highest among Black residents, and lowest among Hispanic residents
Lower for Black and Hispanic residents of Everett compared to Black and Hispanic residents of MAoverall.
4 6 times higher for White residents of Everett compared to White residents of MAoverall
50% higher among Black residents compared to White residents
In Malden:
Highest among Black residents, and lowest among White residents
Lower for Black residents of Malden compared to Black residents of MAoverall
33% higher for Hispanic residents and 72% higher for White residents of Malden compared to Hispanic and White residents of MAoverall
4.3 times higher among Black residents, and 3 1 times higher among Hispanic residents, compared to White residents
In Somerville:
Highest among Black residents, and lowest among White residents
Lower for Black and Hispanic residents of Somerville compared to Black and Hispanic residents of MAoverall.

11% higher for White residents of Somerville compared to White residents of MAoverall
3.5 times higher among Black residents, and 3.2 times higher among Hispanic residents, compared to White residents.
Data Source: Massachusetts Department of Public Health, Bureau of Infectious Disease and Laboratory Sciences, 2016 2020
Notes: Data are suppressed for counts <5 There were fewer than 5 diagnosed cases of HIV among Black non Hispanic and Hispanic individuals in Medford during the 2016 2020 period, so rates were not calculated. Rates are not available for racial/ethnic groups besides Black non Hispanic, Hispanic, and White non Hispanic due to small numbers
Substance Use
Substance use can be a risk factor for addiction and chronic health conditions Prior to the COVID-19 pandemic, rates of alcohol, cigarette/tobacco, marijuana, and vaping/e-cigarette use among high school students in all four communities were lower than the MAstate average
Data Source:
Everett Student Health Survey (Grades 6 12);
Malden Middle School and High School Health Surveys (Grades
High School Health Survey (Grades
Medford High School Communities that Care Youth Survey
Massachusetts High School Youth Risk Behavior Survey (CDC)
2019
2018
7 12); 2019
2020 Somerville
9 12); 2019
130
Among adults, rates of binge drinking were slightly lower than the state average in Everett and Malden, and comparable to the state average in Medford and Somerville.The CDC defines binge drinking as consuming 5 or more drinks on an occasion for men or 4 or more drinks on an occasion for women. Rates of current smoking were higher than the state average in Everett and Malden, and comparable to the state average in Medford and Somerville


Data Source: Centers for Disease Control and Prevention (CDC) PLACES, 2021; Behavioral Risk Factor Surveillance System (BRFSS), 2019
Notes: For indicators at the community level, data were sourced from the CDC PLACES 2021 release, a dataset containing Census tract and city/town level estimates of health outcomes, preventive care, and health behavior indicators Estimates are modeled using BRFSS results extrapolated based on the demographic composition of the geographic area They are NOT direct survey results, so should be interpreted with caution For indicators at the state level, data were sourced directly from the BRFSS Prevalence and Trends Tool, which provides direct estimates at the state level.
While comparable survey data from the COVID era were not available during the assessment, the COVID Community Impact Survey provides additional insight into substance use trends Adults in our communities may be using substances more frequently or in greater quantities compared to before the pandemic
Data Source: Massachusetts Department of Public Health, COVID 19 Community Impact Survey (CCIS), Fall 2020
Notes: The CCIS was conducted online from September through November 2020 by the Massachusetts Department of Public Health The purpose of the survey was to understand the needs and experiences of populations that have been disproportionately impacted by the pandemic. The survey was NOT designed to be fully representative of residents of a given community, so results should be interpreted with caution White non Hispanic residents were overrepresented among survey respondents in Malden, Medford, and Somerville, but not in Everett Low income residents were underrepresented among survey respondents in all four communities The total sample size was over 33,000 residents (adults over age 25), including 156 from Everett, 319 from Malden, 322 from Medford, and 566 from Somerville.
131
Data Point | Compared to the state average, the crude rate of emergency department visits due to opioid overdose is higher in Everett, and lower in Malden, Medford, and Somerville. The rate increased from 2019 to 2020 in Everett and Malden. The rate of emergency department visits is particularly high among White non Hispanic residents of Everett and Malden compared to the statewide average for White non Hispanic residents


Data Source: Massachusetts Department of Public Health, Injury Surveillance Program, 2016 2020
Notes: Data are suppressed for counts <11 For this reason, rates are not available for racial/ethnic groups besides Black non Hispanic, Hispanic/Latino, and White non Hispanic. In Medford, the count of Emergency Department visits for Black non Hispanic residents was <11 for the 2016 2020 period, so a rate could not be calculated.
Data Point | Compared to the state of Massachusetts overall, the 5 year average age-adjusted opioid-related overdose mortality rate is higher in Everett, and lower in Malden, Medford, and Somerville. In Everett, opioid related overdose mortality declined from 2016 to 2018, and increased in 2019 and 2020 In Malden, opioid related overdose mortality fluctuated between 2016 and 2019, and increased notably in
132
2020 In Medford and Somerville, opioid related overdose mortality declined from 2016 to 2018, increased in 2019, but declined in 2020
Data Source: Massachusetts Registry of Vital Records and Statistics, Selected Causes of Death, 2016 2020
Notes: In each chart, a gray dotted line represents the age adjusted rate for the state of Massachusetts


Equity Lens | In Massachusetts overall, 5 year average opioid-related overdose mortality is highest among Hispanic residents. From 2016 to 2018, opioid overdose mortality was highest among White non Hispanic residents, but in 2019 and 2020, it was exceeded by the rate among Hispanic residents. Opioid overdose mortality among Black non Hispanic residents rose sharply from 2019 to 2020, continuing a pattern of increase that began in 2018 In 2020, for the first time, opioid overdose mortality was highest among Black non Hispanic residents, relative to other racial/ethnic groups assessed
Data Source: Massachusetts Registry of Vital Records and Statistics, Selected Causes of Death, 2016 2020
Notes: Mortality rates by racial/ethnic group are not available at the municipal level due to small numbers Mortality rates at the state level are not available for racial/ethnic groups other than those identified in these charts due to small numbers
At the state level, the rate of opioid overdose deaths increased by 75% among Black non-Hispanic males from 2019 (32.6 per 100,000) to 2020 (57.1 per 100,000). Rates also increased among Hispanic andAsian or Pacific Islander males, but declined among White non Hispanic males Opioid overdose death rates increased among females across all racial
133
and ethnic groups assessed mostly sharply among Hispanic females, by 68% (from 8 2 per 100,000 in 2019, to 13.8 per 100,000 in 2020).65
The COVID-19 pandemic may play a complicated role in opioid use, and lethality may be compounded by the increasing presence of the synthetic opioid fentanyl in stimulants, such as cocaine 66 At the state level, month by month data from January 2019 to September 2021 shows an increase in opioid-related overdose deaths in Spring 2020, shortly after the start of the pandemic, and again in Spring 2021, noted in light blue in the chart below There were 2,206 opioid related overdose deaths fromApril 2019 to March 2020 (immediately pre pandemic), and 2,183 opioid-related overdose deaths fromApril 2020 to March 2021. However, data released after this assessment indicate the total number of opioid related overdose deaths increased from 2020 to 2021 67

Data Source: Massachusetts Department of Public Health (DPH), Data Brief: Opioid Related Overdose Deaths among Massachusetts Residents, 2020, 2021
65
Massachusetts Department of Public Health. (2021, November). Opioid-Related Overdose Deaths, All Intents, MA Residents – Demographic Data Highlights. https://www.mass.gov/doc/ opioid-related-overdose-deaths-demographics-november-2021/download
66
For more information on trends in the presence of fentanyl in the drug supply, see Massachusetts Department of Public Health. (2020 February). Data Brief: Trends in Stimulant-Related Overdose Deaths. https://www.mass.gov/doc/data-brief-trends-in-stimulant-related-overdose-deaths-february-2020/download
67 Bebinger, M. (2022 June 8). Overdose deaths reached a record high in Mass. during 2021. WBUR. https://www.wbur.org/news/2022/06/08/overdose-deaths-record-massachusetts-covid
134
Mental Health
The COVID-19 pandemic has had a severe impact on mental health.The charts below show a large difference between indicators of poor mental health before and during the pandemic Each survey used a slightly different question and approach to sampling, so results are not directly comparable. However, the trend reflects how deeply COVID has impacted mental health.
Data Point | In each of our communities, the proportion of respondents to the COVID 19 Community Impact Survey (CCIS) who reported poor mental health was 2 3 times higher compared to the proportion of respondents to the pre pandemic Behavioral Risk Factor Surveillance System Survey (BRFSS) who reported poor mental health

^ Data Source: Centers for Disease Control and Prevention (CDC) PLACES, 2021; Behavioral Risk Factor Surveillance System (BRFSS), 2019
^
Notes: For indicators at the community level, data were sourced from the CDC PLACES 2021 release, a dataset containing Census tract and city/town level estimates of health outcomes, preventive care, and health behavior indicators Estimates are modeled using BRFSS results extrapolated based on the demographic composition of the geographic area They are NOT direct survey results, so should be interpreted with caution. For indicators at the state level, data were sourced directly from the BRFSS Prevalence and Trends Tool, which provides direct estimates at the state level
* Data Source: Massachusetts Department of Public Health, COVID 19 Community Impact Survey (CCIS), Fall 2020
*
Notes: The CCIS was conducted online from September through November 2020 by the Massachusetts Department of Public Health The purpose of the survey was to understand the needs and experiences of populations that have been disproportionately impacted by the pandemic The survey was NOT designed to be fully representative of residents of a given community, so results should be interpreted with caution. White non Hispanic residents were overrepresented among survey respondents in Malden, Medford, and Somerville, but not in Everett Low income residents were underrepresented among survey respondents in all four communities The total sample size was over 33,000 residents (adults over age 25), including 156 from Everett, 319 from Malden, 322 from Medford, and 566 from Somerville
Data Point | In Everett, Malden, and Somerville, anxiety was the most commonly reported mental health concern among youth. In Everett, depression symptoms were more common among high schoolers than middle schoolers, while in Malden, depression
symptoms were slightly more common among middle schoolers. In Somerville, depression symptoms were reported by more than 1 in 3 high school students, a similar rate to the state average.
135
Data Source: 2019 Everett Student Health Survey (Grades 6 12); 2018 Malden Middle School and High School Health Surveys (Grades 7 12); 2020 Somerville High School Health Survey (Grades 9 12); 2019 Somerville Middle School Health Survey (Grades 6 8); 2019 Massachusetts High School Youth Risk Behavior Survey (CDC)
Notes: Anxiety was assessed differently in each community: in Everett and Malden, as the percentage of students who reported "feeling their life was somewhat or very stressful;" in Somerville, "feeling tense, nervous, or worried every day for 2 or more weeks in a row during the past 30 days " Depression was assessed similarly across Everett, Malden, Somerville (high school only), and Massachusetts (high school only), as the percentage of students who reported feeling "so sad or hopeless almost every day for 2 or more weeks in a row that they stopped doing some usual activities, during the past 12 months "
It is important to note that the Somerville High School Health Survey was conducted in Spring 2020, at the start of the pandemic, while the Middle School survey was conducted in 2019, prior to the pandemic The Everett and Malden surveys were conducted prior to the pandemic
Data Point | In Everett and Malden, the percentages of middle school students reporting self-harm or serious consideration of suicide were higher than among high school students. In Everett, the percentage of middle schoolers reporting a suicide attempt was slightly higher than among high schoolers. In Somerville, the percentages of middle school students reporting self harm, serious consideration of suicide, or a suicide attempt were lower than among high school students.

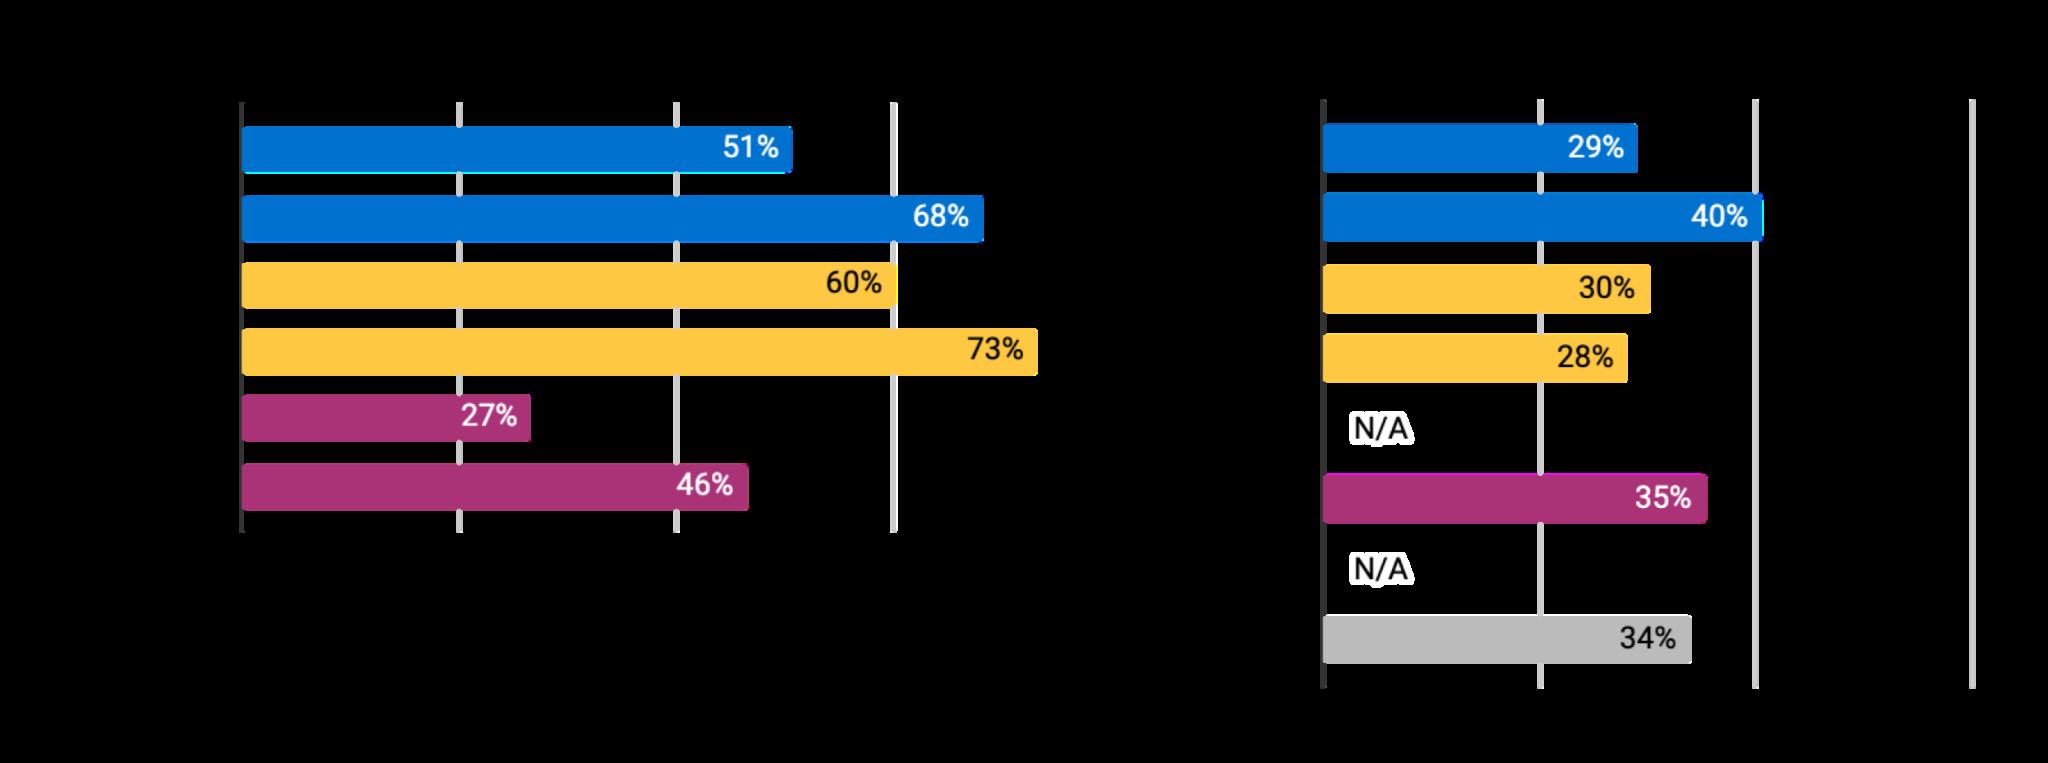
Data Source: 2019 Everett Student Health Survey (Grades 6 12); 2018 Malden Middle School and High School Health Surveys (Grades 7 12); 2020 Somerville High School Health Survey (Grades 9 12); 2019 Somerville Middle School Health Survey (Grades 6 8); 2019 Massachusetts High School Youth Risk Behavior Survey (CDC)
Notes: The 2019 Medford High School and Middle School Communities that Care Youth Survey did not assess these items. There is no Massachusetts Middle School Youth Risk Behavior Survey. The Massachusetts High School Youth Risk Behavior Survey did not include an item about self harm
136
Data Point | In Everett, Malden, and Somerville, the age adjusted rate of emergency department visits due to mental health is higher than the state rate When stratified by racial group, the emergency department visit rate is highest among White residents in Everett, Malden, and Medford, and among Black residents in Somerville. It is notable that rates of outpatient visits for mental health are lower in all of our communities compared to the statewide average.
Data Source: Center for Health Information and Analysis (CHIA), Massachusetts Acute Hospital Case Mix Database, 2016 2019 Notes: This indicator is based on ICD 10 diagnosis codes It includes mental and behavioral disorders due to psychoactive substance use, schizophrenia, mood disorders, stress disorders, other behavioral and emotional disorders, and Alzheimer disease and other neurodegenerative diseases It does not include suicidal thoughts or attempt Data are suppressed for counts less than 5. In Everett and Medford, there were fewer than 5 mental health outpatient visits for Asian residents, so rates were not calculated

137
Data Point | Compared to the state of Massachusetts overall, the 5 year average crude suicide mortality rate is lower in Everett, Medford, and Somerville, and comparable in Malden. Over time, the number of deaths due to suicide has fluctuated in our communities. From 2019 to 2020, capturing the first year of the COVID 19 pandemic, the number of suicide deaths increased in each of our communities, except for Malden.

Equity Lens | In Massachusetts overall, the age adjusted suicide mortality rate is highest among White non Hispanic residents, and lowest among Asian/Pacific Islander non-Hispanic residents. From 2019 to 2020, capturing the first year of the COVID-19 pandemic, suicide mortality increased among Hispanic and Asian/Pacific Islander residents, and declined among Black non Hispanic and White non Hispanic residents.

Data Source: Massachusetts Registry of Vital Records and Statistics, Selected Causes of Death, 2016 2020.
Notes: At the community level, numbers of deaths by year are displayed rather than rates, as the relatively small numbers of deaths due to suicide can make rates unstable Crude 5 year rates are displayed at the community level, as age adjusted rates could not be calculated due to data suppression for counts <5. Mortality rates by racial/ethnic group are not available at the municipal level due to small numbers Mortality rates at the state level are not available for racial/ethnic groups other than those identified in these charts due to small numbers

138
COVID-19
The COVID-19 pandemic reached the Greater Boston area in late March 2020. In the first several months of the pandemic, access to testing was limited, and community level data on cases and testing became available in stages Even with these limitations, trends in COVID 19 incidence and testing rates show differences across our communities.

Data Point | From the start of the pandemic through the peak of the omicron wave, COVID 19 incidence was consistently higher in Everett compared to Malden, Medford and Somerville Thereafter, incidence was highest in Somerville This change in reported incidence may be influenced by differences in access to testing, combined with the shift from laboratory based molecular testing (which is reported to the Massachusetts Department of Public Health) to at home rapid antigen testing (which is not reported). It does not necessarily indicate a true shift in the burden of COVID 19.
Data Source: Massachusetts Department of Public Health, COVID 19 Response Reporting Archives
Notes: Information on vaccination phases and eligibility can be found on the Massachusetts Department of Public Health’s COVID 19 Vaccine Information site: https://www.mass.gov/info details/massachusetts covid 19 vaccine information
Data Point | Since the start of the pandemic, COVID 19 testing rates have tended to be higher in Medford and Somerville compared to Everett and Malden. Across the Greater Boston region, many universities instituted routine testing programs for students, faculty, and staff. Since Tufts University is located in Medford and Somerville (with students residing in dorms and off campus housing in both cities), testing rates are influenced by these large scale programs Steep declines in testing rates during school break periods
139
reinforce the impact of university testing on city level trends Testing rates include only laboratory based molecular testing, not at home rapid antigen testing
Data Source: Massachusetts Department of Public Health, COVID 19 Response Reporting Archives
Notes: Information on vaccination phases and eligibility can be found on the Massachusetts Department of Public Health’s COVID 19 Vaccine Information site: https://www.mass.gov/info details/massachusetts covid 19 vaccine information
As COVID 19 vaccines became available in our communities, efforts grew to ensure equitable access and provide residents with accurate information about the vaccine As of April 2022, more than 75% of all residents in our communities were fully vaccinated, defined as having received two doses of a mRNAvaccine (Moderna or Pfizer) or one dose of the Johnson & Johnson vaccine
Data Source: Massachusetts Department of Public Health, Weekly COVID 19 Municipality Vaccination Data Archives

However, vaccination rates vary within our communities by racial/ethnic group and by age group.As ofApril 2022, children ages 0-5 were not yet eligible for COVID vaccination, so it is important to consider that differing age distributions within racial/ethnic groups in each community could influence the overall vaccination rate among that racial/ethnic group

140
Equity Lens | In Everett, Malden, and Medford, Black residents are less likely to be fully vaccinated compared to other racial/ethnic groups In Somerville, Hispanic residents are less likely to be fully vaccinated.

Equity Lens | In each community, children and youth are less likely than adults to be fully vaccinated, with the exception of 12 15 year olds in Somerville. Older adults tend to have the highest rates of vaccination, with the exception of older adults in Everett. 20 29 year olds in Everett and 16 19 year olds in Somerville have notably low vaccination rates, compared to their peer age groups in other communities
As COVID-19 variants emerge, it has become increasingly important to ensure access to booster or additional vaccine doses, beyond the definition of “full vaccination ”The data suggest continued disparities in rates of receiving one, two, or more booster doses by racial/ethnic group, which will be important to monitor and address as the COVID-19 pandemic evolves.
 Data Source: Massachusetts Department of Public Health, Weekly COVID 19 Municipality Vaccination Data Archives
141
While COVID 19 incidence and mortality rates are not available at the community level by racial/ethnic group or by age group from the Department of Public Health, state level data reinforce that the pandemic has had inequitable impacts in communities of color
Equity Lens | As of April 2022, the incidence of COVID 19 since the start of the pandemic is 2.6 times higher among Hispanic residents, and 1.5 times higher among Black residents, compared to White residents Risk of exposure to COVID 19 is higher among households with overcrowding, workers in service occupations, and other occupations in which Hispanic and Black residents are disproportionately represented.

Equity Lens | Older age is a leading risk factor for mortality due to COVID 19. Since there are proportionally more older adults among the White population in MA compared to other racial/ethnic groups, it is important to adjust for age in order to understand the burden of mortality that cannot be explained by age distribution alone The most recent age adjusted data available during the assessment considered COVID 19 mortality through August 2020 After accounting for age, mortality was over 3 times higher among Hispanic and Black residents in MA compared to White residents. Mortality was 30% higher among Asian residents.
 Data Source: Massachusetts Department of Public Health, COVID 19 Response Reporting Archives
Data Source: Melnik M, Raisz A, Pearlman J et al (December 18, 2020) Across Two Waves: COVID 19 Disparities in Massachusetts Boston Indicators.
Data Source: Massachusetts Department of Public Health, COVID 19 Response Reporting Archives
Data Source: Melnik M, Raisz A, Pearlman J et al (December 18, 2020) Across Two Waves: COVID 19 Disparities in Massachusetts Boston Indicators.
142
Priorities for CollaborativeAction
ACommunity Health NeedsAssessment includes the exploration and analysis of a great deal of data, resulting in many findings of importance to the community In order to build on strengths and channel limited resources equitably and strategically, we must make choices about how to prioritize efforts to improve community health CHAand our CommunityAdvisory Boards (CABs) engaged in a participatory and iterative process to prioritize the key issues that emerged from this assessment, and developed a set of Priorities for CollaborativeAction.68 In collaboration with the CABs and other partners, plans of action to address the priorities will be created during the Implementation Strategy planning phase of this process in Fall 2022 Winter 2023.The Implementation Strategy will guide collaborative action over the next three years.
The priorities are intended to be broad enough to be relevant across the communities of Everett, Malden, Medford, and Somerville, and to allow for the development of community specific strategies In addition to community health topics of concern, both CABs prioritized systemic equity issues that cut across multiple domains.Therefore, the CHAteam synthesized the assessment findings and the results of the CAB prioritization process into four priority focus areas and three equity principles. The priority focus areas define what will be addressed during the Implementation Strategy process, and the equity principles will guide how these focus areas will be addressed
Priorities for Collaborative Action
Implementation Strategy planning will focus on developing or supporting policies, programs, and practices that foster and promote three equity principles in four focus areas to improve the conditions that impact the health of the communities that CHAserves
Equity Principles
In advancing policies, programs, and practices, we will ensure our strategies embody these three equity principles and apply them in practice.
Language justice
We will apply a language justice lens in all our efforts. While many definitions of language justice exist, we consider the definition offered by Communities Creating Healthy Environments (CCHE): “Valuing language justice means recognizing the social and political dimensions of language and language access, while working to dismantle language barriers, equalize power dynamics, and build strong communities for social and racial justice ”69 The
68 For more information about the prioritization process, please see the Process and Methods: Prioritization section of this report, as well as Appendix I for further details.
69 Arguelles, P., Williams, S., Hemley-Bronstein,A. (n.d.) Language Justice Toolkit: Multilingual Strategies for Community Organizing. Communities Creating Healthy Environments. https://www.thepraxisproject.org/resource/ 2012/languagejustice
143
assessment process highlighted the critical importance of language justice in order to promote health equity.
Inclusion of under-represented voices in leadership and decision-making
In the development, implementation, and evaluation of strategies, we recognize the importance of centering the voices, leadership, and decision making power of people who are directly impacted by the issues any given strategy aims to address As emphasized throughout this assessment, such voices are frequently under represented in these processes We will intentionally shift power through the application of this equity principle
Environments that acknowledge unique stressors of diverse communities to promote collective care
We will design strategies that embody elements of collective care As discussed throughout this assessment, collective care has many definitions. One that offers a frame for this equity principle states: “Care is our individual and common ability to provide the political, social, material, and emotional conditions that allow for the vast majority of people and living creatures on this planet to thrive along with the planet itself. ”70 As we co develop strategies and plans of action, we will consider how our efforts can best foster caring environments.This means considering the stressors that impact diverse communities, and intentionally designing systems that promote collective care and ability to thrive
FocusAreas
The four focus areas will be addressed through regional and/or community specific strategies
The partners and coalitions with which CHAis engaged offer existing expertise, strategic efforts, and leadership in many of these focus areas CHA’s contributions as a healthcare and community health institution in addressing these focus areas will vary, as will its role in leading, facilitating, partnering, or supporting strategies.
Affordable, Stable, and Safe Housing
Our priority is to ensure that all people, especially those closest to the impact of historical and present day housing discrimination, can thrive physically, mentally, and socially in healthy housing Through programs, policies, and systems approaches, this means addressing concerns such as affordability, stability and anti displacement, safety, accessibility (e g for older adults and persons with disabilities), as well as homelessness and transitions to stable housing.
Equitable Economies
Our priority is to ensure that all people have the economic resources and support they need to thrive through all stages of life. We recognize the impact of economic systems that exploit
70 Rottenberg, C. and Segal, L. (n.d.) What is Care? The Care Collective. https://www.gold.ac.uk/ goldsmiths-press/features/what-is-care/ For further reading, see The Care Manifesto: The Politics of Interdependence, published September 2020.
144
lower income communities and communities of color for purposes that do not reflect their own priorities.Through programs, policies, and systems approaches, this means addressing concerns related to sustainable food systems, local jobs with living wages and benefits, healthy working conditions, and caregiving systems.
Equity and access to care, services and information
Our priority is to ensure that people receive the care, services, and information they need, regardless of who they are, how much money they have, or what neighborhood they live in. This priority encompasses healthcare (including mental healthcare) as well as other essential services and information, such as education, economic development opportunities, financial supports, legal services and advocacy, and more.This means addressing elements such as costs, cultural and linguistic barriers, navigation of systems, referral systems, adequate staffing, transportation, digital access, quality, disability, and other aspects of accessibility
Climate health and justice
Our priority is to ensure that our communities are resilient to the impacts of climate change, and that our efforts promote environmental justice and mitigate further contributions to climate change.This means addressing concerns related to air quality, water quality, and climate change preparedness We recognize the health impacts of climate change and exposure to environmental hazards are disproportionately shouldered by low income communities and communities of color. Strategies to address this priority must be developed with an equity lens
Next Steps
During Fall 2022 Winter 2023, CHAwill develop an Implementation Strategy (IS) in collaboration with CommunityAdvisory Board members, stakeholders, and community residents The Implementation Strategy will outline next steps to address the prioritized health needs from the assessment The Implementation Strategy development process will culminate with an initial set of goals, objectives, and strategies within each priority focus area, using the equity principles as a guide Afinal Implementation Strategy report will follow
145
Authors and Editors
The 2022 CHARegional Wellbeing Report was authored by the members of the Health ImprovementTeam, part of the Department of Community Health Improvement at CHA.
Renée Cammarata Hamilton, MSW, MPA Jean Granick, MS Laura McNulty, MPH, MSW Ryann Monteiro, MPH, CHES Kathleen O’Brien, MA
The report benefited from the editing support and expertise of Elaine Tsao, MPH; Doug Kress, MPP; and Kathleen Betts, MPH We express our thanks to Lexi Ladd, MPH and Luke Deems for their graphic design contributions
Acknowledgements
This assessment has been deeply collaborative, involving the participation, commitment, and expertise of many people in our communities. Cambridge HealthAlliance thanks all those who informed this process and made it possible to lay the groundwork for collective action.
We acknowledge with gratitude the dedicated guidance and support of institutional partners These include Beth Israel Lahey Health, especially MountAuburn Hospital; the Department of Dental Medicine and Oral Health at Cambridge HealthAlliance; Health Resources inAction; Mass General Brigham, especially Massachusetts General Hospital; the MetropolitanArea Planning Council (MAPC); the North Suffolk Public Health Collaborative; and theTisch College Community Research Center atTufts University
We thank the dedicated community researchers, interns, and volunteers who contributed invaluably to this assessment. By conducting focus groups and interviews, promoting and administering surveys, collecting and analyzing data, creating ancillary materials, and engaging members of the community, these individuals actualized the vision for the assessment process We extend our gratitude to:
Siyu Chen,Tufts University School of Medicine; Kathryn Morris,Tufts University School of Medicine; Alan Mozaffari, HarvardT.H. Chan School of Public Health; Jenna Novy, Boston University School of Public Health; Karun Rajesh, Harvard Data Science Initiative; Emily Reckard-Mota, Community Researcher; Maria Lourdes Silva, Community Researcher; Elaine Tsao, HarvardT.H. Chan School of Public Health; and Abigail Zielinski,Tufts University.
We thank each CommunityAdvisory Board member, interviewee, focus group participant, and survey participant Your invaluable feedback and individual perspectives will contribute to the shaping of community health improvement in the communities that Cambridge HealthAlliance is proud to serve.
146
Glossary ofTerms
Collective care. Aconcept of care rooted in the perspectives, practice, and movement building of Black feminists, disability justice advocates, queer organizers, and Indigenous peoples One definition of this concept is: “Collective care is seeing others' well being as a shared responsibility of the group.”
Billing, L et al (2022) Creating and maintaining a culture of self and collective care at Raising Voices Sexual Violence Research Initiative: Pretoria, South Africa https://raisingvoices org/resources/culture of self and collective care at raising voices/
Economic and Educational Environment One of the three domains in theTHRIVE framework, also referred to as the Equitable Opportunity domain It includes factors such as living wages, local wealth, and education opportunities.
Prevention Institute (n d ) THRIVE: Tool for Health & Resilience in Vulnerable Environments https://www preventioninstitute org/tools/thrive tool health resilience vulnerable environments
Environmental justice. The principle that all people have a right to be protected from environmental hazards and to live in and enjoy a clean and healthful environment It involves the equal protection and meaningful involvement of all people with respect to the development, implementation, and enforcement of environmental laws, regulations, and policies and the equitable distribution of environmental benefits.
Commonwealth of Massachusetts, Executive Office of Energy and Environmental Affairs https://www mass gov/environmental justice
Equity vs Equality Equity recognizes that each person has different circumstances and needs, meaning different groups of people need different resources and opportunities allocated to them in order to thrive Equity acknowledges that racism and other forms of oppression systematically disadvantage marginalized groups, rendering differences in need Equality, on the other hand, means giving everyone the exact same resources, regardless of an individual’s or group’s actual needs or the opportunities and resources already provided to them or not provided to them
United Way of National Capital Area (2021, June 22) Equity vs Equality: What’s The Difference Examples & Definitions https://unitedwaynca org/blog/equity vs equality/
Health disparity. Aparticular type of health difference that is closely linked with social, economic, and/or environmental disadvantage Health disparities are systematic, unust, and avoidable, may arise from discrimination or marginalization, and are likely to reinforce social disadvantage and vulnerability
U.S. Department of Health and Human Services. Healthy People 2030. Health Equity in Healthy People 2030. https://health gov/healthypeople/priority areas/health equity healthy people 2030; Braveman, P et al (2011 December) Health Disparities and Health Equity: The Issue Is Justice American Journal of Public Health https://ajph aphapublications org/doi/10 2105/AJPH 2010 300062
Health equity Health equity means that everyone has a fair and just opportunity to be as healthy as possible.This requires removing obstacles to health such as poverty, discrimination, and their consequences, including powerlessness and lack of access to good jobs with fair pay, quality education and housing, safe environments, and health care.
Braveman, P (2017) A New Definition Of Health Equity To Guide Future Efforts And Measure Progress Health Affairs https://www healthaffairs org/do/10 1377/forefront 20170622 060710/
Health outcomes. Health outcomes reflect the physical and mental well being of residents within a community through measures representing not only the length of life but quality of life as well
County Health Rankings (2022) Health Outcomes https://www countyhealthrankings org/explore health rankings/ measures data sources/county health rankings model/health outcomes
147
Incidence. In epidemiology, a measure of the number of new cases of a disease or condition that develop in a population over a specified time period
Incidence Rate Ratio (IRR) In epidemiology, a measure of the relative rate in which new cases emerge in one group compared to a reference group It is calculated by dividing the incidence rate for the comparison group by the incidence rate for the reference group.
Intersectionality. Aconceptual frame for understanding how people’s multi dimensional identities (e g gender, race) shape the specific ways in which individuals and groups experience bias and discrimination Krenshaw, C and Harris, L (n d ) A primer on intersectionality African American Policy Forum https://www aapf org/publications
Language justice. Valuing language justice means recognizing the social and political dimensions of language and language access, while working to dismantle language barriers, equalize power dynamics, and build strong communities for social and racial justice
Arguelles, P , Williams, S , Hemley Bronstein, A (n d ) Language Justice Toolkit: Multilingual Strategies for Community Organizing Communities Creating Healthy Environments https://www thepraxisproject org/resource/2012/languagejustice
Misclassification bias. Atype of systematic error that can occur when research participants are categorized into an incorrect category
Natural and Built Environment. One of the three domains in theTHRIVE framework, also referred to as the Place domain It includes factors such as green space, air and water, land use, transportation infrastructure, housing stock, and the retail environment Prevention Institute. (n.d.). THRIVE: Tool for Health & Resilience in Vulnerable Environments. https://www preventioninstitute org/tools/thrive tool health resilience vulnerable environments
Non response bias Atype of systematic error that can occur when research participants who do not respond to a survey or study activity are meaningfully different from those who do respond
Prevalence. In epidemiology, a measure of the number of cases of a disease or condition in a population in a specified time period, regardless of when the disease or condition first developed.
Primary data Data collected firsthand by the researcher for a specific study or project, using methods like surveys, focus groups, interviews, or experiments. Primary data can be quantitative or qualitative.
Probability sampling. In research, a method of selecting individuals from a population using random selection, such that every individual in the population has an equal likelihood of being selected.
Public charge Refers to the U S federal criteria for determining if an immigrant is likely to become a “public charge,” or unable to support themselves without government assistance. Not all immigrants are subject to this rule However, use of certain cash benefits, such as SSI,TAFDC or EAEDC, may disqualify an immigrant from lawful permanent residency (a Green Card) under the Public Charge rule
U.S. Department of Homeland Security. (2022, September 8). DHS Publishes Fair and Humane Public Charge Rule. https://www dhs gov/news/2022/09/08/dhs publishes fair and humane public charge rule
Qualitative data. Atype of data that describes characteristics or concepts using words Qualitative data are used to answer questions like “why?” or “what meaning?”
148
Quantitative data. Atype of data that can be counted or measured using numbers Quantitative data are used to answer questions like “how much?” or “how many?”
Recall bias Atype of systematic error that occurs when research participants do not remember past events, experiences, or behaviors accurately
Sampling frame In research, the set of individuals within a population from which samples are selected
Secondary data. Data or information collected by others and made readily available for other research purposes Examples of secondary data include demographic statistics, public health data sets, economic statistics, and reports or narratives Secondary data can be quantitative or qualitative
Social and Cultural Environment One of the three domains in theTHRIVE framework, also referred to as the People domain It includes factors such as patterns of civic engagement and public participation, social norms and cultures, social networks, and trust Prevention Institute (n d ) THRIVE: Tool for Health & Resilience in Vulnerable Environments https://www preventioninstitute org/tools/thrive tool health resilience vulnerable environments
Social desirability bias. Atype of response bias that occurs when participants tend to respond to research questions in a way that conforms to societal expectations, due to stigma or pressure, rather than in a way that reflects their true beliefs, experiences, or behaviors
Social Determinants of Health The conditions in the environments where people are born, live, learn, work, play, worship, and age that affect a wide range of health, functioning, and quality of life outcomes and risks.
U.S. Department of Health and Human Services. Healthy People 2030. Social Determinants of Health. https://health gov/healthypeople/priority areas/social determinants health
Standardized Incidence Ratio (SIR).Ameasure used to describe how the observed number of new cases of a disease in a small population compares to what would be expected, based on the distribution of demographic characteristics (e g sex and age) in the small population, and the corresponding group specific incidence rates of a larger comparison population. SIRs are often used to determine if the occurrence of cancer in a small population is high or low relative to a comparison
Stratification. In epidemiology, a method of separating data or observations into distinct groups (strata) based on a variable that may confound the association between an exposure and outcome, in order to understand statistical differences between groups
Structural racism.Asystem in which public policies, institutional practices, cultural representations, and other norms work in various, often reinforcing ways to perpetuate racial group inequity It identifies dimensions of our history and culture that have allowed privileges associated with “whiteness” and disadvantages associated with “color” to endure and adapt over time.
The Aspen Institute Roundtable on Community Change (2004, June) Structural Racism and Community Building https://www aspeninstitute org/wp content/uploads/files/content/docs/rcc/aspen structural racism2 pdf
Xenophobia Astructural form of discrimination in which individuals are denied equal rights on account of their real or perceived country of origin, or on account of values, beliefs, or practices that are associated with “foreigners” or “outsiders ” Xenophobia may also manifest as interpersonal discrimination
UN Special Rapporteur on contemporary forms of racism, racial discrimination, xenophobia and related intolerance (2016, May 13) Report to the UN Human Rights Council https://undocs org/A/HRC/32/50
149
Appendices
Appendix A Community Advisory Board Membership
Appendix B Organizations Involved in Primary Data Collection & Analysis
Appendix C CHA Regional Wellbeing Assessment & Improvement Framework
Appendix D Complementary CHNA Reports in CHA Primary Service Area
City of Cambridge Community HealthAssessment (2020)
North Suffolk Community Health NeedsAssessment (2022)
Appendix E Data Collection Methods and Tools
Includes the CHACommunity Wellbeing Survey, the focus group and interview guides used during the assessment, the complete primary data collection and analysis protocol, and the list of secondary data sources.
Appendix F Primary Data Results
Includes the complete results of the CHACommunity Wellbeing Survey, provided as a set of frequency tables; and the results of focus groups and interviews, provided as qualitative themes reports
Appendix G Secondary Data Results
Includes Community Data Profiles for each of the eight communities in CHA’s primary service area, as well as a consolidated data book in spreadsheet format.
In addition, the CHAHealth ImprovementTeamTableau Public site provides data visualizations for selected topics: https://bit ly/CHA Community Health Tableau Public
Appendix H Summary Products
Includes two page overviews of assessment findings and slide decks containing primary and secondary data findings, for Everett & Malden and for Medford & Somerville.
Appendix I Prioritization Process
150
AppendixA: CommunityAdvisory Board Membership
Everett & Malden CommunityAdvisory Board (CAB)
EdwinArgueta, La Comunidad, Inc + One Everett
Deirdre (Dee) Campbell, MASeniorAction Council + Friends of Fellsmere Heights
Karen Colón Hayes, Malden City Council
Peg Crowe, MaldenYWCA
Rev. Myrlande DesRosiers, Everett Haitian Community Center
Erin Deveney, City of Everett, Mayor’s Office
Peter Finn, City of Malden, Health Department
Sabrina Firicano, City of Everett, Health Department
Josee Genty, Everett Healthy Neighborhood Study
Samantha Lambert, Everett Community Growers
Matt Lattanzi, City of Everett, Department of Planning and Development
Jaime Lederer, Cambridge HealthAlliance
Marcia Manong, Bread of Life
Lenka McNally, Everett Community Growers
Caitlin Middaugh, Mystic ValleyYMCA
Shawn Middleton, Mystic Valley Elder Services
Antoinette Octave Blanchard, City of Everett, Health Department
Liliana Patino, Eliot Family Resource Center
Lucy Pineda, Latinos Unidos en Massachusetts (LUMA)
Alex Pratt, City of Malden, Office of Strategic Planning and Community Development
Jodaelle Racine, Everett Haitian Community Center
Lauren Reid, Mystic Valley Elder Services
Heather Van Orman, Housing Families, Inc
Cathy Viveiros, Joint Committee for Children's Healthcare in Everett
Rana Wehbe, City of Everett, Health Department
JulieAnn Whitson, Everett Public Schools
151
Medford & Somerville CommunityAdvisory Board (CAB)
Anna Bury, City of Medford, Office of Prevention and Outreach
Winki Chan,The Welcome Project
Virginia Chomitz,Tufts University School of Medicine
Nomi Davidson, Somerville Public Schools / Somerville Family Learning Collaborative
Mary DeCourcey, MountAuburn Hospital
Eileen Dern, MelroseWakefield Healthcare /TuftsMedicine
Alissa Ebel, City of Somerville, Office of FoodAccess and Healthy Communities
Nicole Eigbrett, CommunityActionAgency of Somerville (CAAS)
Sharmy Ertilien, Medford resident
Annie Fowler, Somerville Cambridge Elder Services
Penelope Funiole, City of Medford, Office of Prevention and Outreach
Doug Kress, City of Somerville, Department of Health and Human Services
Mike Libby, Somerville Homeless Coalition
MaryAnn O’Connor, City of Medford, Health Department
Emily Reckard-Mota, Community Researcher
Lisa Robinson, City of Somerville, Office of Food Access and Healthy Communities
Laura Rotolo, Medford resident and civil rights advocate
Maria Lourdes Silva, Community Researcher
152
Appendix B: Organizations Involved in Data Collection &Analysis
American Association for Arab Women
Bread of Life
City of Everett City of Malden
City of Somerville Department of Health & Human Services
City of Somerville Offices of: American
Rescue Plan Act; Food Access & Healthy Communities; Housing Stability; Immigrant Affairs/SomerViva; Sustainability & Environment
Community Action Agency of Somerville (CAAS)
Eliot Family Resource Center
Everett Community Aid Network (ECAN)
Everett Community Growers
Everett Haitian Community Center
Groundwork Somerville
Healthy Neighborhood Study
Housing Families, Inc
Joint Committee for Children’s Healthcare in Everett
Just A Start
La Comunidad, Inc.
Latinos Unidos en Massachusetts (LUMA)
MA Alliance of Portuguese Speakers (MAPS)
MA Senior Action Council
Malden Housing Authority
Malden Neighbors Helping Neighbors
Malden Public Schools
Malden Senior Center
Malden Warming Center
Malden’s Promise
MaldenCORE
Medford Adult Day Health Center
Medford Food Security Taskforce
Medford Health Department
Medford Health Matters
Medford Human Rights Commission
Medford Mass in Motion
Mutual Aid Medford & Somerville (MAMAS)
Mystic Housing Development
Mystic Valley ABCD
Mystic Valley Elder Services
Mystic Valley YMCA
One Everett Coalition Project Soup
Sanctuary United Church of Christ
Somerville Center for Adult Learning & Education (SCALE)
Somerville Community Corporation (SCC)
Somerville Family Learning Collaborative Somerville Homeless Coalition
Somerville Public Schools
Somerville Renters Group (CAAS)
Somerville Cambridge Elder Services
TEASA
The Growing Center The Welcome Project YWCA of Malden
153