Cambridge University Press & Assessment is a department of the University of Cambridge.
We share the University's mission to contribute to society through the pursuit of education, learning and research at the highest international levels of excellence. www.cambridge.org
This publication is in copyright. Subject to statutory exception and to the provisions of relevant collective licensing agreements, no reproduction of any part may take place without the written permission of Cambridge University Press & Assessment.
First published 2021 Second Edition 2025
20 19 18
Cover designed by Loupe Studio Text designed by Shaun Jury Typeset by QBS Learning
Printed in Singapore
A catalogue record for this book is available from the National Library of Australia at www.nla.gov.au
ISBN 978-1-009-65965-9
Additional resources for this publication at www.cambridge.edu.au/GO
Reproduction and Communication for educational purposes
The Australian Copyright Act 1968 (the Act) allows a maximum of one chapter or 10% of the pages of this publication, whichever is the greater, to be reproduced and/or communicated by any educational institution for its educational purposes provided that the educational institution (or the body that administers it) has given a remuneration notice to Copyright Agency Limited (CAL) under the Act.
For details of the CAL licence for educational institutions contact:
Copyright Agency Limited Level 12, 66 Goulburn Street
Sydney NSW 2000
Telephone: (02) 9394 7600
Facsimile: (02) 9394 7601
Email: memberservices@copyright.com.au
Reproduction and Communication for other purposes
Except as permitted under the Act (for example a fair dealing for the purposes of study, research, criticism or review) no part of this publication may be reproduced, stored in a retrieval system, communicated or transmitted in any form or by any means without prior written permission. All inquiries should be made to the publisher at the address above.
Cambridge University Press & Assessment has no responsibility for the persistence or accuracy of URLs for external or third-party internet websites referred to in this publication and does not guarantee that any content on such websites is, or will remain, accurate or appropriate. Information regarding prices, travel timetables and other factual information given in this work is correct at the time of first printing but Cambridge University Press & Assessment does not guarantee the accuracy of such information thereafter.
Please be aware that this publication may contain images of Aboriginal and Torres Strait Islander people who are now deceased. Several variations of Aboriginal and Torres Strait Islander terms and spellings may also appear; no disrespect is intended. Please note that the terms ‘Indigenous Australians’ and ‘Aboriginal and Torres Strait Islander Peoples’ may be used interchangeably in this publication.
Cambridge University Press & Assessment acknowledges the Aboriginal and Torres Strait Islander Peoples of this nation. We acknowledge the traditional custodians of the lands on which our company is located and where we conduct our business. We pay our respects to ancestors and Elders, past and present. Cambridge University Press & Assessment is committed to honouring Aboriginal and Torres Strait Islander Peoples’ unique cultural and spiritual relationships to the land, waters and seas and their rich contribution to society.
UNCORRECTEDSAMPLEPAGES
How to use this resource
Elements in the print book
Glossary
Definitions of key terms are provided next to where the key terms first appear in the chapter.
Explore!
Students are encouraged to conduct research online to find and interpret information.
Quick check
These provide quick checks for recalling facts and understanding content. Cognitive verbs appear in bold. These questions can be completed in the Interactive Textbook or downloaded as Word documents.
Section questions
Learning goals
These are descriptions of what the student will learn throughout the section.
Did you know?
These are short facts that contain interesting information.
Science inquiry
These are recent developments in the particular area of science being covered. They may also show how ideas in science have changed over the years through human discovery and inventions.
UNCORRECTEDSAMPLEPAGES
Question sets at the ends of sections are categorised under five headings: Remembering, Understanding, Applying, Analysing and Evaluating. Cognitive verbs appear in bold. These questions can be completed in the Interactive Textbook or downloaded as Word documents.
Try this
Classroom activities help explore concepts that are currently being covered.
Making thinking visible
Visible-thinking-style classroom activities help consolidate the concepts currently being covered.
Practical
These activities focus on developing science inquiry skills, including using laboratory equipment. These activities are also available as Word document downloads in the Interactive Textbook.
End-of-chapter features
Chapter review
Chapter checklist
Success criteria
Linked questions
2.1 I can recall the components that make up the structure of DNA and RNA molecules. 6, 13
2.1 I can describe the relationship between genes, DNA and chromosomes. 1
2.1 I can describe the steps in which DNA is used to synthesise proteins.7, 18
2.2 I can recall the steps involved in DNA replication. 3, 4, 15
2.2 I can describe the stages of cell division in mitosis. 17
2.2 I can describe the stages of cell division in meiosis. 17
2.2 I can use a karyotype to determine information about an individual.10
2.3 I can define the terms ‘homozygous’, ‘heterozygous’, ‘dominant’ and ‘recessive’ with respect to genetic inheritance. 5
2.3 I can use and interpret a Punnett square to identify possible genotypes and phenotypes of offspring. 20, 23
2.3 I can explain sex linkage. 11, 19
2.3 I can distinguish between codominance and incomplete dominance.22
2.3 I can use a pedigree diagram to determine the type of inheritance that is occurring. 19
2.4 I can explain the different types of mutations, including their causes and effects. 16
2.4 I can describe some ways in which DNA can be manipulated. 25
Data questions
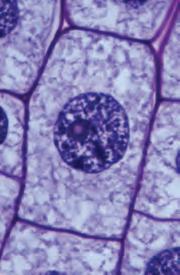
A student prepared an onion root tip slide and examined the cells using a light microscope. She recorded the number of cells in each stage of the cell cycle.
The table shows her results.
Remembering
of cell cycleNumber of cells recorded
1. State the name of the position on a chromosome where a particular gene is located.
2. Recall two autosomal recessive inheritable traits.
3. Recall the name of the enzyme that unwinds the DNA double helix during DNA replication.
4. Name the structure formed when DNA condenses and becomes visible before cell division.
5. Define the terms ‘homozygous’, ‘heterozygous’, ‘dominant’ and ‘recessive’.
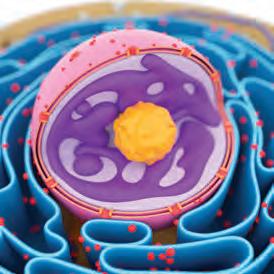
6. Identify the parts of the nucleotide in the following figure.
Table 2.6 Number of onion cells in each stage of the cell cycle
7. State the location in the cell where transcription and translation occur.
Chapter checklists help students check that they have understood the main concepts and learning goals of the chapter.
Chapter review question sets are categorised under five headings: Remembering, Understanding, Applying, Analysing and Evaluating. These questions can be completed in the Interactive Textbook or downloaded as Word documents.
UNCORRECTEDSAMPLEPAGES
8. State how many chromosomes you would expect to find in:
She then calculated the mitotic index for different areas of the root tip. The graph shows her results.
a) a human somatic cell
b) a human gamete
c) a human somatic cell with Down syndrome.
1. The mitotic index of dividing tissue is calculated with the following
Calculate the mitotic index of the tissue shown in the
2. The duration of any phase of the cell cycle can be calculated with the following formula:
Phase
(minutes) = × number of cells seen in that phase total number of cells seen cell cycle duration of the organism.
The cell cycle duration for the onion is 24 hours.
Calculate the duration of metaphase.
3. Identify the trend shown in the graph.
4. Extrapolate the data in the graph to estimate the mitotic index of the cells found 2 mm from the root tip.
Data questions help students apply their understanding, as well as analyse and interpret different forms of data linked to the chapter content. These questions can be completed in the Interactive Textbook or downloaded as Word documents.
STEM activities encourage students to collaboratively come up with designs and build solutions to real-world problems and challenges.
Links to the Interactive Textbook (ITB)
VIDEO
These icons indicate that there is a video in the Interactive Textbook.
WIDGET
These icons indicate that there is an interactive widget in the Interactive Textbook.
These icons indicate worksheets, activities or question sets can be downloaded from the Interactive Textbook. DOC
Overview of the Interactive Textbook
QUIZ
Automarked quizzes can be found in the Interactive Textbook for every section.
SCORCHER
Competitive questions can be found in the Interactive Textbook for every chapter review.
These icons indicate questions can be completed in workspaces in the Interactive Textbook.
The Interactive Textbook (ITB) is an online HTML version of the print textbook, powered by the Edjin platform. It is included with the print book or available as a separate digital-only product.
Definitions pop up for key terms in the text.
Quizzes contain automarked questions that enable students to quickly check their understanding.
Videos summarise, clarify or extend student knowledge.
Widgets are accompanied by questions that encourage independent learning and observations.
Practicals are available as Word document downloads, with sample answers and guides for teachers in the Online Teaching Suite.
SAMPLEPAGES
Worksheets are provided as downloadable Word documents.
Workspaces enable students to enter working and answers online and to save them. Input is by typing, handwriting and drawing, or by uploading images of writing or drawing.
Self-assessment tools enable students to check answers, mark their own work and rate their confidence level in their work.
Student accounts can be linked to the learning management system used by the teacher in the Online Teaching Suite.
UNCORRECTEDSAMPLEPAGES
Overview of the Online Teaching Suite (OTS)
The Online Teaching Suite (OTS) is automatically enabled with a teacher account and is integrated with the teacher’s copy of the Interactive Textbook. All the assets and resources are in one place for easy access.
The features include:
•the Edjin learning management system with class and student analytics and reports, and communication tools
•teacher’s view of students’ working and self-assessment
• chapter tests and worksheets as PDFs and as editable Word documents with answers
•editable curriculum grids and teaching programs
• teacher notes (including suggested responses if relevant) for Practicals, Try this, Making thinking visible, Explore! and STEM activities
• adaptive tools, including ready made pre- and post-tests and intuitive reporting.
Chapter 1 Science inquiry skills
Introduction
When conducting their experiments and investigations, scientists employ a rigorous and systematic approach, commonly referred to as the scientific method. This year, you will explore potential causal relationships between experimental variables. To establish causation, scientists must substantiate their claims with scientific evidence. The scientific method serves as a reliable guide, enabling scientists to conduct effective experiments while remaining mindful of the ethical implications of their work.Uncorrected 2nd sample
UNCORRECTEDSAMPLEPAGES
Questioning and predicting
• Proposing investigable questions
• Making predictions
• Defining variables
Chapter map
The scientific method is a framework for research.
and conducting
• Digital tools
• Safety and ethics
• Minimising error
• Calculating central tendency
• Scientific notation
• Displaying data
• Interpreting data
and communicating
• Line of best fit
• Trends in data
• Extrapolation
• Evaluating methods
• Writing a conclusion
• Primary and secondary sources
UNCORRECTEDSAMPLEPAGES
Curriculum
Propose
UNCORRECTEDSAMPLEPAGES
1.1 Questioning and predicting
Learning goals
At the end of this section, I will be able to:
UNCORRECTEDSAMPLEPAGES
1. Outline the different stages of the scientific method.
2. Identify and differentiate between independent, dependent and controlled variables in an experiment.
3. Propose investigable questions and make predictions.
review of the scientific method
The scientific method is a structured process that scientists use to explore questions and test hypotheses. While various approaches exist, they all begin with observing the world and asking questions.
As you learned in year 7 science, the scientific method is essential for exploring questions and testing hypotheses. This section will recap the key steps, including making observations, drawing inferences and developing research questions.
Quick check 1.1
1. Sequence these steps in the order in which they should be done.
1. Test the hypothesis in an experiment.
2. Gather data.
3. Observe and ask questions.
4. Do background research.
5. State a hypothesis.
6. Analyse the data.
7. Evaluate the data.
8. Make a conclusion.
2. Define these terms:
a) independent variable
b) dependent variable
c) controlled variables
3. Recall what a hypothesis must contain.
Step 1: observe and ask questions
The scientific method starts with observations, by which scientists gather information using their senses. Observations can include statements such as:
• The track is smooth.
• The athlete jumped high.
• The crowd cheered loudly.
Inferences connect observations to prior knowledge, providing explanations. For instance, from the observation of an athlete jumping high, one might infer that their height contributes to their performance. This leads to research questions like:
• Does height influence jump length?
• Can training improve jump distance?
WORKSHEET
Identifying variables and hypotheses
inference to link an observation with past knowledge and assign meaning to the observation
11. Write a conclusion
Summarise your findings and determine if your hypothesis was supported. For example, you might conclude that increased height is associated with longer jump distances, which could lead to further investigations into how other factors, such as leg strength, influence jumping ability.
10. Evaluate the method
Discuss the reliability of your results. If you notice inconsistencies, consider factors like fatigue or technique that could affect jump distance and suggest improvements for future experiments.
9. Describe patterns in the data
Analyse the data to find trends. You might find that taller participants consistently jump farther than shorter participants, supporting your hypothesis.
8. Process and present data
Create graphs that show the average jump distance against the height of each participant. This visual representation will help identify any trends in the data.
1. Observe and ask questions
You notice that some athletes jump farther than others. You ask, ‘Does a person’s height affect how far they can jump?’
UNCORRECTEDSAMPLEPAGES
7. Collect data
Measure and record the jump distance of each participant after they jump three times. Calculate the average distance for each individual to ensure accuracy.
2. Do background research
Professional scientists generally use peer-reviewed journal articles to see what other scientists in the past have found out and experiments that have been done. You research the relationship between height and jump distance and discover that taller individuals often have longer leg lengths, which can contribute to greater jumping ability.
3. Identify the variables
• Independent variable: height of the person (measured in centimetres)
• Dependent variable: distance of the jump (measured in metres)
• Controlled variables: type of jump (e.g. long jump), surface type and weather conditions.
peer review to read, check and give an opinion about something that has been written by another scientist or expert working in the same subject area
UNCORRECTEDSAMPLEPAGES
6. Manage safety risks and ethics
Identify potential hazards, such as uneven ground or obstacles in the jumping area. Ensure the jumping surface is safe and that participants are warmed up before jumping. In addition to safety, consider ethical aspects such as obtaining informed consent from all participants, especially if they are minors.
4. State a hypothesis and make a prediction
Your hypothesis might be: ‘If a person’s height increases, then their jump distance will also increase’. You predict that for every 10 cm increase in height, jump distance will increase by approximately 0.5 metres.
5. Outline the method and equipment needed
You will need measuring tape, a jump mat and a group of participants with varying heights. Ensure each participant jumps from the same position to maintain consistency.
causation when a change in one variable directly causes a change in another variable correlation a relationship between two variables, for which a change in one variable is associated with a change in another variable, but it does not mean that one causes the other investigable question
a research question that can be answered through completing an experiment
primary source
a first-hand record or account
secondary source a second-hand account; a source that summarises, analyses or interprets primary sources
fair test an experiment in which all variables are kept constant except for the independent variable being tested variable a factor or condition that can be controlled, changed or measured in an experiment independent variable the variable that is deliberately changed during an experiment dependent variable the variable that is measured during an experiment (as it responds to the independent variable)
Asking research questions
Consider an observation that some people perform better in long jump than others. This leads to inferences about various factors that might contribute to these differences, such as physical fitness, height, technique or experience. However, to determine causation rather than correlation, you need to ask specific questions. For example: Why do some individuals consistently achieve greater distances in long jump?
UNCORRECTEDSAMPLEPAGES
This inquiry suggests that certain attributes or conditions may influence jumping ability. To explore this causal relationship further, you can formulate investigable questions such as:
• Are taller people better long jumpers?
• How does age affect jumping performance?
• What impact does strength training have on jumping ability?
These investigable questions can be tested through scientific investigation, allowing for meaningful analysis based on data.
Step 2: do background research
In year 7, you learned about the types of observations and inferences that can be used to formulate questions about the world around you. Once a research question has been decided on, it is important that scientists do some background research to identify what similar questions have already been answered by other scientists.
Scientists might review some primary sources of information. These might be data or information that were generated by a researcher or that the researcher collected directly from observations and surveys. Primary sources of information are a first-hand record or account of information.
Secondary sources of information are more likely to be reviewed in background research and summarise, analyse or interpret primary sources. When scientists refer to secondary sources of information, they have access to the research and questions that have been answered all over the world. However, when accessing secondary sources of information, particularly those on the internet, it is important that the credibility of sources is evaluated. In year 7, you did this using the CRAAP test. When using secondary sources of information to aid the background research to your own research question, it is essential that you cite the source of the secondary information. This not only keeps a record of where the original data or information came from, but it also acknowledges the original owners of the work. A scientist can quote, review and discuss the findings and ideas of another researcher. However, when it comes to publishing data, images or text exactly as they were presented in a primary or secondary source, it is most likely that permission must be sought from the original owners of the work.
Step 3: Identify the variables
Once the research question has been determined, a scientist can begin to design the experiment to answer the question. For an experiment to be a considered a fair test, only one thing in the experiment should be changed and one thing measured. The things that are changed and measured are called variables
For example, in the research question ‘Does a person’s height affect how far they can jump in long jump?’:
• the variable being changed is the height of the person. This is the independent variable
• the variable being measured is the distance of their jump. This is the dependent variable.
In an experiment, we want to know if a change in the independent variable causes a change in the dependent variable. To show that the height of a person influences the distance of a long jump, all
other variables must be kept the same. These might include using the same long jump pit and the same tape measure, as well as completing the jump in the same weather conditions. These are the controlled variables. Failing to control other variables makes it difficult to determine the effect of the independent variable on the dependent variable.
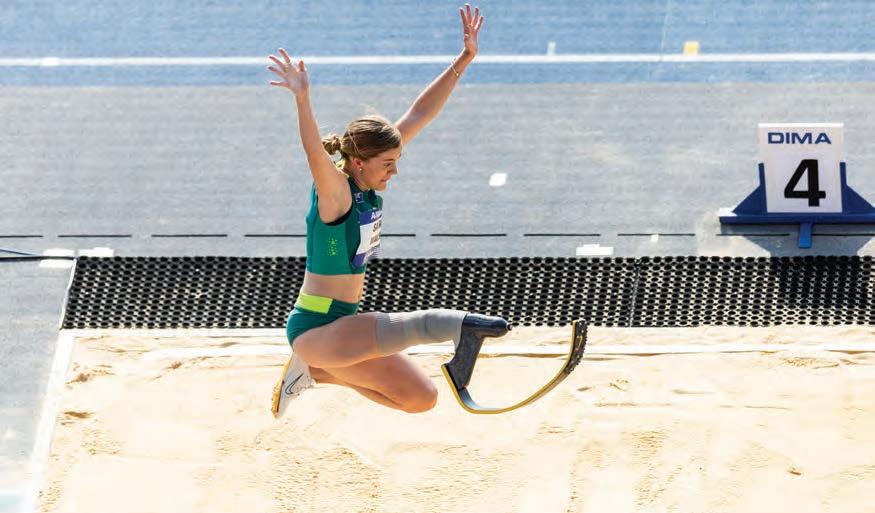
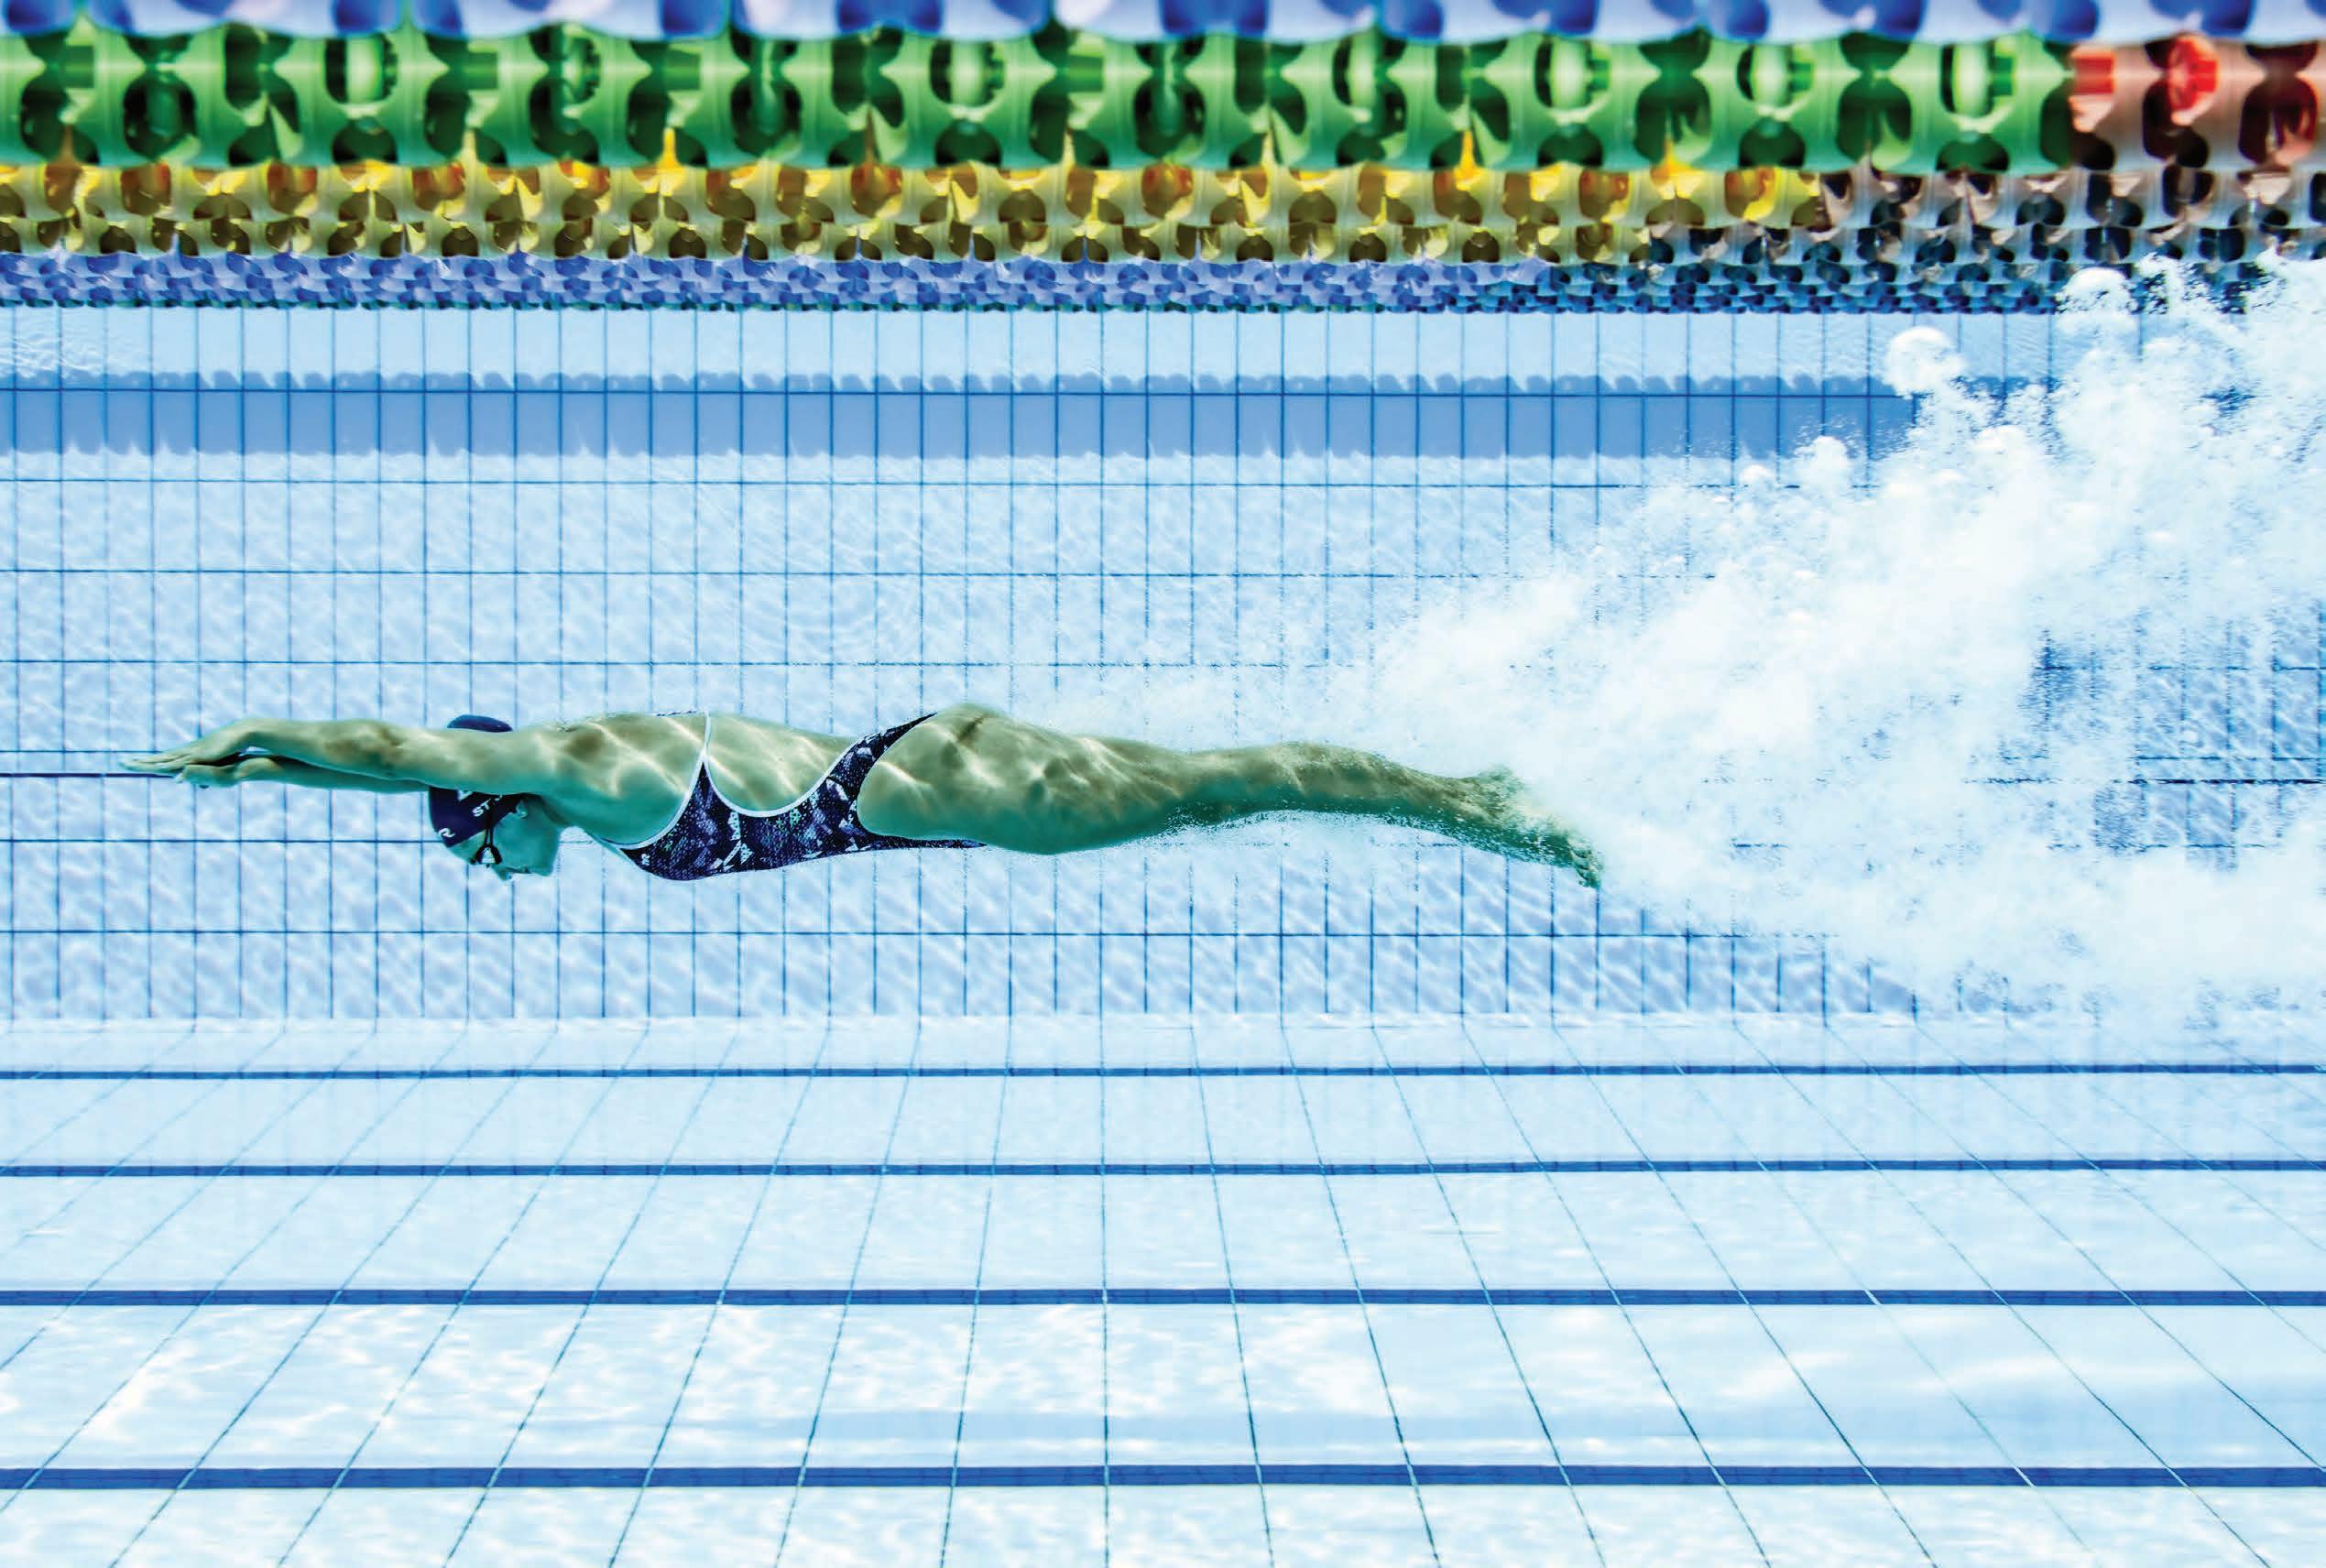
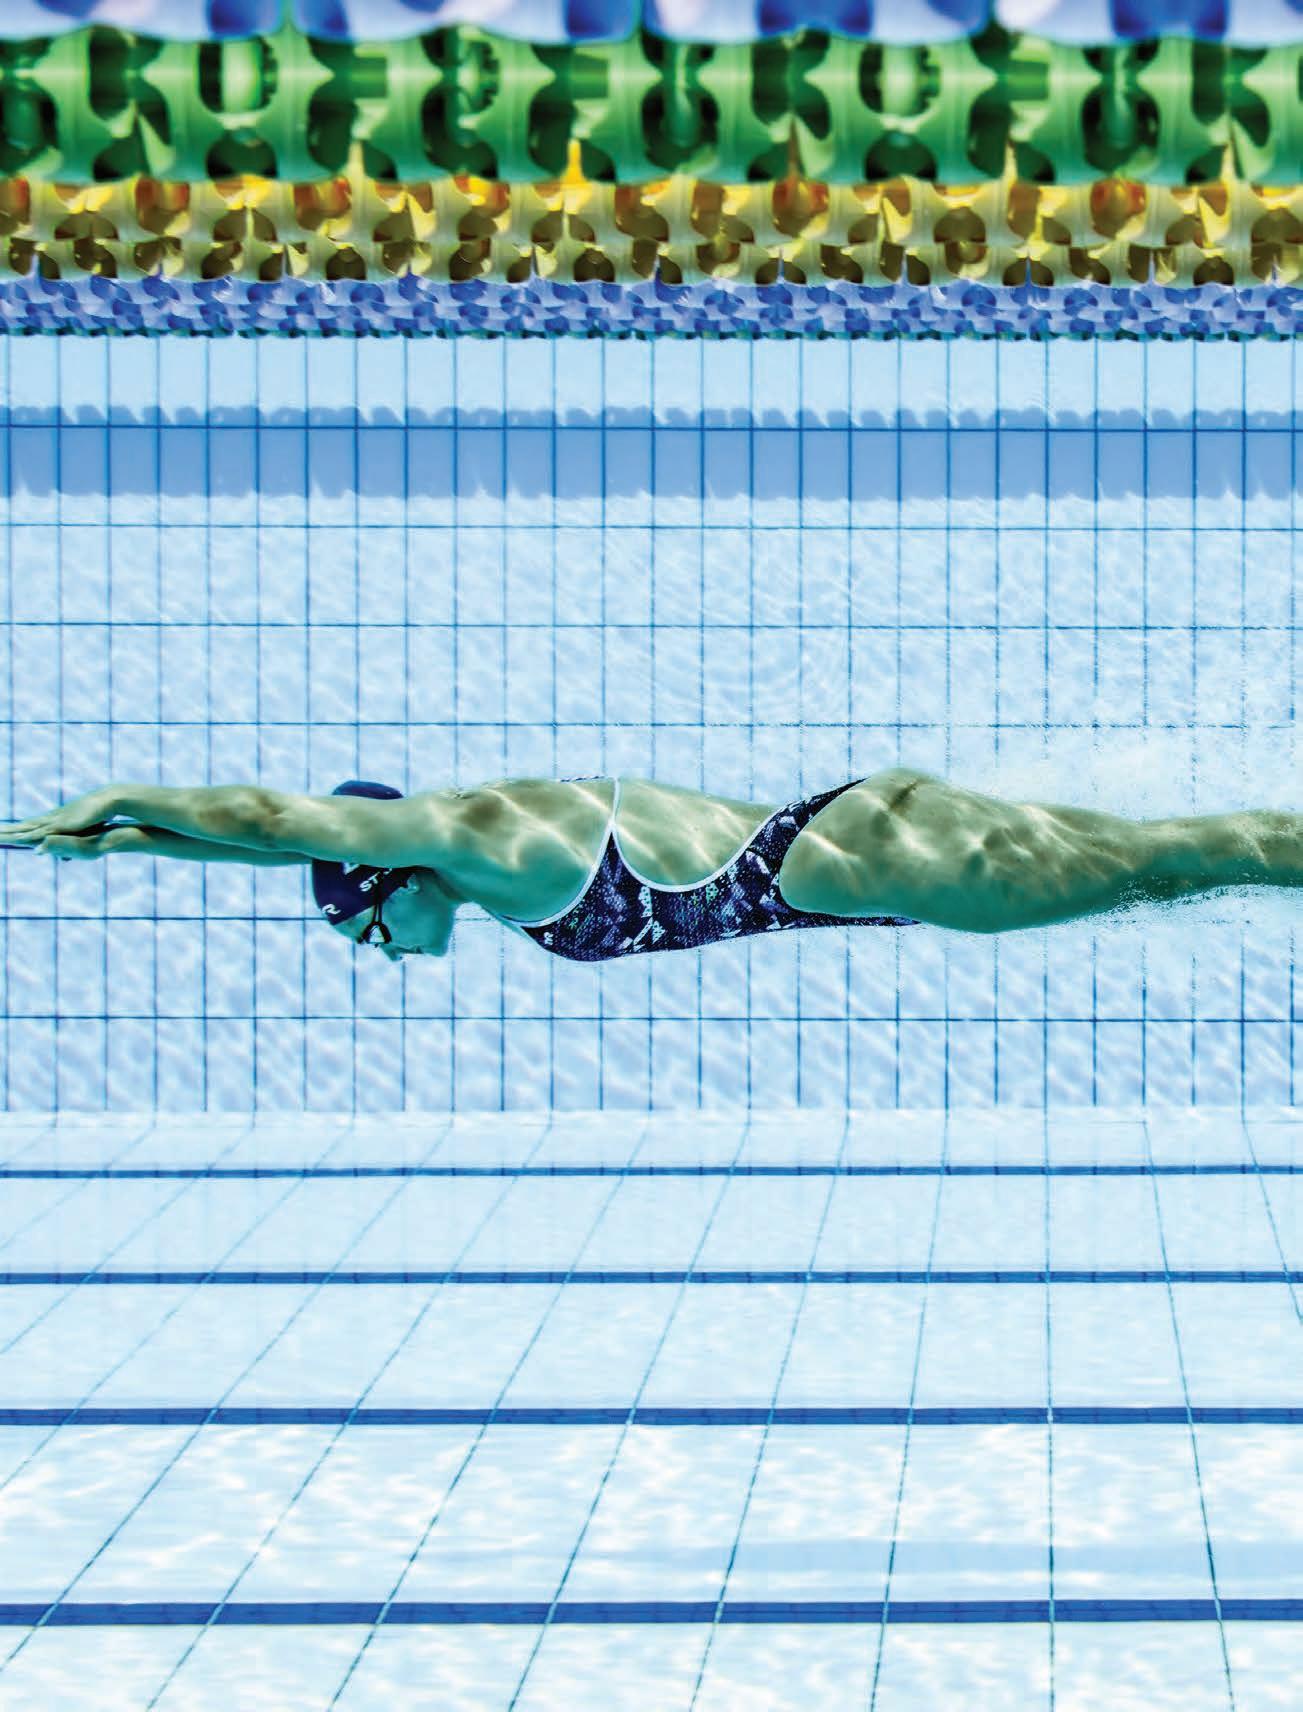
Figure 1.2 Sarah Walsh of team Australia used the same long jump pit as other competitors. By making the pit a controlled variable, factors such as surface texture, pit length and take-off board conditions were kept consistent.
Quick check 1.2
1. In an experiment, recall which variable is changed deliberately.
2. Explain why it is important to keep controlled variables constant in an experiment.
Step 4: State a hypothesis and make a prediction
Recall that a hypothesis is an if … then … statement that predicts the causal relationship between an independent and dependent variable.
A few points to remember when writing a hypothesis:
• A hypothesis makes an educated guess about the causal relationship between two variables.
• The hypothesis is a statement that can be tested in an experiment.
• The hypothesis must include the independent and dependent variables.
If the ___________ increases/decreases, then the ___________ will increase/decrease.
controlled variable a variable that is kept constant in an experiment to ensure it does not influence the results hypothesis an educated guess that can be tested through experimentation
UNCORRECTEDSAMPLEPAGES
Write independent variable here
For example:
If the temperature in the backyard (°C) increases, then the time taken for clothes to dry (seconds) will decrease Write dependent variable here Choose
prediction a statement that describes what is expected to happen if the hypothesis is true
Go online to access the interactive section review and more!
A prediction elaborates on the hypothesis, describing expected outcomes if the hypothesis holds true. For instance, if your hypothesis states that increasing screen time negatively affects sleep duration, your prediction could state that individuals who spend more than three hours on screens before bedtime will average less than six hours of sleep per night. This distinction between hypothesis and prediction is important: while a hypothesis sets the stage for the research, the prediction provides specific expectations that can be measured and compared against actual results.
Section 1.1 review
Online quiz
UNCORRECTEDSAMPLEPAGES
Section 1.1 questions
Remembering
1. List the key steps in the scientific method.
2. Define the terms ‘independent variable’ and ‘dependent variable’.
3. Identify what an investigable question is.
Understanding
4. Explain how observing the world leads to asking questions in the scientific method.
5. Describe the importance of conducting background research before formulating a hypothesis.
6. Differentiate between primary and secondary sources of information.
Applying
7. Identify the independent and dependent variables in the research question ‘Does the amount of sunlight affect the growth rate of plants?’
8. Formulate a hypothesis based on the statement ‘Increasing study time improves test scores’.
9. Design a simple method to test the impact of different fertilisers on plant growth.
Analysing
10. Examine how controlled variables impact the validity of an experiment’s results.
Evaluating
11. Evaluate the implications of cultural appropriation when using traditional knowledge in scientific research, particularly in relation to Aboriginal and Torres Strait Islander communities.
12. Assess the ethical considerations in a study that involves testing new exercise regimens on human participants. What measures should be in place to ensure participant safety and informed consent?
1.2 Planning and conducting investigations
UNCORRECTEDSAMPLEPAGES
Learning goals
At the end of this section, I will be able to:
1. Outline the method and equipment needed for a scientific experiment.
2. Develop clear and reproducible experimental procedures.
3. Identify safety protocols and ethical considerations in laboratory work.
4. Minimise random and systematic errors in data collection.
Step 5: outline the method and equipment needed
Choosing equipment
When conducting scientific experiments, selecting the appropriate equipment is crucial for ensuring accurate observations and measurements. The choice of tools can significantly influence the accuracy and reliability of your results. It is essential to understand the specific requirements of your experiment, beginning with a clear definition of your measurement needs. For example, if you are investigating the growth rate of plants, you will require instruments to measure height, volume of water and temperature. Clearly outlining these needs helps to narrow down your options.
Another important factor to consider is the required precision of your measurements. Different experiments demand varying levels of precision. For example, measuring the height of a plant might only require a standard ruler, while more precise measurements of the same height for scientific research may necessitate the use of a digital calliper. Assessing the level of accuracy needed for your measurements will guide your choice of equipment.
Each piece of equipment has a specific measurement range, so it is important to ensure that the tools you choose can accurately measure the expected values in your experiment. For instance, a thermometer may have a limited range of temperatures it can accurately measure and if you anticipate extreme conditions, such as very high or low temperatures, you should select equipment designed for those specific ranges.
The environment in which you will conduct your experiment can further impact your choice of equipment. If you are working in a laboratory setting, you might require specialised tools like fume hoods or chemical-resistant equipment. Conversely, if your investigation takes place in the field, you may need portable tools that can withstand various weather conditions and outdoor elements.
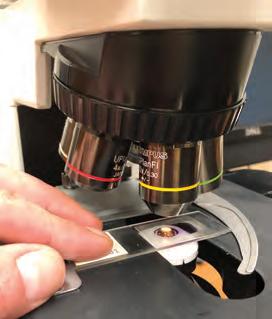
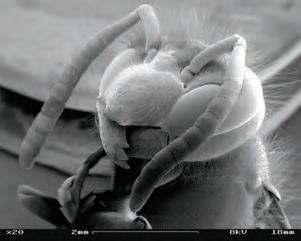
Figure 1.4 When observing cell structures under a microscope, adjusting the magnification to the appropriate level allows specific details to be clearly observed. Recording the magnification used is also necessary for other scientists to replicate the experiment and validate the findings.
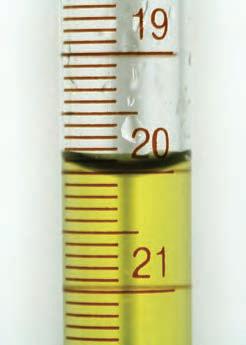
Figure 1.5 When measuring liquid volumes, the observer must read the correct position of the meniscus to obtain accurate measurements. The meniscus refers to the curved surface of a liquid, and accurately determining its position enables the precise measurement of the liquid volume.
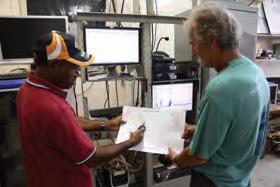
Digital tools
Digital tools have revolutionised the way scientific data are collected, managed and analysed and can make data collection more efficient for larger sample sizes. Digital tools such as online surveys, mobile apps and wearable devices can be used to collect large amounts of data quickly and accurately.
One advantage of digital tools for data collection is that they can reduce the potential for personal error and bias. For example, online surveys can be programmed to skip irrelevant questions, ensuring that respondents only answer questions that apply to them. Wearable devices can capture physiological data automatically, reducing the risk of measurement errors that can occur with traditional data collection methods, as all participants provide data in the same way.
Digital tools can also help data management and analysis, particularly for larger sample sizes. Digital tools can automate data entry, reducing the time and resources required for these tasks and facilitate complex data analysis, allowing researchers to analyse large amounts of data quickly and efficiently.
Digital tools such as digital microscopes, simulations and video-recording devices have also further enhanced scientific observations and measurements by allowing researchers to examine intricate details more effectively by capturing and analysing phenomena that might be difficult to observe directly. However, it is crucial to evaluate these simulations and models carefully to ensure they are well designed and relevant to the experiment. Any errors in programming or set-up may invalidate the entire experiment.
Writing a method
UNCORRECTEDSAMPLEPAGES
Your experimental procedure should be written in clear numbered steps, detailing every action taken, including the materials used and their quantities. Ensure your method is reproducible When documenting, consider the following:
• Clearly define how you will change the independent variable (height of the jumper) and measure the dependent variable (jump distance).
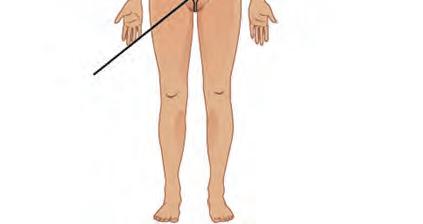
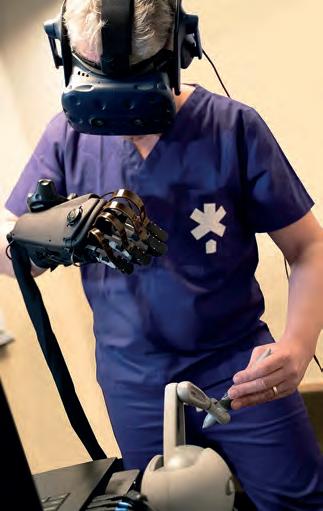
Figure 1.6 Digital tools can ensure that physiological data are recorded accurately.
• Include the number of trials for each height, aiming for at least three to ensure reliability.
• Describe all conditions of the independent variable. For example, you might test jump distances at different heights: 150 cm, 160 cm and 170 cm.
Points to remember when writing a method
Writing a method for the experiment that you are going to carry out is not just for your reference, it is for the reference of all other scientists who might want to carry out an experiment like yours in the future. Because of this, a method must be a clear procedure of actions that can be carried out in the exact same way anywhere in the world.
A few points to remember when writing a method for your experiment:
• Write the steps in order.
• Number the list of steps, starting with 1.
• Include names of specific equipment used.
• Include exact measurements of quantities used; for example, mass or volume.
• Indicate how the independent variable is changed and the dependent variable measured.
• Indicate key variables that are controlled.
• Include the number of repeat trials carried out.
• Use the third person passive voice and past tense.
trial a run-through of an experimental method that is usually repeated several times, to obtain data that can be averaged, to reduce any effect of variables not being completely controlled condition the different levels of the independent variable risk the likelihood that a hazard will actually cause harm hazard a danger or threat that has the potential to cause harm to you or your environment
UNCORRECTEDSAMPLEPAGES
1. Recall why it is important for an experimental method to be reproducible.
2. Name some of the key factors to consider when choosing equipment for a scientific experiment.
Explore! 1.1
The passive voice
Professional scientists communicate their experimental and investigative findings in peerreviewed journal articles. These articles undergo a rigorous evaluation process by experts in the field before being published, ensuring the reliability and quality of the research. The style of writing that all scientists have in common is they use the past tense passive voice and write in the third person, particularly when writing an experimental method.
For example, a high school student might write:
• You need to fill a 100 mL measuring cylinder with water. However, the style of writing used in contemporary journal articles would be:
• A 100 mL measuring cylinder was filled with water.
Use the internet to identify the grammatical rules for writing in the passive voice and third person. Can you see those rules followed in the example above?
Step 6: Manage safety risks and ethics
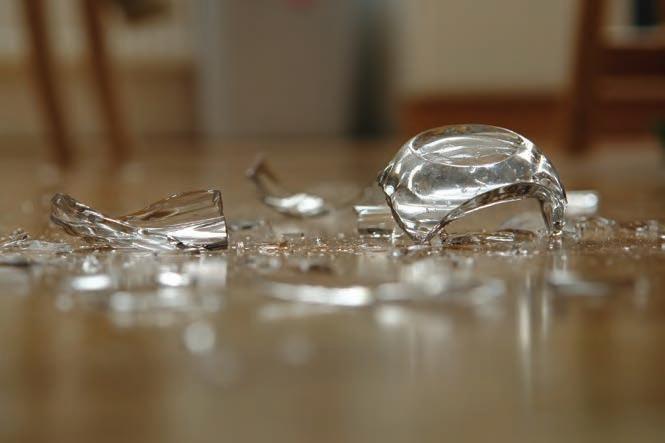
Scientists can work in various environments, including natural settings and laboratories. They may conduct experiments that pose risks to humans. It is important to understand the safety protocols and the equipment you will be using in the science laboratory. Laboratory safety rules exist to protect experimenters from hazards, such as cuts from broken glassware, burns from fire and exposure to harmful chemicals. Before conducting scientific experiments, you must always do a risk assessment to understand the risks and hazards involved in the experiment and have measures in place to reduce or remove the risk of harm to you and your environment.
2nd
Quick check 1.3
Hazard descriptors are essential for communicating the potential dangers associated with various substances and equipment in the laboratory. These descriptors provide quick visual cues about the nature of the hazard, allowing for immediate recognition and appropriate response. Common hazard descriptors you may come across in the lab include:
• corrosive, which indicates that a substance can cause severe damage to skin or eyes and can corrode materials.
UNCORRECTEDSAMPLEPAGES
• flammable, which signifies that a substance can easily ignite and catch fire.
• toxic, representing substances that are harmful or fatal if ingested, inhaled or absorbed through the skin.
• explosive, which warns that a substance can explode under certain conditions, posing a significant risk of injury or damage.
Familiarising yourself with these descriptors is necessary for maintaining a safe working environment.
Conducting a risk assessment is a vital part of laboratory safety. This process involves identifying potential hazards associated with an experiment, evaluating the risks involved and determining appropriate control measures to mitigate these risks. A thorough risk assessment should include:
• identification of hazards, recognising substances, equipment and procedures that could pose a danger.
• evaluation of risks, considering the harm that could result from the identified hazards.
• control measures, implementing strategies to eliminate or reduce the risks, such as using safer alternatives, improving ventilation or modifying experimental procedures.
Personal protective equipment (PPE) is essential for safeguarding you while conducting experiments in the laboratory. Wearing appropriate PPE helps to minimise exposure to hazards and protects against injuries. Common types of PPE include safety glasses, which should be worn at all times when working with chemicals or equipment that could cause eye injury; lab coats, which protect your clothing and skin from chemical spills and stains; gloves, which protect your hands from harmful substances (always remember to wash your hands thoroughly after removing gloves); and closed footwear, which protects your feet from spills and falling objects.
Figure 1.7 A scientist uses PPE to mitigate the risk of harm to herself.
Ethical considerations in experiments
In addition to managing safety risks, you should consider the ethical implications of your experiments. Ethical guidelines ensure that research is conducted responsibly and with respect for all participants, including humans and animals, and also the environment. Here are some key ethical considerations to keep in mind:
• Informed consent: Ensure that all participants are fully informed about the nature of the experiment and any potential risks involved. For instance, if conducting a study on jump height performance, participants should understand the physical demands of the experiment and any risks related to injury. Consent should be obtained freely, without coercion.
• Minimising harm: Strive to design experiments that minimise physical or psychological harm to participants. This includes using safe materials and procedures, such as ensuring proper landing techniques during long jump trials and being mindful of how the research may affect individuals or groups.
• Animal welfare: If your experiment involves animals, it is vital to adhere to strict ethical standards that prioritise their welfare. This includes providing appropriate living conditions and ensuring humane treatment.
• Environmental impact: Consider the potential impact of your research on the environment. Aim to conduct experiments that do not harm ecosystems or contribute to pollution.
• Data integrity: Ensure that data collection and reporting are conducted honestly and transparently. Avoid fabricating or manipulating results and acknowledge the contributions of others appropriately.
By adhering to these ethical principles, you can contribute to responsible scientific practice and ensure the wellbeing of all involved.
Step 7: Collect data
Once an investigation has been designed, it is time to conduct the experiment and analyse the results to answer the original research question.
Minimising errors is a vital part of the data collection process. Errors refer to the differences between observed values and their true values. These discrepancies can lead to results that are either inaccurate or entirely misleading. Errors can be categorised into two main types: random errors and systematic errors.
Random errors are unpredictable and often arise from the experimenter’s actions, such as misreading a measurement or not timing an event accurately. For example, during a long jump experiment, an athlete might jump with slightly different techniques each time, affecting the distance recorded. These errors can fluctuate from one measurement to another, making it difficult to pinpoint their source. On the other hand, systematic errors are consistent and typically stem from faulty equipment or flawed methodology. For instance, if a measuring tape consistently measures distances as being 10 cm shorter than the actual distance, every jump recorded will reflect this discrepancy, regardless of the athlete’s performance.
UNCORRECTEDSAMPLEPAGES
To enhance the reliability of your data, it is essential to implement strategies for error minimisation. This may involve calibrating instruments before use, repeating measurements multiple times or employing digital tools that offer greater precision. For example, using a digital measuring device for recording jump height can provide more accurate readings than a traditional tape measure. By carefully considering the sources of errors and taking steps to prevent them, you can ensure that your data collection process yields more accurate and trustworthy results.
random error error caused by limitations of the measurement device or the observer and does not follow a regular pattern systematic error error that occurs through a poorly calibrated device (consistently too high or consistently too low)
Quick check 1.4
1. Describe two types of personal protective equipment (PPE) and their purposes.
2. Describe informed consent and why is it crucial in scientific experiments involving human participants.
3. Differentiate between random errors and systematic errors. Give an example of each.
UNCORRECTEDSAMPLEPAGES
Section 1.2 questions
Remembering
1. State what should be included in a clear and reproducible experimental method.
2. Name the two main types of errors that can occur during data collection in scientific experiments.
3. Define the terms ‘accuracy’ and ‘precision’.
Understanding
4. Explain how digital tools can enhance the data collection process in scientific research.
5. Explain why it is essential to conduct a risk assessment before starting an experiment.
Applying
6. For an experiment investigating the effect of temperature on plant growth, identify the specific equipment you would need and justify your choices based on measurement needs.
7. Describe the steps you would take to ensure the safety of participants in an experiment that involves physical activity.
Analysing
8. Compare the use of digital tools with traditional methods for data collection. What are the advantages and disadvantages of each?
Evaluating
9. Discuss the ethical considerations that should be taken into account when conducting scientific experiments involving human participants.
10. Reflect on how using inappropriate measurement tools could lead to systematic errors in data collection. What strategies can be employed to prevent such errors?
Section 1.2 review
1.3 Processing and analysing data
Learning goals
At the end of this section, I will be able to:
1. Organise and present data using tables.
2. Select the most appropriate type of graph for a set of results.
3. Describe and interpret trends in data using graphs.
Step 8: process and present data
When working with scientific data, effectively processing and presenting the information is essential for drawing accurate conclusions. There are various tools and techniques available to organise and interpret data, ensuring that they are easily understood and comparable. Measures of central tendency, percentages, tables and graphs are all useful methods to analyse quantitative data, helping to uncover trends, patterns and relationships within the data set.
Measures of central tendency
When analysing quantitative data, measures of central tendency provide insight into the typical or central value in a data set. These measures include the mean, median and mode. Each offers a different perspective on the data. The mean, which we will focus on here, is often referred to as the average and is useful for determining the overall tendency of a data set. In year 9, the other measures of central tendency will be explored.
The mean can be calculated using the following equation:
UNCORRECTEDSAMPLEPAGES
For example, if six athletes reported their long jump distances as 5.5
and 7.0 m, the mean jump distance would be calculated as follows:
The mean gives a general idea of the central value of the data, but it’s important to note that it can be affected by very high or very low values in the data set, which may skew the result.
Calculating percentages
Percentages are another tool for analysing data, especially when comparing parts of a data set to the whole. Percentages can be calculated using the following equation: percentage = part × 100 whole
mean sum of all the values divided by the number of values median the middle value of the data set after all the values have been ranked (sorted in ascending order); there should be as many numbers below the median as there are above mode the most frequently occurring value or values in a data set
For instance, you might want to determine what percentage of athletes achieved a long jump above a certain distance. If you have a group of athletes and 6 out of 24 athletes jumped over five metres, the percentage of athletes who achieved this feat can be calculated as follows:
6 ×100 = 25 24
This calculation shows that 25% of the athletes achieved a long jump over five metres.
Percentages allow for easier comparisons and help to standardise data across different groups or contexts. They are useful for determining proportions, success rates and changes over time, providing a clearer understanding of the data.
Both the mean and percentages offer a way to summarise and interpret data effectively. Together, they allow for meaningful comparisons and insights into trends and patterns in the data.
Quick check 1.5
1. Calculate the mean of the following data set: 10, 12, 14, 16, 18.
2. Provide one example of a situation in which you would use a percentage instead of a raw number in data presentation.
Tables
Tables organise and present data in a clear and structured format. By arranging information into rows and columns, tables allow for easy comparison of different variables and make patterns or trends more visible. They are particularly useful when working with large data sets or complex information, as they enable users to break down the data into manageable parts. Each row can represent a different data point, while each column can represent a variable, making it straightforward to analyse relationships or differences between variables.
For example, consider a table that presents data on the heights and average long jump distances of a group of athletes, including results from three trials for each athlete.
UNCORRECTEDSAMPLEPAGES
In Table 1.1, each row represents an individual athlete, providing their height along with their results from three trials of the long jump. The last column shows the mean jump distance calculated from the three trials for each athlete.
For cases in which the data involves very large or very small numbers, tables can incorporate scientific notation to present the data concisely. Scientific notation expresses numbers as a coefficient multiplied by a power of 10, which is particularly useful when dealing with measurements in fields like physics or astronomy. For instance, instead of writing out a large number like 5 000 000 (five million), scientific notation allows you to represent it as 5 × 10⁶, making the data easier to read and understand, without losing accuracy.
Table 1.1 Heights and average long jump distances of athletes
Figure 1.8 Scientific notation helps simplify the presentation of very large or small numbers, making it easier to compare values.
Try this 1.1
Investigating the impact of screen time on extracurricular activities
As a class, explore the relationship between the time spent on digital devices and the number of hours you dedicate to extracurricular activities. Start by tracking your daily screen time using your device’s built-in features or apps that monitor usage. In addition to this, log the hours you spend on various extracurricular activities each week, such as sports, music, clubs or volunteering. After a designated period, the data from everyone will be collated to create a summary. Once you have the results, look for patterns or correlations between screen time and participation in extracurricular activities. You may want to segment the data by grade level or type of activity to see if any trends emerge.
UNCORRECTEDSAMPLEPAGES
Graphs
Graphs provide a visually engaging way to represent data, making it easier to interpret patterns, trends and relationships. Unlike tables, which present numerical values in a structured format, graphs offer a more immediate understanding by transforming data into shapes and lines. This visual representation can be particularly useful for summarising large data sets or complex information, allowing viewers to draw conclusions at a glance.
Figure 1.9 Is there a relationship between time spent on a phone and time spent playing sport?
line of best fit a line or curve that best shows the overall trend in a set of data points on a graph
interpolation using existing data
(such as a line of best fit) within the original data set to make a reliable prediction
extrapolation using existing data
When creating a graph, it is important to select the appropriate type based on the nature of your data. For instance, bar graphs are ideal for comparing categorical data, such as survey results –each category can be represented by a separate bar. On the other hand, line graphs are better suited for showing trends over time or continuous data – a line can illustrate changes and fluctuations. Scatter plots are effective when you want to show the relationship between two variables, particularly when looking for correlations. Pie charts are useful for displaying proportions or percentages within a whole – each slice represents a part of the total, making it easy to compare relative sizes.
Once you’ve chosen the right graph type, there are several guidelines to follow for clear and effective presentation. First, ensure that both axes are clearly labelled, including units of measurement where applicable. For example, if you’re graphing time and temperature, the x-axis (horizontal axis) might represent time in minutes and the y-axis (vertical axis) temperature in degrees Celsius. Labelling makes it easy for readers to interpret the data correctly. Next, give your graph a descriptive title that summarises what the graph is about. If your graph contains multiple data sets, such as showing the temperature of different locations over time, include a legend to clarify which line or bar corresponds to which data set. Properly formatted graphs not only make the data easier to read but also allow for quick insights and facilitate comparisons across variables.
UNCORRECTEDSAMPLEPAGES
(such as a line of best fit) outside the original data set to make a prediction
Incorporating a line of best fit
One particularly powerful feature of a graph is the line of best fit, especially in scatter plots. This line runs through the ‘middle’ of the data points, representing the general trend and simplifying the identification of patterns. The line of best fit can also be used for interpolation, in which predictions are made using data points within the original data set. For example, if you are studying reaction rates at different temperatures, interpolation allows you to predict the reaction rate at a temperature not directly measured but within the range of observed data points. This method is reliable because it is based on existing trends within the data set.
However, when extending the line of best fit beyond the range of the original data points to make predictions, a technique known as extrapolation is employed. Extrapolation is less reliable than interpolation because it assumes that existing trends will continue outside the range of the data set. For instance, if you’re using a line of best fit to predict future population growth based on past data, the result could be inaccurate if new factors emerge that change the trend, such as economic changes or natural disasters.
Uncorrected 2nd sample
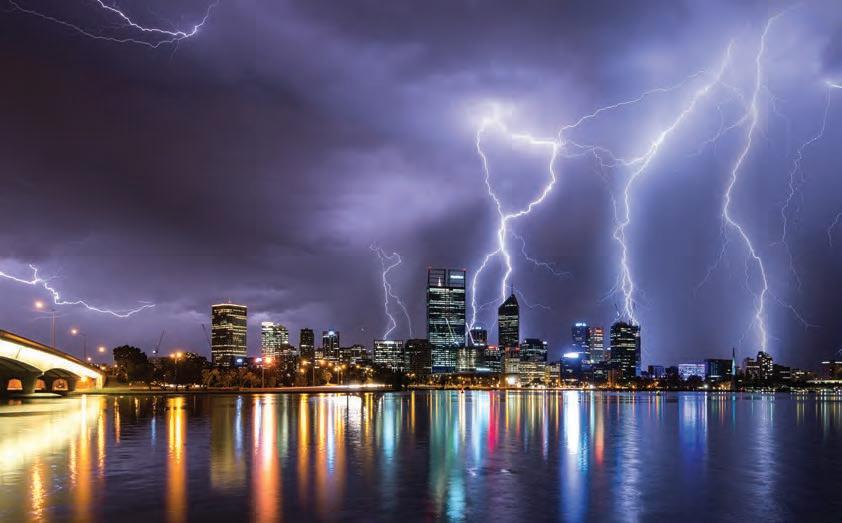
Perth Broome
Figure 1.10 Graph of the maximum temperature in Perth and Broome over the course of a year
Figure 1.11 shows a scatter plot with a line of best fit, drawn in red. The line runs through the ‘middle’ of the data, like an average. The dotted regions are where the line has been extrapolated past the original data set. If you use the line in these regions (for example, to predict the reaction time for 0.1 mol/L acid), then this would be less reliable.
Predicting in here = interpolation
UNCORRECTEDSAMPLEPAGES
Predicting in dotted regions = extrapolation Actual data points from experiment
Figure 1.11 In real experiments, data will often have small inconsistencies (called noise). Using a line of best fit, a pattern can be found and used to extrapolate the data. This graph shows the effect of acid concentration on the time taken for a reaction to start.
While many lines of best fit are straight, not all data trends follow a linear pattern. For example, if you’re studying the cooling of a substance over time, the data might form a curve, as shown in Figure 1.12. In this case, a curved line of best fit is more appropriate because it better represents the nature of the relationship between the variables. This often occurs in scientific data when processes, such as cooling, heating or decay, do not happen at a constant rate, and thus a straight line would not adequately capture the pattern.
Figure 1.12 A set of data does not always have a linear (straight) line of best fit. Sometimes, other functions must be used to obtain an accurate (curved) line of best fit, such as polynomials or exponentials. This graph shows the effect of time on the temperature of 100 mL of water.
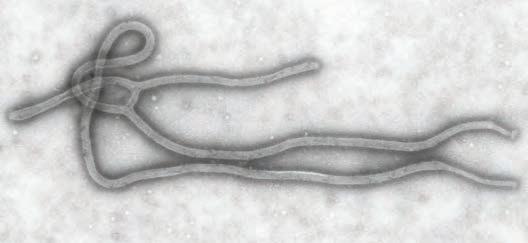
A type of curved line that some data sets display is an exponential trend, in which the rate of change accelerates over time instead of remaining constant. An exponential trend indicates that the data are growing (or decaying) at a rate proportional to the current value, leading to increasingly larger (or smaller) changes as time progresses. Exponential trends are often seen in fields such as biology, finance and population studies. For example, a graph showing the spread of a contagious disease over time might display an exponential growth curve, with the number of infected individuals rising dramatically as more people become exposed to the virus.
exponential trend when the rate of change increases or decreases over time, proportional to the current value, resulting in a curved line when graphed
Step 9: describe patterns in the data
Recognising and describing trends in graphs helps in interpreting data accurately. Below are some common trends that you might encounter, along with examples of how to describe them, based on specific data sets.
In Figure 1.13, the data show a steady increase. A suitable way to describe this would be ‘As athlete height increases, long jump distance also increases’. This highlights a direct, positive correlation in which one variable rises consistently as the other increases.
of athlete height versus long jump distance
UNCORRECTEDSAMPLEPAGES
Figure 1.13 A graph with positive correlation showing the relationship between an athlete’s height and the distance they can jump in a long jump competition
In Figure 1.14, the data display a trend of rapid increase followed by a plateau. You could describe it as ‘Initially, during the first three weeks of a marketing campaign, the number of new subscribers increases rapidly from 0 to 1500. After this period, the number of new subscribers levels off and remains constant at around 1500 for the following month’. This trend is characterised by a sharp rise that eventually stabilises into a flat line, indicating no further growth after a certain point.
Figure 1.14 A graph showing the number of subscribers gained over the course of a month
In Figure 1.15, the data show an exponential increase. This can be described as ‘For the first five days, the number of views on a viral video increases slowly from 100 to 500. After five days, the number of views increases exponentially, reaching over 20 000 within the next two days’. Exponential trends demonstrate accelerating growth over time, starting off slow but becoming progressively faster as the values increase.
In Figure 1.16, the data do not follow a clear pattern. Instead, they show random fluctuations over time. In such cases, you would describe the trend as ‘The data points are scattered or randomly distributed without a clear pattern or correlation’. Even when no obvious trend is present, it is important to note the randomness and lack of a distinct relationship between variables.
1. Describe why it is important to consider the scale when creating a graph.
Figure 1.15 A graph showing the number of views on a viral video in the first week
Figure 1.16 A graph showing a share price over the course of a week
pendulum practical
Background information
In this practical, you will gather continuous data and convert them into a line graph.
UNCORRECTEDSAMPLEPAGES
Aim
To test the effect of string length on the time it takes a pendulum to complete one swing
Materials
• retort stand
• bosshead and clamp
• 120 cm of string
• weight for pendulum
• protractor
• Blu Tack®
• stopwatch
• graph paper or graphing application, such as Excel
Planning
1. Define your variables for this experiment and record them using the table below.
Independent variable
Dependent variable
Controlled variables
2. Construct a hypothesis for your experiment. Predict how the independent variable will affect the dependent variable.
3. Write a risk assessment for this experiment.
Method
1. Attach the weight to the bottom of the piece of string.
2. Tie the string to the bosshead and clamp attached to the retort stand and measure 20 cm from the join of the bosshead to the base of the weight, as shown in Figure 1.17.
3. Using the protractor, hold the string tight at 45 degrees and release the pendulum.
4. Start the stopwatch as soon as you release the pendulum and count three full swings (across and back), as shown in Figure 1.17.
5. When the pendulum returns for the third time, stop the stopwatch and divide the time by 3 to get the time for one swing.
6. Record the time for one swing in the results table. Repeat for two more trials.
7. Repeat steps 2–6 for different lengths of string.
Results
Create a results table for your experiment.
Use the mean of all of your trials to produce a line graph. Remember the following points:
• Plot the independent variable on the x-axis.
• Plot the dependent variable on the y-axis.
• Label each axis with the variable name and the unit of measurement.
• Write a title for the graph.
• Use an even scale (equal spaces between the numbers on the axes).
1.17 Experimental set-up. Left: setting up the pendulum. Right: timing the swing of the pendulum
Discussion
1. Identify any trends you see in your graph.
2. Compare your collected data to data from another group. How do their results compare to yours?
3. Explain whether your results supported or did not support your hypothesis.
Section 1.3 review
Online quiz
UNCORRECTEDSAMPLEPAGES
Section questions
Teachers can assign tasks and track results
Go online to access the interactive section review and more!
Section 1.3 questions
Remembering
1. Recall the term that is used to refer to patterns in graphs.
2. List the steps needed to calculate the mean of a data set.
Understanding
3. Illustrate a graph that shows an exponential trend.
4. Explain why measures of central tendency are important in data analysis.
5. Summarise the main advantages of using tables for data presentation.
Applying
6. Given a graph showing the number of plants growing over time with a steady increase, describe the trend you observe.
7. Describe the trend you would expect to see in a graph depicting the temperature of water cooling over time.
8. Calculate the mean jump distance for a new set of long jump results: 4.2 m, 5.4 m, 5.8 m, 6.5 m and 7.1 m.
Analysing
9. Assess the reliability of extrapolation when predicting future trends based on historical data.
10. Describe how outliers in a data set can affect the mean and range.
Evaluating
11. Decide why it is important to describe patterns in data accurately.
12. Discuss the role of scientific notation in organising large data sets.
Figure
1.4 Evaluating and communicating science
Learning goals
UNCORRECTEDSAMPLEPAGES
At the end of this section, I will be able to:
1. Evaluate the effectiveness of experimental methods and identify areas for improvement.
2. Write a conclusion for an experiment.
3. Assess the validity and reliability of both primary and secondary data sources.
Step 10: evaluate the method
Evaluation allows researchers to reflect on their methods, results and interpretations. After conducting an experiment, it is essential to identify areas for improvement to enhance the reliability of future investigations. For example, suppose a group of students conducts an experiment to assess whether an athlete’s height affects their long jump performance. They might encounter issues such as inconsistent measuring techniques or varying environmental conditions.
Suggested improvements:
• Standardised measurement techniques: Ensure that all heights are measured using the same equipment (e.g. a digital stadiometer) and method (e.g. standing straight against a wall) to reduce measurement errors. This standardisation ensures that height data are reliable and accurately reflect each athlete’s stature.
• Controlled environmental conditions: Conduct the long jump trials in a controlled environment, where factors such as wind and surface type are consistent. For instance, performing jumps on the same surface, like a synthetic track, can minimise variability caused by differing ground conditions.
These improvements aim to enhance the reliability and validity of the data collected in future experiments, leading to more accurate conclusions about the relationship between height and long jump performance.
Step 11: Write a conclusion
A conclusion summarises the key findings and interpretations from the experiment. It should address the causal relationship between the independent and dependent variables, provide evidence to support this relationship and evaluate whether the data support the initial hypothesis.
Conclusion
Based on the data collected during the experiment, there is a positive correlation between an athlete’s height and their long jump performance. As the average height of participants increased from 160 cm to 190 cm, their average jump distance also increased from 4.5 m to 5.8 m. This trend supports the hypothesis that taller athletes tend to perform better in long jump events. However, it is important to note that other factors, such as technique and training, also contribute to performance outcomes.
Validating a conclusion
Comparing results with other groups or secondary sources is a valuable practice to assess the consistency of your findings. If there are discrepancies or conflicting results, the potential reasons behind them can be analysed, such as differences in methods, sample size or experimental conditions. Such conflicts may lead to further investigation or discussion to understand the underlying factors causing the variations. Sometimes, this comparison may produce additional questions that need to be explored to verify the validity of those claims.
Remember, when validating any conclusion, it is important to look for facts or ideas that have been taken for granted. Discussing these assumptions with others helps determine if they are reasonable and supported by evidence. This process helps in developing a stronger understanding of the topic and promotes a more thorough examination of the evidence.
After analysing the data from the long jump experiment, the students might compare their findings with existing literature on the relationship between height and athletic performance. For instance, they could reference studies that have shown similar trends, indicating that taller athletes often excel in events requiring explosive power, like the long jump.
If the results align with these previous studies, it strengthens the credibility of the conclusions. However, if conflicting results arise, such as findings suggesting that height has little impact on performance, they should investigate potential reasons behind these discrepancies. This could include considering other variables that may influence long jump performance, such as muscle strength or technique, which might vary significantly among athletes of different heights.
Try this 1.2
Balloon popping
Background information
In this activity, you will gather data that can be turned into a line graph.
Aim
UNCORRECTEDSAMPLEPAGES
Be careful
Safety glasses must be worn for this practical.
To test the effect of number of breaths on the circumference of a balloon
Materials
• balloon • permanent marker
• string • ruler
Method
1. Lie the balloon flat on the workbench. Using the string, measure the circumference at the widest part of the balloon.
2. Using a permanent marker, draw a line on both sides of the balloon to indicate where you took the first measurement.
3. Use one breath to inflate the balloon and hold it tight to prevent air escaping. Without tying the balloon, use the string to measure the new value of the circumference along the line you have already drawn.
4. Repeat step 3, adding more volume to the balloon by one breath at a time, making sure no air escapes, recording your results until the balloon pops.
Results
Create a results table for this experiment.
Draw a line graph. Number of breaths should be on the x-axis and balloon circumference on the y-axis.
Analysis
UNCORRECTEDSAMPLEPAGES
Identify one trend that you observed in your graph.
Evaluation
1. Suggest possible experimental uncertainties and faults in this experiment.
2. Suggest one way to improve the experimental design if you were to conduct this experiment again in the future.
Conclusion
Draw a conclusion from this experiment. Justify your answer with data.
effective communication in science
Effective communication is crucial for scientists as they engage with diverse audiences, including the public, fellow researchers, policymakers and educators. Various methods are employed to convey scientific information, such as oral presentations, posters, reports, news articles and infographics. Clear and concise communication enhances the understanding of scientific work, fosters public engagement with science and supports informed decision-making within society. By articulating complex concepts in accessible language, scientists can bridge the gap between their research and the community, ultimately promoting greater appreciation for scientific inquiry. However, miscommunication can often arise, particularly in online environments where not all information is reliable. It is essential to source credible information and be vigilant about the impact of biased or incorrect communication on public perception and scientific progress. Inaccurate or misleading information can lead to misunderstanding, mistrust and resistance to scientific findings, which can hinder advancements in various fields.
Communicating data: Primary and secondary sources
Using primary data
When utilising primary data – data collected firsthand for a specific research purpose – scientists should critically assess the validity and reproducibility of the methods employed. Reproducibility refers to whether the research yields consistent results when repeated under similar conditions by different researchers. If a study’s findings cannot be reproduced, questions may arise regarding the validity of the original conclusions. Assumptions made during research can significantly influence the validity of the outcomes. For example, if a researcher assumes that their study population accurately represents the general population, this assumption could lead to biased or misleading conclusions. Similarly, the choice of data collection methods must be justified; relying on a method deemed the most accurate without sufficient evidence can compromise the reliability of the findings.
It is also vital to identify any unstated facts or assumptions within the research and evaluate their reasonableness. For instance, if a study presumes that a particular medication is safe and effective without substantial evidence, this could lead to potentially harmful or misleading conclusions. Researchers must thoroughly evaluate whether their assumptions are justified and consider areas of uncertainty when determining whether there is enough evidence to support their conclusions or if alternative explanations should be explored.
1.18 In the late 1990s, British doctor Andrew Wakefield claimed that the MMR (measles, mumps and rubella) vaccine was linked to autism and bowel disease. Wakefield’s study was later found to be fraudulent, but it led to a decline in MMR vaccination rates in the UK and other countries. This resulted in outbreaks of measles and other diseases, causing serious harm and even death in some cases. Wakefield was eventually found guilty of professional misconduct and the study was withdrawn.
Using secondary data
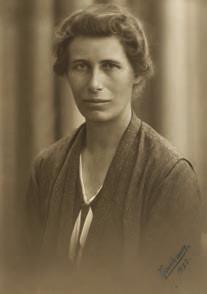
Figure 1.19 A 2010 article published in the journal Behavioral and Brain Sciences claimed that individuals studied in a significant portion of psychology literature are WEIRD – Western, Educated, Industrialised, Rich and Democratic – but stated this group is ‘among the least representative populations one could find for generalising about humans’.
UNCORRECTEDSAMPLEPAGES
When using secondary data – which summarise, analyse or interpret primary sources – scientists must ensure the protection of personal information and accurately cite their sources to avoid plagiarism. Proper citation not only credits the original authors but also enhances the credibility of the new research by providing readers with the opportunity to verify the information presented.
To assess the reliability of secondary data, the CRAAP test (Currency, Relevance, Authority, Accuracy, Purpose) serves as an effective tool. This test evaluates the quality of sources by examining how current the information is, its relevance to the research question, the authority of the source, the accuracy of the information and the purpose behind the data collection. By applying the CRAAP test, scientists can ensure that the secondary data they use meet acceptable standards for inclusion in their research, ultimately leading to more robust and trustworthy conclusions.
Making thinking visible 1.1
name, describe, act: the Craap test
The CRAAP test can be used to evaluate the credibility of secondary sources of information.
1. Name the component that each letter stands for in the CRAAP test.
2. Describe what each of the components listed in Question 1 mean.
3. Explain the purpose of each of the components in the CRAAP test. How do each of these relate to the credibility of a source?
The Name, describe, act thinking routine was developed by Project Zero, a research centre at
Harvard Graduate School of Education.
Figure
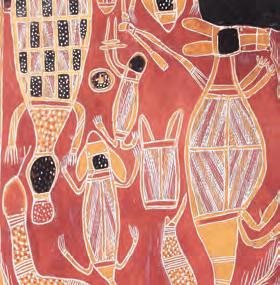
Using primary data from Aboriginal and Torres Strait Islander Peoples Aboriginal and Torres Strait Islander peoples are invaluable primary sources of information regarding their cultural practices, history and traditional knowledge. Their insights have been shaped by thousands of years of living in harmony with the land, allowing them to develop a profound understanding of the natural environment. This knowledge is often transmitted orally through stories, songs and ceremonies, ensuring that cultural practices and lessons are preserved and passed down through generations.
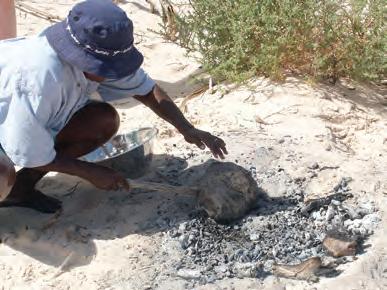
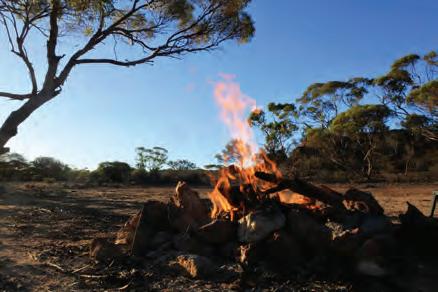
The traditional ecological knowledge held by these communities encompasses various aspects, including sustainable land management, plant and animal behaviour, weather patterns and seasonal changes. For instance, Aboriginal Australians have long utilised fire as a tool for land management, a practice known as ‘fire-stick farming’, which promotes biodiversity and reduces the risk of large-scale bushfires. Such practices demonstrate a deep connection to the environment and a sophisticated understanding of ecological systems that contemporary science is beginning to recognise and learn from.
When engaging with Aboriginal and Torres Strait Islander Peoples, it is crucial for researchers and scientists to approach them with respect and recognition of their status as knowledge holders. Collaborating with these communities provides a richer understanding of local ecosystems and cultural landscapes, offering insights that might not be captured through conventional scientific methods alone.
Explore! 1.2
traditional knowledge
Aboriginal and Torres Strait Islander Peoples have a rich history of medicinal knowledge and practices that have been developed and refined over thousands of years. Their understanding of the human body and physiology, and the environment continues to contribute significantly to the advancement of modern medicine.
For example, the traditional use of eucalyptus oil to treat respiratory infections is now supported by modern research, which has shown that eucalyptus oil has antiviral and antibacterial properties. The use of tea tree oil as a topical antiseptic has also been validated by scientific research.
UNCORRECTEDSAMPLEPAGES
Similarly, the Kakadu plum has the highest concentration of vitamin C of any fruit in the world. Its high vitamin C content has been used to treat the disease scurvy, and its antioxidant properties have been studied for their potential in cancer treatment.
Research other plants that different groups of Aboriginal and Torres Strait Islander Peoples have traditionally used as medicine.
Figure 1.20 Some groups of Aboriginal and Torres Strait Islander Peoples traditionally use eucalyptus oil to treat respiratory Infections.
Section 1.4 review
UNCORRECTEDSAMPLEPAGES
Section 1.4 questions
Remembering
1. Recall what the CRAAP test is used for in research.
2. Recall why it is important to communicate scientific findings clearly.
3. Recall the purpose of evaluating a scientific method after conducting an experiment.
Understanding
4. Explain why it is important to evaluate the method and results before making any conclusions about causation.
5. Explain how a problem with the equipment can affect the results of an experiment.
6. Explain why controlled environmental conditions are important in experiments.
Applying
7. Use an example to demonstrate how miscommunication can lead to misunderstandings in scientific research.
8. Explain how you would write a conclusion to clearly summarise experimental findings.
9. Design a simple experiment to test the impact of another physical characteristic (e.g. arm length) on a different athletic performance (e.g. throwing distance). Explain how you would control the variables.
Analysing
10. Analyse how measurement errors could impact the validity of an experiment’s results. What strategies could be implemented to minimise these errors?
11. Analyse the potential biases that may arise when using secondary data in research. How could these biases influence the findings?
Evaluating
12. Discuss why it is essential to identify and address potential sources of error when modifying an experimental method.
13. Discuss the impact of cultural perspectives on scientific knowledge production, specifically, how traditional knowledge and contemporary science can be integrated.
Chapter review
Chapter checklist
Success criteria Linked questions
1.1 I can outline the different stages of the scientific method. 1
1.1 I can identify and differentiate between independent, dependent and controlled variables in an experiment. 2, 4, 5, 8a
1.1 I can propose investigable questions and make predictions. 6
1.2 I can outline the method and equipment needed for a scientific experiment. 8b, 9
1.2 I can develop clear and reproducible experimental procedures.8b, 8c, 9
1.2 I can identify safety protocols and ethical considerations in laboratory work. 7, 10
1.2 I can minimise random and systematic errors in data collection. 3
1.3 I can organise and present data using tables. 13a
1.3 I can select the most appropriate type of graph for a set of results.13b
1.3 I can describe and interpret trends in data using graphs. 13c
1.4 I can evaluate the effectiveness of experimental methods and identify areas for improvement. 11, 12
1.4 I can write a conclusion for an experiment. 16
1.4 I can assess the validity and reliability of both primary and secondary data. 15
Review questions
Remembering
1. List the steps of the scientific method in order.
2. Recall the definition of a variable in an experiment.
3. Define the terms random error and systematic error.
Understanding
4. Explain why it is important to control variables during an experiment.
5. Identify three types of variables.
6. Describe how a scientist can ensure their research question is investigable.
SAMPLEPAGES
7. Explain why long hair should be tied back and safety goggles worn during practical investigations.
Applying
8. A class conducted an experiment to determine how different fertilisers affect plant growth.
a) Identify the independent and dependent variables in this experiment.
b) Propose a method for measuring plant growth over a month.
c) State ways they can ensure that the experiment is conducted fairly.
9. You are designing an experiment to test the effect of temperature on yeast fermentation. Outline a simple experimental procedure, including the materials needed.
10. Imagine you are testing the effect of caffeine on heart rate using living organisms. Describe the ethical considerations you must take into account.
Analysing
11. Consider the following hypothesis: ‘Increasing the amount of water will enhance the growth of bean plants’. A group of students conducted an experiment with three different watering schedules.
a) Examine the students’ experimental design for potential flaws.
b) Discuss how these flaws could impact the validity of their conclusions.
12. An experiment is conducted to evaluate the effectiveness of different medications on reducing fever. After analysing the data, the researchers observe a significant variation in results across participants.
a) Examine the factors that may have contributed to this variability in the results.
b) Discuss how the researchers could adjust their methodology to minimise this variability in future studies.
13. Yuki and Aria wanted to test who was the fastest runner in a 100 m sprint race. They raced each day for five days, timing each race. The results (in seconds) are listed below in order of day 1 to day 5:
Yuki: 15.8, 15.4, 15.3, 15.4, 15.2
Aria: 15.5, 15.2, 15.0, 14.9, 14.9
a) Organise the data by constructing an appropriate table.
b) Draw a graph of the results.
c) Identify any trends in the data.
Evaluating
14. Discuss how scientific reporting might differ between a laboratory report and a public science blog.
15. A student investigates the impact of music on concentration levels while studying.
a) Identify the variable the student is changing and how it might be measured.
b) Discuss how the student could control other variables to ensure a fair test.
c) After analysing the results, the student finds that music helped some classmates concentrate but distracted others. Evaluate this outcome and suggest reasons for the differences in results.
16. A conclusion claims ‘We proved that salt makes water boil faster’. Critique this conclusion.
SAMPLEPAGES
Data questions
A scientist was investigating the relationship between the volume that a certain mass of gas would occupy at different temperatures (while the pressure was constant) and the volume that the same mass of gas would occupy at different pressures (while the temperature was constant).
Figure 1.21 Variation of the volume of a gas at atmospheric pressure (P = 101 kPa), when temperature is changed
Figure 1.22 Variation of the volume of a gas at ambient temperature (T = 20°C), when pressure is changed
1. Identify the pressure exerted by a volume of 19 L of gas at 20°C, by referring to Figure 1.22.
2. Identify the dependent, independent or controlled character of each variable (volume, temperature, pressure) for the data presented in Figure 1.21.
3. Identify the volume occupied by a gas at 101 kPa pressure and a temperature of 10°C, by referring to Figure 1.21.
UNCORRECTEDSAMPLEPAGES
4. Identify the general relationships between the volume the gas occupies and the temperature, and the volume the gas occupies and the pressure.
5. Analyse whether the volume that the gas occupies is doubled when the temperature is doubled in Figure 1.21.
6. Use the two graphs to deduce the volume that the gas will occupy at 20°C and 101 kPa.
7. Extrapolate the data to predict the volume that the gas will occupy at 110°C and 101 kPa pressure.
8. In Figure 1.21, predict whether a new line will be higher or lower than the original if the pressure was increased to a constant 150 kPa.
9. Use Figure 1.21 and Figure 1.22 to deduce whether an increase in temperature at atmospheric pressure would affect the volume occupied by the gas.
Chapter 2 Cells
Introduction
Cells are the smallest unit of life and are the building blocks that make up all living things. They are like tiny factories that carry out vital processes to keep us alive. In this chapter, you will learn about the important role that cells play in living organisms. You will discover the different types of cells and how they work together to keep organisms healthy. You will also learn about cell structure and the processes that cells use to carry out their functions.
UNCORRECTEDSAMPLEPAGES
Microscopes are used to view cells
Chapter map
Cells are the building blocks of living things
Magnification Resolution Field of view
Some organisms are unicellular
Some organisms are multicellular
Contains specialised cells for specific functions
Made up of organelles with specialised functions
Section 2.1
Section 2.2
Section 2.3
Section 2.4 (online only)
Prokaryotic cells
Eukaryotic cells
Cell membrane
Genetic material
Cytosol
Nucleus
Ribosomes
Mitochondria
Endoplasmic reticulum
Golgi body
Cell wall (plants and fungi)
Vacuole*
Chloroplast (plants)
*some bacterial, protist and animal cells have vacuoles
UNCORRECTEDSAMPLEPAGES
Curriculum
Biological sciences
Cells are the basic units of living things and can be viewed with a compound microscope; animal cells have specialised structures and functions, including the cell membrane, cytoplasm, nucleus and mitochondria; plant cells have specialised structures and functions, including the cell membrane, cytoplasm, nucleus, mitochondria, cell wall, chloroplasts and large vacuoles.
• observing cell structures and determining cell size using a compound microscope
• comparing the structure and function of plant and animal cells
Collaborating and applying
Illustrate how the development of scientific knowledge has benefited from collaboration across disciplines and the contributions of people from a range of cultures
• identifying how microscopes and medical imaging have led to improved understanding of cells and organs
1. Consider how the invention of the microscope has contributed to understanding of cell structure.
2. Observe cell structures and determine cell size using a compound microscope.
3. Examine a variety of cells using a light microscope, a digital microscope, simulations and photomicrographs.
The microscope
Cells are the basic building blocks of all living things. They are the smallest unit of life that can carry out all the functions necessary for an organism’s survival. To study cells, scientists use microscopes. Microscopes allow us to see and study the tiny details of cells that are invisible to the naked eye.
Five hundred years ago, scientists used hand-held magnifying glasses to view small macroscopic specimens such as fleas – these are large enough to be visible to the naked eye. Scientists soon found that using two lenses together enabled them to see even smaller specimens. This discovery led to the invention of the first light microscope. The light microscope that you use today at school is not very different from those used by scientists hundreds of years ago, but the technology used to produce today’s lenses is more advanced and enables us to see things at higher magnifications. Anything that can only be seen clearly with the use of a microscope is described as microscopic
Did you know? 2.1
antonie van leeuwenhoek
Antonie van Leeuwenhoek was a Dutch scientist who is often credited with being the first person to see and describe microorganisms. He is considered one of the pioneers of microbiology, and his discoveries were made possible by his remarkable skill in building and using microscopes. Van Leeuwenhoek created his own microscopes, which were simple, single-lens instruments that he could use to magnify objects by up to 300 times. With these microscopes, he was able to observe and describe the shape and movements of single-celled organisms, including bacteria. He called these organisms ‘animalcules’, meaning ‘little animals’.
Uncorrected 2nd
Figure 2.1 This plate from 1743 illustrates animalcules, or unicellular organisms, discovered under magnification when examining teeth (figure I), along with scabies (figure II), skin samples (figure III), insects and a snake.
macroscopic visible to the naked eye microscopic can only be seen clearly with the use of a microscope
VIDEO Leeuwenhoek and his simple microscope
Explore! 2.1
The history of the microscope
In 1665, Robert Hooke published a book based on his observations of the microscopic world. He was able to do this because he had built a compound microscope with a twist-operated focusing mechanism – this had never been seen before. He further improved the microscope by placing a water flask beside the microscope to focus light from an oil lamp onto his specimens to illuminate them brightly.
UNCORRECTEDSAMPLEPAGES
1. Find out about the role of the following scientists in the development of the microscope and how these have led to an improved understanding of cells and organs: Professor Pratibha Gai-Boyes, Professor Ed Boyes and Professor Ian Wright; Robert Hooke; Antonie van Leeuwenhoek; Doctor Gertrude Rempfer; Frits Zernike; Marvin Minsky; Ernst Ruska; Gerd Binnig and Heinrich Röhrer.
2. Using A3 paper, draw an annotated timeline showing who developed what and when.
Parts of a microscope
Although some microscopes are more advanced than others, most of those you use at school are light microscopes that have the same basic components. The microscopes you use have at least two lenses: the eyepiece (ocular) lens and the objective lens, which are multiplied together to provide the total magnification. They also have a light source, a stage on which to place specimens and knobs to adjust the focus. The monocular microscope shown in Figure 2.3 is for use with one eye. Binocular microscopes can be used with both eyes.
Try this 2.1
parts of the microscope
Draw up a table with the parts of a microscope in the left column. Find out the function of each part and put this information in the right column.
Microscope terms
When you use a microscope, you will often encounter special terms. Table 2.1 summarises some key terms.
MagnificationHow much the image of the specimen or object is increased in size (i.e. how much you are zooming in)
Figure 2.2 The Hooke microscope (circa 1660)
Figure 2.3 The parts of a monocular microscope
Term Definition Image
ResolutionHow detailed and clear the image is (i.e. how easy it is to tell two separate objects apart)
UNCORRECTEDSAMPLEPAGES
Field of view (FOV) The maximum area that can be seen when you look through the eyepiece
Binocular microscopes have an eyepiece for each eye. There are two types: compound binocular and stereoscopic. Compound binocular microscopes have one light path from the specimen, which is split and led to both eyepieces, so each eye has the same view. Therefore, the image looks flat (2D). Stereoscopic (‘stereo’) microscopes, which are much more expensive, lead two separate light paths from the specimen to each eye, so they have different views. The image has depth (3D). This is useful for manipulating or dissecting specimens, and the magnification does not have to be very large. There are also trinocular microscopes that have an additional eyepiece that a camera can be attached to.
Light microscopes are limited in their usefulness. They can magnify a specimen up to ×1500, which is enough to make bacteria visible. However, the resolution at this magnification is not very high, and so light microscopes do not enable you to view anything smaller than bacteria in any detail.
Human flea
Figure 2.4 An image of a cucumber green spider taken with a camera mounted on a trinocular microscope
Figure 2.5 Light microscope images taken of the heads of
a horsefly,
a spider
Table 2.1 (continued)
The electron microscope
To observe things that are smaller than bacteria, scientists invented a different type of microscope, called an electron microscope. This microscope uses tiny particles called electrons, instead of light, to view an object. Electron microscopes have a magnification of around 10 million times and very high resolution. Since the invention of the electron microscope in 1933, we have been able to observe the structure of extremely small objects in high detail.
UNCORRECTEDSAMPLEPAGES
There are now two types of electron microscope:
• transmission electron microscope (TEM) – The specimen to be viewed is sliced very finely, and the internal structure can be seen because images are created from electrons transmitted (passing) through the specimen.
• scanning electron microscope (SEM) – The specimen to be viewed is not sliced, and only the external surface can be viewed because images are created from reflected electrons.
Unfortunately, electron microscopes are extremely expensive, and all specimens that are observed must be prepared in a way that requires them to be killed first.
research with microscopes
Researchers from The Kids Research Institute
Australia and the University of Western Australia used a special electron microscope called a focused ion beam scanning electron microscope (FIB-SEM) to look inside cells with incredible detail. This microscope allowed them to see how different parts of the cell interact with each other.
Using this advanced technique, researchers could observe how changes in these parts, especially when they are damaged, affect the overall health of the cell. This technology helped them discover that when certain parts of the cell don’t work properly, it can lead to problems for the whole cell.
2.7 This image shows a 3D picture of viruses (red) on tiny bridges connecting an infected immune cell (gold) to a healthy brain cell (blue). The image was created using focused ion beam scanning electron microscopy (FIB-SEM).
Figure 2.6 Examples of (a) the Ebola virus seen through a TEM, and (b) a German wasp head seen through an SEM
Figure
Quick check 2.1
1. State the maximum magnification of the monocular microscope, the stereo microscope and the electron microscope.
2. State what microorganisms were originally called.
3. Define the following key terms, in your own words: magnification, resolution, field of view.
Making thinking visible 2.1
see, feel, think, wonder
The following images have been produced from an SEM.
• See: describe what you see in these images.
• Feel: how do these images make you feel?
• Think: what do the images make you think about? Explain your reasoning.
• Wonder: what questions do you have about these images?
Figure 2.8 Examples of specimens as seen through (a) a TEM (Wolbachia bacteria within an insect cell), and (b) an SEM (a mite)
VIDEO Electron microscope
The See, Feel, Think, Wonder thinking routine was developed by Project Zero, a research centre at the Harvard Graduate School of Education.
Figure 2.9 (a) Head of a moth, (b) asbestos, (c) partially melted ice crystal, (d) ladybird eye
Using a microscope
Aim
To become proficient in using a microscope
Materials
• glass microscope slide
• cover slip
• light microscope
• pond water sample
• pipette
Method
Be careful
Ensure that the microscope is carried appropriately. Carry it with one hand holding the arm and one hand under the base. When adjusting the coarse focus knob, do not allow the objective lens to touch the glass slide and damage it.
1. Use the pipette to place a drop of pond water in the centre of the glass slide.
2. Gently place a cover slip over the drop of water to create a wet mount.
2.10 Lowering the cover slip slowly is very important when preparing a wet mount.
3. Place the slide on the stage of the microscope and secure it in place with the clips.
4. Set the lowest magnification or smallest objective lens in place. Turn the coarse focus knob until it is as close to the stage as it will go while looking from the side of the microscope.
5. Wind the coarse focus knob, to lower the stage until the pond water sample starts to come in to focus.
6. Draw what you can see in the field of view at this lowest magnification. Record the magnification next to your drawing. To calculate the magnification, you will need to multiply the magnification of the eyepiece (ocular) lens by the magnification of the objective lens. For example, if the eyepiece is ×10 magnification and the objective lens is 4× magnification, then the overall magnification is 10 × 4 = ×40.
7. Try moving the stage left and right, forwards and backwards, and note what you observe about the movement of the image.
8. Repeat steps 3–6 for each of the optical lenses. You should no longer use the coarse focus knob now; use only the fine focus knob to focus your specimen.
UNCORRECTEDSAMPLEPAGES
Figure
Figure 2.11
Results
Your results will consist of:
• your drawings of the field of view using the different objective lenses. Include the magnification of each drawing.
• your notes about what happens when you move the stage left and right, forwards and backwards.
Discussion
1. Explain what happened to the single-celled organism when viewed under the microscope at low magnification.
2. Describe what happened when you increased the magnification using the different objective lenses.
3. Describe what you observed as you moved the slide – did the organism go in the same direction as the direction in which you moved the slide?
4. As the magnification of an image increases, the resolution decreases. State the magnification at which you would have had the lowest resolution.
5. Explain what happened to the field of view as you increased the magnification of the objective lens.
6. Outline a safety precaution you would use when observing a specimen using the highest magnification objective lens.
7. Summarise the advantages and disadvantages of using a light microscope.
smartphone disease detection
Smartphone cameras are not designed to produce high-resolution microscopic images. However, devices that are designed to convert smartphones into microscopes have been developed. They increase the resolution and the visibility of tiny details in the images, which they take down to a scale of approximately one-millionth of a metre; they have the potential to make mobile medical diagnosis of diseases affordable and accessible.
The detection of diseases often requires changes in cells being detected using optical microscopy. This involves staining the cells with chemicals in a laboratory and the use of specialised phase-imaging microscopes. These microscopes are expensive and bulky and so are inaccessible to remote or disadvantaged medical centres in developing countries.
This new smartphone technology could lead to in-home disease detection, in which a person could obtain their own saliva or pinprick blood sample then send an image to a laboratory that could analyse and diagnose the disease.
SAMPLEPAGES
Figure 2.12 A smartphone connected to an infrared light spectrometer can detect malaria in 10 seconds.
Cell theory
Cells are extremely small, and most cells cannot be seen with the naked eye. They are described as being microscopic. It wasn’t until 1665, when Robert Hooke built a compound microscope that lit up the specimen he was viewing, that we even knew cells existed. Because of the improvements he made to the microscope, he was able to observe that a dead cork plant appeared to be made of small blocks. He named these blocks ‘cells’ because they looked like the small identical cells that monks lived in at the time.
UNCORRECTEDSAMPLEPAGES
Nearly 200 years later, after many other scientists had observed and catalogued many more types of cells, a cell theory was proposed.
This first cell theory stated that:
• Cells make up all living things.
• Cells are the basic building blocks of all living things.
• All cells form spontaneously from their environment, in a similar way to crystals forming. We now know that the third part of this theory is incorrect, as cells do not just pop into existence.
Modern cell theory is summarised as follows:
KEY IDEA
Cell Theory:
• Cells make up all living things.
• Cells are the basic building blocks of all living things.
• All new cells are produced from existing cells.
• All cells contain genetic information, which is passed from cell to cell during cell division.
Figure 2.13 The cork cells (a) Hooke observed looked like the monks’ cells in the building plans (b) of monasteries (c).
Did you know? 2.3
egg cells
Cells come in many sizes. The main reason is simple: their size and structure depend on their function. Ova, also known as eggs, are some of the largest cells in the animal kingdom. They are typically much larger than other cells such as red blood cells and muscle cells. This size is necessary for the egg to contain all the nutrients and genetic material required for the development of a new organism. The size of an egg varies greatly depending on the species, with some bird eggs being over 100 times larger than a human egg. This large size allows the egg to provide enough sustenance and protection to the developing embryo until it hatches.
2.14 A human ovum in the fallopian tube. Ova are ‘macro’ cells. Macro means ‘large scale’, and so they can be seen with the naked eye – that is, without a microscope. Some can be seen easier than others though. An ostrich egg is approximately 15 cm long, while a human ovum is only 0.12 mm and is only just visible to the human eye!
UNCORRECTEDSAMPLEPAGES
Quick check 2.2
1. Name the largest cell in the human body.
2. Contrast the terms ‘micro’ and ‘macro’.
3. Explain why cells come in many shapes and sizes.
Did you know? 2.4
skin
You lose about 40 000 skin cells every minute of every day. This means that, over a lifetime, you will lose at least half of your body weight in skin cells. Have you ever wondered where dust comes from? Most of the dust in your house is made up of your dead skin cells.
Figure 2.15 Dust mites are microscopic organisms that are found in virtually all homes, feeding on organic detritus such as dead skin cells. They are not parasites and do not bite humans, but their faeces can trigger allergic reactions in some people.
Uncorrected 2nd sample
Figure
Try this 2.2
Cell size
In science, it is important to use appropriate units when measuring different objects. You would not measure the size of a bedroom in kilometres, or the size of an ant in metres. Therefore, when you measure cells, it is important to use a very small unit. This is usually a micrometre (µm). A micrometre is 1000 times smaller than a millimetre (mm).
Using Figure 2.16, convert the cell sizes in the table into millimetres (mm) or micrometres (µm).
Figure 2.16 Conversions needed for different measurements
Figure 2.17 Red blood cells
Figure 2.18 Plant cells on leaf surface
Figure 2.19 Sperm cells
Practical 2.2
Measuring cell size using field of view (FoV)
Aim
To learn how to measure the size of cells under a microscope by calculating their size based on the field of view (FOV) and converting measurements from millimetres (mm) to micrometres (µm)
UNCORRECTEDSAMPLEPAGES
Materials
• compound microscope
• prepared slides of cells (e.g. onion cells, cheek cells)
• ruler or micrometer (optional for measuring FOV)
• calculator or paper for converting units
• pencil and paper for drawing observations
Method
1. Prepare the slide: Place a sample of cells (e.g. onion cells or cheek cells) onto the microscope slide and cover it with a cover slip.
2. Set up the microscope: Start with the lowest magnification (usually 4× or ×10 objective lens) and focus the sample using the coarse and fine adjustment knobs.
3. Determine the field of view (FOV):
Look at the microscope’s field of view. You can estimate the size of the area you can see under the microscope. If you know the size of the FOV at a particular magnification, use this to help measure cell sizes.
For example, at ×10 magnification, the FOV may be about 1.5 mm across. If the FOV is not provided, you can use a micrometer or ruler to measure it directly under the microscope.
4. Measure the size of the cell: Count how many cells fit across the diameter of the field of view. For example, if five cells fit across the FOV, and you know the FOV is 1.5 mm, you can calculate the approximate size of each cell.
Formula: cell size = FOV ÷ number of cells across the FOV
Example: cell size = 1.5 mm ÷ 5 cells = 0.3 mm per cell
5. Convert from millimetres (mm) to micrometres (µm):
To convert millimetres to micrometres, multiply by 1000 (because 1 mm = 1000 µm).
Example: 0.3 mm = 0.3 × 1000 = 300 µm
6. Draw and record: Draw the cells you observe, label their structures and write down their approximate size in micrometres.
What to look for:
• the number of cells that fit across the FOV
• the size of individual cells based on your calculations
• how cell sizes compare at different magnifications (if you change the magnification)
7. Challenge: Try measuring cells at different magnifications and compare the sizes by calculating the FOV for each magnification (e.g. ×40, ×100).
Go online to access the interactive section review and more!
Section 2.1 review
Online quiz
Section 2.1 questions
Remembering
1. Define the term ‘microscopic’.
2. Recall the modern cell theory.
Section questions
Teachers can assign tasks and track results
3. State the function of each of the following parts of the microscope.
Part
Stage
Eyepiece
Objective lens
Coarse focus knob
Fine focus knob
Function
4. Recall the contribution of Robert Hooke to our understanding of the cell.
Understanding
5. Summarise the advantages of using a:
a) monocular light microscope
b) stereo microscope
6. Summarise why it is important to move the stage away from the objective lens before putting the slide on the stage. (Think about the safety notes.)
Applying
7. A nanometre (nm) is 1000 times smaller than a micrometre (μm). Generally, a virus is around 0.0225 μm in size. Calculate this size in nanometres.
8. Calculate the magnification of the specimen when using the following objective lenses.
9. Copy and complete the following table to calculate the sizes of the different specimens.
Analysing
10. Distinguish between a TEM and an SEM.
11. Demonstrate how you would determine the size of a cell.
12. Classify the following specimens into three groups: those that can be seen easily with the naked eye; those that can be seen with a light microscope; and those that can be seen only with an electron microscope. (Some might belong in more than one group.)
UNCORRECTEDSAMPLEPAGES
• plant cell (100 μm)
• frog egg (1 mm)
• red blood cell (7 μm)
• phytoplankton (2 μm)
• chicken egg (50 mm)
• virus (35 nm)
• bacterium (1 μm)
Evaluating
13. Propose the reason that different units are used to measure different-sized objects.
14. Create a detailed set of step-by-step instructions for a year 6 student to safely use a microscope.
15. Justify the statement: ‘The development of microscopes has changed our understanding of cells’.
WORKSHEET
Cell types and structure
2.2 Organelles
Learning goals
At the end of this section, I will be able to:
1. Distinguish between prokaryotic and eukaryotic cells.
2. Identify the structure and function of organelles in cells.
all cells
multicellular composed of many cells
unicellular composed of just one cell cell membrane the barrier that separates the inside of the cell from the external environment DNA the material containing the code that allows the cell to produce copies of itself and to regulate the functions within the cell cytosol the water-based mixture that fills the cell, containing different molecules; many chemical processes that happen within a cell occur in the cytosol
UNCORRECTEDSAMPLEPAGES
Everything that we classify as living is made up of one or more cells. People, trees, fish and mushrooms are made up of many different cells working together and are known as multicellular . These cells depend on each other and cannot survive alone. Organisms in the kingdoms Bacteria, Protista and Archaea are made of single cells and are referred to as unicellular Each of these single cells, by itself, carries out all the processes needed to stay alive. Generally, unicellular organisms are quite simple and are similar to some of the oldest forms of life found on Earth, whereas the cells of multicellular organisms are specialised and much more complex.
All cells, no matter how simple, contain the following three components:
• a cell membrane
• genetic material in the form of DNA
• cytosol.
Cell membrane
Genetic material (DNA)
Cytosol
2.21 All cells, no matter how simple or complex, contain these three components.
Figure 2.20 Diatoms are single-celled algae with unique silica shells.
Figure
Figure 2.22 (a) Human liver cells, and (b) unicellular Bacillus anthracis bacteria
organelles
Simple and complex cells
All cells can be grouped into two main categories: prokaryotes (simple) and eukaryotes (complex). Prokaryotes are unicellular organisms such as bacteria, while eukaryotes can be unicellular or multicellular. Examples of eukaryotes are animals, plants, fungi and protists. The two categories of cell type are based on the structures found inside the cell. All cells have a membrane, cytosol and genetic material, but eukaryotic cells are more complex and also have many membrane-bound organelles, including a nucleus, that carry out specific functions. The specialised structures inside cells are known as organelles because they are like mini organs with specific roles.
The term ‘prokaryote’ means ‘before (pro) nut/kernel (karyon)’, meaning they were present before eukaryotic cells. Prokaryotic cells do not have a nucleus or any membrane-bound structures.
Try this 2.3 observing ‘friendly’ prokaryotes under the microscope
Using your microscope and wet mount preparation skills, look at some bacteria under the microscope. You will need the stain called methylene blue and a sample of yoghurt or probiotic drink containing live bacteria strains. Look at the size and structure of the bacterial cells and consider their similarities and differences.
2.23 3D representations of (a) a eukaryotic cell versus (b) a prokaryotic cell. Can you identify the cell membrane, genetic material and cytosol in each cell type?
The cell city
Although all cells contain a cell membrane, genetic material and cytosol, as described previously, only complex eukaryotic cells contain the specialised membrane-bound organelles covered in this section. These organelles have a membrane around the outside that helps to compartmentalise them and allows them to do their jobs more efficiently. It is helpful to compare the cell to a city. A city has many needs, and each organelle caters for one or more of those needs.
Nucleus containing DNA
VIDEO
Cells of living things
prokaryote a unicellular organism that lacks membrane-bound organelles and a nucleus
eukaryote any cell or organism that possesses membrane-bound organelles and a nucleus
bacteria very small prokaryotic organisms that lack membrane-bound organelles and a nucleus; most have cell walls
membrane-bound organelle an organelle that is surrounded by an outer covering made of fat
organelle a specialised structure in a cell that has a specific function or role
Figure 2.24 A eukaryotic cell with labelled organelles
Figure
Nucleus
The nucleus is a structure that holds the genetic material of a cell. It is like the brain of the cell and controls all its functions. In a city, the nucleus would be the top level of government, which keeps all the plans and blueprints and makes all the important decisions.
Genetic material
The genetic material found in the nucleus is called deoxyribonucleic acid (DNA). DNA is the coded information that makes you who you are and tells every cell what to do. The code has all the instructions that a living organism needs to grow, reproduce and function. A DNA molecule is shaped like a twisted ladder, and this shape is called a double helix. In the cell city, DNA would be the plans and laws that the government (the nucleus) uses to keep everything running smoothly.
you know? 2.5
The Moon and back!
If you stretched the DNA in one cell all the way out, it would be over two metres long! This means if you lined up the DNA from all your cells, it would reach to the Moon and back approximately 1500 times!
Figure 2.25 (a) Graphic representation of a nucleus, (b) an electron microscope image of a nucleus within a plant cell, (c) Parliament House, Canberra. The nucleus makes all the major decisions for the cell city.
Figure 2.26 Graphic representation of a DNA molecule
Cell membrane
The cell membrane is a thin double layer that separates the inside of the cell from its external environment. It contains molecules such as fats and proteins that play a role in checking what passes through the membrane. The cell membrane is like a border checkpoint of the cell city, controlling who enters and leaves.
UNCORRECTEDSAMPLEPAGES
Cytosol
The cytosol is the liquid part of the cytoplasm, the substance that fills the interior of all cells. It is a mixture of water and other molecules that plays a crucial role in many cellular processes. Although it appears mostly transparent under a light microscope, it has a very complex structure, with regions that vary greatly in composition – parts of it may resemble jelly. Many of the chemical reactions that cells require to function take place between molecules dissolved in the water of the cytosol and are controlled by enzymes. Many nutrients and other materials may be stored in the cytosol.
Using the city analogy, the cytosol makes the cell city like Atlantis, an underwater city.
Ribosomes
Ribosomes are very small structures that ‘read’ the codes sent to them from the DNA and use these to produce proteins that the cell needs to build structures and carry out different functions. Ribosomes would be the factories of the cell city, producing bricks, cars and different tools for the city to use.
Mitochondria
Mitochondria (singular: mitochondrion) are where food is turned into energy, in a process called cellular respiration. Cells use this energy for many tasks, such as moving things into and out of the cell, and cell growth, repair and reproduction. The mitochondria can therefore be thought of as the power station of the cell.
enzyme a protein that speeds up chemical reactions in living organisms
ribosome
a structure in a cell that reads genetic information to assemble proteins
mitochondrion
a structure in a cell that converts the energy from food into the form needed by the cell during cellular respiration
cellular respiration
a process that occurs inside the mitochondria, during which oxygen and glucose react to form carbon dioxide and water, producing useable energy
Figure 2.27 The cell membrane (left) provides ‘border security’ for the cell.
Figure 2.28 (a) Graphical representation of the inside of a mitochondrion, (b) an electron microscope image of mitochondria, (c) The mitochondria produce energy from food, much like power stations can produce electricity from coal.
endoplasmic reticulum an organelle that is involved in making and transporting fats, carbohydrates and proteins
Golgi body a structure in a cell involved in the modification, packaging and transport of proteins and lipids
Endoplasmic reticulum
The endoplasmic reticulum (ER) is a folded membrane attached to the nucleus. The name ‘endoplasmic reticulum’ is a description of what it does: endo (inside), plasmic (cytoplasm), reticulum (network). There are two types of ER in the cell.
The rough ER is where ribosomes are attached, and it is involved in the building and transport of proteins. If no ribosomes are attached, then it is smooth ER, which is involved in the making of carbohydrates and fats. The ER is like the industrial district of a city with a connected delivery system.
The rough ER is like factories in the industrial area, where workers (ribosomes) assemble proteins on production lines. The smooth ER is like a specialised plant nearby that produces fats and carbohydrates instead of proteins. Roads within this district move the newly made goods to other areas of the city.
2.29 (a) Graphical representation of the endoplasmic reticulum around the outside of the nucleus, (b) The endoplasmic reticulum is the highway network of the cell city, (c) an electron micrograph of the rough endoplasmic reticulum
Golgi body
The role of the Golgi body (also known as the Golgi apparatus) is to modify and package the proteins and lipids made by the endoplasmic reticulum then export them to their destination. Golgi bodies are like the post office of the cell. They place proteins and lipids into small sacks of membrane, called vesicles (the ‘postal vans’), and send them to where they are required.
Try this 2.4 organelles
Draw up a table with three columns. List all the organelles covered in this section in the left column. Give a description of their role in a cell in the middle column and provide a simple picture or diagram in the right column.
Figure
Figure 2.30 (a) Graphic representation of a Golgi body, (b) Golgi bodies act as the postal system of the cell city. (c) an electron micrograph of the Golgi body
Quick check 2.4
1. State the terms used for simple and complex cells.
2. Define the term ‘organelle’.
3. Copy Figure 2.31 and label the following organelles: cell membrane, cytosol, nucleus (includes genetic material), ribosomes, smooth and rough endoplasmic reticulum, Golgi bodies, mitochondria.
Section 2.2 questions
Remembering
1. State three organelles found in all cells.
2. State three organelles found only in eukaryotic cells.
3. Identify the correct organelle from each description.
a) produces energy for cells
b) a barrier between the inside and the outside of cells that controls what enters and leaves c) a water-based mixture that fills the cell, and where many chemical processes happen d) makes proteins using the instructions provided by the genetic material of the cell Understanding
4. Explain the function of the nucleus.
5. Summarise why the Golgi body can be thought of as the post office of the cell.
Applying
6. Compare the roles of the rough endoplasmic reticulum and the Golgi body.
7. Compare the function of the cell membrane with that of the nucleus.
Analysing
8. Distinguish between unicellular and multicellular, using examples.
Evaluating
9. Different cells have different numbers of mitochondria. Propose a reason why muscle cells contain more mitochondria than skin cells.
10. Propose why cells contain many ribosomes.
VIDEO Eukaryotic cells
Figure 2.31 Diagram of a eukaryotic cell
Section 2.2 review
Online quiz
Section questions
2.3 Eukaryotic cells
Learning goals
At the end of this section, I will be able to:
UNCORRECTEDSAMPLEPAGES
chloroplast a structure in a plant cell that contains chlorophyll and conducts photosynthesis
1. Compare plant and animal cells.
2. Design a physical or digital model of a cell and explain how the representation models the cell.
Eukaryotic organisms are made of eukaryotic cells and therefore have many organelles in common. You may recall from year 7 that eukaryotes can be found in the kingdoms Animalia, Plantae, Fungi and Protista. In this section, you will look at the differences between the cells of the organisms found in these kingdoms.
animal cells
Animal cells typically contain all the organelles discussed in the previous section, although the number of each may vary depending on the specific cell type.
For example, muscle cells, which require energy for contraction, have many mitochondria to meet their energy demands. Liver cells, which are involved in detoxification, contain lots of smooth endoplasmic reticulum to process various metabolites. Metabolites are substances involved in or produced by chemical reactions in living organisms. Cells involved in protein secretion, such as pancreatic cells, have higher numbers of Golgi apparatus and rough endoplasmic reticulum to synthesise and package enzymes.
1. State the organelles that are found in animal cells.
plant cells
Plants are different from all other eukaryotic organisms in many ways. Most noticeably, they can make their own food in a process called photosynthesis. This difference means that plants have some organelles that animals and fungi lack. The special organelle in plants that carries out photosynthesis is called a chloroplast
Chloroplasts contain a green pigment called chlorophyll, which captures the Sun’s light. It is because of this pigment in chloroplasts that plants appear green. Chloroplasts are found in plant cells that are exposed to light (e.g. leaf cells) but not in the cells of roots.
Figure 2.32 Plants, animals and fungi living together
Quick check 2.5
Figure 2.33 Plant cells; the green blobs are chloroplasts. Also note the thick cell wall that surrounds each cell.
Because plants do not need to move, they lack a skeleton and muscles, but they still need to be able to support their weight so they can grow tall, towards the light from the Sun. This is why plant cells have a cell wall. The cell wall is a rigid structure that surrounds each cell (sitting outside the cell membrane) and provides shape and support for the plant. The cell wall is made of a substance called cellulose.
Plant cells also contain an organelle called a vacuole. This organelle stores water and other nutrients for the plant. It also works with the cell wall to help support the plant and give it shape. If you have ever forgotten to water your plants at home, you might have noticed that they droop and wilt, becoming floppy, and if not watered they will start to die. This is because the vacuoles in each cell lose so much water that the cells become flaccid, and so the plant cannot hold its shape.
Animal cells also contain vacuoles, but they are much smaller and are mainly used for storage of nutrients. The cells of some fungi, protists and bacteria may also have vacuoles.
Try this 2.5
Cell exploration
Use the internet to find a free online interactive 3D model that will allow you to understand the scale and scope of cells. You may want to consider the Cell Explorer by SCoPE or Cell Size and Scale by Learn.Genetics.
distinguishing animal cells from plant cells
You have seen that animal cells and plant cells have many organelles in common, as they are both eukaryotic cells that have many processes in common. However, you have also learned about the additional organelles that plant cells have due to their different structures and functions. It is generally easy to identify plant cells under the microscope, because the cell wall usually gives them a shape with rigid straight lines and a thick outline, whereas animal cells have a less uniform shape and a much thinner outline. cell wall
UNCORRECTEDSAMPLEPAGES
Figure 2.34 Eucalyptus trees grow as tall as they do because of the rigid cell wall that surrounds each of their cells.
Figure 2.35 A thirsty plant; the vacuoles are no longer full of water and so they cannot help support the plant to stand upright.
WIDGET Eukaryotic organelles
Quick check 2.6
1. Name the organelles in a plant cell that an animal cell does not have.
2. Explain why plant cells have each of these ‘extra’ organelles.
Golgi body
Ribosome Rough endoplasmic reticulum
body
Cell membrane
Cytosol
Mitochondrion
Nucleus
Nucleus Smooth endoplasmic reticulum
Mitochondrion
Ribosome Smooth endoplasmic reticulum
Vacuole
Cytosol
Chloroplast
Cell membrane
Cell wall Rough endoplasmic reticulum
Golgi
Figure 2.36 Animal cell (a), and plant cell (b) showing the major structures and organelles
Figure 2.37 (a) Human cheek cells stained blue, (b) leaf cells from moss
observing cells under a microscope
Aim
To observe the characteristics of plant, animal, fungi and bacteria cells
Materials
• light microscope
• glass slides and cover slips
• toothpick
• onion and celery
• iodine solution
Method
1. Prepare wet mounts:
UNCORRECTEDSAMPLEPAGES
• ripe and unripe bananas
• prepared fungal cell slides (or yeast)
• prepared animal cell slides
• prepared bacterial cell slides
a) Peel a translucent (see-through) piece of tissue from the onion.
b) Place the piece of onion tissue on a glass slide and add a drop of iodine solution.
c) Cover the slide with a cover slip, using your wet mount technique.
d) Repeat steps a–c for the celery.
e) Use the toothpick to collect some ripe banana cells and smear them as thinly as you can across a glass slide.
f) Add a drop of iodine solution and then cover with a cover slip.
g) Repeat steps e–f for the unripe banana.
2. Observe the cells: starting with the microscope on the lowest magnification, turn the coarse focus knob to move the stage away from the objective lens. Place your first slide on the stage and focus using the coarse focus knob. Once focused, turn to the next objective lens. Use only the fine focus knob to focus now. Once focused, move to the highest magnification and again focus using the fine focus knob.
3. Draw a diagram:
a) Using a pencil, draw diagrams of an onion cell, a celery cell, a ripe banana cell, an unripe banana cell, four animal cells, fungal cells and bacteria cells from the prepared slides.
b) Label all the organelles you can see, using a ruler and labels at the side of the diagram.
c) Record the name of the specimen, the magnification of the drawing, and determine the cell size.
Results
Your results will be in the form of diagrams for:
• four plant cells (onion, celery, ripe banana, unripe banana)
• four animal cells from the prepared slides
• fungi cells from the prepared slides
• bacteria cells from the prepared slides.
Discussion
1. Explain why stains are needed.
2. Compare the onion and celery cells: what similarities and differences did you observe?
3. Compare the ripe and unripe banana cells: what similarities and differences did you observe? Can you explain the differences?
4. What characteristics did you observe in the plant cells? In the animal cells? What did they have in common? Explain why there are differences.
5. Are the plant and animal cells all the same size? If there are differences, can you explain why?
6. What characteristics did you observe in the bacterial cells? In the fungal cells? What did they have in common? Explain why there are differences.
Try this 2.6
Making a model: 3d cell
Aim
To create a 3D model of a plant cell and an animal cell using the materials provided
Materials
• black beans
• white beans
• ping pong balls
• zip lock bags
• red food colouring
Method
UNCORRECTEDSAMPLEPAGES
• green food colouring
• takeaway food container
• poppy seeds
• balloons
• glue and tape
1. Look at the materials your teacher has provided for you and decide what you are going to use to represent each part of the plant cell and the animal cell.
2. Copy and complete the table below to indicate how each organelle is going to be represented in your model.
3. Construct your 3D model of the cell.
4. Explain to the class and your teacher how your model represents all the parts of a cell.
Results
Plants
Cell structure
Nucleus
Cell membrane
Mitochondria
Ribosomes
Golgi body
Endoplasmic reticulum (rough)
Endoplasmic reticulum (smooth)
Cytosol
Large vacuole
Chloroplast
Cell wall
Discussion
Materials used
Animals
Cell structure
Nucleus
Cell membrane
Mitochondria
Ribosomes
Golgi body
Endoplasmic reticulum (rough)
Endoplasmic reticulum (smooth)
Cytosol
Small vacuoles
1. Explain why models are used in science.
2. Assess two strengths and two limitations of your model.
3. Propose a way to make your model more accurate.
Materials used
Fungi
Fungi have similarities to both plants and animals and most are multicellular. Fungi are heterotrophs, like animals, which means they must digest other organisms in order to gain nutrients. Fungal cells therefore don’t have chloroplasts like plant cells do. They are like plants in that they have a cell wall, but their cell wall is made of chitin, not cellulose.
Did you know? 2.6
Fungi and beetles
The cell wall of fungal cells is made of chitin, and this is the same material that makes up the exoskeleton of insects such as beetles.
UNCORRECTEDSAMPLEPAGES
Figure 2.38 Beetle exoskeletons and fungal cell walls are made of the same substance: chitin.
The main body of a fungus is called the mycelium; this is a large network of small filaments, called hyphae, that can stretch for over 10 kilometres! You don’t often see hyphae, as they are very small, and you only really notice a fungus when it develops a fruiting body when conditions are perfect. This fruiting body can be seen as a mushroom or a toadstool, a truffle or a puffball. This is why you often see mushrooms appear soon after heavy rainfall. The fungus makes these fruiting bodies to produce spores to reproduce.
1. State whether fungi are prokaryotic or eukaryotic.
2. Contrast the cell wall of a plant with the cell wall of a fungus.
protist a eukaryotic organism that is part of the kingdom Protista
protists
Protista is a kingdom that consists mostly of unicellular organisms; however, there are a few multicellular examples, such as kelp. They are eukaryotic, so they contain the organelles that you learned about in the previous section. However, scientists have changed the classification of many of these organisms several times because they display characteristics of both plants and animals. All protists need to live in a moist environment and so are very common in most aquatic environments. If you look at a sample of pond water under the microscope in the warmer months of the year, you will likely see many types of protists, such as Euglena and Amoeba Each of these types of protists is slightly different in structure, depending on its function.
Go online to access the interactive section review and more!
Euglena have chloroplasts, which are typically considered a plant cell organelle, but they also have a flagellum, which is more typical of an animal cell.
Section 2.3 review
Online quiz
Section 2.3 questions
Remembering
1. State the organelle involved in photosynthesis.
2. Name the three key differences between plant cells and animal cells in terms of their organelles.
3. List three examples of protists.
Understanding
4. Outline the two parts of a plant cell that provide support and explain how they work together.
5. Explain why fungi are known as heterotrophs.
6. Summarise the steps you need to take when preparing a wet mount.
Applying
7.a) Name the organelles labelled A to E in the eukaryotic cell shown in Figure 2.43.
b) What type of cell is shown in Figure 2.43? Explain your answer.
8. Identify where you are most likely to find protists.
Figure 2.43 Eukaryotic cell
Nucleus
Chloroplast
Flagellum
Vacuole
Figure 2.41
Figure 2.42 Protists: (a) Amoeba, (b) Euglena
Analysing
9. a) Compare an animal cell to a fungal cell in terms of the cell’s structure and organelles. You may choose to present the information in a Venn diagram.
b) Compare a plant cell to a fungal cell in terms of the cell’s structure and organelles. You may choose to present the information in a Venn diagram.
10. Yeast are unicellular eukaryotic cells and belong to the Fungi kingdom. A student conducted an experiment to test the effect of temperature on the activity of yeast, which will produce a gas when added to a solution of sugar in water. The student placed 2 g of yeast and 10 g of sugar into a glass apparatus full of water, designed to trap any gas produced in a closed narrow vertical tube at the top. The amount of gas can be measured by the height of the column of gas that collects in the tube. They did the experiment three times with the apparatus containing water at three different temperatures and measured the height of the column of gas produced after one minute.
a) Using the student’s results, assess the effect of temperature on yeast function.
b) Identify the optimum temperature for yeast activity.
c) Suggest the effect that an even higher temperature, such as 100°C, would have on the yeast being tested.
Evaluating
11. Propose reasons why protists are difficult to classify.
Chapter review
Chapter checklist
Success criteria Linked questions
2.1 I can describe how the invention of the microscope has contributed to understanding of cell structure. 6, 7
2.1 I can determine cell size using a compound microscope. 16
2.2 I can distinguish between prokaryotic and eukaryotic cells. 14
2.2 I can identify the structure and function of organelles in cells. 4a, 4b, 5, 9,
2.3 I can compare plant and animal cells. 4c, 10, 12
2.3 I can design a physical or digital model of a cell and explain how the representation models the cell. 8, 15
Online only
2.4 I can describe the structure and function of specialised cells in multicellular organisms.
Scorcher competition
Go online to access the interactive chapter review Review questions Data questions
Review questions
Remembering
Section 2.4 questions
1. Of the four kingdoms – Animal, Plant, Fungi, Protist – state which have unicellular organisms and which have multicellular organisms.
2. Name two examples of protists.
3. Name the common components of the monocular light microscope.
4.a) Recall the role of the following organelles in the cell.
Organelle
SAMPLEPAGES
Nucleus
Cytosol
Golgi body
Ribosomes
b) Copy the cell diagram in Figure 2.44, and identify the organelles listed in part a
c) Is the cell shown in part b a plant cell or an animal cell? Explain how you know.
5. Recall the role of the mitochondria in cells and why they are so important.
6. Identify two disadvantages of the electron microscope.
7. Identify the type of microscope that needs to be used to view objects smaller than a cell.
Role in the cell
8. Peroxisomes are small organelles found in eukaryotic cells. Their job is to break down waste in the cell. Using the ‘cell as a city’ model, select an appropriate analogy for peroxisomes.
Understanding
9. After going on holiday, you come home to find that all your plants are wilted. Explain why this has occurred, referring to parts of the cell.
10. Use ‘yes’ or ‘no’ to summarise the organelles that are found in each cell type.
Animals
UNCORRECTEDSAMPLEPAGES
Plants
Nucleus
Cell wall
Large vacuole
Cytosol
Cell membrane
Chloroplast
Applying
11. Organise the following microscope instructions in order by numbering the steps in the left column. Step 1 has been done for you.
Step
Description
Check that the iris adjustment is open.
Draw a diagram.
Return to low magnification objective lens
Centre your specimen slide on the stage.
Rotate the objective lenses until the low magnification lens is in place. Turn on the power.
1 Carry microscope with two hands to the bench.
Carry microscope with two hands back to the cupboard.
Turn off the power and let the lamp cool.
Using the coarse focus knob, focus away from the slide.
Lower the lowest magnification objective lens until it is close to the stage.
Swing a higher magnification objective lens into place.
Remove cover and plug in the microscope.
Unplug the microscope, pack up and place on cover.
Use only the fine focus knob.
12. Classify animals and plants as unicellular, multicellular or both.
Analysing
13. Contrast the terms ‘resolution’ and ‘magnification’.
14. Draw a Venn diagram to compare prokaryotic cells (such as bacteria) with eukaryotic cells (such as plant and animal cells).
Evaluating
15. Evaluate the use of models when explaining the structure of the cell.
16. A student reports that their cell is 5 mm long. Evaluate the likely accuracy of this result and suggest what might have gone wrong during their measurement.
Uncorrected 2nd
Data questions
The human body is composed of trillions of cells that work together to carry out various functions necessary for life. Estimating the total number of cells in an adult human body is a challenging task, but researchers have made significant progress in recent years. By studying individual organs and tissues and using various methods, such as microscopy, scientists have developed estimates for the number of cells in the human body, divided by cell type. These are shown in Figure 2.45.
UNCORRECTEDSAMPLEPAGES
Skin cells, 0.6%
Muscle cells, 0.001%
Blood vessel cells, 2.1%
Platelets, 4.9%
Liver cells, 0.8%
Bone marrow cells, 2.5%
Lung cells, 1.0%
Fat cells, 0.2%
White blood cells, 1.5%
Other cells, 2.6%
blood cells, 84%
Figure 2.45 Estimated cell numbers in an average adult human, divided by cell type
Cell turnover refers to the ongoing process of breaking down and recycling cellular components like proteins, fats and organelles, while also creating new molecules to build fresh cells. This continuous renewal is essential for maintaining good health and proper bodily function. The speed of cell turnover varies depending on the specific cell, tissue and organ. For instance, skin cells have a short lifespan of a few weeks, while liver cells can endure for years.
Figure 2.46 shows the mean lifespan of different cell types and their total mass in an adult human.
1. Identify the most common cell type, using Figure 2.45.
2. Identify the least common cell type, using Figure 2.45.
3. If the estimated total number of cells in an adult human is 30 × 1012 (30 trillion), calculate the total number of red blood cells, using Figure 2.45.
4. Identify the cell type that has the highest total cell mass, using Figure 2.46.
5. Identify the cell type that has a mass turnover of 0.08 g per day, using Figure 2.46.
Red
6. Contrast small and large intestine cells, using Figure 2.46.
Cellularmassturnovergd–1
Figure 2.46 The mean lifespan (days) and total cell mass (grams) of different cell types in an adult human.
Note that both the x-axis and the y-axis increase by a factor of 10 at each interval.
7. Categorise the following cells as having either a high turnover rate or a low turnover rate, using Figure 2.46: heart cells, white blood cells, red blood cells, lung cells.
8. Compare stomach cells and muscle cells, using Figure 2.46.
sTeM activity: Designing a self-sustaining community
Background information
Just as cells are made up of various organelles that perform specific functions to keep the cell alive and healthy, a community consists of different sectors and services that work together to ensure the wellbeing and functioning of its residents. Each sector, much like an organelle, has a specific role that contributes to the overall community. This can include sectors such as energy, healthcare, transportation, education and waste management.
DESIGN BRIEF
Design a self-sustaining community using cells as a model.
activity instructions
In a group, use your knowledge of the functions of cell organelles and make comparisons with the functions of community sectors to create a modern self-sustaining community design. Your design should address common challenges such as energy supply, healthcare access, efficient transportation, education and waste management. You can present your work to the class through a poster, PowerPoint or vlog/video.
Suggested materials/presentation format
• poster
• PowerPoint • video
UNCORRECTEDSAMPLEPAGES
Research and feasibility
1 List all the major organelles and their functions. Research the issues that face a city and then match the issues/resources required with the organelle. An example has been provided for you.
OrganelleFunctionCommunity sector/issue
Golgi bodyPackaging and distribution of proteins
Design and sustainability
How the organelle provides the solution
Logistics and distributionActs as warehouses and distribution centres, ensuring the flow of goods
2. Choose a type of community to model (e.g. urban, rural, coastal) and sketch a diagram of this community. Label the major sectors with the corresponding organelle.
3. Discuss the sustainability of the community you have designed. How could the community be self-sufficient for all its resources? Consider factors such as renewable energy, local food production and efficient waste management.
Create
4. Reflect on your basic design and start building a larger detailed drawing that incorporates all your ideas. Keep thinking about all the challenges faced by communities and how they are managed.
5. Present your self-sustaining community model to the class, highlighting how each sector of your community corresponds to a cell organelle and explaining how the system maintains sustainability.
Evaluate and modify
6. Analyse the solutions you have come up with and comment on how achievable they would be in the real world today.
7. Explain any potential problems that might be encountered when implementing your solutions in the real world. Discuss the types of technologies that could be incorporated into your solutions (e.g. smart grids, vertical farming, waste-to-energy systems).
UNCORRECTEDSAMPLEPAGES
Chapter 3 Body and plant systems
Introduction
Animals and plants are made up of incredible systems, each composed of various parts that work together to sustain life. In this chapter, you will learn how cells, tissues and organs in the body work in unison to keep you functioning effectively. You will also explore how plants transport water, nutrients and sugars. You will learn about how these complex systems work together to allow organisms to survive and reproduce.
Chapter map
Damaged organs require repair or replacement for continued survival.
Many multicellular organisms are composed of various specialised cells that are organised into tissues, organs and organ systems.
Different organ systems are responsible for specific functions.
Section 3.1
Section 3.2
Section 3.3
Section 3.4
Section 3.5
Section 3.6
Section 3.7 (online only)
Gas exchange Transportation of materials Reproduction
Gas exchange in humans occurs in the lungs.
Gas exchange in plants occurs via the stomata.
Materials are transported in plants through the xylem and phloem.
Reproduction in vertebrates
Materials are transported in vertebrates through the circulatory system.
Reproduction in plants
UNCORRECTEDSAMPLEPAGES
Curriculum
Biological sciences
Flowering plant and vertebrate systems carry out specialised functions that enable them to survive and reproduce, including systems for gas exchange, transportation of materials around the organism and reproduction.
• comparing flowering plant and vertebrate systems for gas exchange, such as stomata and guard cells in flowering plants and respiratory systems in vertebrates
• comparing flowering plant and vertebrate systems for transportation of materials, through the xylem and phloem, and processes of capillarity and transpiration in flowering plants and the heart, blood vessels and blood in vertebrates
• comparing flowering plant and vertebrate systems for reproduction, such as the structure of the flower and vertebrate reproductive systems, and the processes of pollination and fertilisation
Collaborating and applying
3.2, 3.4
3.3, 3.4
3.5, 3.6
Illustrate how the development of scientific knowledge has benefited from collaboration across disciplines and the contributions of people from a range of cultures.
• identifying how microscopes and medical imaging have led to improved understanding of cells and organs 3.1
1. State the levels of organisation in a multicellular organism.
levels of organisation
The cells in your body work together in a complex and highly coordinated manner to ensure essential functions like nutrient uptake and waste removal. This is where tissues, organs and organ systems come into play.
Tissues are groups of similar cells that work together to perform a specific function. They are the building blocks of organs, which are structures made up of two or more types of tissues that work together for a common purpose. Organs, in turn, work together to form organ systems, each system fulfilling a different role in the body.
An example is shown in Figure 3.1.
Tissues
Figure 3.1 The nervous system is an example of cells being organised into an organ system.
When a group of cells of the same type work together in a body, we call them a tissue. One of the most obvious tissues in animals is muscle tissue. These groups of cells contract and relax to generate movement by the animal. Muscle tissues require lots of energy, and so each cell has many mitochondria to carry out cellular respiration and provide that energy. Muscle cells also have a good supply of blood to deliver oxygen and glucose for cellular respiration and to remove waste products such as carbon dioxide. Other types of tissue include lung tissue, liver tissue and connective tissues, such as tendons and ligaments. Even blood is considered a tissue.
tissue a group of similar cells performing the same function
cellular respiration a process that occurs inside the mitochondria, during which oxygen and glucose react to form carbon dioxide and water, producing useable energy
Figure 3.2 A high-magnification photograph of human smooth muscle (a) and cardiac (heart) muscle (b), seen through a light microscope. Each of the cells has a nucleus (shown in purple). Note that a stain has been added to the tissue to make it more visible.
organ a group of tissues working together to perform a function
Organs
An organ is a structure formed from various tissues that work together to carry out a specific function. The brain, one of the most crucial organs in the human body, serves as the control centre for all bodily activities. It is primarily composed of nerve tissues, which are organised into two main types:
• grey matter, responsible for processing information and controlling muscle activity
• white matter, which transmits signals between different parts of the brain and the rest of the nervous system.
In addition to nerve tissue, the brain has a rich blood supply, with numerous blood vessels delivering oxygen and nutrients throughout.
a new human organ
In 2020, scientists conducting cancer research discovered a new human organ. When using CT and PET scans with radioactive glucose to highlight tumours, researchers from the Netherlands Cancer Institute noticed unexpected glowing spots in the head.
Further investigation revealed a previously unknown organ, the tubarial salivary gland, located behind the nasal passage near the throat. This gland is believed to moisten the upper throat. After examining 100 patients, the scientists confirmed the presence of this gland in each one.
The human body has three other major salivary glands: the parotid glands (for chewing and swallowing), the submandibular glands (under the lower jaw, providing most saliva) and the sublingual glands (found under the tongue, helping to moisten food and begin digestion).
Figure 3.3 The human brain is a complex organ composed of neurons, blood vessels and other cells.
Tubarial salivary glands
Figure 3.4 A model of the human head with salivary glands highlighted. The tubarial salivary glands were unknown before 2020.
medical imaging
Technological advancements in microscopy and medical imaging have significantly contributed to a better understanding of cells and organs. Medical imaging now allows doctors and researchers to non-invasively visualise the inside of the human body. Techniques like MRI (magnetic resonance imaging) and CT (computed tomography) produce detailed images of organs and tissues, while technologies like PET (positron emission tomography) and SPECT (single photon emission computed tomography) can reveal functional information about cellular processes.
UNCORRECTEDSAMPLEPAGES
Figure 3.5 (a) MRI scan and (b) CT scan of a head
Figure 3.6 (a) PET scan and (b) SPECT scan of a head
Organ systems
A group of different organs working together is called an organ system (or body system). The structures of the system each perform distinct processes or functions. There are eleven organ systems in humans.
Hair
Skin
Integumentary system
• Encloses internal body structures
• Site of many sensory receptors
Cartilage
Bones
Nails
Joints
Skeletal muscles
Tendons
Muscular system
• Enables movement (with skeletal system)
Brain
• Helps maintain body temperature
Spinal cord
Peripheral
nerves
Pituitary gland
Thyroid gland
Pancreas
Adrenal glands
Testes (male)
Skeletal system
Endocrine system
• Secretes hormones
• Regulates body processes
Heart
Blood vessels
• Supports the body
• Enables movement (with muscular system)
Nervous system
• Detects and processes sensory information
• Activates bodily responses
Circulatory system
• Delivers oxygen and nutrients to tissues
• Equalises temperature in the body
Thymus
Lymph nodes
Spleen
Lymphatic vessels
Lymphatic system
• Returns fluid to the blood
• Defends against pathogens
Stomach
Liver
Gall bladder
Large intestine
Small intestine
Digestive system
• Processes food for use by the body
• Removes wastes from undigested food
Nasal passage
Trachea
Lungs
Kidneys
Urinary bladder
Epididymis
• Produces sex hormones and gametes
• Delivers gametes to female Male reproductive system
Mammary glands
Uterus
Respiratory system
• Removes carbon dioxide from the body
• Delivers oxygen to the blood
UNCORRECTEDSAMPLEPAGES
Urinary system
• Controls water balance in the body
• Removes wastes from blood and excretes them
Female reproductive system
• Produces sex hormones and gametes
• Supports an embryo/ foetus until birth
• Produces milk for an infant
Testes
Ovaries
Figure 3.7 (continued)
Science inquiry 3.2
Practice makes perfect
Haptic feedback gloves are gloves that provide sensory feedback to the wearer through vibrations or other means. They are being used in surgical training to provide a realistic and immersive experience for trainee surgeons. The gloves allow trainees to practise procedures in a simulated environment, where they can experience haptic feedback as they perform virtual reality surgeries. This allows the trainees to get a more realistic sense of the physical aspects of surgery, such as the resistance and movement of tissues, or how the tissue of a baby would differ from that of an older person. This can help to build their surgical skills and improve their confidence before they perform procedures on real patients.
Figure 3.8 The HaptX Gloves DK2 system being used in 2019 with FundamentalVR’s surgeon simulator software. This technology allows trainee surgeons to build their skills before performing a real operation.
UNCORRECTEDSAMPLEPAGES
Try this 3.1
three-dimensional organ systems
Use the internet to find an online 3D anatomy site, such as ZygoteBody. You should compare the two-dimensional representations in this book with the three-dimensional representations of organ systems online to understand how organs are positioned within the body.
Organisms
A group of organ systems working together supports a living being, called an organism. Each day, we eat food, breathe air and excrete waste products from our bodies. The many organ systems in our bodies work together in integrated ways to detect and respond to changes and complete the processes required to keep us alive.
Explore! 3.1
Plants are complex
Plants are eukaryotic organisms, just like us. This means their cells have complex membrane-bound organelles, such as the nucleus. We tend to think that because plants are usually sessile (stationary), they are less complicated than animals, but plants also have specialised cells that are organised into tissues, organs and organ systems.
Research one plant of your choice and list one example of each of the levels of organisation: Cell: Tissue: Organ: Organ system: Organism:
Figure 3.9 A couple show an ultrasound image of their unborn baby. It is amazing to think that inside this tiny organism (within another organism!), all the body’s essential organ systems are developing. Uncorrected 2nd
animal
Quick check 3.1
1. Sequence the following structures into the correct level of organisation, from largest to smallest: cell, organ system, organism, organ, tissue.
2. Propose why unicellular organisms don’t have organs.
3. Distinguish between a tissue and an organ.
UNCORRECTEDSAMPLEPAGES
Did you know? 3.2
traditional knowledge of internal systems
Aboriginal and Torres Strait Islander Peoples have unique ways of communicating their understanding of the internal systems of organisms. Various Peoples often depict the internal features of animals through mediums like X-ray paintings, sculptures or head dresses.
Figure 3.10 Consider what internal systems are being shown in these pieces of art.
Try this 3.2
levels of organisation study mate
Step 1 Hold a piece of A4 paper in ‘portrait’ (upright) orientation.
Step 2 Fold it in half vertically – from left to right. You have formed a brochure with four sides or pages.
Step 3 Cut the front page only into six horizontal sections and label the front of these six flaps ‘organelle, cell, tissue, organ, organ system, organism’ from the top down.
Step 4 On the back of each flap, add the definition of each of the six levels of organisation.
Step 5 On the third page of the brochure, add some examples of each of the six levels of organisation.
When you look at the front of the brochure, you should see the names of the levels of organisation. As you open each flap, you should see the definition and examples.
Go online to access the interactive section review and more!
Section 3.1 review
Online quiz
Section questions
Section 3.1 questions
Remembering
1. Define the term ‘tissue’.
2. Recall the number of different organ systems in a human.
Understanding
3. Explain the interrelationship among cells, tissues and organs.
Applying
Teachers can assign tasks and track results
UNCORRECTEDSAMPLEPAGES
4. Sketch some simple diagrams that model the difference between a cell, a tissue, an organ and an organ system.
5. Choose which of the following statements are correct. Hint: there may be more than one correct answer.
A) An organ is composed of different types of tissue.
B) A tissue is composed of only one type of cell.
C) If you look at a tissue under the microscope, you will see many different organs.
Analysing
6. Categorise the following terms as either cells, tissues, organs, organ systems or organisms: liver, neuron, sperm, dog, digestive, human, eucalyptus, brain, muscle, blood.
Evaluating
7. A newly discovered organism has an internal anatomy in which nutrients enter through an opening, travel through a long tube to a storage area and are eventually excreted through a sphincter. Based on this description, justify whether the observed structures constitute evidence of a tissue, an organ or an organ system.
3.2 The human respiratory system
Learning goal
At the end of this section, I will be able to:
1. Explain how the structure of the respiratory system relates to gas exchange in vertebrates.
Breathing versus respiration
You can probably hold your breath for about a minute, maybe two, but after that your body forces you to take a huge gulp of air. This is because the cells in our bodies need a constant supply of fresh oxygen to produce energy and function efficiently. Cellular respiration is the process that happens inside the mitochondria in our cells, which turns glucose and oxygen into useable energy. The process also produces the waste products of carbon dioxide and water. Breathing, the physical process of inhaling and exhaling, provides your body with oxygen to undertake cellular respiration. If you stop breathing, you are preventing oxygen entering your body and therefore depriving your cells of oxygen, meaning energy cannot be utilised.
KEY IDEA
To summarise: breathing is a physical process; cellular respiration is a chemical process.
Did you know? 3.3
Freedivers
While most people might be able to hold their breath under water for about 30 seconds, people who practise freediving can hold their breath for several minutes. The world record is more than 20 minutes! Freedivers do not use equipment like scuba gear. Instead, they have developed techniques such as hyperventilation, which allows them to reduce the concentration of carbon dioxide in their blood. Special breathing exercises aim to increase their lung capacity, and their bodies are adapted to dealing with prolonged periods of low oxygen. The current world record for freediving is held by Croatian, Budimir Šobat, who held his breath under water for 24 minutes and 11 seconds.
pharynx
the throat region where the nasal cavity and oral cavity meet, leading into the trachea trachea the tube that carries air down to the lungs; also known as the windpipe epiglottis
a flap of elastic cartilage that covers the opening of the trachea during swallowing, preventing food and liquids from entering the airways
bronchi (singular: bronchus) the two branches of the airways that split off the trachea, one main left bronchus to the left lung and one main right bronchus to the right lung bronchioles smaller tubes that
the respiratory system
The main function of the organs in the respiratory system is to get oxygen into your body cells and release the waste product carbon dioxide into the air. The respiratory system works very closely with the circulatory system, which together transport the oxygen you breathe in and remove the carbon dioxide you breathe out.
Mouth and nose
The two main openings to your respiratory system are your mouth and your nose. When you inhale, air enters through your nostrils and travels through the nasal cavity before reaching the rest of the respiratory system. It is best to breathe through your nose, as the function of your nose is to warm up and moisten the air coming into your body, filter out any particles via the hairs in your nasal cavity and stimulate your sense of smell. If you close your mouth and exhale, the air will be directed out through your nose. This is because the nose and the mouth are connected in a region called the pharynx, which leads to the trachea, or windpipe. During swallowing, the epiglottis, a flap of elastic cartilage located at the base of the tongue, covers the opening of the trachea, protecting the airways from food and liquids.
Trachea and bronchi
The trachea is a wide tube with thick protective rings of cartilage that keep it open. If you place your hand on your throat, you can feel the rings. Warm, moist air from the nose and mouth enters the lungs by travelling down the trachea. The structure of your lungs is like an upsidedown tree. The trunk of the tree is the trachea, and this large tube splits into two smaller tubes called bronchi, which are like branches and lead into the left and right lungs. The bronchi then branch into smaller and smaller tubes called bronchioles, which are like small twigs.
The cells of the trachea have hair-like structures on them called cilia. These cells play an important role in removing foreign particles and mucus from the respiratory system. The cilia move in a coordinated beating motion, which moves mucus and particles upward towards the mouth and nose, where they can be removed. This helps to keep the trachea and lungs clear of potentially harmful substances.
Figure 3.12 Freediving in the ocean
Figure 3.13 A scanning electron micrograph of ciliated cells in the trachea
branch off the two large bronchi and lead to the alveoli
Making thinking visible 3.1
Parts, purposes, complexities: respiratory system
Examine Figure 3.14 closely.
Nasal cavity
Epiglottis
Lung
Figure 3.14 Structure of the human respiratory system
What are the different parts of the respiratory system?
What is the purpose of each of these parts?
UNCORRECTEDSAMPLEPAGES
Pharynx
Larynx
Trachea
Bronchus
Bronchiole
Alveoli
Diaphragm
What is complicated about the diagram? Do you have any questions about these complexities?
The Parts, purposes, complexities thinking routine was developed by Project Zero, a research centre at the Harvard
1. Define the main function of the respiratory system.
2. Describe what happens to air as it passes through the nose.
Explore! 3.2 snoring
Snoring can be an annoying habit and can prevent people from getting a good night’s rest. You snore because parts of your throat relax and vibrate as you breathe once you’re asleep. However, snoring can also be a symptom of bigger medical problems. Do some research into why snoring occurs and what can be done to stop it. Your research should answer the following questions.
1. What are some risk factors for snoring (things that increase your likelihood of snoring)?
2. Which structures in the respiratory system are involved in snoring?
Uncorrected 2nd
3. Snoring can be a warning sign of a medical condition called sleep apnoea. Describe this condition.
4. What treatments are available to reduce snoring?
Graduate School of Education.
Quick check 3.2
alveoli
the tiny sacs at the end of bronchioles in the lungs; the site of gas exchange with the capillaries
capillaries
the smallest blood vessels, one cell thick, and the site of gas exchange with cells
diaphragm
a dome-shaped muscle that separates the chest and abdominal cavities; it contracts to draw air into the lungs.
Alveoli
When the air gets to the end of the smallest bronchiole, it enters small sac-like structures called alveoli. The alveoli are only one cell thick and are surrounded by a net of very small blood vessels, called capillaries. This is where gas exchange occurs: inhaled oxygen diffuses out of the alveoli and into the capillaries (into the bloodstream) for transport around the body. Carbon dioxide moves in the opposite direction, from the capillaries into the alveoli. As the diaphragm and intercostal muscles relax, the carbon dioxide–rich air is exhaled out through your nose and mouth.
Big breath in!
Figure 3.15 This drawing of the lungs shows the blue central trachea dividing into the left and right bronchi. The red bronchi then branch into bronchioles.
When you breathe in (inhale), a large muscle at the base of your ribs, called the diaphragm, contracts and pulls down. At the same time, the intercostal muscles between your ribs contract, moving the ribs upwards and outwards. This increases the volume of your chest, drawing air in through your mouth and nose by decreasing the pressure in your lungs compared with the outside. As you breathe out (exhale), the diaphragm relaxes and air is passively released through your nose and mouth because the pressure has increased in the lungs.
Chest expands
Lung
Ribcage
Diaphragm
Diaphragm contracts
Chest contracts
Diaphragm relaxes
Figure 3.16 The movements of the chest during inhalation and exhalation
3.17 Gas exchange occurs between the alveoli and the capillaries. The oxygenated blood is returned to the heart, and the carbon dioxide–rich air is exhaled.
excretion through the respiratory system
One of the primary waste products our bodies produce is carbon dioxide, a by-product of the cellular respiration process that generates energy for our cells. We excrete carbon dioxide by exhaling it from our lungs.
During exercise, the muscles produce more waste products, such as lactic acid and carbon dioxide. The increased production of carbon dioxide leads to a build-up in the blood, which can make the blood more acidic. This can have negative effects on the body’s function, including impaired muscle contraction and fatigue.
To prevent this build-up of carbon dioxide, the body increases its breathing rate and depth during exercise. This increased ventilation means carbon dioxide is removed at a faster rate.
UNCORRECTEDSAMPLEPAGES
VIDEO Gas exchange in an alveolus
Figure
carbon dioxide a waste product produced in cellular respiration
Figure 3.18 Steph Catley and Clare Wheeler are exhaling more carbon dioxide than the rest of the Matildas.
modelling the pressure changes in the lungs
Aim
To model how contraction of the diaphragm creates negative pressure inside the lungs
Materials
• plastic bottle, 500 mL or 1 L
• straw
• 2 elastic bands
• 2 balloons
Method
UNCORRECTEDSAMPLEPAGES
• putty
• scissors
• sticky tape
1. Tie a knot in one of the balloons and then cut off about a quarter of the other end.
2. Cut the bottle in half and only use the top half.
3. Put sticky tape around the cut edge of the bottle.
4. Stretch the cut balloon over the cut bottle opening and secure in place with an elastic band and sticky tape.
5. Put a straw into the second balloon and use an elastic band to hold them together.
6. Place the straw with balloon attached through the neck of the bottle and seal the hole with putty.
7. Pull down on the bottom balloon covering to mimic the diaphragm contracting and describe what you observe.
3.19 Experiment set-up. Breathing in: pressure in the lungs is lower than the atmosphere, so air flows in. Breathing out: pressure in the lungs is greater than the atmosphere, so air flows out.
Results
Draw your model of the lung in your book and label each of the parts that represent the following structures: lungs, ribs, diaphragm, trachea, mouth.
Discussion
1. What similarities can you draw between your model and the actual human respiratory system?
2. Describe the flow of air when you pull down on the balloon at the bottom of your model.
3. Explain what happens to the balloon lung when you push the balloon at the bottom of your model upwards.
Straw
Putty
Bottle
Balloons
Figure
thunderstorm asthma
Asthma is a chronic lung condition that involves inflammation of the airways, tightening of the bronchioles and a hypersecretion of mucus in response to certain triggers, such as exercise, smoke and pollen. People who suffer from mild asthma might feel slightly tight in the chest when they exercise or breathe in cold air, but some severe sufferers must take medications such as steroids every day to treat the inflammation.
Thunderstorms can cause a phenomenon known as thunderstorm asthma, which can affect even those who do not have a history of asthma. The sudden change in weather conditions causes pollen grains to be drawn up into clouds as the storm forms. The moisture in the air causes the pollen grains to swell and then burst, generating tiny fragments of pollen that are pushed back down to the ground by wind. These small particles are then inhaled, leading to symptoms such as coughing, wheezing and shortness of breath.
levels of airborne grass pollen, and changes in the types of grasses that flower in different seasons might extend and intensify pollen exposure in the future.
Figure 3.21 In Australia, most thunderstorm asthma events happen during the peak grass pollen season, from late October to early December. Climate change is causing higher
Figure 3.20 Asthma (right) causes a narrowing of the airways.
Quick check 3.3
1. Sequence these terms in order so that they represent the direction of airflow during inhalation: alveoli, pharynx, nose/mouth, bronchus, trachea, bronchiole.
2. Explain how the diaphragm is involved in breathing in and out.
UNCORRECTEDSAMPLEPAGES
Practical 3.2
the products of respiration
Aim
To demonstrate the products found in exhaled air
Materials
• air pump
• straw
• conical flask
• glass Petri dish
• bromothymol blue
• water
Method
Bromothymol blue solution
1. Add 50 mL of water to a conical flask.
2. Add a few drops of bromothymol blue and record the colour in the ‘Observations before’ column of your results table.
3. Using a pump and a straw, blow air slowly through the solution for 30 seconds.
4. Record your observations in the ‘Observations after’ column.
5. Using your breath and the same straw, blow air slowly through the bromothymol blue solution for 30 seconds, being careful not to suck up any of the solution.
6. Record your results in the ‘Observations after’ column.
Petri dish
7. Using a pump, blow air directly over the Petri dish.
8. Record any changes in the results table.
Bromothymol blue solution Petri dish
Air source
Observations before Observations after Observations before Observations after Pump Exhaled
9. Using your breath, exhale directly over the Petri dish.
10. Record any changes in the results table.
Discussion
When carbon dioxide is dissolved in water, it becomes acidic. Bromothymol blue turns from blue to green/yellow when it is exposed to acid.
1. Using the information above and the results you collected, explain your bromothymol blue before and after results.
2. Discuss your observations of the Petri dish portion of the practical and relate your findings to the products of respiration.
Gas exchange in animals
In humans and other animals with lungs, it is the alveoli that are responsible for exchanging gases into and out of the blood. However, there are other members of the animal kingdom that have developed very different specialised structures for gas exchange, such as gills in fish, skin in frogs and tracheoles in insects. All these structures share common features to allow for efficient function. These features are:
• a very large surface area. This is usually achieved by a folded surface, which increases the amount of gas that meets the animal’s blood.
• a moist surface that gases dissolve into before they enter or leave the body. This makes the process of diffusion much easier for gases.
• a thin surface and small barrier between the inside and the outside of the body. This means that the gas has to travel a smaller distance.
• a transport system near these structures, such as blood vessels, to transport the gases to all parts of the body.
The 300 million alveoli in our lungs have all of these features, which makes them an extremely efficient gas exchange surface.
1. Recall the site of gas exchange in the lungs.
2. Recall the advantage of having a moist surface for gas exchange. Explore! 3.3
amphibian business
Gas exchange between the alveolus and the capillary. Note the direction of diffusion as oxygen enters the bloodstream and carbon dioxide leaves the bloodstream.
Figure 3.23 The feathery external gills on each side of the head provide axolotls with oxygen.
Billions of years ago, life began in the oceans, and gills were the first form of respiratory organ. As animals began to move onto land, a new gas exchange surface was needed. Evidence of this gradual change from aquatic life to terrestrial life is present in amphibians today. In amphibians such as axolotls, frogs, newts and salamanders, there are several ways in which gas can be exchanged. Unlike mammals and birds, amphibians are ectotherms, which means they depend on external sources of heat. As a result, their level of respiration can be lower than endothermic animals (those that produce their own body heat), and so their cells need less oxygen to function properly.
1. Axolotl larvae spend all their time in water. Find out how they get oxygen and explain how the features of gas exchange (thin, moist surface, etc.) relate to this process.
2. As axolotls transition into adults, the process they use to gain oxygen changes. Explain how it changes.
3. Find out what ‘cutaneous respiration’ is and how it relates to an axolotl getting oxygen. Link this information to the features that gas exchange surfaces exhibit.
4. Research why axolotls must undertake buccal pumping.
Try this 3.3
modelling an animal respiratory system
Using whatever materials you can find (suggestions: plastic bags, string, bucket, rubber tubing), construct a model of an animal’s respiratory system.
Figure 3.22
VIDEO Other respiratory systems
Go
Section 3.2 review
Section 3.2 questions
Remembering
Teachers can assign tasks and track results
1. Name the gas that is absorbed into the body by the respiratory system.
2. Name the gas that is removed from the body by the respiratory system.
3. State the scientific name for the windpipe.
Understanding
4. Describe the features necessary for efficient gas exchange.
5. Explain why your breathing rate increases when you exercise.
6. Explain how the parts of the respiratory system are similar to a tree.
7. Summarise the functions of each of the following parts of the respiratory system:
Applying
8. Summarise the movement of the diaphragm during inhalation and exhalation.
9. Identify how the structure of the alveoli facilitates gas exchange.
10. A person suffers a spinal cord injury at a level that paralyses their diaphragm. Describe the effect this would have on their ability to breathe.
11. Construct a flow chart showing the route taken by an oxygen molecule, starting from the air in your classroom and finishing in a body cell.
Analysing
12. Contrast the term ‘breathing’ with the term ‘cellular respiration’.
13. The graph in Figure 3.24 shows a person’s respiratory (breathing) rate when resting and when exercising.
a) Identify the person’s respiratory rate at rest.
b) Identify their respiratory rate at the maximum treadmill speed.
c) Infer why their respiratory rate increased during exercise.
Evaluating
14. Decide why it is better to breathe through your nose than through your mouth.
SAMPLEPAGES
Figure 3.24 A person’s respiratory rate depends on the level of physical activity. This graph shows the respiratory rate as someone increases their speed on a treadmill.
15. Cystic fibrosis is a disease that causes over-production of mucus in the airways and can be life threatening if the person catches a cold or the flu, resulting in a chest infection. Propose a reason why a build-up of fluid in the lungs can be harmful, and why the person may experience shortness of breath.
3.3 The human circulatory system
Learning goal
At the end of this section, I will be able to:
1. Explain how the structure of the circulatory system relates to the transportation of materials in vertebrates.
The partner of most of the organ systems in the body is the circulatory system (sometimes referred to as the cardiovascular system). This is a transport system that moves oxygen, nutrients, hormones, immune cells, waste and heat throughout the body, in one continuous loop. Without the circulatory system, none of the other organ systems would be able to function.
heart
The heart is a powerful muscular pump. It has one job: to maintain pressure in your circulatory system, which moves the blood around your body. Once in your heart, blood is ready for recirculation. Your heart does this by contracting and relaxing about 60–90 times per minute. Your heart is located near the centre of your chest, and it is about the same size as your fist. It is made up of four main sections: the right atrium and left atrium (top parts of the heart) and the right and left ventricles (bottom parts of the heart).
The heart generates high pressure, which pushes blood out of your heart into the arteries. Blood is pushed towards the heart because valves in the veins prevent back-flow, and it continues to move because the muscles around the veins apply pressure.
Unlike other muscles in your body, the heart is myogenic, meaning it contracts (beats) without having to receive instructions from the brain. The heart has its own natural pacemakers, called the sinoatrial node, located in the wall of the right atrium, and the atrioventricular node, located between the atria and the ventricles. The nodes send an electrical signal throughout the heart, causing it to contract.
The human heart is like a double pump: the left side sends blood out to the body, and the right side sends blood to the lungs. Let’s follow the path of a red blood cell through the circulatory system, using Figure 3.25.
Blood returning to the heart from the body enters the heart though the vena cava and goes into the right atrium. This blood has low levels of oxygen and high levels of carbon dioxide.
The blood then passes into the right ventricle and is prevented from travelling backwards by a valve between the atrium and the ventricle. Once in the ventricle, the blood is then pumped out of the heart and travels via the pulmonary artery to the lungs.
As the blood passes through the lungs, it releases the carbon dioxide it has stored within it and gains oxygen from the alveoli of the lungs. The oxygenated blood then returns from the lungs through the pulmonary veins into the left atrium. From there, it passes into the left ventricle. The left ventricle pumps the blood out via the aorta to all the different parts of the body. This process delivers oxygen to the cells and picks up the waste carbon dioxide.
WORKSHEET
Human circulatory system DOC
Contraction of heart chambers
atrium (plural: atria) one of the two upper chambers of the heart, the left and right atria ventricle one of the two lower chambers of the heart, the left and right ventricles sinoatrial node a natural pacemaker that controls the heartbeat and is located in the wall of the right atrium atrioventricular node a natural pacemaker that controls the heartbeat and is located between the atria and the ventricles
vena cava the large vessel that returns deoxygenated blood from the body to the heart, emptying into the right atrium
aorta the largest vessel leaving the heart, from the left ventricle, carrying oxygenated blood to the body
VIDEO
UNCORRECTEDSAMPLEPAGES
Vena cava Right atrium Right ventricle Body
Low oxygen, high carbon dioxide blood
Left atrium Aorta
Left ventricle
High oxygen, low carbon dioxide blood
Figure 3.25 Blood flows in the following loop: right atrium → right ventricle → pulmonary artery → lungs → pulmonary vein → left atrium → left ventricle → aorta → body tissues → vena cava → right atrium … and the loop starts again.
Making thinking visible 3.2
Connect, extend, challenge: Bioprinting
Three-dimensional printing of organs, also known as bioprinting, is an emerging area of research in which scientists create functional human organs using 3D-printing technology. The goal is to address the critical shortage of organs for transplantation and create tissue models for drug discovery and testing.
In bioprinting, a 3D printer is used to layer living cells with a supportive material to create functional tissue. The cells can be taken from the patient, reducing the risk of rejection, or they can be sourced from a biobank. Once the tissue has been printed, it is incubated in a controlled environment that allows it to mature and develop into functional tissue.
While the technology is still in the early stages of development, significant progress has been made in bioprinting simple tissues, such as skin and cartilage. However, more complex organs, such as the heart, liver and lungs are much more challenging to bioprint, as they require intricate networks of blood vessels and other structures to support the cells.
Despite the challenges, researchers are optimistic about the potential of bioprinting to revolutionise the field of transplantation and provide a limitless supply of functional organs for patients. Bioprinting also has the potential to advance the field of drug discovery and testing, allowing researchers to test new drugs on functional human tissue before proceeding to clinical trials.
Consider what you have just read about bioprinting, then answer the following questions:
• How are the ideas and information about bioprinting connected to what you already know about organs?
• What new ideas extended your thinking or made you think differently?
• What questions do you have about bioprinting?
The Connect, extend, challenge thinking routine was developed by
of Education.
Try this 3.4
testing your heart rate
Your heart rate responds to the oxygen requirements of your body. For each of the following test conditions, follow the procedure below and record your heart rate (in beats per minute) in the table. You will need a stopwatch.
Find your pulse by gently pressing two fingers over your radial artery (on the soft side of your wrist, slightly off centre towards the thumb). Count the number of beats you feel in 15 seconds, using the stopwatch, and then multiply by four to find your heart rate in beats per minute (bpm).
Test your pulse under the following conditions, then copy and complete the table.
Test condition
Lying down
Sitting
After jogging for three minutes
Graph your data as a bar chart and answer the following questions.
1. During which test condition was your heart rate:
a) at its highest?
b) at its lowest?
2. For each answer you gave to Question 1, propose a reason why this was the case.
UNCORRECTEDSAMPLEPAGES
Heart rate (bpm)
Project Zero, a research centre at the Harvard Graduate School
Figure 3.26 3D printing of a human heart
Figure 3.27 Feeling for the radial pulse
Did you know? 3.5
red or blue?
Superior vena cava (from upper half of body)
ulmonary
Pulmonary arteries (to right lung)
Pulmonary veins (from right lung)
Sinoatrial (SA) node
Atrioventricular (AV) node
Right atrium
Right ventricle
Aorta (to body)
Pulmonary arteries (to left lung)
Inferior vena cava (from lower half of body)
Septum
Pulmonary veins (from left lung)
Left atrium
ventricle
Figure 3.28 The human heart and its major vessels, chambers and valves. The heart is labelled as it sits in your chest, but it is drawn as if it were visible to someone facing you. This is why the left ventricle is located on the right-hand side of the diagram.
When you look at your wrist, you might be tempted to think that your veins are blue or green, depending on your skin tone. However, this is just an illusion! The appearance of blue or green veins is due to the interaction of light with the veins and the layers of skin above them. The colours you perceive are determined by the wavelength of light that reaches your eye. Different layers of skin scatter light in various ways.
Figure 3.29 Bright red oxygenated blood (left) and darker deoxygenated blood (right)
In individuals with darker skin tones, veins often appear green rather than the blue seen in individuals with lighter skin tones. Green and blue light have shorter wavelengths compared to red light. Red light can penetrate human tissue more deeply, so our skin absorbs red wavelengths, while green and blue wavelengths are more likely to be reflected and scattered back to us, contributing to the colour we observe in veins.
In reality, the blood inside veins is not blue or green – it is dark red because it contains less oxygen than the blood inside arteries. Blood that is rich in oxygen, as found in arteries, is bright red. This difference in colour is due to how oxygen binds to haemoglobin, a protein in red blood cells.
Quick check 3.5
SAMPLEPAGES
1. Name the four chambers of the heart.
2. Name the two structures that make up the heart’s natural pacemaker.
3. For each of the vessels listed below, state whether it carries oxygenated or deoxygenated blood. a) vena cava
pulmonary artery
pulmonary vein
aorta
sheep heart dissection
Aim
To identify the path of blood flow through the heart and become familiar with the structures
UNCORRECTEDSAMPLEPAGES
Materials
• lamb heart, preferably with aorta and vena cava attached
• dissecting scissors
• disposable gloves
• two blue and two red pipe cleaners (or straws)
• wash bottle
• dissecting tray
Method
1. Place the heart on the dissecting tray and identify the front (anterior) and back (posterior).
2. Before cutting into the heart, identify:
• the vena cava – Place a blue pipe cleaner into the vena cava (representing deoxygenated blood).
• aorta – Place a red pipe cleaner into the aorta (representing oxygenated blood).
• pulmonary artery – Place a blue pipe cleaner here (representing deoxygenated blood, note that this connects to the same side as the vena cava).
• pulmonary vein – Place a red pipe cleaner here (representing oxygenated blood; note that this connects to the same side as the aorta).
• right/left side (Remember, these will be opposite your left and right).
3. Place your finger into the vena cava and then into the aorta. Notice the difference in strength and thickness of the walls of the blood vessels.
Right atrium
4. To open the right side of the heart, place the dissecting scissors into the vena cava and cut down the wall of the heart, stopping about a quarter of the way down the heart.
5. Open the atrium chamber and locate the valve joining the right atrium to the right ventricle.
6. Using water from a wash bottle, fill the right ventricle through the valve.
7. Gently squeeze the heart and observe as the water moves up and tries to re-enter the atrium.
Right ventricle
8. Continue to cut down the same line you made earlier, to expose the right atrium.
9. Locate the 'heart strings' within the ventricle.
Left side of the heart
10. Repeat the process above to expose the left side of the heart.
11. Compare the thickness of the walls of the heart on the left and right sides.
Discussion
1. Identify which chambers of the heart receive the blood and which pump the blood.
2. Describe the action of the valves in the heart.
3. Compare the wall thickness of the right and left sides of the heart. Suggest a reason why they differ.
4. Describe how the vena cava and aorta felt on your finger.
Left side of heart
Aorta
Right side of heart Pulmonary
Figure 3.30 Diagram of where you will place the pipe cleaners in the lamb heart
robot surgeons
Angioplasty is a medical procedure used to treat narrow or blocked arteries, especially those that supply blood to the heart. Coronary angioplasty aims to improve blood flow to the heart and reduce the symptoms of conditions such as angina (chest pain) or a heart attack. During an angioplasty, a thin, flexible tube called a catheter is inserted into an artery, usually in the groin or arm, and guided to the site of the blockage. A small balloon at the tip of the catheter is then inflated to compress plaque (fatty deposits) against the walls of the artery and widen the opening. In some cases, a small device called a stent may also be inserted to help keep the artery open.
During the procedure, X-ray imaging is often used to guide the catheter to the site of the blockage and to monitor the progress of the procedure. X-ray imaging uses ionising radiation, which can be harmful if a person is exposed to high doses over time. The radiation exposure during angioplasty is relatively low, but it can add up over time for doctors and other medical personnel who perform many procedures. To minimise their exposure to radiation, medical staff usually wear protective clothing, such as lead aprons and thyroid collars, to shield their bodies from the radiation.
However, robots are now being used to perform coronary angioplasties. Medical staff can work from a control station shielded against radiation and use joysticks to remotely control the devices needed for the procedure, such as guidewires, balloons and stents. Due to the reduction in exposure to radiation, staff do not need to wear heavy lead protective gear during the procedure.
Robot angioplasties have improved the navigation and accuracy of balloon and stent placement due to the millimetre precision of the robotic controls.
Figure 3.32 Using robots to perform angioplasties is not only safer for medical staff but also more accurate.
Figure 3.31 Angioplasty procedures
Vessels of the circulatory system
There are three main types of blood vessels in the body: arteries, veins and capillaries.
Arteries
Arteries take blood away from the heart. They carry oxygenated blood to all the cells of the body, with one exception: the pulmonary artery, which carries deoxygenated blood to the lungs. The blood in arteries is pumped out of the heart with a lot of force and this means that the artery walls must be thick, muscular and strong to withstand the pressure being placed upon them.
Capillaries
As the blood travels away from the heart, it enters smaller and smaller blood vessels, eventually leading to the capillaries. All tissues in the body are surrounded by a network of tiny capillaries that allow nutrients and gases to be delivered to cells while removing waste. The walls of capillaries are extremely thin, only one cell thick, to allow nutrients and gases to pass into the tissues.
artery a thick muscular, elastic vessel that carries blood away from the heart
Outer layer
Inner layer
Smooth muscle
Figure 3.33 The structure of an artery
Figure 3.34 A capillary is only slightly wider in diameter than a red blood cell.
Cell
Endothelium (one cell thick)
Lumen
Figure 3.35 The structure of a capillary
Figure 3.36 (a) Nailfold capillaries. (b) The nailfold is located at the base of your fingernail.
vein a thin-walled vessel with valves that carries blood back to the heart
valve
a structure that prevents the backward flow of blood
Veins
As the blood travels away from the body tissues and back towards the heart, it moves from the capillaries into the veins. At this point in the cycle, the blood is under much less pressure and so the vein walls do not need to be as thick and muscular as artery walls. However, due to the low flow pressure, the veins need to prevent blood from flowing backwards, and so they have special valves that prevent this from happening.
UNCORRECTEDSAMPLEPAGES
Quick check 3.6
a) thick muscular walls
b) diameter one cell wide
c) valves to prevent backflow of blood
2. Explain why arteries carry blood at high pressure.
3. Explain why capillaries need to be one cell thick.
Explore! 3.4
Circulatory system technologies
1. State the vessel type that matches each feature listed below.
• automatic external defibrillators
• implanted pacemakers
• mitral valve replacements
1. How does this device or technique work?
2. What heart problems does it assist with?
d) carry oxygenated blood (except for the pulmonary vessel)
A malfunctioning heart can struggle to pump blood effectively due to conditions like damaged valves, weakened heart muscle or blocked arteries. Several surgical procedures and medical devices, such as pacemakers, stents or heart transplants, can help support or restore proper heart function. Choose one or more of the following to research and answer the questions below.
Figure 3.37 The structure of a vein
Did you know? 3.6
Bruises
Bruises occur when an impact breaks the capillaries under the skin. As the trapped haemoglobin in the red blood cells breaks down, it changes colour, leading to the colour changes you see in bruises over a couple of weeks.
3.38 From left to right: a stage 1 bruise is red; a stage 2 bruise is blue or purple; at stage 3 it becomes more yellow or green, and at stage 4 it becomes more yellow-brown.
Try this 3.5 examining vessel types
Your teacher can provide some prepared slides showing cross-sections of arteries, veins and capillaries. Observe these vessel types under the microscope and try to identify all the features discussed in this section.
Blood
The human circulatory system is structured around a pumping heart and connected vessels, but the third part is the tissue that is actually circulated: blood. You have around five litres of blood circulating around your body all the time. This blood contains dissolved nutrients, proteins and several types of cells. Most of your blood is made up of a liquid called plasma. Plasma is yellowish in colour, made up mainly of water and contains all the dissolved gases, nutrients and hormones (proteins) that are travelling to the tissues around your body.
The second-largest component of blood is the red blood cells. These cells contain a molecule called haemoglobin, which gives blood its red colour. Haemoglobin molecules contain iron and can bind with oxygen molecules. Red blood cells are unusual, as they do not have a nucleus. This gives them more space for haemoglobin and hence allows them to carry more oxygen molecules. The biconcave shape provides a greater surface area for gas exchange and allows the cells to be extremely flexible so that they can fit easily through small capillaries.
White blood cells make up about one per cent of the overall volume of blood. This varies depending on whether you are sick, because white blood cells are part of the immune system. White blood cells are generally much bigger than red blood cells. They help the body fight infection from foreign organisms, by engulfing these organisms and breaking them down or by using special molecules known as antibodies to identify and destroy the invaders.
plasma the yellow liquid component that makes up 55% of blood; carries water, dissolved gases, nutrients and proteins
haemoglobin the red pigment in blood that binds to oxygen, allowing red blood cells to carry oxygen
Figure
Figure 3.39 Blood plasma
Another component of your blood is the platelets. These tiny cell fragments help blood to clot and help scabs form. Platelets are much smaller than red blood cells. If platelets encounter any punctures along the blood vessels, they become activated and change shape. They then release chemicals that produce a thread-like substance called fibrin. This allows them to seal the puncture. If your body has too few platelets, then you won’t be able to stop bleeding if you have an injury. On the other hand, if you have too many platelets, clots can form inside the blood vessels and stop the blood from flowing properly. These internal clots can lead to heart attacks or strokes.
UNCORRECTEDSAMPLEPAGES
Figure 3.41 Red blood cells trapped in fibrin threads during blood clotting
Plasma (55%)
White blood cells and platelets (>1%)
Red blood cells (45%)
Figure 3.42 The components of blood, separated into layers using a centrifuge
Figure 3.40 A coloured TEM image showing Staphylococcus aureus (coloured yellow) outside a white blood cell (coloured blue)
Figure 3.43 Red blood cells
Did you know? 3.7
Changing blood composition
SAMPLEPAGES
The composition of your blood can change depending on many environmental factors, particularly oxygen availability. At higher altitudes, the air pressure is lower, meaning there is less oxygen available for the body to use. To compensate for this, people who live at high altitudes, such as Sherpas in the Himalayas or the Quechua people in the Andes, have naturally higher red blood cell counts and increased haemoglobin levels. These adaptations allow their blood to carry more oxygen, enabling them to perform physically demanding tasks, such as mountaineering or farming, with greater efficiency despite the lower oxygen levels. If someone from sea level were to move to a high-altitude location, their body would gradually adapt over time. Within a few days, their breathing rate would increase to take in more oxygen, and within about a week, their body would start producing more red blood cells to improve oxygen transport. This process, known as acclimatisation, helps prevent altitude sickness and allows the body to function more effectively in low-oxygen environments.
Figure 3.44 A large white blood cell (called a macrophage) engulfing and destroying bacteria
Figure 3.45 Platelets help a scab to form over a wound.
Activation of platelets
Figure 3.46 Platelets in the blood, sealing a hole in a blood vessel
Figure 3.47 Sherpas in Sagarmatha National Park, Khumbu Region, Nepal
the spleen
The spleen, an organ found in almost all vertebrates, has two jobs. Located inside your left rib cage, just above the stomach, it acts as a blood filter by removing old red blood cells, storing a reserve of blood for emergencies and recycling iron by breaking down haemoglobin from aged red blood cells. It also plays a role in the immune system as it produces white blood cells. The spleen can be removed in an operation called a splenectomy, but this increases susceptibility to certain infections.
1. On average, recall how much blood is in your body.
2. Name three components found in the blood and state their approximate percentage composition in the blood.
3. Recall what is contained in the plasma.
SAMPLEPAGES
1. State the function of the heart.
2. Recall how many times a healthy human heart beats per minute.
3. State the components of blood.
4. Name the smallest type of blood vessel.
Figure 3.48 The spleen is located in your rib cage between your stomach and kidney.
Understanding
5. Explain how heart muscle is different from a muscle in your arm.
6. Explain the function of a platelet.
7. Explain how the structure of a capillary allows it to exchange nutrients and gases with cells.
Applying
8. Determine the point in your circulatory system where your blood pressure would be highest.
9. Determine the point in your circulatory system where your blood pressure would be lowest.
10. Figure 3.49 is an ECG readout of a person’s heartbeat. The ECG machine captures the electrical signals of the heart. The section between the arrows represents one full cardiac cycle (heartbeat + refilling stage). If the person’s heart rate is 120 beats per minute, calculate how much time a full cycle takes.
UNCORRECTEDSAMPLEPAGES
Analysing
11. A baby is diagnosed with ‘patent foramen ovale’, a condition distinguished by a hole in the wall of the heart, between the left and right atria. Infer what effect this hole would have on the blood that is being pumped out the aorta.
Evaluating
12. Construct a flow chart showing the path of an oxygen molecule, from when it diffuses from the alveoli into the capillary, until it reaches a muscle cell in your leg.
13. Suggest a problem that would be faced by someone who has too few platelets in their blood.
Figure 3.49 ECG printout of a person’s heartbeat
3.4 Plant systems for gas exchange and transport
Learning goals
UNCORRECTEDSAMPLEPAGES
At the end of this section, I will be able to:
1. Explain how the structure of the plant respiratory system relates to gas exchange.
2. Explain how the structures of the xylem and phloem relate to transportation of materials in plants.
3. Explain how transpiration in plants contributes to water and nutrient management.
4. Compare plant and vertebrate systems for gas exchange and transportation of materials.
roots
The part of a plant that is underground is known as the root system, which has two main purposes. Firstly, it provides structural support, anchoring the plant in place and enabling its above-ground parts to grow tall, allowing them to compete effectively for sunlight. Secondly, the root system absorbs water and essential nutrients from the soil, supplying the plant with the resources necessary for photosynthesis and overall growth.
To maximise their effectiveness, roots have a large surface area due to tiny structures called root hairs. These hair-like extensions, which are specialised cells, both increase the root’s surface area and reduce the distance for the diffusion of water and nutrients, increasing the plant’s ability to absorb these important substances.
Practical 3.4
observing root hair cells under the microscope
Aim
To observe and identify root hair cells and understand their structure and function
Materials
• microscope
• glass slides
• cover slips
• water
• onion bulb or other plant with visible root hairs
• scalpel or razor blade
• paper towels
• microscope slide with a prepared onion root tip (optional, for comparison)
Method
Preparing the slide
1. Take a small section of the root of an onion bulb and use a scalpel or razor blade to carefully slice the root section into thin slices.
2. Place a small drop of water on a clean glass slide.
3. Gently place the thin slice of the onion root onto the water drop.
4. Cover the slice with a cover slip, avoiding air bubbles.
Observations
1. Place the slide on the stage of the microscope.
2. Start with the lowest magnification objective lens and focus on the slice using the coarse and fine focus knobs.
3. Once the slice is in focus, increase the magnification to observe the root hair cells in more detail.
UNCORRECTEDSAMPLEPAGES
4. Observe the shape and structure of the root hair cells. Note the presence of the elongated tubular structure extending from the root surface (root hair).
5. Look for any other structures within the cells, such as nuclei or cell walls.
6. If available, observe a prepared slide of an onion root tip to compare the root hair cells with other cells in the root tip.
Recording observations
1. Sketch the observed root hair cells, noting their shape and any other observed structures.
2. Label the sketch with any relevant structures.
Discussion
1. What is the function of root hair cells?
2. How do the root hair cells differ from other cells in the root tip?
3. How do root hair cells help a plant absorb water and nutrients from the soil?
and nutrients more efficiently.
shoots
The shoot system is represented by the portion of a plant that extends above the soil surface, made up of all visible parts such as leaves, flowers and the stem. This system is important for photosynthesis, reproduction and structural support.
The stem of a plant provides support for the plant and transports water, minerals and sugars. Within the stem are vascular bundles, specialised tissue made of xylem and phloem cells.
• Xylem is responsible for transporting water and minerals from the roots to the leaves. Xylem cells are arranged end-to-end, forming long tubes that extend throughout the plant. These vessels also provide structural support to the plant, helping it to stand upright. Xylem tissue also plays a role in capillarity, in which the cohesion and adhesion forces of water molecules enable the upward movement of water through the plant’s vascular system.
vascular bundles a transport system in plants, composed of xylem and phloem xylem vascular tubes that transport water in one direction through the plant phloem vascular tubes that transport sugars and nutrients throughout the plant capillarity the ability of a liquid to rise in narrow spaces without the help of external forces cohesion when molecules stick to each other adhesion when molecules stick to other surfaces
DOC
WORKSHEET Shoot systems
Figure 3.50 An image showing the root hairs on a tomato plant’s root, made using a special fluorescent technique
Figure 3.51 Root hairs are elongated specialised cells that increase the surface area of roots, helping plants absorb water
Adhesion occurs when water molecules are attracted to the walls of the xylem.
Individual xylem cell Xylem wall
Cohesion occurs when water molecules are attracted to each other.
UNCORRECTEDSAMPLEPAGES
Water molecules
Figure 3.52 Cohesion and adhesion in xylem vessels allow water to travel upwards from roots to leaves.
• Phloem transports sugars produced during photosynthesis to various parts of the plant. It consists of sieve tube elements and companion cells, which work together to allow the movement of these substances throughout the plant.
Xylem
One-way flow
Water and minerals
No end walls between cells Stiffened with lignin
Phloem
Two-way flow
Water and food
End walls with perforations
Photosynthesis products
Water and minerals
Figure 3.53 Xylem and phloem transport water, minerals and other nutrients through the shoots of plants.
UNCORRECTEDSAMPLEPAGES
Try this 3.6
Colourful carnations
You can use white carnations and food colouring to observe the vascular bundles. Fill glasses with water and add a few drops of different food colours. Trim the carnation stems diagonally and place one in each glass. Over the next day, you will see how the colour moves up the xylem into the petals, demonstrating how plants transport water and nutrients. You can even split stems to make multicoloured flowers.
Carnations will change colour when placed in food colouring.
Leaves
Gas exchange is important for all living organisms, including plants. Plants perform both cellular respiration and photosynthesis, requiring organs that facilitate gas exchange with the environment. The main organ for this in plants is the leaf. Most photosynthesis occurs in the palisade cells, a layer near the top of the leaf. During photosynthesis, leaves take in carbon dioxide and release oxygen.
Similar to how our lungs have many alveoli, plants have many leaves to increase surface area for gas exchange and light absorption.
Leaves have tiny pores called stomata (singular: stoma), mainly on their underside, which control gas exchange. Each stoma is surrounded by guard cells that open and close the pore.
that facilitate the entry and exit of gases such as oxygen and carbon dioxide guard cells specialised cells located on either side of a plant stoma that regulate gas exchange by opening and closing the stoma
Figure 3.54 Vascular bundles in a banana plant stem
Figure 3.55
stomata (singular: stoma) tiny pores (holes) in leaves
transpiration a plant’s loss of water through the stomata of leaves
The guard cells of stomata have large vacuoles that open the pores when filled with water. This happens in strong sunlight or high carbon dioxide levels, as the stomata need to be open to allow the carbon dioxide to enter for photosynthesis.
However, when stomata are open, this allows water vapour to escape, so plants need to balance gas exchange with minimising water loss. The loss of water through the stomata of leaves is called transpiration
When the plant faces dry conditions, high temperatures or low humidity, the vacuoles lose water, causing the guard cells to become flaccid and close the stomata. At night, stomata also close because the low light levels are insufficient for photosynthesis.
UNCORRECTEDSAMPLEPAGES
Figure 3.56 With a record leaf size of 3.2 m, Victoria boliviana is the largest known species of water lily in the world.
Guard cell
Top of leaf
Bottom of leaf Stoma
Phloem
Xylem
Palisade cell Vein
Figure 3.57 Gas exchange occurs in the leaves of plants.
Explore! 3.5
trichomes
Plant hairs, also known as trichomes, can help to prevent water loss in plants. They break up the flow of air across the plant surface in windy regions, reducing water loss. When trichomes are dense, they reflect sunlight and in areas where plants obtain their water from fog, the trichomes allow water droplets to accumulate.
UNCORRECTEDSAMPLEPAGES
Figure 3.58 Scanning electron micrographs showing a variety of trichomes on different leaves
Guard cell
Guard cell
Stoma
Figure 3.59 Swollen guard cells have forced open this stoma, allowing gases to enter and exit the leaf.
stomata lab
Aim
To observe and compare stomata in desert and non-desert plants using a compound microscope
Materials
• leaves from desert and non-desert plants
• compound microscope
• transparent ruler
• sticky tape
Method
1. Choose leaves from desert and non-desert plants.
2. Identify the top and bottom of the leaf.
• glass slide
• transparent nail polish
Be careful
Carry the microscope appropriately, with one hand holding the arm and one hand under the base. Do not make big changes in magnification, so that the glass slide is not damaged.
3. Use the nail polish to paint a thin layer of varnish on a small section of the bottom side of each leaf.
4. Allow the polish to dry completely.
5. Place the sticky tape over the dry polish and pull it off.
6. Place the sticky tape with the polish impression onto a microscope slide.
7. Use the compound microscope to focus on the stomata impression, noting how many stomata you can see.
8. Focus on the highest possible magnification and sketch an image of a stoma.
9. Repeat for each leaf.
Results
Plant
Source (desert/non-desert)Number of stomata you can see
Discussion
1. Compare the estimated number of stomata in desert and non-desert plants.
2. Explain why different plants are likely to have a different number of stomata. Consider the environments in which these plants grow.
3. Suggest a reason why some stomata are open while others are closed.
Try this 3.7 modelling stomata with a balloon
1. Using a twist balloon, blow it up and fold it in half but do not tie a knot in the end.
UNCORRECTEDSAMPLEPAGES
2. Keeping the balloon folded, allow some air to escape slowly from the balloon.
3. Notice how the two sides of the balloon begin to come together. This is like what happens in the stoma as it loses water. By closing the stomata, the plant can limit water loss.
Science inquiry 3.5
thirsty plants
At present, agriculture consumes 90% of the world’s fresh water to irrigate (water) crops. Scientists have found a way to genetically alter crops so that they are only able to partially open their stomata. This means the plants lose less water vapour when they open their stomata to take up the carbon dioxide they need to carry out photosynthesis. In a study conducted on tobacco plants, the modification improved crop water use by 25% but did not affect the yield of the crops – that is, the same amount of tobacco was produced. Tobacco plants are easy to genetically modify, but now the research team hopes to apply the discoveries to food crops.
Although the stomata on leaves do a great job of providing gases for the leaves, other parts of the plant need to respire, using oxygen. The thick woody parts of trees, such as the branches, stems and trunks, have structures called lenticels. You can often see these in the bark – they look like small dots or stripes. Lenticels allow the thick woody parts of the plant to exchange gases with the air.
Explore! 3.6
summarising analogous structures in flowering plants and vertebrates
UNCORRECTEDSAMPLEPAGES
In biology, analogous structures refer to different organs or systems in organisms that perform similar functions but have evolved independently in different species. Despite having different structures, these systems help organisms carry out essential life processes. In this task, you will explore and summarise the analogous structures and systems involved in gas exchange and transportation of materials in flowering plants and vertebrates.
An example of an analogous structure in a plant and a vertebrate is the leaf in plants and the lung in vertebrates.
Leaf (plant): The leaf is responsible for gas exchange in plants, taking in carbon dioxide for photosynthesis and releasing oxygen. It does this through pores called stomata, which are controlled by guard cells.
Lung (vertebrate): The lung is responsible for gas exchange in vertebrates. It takes in oxygen from the air and releases carbon dioxide. This process occurs in the alveoli of the lungs, where oxygen enters the bloodstream and carbon dioxide is expelled.
Task instructions
Create a summary chart
Gas Exchange: Summarise the processes of gas exchange in both flowering plants (stomata and guard cells) and vertebrates (respiratory system). In your chart, note:
• the structures involved
• the process of gas exchange
• the key differences and similarities between the two systems.
Transportation of materials: Summarise how materials are transported in flowering plants (xylem, phloem, capillarity, transpiration) and vertebrates (heart, blood vessels, blood). In your chart, note:
• the structures involved
• the process of material transport
• the key differences and similarities between the two systems. continued …
lenticels small slits on trunks or branches of trees that allow gas exchange
Figure 3.61 The small horizontal slits in this tree trunk are lenticels.
Go online to access the interactive section review and more!
Write a short summary (200–300 words)
After completing your chart, write a brief summary that explains the key points of comparison between flowering plants and vertebrates in the areas of gas exchange and material transport. Focus on the analogous structures and processes, as well as how each system is adapted to the needs of the organism.
Visual representation
Create a Venn diagram, mind map or infographic that visually compares the structures and processes involved in gas exchange and material transport in flowering plants and vertebrates.
Quick check 3.8
1. Name the structures that allow gas exchange to occur in leaves.
2. Recall three environmental factors that could cause stomata to close.
3. Describe the need for lenticels on a tree.
4. Compare xylem and phloem.
5. Name a structure that can be found in the shoot system.
Section 3.4 review
Online quiz
UNCORRECTEDSAMPLEPAGES
Section questions
Section 3.4 questions
Remembering
1. Define the term ‘gas exchange’.
2. State the location of stomata.
3. Define ‘lenticels’.
Understanding
4. Explain how stomata open and close.
5. Explain why the stomata close at night.
Applying
6. Describe the two primary functions of the root system.
Analysing
Teachers can assign tasks and track results
7. Distinguish between the two types of vascular tissue in plants: xylem and phloem.
8. Distinguish between adhesion and cohesion.
Evaluating
9. Discuss why plants in the desert have fewer stomata.
10. Discuss why leaves and lungs are considered analogous structures.
3.5 Animal reproduction
Learning goals
At the end of this section, I will be able to:
1. Outline different methods of reproduction in animals.
2. Explain how the structures of male and female reproductive organs in animals relate to reproduction.
Reproduction is the biological process by which living things produce offspring. There are two main types of reproduction: asexual and sexual.
Asexual reproduction involves only one parent organism and results in offspring that are genetically identical to the parent. This type of reproduction is common in single-celled organisms, such as bacteria and amoebas. Asexual reproduction is a highly efficient way of reproducing because it does not require the involvement of another organism.
In contrast, sexual reproduction involves two parent organisms, and results in offspring with genetic variation. Humans and most other animals reproduce through sexual reproduction, which allows for diversity in offspring.
sexual reproduction
Sexual reproduction is a process that involves the fusion of gametes (sex cells), one from each parent, resulting in offspring that are genetically unique and not identical to their parents. Gametes are specialised cells produced by the gonads, which are the reproductive organs. In males, the gonads are the testes, while in females, they are the ovaries.
During sexual reproduction, the male gamete, a sperm cell, and the female gamete, an egg cell, unite to form a zygote (Figure 3.62). The zygote contains the complete set of genetic material necessary to form a new organism of the same species. The zygote then undergoes cell division and develops into an embryo (Figure 3.63).
asexual reproduction a method of reproduction in which a single parent produces offspring genetically identical to itself sexual reproduction a method of reproduction that involves two parent organisms and results in genetic variation in the offspring gamete a sex cell (egg or sperm), which contains half the genetic material required to make an organism gonad the reproductive organ where gametes are produced; testis in males and ovary in females zygote a fertilised egg cell embryo the early stages of growth and differentiation of a multicellular organism; in humans, 2–8 weeks after fertilisation
Figure 3.62 A zygote results from the fusion of an egg cell and a sperm cell.
Figure 3.64 Sexual reproduction creates a greater rate of variation among offspring than asexual reproduction because it involves the mixing of genetic material from two different parents.
Quick check 3.9
1. Define:
a) asexual reproduction
b) sexual reproduction
c) gametes
d) gonads
e) zygote
f) embryo
2. Recall the number of parents involved in asexual and sexual reproduction.
3. Name the female gonads and gametes and the male gonads and gametes.
Did you know? 3.9
Courtship rituals
Attracting a mate is essential in sexual reproduction. Many animals, such as birds, use elaborate and impressive courtship rituals to signal to the opposite sex that they are ready to mate.
Rituals include:
• behavioural adaptations, such as special mating calls (songs) and dances
• physical adaptations, such as special feathers and colour patches
UNCORRECTEDSAMPLEPAGES
• physiological adaptations, such as releasing hormones called pheromones to attract a mate.
Bowerbirds are known for their unique and elaborate mating rituals. One aspect of these rituals is the use of colour to attract mates. Male bowerbirds create intricate displays called bowers, which they decorate with various objects such as leaves, flowers and feathers. One popular
decoration is the colour blue, which is known to be attractive to female bowerbirds. Male bowerbirds will gather blue objects such as flowers, feathers and even bottle tops and wrappers to decorate their bowers, in the hope of catching the attention of a female.
In general, more complex organisms tend to have more intricate and varied reproductive strategies, which may involve specific courtship behaviours and elaborate mating displays. These strategies are often shaped by the selective pressures of the environment, such as competition for mates and access to resources.
Fertilisation methods
Internal fertilisation is the method of fertilisation in which male gametes are delivered into the female reproductive system and fertilisation takes place inside the female. This is the method of fertilisation of most animals living in a terrestrial environment, because it protects the gametes and zygote from drying out.
3.65 The satin bowerbird is native to Australia; like other bowerbirds, it uses the colour blue to attract potential mates.
In most mammals, the development of the embryo is also internal, which provides protection to the developing embryo from any threats in the outside world. Although other land animals such as reptiles and birds also have internal fertilisation, the development of their young happens externally, in water-resistant eggs.
External fertilisation typically occurs outside the parent animals and is commonly observed in organisms that live in an aquatic or semi-aquatic environment, such as amphibians and fish. This method of fertilisation requires eggs and sperm to be expelled from the organisms’ bodies, and then be united in water.
UNCORRECTEDSAMPLEPAGES
internal fertilisation a method of fertilisation in which male gametes are delivered into the female reproductive system and fertilisation takes place inside the female external fertilisation a method of fertilisation in which gametes are released into the environment and fertilisation occurs outside the body
Figure
Figure 3.66 Internal fertilisation in most reptiles is followed by external embryo development.
Figure 3.68 A school of fish and a cloud of gametes that have been released in external fertilisation
Figure 3.67 Internal fertilisation allows reproduction to take place on land without gametes drying out.
Because the eggs and sperm are released outside the body, it is harder for them to meet, and the fertilised eggs have little protection. Consequently, organisms that use this type of fertilisation have evolved to produce large quantities of eggs and sperm cells, which are released simultaneously and near each other.
However, this presents several potential problems.
• The eggs and sperm may not meet.
UNCORRECTEDSAMPLEPAGES
• The eggs may be eaten by predators.
• Environmental conditions may not be favourable (e.g. strong currents in the wrong direction).
Quick check 3.10
1. Define:
a) internal fertilisation
b) external fertilisation
2. State the type of fertilisation that occurs in mammals.
3. Describe some advantages of internal fertilisation and some disadvantages of external fertilisation.
Gestation
Gestation refers to the period during which offspring develop inside the mother’s body until they can survive outside her body. This is commonly known as ‘pregnancy’. Gestation typically lasts about 280 days (9 months) in humans, but varies among different mammalian species. More complex organisms tend to have longer gestation times.
gestation the pregnancy period, when offspring are developing inside the mother
Did
you know? 3.10
mouse plagues
Mice are prolific breeders, with a gestation period of 19–21 days. A female mouse can produce 5–10 litters a year, with each litter ranging from 3 to 14 pups. On average, a litter contains 6–8 pups, resulting in a potential output of at least 32–56 pups annually from a single female mouse.
UNCORRECTEDSAMPLEPAGES
Moreover, mice have a rapid reproductive cycle, with the mother capable of mating again immediately after giving birth. The offspring can start reproducing as early as six weeks old and can have up to 10 litters a year themselves. One mathematician estimated that in a perfect world for mice, just two initial mice could result in a total of five million mice being produced in a year.
The quick gestation times play a significant role in creating mouse plagues. This phenomenon only occurs in China and Australia and occurs when mouse populations explode, leading to an overabundance of mice. These plagues can have devastating effects on agriculture, natural ecosystems and public health.
Development
Most mammals undergo internal development within their mother’s uterus and are born generally resembling adult organisms. During internal development, humans and other animals receive nourishment directly from their mother through the umbilical cord. However, marsupials, such as kangaroos, are exceptional in that their young are born in an extremely underdeveloped state and emerge from the vagina at the size of a jellybean. The newborn then makes its way up the mother’s body and into the pouch, where it undergoes further development (see Figure 3.71).
2nd
3.71 A baby kangaroo is called a joey. After being born, the joey wriggles its way into its mother’s pouch to feed.
Offspring of birds, reptiles, amphibians and insects typically undergo external development outside the mother’s body. They develop within an egg and hatch when they are developed enough to survive in their environment.
Figure 3.70 Periods of flooding often trigger mouse plagues in Australia.
Figure
WORKSHEET
ovum egg; the female gamete
puberty the time of transition from juvenile form to adult form
the human reproductive system
Humans reproduce sexually by internal fertilisation and have highly specialised body systems to support this process. Females and males share some structural similarities; for example, both possess gonads, which are the site of gamete production. However, many of the other structures are different.
Female reproductive system
The female reproductive system supports the production and transport of eggs, as well as the growth and development of a fertilised egg (ovum) into a foetus during pregnancy (see Figure 3.72).
Fallopian tube
Carries the ovum from the ovary to the uterus
Ovary
After puberty, an ovum is released from here once every month
Cervix
The opening at the top of the vagina, leading to the uterus
Figure 3.72 The female reproductive system
Male reproductive system
Uterus
If an egg is fertilised, it may implant into the wall of the uterus (endometrium) and develop into a foetus
Vagina
Connects the cervix to the outside of the body. Sperm is deposited here.
The male reproductive system consists of several organs and structures that work together to produce, store and transport sperm (see Figure 3.73).
Bladder
Holds urine for excretion
Prostate
Gland that releases an alkaline liquid, which helps to neutralise the acidic conditions of the vagina
Penis
Contains erectile tissue and urethra
Urethra
Tube through which semen and urine leave the body
Figure 3.73 The male reproductive system
UNCORRECTEDSAMPLEPAGES
Scrotum
Seminal vesicle
Gland that releases liquid, which mixes with the sperm to form semen
Sperm duct (vas deferens)
A tube that transports sperm from the testes to the penis
Testes
After puberty, produce sperm continuously for the remainder of the male’s life
Sperm (inside the testes)
The male gamete, adapted to swim into the fallopian tube to fertilise an egg
A protective sac of skin that holds the testes and responds to changes in temperature
Female and male gametes
The forms of female and male gametes are adapted to their specific functions. They both contain half the amount of genetic material as body cells. This is important for sexual reproduction, because when a sperm and an egg meet during fertilisation, the resulting cell (called a zygote) will have the right amount of genetic material to grow into a normal individual.
An egg (ovum) is a large immobile cell. The larger cell size allows for the storage of nutrients and proteins required for the early stages of embryonic development. An egg also has a protective coating to prevent multiple sperm from fertilising it. At birth, a female typically has from one million to two million eggs stored in her ovaries, enclosed in small sacs called follicles. However, many of these eggs will naturally deteriorate before she reaches puberty.
Once she reaches puberty, one egg is released from the ovaries into the fallopian tube each month in a process known as ovulation. If this egg remains unfertilised, the uterine lining is shed, along with the remains of the egg, resulting in menstruation.
After reaching puberty, males begin to generate sperm in their testes, which are held in a sac known as the scrotum, located outside of the body. This area remains approximately 2–3°C cooler than the core body temperature, a temperature that is best suited for efficient sperm production.
Sperm are smaller and more streamlined in shape than eggs. The streamlined shape of a sperm enables it to move quickly and efficiently through the female reproductive tract to reach the egg. It also has a long, whip-like tail, or flagellum, that enables it to swim (see Figure 3.74). The midpiece of the sperm contains many mitochondria, which provide energy for the sperm to swim. The sperm also has a sac of enzymes in its head, which helps it to penetrate the egg membrane. Unlike eggs, sperm are continuously produced in vast quantities throughout a male’s life.
ovaries the female reproductive organs that produce eggs (ova)
ovulation the release of an ovum (egg) from the ovary into the fallopian tube
menstruation the cyclical shedding of the uterine lining; also known as the menstrual period sperm the male gamete testes the male reproductive organs that produce sperm scrotum a sac that encloses the testes
Figure 3.74 Sperm adaptations enable them to move quickly to the egg.
Stages of prenatal development in humans
In humans, the time from fertilisation to birth is about 40 weeks.
Egg to zygote
The unfertilised egg is released from the ovary and travels along the fallopian tube towards the uterus (see Figure 3.76). There is a 12–24-hour period after an egg has been released in which it can unite with a sperm cell and become fertilised. Once fertilised, the egg is referred to as a zygote.
Zygote to embryo
After fertilisation, the zygote starts to divide and splits into two cells, which further divide repeatedly and form a ball of cells. This ball of cells takes about five days to travel through the fallopian tube and it finally implants into the lining of the uterus. The cells within the ball continue to divide and begin
Foetal stage
UNCORRECTEDSAMPLEPAGES
From approximately week eight until birth, the foetal stage of development takes place. This is characterised by a period of accelerated growth during which the organs become fully developed and functional. During this stage of development, the foetus is still susceptible to the effects of alcohol, disease and drugs.
Figure 3.76 The stages of embryonic development in the female reproductive system
Explore! 3.7
Investigating gestation and development
How much time does it take different animals to develop from an embryo to infant form? Conduct some research to answer the question and then copy and complete the following table.
Animal
Gestation period Time until they can walk/move
Human 280 days
Dog
Giraffe
Choose your own animal
Explore! 3.8
Ivy aI
Time relying on parent for food
Australia has developed an artificial intelligence system that is used to predict the likelihood of a viable pregnancy from transfer of a single embryo to a woman undergoing in-vitro fertilisation (IVF). IVF is a fertility treatment procedure in which eggs are removed from a woman’s ovaries, fertilised with sperm in a laboratory and then transferred back into the woman’s uterus to try and achieve a successful pregnancy.
The artificial intelligence system is called ‘Ivy’ and it uses data from previous IVF cycles to predict the probability of a successful pregnancy based on various factors, such as a woman’s age and body mass index (BMI), and the quality of the embryo. Ivy AI was trained on data from more than 24 000 IVF cycles, and it uses machine learning algorithms to analyse and identify patterns in the data.
The system provides a personalised prediction of the likelihood of pregnancy for each patient, which can help doctors and patients make more informed decisions about how many embryos to transfer. The goal is to maximise the chances of a successful pregnancy while minimising the risk of multiple pregnancies, which can be associated with complications for both the mother and the babies.
The use of Ivy has reduced the number of multiple pregnancies and led to a higher success rate for single embryo transfers. This not only improves the chances of a healthy pregnancy but also reduces the costs associated with multiple cycles of IVF.
Conduct some research to determine how assisted reproductive technologies have become widely used since their initial development.
Figure 3.78 Intracytoplasmic sperm injection is a fertility treatment procedure in which a single sperm is directly injected into an egg to help with fertilisation. It can be used when conventional IVF has failed.
Quick check 3.12
1. Define ‘gestation’.
2. Recall the length of the gestation period in humans.
3. Copy and complete the following table to summarise the stages of embryonic development in humans.
Stage
UNCORRECTEDSAMPLEPAGES
Duration
Description
Egg to zygote
Zygote to embryo
Embryonic stage
Foetal stage
Birth
At the onset of birth, the mother begins labour, which is the process of giving birth. Labour can last from a few hours to several days. During this time, the cervix – the lower, narrow part of the uterus that connects to the vagina – dilates (widens) to allow the baby to pass through. The uterus, a muscular organ where the baby develops, contracts to help push the baby out through the vagina (the birth canal). The baby is usually delivered headfirst. However, complications such as a breech birth can occur, in which the baby’s feet or buttocks emerge first instead of the head. This can pose a medical risk and may require surgical delivery. This procedure is known as a caesarean section (C-section) and involves making an incision across the mother's abdomen and uterus to safely deliver the baby.
Explore! 3.9
dr helen mayo
Dr Helen Mayo was an Australian doctor and social reformer who dedicated her life to improving the health and welfare of women and children. She was the second woman to gain a medical degree from the University of Adelaide, but she is best known for her work in reducing infant mortality rates in South Australia in the early twentieth century. The practices adopted by society based on Dr Mayo’s research and recommendations caused the infant mortality rate to decline rapidly. Dr Mayo’s work had a lasting impact on public health in Australia, and her recommendations for improving infant care and nutrition are still widely used today.
Conduct some research to discover the recommendations that Dr Mayo made that led to a significant reduction in infant mortality rates in South Australia.
Figure 3.79 A newborn baby in the operating room
Figure 3.80 Dr Helen Mayo’s research helped reduced infant mortality rates in Australia.
octopus fertilisation
While octopuses do not undergo pregnancy, they do lay eggs, albeit in an unusual manner. During mating, male octopuses use specialised arms known as hectocotyli to transfer packets of sperm to the female. The female can retain the sperm for later use when fertilising her approximately 200 000 eggs. After fertilisation, she proceeds to lay the eggs, either suspending them near her den or attaching them to the seafloor.
Unusually for an animal that lays so many eggs, the female displays intense care towards her eggs, continually fanning water over them to provide aeration and protect them from harm.
asexual reproduction in animals
Certain organisms can reproduce asexually without the assistance of a mate. This type of reproduction is advantageous for organisms that are geographically isolated or have limited mobility. Asexual reproduction is also beneficial as it is quick and does not waste time and energy searching for a mate. The offspring produced are clones – genetically identical to the parent. This is advantageous if the parent is well adapted to the environment. However, if environmental conditions change or a disease that the organisms are vulnerable to is introduced, the entire species can be at risk of extinction.
Asexual reproduction involves the division of a single cell into two, and there are various mechanisms by which this can occur. Fragmentation, budding and parthenogenesis are all examples of asexual reproduction that can occur in certain animal species.
Fragmentation
Fragmentation is a form of asexual reproduction in which an organism splits into several fragments, each of which can grow into a new individual. This mechanism of reproduction is observed in certain multicellular organisms, such as flatworms and sea anemones.
In fragmentation, the parent organism breaks into two or more fragments, each of which contains a portion of the parent’s body, including its organs and tissues. These fragments can then regenerate missing parts and develop into complete, independent individuals over time.
fragmentation a type of asexual reproduction in which a parent organism splits into multiple fragments, each of which can potentially develop into a new independent individual
Figure 3.81 An octopus guarding her egg mass
Figure 3.82 Fragmentation in a flatworm
budding a type of asexual reproduction by organisms such as yeast and hydra, in which the daughter offspring grows off the side of the parent and drops off
Budding
Budding is a type of asexual reproduction in which a new genetically identical individual grows as an outgrowth or bud from the parent organism. This process is commonly observed in many types of simple organisms, such as hydra (tiny freshwater organisms) and yeast.
In budding, the new individual develops as a smaller version of the parent organism and remains attached to it until it is fully formed. The bud grows until it reaches a certain size then detaches from the parent organism to become a separate individual (see Figure 3.83).
parthenogenesis a type of asexual reproduction in which an egg develops into an embryo without being fertilised by a male gamete
UNCORRECTEDSAMPLEPAGES
Parthenogenesis
Parthenogenesis comes from the Greek words for ‘virgin birth’ and is a form of asexual reproduction in which an egg develops into an embryo without being fertilised by a male gamete. Most animals that reproduce by parthenogenesis are invertebrates, such as bees, wasps, ants and aphids. These species can switch between sexual and asexual reproduction. However, parthenogenesis has also been documented in more than 80 vertebrate species, with about half of these being lizards or fish.
Egg cells contain half of the mother’s genetic material, but when they are formed, a smaller cell is also produced as a by-product that also contains some of the mother’s genetic material. In one form of parthenogenesis, the gamete and smaller by-product cell merge. This slightly shuffles the genes, so the offspring are similar, but not identical, to the mother.
3.84 Corals reproduce asexually by fragmentation or budding. In the centre, a Leptastrea purpurea coral polyp has produced a large bud, which will split off.
Figure 3.83 Budding in a hydra – a daughter offspring grows off the side of the parent and drops off.
Figure
Did you know? 3.12
Parthenogenesis and sex of offspring
Parthenogenesis is a way some animals can reproduce without needing a male. In many animals, this type of reproduction results in only female offspring.
In animals like birds, which have a different system to decide whether they are male or female, parthenogenesis can produce either male or female offspring.
Some animals, like aphids, can even produce male offspring without a male. These male aphids are almost exactly like their mother, but they can only produce female offspring because their sperm can only make females.
Quick check 3.13
1. State two advantages of asexual reproduction.
2. State one disadvantage of producing genetically identical offspring.
3. Name three types of asexual reproduction and give an example of an organism that reproduces by each method.
Try this 3.9 asexual versus sexual reproduction
Draw a Venn diagram comparing asexual and sexual reproduction. Remember, the overlapping section of the circles is for characteristics shared by both types of reproduction.
Figure 3.85 Parthenogenesis in Komodo dragons produces offspring that are exclusively male.
Figure 3.86 The New Mexico whiptail (Aspidoscelis neomexicanus) is a female-only species of lizard.
Go online to access the interactive section review and more!
Section 3.5 review
Online quiz
Section questions
Section 3.5 questions
Remembering
1. Recall the two main types of reproduction.
2. State the two cells that are required for sexual reproduction.
3. Define ‘gamete’.
4. Recall where the female and male gametes are produced.
5. State the function of the testes.
Understanding
Teachers can assign tasks and track results
UNCORRECTEDSAMPLEPAGES
6. Distinguish between sexual reproduction and asexual reproduction.
7. Summarise the benefits of internal fertilisation.
Applying
8. Explain why an aquatic animal can use external fertilisation more easily than a land-dwelling animal.
9. A new species of lizard is discovered, and a zoologist captures a female of the species. One year later, the lizard lays eggs that hatch into many female lizards. Determine the method of reproduction she has used.
Analysing
10. Connect methods of fertilisation with methods of embryo development, in relation to where they take place – internally or externally. Include examples. Consider why for an animal a particular method of fertilisation might not go with a particular method of embryo development.
11. Classify the following structures as belonging to the female reproductive system, the male reproductive system or both: fallopian tube, penis, gonads, prostate gland, scrotum, ovary, vas deferens, cervix.
Evaluating
12. Determine why a woman who has blocked fallopian tubes might find it difficult to become pregnant.
13. As a man ages, his prostate can increase in size. Propose a reason why this could affect urination.
14. Many courtship displays demonstrate a male individual’s strength through physical feats, or their health through the vibrancy of their colourings. Discuss why this would be useful information for the female.
3.6 Plant reproduction
Learning goals
At the end of this section, I will be able to:
1. Explain how the reproductive structures of plants relate to reproduction.
2. Describe the processes of pollination and fertilisation.
3. Compare flowering plant and vertebrate systems for reproduction.
Plants can reproduce both asexually and sexually. Sexual reproduction in plants, as in animals, involves the fusion of gametes, resulting in a zygote and embryo. This process leads to genetic diversity, which can increase the chances of survival in changing environments.
Although sexual reproduction increases genetic diversity, asexual reproduction offers several advantages, including a relatively quick process that requires less energy and the ability to produce offspring in environments that are unfavourable for sexual reproduction. However, asexual reproduction produces offspring that lack genetic diversity.
Figure 3.87 Plants are a diverse kingdom, including non-flowering plants such as (a) moss, (b) ferns, (c) conifers, and (d) flowering plants.
spore a reproductive body, produced by fungi and some plants, that develops into a new individual vegetative propagation a form of asexual reproduction in which only one plant is involved
spore formation
Fungi and some plants, such as ferns, produce single-celled spores that are released into the environment. The spore is a clump of unspecialised cells surrounded by a protective coating. These spores are carried by the wind to a new location. If conditions at the new location are favourable, the spores germinate and grow into new individuals that are genetically identical to the parent. Note that spores can be formed by sexual or asexual reproduction.
Figure 3.88 Spore formation can provide a means of survival in harsh environments. For example, a fungus can produce spores that remain dormant until conditions become favourable for growth.
asexual reproduction in plants
All asexual reproduction in conifers and flowering plants is classed as vegetative propagation. It involves part of a plant growing into a new plant and can occur naturally or through human manipulation.
Natural methods and human-induced methods of asexual reproduction are summarised in Tables 3.1 and 3.2.
Vegetative propagation method
Bulb
UNCORRECTEDSAMPLEPAGES
Features
• Underground stem for food storage
• Food is stored in large leaves.
• Each bulb develops into a new plant.
Onions, hyacinths, daffodils
Examples
Figure 3.89 Spores under a fern leaf
Table 3.1 Natural methods of asexual reproduction in plants
Figure 3.90 An onion bulb with leaves and roots
Vegetative propagation method
Runner
Tuber
Features
• A stem that grows on top of and across the ground, from an existing stem
• New plants grow from the runners.
• Underground stem that contains stored food
• The eyes of a potato can develop into new plants.
Strawberries, some grasses
Rhizome
• Long modified stem that grows horizontally under the ground
• New plants grow from the rhizome.
Potatoes, sweet potatoes
Examples
3.91 Strawberry leaves and runner
Long grasses, ferns, irises, ginger, asparagus
Table 3.1 (continued)
Vegetative propagation method
Cutting
UNCORRECTEDSAMPLEPAGES
Grafting
Features
• Taking pieces of a root or stem
• Each piece grows into a new plant.
Examples
Bananas, roses, sugar cane
• Connecting part of a plant to another plant, combining the two plants
Citrus, grapes, apples, stone fruit, roses
Table 3.2 Human-induced methods of asexual reproduction in plants
Figure
Figure 3.92 A potato with eyes beginning to sprout
Figure 3.93 A ginger rhizome with sprout
Figure 3.94 Cuttings growing roots in water
Figure 3.95 The two pieces of stem are tied in place and will eventually grow into one stem.
Practical 3.6
asexual reproduction in plants
Aim
To model the process of asexual reproduction, using potato tubers
Materials
• potatoes with eyes that are already starting to grow
• cotton wool
UNCORRECTEDSAMPLEPAGES
• Petri dish
• windowsill
• water • knife • chopping board
Figure 3.96 Some trees can have multiple fruits grafted onto the same tree. For example, plums, nectarines and peaches can be grafted together.
Figure 3.97 Growing new plants from cuttings is a way of making clones.
Method
1. Place the cotton wool in the Petri dish.
2. Add enough water to make the cotton wool damp but not wet.
3. Cut the potato into 3 cm pieces with one eye on each piece.
4. Press a piece of potato into the wet cotton wool with the eye on top.
5. Re-water the cotton wool every few days to prevent it from drying out completely.
6. Once the stem begins to grow, measure and record the growth each day over two weeks.
Results
Use your data and the data from three other groups in your class to calculate the average stem growth each day. Use the average data to produce a line graph.
Remember:
• Place the independent variable on the x-axis.
• Place the dependent variable on the y-axis.
• Label both axes.
• Write a title.
• Use more than 75% of your graph paper.
Copy and complete the following table.
Analysis
1. Describe a trend you see in your graph.
2. Explain why you calculated an average using other groups’ data as well as your own.
3. Suggest another plant that could be used for a similar activity.
4. Propose an independent variable that you could add to this activity to turn it into a different experiment.
Quick check 3.14
1. Define: a) asexual reproduction
b) sexual reproduction
2. State two advantages of asexual reproduction in plants.
3. Define ‘rhizome’.
4. Name one plant that can be grown from a cutting.
WORKSHEET
Sexual plant reproduction
sexual reproduction in plants
If you sit near a patch of flowers on a summer’s day, you may see a bee or a butterfly visiting the flowers. Many flowers rely on these insects to help them reproduce by sexual reproduction. The flower is the sexual organ of the plant. The pollen it produces is the male gamete (similar to sperm) and the female gamete, known as the embryo sac, is inside the ovule. The parts of a flower are shown in Figure 3.98.
The colourful part of the flower that attracts insects or other pollinators
Stamen The part of the stamen that produces and holds pollen
The male part of the flower; consists of filament and anther
The long stalk that holds the anther
pollen the male gamete in flowering plants
embryo sac the female gamete in flowering plants
ovule a structure in a flowering plant where the female gamete is produced and where seeds develop
UNCORRECTEDSAMPLEPAGES
The sticky head on the top of a stalk in the centre of the flower.
Pollen grains from other plants stick to the stigma Stigma
Style
The long stalk that the pollen grain grows through into the ovary
Where the female gamete (ovule) is housed
The female part of the flower; consists of the stigma, style and ovary
Did you know? 3.13
environmental dna
Recent research from Curtin University has shown that using environmental DNA (eDNA) alongside traditional methods could help monitor how insects interact with avocado flowers. This study focused on Hass avocado trees in Western Australia's South-West region. eDNA refers to traces of DNA left by animals in the environment, such as in soil, water and air. The research found that eDNA could help identify insect species, such as hoverflies and honeybees, which play a vital role in pollination. In addition to beneficial insects, eDNA also helped detect pests, like mites, which can be harmful to the plants.
The study highlighted the importance of using eDNA as a more efficient and cost-effective method for monitoring insect populations, especially in remote or hard-to-reach areas. By combining eDNA with conventional methods like camera recordings and traps, researchers were able to identify 49 insect families visiting the flowers.
Stamen Sepal
Pistil Petal
Ovary
Pistil (carpel) Anther Filament
Figure 3.98 Top: a vertical section showing the reproductive parts of a flower. Bottom: a cross-section of the reproductive parts
Pollination is the fertilisation process in which the pollen from one flower reaches the ovule of another flower. Bees and other insects are attracted to brightly coloured and scented flowers, in addition to the sweet nectar they produce, and pick up pollen while they are feeding (see Figure 3.99). When the bee moves to the next flower, some of the pollen on the bee sticks to the stigma of the new flower, and the pollen grain then grows? down the style to the embryo sac in the ovule. This is where fertilisation occurs and seeds develop.
Explore! 3.10
Pollination
pollination the process by which pollen, containing the male reproductive cells of a plant, is transferred from the male part of a flower to the female part of a flower nectar a sweet liquid produced by flowers to attract pollinators
self-pollination
pollination that occurs when pollen is transferred from the same flower or from another flower on the same plant
cross-pollination
UNCORRECTEDSAMPLEPAGES
Pollination is an important process that allows plants to reproduce. After fertilisation, the ovary swells and grows into a fruit. There are different methods by which pollen can be transported from one flower to another and allow pollination to occur – examples are wind, insects, birds and animals.
When male gametes fertilise female gametes on the same plant, it is called self-pollination When pollen from one plant fertilises the ovule of another plant, it is called cross-pollination. Cross-pollination results in genetically diverse offspring that increase variation in the species, making it more likely to be able to survive changes in the environment.
1. Draw a table with two columns. In the first column, list the four methods of moving pollen from one flower to another. Then conduct some research on the types of flowers that use each method of pollination. In the second column, summarise what you have found out about the characteristics (shape, colour, size) of the flowers, their stamens and pistils.
2. What are the advantages and disadvantages of self-pollination? Conduct some research to find out how plants prevent self-pollination occurring.
pollination that occurs when pollen is transferred from a flower on one plant to a flower on another plant
Figure 3.99 A bee with a large yellow pollen sac on its leg
Figure 3.100 These flowers are pollinated by different methods. Can you identify what the methods are?
Did you know? 3.14
Palynology
Pollen grains come in many shapes and sizes, depending on the plant that produces them. This is why pollen from certain plants can trigger an allergic reaction in some people, while other pollen has no effect. Palynology is the name for the study of pollen grains. Palynologists study pollen samples found in such places as archaeological digs and crime scenes. Palynology suggests that Australia’s oldest flowering plants are approximately 126 million years old, and they resembled modern magnolias, buttercups and laurels.
Making thinking visible 3.3
Compass points: robot pollinators
In recent years, there has been a global decline in the population of pollinators, such as bees, butterflies, birds and bats, which are crucial to the reproduction of many crops and wild plants. This decline is mainly attributed to habitat loss, pesticide use, climate change and diseases, and has significant implications for food security, ecological balance and biodiversity.
The RoboBee, the world’s tiniest flying robot insect, was unveiled by US researchers in 2013, after 12 years of experimentation in the laboratory. RoboBee was designed to address the current pollinator crisis. However, there was a slight issue with the robot bees: they required an exceptionally lengthy extension cord to venture out into the field.
A new version of the RoboBee was introduced in 2019, featuring an additional set of wings to allow the removal of the power cord and soft ‘muscles’ to prevent the robot from disintegrating when crashing into crops (see Figure 3.102).
In 2017, Dr Eijiro Miyako, a materials chemist at Japan’s National Institute of Advanced Industrial Science and Technology, transformed a toy drone into a fast but somewhat hazardous pollinating robot. To achieve this, he attached a patch of horsehair to the drone and coated it with an ionic liquid gel, resulting in a sticky surface that could collect and transport pollen between plants.
Photovoltaic array
Centre of mass ≈
Centre of pressure
Figure 3.102 The 2019 untethered prototype of the RoboBee, with an additional set of wings continued …
Figure 3.101 There are many types of pollen in the air.
However, the drone faced two immediate issues. First, it damaged the flowers. Second, it required a human operator to control it, which, given the significant number of bees required for pollinating, would be very expensive for farmers when hiring people to pilot drones.
UNCORRECTEDSAMPLEPAGES
Dr Miyako and his team then attempted a different approach using a drone equipped with a bubble gun that released soapy bubbles filled with pollen. In lab experiments, the researchers tested the technique on pear flowers, and the results were promising. The bubbles ruptured on contact with the pistil, allowing the pollen to adhere and form pollen tubes, which helped in fertilisation. However, excessive bubbles stunted the pollen growth, possibly because of the soap’s properties. The team is working on developing an environmentally friendly soap bubble solution that would biodegrade more quickly, potentially leading to even more effective and sustainable pollination methods. However, this approach is not suitable for use on windy days!
Complete the Compass points activity about robot pollinators:
E = Excited
What excites you about RoboBee and robot pollinators? What are the potential benefits?
W = Worrisome
What worries you about this idea? What are the potential drawbacks?
N = Need for information
What other details or facts do you need to evaluate this idea?
S = Suggestion for progress
What is your current viewpoint or proposal about robot pollinators? How can you continue to assess this concept?
The Compass points thinking routine was developed by Project Zero, a research centre at the Harvard Graduate School of Education.
Figure 3.103 Dr Miyako’s horsehair drone
Figure 3.104 Dr Miyako’s bubble gun pollinating drone
Humans are attracted to flowers because of their beautiful and varied colours and scents, but there is much more to the flowers than the colourings that we can see. Unlike us, numerous insects can perceive wavelengths beyond the visible spectrum. When flowers are viewed under ultraviolet light, distinct patterns resembling landing strips or bullseye targets become apparent. You can see these patterns in Figure 3.105. These patterns serve as a guide for insects, directing them precisely to the nectar source.
UNCORRECTEDSAMPLEPAGES
with a bullseye pattern
Quick check 3.15
1. Name the male gamete and the female gamete of plants.
2. Bees and insects can transfer pollen from one flower to another flower. Name some other ways that pollen can be transferred.
3. Draw up a table to summarise the parts of the flower and their role in sexual reproduction.
Figure 3.106 Conifers such as pine trees have separate male (left) and female (right) cones on the same tree. They do not have flowers. They are wind pollinated – male cones release pollen to the wind. When ready, the female cones open and the pollen is blown inside to fertilise the female gametes, which develop into seeds. To reduce self-pollination, female cones are on the higher branches and male cones on the lower branches.
Figure 3.105 Flowers
(left) and a landing strip pattern (right)
Flower dissection
Aim
To identify the parts of a flower and link their structure to their role in reproduction
Materials
• variety of flowers for dissection
• hand lens
• stereomicroscope
• tweezers
• single-sided razor blade
• chopping board
Method
Be careful
Be very careful when handling the razor blade.
UNCORRECTEDSAMPLEPAGES
1. Refer to Figure 3.98 to help you to identify the parts of your flower. Draw a diagram of your first flower. Note the number of petals and sepals, and label these on your diagram.
2. Holding the flower carefully with tweezers on the chopping board, cut the flower in half vertically. This means you should now be looking at a vertical section of the flower, similar to the top picture in Figure 3.98.
3. Draw a diagram of the flower, and label all the parts of the flower you can recognise. Add ‘M’ next to the male parts of the flower and ‘F’ next to the female parts of the flower.
4. Gently remove the sepals and petals, by pulling them down towards the stem. Use a microscope to look at the tip of the petal at low magnification. Record your observations of the petal’s texture in your results.
5. Remove the flower’s stamens, by breaking or gently cutting them off the stem. Examine the pollen with your microscope. Record your observations of the pollen’s shape and texture in your results.
6. Gently remove all parts except the pistil, so that it remains alone on the stem. Carefully cut the pistil in half lengthwise and use your hand lens to look at the inside of it. Record your observations of the style, ovary and ovules in your results.
7. Repeat steps 1–6 with the other flowers.
Results
Your results should consist of:
• labelled diagrams of the whole flowers and vertical sections of the flowers
• observations made during the dissection.
Discussion
1. Consider the different flowers you looked at. List the similarities and differences between them.
2. Explain why these differences between flowers might exist.
3. Use a flow chart to summarise the process of sexual reproduction in plants. Use the names of the parts of flowers that are involved and their role in reproduction.
Explore! 3.11
Citizen science
Bees pollinate most of our crops, but bee numbers are decreasing rapidly. Bees can fly between flowers at about 25 km/h and visit up to 5000 flowers in one day. In fact, bees are so important that artificial hives are moved all around the country to help pollinate new crops.
With the bee industry facing challenges such as invasive pests and extreme weather, bee experts are urging citizen scientists to help count various species of insects to assess the health of pollinators. The Australian Pollinator Count is a long-term citizen science project to monitor the status of pollinator populations, including more than 2000 species of bees, along with thousands of species of flies, butterflies, moths and wasps.
UNCORRECTEDSAMPLEPAGES
Suggest why people want to be involved in citizen science projects.
Did you know? 3.15
FlyGro
When managing an avocado and lychee farm in Mareeba, far north Queensland, James Wheildon began exploring the use of flies for pollination. Flies are just as efficient pollinators as bees and are ideal because they visit flowers year round, seek sugar from nectar and easily pick up pollen. Wheildon became known as the ‘fly guy’ after locals advised him to use dead animals to attract flies for pollination. However, he found the method was not practical because the dead animals did not last long and were a health risk. As a result, he developed FlyGro, a product that would attract flies for pollination. When water is added to FlyGro, it starts to ferment and emits a gas that attracts flies, dramatically boosting numbers and therefore pollination.
Seed dispersal
After fertilisation in conifers and flowering plants, the embryo develops inside a seed or nut. In flowering plants, the seeds are usually inside a fruit, which develops from the ovary after flowering. The everyday use of the term ‘fruit’ usually refers to an edible product such as apples, lemons, grapes and nectarines, but in plant science, the term ‘fruit’ refers to any seed-containing structure that develops from the ovary of a flowering plant. This includes bean pods, wheat grains and corn kernels.
Figure 3.107 The Australian Pollinator Count takes place every year around November, and anyone can get involved!
Figure 3.108 A fly pollinating a flower
Pine trees and other conifers produce cones, which are specialised structures that hold and protect the seeds. The cones can vary in size and shape, and they can remain on the tree for several years before they mature and release the seeds. When the cones are mature, they open to release the seeds, which are usually small and winged to aid in dispersal by the wind.
Plants produce many seeds, to increase the chances of survival. Many seeds will be eaten by animals, land on areas where they cannot grow, or be destroyed. Adult plants often take up a lot of space and resources, and so, for the offspring to thrive, the seeds need to spread to new places. This is known as seed dispersal, and plants have many clever ways of doing this.
Seed explosions
The seed pods of a group of plants known as Impatiens are ticking time bombs. When the fruit is ripe, the slightest touch can trigger the pod to explode suddenly, flinging the seeds it contains in many directions, although the seeds often do not travel far (see Figure 3.111).
caught on a dog’s fur. They are transported by the dog until the dog scratches them off and they are dispersed at a new location.
Hitching a ride on the outside
UNCORRECTEDSAMPLEPAGES
Certain plants, including grasses, have spiky pods (burrs) that latch onto fur or clothing to disperse (see Figure 3.112). The spiky pod stays on the animal’s fur until the animal gets itchy and scratches it off, and then the pod falls to the ground in a new location.
seed dispersal the spread of seeds away from the parent plant
Figure 3.109 A tomato flower and young fruit
Figure 3.110 A pine cone ready to drop its seeds
Figure 3.111 A Himalayan balsam seed pod exploding Figure 3.112 Burrs
Hitching a ride on the inside
Some plants have extra-sweet fruit, which encourages animals to eat the fruit containing the seeds (see Figure 3.113). The seeds have a tough coat so that they won’t be digested. When the seeds eventually pass intact through the animal, they are in a new location, where they may begin to grow.
Shooting
the breeze
Dandelion seeds are so light that they are blown extremely long distances by just a gust of wind. A fluffy tuft called a pappus acts as a parachute to carry each seed away (see Figure 3.114). A dandelion head is not just one flower but is made up of many florets that each produce an individual seed. One dandelion head can make about 500 seeds. This is why dandelions are such an effective weed.
Floating away
A coconut is one giant seed. It is hollow, so it can float (see Figure 3.115). This is how coconuts can move between islands and possibly even across oceans.
1. Draw a table to summarise the different ways in which seeds can disperse. Include examples where appropriate.
Figure 3.113 Animals ingest seeds in fruit and then defecate the seeds in a new location.
Figure 3.114 Dandelion seeds leaving a dandelion clock after getting caught in the breeze
Figure 3.115 A floating coconut. Wild coconuts are typcially found in coastal areas because their floating seeds are well suited to dispersal over water.
Quick check 3.16
seed germination
Aim
To design an experiment to test the conditions necessary for a seed to germinate, using the materials provided. You may investigate other factors that contribute to the plant’s germination (e.g. light levels, water, nutrients, heat).
Planning
1. Write a rationale about the factors that affect seed germination.
2. Write a specific and relevant research question for your investigation.
3. Choose a suitable independent variable to test.
4. Identify the dependent and controlled variables.
5. Write a hypothesis for your investigation.
6. Write a risk assessment for your investigation.
7. Construct a detailed method to explain the procedure you will follow in your experiment. Include all the instruments and exact measurements you will use. Set it out in step-by-step form. Include the number of repeats you expect to conduct. Do not forget to mention how the data are recorded. Remember, another scientist should be able to read this procedure and replicate your experiment exactly, so be detailed in your instructions.
8. After confirming with your teacher that your method is satisfactory, carry out your investigation.
Materials
• Petri dish or glass jar
• paper towel
• water
• seeds
• sugar
• salt
Results
1. Draw a results table for your experiment.
• water
• black paper
• heat lamp
• cotton wool
• fertiliser
2. Produce a suitable graph for your experiment.
Discussion
1. Describe any patterns, trends or relationships in your results.
2. Explain any trends you have identified.
3. Identify any limitations in your investigation.
4. Propose another independent variable that could have been tested, to expand on your results.
5. Suggest some improvements for this experiment.
Conclusion
1. Draw a conclusion from this experiment, using data to support your statement.
Explore! 3.12
analogous structures in flowering plants and vertebrates
Flower (plant): The flower is responsible for reproduction in flowering plants, containing reproductive organs such as stamens and pistils. Pollination occurs when pollen is transferred to the stigma of the flower, enabling fertilisation.
Reproductive system (vertebrate): The reproductive system in vertebrates, such as the testes and ovaries, produces gametes (sperm and eggs). Fertilisation takes place when the sperm meets the egg, leading to the formation of an embryo.
Task instructions
1. Create a summary chart
Reproduction in flowering plants: Summarise the process of reproduction in flowering plants, including the structure of the flower, pollination and fertilisation.
Reproduction in vertebrates: Summarise the process of reproduction in vertebrates, highlighting the organs involved, gametes produced and fertilisation.
In your chart, note:
• the structures involved
• the process of reproduction
• the key differences and similarities between the two systems.
2. Write a short summary (200–300 words)
After completing your chart, write a brief summary explaining the key points of comparison between reproduction in flowering plants and vertebrates. Focus on the analogous structures and processes, and how each system is adapted to the organism's reproduction.
3. Visual representation
Create a Venn diagram, mind map or infographic that visually compares the structures and processes involved in reproduction in flowering plants and vertebrates. Highlight the similarities and differences between these systems.
Explore! 3.13 saving seeds
The Royal Botanic Gardens in Kew, England, is leading a seed conservation program to preserve rare and threatened wild plants. Kew’s 2020 report, ‘State of the World’s Plants and Fungi’, indicates that 40% of the world’s plants are at risk of extinction due to the deterioration of natural ecosystems, changes in land use and the unpredictable effects of climate change.
UNCORRECTEDSAMPLEPAGES
On 1 March 2023, the Millennium Seed Bank announced they had successfully stored more than 2.4 billion individual seeds of 40 020 various species of wild plants. Dubbed the ‘Noah’s Ark for plants’ by experts, the Millennium Seed Bank is the most prominent global storage facility for wild seeds.
Research the Australian Seed Bank Partnership and the work that is being done to conserve Australia's native plant diversity.
Figure 3.116 The Millennium Seed Bank holds the Guinness World Records title as the largest seed bank in the world, and has a bomb-proof and flood-proof building.
Section 3.6 review
UNCORRECTEDSAMPLEPAGES
Section 3.6 questions
Remembering
1. State four ways in which plants can reproduce asexually in nature.
2. State the purpose of the petals of a flower.
3. Define ‘pistil’.
Understanding
4. Explain why some flowering plants’ ovaries develop into fleshy fruit.
5. Explain how seed dispersal by wind is effective.
6. Describe some ways in which a plant can be pollinated.
Applying
7. Design a garden to encourage pollinators such as bees and butterflies. Consider the plants’ structure and reproductive features.
8. Imagine you are a seed being dispersed. Describe the process of dispersal you would undergo depending on your environment.
Analysing
9. Compare a peach with a pine cone.
10. Distinguish between self-pollination and cross-pollination.
Evaluating
11. Hay fever is caused by pollen irritating the nasal passageways. Evan lived in England for 15 years and never experienced hay fever. Since moving to Australia, Evan has had hay fever every summer. Propose a reason for this.
12. A new volcanic island forms in the middle of the Pacific Ocean. Predict the first type of plants that will grow on the island, and justify your answer, based on its method of seed dispersal.
Figure 3.117 An isolated island, which was formed by a volcanic eruption
Chapter review
Chapter checklist
Success criteria
Linked questions
3.1 I can state the levels of organisation in a multicellular organism. 16
3.2 I can explain how the structure of the respiratory system relates to gas exchange in vertebrates. 6, 11, 23, 24, 25
3.3 I can explain how the structure of the circulatory system relates to the transportation of materials in vertebrates. 2, 10, 19, 20
3.4 I can explain how the structure of the plant respiratory system relates to gas exchange. 1, 3
3.4 I can explain how the structures of the xylem and phloem relate to transportation of materials in plants. 27
3.4 I can explain how transpiration in plants contributes to water and nutrient management. 12, 26
3.4 I can compare plant and vertebrate systems for gas exchange and transportation of materials. 21
3.5 I can outline different methods of reproduction in animals. 9, 14, 29
3.5 I can explain how the structures of male and female reproductive organs in animals relate to reproduction. 7, 15
3.6 I can explain how the reproductive structures of plants relate to reproduction. 8, 13, 17
3.6 I can describe the processes of pollination and fertilisation. 4, 5, 30
3.6 I can compare flowering plant and vertebrate systems with regard to reproduction. 18
Online only
3.7 I can describe how a disorder in cells or tissues can affect how an organ functions. Section 3.7 questions
3.7 I can describe how an artificial organ mimics or augments the function or functions of a real organ. Go
Review questions
SAMPLEPAGES
Remembering
1. Define ‘lenticels’ and where they might be found.
2. Name the blood vessel: a) that carries blood away from the heart to the lungs to become oxygenated. b) that carries oxygen-rich blood out of the heart. c) that returns blood to the heart from the body.
3. Name the plant structures responsible for gas exchange and explain their function.
4. Define pollination.
5. Define fertilisation.
6. Identify the correct word for each of the numbers in the diagram in Figure 3.118: larynx, alveoli, diaphragm, nasal cavity, trachea, lung, epiglottis, pharynx, bronchus, bronchiole.
7. State the function of the following structures in the human reproductive system.
a) ovary
b) scrotum
c) fallopian tube
d) prostate gland
e) uterus
8. Name the parts of a flower that have the following functions.
a) attracts pollinators
b) the site of seed development
c) produces the male gametes
d) produces the female gametes
e) site where the male gamete sticks to the female part of the plant
9. State the two methods of fertilisation in animals, and for each method give an example of one animal that uses it.
Figure 3.118 Human respiratory system
Understanding
10. Describe the contents of blood.
11. Summarise three essential features of gills that enable them to efficiently exchange gases and act as lungs for fish.
12. Explain how transpiration helps plants manage water loss and nutrient uptake.
13. Explain four different ways that seeds might be dispersed.
14. Describe how sexual reproduction results in a greater rate of variation among offspring than asexual reproduction.
15. Explain how a sperm’s structure is related to its function.
Applying
16. Sequence these terms in order of increasing size/complexity: organ, organism, tissue, cell, organ system.
17. Construct a comic strip or diagram to model how sexual reproduction occurs in a flowering plant. Ensure the reproductive organs are labelled appropriately.
Analysing
18. Compare the processes of reproduction in vertebrates and flowering plants.
19. Contrast the contents of the blood as it leaves your heart with when it returns to the heart.
20. Copy and complete the table to distinguish between an artery, a capillary and a vein, in terms of both their structure and function. Structure
Artery Capillary Vein
21. Complete the table to compare the structures involved in transpiration in plants and the circulatory system in animals.
UNCORRECTEDSAMPLEPAGES
22. Forced vital capacity (FVC) is a measure of how much air a person can blow out in one exhalation. The graph in Figure 3.119 shows the normal values for men (in red) and women (in purple) according to their age. Use the graph to answer the following questions.
UNCORRECTEDSAMPLEPAGES
Figure 3.119 Forced vital capacity versus age, for men and women
a) Identify the average FVC for a male and a female at age 30.
b) Identify the age range for which a person’s lung capacity increases the most.
c) Propose a reason why males tend to have larger FVC than females.
Evaluating
23. Construct a flow chart or a story that depicts the path taken by a single molecule of oxygen, from when it enters the nose to when it enters a cell and diffuses to the mitochondria to be consumed in cellular respiration. Then show how a molecule of carbon dioxide is produced and follow its story until it is exhaled. Make sure you include all relevant parts of the respiratory and circulatory systems.
24. Propose two reasons why most frogs need to remain near water.
25. Construct a Venn diagram to compare the gas exchange structures of fish, frogs and humans.
26. Propose how environmental factors such as temperature or light could affect the rate of transpiration in plants.
27. Evaluate how a malfunction in the plant transport system (xylem or phloem) would affect the overall health of the plant.
28. If a female reptile with XX sex chromosomes reproduces by parthenogenesis because of a lack of male mates in the area, what can you predict about her offspring?
Figure 3.120 Drakea, or hammer orchids, are pollinated by specific species of thynnid wasp, so their flowers have adapted to look like the females of those wasp species.
29. A biologist is investigating a species of frog that lives in an environment that is changing rapidly. Propose a reason why sexual reproduction would be better for this species of frog.
30. The flowers of certain orchids closely resemble the shape of a female wasp (see Figure 3.120). Justify a reason for this adaptation.
Data questions
Biathlon is a winter sport whereby an athlete competes by completing three legs of crosscountry skiing and two legs of shooting at a target. In each phase of the race, the biathlon athlete’s heart rate will change as they use energy to ski and then calm themselves for a shooting phase. The heart rate of a biathlon competitor is plotted over the various phases of the race in Figure 3.121. The relationship between maximum heart rate (HRmax) and age of the athlete is shown in Figure 3.122.
Figure 3.121 Heart rate of an athlete during a biathlon race including warm-up, three ski phases, two shootings, a final sprint and a recuperation phase
UNCORRECTEDSAMPLEPAGES
Figure 3.122 Activity intensity linked to the average human heart rate as a function of age (following the commonly accepted relation HRmax = 220 – age)
1. With knowledge that the heart rate is higher during the ski periods and lower for the shooting periods, identify the time range for each of the three ski periods and the two shooting periods.
2. Identify when the athlete’s heart is beating at its lowest rate.
3. Calculate the duration of the athlete’s recuperation phase, when the heart rate goes from its highest, back to the resting pace.
4. Using the graph in Figure 3.122, identify the potential age of the athlete knowing his HRmax is 190, and that HRmax = 220 – age.
5. Identify the relationship between the heart rate during the successive ski periods and the fatigue of the athlete across the race.
6. Contrast the heart rate between 24 and 30 minutes (third ski phase), and between 30 and 33 minutes (final sprint).
7. Another athlete in the race was 40 years old and had a heart rate of 150 beats per minute during the second shooting phase. Deduce the activity intensity for this athlete during this phase.
8. Infer whether or not the heart rate of the athlete during the ski phases would be identical on a longer race with five ski periods and four shootings.
9. Predict the maximum heart rate of a 70-year-old athlete running a marathon if the athlete was using the maximum effort.
stem activity: Artificial bees to save the planet
Background information
Australia has many native bee species (the estimated total being more than 1700 types, with around 800 being found in Western Australia.
However, all bees play an important role in pollinating plants, and native bees might have just
Low-res
Figure 3.123 The blue-banded bee is considered a ‘safe’ bee.
the right skills to help keep our local food chain safe.
A bee’s skills in moving pollen are highly evolved. Different species have evolved differently to suit the surrounding plants. Some bees can buzz at certain frequencies, which for some plants is essential for releasing the pollen. Others have specialised bristles on their forelegs to rake the pollen out.
DESIGN BRIEF
Design a pollen distribution prototype robot or machine that can be used in areas with declining bee populations.
UNCORRECTEDSAMPLEPAGES
activity instructions
In groups, you will research bees and pollination. Then you will design and create a scale drawing of a pollen distribution prototype. You won’t need to build this, so be as creative and incorporate as many types of technology as possible.
Research and feasibility
1. Conduct some research on how bees support the reproduction of plants. You may want to print out an image of a bee and annotate its features.
2. Discuss how a pollen distribution prototype could be built to mimic the behaviours of bees.
3. Conduct some research on different types of technology that are used in robotics and flight.
Design and sustainability
4. As individuals, sketch your own ideas, and then present to the group and discuss your key connections between how bees distribute pollen and your prototype. Discuss the best of each person’s sketch.
5. As a group, sketch a design and annotate its key features, incorporating sustainable ideas. This means making sure that your prototype can be reused easily. Discuss in your group the size of your prototype and the materials or manufacturing that would be required.
Create
6. As a group, create a scale drawing of your group’s prototype to present to the class. You will need to agree on a scale and a size. Your scale drawing should include colours and annotations.
Evaluate and modify
7. Present your prototype design to the class in a one-minute demonstration of your scale diagram.
8. Discuss with the class your ideas of design and sustainability for the prototype.
9. Evaluate the issues arising from a human solution to an environmental problem.
UNCORRECTEDSAMPLEPAGES
Chapter 4 Particles of matter
Introduction
The world around you is made up of matter, and in this chapter you will learn about the particles that make up matter. Atoms, elements, compounds, molecules and mixtures can all be represented in different ways to give information about the compositions of the particles. In this chapter, you will learn about where those representations came from and how you can use them yourself to describe the matter in the world.
UNCORRECTEDSAMPLEPAGES
Section 4.1
Section 4.2
Section 4.3
Chapter map
Matter
Pure substances
Elements are substances made up of only one type of atom.
Organising elements
• Metals
• Non-metals (including metalloids)
The periodic table organises elements from lightest to heaviest.
Structural organisation with other atoms of the same type
• Monatomic
• Molecules
• Lattices
Mixtures
Categorised as
• Homogeneous
• Heterogeneous
Compounds are substances made up of two or more different types of atoms chemically combined.
Organised as
• Molecules
• Polymers
• Lattice arrangements
UNCORRECTEDSAMPLEPAGES
Curriculum
Chemical sciences
Matter is composed of atoms, which contain protons, neutrons and electrons; matter can be classified as elements or compounds, which can be compared using different representations, including symbols, formulae and models.
• recalling the symbols for common elements
• using the formulae for molecules and compounds to identify the names and number/s of elements they contain
• constructing models of elements, molecules and compounds
Elements of the periodic table can be classified as metals and non-metals based on their physical properties.
• exploring the properties of metals and non-metals, such as melting and boiling point, hardness, malleability, brittleness, ductility, heat and electrical conductivity, lustre and density
• comparing the properties of metals and non-metals, and their position on the periodic table
Collaborating and applying
Illustrate how the development of scientific knowledge has benefited from collaboration across disciplines and the contributions of people from a range of cultures.
• investigating how the development of superstrong, lighter alloys has enabled engineers to improve structural components in building, transportation and industry
1. Define an element, an atom, a molecule, a compound, a pure substance and a mixture.
2. Distinguish metals and non-metals, as well as metalloid elements.
3. Recall the history of the development of the term ‘element’.
In year 7, you learned about matter and that it makes up everything in the world around you. Matter comes in three main states: solid, liquid and gas. In this chapter we are going to zoom in on what matter is actually made up of at the smallest level. If you were to cut a piece of paper in half and then in half again, you would end up with a smaller piece of paper. But what if you kept cutting it in half until all that was left was the smallest indivisible particle of paper remaining? – a particle that couldn’t be cut in half again. This particle would be called an atom and is the smallest indivisible particle of matter. Atoms are incredibly small – across the width of one single strand of hair there are likely close to 10 billion atoms!
While atoms are called ‘indivisible’, they are actually made up of smaller subatomic particles: protons and neutrons make up a small densely packed nucleus, which is surrounded by orbiting electrons. The protons are positively charged, and the electrons balance this charge as they are negatively charged. Neutrons are neutral, and so atoms are also overall neutral. Splitting an atom’s subatomic particles is technically possible but is beyond the scope of what you will learn in year 8.
Try this 4.1
Cutting paper
Cut a strip of paper 28 cm x 1 cm. Now cut it in half, and you will have two 14 cm lengths of paper. This is cut one. Repeat this as many times as you can, counting your cuts as you go.
How many cuts were you able to make? Name one item that is the same size as the paper with one cut, three cuts and five cuts. How do you think you could keep cutting the paper smaller and smaller? Imagine this: it takes 31 cuts to get a piece of paper the size of an atom!
Pure substances and mixtures
In this chapter, the word ‘particles’ will be used to describe a range of atoms, elements and compounds, which have a size on the atomic scale. Atoms may exist alone, but they can also join to other atoms. In this case, the strong force of attraction used to join atoms is called a chemical bond There are several different types of chemical bonds: covalent bonds (a bond usually between two non-metal atoms), metallic bonds (bonds between metal atoms) and ionic bonds (a bond usually between a metal and a non-metal atom). A chemical substance is one type of particle of matter and a pure substance is made up of only one type of chemical substance. In this chapter you will learn about two types of pure substances: elements and compounds. chemical bond strong force of attraction between two atoms
substance matter that contains only one type of particle pure substance material that is made up of just one type of chemical substance WORKSHEET Properties of elements and compounds
Figure 4.1 A simplified model of the structure of an atom
element chemical substance made up of only one type of atom molecule two or more atoms chemically bonded by strong covalent bonds
An element is a chemical substance made up of only one type of atom. These can be single atoms or atoms that are bonded together, but they are all the same type of atom. For example, gold is an element and is made up of many single gold atoms joined by metallic bonds. A combination of atoms held together by strong covalent bonds is called a molecule. Atoms of the element hydrogen like to bind together to form molecules, each with two hydrogen atoms joined by a covalent bond.
Atoms of an element
Molecules of an element
Molecules of an element
Explore! 4.1
the evolution of the element
The element has taken on a few different definitions prior to the one that scientists use today. The earliest report is from the fifth century bce when the Greek philosopher Empedocles proposed that there were four ‘roots’ or ‘elements’ in the world: earth, water, air and fire.
Use the internet to find information on the different definitions of the term ‘element’ from the following philosophers and scientists and create a timeline of their models.
• Aristotle
• Democritus
• Paracelsus
• Robert Boyle
• Maria Goeppert Mayer
• Antoine Lavoisier
• John Dalton
A compound is a chemical substance made up of two or more different types of atoms bonded together. For example, water is a covalent molecular compound, as it is made up of two hydrogen atoms bonded to one oxygen atom, joined by strong covalent bonds. compound chemical substance made up of two or more different types of atoms
UNCORRECTEDSAMPLEPAGES
Figure 4.4 A water molecule is a compound, because it has two different types of atoms: one oxygen atom bound together with two hydrogen atoms. Water is also a pure substance, as it is made up of only one type of molecule, the one shown here.
Figure 4.2 In an element, all the atoms are the same.
Atoms of an element
Figure 4.3 Empedocles proposed four elements: earth, water, air and fire.
A mixture is a substance that is made up of two or more different pure substances (compounds or elements) that are not bonded together. For example, air is a mixture of several different elements and compounds.
Figure 4.5 Air is a mixture of nitrogen, oxygen, argon, carbon dioxide, water vapour and very small amounts of other gases.
mixture a substance made up of two or more different pure substances (compounds or elements) that are not chemically bonded together
UNCORRECTEDSAMPLEPAGES
Making thinking visible 4.1
Parts, purposes, complexities: the water molecule
1. Identify the different parts you can see in the water molecule model in Figure 4.6.
2. What are the purposes of each of these parts?
3. What is complicated about this model? What questions do you have about water molecules?
4.6 A model of a water (H2O) molecule
The Parts, purposes, complexities thinking routine was developed by Project Zero, a research centre at the Harvard Graduate School of Education.
Figure
Quick check 4.1
1. Match the following terms with their correct definitions.
Molecule
Compound
The smallest indivisible particle that makes up all matter
Chemical substance made up of only one type of atom
Chemical bondChemical substance made from two or more different types of atoms
Element
Atom
UNCORRECTEDSAMPLEPAGES
Two or more atoms chemically bonded together by covalent bonds
Strong force of attraction that holds atoms together
2. In the following table, match each term and example with the correct diagram (A–E). Term
Mixture of elementsOxygen and helium
Did you know? 4.1
electron microscopes
Electron microscopes allow scientists to visualise matter smaller than the microscale, which is the limit of most light microscopes that you might use in your school classroom. The three main types of electron microscope are the scanning tunnelling microscope (STM), scanning electron microscope (SEM) and the transmission electron microscope (TEM). Scientists are continuing to improve the resolution of their microscope images, and currently these types of electron microscopes can measure particles on the nanometre (nm) scale. A scanning electron microscope (SEM) has been used in recent years to image the SARSCoV-2 virus, the virus responsible for the COVID-19 disease. These virus particles have a diameter of approximately 50–150 nm.
elements
Elements are made up of one single type of atom. The first elements were identified thousands of years ago with the discovery of the metals, gold, tin, copper and iron. After these elements, scientists and philosophers discovered and hypothesised other elements that could be found in the earth, rocks, air and water. In more modern times, elements have been made by shooting atoms at each other at very high velocities to attempt to ‘merge’ them. This is how the newest element, oganesson (Og), was discovered in 2002.
Grouping elements
Metals and non-metals
Given that there are 118 elements, they can be categorised by their physical and chemical properties to more easily classify the type of element. A useful classification is whether the element is a metal or a non-metal. To do this, scientists look at the general properties that the elements have in common (see Table 4.1).
Metalloids
UNCORRECTEDSAMPLEPAGES
Uncorrected 2nd sample pages
Some of the elements in the non-metal group have properties that could be considered in the metal group. One example is silicon (see Figure 4.10). Silicon can conduct heat and electricity a little, but it cannot be bent (malleable) or made into wire (ductile). It is lustrous (shiny) when polished but is brittle and can shatter like glass. When an element has properties of both metals and non-metals, it is called a metalloid. However, it should be noted that all metalloids are considered non-metals, as they are not metals! There are six elements that are typically considered metalloids: boron (B), silicon (Si), germanium (Ge), arsenic (As), antimony (Sb) and tellurium (Te).
metal a chemical substance that is shiny (lustrous), can conduct electricity and heat, is malleable and ductile, and is usually silvery/grey non-metal a chemical substance that is dull, cannot usually conduct electricity and is brittle
metalloid a non-metallic substance that has some of the properties of both metals and nonmetals
VIDEO Scanning tunnelling microscope
Figure 4.8 Scanning electron microscopic (SEM) image of SARS-CoV-2, which causes the COVID-19 disease
Figure 4.9 This transmission electron microscope in the USA can observe atoms.
lustre
the ability of a substance to become shiny when polished conductivity
the ability of a substance to conduct (carry) electricity or heat
malleability
the ability of a substance to be bent or flattened into a range of shapes
ductility
the ability of a substance to be drawn into a wire
Property
Metals
Non-metals
State at room temperatureSolid (exception: mercury)Solid, liquid or gas
Colour
lustre
Conductivity
malleability
ductility
Melting point and boiling point
Hardness and density
Silver/grey (exceptions: gold, copper)
Shiny when polished
A range of colours, as well as colourless
Usually dull
Conducts electricity and heatCannot usually conduct electricity or heat
Can be bent or flattenedCannot be bent or flattened; Often brittle
Can be made into a wireCannot be made into a wire
Usually high temperature (exception: mercury)
Usually low temperature
Relatively hard and denseRelatively soft and low density
Figure 4.10 Three examples of metalloids. (a) Left: Silicon is shiny and brittle and can conduct electricity but not as well as a metal. (b) Antimony is shiny like a metal, but brittle like a non-metal. (c) Boron conducts electricity but is brittle.
Did you know?
4.2
Conductors and semiconductors
Some non-metals are good conductors. Carbon in the form of graphite is both a good heat and electrical conductor, and surprisingly, carbon in the form of diamond is the best-known thermal conductor, with a conductivity five times higher than copper!
Metalloids have a heat conductivity between metals and non-metals, and if they can conduct electricity, this usually can only occur at higher temperatures. Metalloids that are good electrical conductors at high temperatures are called semiconductors. Silicon is an example of a semiconductor.
After oxygen, silicon is the second most abundant element in Earth’s crust but is rarely found naturally in its pure form. Instead, it can be extracted from silica sand, a combination of silicon and oxygen.
Table 4.1 The general properties of the metal and non-metal elements
Practical 4.1
metals versus non-metals
Aim
To investigate the properties of metals and non-metals
Materials
• light bulb (LEDs can also be used)
• connecting wires and alligator clips
• battery or power pack
• fine sandpaper
• samples of six metals and non-metals – for example, sulfur, magnesium, silicon, copper, iron/steel, tin, zinc, aluminium, carbon
Method
Be careful
Electrical shocks may occur.
Elements may become hot. Ensure the recommended voltage output is not exceeded. Turn the power supply off when changing the circuit.
1. Draw a table like the one in the Results section. Include the six metals and non-metals you are investigating. Also select a property you would like to investigate as well as those already listed.
UNCORRECTEDSAMPLEPAGES
Material to be tested
Alligator clips
Figure 4.11 Experimental set-up for testing the electrical conductivity of different substances
2. Use the fine sandpaper to rub each substance and determine its lustre – is it shiny or dull? Record your observations in your table.
3. Try to bend each of the substances – is it malleable or not? Record your observations in your table.
4. Make a prediction about the electrical conductivity of each of the substances.
5. Connect each substance as shown in Figure 4.11. Does it allow electricity to pass through, making the globe glow? Record your observations in your table.
6. Investigate another property of your choice.
Power supply
Light bulb
Results
SampleLustreMalleability
Electrical conductivity Your choice of property
Prediction:
Observation:
Prediction:
Observation:
Prediction:
Observation:
Prediction:
Observation:
Prediction:
Observation:
Prediction:
Observation:
Discussion
1. Which of the substances you tested were metals and which were non-metals? Were there any exceptions? List them and name the group that these exceptions belong to.
2. Explain how you tested for your choice of property.
3. Recall the difference between a physical property and a chemical property. Then, summarise the physical properties that metals have in common and the physical properties that non-metals have in common. Name some exceptions and state how they are different.
4. Are the substances you tested elements, compounds or mixtures? Explain your answer by including definitions of these terms.
5. Imagine you have discovered a new element. What tests would you carry out in order to determine whether the substance was a metal or a non-metal?
1. Define the following key terms: element, metal, non-metal, metalloid, malleability, lustre, conductivity, ductility. Provide examples where possible.
2. Demonstrate your knowledge of metals and non-metals by rewriting the following properties in the correct columns.
Metals
Solid, liquid or gas
Usually in the solid state
UNCORRECTEDSAMPLEPAGES
Usually dull
Lustrous surface
Non-metals
Usually unable to conduct electricity or heatCan conduct electricity and heat
Ductile
Low melting temperature
High melting temperature
Soft and low density
Unable to be made into a wire
Malleable
Unable to bend
Hard and dense
Quick check 4.2
Section 4.1 review
Online quiz
Section 4.1 questions
Remembering
Section questions
Teachers can assign tasks and track results
1. Define the terms ‘pure substance’ and ‘mixture’, providing examples of each.
2. Recall three properties of metals and three properties of non-metals.
3. State what holds two or more atoms together in a molecule.
4. Identify the missing word in this sentence: A molecule consists of two or more ____ covalently bonded together.
Understanding
5. Look at diagrams A to D below. Identify which diagram is:
a) an element
b) a compound
c) a mixture of elements
d) a mixture of compounds
Applying
6. Summarise three of the tests you can do to find out whether a substance is a metal or a nonmetal.
Analysing
7. Distinguish between:
a) an atom and a molecule
b) an atom and an element
c) an element and a compound
d) a molecule and a compound
Evaluating
8. Consider what elements are and what compounds are. Discuss why there are many more compounds than there are elements.
9. Justify why the metalloids are considered a separate group from the metals and non-metals. Use an example to illustrate your point.
Go online to access the interactive section review and more!
UNCORRECTEDSAMPLEPAGES
10. Summarise the work of John Dalton towards the definition of the ‘element’.
4.2 Organising elements
Learning goals
At the end of this section, I will be able to:
1. Describe how Mendeleev organised elements in his first periodic table.
2. Describe different elemental structures, including monatomic, diatomic, molecules and lattices.
symbols for elements
For all scientists, from all language backgrounds, to understand the language of chemistry, elements are represented by universally understood symbols. These symbols should avoid confusion when communicating about elements and therefore should be unique.
Elements are always denoted by a ‘symbol’ made of either a capital letter or two letters where the first letter is capitalised and the second letter is never capitalised. Usually, the letter used for the symbol is the first letter of the element’s name or the first two letters to ensure an element has a unique symbol. For example, hydrogen has the symbol H, and, to not confuse with hydrogen, helium has the symbol He. But what about chlorine? You would think that chlorine would have the symbol Ch, but it is actually Cℓ. In this case it is distinguished by its third letter. As chlorine was given the symbol Cℓ, no other element has ever been given the symbol Ch as it would just cause confusion!
Sometimes the letters from the element’s Latin or Greek name are used. For example, the symbol for copper is Cu. The Latin word for copper is cuprium and this is where its symbol comes from. Another example is mercury, which has the symbol Hg, taken from its Latin name, hydragyrum, which means ‘shining water’. Some elements are also named after famous people or places, like einsteinium and francium. Table 4.2 shows the symbols for the first 20 elements of the periodic table these are the symbols you should commit to memory. Can you identify any symbols that aren’t based on the English name?
UNCORRECTEDSAMPLEPAGES
Table 4.2 The first 20 elements, their symbols and some of their properties
Quick check 4.3
1. Explain why not all the elements are named after the first letter of their name.
2. Recall the reason for using symbols for elements instead of the elements’ full names.
3. Refer to Table 4.2 with the 20 elements listed.
a) Name the elements with the following symbols: K, S, Mg, Be, B
b) Identify the element with the lowest melting point.
c) Identify the most recently discovered element.
4. Match each element name below to its correct symbol.
An organised list of all the known elements and their symbols is called the periodic table (see Figure 4.13). It shows the elements in order from lightest to heaviest (with some exceptions) and even clearly shows which elements are metals, which are non-metals and which are metalloids. The classification of metals, non-metals and metalloids has been shown more clearly in the periodic table in Figure 4.14.
Uncorrected 2nd
The modern periodic table displays not only elemental data, but it has its characteristic shape as it displays many trends to scientists, including metallic character and chemical reactivity. This form of the periodic table wasn’t created overnight – there were many iterations with ideas from many great scientists and philosophers.
‘Step ladder’ separating the metals from the metalloids and non-metals
The classification of metals, non-metals and metalloids in the periodic table
Figure 4.14
Try this 4.2
Identifying elements
Look at the periodic table in Figure 4.14. Use the legend to identify all six metalloids. What colour are they in the periodic table?
Next, identify some of the metals you know. Where are they in relation to the metalloids? What about the non-metals – where are they positioned in the table?
Explore! 4.2
mendeleev’s periodic table
Dmitri Mendeleev was a Russian scientist who is often called the ‘father of the periodic table’ after he proposed the novel ‘periodic system’ in 1869.
Use the internet to research the following questions:
1. Why did Mendeleev arrange the known elements in the vertical groups shown in Figure 4.15, with some blank spaces?
2. How is the organisation of elements in Mendeleev’s periodic table similar to the modern periodic table used today?
UNCORRECTEDSAMPLEPAGES
Quick check 4.4
1. Recall the purpose of the periodic table.
2. Below are some of the symbols in the periodic table that start with C or S. State the full element name for each symbol.
Figure 4.15 Mendeleev’s first periodic table proposed in 1869
Figure 4.16
Dmitri Mendeleev, the father of the modern periodic table
Flame tests
Aim
To investigate the colour that a flame will go when an element is heated and use this information to determine the metal element in four unknown samples
Materials
• heatproof mat
• Bunsen burner
• 10 flame test wires
• 5 mol/L hydrochloric acid in five test tubes, labelled with the test solutions below
1. Check if your flame wires are clean by holding the metal loop in the hottest part of the blue Bunsen burner flame. If it is not clean, a coloured flame will appear, so clean it by dipping it into the hydrochloric acid provided and then holding the loop in the Bunsen burner flame again.
2. Dip the clean flame test loop into one of the known test solutions, then hold the metal loop in the hottest part of the Bunsen burner flame. Record the colour of the flame in your results table.
3. Clean the flame test wire, then test another known test solution. Keep going until you have recorded the colour for all the known solutions.
4. Flame test the four unknown solutions and record their flame colours in a second results table.
5. Work out which metals are in each of the unknown samples and record in your table.
Results
Table showing flame colours of known substances
Flame colour
Table showing flame colour of each unknown substance and the metal indicated by the colour
Sample 1
Sample 2
Sample 3
Sample 4
Flame colour
Metal
Discussion
1. Suggest why a blue flame, not a o flame, on the Bunsen burner is necessary.
2. List the elements that produced the most easily identified colours. Were there any colours that were tricky to identify?
SAMPLEPAGES
3. Based on your observations, would this method be useful to determine the identity of metals that are in a mixture? Why or why not?
4. Give at least two reasons why the flame test may not always provide the right answer.
5. Describe some sources of faults for this experiment and the improvements you would make if you were to repeat this task.
Figure 4.17 A barium salt burning in the flame of a Bunsen burner, producing an apple green flame BariumCalciumCopperStrontiumSodium
monatomic
made up of single atoms, all of one type
lattice
a three-dimensional shape of atoms that pack together very tightly and form bonds that are extremely strong because the atoms bond to each other in multiple directions
diatomic element
an element that exists as a molecule consisting of two atoms of the same type
polyatomic element
an element that exists as a molecule containing more than two atoms of the same type
A closer look at the organisation of elements
While elements are made up of only one single type of atom, those atoms can arrange themselves in different ways. Atoms of an element can be single atoms (monatomic) or chemically bonded as molecules. They can even form larger three-dimensional lattices
Monatomic elements
Monatomic means ‘single atom’. A monatomic element is made up of single atoms that are not chemically combined. The only elements that take this form are known as the noble gases and include helium (He), neon (Ne), argon (Ar), krypton (Kr), xenon (Xe) and radon (Rn). Can you see where these elements all sit in the periodic table? (Refer back to Figure 4.13.)
Molecules
In general, non-metal atoms chemically bond to form molecules. Some elements chemically bond to form diatomic elements. These molecules have two atoms of the same type bonded together. Common examples of diatomic elements include hydrogen (H2), oxygen (O2), nitrogen (N2) and chlorine (Cℓ2).
Other elements exist in polyatomic form. Sulfur exists as S8 and phosphorus exists as P4. Oxygen can also exist as ozone (O3).
Some examples of different molecular elements are shown in two dimensions in Figure 4.18. As you look at the diagram, it is important to notice not only the range of molecules but also how to write the chemical formula for elements that are molecules. For example, look at the oxygen molecule. It has two oxygen atoms, so we write O2, where O is the elemental symbol for oxygen, and the subscript 2 shows how many atoms are joined by chemical bonds in the molecule.
UNCORRECTEDSAMPLEPAGES
Figure 4.18 Some elemental molecules: hydrogen, oxygen, chlorine, ozone and sulfur
Try this 4.3
2d and 3d molecules
Figure 4.18 illustrates some two-dimensional models of molecular elements. Let’s now visualise them in three dimensions.
1. Go to app.molview.com
2. Create the molecular elements, Cℓ2 and S8 and the molecular compound CH4
3. What do you notice about the 3D models compared to the 2D models?
4. In your own words, describe each 3D model.
Lattices
All metals in their solid state (and some non-metals, such as carbon and silicon) are organised in what we call a lattice formation. A lattice is a three-dimensional shape that allows the atoms to pack together very tightly and form strong chemical bonds. They are strong because the atoms bond to each other in multiple directions, and so it is hard to separate them completely. The three-dimensional lattice continues in all directions to the edge of the material.
UNCORRECTEDSAMPLEPAGES
1. Describe the three ways in which elements can be organised.
2. Draw a simple diagram to show the arrangement of atoms in each of the three ways described in Question 1.
Explore! 4.3
Forms of carbon
Carbon is an element that occurs in many different forms. Each form consists solely of carbon atoms, but the way the atoms are organised differs. This affects the properties of the different forms.
1. Investigate one of the hardest substances in the world: diamond. Find out its uses and its properties.
2. Investigate the substance that is in the middle of your pencil: graphite. Find out its uses and its properties.
3. Investigate the coolest-sounding molecules: buckyballs. Find out their uses and their properties.
4. Compare the structure of the lattices of diamond, graphite and buckyballs. Do this by describing what each looks like and include a sketch.
Figure 4.19 Methane, CH4
Figure 4.20 A 3D lattice structure: every atom is attached tightly to other atoms in multiple directions.
Quick check 4.5
VIDEO Forms of carbon
Science inquiry 4.1
Aboriginal and torres strait Islander Peoples’ material culture
Material culture is a term used in the scientific community to refer to the physical aspects of the objects that surround people, that is, the relationships between people and their things. Aboriginal and Torres Strait Islander Peoples have passed down ancestral knowledge of the properties and uses of materials found on Country for millions of years. Their knowledge of the interconnectedness of all living things (connection to Country) allows a deep and sophisticated knowledge of the use of the properties of plant and animal life for food, clothing and medicine, as well as tools, such as grinding stones, coolamons and fish traps.
Thus, a vast material culture exists in many Aboriginal and Torres Strait Islander cultural groups over many generations.
Figure 4.21 Aboriginal and Torres Strait Islander Peoples use the cultural knowledge of the properties of materials found on Country.
Section 4.2 review
Online quiz
Section questions
Section 4.2 questions
Remembering
1. State the chemical symbol for the following elements.
a) carbon b) oxygen c) hydrogen
d) silicon e) sodium f) copper
g) chlorine h) potassium
2. Identify the names of these elements.
a) Ag b) Au c) Sn
d) Si e) Hg f) Li
g) Zn h) Pb
Teachers can assign tasks and track results
Go online to access the interactive section review and more!
UNCORRECTEDSAMPLEPAGES
3. Name all the elements in the periodic table that have symbols beginning with A.
Understanding
4. Select the appropriate word from the list to complete the sentences below: compound, symbol, properties, sulfur, pure, letters, carbon dioxide, periodic table, atoms a) cannot be separated or broken down any further chemically.
b) An element’s name can be written as a , which consists of one or two
c) Elements are organised in the .
d) When two or more different elements are chemically combined, the end result is a .
e) is an example of an element and is an example of a compound.
f) Elements and compounds are called substances because they have specific chemical and physical
5. Identify each of the following as either an element (E) or a compound (C).
a) silver b) water c) chalk
d) plastic e) tin f) silicon dioxide
g) chromium h) arsenic i) carbon dioxide
j) sodium chloride (table salt)
Applying
6. Describe a monatomic element and a molecular element.
Analysing
7. Classify the following elements as monatomic, molecular or lattice: helium, diamond, hydrogen, aluminium, oxygen, argon, chlorine, copper, neon
8. Distinguish between a molecular element and a lattice. Include examples in your answer.
Evaluating
9. We use symbols to describe elements. Propose the reasons why we do this.
4.3 Compounds and mixtures
Learning goals
At the end of this section, I will be able to:
1. Name a chemical compound using naming conventions.
2. Distinguish homogeneous and heterogeneous mixtures.
3. Explain why mixtures are represented by percentages or ratios and not chemical formulae.
Compounds
When two or more different types of atoms chemically bond together, a chemical compound is formed. For example, water is a compound. It is made up of two hydrogen atoms bonded to one oxygen atom, so it has two different types of atoms. Just as the 26 letters of the alphabet can form thousands of words, elements can form millions of compounds.
Compounds can be covalent or ionic – these terms describe the types of chemical bonds that hold the compound together. Covalent compounds consist of units called molecules (e.g. water) while ionic compounds consist of units called ions (e.g. sodium chloride). The properties of a compound are affected by the elements that are in the compound, the types of bonds between atoms and how they are arranged. For example, the properties of carbon vary depending on the arrangement of the carbon atoms. You learned about some of the different forms of carbon in Explore! 4.3: graphite, diamond and buckyballs. Hydrogen has the following properties: it is colourless, odourless, non-toxic and highly combustible. However, the properties of the compounds formed from carbon and hydrogen are very different from the two elements on their own. Figure 4.23 shows examples of the uses and properties of compounds made of only carbon and hydrogen.
UNCORRECTEDSAMPLEPAGES
Figure 4.22 Elements are like the letters of the alphabet – letters can form thousands of words, and elements can form millions of compounds.
Figure 4.23 Substances that contain only carbon and hydrogen.
organisation of compounds
The atoms in compounds can be arranged in three different ways: as a discrete (separate) molecule, a polymer or a lattice. These are summarised in Table 4.3.
Arrangement
Description
Discrete moleculeGroups of atoms held together by covalent bonds. A particular compound always has the same elements in the same ratio and these molecules are generally called ‘discrete’ due to being distinctly separate from one another, unlike in polymers and lattices. Carbon
Polymer
A long molecule made of a chain of atoms in a pattern that repeats
polymer a long molecule made of a chain of atoms in a pattern that repeats
Examples
Plastics
Natural fibres (e.g. cotton) Proteins
Lattice A 3D continuous network of atoms in a fixed arrangement, held together by chemical bonds. However, most compounds that exist as lattices are ionic, so the lattices are made up of positive and negative ions rather than atoms. Sodium
Science inquiry 4.2
Ultra-high-molecular-weight polyethene (UHmWPe) body armour
Polymers can be manufactured for the development of superstrong but lightweight ballistic (bullet-resistant) body armour. In fact, polyethene has been synthesised by reaction of ethene monomers under conditions that create a substance known as ultra-high-molecular-weight polyethene (UHMWPE) that has the strength to stop bullets! In recent years, scientists have also been experimenting with combining plates of stainless steel alloys with UHMWPE to create even stronger materials for armour used in the military and by police.
Figure 4.25 Summing up: the organisation of atoms in elements and in compounds
Table 4.3 The atoms in a compound can be arranged into a discrete molecule, a polymer or a lattice.
Figure 4.24 Could UHMWPE body armour be used by Australian police?
chemical formula a symbol for a compound that shows which elements, and how many atoms of each element, are present in one molecule or one basic unit of that compound
Polymer banknotes
In 1988, Australian scientists at CSIRO developed the first polymer banknotes and they were introduced to the general population. These polymer-based Australian banknotes start out as plastic pellets, which are melted and blown into a bubble three storeys high! The walls of the bubble are pressed together and cooled to form laminated polymer films. Since the introduction of polymer banknotes in Australia, they are now used in over 30 countries in the world, including our neighbours, New Zealand and Indonesia.
UNCORRECTEDSAMPLEPAGES
Figure 4.27
1. Compare and contrast the terms ‘compound’ and ‘molecule’.
2. Explain why the properties of elements and the compounds made up of those elements are different.
3. Name two examples of compounds that have a molecular structure, two that have a polymer structure and two that have a lattice structure.
symbols for compounds
A chemical formula is a shorthand way of representing the elements that are in a compound. The formula tells you which elements are present in the compound and how many atoms of each element are present in one molecule or one basic unit of that particular compound.
For example:
• Carbon dioxide, found in the air, has the chemical formula CO2. This means that one covalent molecule of the compound carbon dioxide has two elements in it: carbon (C) and oxygen (O). There are one carbon atom and two oxygen atoms.
• Sodium sulfate, found in common detergents, is an ionic compound and has the chemical formula Na2SO4. This means that one basic unit of the compound has three elements in it: sodium (Na), sulfur (S) and oxygen (O). Each basic unit of sodium sulfate contains two atoms of sodium, one atom of sulfur and four atoms of oxygen.
What if the formula has brackets in it? Consider the compound aluminium carbonate. Its formula is Aℓ2(CO3)3. The brackets tell us that there is more than one CO3 unit. In this case, there are three units of CO3. So, from the formula, we can see that there are three elements in each basic unit of this compound: aluminium (Aℓ), carbon (C) and oxygen (O). Each unit of aluminium carbonate is made of two atoms of aluminium, three atoms of carbon and nine atoms of oxygen.
Sodium sulfate is a compound used in common household detergents. Uncorrected 2nd
Figure 4.26 Australian, Indonesian and New Zealand polymer banknotes
Quick check 4.6
Explore! 4.4
3d compounds
Using a molecular modelling kit, construct the following molecular compounds:
1. H2O
2. NH3
What do you notice about the three-dimensional structure? How might you draw these compounds in two dimensions?
UNCORRECTEDSAMPLEPAGES
naming compounds
When naming a compound, there are some general rules to follow depending on whether the compound contains a metal and a non-metal or only non-metals. Note that there are some exceptions to these rules, but the exceptions will be learned in future school years.
Metal and non-metal compounds
1. If there is a metal in the compound, it gets named first. For example, CaCℓ2 is calcium chloride. Calcium is the metal, so it is named first.
2. If the non-metal present is a single element, it will usually be named with a suffix, -ide. Again, consider CaCℓ2. As the non-metal present is only chlorine it will be named second as chloride.
3. When the non-metal component of a metal and non-metal compound contains more than one element, it is called a polyatomic ion, and these usually take a special name. Some common examples include:
• hydroxide ( OH)
• ethanoate (CH3COO )
• nitrate (NO3 )
• carbonate (CO32−)
• sulfate (SO42−)
• phosphate (PO43−)
For example, CaCO3 would be named calcium carbonate.
Non-metal only compounds
1. When a compound contains only non-metals, such as oxygen (O) and chlorine (Cℓ), the start of the second element word changes based on how many atoms there are in the compound. For example, CO2 contains one carbon atom and two oxygen atoms, and so the second word starts with a prefix di- and the compound is called carbon dioxide. Another example would be the compound CO, which would be named carbon monoxide, as the second element starts with the prefix mono-. Table 4.4 summarises the prefixes used, depending on how many atoms of the second element there are in the compound.
2. In some cases, t here is more than one atom of the first non-metal element present, and in these cases the prefix is also used for the first element. For example, H 2O would be named dihydrogen monoxide, although you will be more familiar with its common name, water!
3. If the prefix ends in an ‘a’ and the start of the element name starts with a vowel, the ‘a’ can be dropped from the name. For example, N2O4 would be dinitrogen tetroxide (rather than tetraoxide).
Table 4.4 Prefix used at the start of the second element when naming compounds containing only non-metals
making a compound
Aim
To make a compound from two elements and to practise using elemental symbols and naming compounds
Materials
• strip of magnesium ribbon (approximately 5 cm)
• fine sandpaper
• crucible with lid
• pipeclay triangle
• safety glasses
Method
• tongs
• Bunsen burner and matches
• heatproof mat
• tripod
1. Examine the piece of magnesium and record its properties. If it isn’t shiny and clean, gently use the sandpaper to remove any imperfections from the surface.
2. Coil the ribbon up and place it in the crucible with the lid. Place the crucible on the pipeclay triangle, as shown in Figure 4.28.
3. Put on your safety glasses. Heat the crucible with a blue flame and, every so often, monitor the reaction using the tongs to carefully lift the edge of the crucible lid. Ensure you do not look directly at the reaction.
4. When the reaction has finished, the magnesium ribbon will no longer be recognisable. Turn off the Bunsen burner and let the crucible cool down.
5. Record what you see in the crucible.
Results
Record your observations.
Discussion
1. Magnesium is an element. What is its elemental symbol?
UNCORRECTEDSAMPLEPAGES
Be careful
Do not look directly at the reaction.
The reaction is very bright and can damage your eyes. Wear safety glasses.
2. When magnesium is heated, it reacts with something. What is the other element, and what is its elemental symbol?
3. Describe what you saw in the crucible after heating and decide whether it is an element or a compound. Explain your answer.
4. Work out the chemical formula for this compound and the name of the substance formed in the crucible.
Practical 4.3
Tripod Magnesium ribbon inside Pipeclay triangle
Lid
Crucible
Bunsen burner
Heatproof mat
Figure 4.28 Experimental set-up
Quick check 4.7
1. Complete the following table to identify the elements and number of atoms present in each compound.
CompoundScientific nameFormulaList of elements
Number of atoms of each element
Natural gasMethane CH4 Carbon Hydrogen C 1 H 4
PetrolOctane C8H18
AlcoholEthanol C2H6O
AspirinAcetylsalicylic acidC9H8O4
Eggshells Calcium carbonate CaCO3
2. State the formula for each of the following compounds:
a) hydrochloric acid – contains one atom of hydrogen and one atom of chlorine
b) glucose – a sugar, contains six carbon atoms, 12 hydrogen atoms and six oxygen atoms
c) rust – contains two atoms of iron and three atoms of oxygen
3. Determine the names of the following compounds
a) one carbon atom and four chlorine atoms
b) two hydrogen atoms and one oxygen atom
c) one magnesium atom and one oxygen atom
Practical 4.4
Breaking down a compound
Aim
To investigate the breakdown of copper carbonate Materials
• copper carbonate
• limewater
• straw
• large test tubes ×3
• Bunsen burner
• matches
• heatproof mat
• wooden tongs
• paper towel
• retort stand and clamp
• delivery tube and stopper
• spatula
Be careful Safety glasses must be worn at all times. Wash hands thoroughly at the end of the experiment.
Method
1. Half fill a test tube with limewater. Using the straw, blow into the limewater so it bubbles. Record your observations when CO2 from your breath is bubbled through limewater.
2. Use the diagram in Figure 4.29 as a guide to the steps that follow.
3. Place a small amount of the copper carbonate in a large test tube and fit it with the gas delivery tube and stopper. Clamp the test tube to a retort stand.
4. Record the appearance of the copper carbonate.
5. Half fill another test tube with limewater and place the gas delivery tube in it.
UNCORRECTEDSAMPLEPAGES
6. Using a small blue flame on the Bunsen burner, gently heat the copper carbonate.
7. Observe and record the changes in the copper carbonate and the limewater.
8. Remove the limewater solution before turning off the Bunsen burner.
9. Allow to cool.
Results
Record your observations of the limewater after bubbling, the copper carbonate before heating, and the substance and the limewater after heating.
Discussion
1. What caused the change in the limewater when you blew into it?
2. Describe the copper carbonate before and after heating. Mention the changes you observed in the limewater.
3. What is the evidence that copper carbonate is a compound and not an element?
4. Why is it important to remove the delivery tube from the limewater as soon as heating is stopped?
5. Why do some gas bubbles pass through limewater when heating is first started?
6. Identify any faults in the method for this experiment and how the experiment could be improved if it were to be carried out again.
Bunsen burner
Retort stand
Clamp
Test tube
Copper carbonate
Test tube
Limewater
Delivery tube
Figure 4.29 Experimental set-up
mixtures
A compound or a molecule is not a mixture as the atoms are joined with chemical bonds. A mixture is the name given to a material or substance made up of more than one type of pure substance that are not chemically combined. This means that the components of a mixture can be separated. Some examples of mixtures that you may be familiar with are soft drinks (a mixture of sugar, water, carbon dioxide, flavouring and colouring), a cup of tea (a mixture of tea leaves and water), tap water (a mixture of water, oxygen, carbon dioxide and dissolved ionic compounds) and spaghetti bolognaise (a mixture of tomatoes, beef, garlic and herbs).
Mixtures have different properties from those of compounds, as there is no chemical bond between the parts of a mixture. Table 4.5 summarises the differences between compounds and mixtures.
Figure 4.30 This pizza is an example of a mixture – the components are not chemically combined, and so they can be separated.
Compound
Mixture
Components Contains two or more elementsContains two or more elements or compounds
Bonding between atoms
Properties
UNCORRECTEDSAMPLEPAGES
Separation
Ratio of different atoms
Elements are chemically bonded together
The compound has properties that are different from the properties of the elements it contains
Most compounds can be separated into their elements using chemical decomposition reactions
Elements occur in strict ratios to each other
Table 4.5 The differences between a compound and a mixture
Elements/compounds are not chemically bonded together
Each substance in the mixture keeps its own properties
Each substance can be separated out of the mixture by a physical process
Substances in the mixture can occur in any ratio
WIDGET Elements, compounds and mixtures
homogeneous mixture
a mixture of two or more substances that are evenly distributed and do not separate out easily heterogeneous mixture
a mixture that can be separated into its parts, and the parts retain their original properties; the mixture is not blended evenly colloid
a mixture in which particles of one chemical substance will not dissolve but remain distributed throughout another chemical substance
emulsion a colloid of two or more liquids
suspension a mixture in which one chemical substance will eventually settle out of the solvent
UNCORRECTEDSAMPLEPAGES
Mixtures can be broadly classified into two categories: homogeneous mixtures and heterogeneous mixtures.
Homogeneous mixture
Homogeneous mixtures are those where you cannot tell that two or more substances have been mixed together, as they don’t separate out when left to stand. The components of the mixture are all evenly distributed, so the entire mixture has the same properties. A type of homogeneous mixture where a solute is dissolved in a solvent is called a solution.
A heterogeneous mixture is not blended together evenly and is not the same consistency throughout. So, if you took samples from different parts of the mixture, the samples would contain different amounts of the substances making up the mixture. Heterogeneous mixtures that have components not evenly distributed include colloids, emulsions and suspensions
Figure 4.32 Apple juice is an example of a homogeneous mixture.
Figure 4.33 A lasagna is an example of a heterogeneous mixture.
Figure 4.31 Matter consists of pure substances and mixtures. In this chapter, you have learned about both these groups.
Did you know? 4.4
Crystal growing
Solutions are a fantastic medium to grow crystals of a dissolved solute. Imagine you have a glass of salty water (NaCℓ dissolved in water) and leave the water to slowly evaporate. Eventually, there won’t be enough water to keep all the salt dissolved and some will start to become a solid again. It will often form a crystalline solid called a crystal. If this process happens quickly, such as boiling the water away, the crystals will be small. But if the process happens over a longer period of time, very large crystals can form.
UNCORRECTEDSAMPLEPAGES
When a solution has the maximum amount of solute dissolved, the solution is referred to as saturated. If a saturated solution is heated and cooled very slowly, very large crystals can form! This is what happens when large crystals are formed on rocks in Earth’s crust over millions of years.
symbols for mixtures
Mixtures do not have a chemical formula as the elements are not chemically combined, but rather they are represented by a percentage composition or a ratio of each pure substance. The pure substances in a mixture retain their original chemical formulae.
Did you know? 4.5
Composition of mixtures
The simplest unit of the compound sodium chloride is made up of one Na atom and one Cℓ atom. Thus, its symbol formula is NaCℓ. Similarly, the molecular compound water is made up of two H atoms and one O atom in its simplest formula. Thus, its symbol formula is H2O.
Mixtures of elements or compounds are often represented by the relative percentage or ratio of their mass in the total mass. This is commonly used to describe the composition of colloids and suspensions as well as solutions. For example, a brine solution (NaCℓ dissolved in H2O) could be described as having 25% NaCℓ by mass or even one part NaCℓ to three parts H2O (or 1:3, NaCℓ:H2O). Mixtures are not represented by elemental symbols being combined, such as with compounds, as this would suggest that the elements are chemically combined, but in mixtures they are not.
saturated a solution containing the maximum amount of dissolved solute
Figure 4.34 Blue CuSO4 crystals growing in a saturated homogeneous mixture of CuSO4 and water
Figure 4.35 Large amethyst crystals formed on a rock over millions of years
Figure 4.36 Adding table salt (NaCℓ) to water (H2O) creates a mixture. The two compounds might interact, but they do not chemically combine.
Investigating heat energy from alcohols
Aim
To compare the heat energy produced by burning alcohols that have different numbers of carbon atoms
Planning
1. Write a rationale about carbon-based fuels, the number of carbon atoms in them and how they release energy.
Be careful
To be conducted in a fume hood or well-ventilated area. Wear safety glasses.
2. Write a specific and relevant research question for your investigation.
3. Identify the independent, dependent and controlled variables.
4. Write a risk assessment for this investigation.
Materials
• retort stand and clamp
• 150 mL conical flask
• 100 mL measuring cylinder
• thermometer
• spirit burners containing the following alcohols: –methanol – ethanol – propanol – butanol
• stopwatch
• matches
Method
1. Add 100 mL of water to a conical flask and clamp it at a height where a spirit burner can be placed below.
2. Record the initial temperature of the water in your results table.
3. Light the wick of the spirit burner and let it burn for one minute.
4. Replace the spirit burner cap to extinguish the flame.
5. Record the final temperature of the water in your results table.
6. Repeat stages 1–5 with the other three alcohols.
Results
Thermometer
Clamp
Conical flask
Spirit burner
Alcohol
MethanolCH3OH
EthanolC2H5OH
PropanolC3H7OH
ButanolC4H9OH
Discussion
1. Describe any patterns, trends or relationships in your results.
2. Explain any trends you have identified.
3. Identify any limitations in your investigation.
4. Suggest some improvements for this experiment.
Conclusion
Draw a conclusion from this experiment regarding the effect of the number of carbons in the alcoholic compound on the energy released in burning the alcohol. Use data to support your statement.
Explore! 4.5
Rocket alloys
Spacecraft are incredibly heavy structures that are launched into space. In order to reduce the energy required to launch a spacecraft, mixtures of metal elements, called alloys, are used to allow engineers to create superstrong materials that are also lightweight. For example, in SpaceX’s Falcon 9 spacecraft, an aluminium–lithium alloy is used in the structure, rather than a pure metal, which might be heavier and less strong.
Use the internet to identify five more alloys that are used in the real world. What are their properties and what are they used for?
Figure 4.37 SpaceX’s Falcon 9 spacecraft is constructed using a mixture of metals.
Go online to access the
Bioplastics
For over 100 years, humans have been developing plastic products for use in a variety of circumstances, including food packaging, electronics and other consumer products. However, when these materials are disposed of in landfill, they take thousands to millions of years to degrade to natural products! This issue sparked the Western Australian Government to ban the supply of single-use plastic food packaging, straws and cutlery in 2022, and in 2023 the ban was expanded to include polymer cups and trays for meat and seafood, and some plastics from personal care products, such as cotton buds.
Figure 4.38 Cotton buds with plastics stems are banned from supply as of 2023, to promote the production of biodegradable alternatives.
Single-use plastics can be replaced with much more environmentally friendly biodegradable or biobased products, which degrade when placed in soil or landfill. Biodegradable products can be broken down in the soil to produce biomass, carbon dioxide and water, while biobased materials are sourced from biomass, which naturally decays when placed in the earth.
By placing bans on plastic products, the Western Australian Government is making an informed decision to promote biodegradable and environmentally friendly alternatives.
Section 4.3 review
Online quiz
review and more! Section questions Teachers can assign tasks and track results
Section 4.3 questions
Remembering
1. Read each of the following statements and state whether it applies to compounds or mixtures.
a) The substances in it are not chemically bonded.
b) The substances in it are chemically bonded.
c) Each substance keeps its own properties.
d) Its properties are not the same as the properties of the elements that make it up.
UNCORRECTEDSAMPLEPAGES
e) The substances can be separated by chemical means only.
f) The substances can be separated by physical methods.
2. State the formula for the following compounds:
a) marble, which contains one calcium atom, one carbon atom and three oxygen atoms
b) propane, which contains three carbon atoms and eight hydrogen atoms
c) sucrose, which contains 12 carbon atoms, 22 hydrogen atoms and 11 oxygen atoms
3. Identify the names of the following compounds:
a) sand, which contains one silicon atom and two oxygen atoms
b) Epsom salts, which contain one magnesium atom, one sulfur atom and four oxygen atoms
c) one phosphorus atom and three chlorine atoms
Understanding
4. Describe the following key terms, related to the organisation of compounds: molecule, polymer, lattice.
Applying
5. Compare a heterogeneous mixture with a homogeneous mixture.
Analysing
6. A tiny sample of quartz contains 1 000 000 atoms of silicon and 2 000 000 atoms of oxygen. Determine what the formula would be, based on this information.
7. Substances A, B and C were tested and were found to have the following chemical compositions:
A: 70% oxygen, 30% carbon
B: 60% hydrogen, 40% carbon
C: 60% oxygen, 40% carbon
Deduce if any two of these substances are the same compound. Give reasons for your answer.
Evaluating
8. Determine the correct answers to complete the following table.
9. Use the information you provided in your answer to the previous question to answer the following questions.
a) Describe the difference between nitrogen monoxide and dinitrogen monoxide.
b) Deduce which is bigger: a molecule of sulfuric acid or a molecule of carbon monoxide. Explain.
c) State the ways dinitrogen monoxide and water are similar.
Go online to access the interactive chapter review
Chapter review
Chapter checklist
Success criteria
UNCORRECTED
Linked questions
4.1 I can define the following key terms: atom, molecule, element, pure substance, compound, mixture. 1, 4, 7, 9
4.1 I can distinguish between metals, non-metals and metalloids. 10
4.1 I can create a timeline of the development of the term ‘element’. 3
4.2 I can describe how Mendeleev organised elements in his first periodic table. 12
4.2 I can describe monatomic, diatomic, molecular and lattice structures. 11
4.3 I can recall some rules that are required when naming compounds. 13, 14
4.3 I can distinguish between homogeneous and heterogeneous mixtures. 8
4.3 I can explain why mixtures are represented by percentages or ratios and not chemical formulae. 16
Scorcher competition
Review questions
Remembering
Review questions
Data questions
1. Identify the difference between a compound and an element.
2. Identify the correct symbol for each element name.
3. List the key scientists and philosophers who contributed to the modern knowledge of the elements.
4. Identify the correct word to complete the blanks in the following sentences.
a) Elements are pure substances containing only one kind of _____________.
b) All known elements are listed and classified in the _____________.
c) In compounds, the atoms are _____________ combined using bonds.
d) The properties of a compound are usually _____________ to the properties of the elements it contains.
e) Mixtures contain two or more _____________ or _____________ that are not chemically combined.
f) Mixtures can be uniform (called _____________).
SAMPLEPAGES
g) Mixtures can also be non-uniform (called _____________).
h) The properties of a mixture are _____________ to the properties of its components.
Understanding
5. Explain, using examples, how the properties of an element relate to its use.
6. Explain why carbon dioxide does not appear in the periodic table.
Applying
7. Summarise the arrangement of atoms in an element, a compound and a mixture.
8. Distinguish between a homogeneous mixture, a heterogeneous mixture and a chemical compound.
Analysing
9. Classify each of the following substances as an element, a compound, a mixture of elements, a mixture of compounds, or a mixture of elements and compounds. Some of the substances are named, and some are provided as diagrams.
a Chicken soup b Bismuth (Bi)
c Dry ice (CO2) d Concrete
e f g h i j
UNCORRECTEDSAMPLEPAGES
10. Compare the properties of metals and non-metals.
11. Sodium chloride (NaCℓ) has a lattice arrangement of atoms, whereas oxygen gas (O2) is a diatomic molecule. Describe the difference between these structures.
Evaluating
12. Describe how Mendeleev’s first periodic table provided a scaffold for the development of the modern periodic table used today.
13. Methane (natural gas), hexane (solvent in glue for shoes) and octane (petrol) are substances that contain only carbon and hydrogen. Deduce why they are all so different.
14. Determine the correct answers to complete the following table.
15. We can use the letters of the alphabet to make up words, sentences, paragraphs and more. Using this analogy, what would best represent compounds, mixtures and elements –letters, words or paragraphs? Justify your answers.
16. Propose why elements and compounds can be represented by chemical formulae, but mixtures are represented by percentages or ratios.
Data questions
Refer to the melting points and boiling points for various elements shown in Table 4.6 and Figure 4.39.
UNCORRECTEDSAMPLEPAGES
Table 4.6 Classification, and melting and boiling point of various elements
UNCORRECTEDSAMPLEPAGES
1. Calculate the difference in temperature between the melting and boiling point of elemental mercury.
2. Identify the element with the lowest melting point.
3. Identify which elements in Table 4.6 are classified as halogens.
4. Contrast the general melting point of the noble gases and the metals in Table 4.6.
5. Identify the element for which the data does not match that of similarly classified elements.
6. Categorise the halogen elements as either ‘gas at 25°C’ or ‘not gas at 25°C’.
7. Compare the temperature range for which each metal is present in the liquid state.
8. Given the data in Table 4.6, deduce whether the noble gases can exist in the liquid state.
9. Argon is another noble gas element. Predict whether the boiling point of elemental argon is closer to 3000°C, 100°C or −150°C.
Figure 4.39 States of various elements at different temperatures
stem activity: Prosthesis design
Background information
Your skeleton protects your organs and gives your body shape and structure. Your skeleton is necessary for you to move, make blood cells, store calcium and more. You would look very different without it. For various reasons, not everyone has all the bones that complete their skeleton. Biomedical engineers can help in this area. They combine engineering principles and problem-solving strategies to medicine for healthcare purposes. In this case, a biomedical engineer would study the strength and durability of bones so that they can replicate them to make prostheses (artificial devices that replace body parts). Of course, there are criteria and constraints that a biomedical engineer needs to think about when designing, for example, a prosthetic leg. Consider what would be some important features of a good prosthetic leg.
Biomedical engineers design new ways to create prosthetic legs that have all the characteristics you have thought of, but most importantly, biomedical engineers must carefully select the right materials for the project. Whenever something is made by engineers, they must consider both the chemical and physical properties of the materials they use – their choices are key to biomedical technologies.
DESIGN BRIEF
Construct a lower-leg prosthesis that can assist in movement.
Activity instructions
In teams, you will become a biomedical engineer and investigate the technology of prosthetics. First, list the characteristics and features that are important for a prosthetic leg, then design your prototype using various ordinary materials that you have selected on the basis of their physical properties, before creating a lower-leg prosthetic prototype. Your team will then demonstrate your prosthetic’s strength, analyse your prototype and make suggestions for design improvements.
SAMPLEPAGES
Figure 4.40 An artificial lower leg
Suggested materials
• ruler or tape measure
• scissors
• prosthetic structural materials from home, e.g. cardboard tubes, sponges, pants, shoes, rope
• roll of duct tape
Research and feasibility
1. Conduct research to find out what types of materials are used to manufacture prostheses, the physical properties of the materials, and design considerations of the prosthesis.
2. Consider important design factors for the prosthesis, including aesthetics, cost and customisation of the prosthesis. Use a table to rank important considerations of the prosthesis. You can also add other design considerations.
Design considerationWhy this is important?Rank of importance
Aesthetics (how it looks)
Cost of materials
Customisation of the prosthesis
Useability (how easy it is to use)
Design
3. Design a lower leg prosthesis and label all the design features. Consider the types of materials you have available, how they will be used in construction and the durability of these materials compared to the materials used in manufacturing. Also, ensure your design is practical and considers how the prosthesis would be attached to the limb and how it allows ankle movement.
Create
4. Construct the lower leg prosthesis you have designed using the materials available.
Evaluate and modify
5. Create a reflection chart containing positives, negatives and interesting observations, and evaluate your constructed lower leg prosthesis prototype. Make sure you reflect on the strength, durability, useability and comfort of the prototype.
e.g. Ankle movement is realistic and the ankle has a 60° range.
e.g. Cardboard tubing used was not strong and broke when tested.
UNCORRECTEDSAMPLEPAGES
e.g. The foam used around the tubing was a strong support for the tubing.
6. Explain the improvements and modifications you would make to the prototype in a presentation to the class.
Figure 4.41 An artificial limb restores functionality and independence.
Chapter 5 Physical and chemical change
Introduction
When different particles collide under specific conditions, new substances can form in a chemical reaction. There are observations that can be made to indicate a chemical change has occurred and most of these are quite different to the indicators of physical change. One indicator of chemical change could be a temperature change, and you will explore how temperature indicates that either an exothermic or endothermic chemical reaction has occurred. A combustion reaction is a very common exothermic reaction from which the heat released can be harnessed as energy for a variety of applications.
Physical change (often reversible)
Evidence
Chapter map
Substances can change
Section 5.1
Section 5.2
Section 5.3
Chemical change (often irreversible)
Evidence
• Shape
• State
• Dissolving
• Mixing Combustion
Involves the loss of energy to surroundings or gain of energy from surroundings
• Colour change
• Gas formation
• Precipitate
• Light or sound
Exothermic reactions (loss of energy)
Endothermic reactions (gain of energy)
UNCORRECTEDSAMPLEPAGES
Curriculum
Chemical sciences
Changes to substances can be classified as physical or chemical; chemical changes involve the formation of new substances.
• identifying physical changes, such as changing state, dissolving, mixtures, tearing paper, chopping wood
• indicators of chemical changes, such as colour change, temperature change, formation of a precipitate, gas, odour, light
At the end of this section, I will be able to: 1. Describe the common evidence of physical change.
evidence of physical change
During a physical change, the characteristics of a substance, or its physical properties, change in some way, but no new chemical substance is formed. Examples of physical properties are texture, shape, size, colour, odour, volume, mass and density.
Evidence of a physical change can be any one or more of the following:
• a change in shape
• expansion or contraction
• a change in state
• mixing or dissolving
• a non-permanent colour change.
Changing shape
When an object changes shape, it is generally a physical change. For example, when an elastic band is stretched, the physical properties of the elastic band change but its chemical structure does not; no new chemical substance has formed. Think about a soft drink can being crushed. Have its physical properties changed? Has its chemical structure changed? Has anything new been made? So, is it a physical change?
physical change when the physical properties of a substance change in some way, but no new chemical substance is formed; usually reversible
Figure 5.1 Different types of evidence that a physical change has occurred: change in shape (a), expansion or contraction (b), change in state (c), or mixing (d)
Figure 5.2
5.3 An example of a physical change is when glass breaks: its physical characteristics change, but it is still glass.
Quick check 5.1
1. Define the term ‘physical change’.
2. Name four pieces of evidence to look for when determining whether a physical change has occurred.
3. Explain how changing shape is an example of physical change.
Expansion and contraction
Particles expand or contract when exposed to changing temperatures. As the particles in a solid, liquid or gas are exposed to a higher temperature, they absorb some of the energy and convert it to kinetic energy. The particles move more rapidly and this causes the particles to move apart. This is called expansion. Expansion is an example of physical change as the properties of the chemical substance have changed (volume increases and density decreases), but no new chemical substance has formed, and it is reversible. Hot-air balloons and thermometers are two examples of where we can see evidence of the physical change, expansion.
UNCORRECTEDSAMPLEPAGES
The reverse of expansion is contraction, and this is also evidence of a physical change occurring. The substance cools down, the particles lose energy, they move less rapidly, and the distance between the particles gets smaller (volume decreases and density increases).
5.4 When the air inside a hot-air balloon is heated, the atoms in the heated air gain energy, move faster and move away from one another, therefore taking up more space. This is an example of a physical change occurring and it results in the air being less dense on the inside of the balloon, so the balloon rises.
Increasing temperature
Decreasing temperature
Contraction
Expansion
Figure 5.5 The physical changes experienced by atoms during expansion and contraction
Figure
Figure
Making a model thermometer
Aim
To demonstrate expansion and contraction by making a model thermometer
Materials
• 250 mL conical flask
• glass thermometer
• clear plastic straw or clear narrow plastic tubing
• ice-cream container
• red food colouring
• kettle or hotplate
Method
1. Half fill the conical flask with water.
2. Add a drop or two of food colouring.
UNCORRECTEDSAMPLEPAGES
• 250 mL beaker
• permanent marker
• modelling clay (or Blu Tack®)
• water
• ice
3. Place the straw in the flask, but do not let it touch the bottom. Use the clay to seal the edges of the flask’s top with the straw in the middle. The clay will hold the straw in place and prevent it from touching the bottom of the flask.
4. On the side of the flask, use a permanent marker to mark the height of the liquid inside the straw (your thermometer) at room temperature. Record the temperature of the room using the glass thermometer
5. Place the flask into an ice cream container with ice and allow to cool. Record the temperature inside the ice cream container using your glass thermometer and mark the side of the flask to document where the liquid level is.
6. Now heat up some water on the hotplate and add to the ice cream container. Let the flask sit there for several minutes. Record the new temperature using the glass thermometer and mark the side of the flask to document where the liquid level is.
7. Make a scale on your model thermometer, using the temperatures you have recorded and the marks you have made on the flask.
8. Now test your model thermometer by using it to predict the temperature of different environments, such as a sunny spot in the school or when you change the ratio of hot and cold water in the ice cream container. Check your predictions with the glass thermometer.
Results
Record your observations and tabulate your results: the temperature of each environment and the height of the fluid in the straw.
Discussion
1. Compare your model thermometer results with the actual glass thermometer results. How close are they?
2. Explain your results. Why did the fluid move up/down the straw? Use your knowledge of the particle theory and physical change to aid in your explanation.
3. Imagine you repeated your experiment but with a narrower straw. How would you expect the measurements to be different for a narrower straw? Explain whether this new thermometer would be likely to be more or less accurate than your first thermometer.
4. Outline possible faults in this experiment and explain how each could have affected your results.
5. Suggest improvements for this experiment if you were to carry it out again.
Changing state
If the temperature change is large enough, particles can move beyond expansion and contraction and change into another state. You learned about these states in year 7, and they are solids, liquids and gases. If the heat energy is sufficient, particles in a solid can gain enough kinetic energy to move them apart into a liquid state, or even a gaseous state. In contrast, if heat energy is removed, gaseous particles can move closer together to form a liquid or a solid. The different changes of state are summarised in Figure 5.6 below.
UNCORRECTEDSAMPLEPAGES
Figure 5.6 When some substances gain or lose heat, they undergo a physical change: no new substance is produced and the substance changes its physical properties but is still the same substance.
Figure 5.7 A snowman melting is an example of physical change. Can you explain why?
Figure 5.8 Condensation is an example of a physical change, as no new substance has formed; it is reversible and it is only the physical properties of the water that have altered, not its chemical make-up.
Did you know? 5.1
Physical changes formed the stirling Ranges
The Stirling Ranges in the south-west of Western Australia are a picturesque example of physical changes occurring over a very long period of time. The ranges contain rocks that have undergone many physical changes over millions of years due to temperature and pressure changes deep within Earth. The shapes of the rocks have undergone weathering and erosion, a physical change, due to wind and rain over millennia.
UNCORRECTEDSAMPLEPAGES
Mixing and dissolving
When substances are mixed or one dissolved in another, a physical change occurs. For example, a solute (e.g. sugar) dissolves in a solvent (e.g. water) to form a solution. The solute does not evenly distribute itself in the solvent immediately. The particles, in this case sugar, spread out in the water from an area of high concentration of sugar to an area of low concentration, until there is an even distribution of sugar throughout the water. This process is called diffusion. When the sugar is evenly spread out in the water, there are still the chemical substances of sugar and water, but they are now mixed with each other. The characteristics of the sugar have changed from a crystalline, solid structure to one where all the sugar molecules can move around freely in the water. No new chemical substance has been formed, and the process is reversible if you evaporate the water. This is why mixing and dissolving are considered evidence of physical change.
dissolve the process by which individual molecules of a solute are separated from one another and surrounded by solvent molecules, causing them to no longer be visible in a solution diffusion the passive movement of particles from an area of high concentration to low concentration
Figure 5.9 Millions of years of physical changes have formed the Stirling Ranges in Western Australia.
Quick check 5.2
1. Explain how expansion and contraction are examples of physical change.
2. Explain how changing state is an example of physical change.
Figure 5.10 Molecules of water (blue) move randomly
Making thinking visible 5.1
see, think, wonder: Diffusion
1. Observe a tea bag being added to some hot water.
2. What do you think is happening to the particles to cause the change in appearance? How long does the change take to complete?
3. What questions do you have about the physical change taking place?
The See, think, wonder thinking routine was developed by Project Zero, a research centre at the Harvard Graduate School of Education.
Quick check 5.3
1. Explain how mixing and dissolving are examples of physical change.
2. Identify which of the following are physical changes.
a) slicing bread
b) turning on a light
c) breaking an egg
d) mowing grass
e) setting off fireworks
f) breaking glass
g) freezing water
h) cutting hair
i) making a fire
j) drying clothes
k) burning toast
l) melting chocolate
m) colouring hair
n) yoghurt going past its use-by date
o) popping popcorn
p) squeezing an orange
Try this 5.1
Modelling physical changes
SAMPLEPAGES
Using software of your choice, create a model to help your classmates visualise one of the following physical changes:
• changing shape
• changing state
• dissolving and diffusion.
Present your visual model to the class to aid their understanding of the physical change.
Figure 5.11 A tea bag in hot water can demonstrate diffusion.
Section 5.1 questions
Online quiz Section questions
Section 5.1
questions
Remembering
Teachers can assign tasks and track results
Go online to access the interactive section review and more!
UNCORRECTEDSAMPLEPAGES
1. Identify which of the following are examples of physical properties.
a) blue colour
b) odour
c) density
d) sweet taste
e) flammable
f) reacts with air
g) reacts with water
h) boiling point
i) hardness
j) dissolves in water
k) lustre
l) volume
2. Identify which of the following are physical changes.
a) cutting an apple
b) milk going past its use-by date
c) digesting food
d) ice melting
e) cooking pikelets
f) wood rotting
g) reacting with vinegar
h) inflating a bike tyre
i) grass growing
j) silver tarnishing
k) mopping up water
l) Milo® dissolving in milk
3. Define the following terms: reversible, expansion, contraction, melting, freezing, evaporation, condensation, dissolving, diffusion.
Understanding
4. State if each of the following statements is true or false. Then, rewrite the false statements so that they are true.
a) During a physical change, the chemical make-up of the substance also changes.
b) Melting is a physical change.
c) As particles warm up, expansion can occur, so this is a physical change.
d) Physical changes are never reversible.
e) When heat is lost from a substance, the particles can move closer together, and a gas can change to a liquid.
f) Cutting up a cake changes the shape and size of the cake, so this is a physical change.
g) Burning wood in a fire forms charcoal and ash, so this is a physical change.
h) When a solute dissolves in a solvent, nothing new is formed, so this is a physical change.
5. Identify five physical changes that happen in your home.
6. State the name of the process whereby a strong-smelling deodorant is sprayed in one corner of the room but eventually everyone in the room can smell it.
Applying
7. Summarise the following physical changes, using your knowledge of how particles behave.
a) why the tyres on your family car seem more deflated on a cold day
b) how the liquid in a glass thermometer works
c) why, on extremely hot days, there are concerns about train tracks not working well
Analysing
8. Consider how you could reverse the following physical changes.
a) salt dissolving in water
b) inflating a balloon
c) ice melting
d) glass breaking
Evaluating
9. Justify why each of the following is an example of a physical change.
a) blow-drying your dog’s coat after giving him a bath
b) making cordial from a concentrate and water
c) your camping airbed getting tight and ready to pop after lying in the sun
d) crushing cereal boxes before putting them out for recycling
5.2 Chemical change
Learning goal
At the end of this section, I will be able to:
1. Describe the common evidence of chemical change.
evidence of chemical change
During a chemical change, a new chemical substance is formed. This new chemical substance could be a solid, a liquid or a gas. The following list describes some examples of when a chemical change has occurred:
• a permanent colour change
• a gas being given off; effervescence (as an odour or bubbles)
• a solid (called a precipitate) forming in a solution
• a change in temperature (increase or decrease)
• energy in the form of light or sound being produced (e.g. an explosion).
Did
you know? 5.2
Western australia’s wheat crops
Wheat crop harvesting is an important industry in Western Australia. The physical and chemical properties of the plantation are considered when the time comes to harvest. The physical properties of the plants, such as size, shape and density, will contribute to how effectively the plants can be harvested and processed, while the chemical properties, such as the pH levels of the soil and water, as well as of the plant itself, will impact the quantity of wheat grains in each plant.
Thus, farmers working on wheat crop plantations must monitor both the physical and chemical properties of their crop to ensure the highest quality harvest.
UNCORRECTEDSAMPLEPAGES
1. On a chemical level, identify what has happened when a chemical change has occurred.
2. List the five pieces of evidence to look for, to determine whether a chemical change has occurred.
3. Identify the evidence that a chemical change has occurred in each of these situations.
a) leaves turning red in the autumn
b) sherbet fizzing in your mouth
Uncorrected 2nd sample
c) bread baking in the oven
Figure 5.12 This brown-coloured rust on the ship, Cheynes III, is an example of a chemical change. This shipwreck is off the coast of Albany.
Figure 5.13 Wheat crop ready for harvest
corrosion the gradual and natural process of metals reacting with oxygen to form a new chemical substance; an example is rusting galvanisation the process of coating iron or steel in zinc to prevent corrosion
A campfire burning is an example of chemical change; light, heat and gas are produced and the burning wood permanently changes colour. Aboriginal and Torres Strait Islander Peoples have been using fire to cook meat and bush bread for thousands of years. Cooking is also a chemical reaction that provides evidence of chemical change. Think about how your favourite meal changes pre- and post-cooking. Is there evidence of chemical change?
Colour change
A permanent colour change is evidence that a chemical reaction has occurred, as the new chemical substance formed has a different colour to the reactants that made it. Cooking is an example in which colour changes frequently occur. Consider what happens to a marshmallow when it is held over a fire or when a piece of bread is put in the toaster.
The ripening of fruit and vegetables is another example of a colour change indicating that a chemical change has occurred. For example, when a banana reaches the green stage of its development, it starts to produce ethene gas. The ethene then interacts with enzymes in the banana to start the ripening process, which involves chemical reactions. The evidence of this chemical change is the banana changing from green to yellow to brown.
5.14 An Aboriginal person prepares bush bread, a food made from finely ground native seeds and cooked over hot coals on Country near Broome, WA. Aboriginal and Torres Strait Islander Peoples were the world’s first bakers, farming, harvesting and processing grains tens of thousands of years before other civilisations. This sophisticated knowledge of native plants and sustainable land management has been passed down through generations, ensuring food security and cultural continuity for millennia.
Rusting, a type of corrosion, is a slow and usually unwanted chemical change that causes iron and steel to go flaky and brown. This is not desirable in construction when building bridges and train tracks, which are made of iron and steel. Rusting occurs when iron reacts with the oxygen in the air to form iron(III) oxide, also known as ‘rust’. This is a new chemical substance forming, and the change in colour is evidence of a chemical change.
The word equation for the process of rusting is:
UNCORRECTEDSAMPLEPAGES
Given the widespread use of iron and steel, we need ways to prevent rusting. The equation shows that there are two chemical substances that react together to form one new chemical substance. If iron and steel are not exposed to oxygen, then iron(III) oxide cannot be made and rusting does not occur. There are some methods of stopping the contact of oxygen with iron:
• A surface protector can be painted onto the iron or steel surface. This is like the paint we put on cars to prevent the metal panels being exposed.
• Galvanisation is a process in which the iron or steel is coated in a layer of zinc. If a corrugated iron roof has been galvanised, the zinc coating will corrode before the iron, and so the iron is protected from rusting. Uncorrected 2nd sample
Figure
Figure 5.15 Bananas ripening and changing colour are evidence that a chemical change has occurred.
VIDEO
Evidence of chemical reactions
iron + oxygen → iron(III) oxide
UNCORRECTEDSAMPLEPAGES
To rust or not to rust
Aim
To determine the conditions required for the chemical change of rusting
Planning
1. Write a rationale about rusting and the factors that affect it.
2. Consider what you learned earlier in the chapter and in your rationale about the conditions that are required for the chemical change of rusting.
3. Design an experiment that will demonstrate that the conditions you believe to be required for rusting are essential, using iron nails, oil (to prevent air getting access to water or iron nails), stoppers and test tubes. Think about your independent, dependent and controlled variables as you plan. You will need to leave your experiment overnight.
4. Write a specific and relevant research question for your investigation.
5. Identify the independent, dependent and controlled variables.
6. Write a hypothesis for your investigation.
7. Write a risk assessment for your investigation.
8. Draw a diagram of your method, showing what will be added to each test tube.
9. Check your design with your teacher before starting your experiment.
Materials
• iron nails
• sandpaper
• large glass test tubes with stoppers • vegetable oil • water
Results
1. Draw a results table for your experiment.
2. Produce a suitable graph for your experiment.
Discussion
1. Describe any patterns, trends or relationships in your results.
2. Define the terms ‘chemical change’ and ‘rusting’. List any chemical changes you see in this experiment.
3. Write a word equation for the reaction that occurs when rust is produced.
4. Identify any limitations in your investigation.
5. Propose another independent variable that could have been tested, to expand on your results.
6. Suggest some improvements for this experiment.
7. For a super challenge, how can you make the iron nail rust faster? You may like to use salt water, vinegar and soft drinks in your experiment.
Conclusion
Draw a conclusion from this experiment regarding the conditions required for rusting, using data to support your statement.
Figure 5.16 Iron metal corrodes to form brown iron oxide after years of exposure to oxygen and water.
Figure 5.17 A galvanised corrugated-iron roof: the zinc coating will corrode before the iron underneath, preventing rusting of the iron.
Gas is formed
In some chemical reactions, the new chemical substance formed is in a gaseous state. These gases can be useful, particularly in cooking when we want a cake to rise. This occurs because gases are formed and inflate the cake mix or dough.
Another example is when bread is made using microorganisms called yeast. The yeast uses the starch and sugars in the flour to produce alcohol and carbon dioxide. The alcohol escapes during cooking, but the carbon dioxide expands inside the dough, creating bubbles of gas and making the bread rise.
Rotting fruits often produce gas, and again, this is evidence that a chemical change is occurring. For example, vegetable scraps in the compost bin are broken down by microorganisms in a process called decomposition, and this produces carbon dioxide gas.
Thermal decomposition
Many metal carbonates can be involved in thermal decomposition reactions. For example, copper(II) carbonate breaks down easily when it is heated:
Word equation: copper(II) carbonate → copper(II) oxide + carbon dioxide
Chemical equation: CuCO3 → CuO + CO2
Your teacher may demonstrate this. Wearing safety glasses, add two spatulas of copper(II) carbonate to a test tube. Then, using tongs, gently heat the base of the test tube. Make sure the mouth of the test tube is pointing towards a wall. You may like to hold a flame or a lit match over the mouth of the test tube. What do you observe? What evidence is there of a chemical change? What happened to the flame? What gas was produced?
Calcium carbonate (CaCO3) behaves in the same way. Can you write both a word equation and a chemical equation for its thermal decomposition?
Precipitate is formed
The formation of a solid, or precipitate, from a solution is an indicator of chemical change. The precipitate is unable to dissolve in water and so, when it forms, it makes the solution look cloudy before it settles on the bottom.
5.19 Pale brown iron(III) carbonate precipitating from a chemical reaction
Quick check 5.5
1. Name three examples where a colour change indicates that a chemical change has occurred.
2. Recall the word equation that represents the process of rusting.
3. List two examples for which a gas being formed provides evidence of chemical change. In each case, explain the chemical reaction.
4. Define the term ‘precipitate’.
Figure 5.18 Croissants are a delicious result of chemical change.
Figure
VIDEO Airbags
Change in temperature
A chemical reaction produces a new chemical substance, however, in every chemical reaction there will always be a change in temperature, even if it is by less than 1°C. Every chemical reaction either releases energy as heat or absorbs energy from the surroundings as heat. For example, when you have started a campfire and the fire burns, you will feel heat radiating from the fire. The chemical reaction that is occurring is:
In this case, heat is released as part of the chemical change, and the surrounding temperature increases.
But the opposite can also happen; heat energy can be absorbed, and the temperature decreases. Chemical ice packs are a common example of this. If you injure yourself, you may be offered an ice pack. You pop a bubble inside the pack and the pack starts to absorb heat from the surrounding environment, making the pack feel cold. You will investigate chemical processes that produce heat energy and absorb heat energy in section 5.3.
Light or sound produced
5.20 When natural gas burns on a stove top, a lot of heat energy is released, and we use this heat to cook our food.
Light and sound can be evidence that a chemical change has taken place. Fire is a great example. Fire releases light energy and is always an indicator of a chemical change. Consider fireworks that release light and sound; could this be a chemical change? What other examples can you think of when light or sound are emitted as evidence of a chemical change?
australia’s glow worms
A chemical reaction occurs in the abdomens of glow worms, allowing them to produce light! This process is called bioluminescence and is shared by many other organisms, mostly sea-dwelling or marine organisms. (Note that bioluminescence is a type of chemiluminescence).
When oxygen combines with the chemical luciferin, and a bioluminescent enzyme is also present, light is produced. When oxygen is available, the glow worm’s light organ glows, and when it is not available, the light goes out. The glow worm can control the beginning and end of the chemical reaction, and thus start and stop the production of light. However, the glow worm has limited control over how much oxygen can enter its light organ. Unlike a light bulb, which gets hot when it produces light, a glow worm’s light is cold light, and so very little energy is lost as heat. This is very lucky for the glow worm because it would not survive getting as hot as a light bulb!
UNCORRECTEDSAMPLEPAGES
bioluminescence
a chemical reaction that produces light in living things
chemiluminescence a chemical reaction that produces light
Figure
Figure 5.21 The abdomen of a glow worm produces light through a chemical reaction known as bioluminescence.
Explore! 5.1
Rapid antigen tests (RaTs)
The rapid antigen test (RAT) is commonly used for the detection of some types of virus particles, such as flu viruses and coronaviruses, and it is likely that you have used one of these at home.
This test uses antibodies to chemically react with the antigen (proteins on the virus particle), and if this chemical reaction occurs, a new antigen-antibody product is formed. This new product then reacts with enzymes that cause a colour change. This colour change is observed as a line on the RAT, confirming that the virus particle is present.
If a virus particle isn’t present, the chemical reactions won’t occur, and no colour change will be observed.
Use the internet to explore what other viruses RATs are currently being used to detect.
UNCORRECTEDSAMPLEPAGES
1. List some examples of when a change in temperature provides evidence of chemical change.
2. List some examples of when light or sound being produced provides evidence of chemical change.
Figure 5.22
Rapid antigen tests work because chemical reactions occur.
Quick check 5.6
Chemical change
Aim
To conduct a series of activities/experiments in order to explore chemical change and be able to identify the evidence of change
Materials
• Bunsen burner
• matches
• wooden skewer
• strontium chloride solution
• copper(II) sulfate solution
• ammonium hydroxide solution
• test tubes and test-tube rack
Method
Copy the results table.
Activity 1
1. Light the Bunsen burner.
2. Take a wooden skewer and break it in half.
Be careful
Wear personal protective equipment. Collected and dispose of all waste appropriately.
• 2 cm strip of magnesium ribbon
• 1 mol/L hydrochloric acid
• thermometer
• 100 mL glass beaker
• lemon juice
• baking soda
• Pasteur pipette
UNCORRECTEDSAMPLEPAGES
3. Dip the broken-off end of the skewer into the strontium chloride solution.
4. Place the wet end of the skewer into the flame.
5. Record your observations for Activity 1 in your results table and tick which of the pieces of evidence show that a chemical change has occurred.
6. Repeat the above steps with the copper(II) sulfate solution.
Activity 2
1. Place three full Pasteur pipette volumes of ammonium hydroxide into a test tube in a rack.
2. Add the copper(II) sulfate solution, drop by drop, no more than 10 drops, into the ammonium hydroxide.
3. Record your observations for Activity 2 in your results table and tick which of the pieces of evidence show that a chemical change has occurred.
Activity 3
1. Place a 2 cm strip of magnesium ribbon into a test tube in a rack.
2. Gently stand a thermometer in the same test tube.
3. Add approximately 2 cm of dilute hydrochloric acid to the test tube.
4. Record your observations for Activity 3 in your results table and tick which of the pieces of evidence show that a chemical change has occurred.
Activity 4
1. Put approximately 40 mL of lemon juice in a 100 mL glass beaker.
2. Gently stand a thermometer in the beaker.
3. Add 1 teaspoon of baking soda to the lemon juice.
4. Record your observations for Activity 4 in your results table and tick which of the pieces of evidence show that a chemical change has occurred.
continued …
1. Define ‘chemical change’.
2. Outline the different pieces of evidence that a chemical change has occurred and provide an example from your activities.
3. Were there any pieces of evidence that were not demonstrated during these activities? Write an activity that would allow you to demonstrate this piece of evidence of chemical change. You may need to do some online research first.
Did you know? 5.4
Digestion is all about change
Thousands of physical and chemical changes take place during the digestion of your food … yes, thousands!
Part of the body Type of change
Details
MouthPhysicalFood is chewed by teeth to break it down into smaller pieces so that enzymes have a greater surface area to work on.
ChemicalAn enzyme in saliva (called amylase) starts to break down complex carbohydrates into simpler forms that your body can absorb.
OesophagusPhysicalAs the oesophagus moves food from the mouth to the stomach, the muscles contract, pushing the food along, in a process called peristalsis.
StomachPhysicalThe stomach muscles contract and churn the food to break it into smaller pieces so that enzymes have a greater surface area to work on.
ChemicalEnzymes start to break down proteins. Hydrochloric acid provides the optimum conditions for this to occur.
Small intestine Physical As the small intestine moves food along towards the large intestine, the muscles contract the food to help break it down further. Bile emulsifies fats into smaller droplets so that enzymes have a greater surface area to work on.
ChemicalEnzymes break down proteins and fats even further, so they can be absorbed into your bloodstream through the walls of the intestine.
Table 5.1 Some of the many physical and chemical changes that occur in the digestive system
The digestive system uses physical changes and chemical changes to break down your food for absorption.
The detection of doping in sport
The fairness of professional sport is of utmost importance for the integrity of many sporting codes and competitions worldwide. In Australia, the Australian Government founded the Australian Sports Anti-Doping Authority (ASADA) in 2006, to protect Australia’s sporting integrity and eliminate doping. Doping is the act of giving a person or animal drugs in order to make them perform better or worse in a competition.
ASADA uses a variety of chemical tests on athletes to detect the use of recreational or performance-enhancing drugs. These tests work by using chemical reactions to identify specific chemicals, such as enzymes and proteins, or to prepare a sample for further testing.
This type of testing is becoming more and more commonplace at professional Australian sporting events and is prominent in ensuring that Australian athletes and sporting competitions are fair.
UNCORRECTEDSAMPLEPAGES
Figure 5.23
Figure 5.24 ASADA officers are present
Practical 5.4: Teacher demonstration
elephant’s toothpaste
Aim
To observe the evidence that shows the decomposition of hydrogen peroxide is a chemical reaction
Materials
• 300 mL conical flask
• 6% hydrogen peroxide solution
• 7 g packet of dried yeast
• warm water
• dishwashing detergent
• 250 mL beaker
• pipette
• food colouring
• funnel
• large plastic tray
Method
1. Measure 125 mL of6% hydrogen peroxide and pour into the flask using a funnel.
2. Add a large squirt of detergent to the flask and swirl to mix.
3. Add 3 drops of food colouring.
4. In the beaker, mix about 80 mL of warm water and the dry yeast, and stir to combine.
5. Pour the yeast into the flask with the peroxide, using a funnel. Stand back and observe what happens. Record your observations.
Results
Be careful
Wear appropriate personal protective equipment, including gloves, during this experiment.
UNCORRECTEDSAMPLEPAGES
1. Take photos of each stage of the method and record the chemical reaction using a phone or video camera.
2. Once the reaction is complete, touch the foam and the edge of the flask (while wearing gloves), and record your observations of the temperature.
Discussion
1. What evidence was there that a chemical change had occurred?
2. How do you think the foam was formed? Why do you think it is called ‘elephant’s toothpaste’?
3. How was the heat made?
4. Write a word equation for the decomposition of hydrogen peroxide.
5. Write the chemical equation for the decomposition of hydrogen peroxide (H2O2).
6. Investigate yeast and find out why it is included as an ingredient in this reaction.
Figure 5.25 Experimental set-up
Section 5.2 questions
Online quiz
Section 5.2 questions
Remembering
Section questions
Teachers can assign tasks and track results
1. Name three examples of chemical change occurring in your home.
2. For each of the following situations, summarise the signs of chemical change you would observe.
a) Bread is baking in an oven.
c) Sandwiches go mouldy.
Understanding
b) Glow sticks emit light when you break them.
d) Baking soda and vinegar are mixed.
3. Explain the process of rusting and why it is an example of chemical change.
4. A stoppered test tube of yellow liquid is left on the window sill of a science lab over the weekend. When the students come back to class, they observe that there is condensation on the inside of the tube, the liquid has gone green, and the stopper has popped out. Explain whether these observations indicate physical or chemical changes and give a reason for your answer.
Applying
5. Distinguish between bioluminescence and chemiluminescence.
6. Classify each of the following as physical or chemical change.
a) vegetable scraps breaking down in the b) separating sand from gravel compost bin
c) cutting fingernails
e) chipping tree branches
d) drilling a screw into wood
f) a stock cube dissolving in hot water
h) crushing a can
g) fruit on the ground going mouldy j) breakfast cereal going soggy
i) trees growing new leaves in spring l) dropping and breaking a plate
k) rain making the ground muddy m) baking a quiche
Analysing
7. Identify the types of changes occurring in the following situations. (There may be more than one type.)
a) Pastry is defrosted and then used to make a pie.
b) To make honeycomb, sugar is mixed with water and honey, heated, and then bicarbonate of soda is added.
c) A candle burns and wax drips down the side.
8. Determine the reasons why galvanised iron does not rust.
Evaluating
9. Propose why rusting occurs faster on door hinges of boat sheds compared to door hinges a kilometre inland from the beach.
Go online to access the interactive section review and more!
UNCORRECTEDSAMPLEPAGES
10. For each of the following situations, deduce whether a physical change, a chemical change, or both, has occurred. Give reasons for your answers.
a) biting, chewing and swallowing noodles
b) ice cubes melting in your iced-chocolate drink
c) petrol burning in a car
d) bread dough being kneaded, then rising
e) a steel spoon left out after being washed and little red spots forming on it
WORKSHEET
5.3 Energy in chemical reactions
Learning goals
At the end of this section, I will be able to:
1. Identify reactants and products in a chemical reaction.
2. Compare the indicators of exothermic and endothermic reactions.
3. Write a word equation for the combustion reaction of a hydrocarbon.
In this section you will further explore temperature change in chemical reactions, which is an indicator of chemical change. Heat energy can either be absorbed from the surroundings and added to the reactants or released to surroundings when the new chemical products form.
Figure 5.26 Photographic film works because of chemical reactions.
Graphing endothermic and exothermic reactions reactants the chemical substances that are present at the beginning of a chemical reaction products the chemical substances that are present at the end of a chemical reaction
UNCORRECTEDSAMPLEPAGES
Word equation:
Reactants and products
In a chemical reaction, the chemical substances that react are called reactants, and the substances that are produced are called products A chemical reaction can be represented in different ways, such as a word equation or a symbol equation (also called a chemical equation).
An example of a chemical reaction is when light hits photographic film coated with tiny crystals of the compound, silver chloride. When the film is exposed to light, a chemical reaction occurs, and this darkens the film to produce an image. This reaction can be represented by a word equation and by a chemical equation.
The reactants, or in this case reactant, are on the left of the arrow – silver chloride. Note that the formula for silver chloride is AgCl, one atom of silver joined to one atom of chlorine.
The products are on the right of the arrow – silver and chlorine. Note that chlorine has the formula Cl2 as it exists as a molecule, never as an atom on its own.
You may have noticed that in front of the AgCl is the number 2, and there is also a number 2 in front of the Ag. This is part of the process of balancing equations, which you will learn more about in years 9 and 10. To put it simply, atoms cannot be created or destroyed, they just move around during chemical reactions. This means the number of silver atoms in the reactants must be the same as the number in the products, and the number of chlorine atoms in the reactants must be the same as in the products. These extra numbers you see in the equation are there to balance the numbers of atoms on each side of the equation.
Figure 5.27 Keeping it simple: balancing equations is like working out whether you need one or two cups of flour to make bread. The top equation is not balanced, because the number of chlorine atoms is not the same on both sides of the reaction.
Quick check 5.7
1. a) Recall if chemical reactions involve physical change or chemical change.
b) Recall examples of what evidence there would be if a chemical reaction occurred.
2. Define the terms ‘reactants’ and ‘products’.
3. Name and give examples of two different ways we can represent chemical equations.
UNCORRECTEDSAMPLEPAGES
exothermic and endothermic reactions
Particles in a chemical reaction are constantly moving as they have kinetic energy. There is also potential energy, also known as chemical energy, stored in the chemical bonds between atoms in molecules. When the atoms rearrange in a chemical reaction, the potential energy stored in the bonds also changes, as old bonds are broken and new bonds are formed. As the new chemical bonds will always be different to the old chemical bonds, the potential energy of the reactants and products will always be different. But as energy cannot be created or destroyed, it must go somewhere. If the energy is lost, it is lost as heat energy to the surroundings, and if it is gained, heat energy is removed from the surroundings. This is observed as a change in temperature, an indicator of chemical change. Reactions that release energy, like the burning of wood on a campfire, are described as exothermic reactions.
In science, it is useful to understand where words come from, so let us split up the word exothermic. The exo part of exothermic means external. The thermic part of exothermic means heat. If you put these two parts together, then exothermic just means external heat (heat leaving the reaction). You can tell if a reaction is exothermic because you will observe a rise in temperature. Heat has left the chemical reaction and gone into the immediate surroundings; it is the temperature of the surroundings that you will measure in an experiment.
In exothermic reactions, the products have less potential energy than the reactants, which is why this extra energy is released into the surroundings. It is helpful to see what is happening in an exothermic reaction by looking at an energy profile diagram, such as shown in Figure 5.32.
EXO External THERMIC Heat
Figure 5.29 The word ‘exothermic’ means external heat.
the
the
a
Figure 5.28 Applying heat energy to vegetables creates a chemical reaction, evidenced by a colour change.
kinetic energy
energy of moving matter potential energy (chemical)
energy stored in the chemical bonds between atoms exothermic
release of heat in a chemical reaction characterised by an increase in surrounding temperature VIDEO Exothermic and endothermic chemical reactions
Figure 5.30 Burning wood is an example of an exothermic reaction because heat is released.
endothermic an absorption of heat in a chemical reaction characterised by a decrease in surrounding temperature
In this reaction, the reactants have more potential energy in their bonds than the products, so surplus energy is released into the surroundings.
Figure 5.31 These fireworks in Perth were launched into the sky using an explosion, which is a very fast exothermic reaction.
Figure 5.32 An energy profile diagram for an exothermic reaction
In this word, endo means internal and thermic means heat. You can tell if a reaction is endothermic because you will observe a decrease in temperature: heat has left the immediate surroundings and has gone into the reaction.
Figure 5.33 Photosynthesis, in which plants use the Sun’s light energy to make their own food, is an example of an endothermic reaction. THERMIC
UNCORRECTEDSAMPLEPAGES
Figure 5.35 An energy profile diagram for an endothermic reaction
Reactions that take in energy from the surroundings, for example, photosynthesis, in which plants use light energy to make their own food, are described as endothermic reactions. Uncorrected 2nd
Figure 5.34 The word ‘endothermic’ means internal heat.
In endothermic reactions, the products have more potential energy than the reactants, because extra energy is absorbed from the surroundings. It is helpful to see what is happening in an endothermic reaction by looking at an energy profile diagram, such as shown in Figure 5.35.
In this reaction, the products have more potential energy than the reactants, so energy is absorbed into the reaction from the surroundings.
Quick check 5.8
1. During a chemical reaction, the temperature of the solution decreases. Infer whether this reaction is endothermic or exothermic.
2. ‘Cellular respiration is an example of an endothermic reaction because it releases energy into the surroundings.’ Is this statement true or false?
3. During a chemical reaction between hydrochloric acid and sodium hydroxide, the temperature went up by 5°C. Infer whether the reaction is endothermic or exother mic.
4. ‘Burning wood is an example of an exothermic reaction because the products have more potential energy than the reactants.’ Propose whether this statement is true or false.
Practical 5.5: Teacher demonstration
endothermic and exothermic reactions (1)
Aim
To determine whether a reaction is endothermic or exothermic
Materials
Experiment 1
• potassium iodide
• 30% hydrogen peroxide solution
• food colouring
• dishwashing detergent
Experiment 2
• ammonium chloride
• barium hydroxide
• 250 mL beaker
Method
Copy the results table.
Experiment 1
UNCORRECTEDSAMPLEPAGES
Be careful
Wear appropriate gloves during this experiment.
• 100 mL plastic measuring cylinder
• plastic tray
• spatula
• wooden block
• glass stirring rod
• thermometer
1. Place the 100 mL measuring cylinder in the middle of the plastic tray.
2. Add a squirt of dishwashing detergent and a few drops of food colouring to the measuring cylinder.
3. Pour about 65 mL of 30% hydrogen peroxide into the measuring cylinder.
4. Weigh 1.4 g of potassium iodide using a weighing balance.
5. Add the potassium iodide to the flask, stand back and watch.
Experiment 2
1. Put a drop of water on the wooden block and place the 250 mL beaker on top of the water.
2. Weigh 10 g of ammonium chloride and 32 g of barium hydroxide separately using a weighing balance.
3. Mix the ammonium chloride and barium hydroxide together in the beaker, stirring with the stirring rod, and observe the change in temperature.
4. Now try to remove the beaker from the block.
5. Pass the wooden block around the class and feel the change in temperature.
Results
UNCORRECTEDSAMPLEPAGES
Experiment ObservationsExothermic
Discussion
1. How did you know that a chemical reaction had taken place in both experiments?
2. Draw an energy profile diagram for each experiment.
3. Explain why the two solids in Experiment 2 changed into a liquid without any heat being applied to the beaker.
4. Determine why the reaction mixture shot out of the measuring cylinder in Experiment 1
5. Explain why it would be important to use the same weighing balance when weighing all chemical substances. What possible error might occur if different balances were used?
Conclusion
Draw a conclusion from this experiment regarding whether each reaction is endothermic or exothermic.
Practical 5.6
endothermic and exothermic reactions (2)
Aim
To determine whether a reaction is endothermic or exothermic
Materials
• 0.5 mol/L hydrochloric acid
• 1.0 mol/L hydrochloric acid
• 0.5 mol/L sodium hydroxide solution
• 1 mol/L copper sulfate solution
• 1 mol/L sodium hydrogen carbonate solution
Method
Be careful
Wear appropriate gloves during this experiment.
• 2 × 3 cm piece of magnesium ribbon
• 1 spatula of zinc powder
• 1 spatula of citric acid
• 10 mL measuring cylinder
• thermometer
• foam cup with lid
1. Copy the results table, which gives the reactants to be used in five experiments.
2. Pour 10 mL of the first substance in Experiment 1 into the cup and measure the starting temperature. Record the temperature in your results table.
3. Add the required amount of the other substance listed in Experiment 1 to the cup, poke the thermometer through the lid and attach the lid to the cup.
4. When the temperature on the thermometer remains stable, record the final temperature in the results table.
5. Work out the temperature change and decide whether the reaction is endothermic or exothermic.
6. Repeat for the other experiments listed in the table.
Results
Experiment
110 mL 0.5 mol/L hydrochloric acid + 3 cm piece of magnesium ribbon
210 mL 1.0 mol/L hydrochloric acid + 3 cm piece of magnesium ribbon
310 mL 0.5 mol/L hydrochloric acid + 10 mL sodium hydroxide solution
410 mL copper sulfate solution + 1 spatula zinc powder
1. Explain how you determined if each reaction was endothermic or exothermic.
2. Compare the temperature change for Experiments 1 and 2. Did changing the concentration of HCl affect the temperature change in the reaction?
3. Describe what happened to the energy in the reaction between sodium hydrogen carbonate and citric acid in Experiment 5.
Combustion
Chemical reactions that involve the burning or exploding of a chemical substance in oxygen are called combustion reactions. This type of reaction is exothermic, and the heat released can often be harnessed and transformed to different types of energy, including electrical energy. For example, methane, also called natural gas, can be used for cooking or heating water in a household. Methane reacts with oxygen to produce carbon dioxide, water, light and heat.
Word equation:
that involves the burning or exploding of a chemical substance in the presence of oxygen
hydrocarbon chemical substance containing only hydrogen and carbon atoms
Chemical equation:
CH4 + 2O2 → CO2 + 2H2O
Another example is octane, the fuel used to power modern cars. It reacts with oxygen to produce carbon dioxide, water, light and heat.
Figure 5.36 These petrol pumps indicate the different amounts of octane present in petrol, with 98 being ‘higher octane’ than 95 and 91.
UNCORRECTEDSAMPLEPAGES
Creating a visual model of a combustion reaction For this task you will need to:
• draw and colour in two circles labelled ‘C’ for carbon, eight circles labelled ‘H’ for hydrogen and eight circles labelled ‘O’ for oxygen.
• cut out these circles such that they represent individual atoms.
• organise the atoms such that they illustrate the following combustion reaction: CH4 + 2O2 → CO2 + 2H2O
• check whether all atoms are present on either side of the chemical reaction. Why or why not?
When hydrocarbons, chemical substances containing only hydrogen and carbon atoms, are burned in oxygen, carbon dioxide and water are produced, as well as light and heat. This is one example of how the heat released in an exothermic reaction can be harnessed to provide energy for tasks in our daily lives.
Did you know? 5.6
Candle combustion
Figure 5.37 The wick provides a surface on which the wax can undergo a combustion reaction.
Candles are a great source of light and can last for hours with a controlled flame. A common misconception is that when a candlewick is ignited, it is only the wick that burns. In fact, the wax surrounding the wick burns in contact with oxygen in the air in a combustion reaction. This is why the wax eventually disappears from the candle: it has become carbon dioxide and water vapour! This steady burn and relatively controlled flammability have allowed candles to be a perfect candidate for lighting purposes for thousands of years.
Practical 5.7: Teacher demonstration
sugar snake
Aim
To investigate a combustion reaction
Materials
• fume hood or well-ventilated area (outdoors recommended)
• teaspoons
• aluminium pie tin
• sand
• mixing bowl
• lighter fluid (or isopropyl alcohol)
• matches
• powdered sugar
• baking soda
Method
1. In a bowl, combine four teaspoons of powdered sugar with one teaspoon of baking soda.
2. Fill the pie tin with sand and create a small mound in the centre. Then use your hand to make an indent in the middle of the mound.
3. Pour lighter fluid on the mound and in the indentation. Make sure the sand is well soaked.
Be careful
Wear appropriate personal protective eqiupment, including safety glasses. Only conduct this experiment in a wellventilated area.
4. Spoon the sugar and baking soda mixture into the centre of the mound.
5. Carefully light the sand near the sugar mixture.
Results
Take photos of each stage of the method and record the chemical reaction using a phone or video camera.
Discussion
1. Define the terms ‘chemical change’ and ‘combustion’. What evidence do you see that a chemical change has occurred?
2. Which ingredient do you think is undergoing combustion? What gas is being made?
3. Can you explain why the snake goes black? Why does it keep growing?
4. Explain the purpose of the sand.
5. Why is it recommended that this experiment is done wearing safety glasses, in a well-ventilated area or fume hood?
1. Explain how you would identify that a chemical reaction was a combustion reaction.
SAMPLEPAGES
Sugar and baking soda
Sand
Aluminium pie tin
Figure 5.38 Experimental set-up
Quick check 5.9
Science as a human endeavour 5.1
synthesis of medicines
Scientists employ a wide range of chemical reactions to create new complex molecules. An example of this is the development of medicines to specifically target certain diseases.
Scientists are always working to create new vaccines, and antiviral and antibiotic agents for a range of new and old diseases. The synthesis (making) of such molecules may require more than 10 or 20 steps of chemical reactions to achieve the complex medicine. Each one of these steps either uses energy (endothermic) or loses energy to the surroundings (exothermic).
5.39 The coronaviruses are a family of viruses that includes SARS (shown in the image), MERS and more recently, SARS-CoV-2.
In early 2020, scientists around the world were hastily using chemical reactions to attempt to create a molecule that would act as an antiviral agent to the virus responsible for COVID-19.
Online quiz Go online to access the interactive section review and more!
Section 5.3 questions
UNCORRECTEDSAMPLEPAGES
Section 5.3 questions
Remembering
1. Identify the gases that are products of combustion reactions involving hydrocarbons.
2. Recall one example of an endothermic reaction and one example of an exothermic reaction.
Understanding
3. Explain why when fire blankets are put over a fire, they cause the fire to be put out.
4. During photosynthesis, plants use the Sun’s energy to make their own food. Explain why this is an example of an endothermic reaction.
Applying
5. Contrast exothermic and endothermic reactions.
Analysing
6. Classify the following as exothermic or endothermic reactions.
a) a reaction in which the temperature decreases
b) releasing energy from food in cellular respiration
c) baking a cake
d) combustion
Evaluating
7. Construct a word equation for the combustion of butane (barbeque gas) to form carbon dioxide and water.
8. Decide if the following statement is true or false: ‘Combustion is a chemical reaction’. Give reasons for your choice.
Section questions
Teachers can assign tasks and track results
Figure
Chapter review
Chapter checklist
Success criteria Linked questions
5.1 I can describe ways to identify if a physical change has occurred.2, 4, 15
5.2 I can describe ways to identify if a chemical change has occurred.4, 11, 15
5.3 I can identify the reactants and products in a chemical reaction.8, 10
5.3 I can compare the indicators of exothermic and endothermic reactions.5, 9
5.3 I can write the word equation for a combustion reaction. 3, 6, 8
Review questions
Remembering
1. Define the following key terms: physical property, chemical property, physical change, chemical change, reactant, product.
2. Recall the possible evidence that a physical change has occurred.
3. State whether each of the following processes is a physical or chemical change.
a) moth balls evaporating in a cupboard
b) building a sandcastle
c) hydrogen burning in chlorine gas
d) fogging up a mirror by breathing on it
e) breaking a bone
f) a broken bone mending
g) slicing potatoes for making chips
h) hand sanitiser evaporating
i) mixing sugar with coffee
j) making a paper aeroplane
k) pan frying dumplings
l) copper turning green when exposed to the air
m) paper ripping
4. State whether the temperature of the surroundings would increase or decrease in an endothermic reaction.
Understanding
5. When Tori reacts a lump of calcium carbonate with sulfuric acid, she notes that water, carbon dioxide and calcium sulfate form.
a) State the word equation representing the information given.
b) Identify the reactants and the products and give reasons for your answer.
Go
6. Identify which of the following are examples of chemical reactions.
UNCORRECTEDSAMPLEPAGES
7. When a chemical substance containing carbon and hydrogen burns, it reacts with a gas in the air and forms another gas.
a) Name the gas produced from this reaction.
b) Identify the type of chemical reaction.
Applying
8. Explain what evidence could determine whether a combustion reaction is an exothermic or endothermic reaction.
9. a) Explain why baking cookies is not an example of physical change.
b) Explain why bending metal in half is not an example of chemical change.
10. Summarise the observations you could make if a chemical change had occurred.
Analysing
11. Explain why a colour change occurring is not always a sign that a chemical change has occurred.
12. Critique the following statement: ‘Atoms that are not in the reactants can end up in the products of a chemical reaction’.
Evaluating
13. a) When you combine bicarbonate of soda and buttermilk, a gas is produced. Propose why the gas is considered evidence that a chemical reaction occurred.
b) Propose whether it is possible to continue adding more and more of only one reactant and expect to get more and more product. Give reasons why or why not.
14. Determine whether each of the particle diagrams below indicates a chemical or physical change. Justify your answer.
a) Before After b) Before After
Data questions
A theoretical chemical reaction occurs such that reactant A reacts to form an intermediate product B, which reacts to form a product C. The chemical reactions occurring are:
A → B reaction 1
B → C reaction 2
The mass of each species is plotted in Figure 5.40, with respect to time passed in the reaction.
UNCORRECTEDSAMPLEPAGES
Figure 5.40 Change in mass of the reactant (in red), intermediate (in blue) and product (in green) over time in a chemical reaction.
1. Identify the colour of the line that represents the reactant A.
2. Identify which coloured line represents the intermediate – the species that is formed in a reaction of A and then reacts to form C.
3. Identify the time at which the mass of intermediate B is greatest.
4. Identify the relationship between the mass of reactant A and the mass of product C.
5. Contrast the curves for intermediate B and product C and account for the shape of the blue line.
6. Infer why the green line does not increase steadily until after 0.5 hours.
7. Justify what the total mass of all species will be at 3.0 h if the mass of reactant A was 7 g at time zero.
8. Predict whether the mass of product C will increase above 7 g.
9. The intermediate, B, has a blue colour when it is produced, and in this reaction this blue colour was only evident when B composed the most mass of all species. Deduce which time period after the start of the reaction the reaction mixture would have appeared blue.
sTeM activity: Building a rocket
Background information
Define the problem/ identify the need
Redesign (as needed)
Rockets are very heavy machines capable of lifting off the surface of Earth and obtaining a height sufficient to reach the orbit of Earth. This lift-off requires a combustion reaction to provide the thrust needed to overcome the force of gravity and shoot up into orbit. Combustion is a rapid, heat-producing (exothermic) reaction between a fuel and oxygen. During a chemical reaction, chemical bonds are broken and new bonds are formed, creating new chemical products. The exhaust from the bottom of the rocket produces a great thrust or force, and the opposing force pushes the rocket upward.
Communicate the design and the process
Test and evaluate prototype
Research the problem
Engineering design cycle
Brainstorm/develop solutions
Select the solution
Build/construct prototype
Figure 5.41 Designing and testing of a model comes before construction of the real thing.
DESIGN BRIEF
In a process known as the engineering design cycle, aerospace engineers design small-scale models to learn from and experiment with. By testing smallscale models, the engineers ensure the rockets will work, without wasting time and money on testing full-size rockets. They can test the thrust and stability and make modifications in order to design the best rocket possible with the materials available.
Design, build, test and evaluate a rocket that will launch in a controlled manner in 10 seconds.
activity instructions
In teams, you will take on the role of aerospace engineers for the Super-Fast Rocket Company. You have been hired to design, build, test and evaluate a rocket that will launch safely and repeatedly in 10 seconds. There will be two major factors in solving this problem: first, the design of the rocket, and second, the chemical reaction that will provide the thrust for the rocket.
Suggested materials
• 35 mm film canister (or anything similar with an internal snapping lid such as some prescription medicine bottles)
• 1 antacid tablet
• water
• scissors, sticky tape, markers, paper
UNCORRECTEDSAMPLEPAGES
• chopping board • mortar and pestle
• knife, spoon
• safety glasses
Research and feasibility
1. Research the chemical reaction between antacid tablets and water to produce carbon dioxide and find out the impact of temperature, surface area, mass or other factors on the rate of reaction. List these factors in a table.
Factors that affect rate of reaction
Temperature
Surface area
Mass
Reaction vessel type
Rate of reaction (increase/ decrease/no effect)
Ideas on how to use this factor in design
2. Research and discuss, in your team, ideas of how to use the film canister and lid as a reaction vessel – good engineers use existing technology and work on improvements and also completely reinvent the concept sometimes.
3. Research rocket design and the size ratios of the dimensions of the rocket.
Design and sustainability
4. Discuss in your group how to make the rocket reaction vessel reusable to reduce waste and think of methods to limit excess production of carbon dioxide.
5. Sketch multiple possibilities of the rocket design and how the rocket would obtain lift from the reaction vessel, making sure that your rocket is not destroyed through the explosion of the reaction vessel.
6. Discuss the sustainability of your design and, as a group, decide on a model V1.0 to build.
7. As a group, use your knowledge of chemical reactions to decide on a combination of tests you will use to launch the rocket in 10 seconds. You may find creating a table a good way to record your tests. You can do this any way you wish.
8. Break into two groups, a build team and a discovery team. The build team will construct the rocket, and the discovery team will need to work on identifying the correct amount of antacid and water in the film canister in order to ensure the rocket launches at approximately 10 seconds. The build team needs to ensure the rocket can launch safely and sustainably.
Evaluate and modify
9. Discuss the different conditions you investigated and what you found out about the effect of temperature, surface area and mass of the antacid tablets on the rocket launch times.
10. Draw a flow chart to show your original design for a 10-second launch and the modifications that followed, ending with your rocket launching at exactly 10 seconds. Highlight the changes/improvements you made at each step along the way.
11. Consider both your rocket and the other rockets you observed being launched. Identify and describe the characteristics that make one rocket perform better than another.
12. Discuss what challenges you faced while designing and testing your rocket and how you overcame these challenges.
UNCORRECTEDSAMPLEPAGES
Chapter 6 Our changing Earth
Introduction
Earth is constantly being reshaped by natural forces, including those created by the movement of tectonic plates. Over the course of billions of years, these forces have created and destroyed landforms and reshaped coastlines. In this chapter, you will explore the changing nature of our planet, examining the evidence for plate tectonics and the mechanisms behind plate movement. You will also consider the ways in which plate tectonics can contribute to natural disasters and the strategies that scientists and policymakers are using to predict and manage these events.
The theory of plate tectonics explains global patterns of geological activity, including the formation of features at divergent, convergent and transform plate boundaries.
• development of the theory of plate tectonics and evidence supporting the theories 6.1, 6.2
• correlating earthquake and volcanic activity to tectonic plates 6.3
• examining why earthquakes occur within the Australian plate 6.3
Collaborating and applying
Illustrate how the development of scientific knowledge has benefited from collaboration across disciplines and the contributions of people from a range of cultures.
• exploring how seismic data are collected and shared between governments across the Asia–Pacific region and how governments use these data for alert systems, such as tsunami alerts
Illustrate how science understanding and skills have influenced the development of individual, community and workplace practices.
• exploring how geologist and oceanographic cartographer Marie Tharp’s topographic maps of the Atlantic Ocean floor provided support for the acceptance of the theory of plate tectonics
GPS hotspot lag time lava lithosphere magma mantle pangaea plate boundaries plate tectonics pyroclastic Richter scale
ridge push rift valley seafloor spreading seismic wave seismogram seismometer slab pull subduction subduction zone
tectonic plates transform (conservative) tsunami
UNCORRECTEDSAMPLEPAGES
6.1 Continent movement theories
Learning goals
At the end of this section, I will be able to:
1. Describe the evidence for the theory of continental drift.
2. Explain how Marie Tharp’s topographic maps provided support for the acceptance of the theory of plate tectonics.
For centuries, scientists have been fascinated by Earth’s continents and the puzzle of how they came to be distributed across the planet’s surface. The concept of continental drift, or the idea that the continents have moved over time, is not a recent discovery. In fact, it dates to the late sixteenth century when early map-makers noticed that the coastlines of South America and Africa appeared to fit together like puzzle pieces.
Over the centuries, various scientists made contributions to the understanding of the theory of continental drift, and in this section you will explore the historical evolution of the theory of continental drift, from its earliest speculations to the present-day understanding of plate tectonics.
alfred Wegener – continental drift
In 1912, Alfred Wegener, a German geophysicist and meteorologist, proposed his theory of continental drift. Wegener hypothesised that Earth’s continents were once part of a giant land mass, which he called Pangaea
continental drift the theory of how the continents on Earth have moved over millions of years Pangaea the supercontinent that has since broken into pieces and drifted apart
Figure 6.1 Alfred Wegener
Figure 6.2 Wegener proposed that all the continents were once together in a giant land mass called Pangaea.
Over time, this giant land mass broke up and drifted apart to form the continents as they are found today. Figure 6.3 shows how the continents have moved over millions of years. Follow the movement of Australia to see how far it has moved in that time.
6.3 The movement of the continents from a single land mass (Pangaea) to their current locations
A scientific theory must be based on evidence. So how did Wegener justify his theory to the scientific community? He put forward four different pieces of evidence to support his theory.
1. Continental outlines matched
You can see from Figure 6.4 that, when put together, some of the existing continents look like they fit into each other – just like pieces of a jigsaw puzzle. This observation was not lost on early map-makers, but you could argue that this is just a coincidence, so Wegener needed more evidence to back up his theory.
2. Similar fossils were found on different continents
UNCORRECTEDSAMPLEPAGES
Figure 6.4 The outlines of Africa and South America fit together like pieces in a jigsaw puzzle.
When observing the types of fossils on different continents, Wegener found examples of the same prehistoric landbased creatures on continents that are now separated by oceans. He stated that the land masses must have been together at some stage (as shown in Figure 6.5) because these animals could not swim from one continent to another. Opposing geologists argued that land bridges could have existed in the past when ocean levels were lower. These land bridges would have allowed the fauna and flora to cross between continents.
3. Rock types on different continents matched each other
Wegener found rocks of the same type and age on both sides of the ocean, which he claimed was evidence they were formed together and later separated.
Figure
Africa
South America
4. Coal was found in cold areas and evidence of glaciers was found in the tropics
Coal only forms in hot and humid climates, and glaciers only form in cold climates, so how could there be coal in cold areas and evidence of past glaciers in regions that are now hot? Wegener concluded that continents have moved over time to a different location.
Despite all the evidence compiled by Wegener, he was unable to convince the scientific community at the time of the validity of his hypothesis. Alternative theories (like the land bridges) were proposed, and geologists questioned his credibility because he was a meteorologist and geophysicist known for polar climate research and not a geologist. However, the main flaw of Wegener’s hypothesis was that he had no explanation for the mechanism behind the movement of the continents.
India
Fossil remains of the Triassic land reptile Lystrosaurus
Fossil remains of the freshwater reptile Mesosaurus
Fossil remains of Cynognathus, a Triassic land reptile approximately 3 metres long
Fossil remains of the fern Glossopteris
Figure 6.5 Wegener found that fossils on different continents matched up, supporting his theory of continental drift.
Figure 6.6 Coal only forms in hot, swampy areas; glaciers only form in cold areas.
Unfortunately, in 1930, Alfred Wegener and another team member were caught in a blizzard on an expedition in Greenland and did not survive. At the time of his death, his theory was still not accepted by the scientific community.
Quick check 6.1
UNCORRECTEDSAMPLEPAGES
1. Recall the name of the scientist who proposed and gave evidence for the theory of continental drift.
2. List the four different pieces of evidence he used to support his theory.
3. Outline why his theory was not accepted at the time.
mid-ocean ridges and seafloor spreading
Around 20 years after the death of Alfred Wegener, evidence of geological change in the seafloor started to come to light and was eventually interpreted as support for the theory of continental drift. The use of echolocation (sonar) to probe under the sea was developed in the 1930s for military use. Sonar works by sending sound waves into the ocean; when they bounce back, they are picked up as an echo. The time they take to bounce back indicates the depth of that part of the ocean.
The existence of sonar, and resulting data, was mostly kept secret until after World War II. Then it became available to geologists and oceanographers, revealing deep trenches, underwater mountain ranges and volcanoes.
Marie Tharp
Marie Tharp was a geologist and oceanographic cartographer who played a pivotal role in the development and acceptance of the theory of plate tectonics in the mid-twentieth century. Tharp’s work focused on mapping the topography of the Atlantic Ocean floor, which provided crucial evidence for the theory of plate tectonics.
At the time Tharp began her work in the 1950s, the view among scientists was that the ocean floor was flat and featureless. However, Tharp’s research challenged this view by creating the first detailed three-dimensional maps of the ocean floor. Working with Bruce Heezen, she used sonar data to create accurate and detailed maps of the seafloor topography.
One of the most significant discoveries that Tharp made was the presence of a large underwater mountain range that runs along the centre of the Atlantic Ocean floor, known as the Mid-Atlantic Ridge. Tharp’s 1977 maps revealed that the ridge was not a simple continuous structure but was instead a series of interconnected segments with deep valleys running between them.
Tharp’s work was initially met with scepticism by many scientists; however, as more evidence emerged in support of plate tectonics, Tharp’s maps became widely accepted as a key piece of evidence. In 1977, Tharp was awarded the National Geographic Society’s Hubbard Medal, the first time the award had been given to a woman. Figure 6.7 Marie Tharp and Bruce Heezen
Harry Hess
Harry Hess, a geologist, became a US Navy captain in the Pacific Ocean during World War II. His troop transport ship had an echo sounder, which allowed him to create profiles of the ocean floor, discovering ridges and submarine volcanoes. After the war, he became a professor of geology at Princeton University. When he saw Marie Tharp’s maps of the Mid-Atlantic Ridge, he realised that his profiles of the ocean floor in the Pacific were evidence of major geological changes, and he was the first to explain how ridges, rifts and the seafloor were formed.
In his book The History of Ocean Basins, Hess wrote that volcanoes found along the line of the ocean ridges bring up molten rock from beneath Earth’s crust. This molten rock cools and forms new oceanic rock. As more and more oceanic rock is produced, the sea floor moves away from the ridges. Hess called this process seafloor spreading. This was a crucial piece of evidence to support Wegener’s theory. If oceans are moving away from one another, then continents on either side of the ocean must be doing the same. Hess also proposed that if the ocean floor was moving towards a continent it would sink in a process called subduction, forming ocean trenches (see Figure 6.9). You will look at subduction in more detail in section 6.2.
seafloor spreading a process by which new oceanic crust is produced as sea floor moves away from ocean ridges subduction when a more dense oceanic plate sinks underneath a less dense continental plate
Figure 6.8 Harry Hess was a professor of geology who explained how the ocean floor and mid-ocean ridges were formed.
Ocean Bedrock
Ocean
Trench
Bedrock
Figure 6.9 The ocean floor was previously thought to be flat (left). Mapping of the ocean floor (right) indicated otherwise.
Explore! 6.1
Journey to the bottom of the sea
Victor Vescovo‘s Five Deeps Expedition was an ambitious project that aimed to explore the deepest points of each of the world’s five oceans. Over the course of several years, Vescovo and his team used a specially designed submarine to dive to the bottom of the Atlantic, Southern, Indian, Arctic and Pacific Oceans. The expedition not only provided new insights into the geology and biology of the ocean depths, but it also set several new records.
One of the most significant records broken was the deepest manned descent in history, as Vescovo’s team reached a depth of nearly 10 925 m in the Pacific Ocean’s Mariana Trench. In addition to this, the expedition also set a record for the deepest dive in the Atlantic, Southern and Indian Oceans. The expedition made the first manned descent to the bottom of the Arctic Ocean.
In June 2023, a submersible vessel owned and operated by the American company, OceanGate, suffered a catastrophic implosion while attempting to explore the wreck of the Titanic, instantaneously killing all passengers and crew. Discuss whether deep ocean expeditions should be manned and why people choose to ignore the risks associated with such trips.
UNCORRECTEDSAMPLEPAGES
Figure 6.10 A map of the Mid-Atlantic Ridge and its volcanoes running down the middle of the Atlantic Ocean
Figure 6.11 Dr Dawn Wright and Victor Vescovo inside the control capsule of the submersible deepsubmergence vehicle (DSV) Limiting Factor
Figure 6.12 The only light that can be observed in the ocean depths is created by the animals that live there. This is called bioluminescence.
Making thinking visible 6.1
see, think, wonder: vomiting shrimp
The following images show a deep-sea pandalid shrimp, Heterocarpus ensifer, and the same animal ‘vomiting’ light from glands located near its mouth.
• Can you describe what is visible in the photos?
• What thoughts come to your mind when you observe them?
• Are there any questions that arise from your observations?
UNCORRECTEDSAMPLEPAGES
Did you know? 6.1
Extreme exploration
On a 2020 crewed expedition to the Challenger Deep, some records were set by passengers who accompanied Victor Vescovo on his dives. Former NASA astronaut Doctor Kathryn Sullivan became the first person to both walk in space and descend to the deepest known point on Earth; and Vanessa O’Brien became the first woman to reach Earth’s highest (Mt Everest) and lowest points. She was also the first person to reach nearest to and farthest from Earth’s core (Challenger Deep and the summit of Chimborazo).
1. Name the ridge located in the Atlantic Ocean.
2. Recall the name of the technique Harry Hess used to map the ocean floor.
3. Describe the results and major discovery of Harry Hess’s ocean-floor mapping.
Frederick vine, Drummond matthews and Lawrence morley – reading the ocean floor
In the 1960s, further evidence was discovered to support Hess’s theory. Frederick Vine and Drummond Matthews were British geologists who first worked together when Vine was a PhD student under Matthews at the University of Cambridge. Earlier work using magnetometers (which measure the direction of magnetic fields) showed that the sea floor has bands of alternating
The See, think, wonder thinking routine was developed by Project Zero, a research centre at the Harvard Graduate School of Education.
Figure 6.13 Heterocarpus ensifer
Figure 6.14
Vanessa O’Brien
Quick check 6.2
WORKSHEET
normal and reverse magnetism, running parallel to the mid-ocean ridges. At about the same time, Canadian geologist Lawrence Morley was independently working on the same idea and his results agreed with those of Vine and Matthews.
Normal magnetic polarity
Reversed magnetic polarity
Mid-ocean ridge
UNCORRECTEDSAMPLEPAGES
6.15 The pattern of magnetic stripes on the ocean floor
Vine and Matthews knew that the new molten rock produced by the ocean ridges contained magnetite, a magnetic mineral. While the molten rock cooled and solidified, the magnetite aligned with Earth’s own magnetic field, with its magnetic poles matching Earth’s magnetic poles. Earth’s magnetic field reverses direction approximately every 300 000 years, and the cooling rock preserves the record of Earth’s polarity at that time. For rocks to have their magnetic minerals aligned in different directions, they must have formed at different times. As the pattern of magnetic stripes leading away from the mid-ocean ridges is symmetrical, this led Vine and Matthews to conclude that new sea floor was being added equally to each side of the ridge. Morley also saw the significance of the changes in Earth’s magnetic field, magnetism of new oceanic crust and seafloor spreading as a mechanism for continental drift. That is why it is often called the Vine–Matthews–Morley hypothesis.
Figure 6.16 According to paleomagnetic records, Earth’s magnetic poles have experienced approximately 183 reversals in the last 83 million years and have undergone at least several hundred reversals over the past 160 million years.
Magma
Lithosphere
Figure
Explore! 6.2
Earth’s magnetic field
On average, Earth’s polarity switches approximately every 300 000 years. The last time Earth’s poles reversed was 780 000 years ago. This means that at any time there could be a reversal in Earth’s magnetic field. Interestingly the Sun is a lot less magnetically stable; its magnetic field reverses approximately every 11 years.
1. On average, how long does it take for Earth to complete a full reversal?
2. If you were using a compass to navigate at the time when Earth’s poles were reversing, how would this affect the direction you were taking?
3. Research and describe how nature uses Earth’s magnetic field.
4. Research and discuss the consequences of Earth’s magnetic field weakening for a significant period when it reverses.
Making thinking visible 6.2
Connect, extend, challenge: the auroras
The upper atmosphere of the Sun generates a stream of charged particles called the solar wind.
The Aurora Borealis and Aurora Australis are natural phenomena that occur when charged particles from the Sun, also known as solar wind, interact with Earth’s magnetic field and atmosphere. These interactions cause particles in the atmosphere to emit light, creating the colourful displays that we know as the Northern Lights and Southern Lights.
UNCORRECTEDSAMPLEPAGES
These lights are typically visible in the high-latitude regions near Earth’s magnetic poles, including northern Scandinavia, Alaska, Canada and Russia for the Aurora Borealis, and southern Australia, New Zealand and Antarctica for the Aurora Australis. However, during particularly intense geomagnetic storms, the lights can sometimes be seen at lower latitudes as well.
The colours of the auroras depend on the altitude of the aurora, the gas that is being excited and the energy of the particles in the solar wind. Green is the most common colour. Other colours that can be seen include pink, red, yellow, blue and purple.
Consider what you have just read and answer the following questions:
• How do the concepts and details connect to your existing knowledge about auroras?
• Which new insights did you gain from the text that extended your understanding or encouraged you to consider new perspectives?
• What questions do you have after thinking about this information?
Figure 6.17 The next switching of Earth’s magnetic field is overdue.
The Connect, extend, challenge thinking routine was developed by Project Zero, a research centre at the Harvard Graduate School of Education.
Figure 6.18 Solar wind interacting with Earth’s magnetic field
Figure 6.19 The Aurora Borealis
Further evidence to support the notion of seafloor spreading comes from the age of the rocks on the sea floor. If new rock is forming at the ridge and spreading out equally in opposite directions, you would expect that as you move further away from the ridge, the rock would increase in age. This is exactly what Vine, Matthews and Morley found.
Quick check 6.3
1. Identify the name of the mineral in molten rock that is magnetic.
2. Discuss what happens to this magnetic mineral when the molten rock cools.
3. Describe how the presence of magnetic stripes in rocks parallel to ocean ridges prove that the sea floor was spreading.
4. State the other piece of evidence that supports Hess’s theory of seafloor spreading.
Practical 6.1
making a compass
Aim
To make a simple compass
Materials
• 250 mL beaker half full of water
• needle
• small square of paper
• bar magnet
Method
1. Draw the results table below.
2. Thread the needle through the small square piece of paper as shown above.
3. Stroke the needle 20 times with the bar magnet. You must stroke in one direction only and with one end of the magnet only.
4. Put the piece of paper with the needle into the water, making sure that it floats.
5. Record in the results table the direction that the needle points.
6. Turn the beaker 90° and record the direction that the needle points in the results table.
7. Turn the beaker a further 90° and again record the direction in the results table.
Results
Direction
Discussion
UNCORRECTEDSAMPLEPAGES
First positionRotated 90° Rotated a further 90°
1. Describe what happened to the magnetised needle when the beaker of water was rotated.
2. Explain the role of the paper in this experiment.
3. The needle in this experiment is acting as a temporary magnet. What is a temporary magnet and how does it differ from a permanent magnet?
4. Discuss the importance of having the needle magnetised only in one direction.
Try this 6.1
modelling seafloor spreading
1. Get a piece of paper and re-create the diagram below, which shows Earth’s magnetic field changing over time from the present (centre) to the distant past (left and right edges).
2. Fold the paper in half in the middle of the section labelled ‘Present’.
3. Put the paper into a gap between two tables with the two short ends of the paper on the tables’ edges and the remainder of the paper dropping down into the gap. Push the tables together so that the gap is closed and most of the paper cannot be seen.
4. Pull apart the ends of paper to show the movement of the sea floor away from an ocean ridge. You have just modelled seafloor spreading!
Section 6.1 questions
Remembering
1. Name the theory proposed by each of the following scientists.
a) Alfred Wegener b) Harry Hess
Understanding
2. Recall the piece of evidence that supported Harry Hess’s theory.
3. Describe one piece of evidence that Wegener used to back up his theory.
4. Explain why Wegener’s theory was not accepted during his lifetime.
6. Describe how sonar works in relation to ocean-floor mapping.
7. Summarise the evidence that supports Harry Hess’s theory of seafloor spreading.
5. Communicate using labelled diagrams the results of Marie Tharp’s mapping of the ocean floor.
Applying
8. Organise these major discoveries (A–E) on the movement of continents into chronological order (the earliest first).
A Harry Hess states that the sea floor is spreading outwards from mid-ocean ridges.
B Alfred Wegener outlines his theory of continental drift, stating that all the continents were once part of a large land mass, which has split up and drifted apart.
UNCORRECTEDSAMPLEPAGES
C The age of rock confirms that new rock is forming at mid-ocean ridges.
D Magnetic striping patterns in the ocean rock confirm that new rock is constantly forming.
E Marie Tharp maps the ocean floor and confirms that it contains deep valleys and ridges.
Analysing
9. Distinguish between magnetic striping and magnetic field reversal.
10. Compare the properties of oceanic rock as you move away from a mid-ocean ridge.
11. Classify the following as theory or evidence.
a) The sea floor spreads away from a mid-ocean ridge.
b) The rock is older the further away it is from a ridge.
c) The continents drifted away from one another.
d) Rock types on different continents match up with one another.
Evaluating
12. Deduce what would happen to a compass if Earth’s magnetic field was to change direction now.
13. Justify by use of a diagram that Earth’s magnetic field has switched over time.
14. With the examples of Alfred Wegener and Harry Hess, evaluate the impact of currently accepted scientific ideas on the willingness to adopt new theories.
15. Discuss the role that Marie Tharp’s maps played in the theory of plate tectonics.
6.2 Plate tectonics and plate movement
Learning goals
At the end of this section, I will be able to:
1. Describe the development of the theory of plate tectonics and evidence supporting the theory.
2. Investigate the relative significance of different forces involved in tectonic plate movement.
3. Describe the consequences of three types of plate boundaries.
4. Model interactions at plate boundaries.
With the help of Marie Tharp, Harry Hess, Frederick Vine, Drummond Matthews and Lawrence Morley, evidence for Wegener’s theory of continental drift was mounting. But in order to explain how the continents moved, scientists needed to understand more about the structure of Earth.
Earth’s geosphere is made up of four layers: the crust, mantle, outer core and inner core. The mantle is divided into a lower and upper mantle. The lithosphere consists of the topmost layer of the upper mantle, which is solid, and the crust. The asthenosphere is the softer layer of rock in the upper mantle, under the lithosphere.
The inner core is made up of heavy metals like iron and nickel. Even though the temperatures in the inner core are hotter than the surface of the Sun, these metals are in solid form due to the intense pressure from all the layers above. The outer core is completely liquid and, like the inner core, contains heavy metals. The mantle is mostly made of semi-molten rock and is quite dense, though not as dense as the metal core. The crust is the thinnest layer and supports all the life on Earth. It is made of two different types: oceanic and continental crust. Oceanic crust is much thinner and denser than continental crust and supports the world’s oceans. The continents and continental shelves make up the continental crust.
UNCORRECTEDSAMPLEPAGES
geosphere the parts of Earth that are solid (e.g. the mantle and crust)
crust the solid outer layer of Earth that supports all life on Earth
mantle the layer of Earth underneath the crust that is made up of solid and semi-molten rock and surrounds the outer core core the inner part of Earth’s structure lithosphere the solid outer layer of Earth consisting of the crust and top layer of the upper mantle; it is split into giant slabs called tectonic plates
Site of tectonic
asthenosphere the softer layer of rock under the lithosphere
movement
plate tectonics the theory that Earth’s lithosphere is broken up into many pieces called tectonic plates and that they are moved by convection currents in the mantle
tectonic plates giant slabs of rigid rock that float on the partially molten rock below Earth’s surface and make up the lithosphere
Did you know? 6.2
the innermost inner core
In 2023, scientists also proposed a fifth layer, the innermost inner core. Geoscientists first hypothesised that Earth’s core might have an additional layer twenty years ago, but new research has finally provided evidence. The new layer was detected using data collected by measuring the seismic waves of earthquakes as they passed through Earth’s centre.
Scientists need to focus on Earth’s lithosphere to explain how continents move. Scientists first proposed the theory of plate tectonics in the late 1950s and early 1960s. They said that Earth’s surface is composed of tectonic plates, gigantic slabs of rigid rock, which float on the partially molten rock below Earth’s surface.
Quick check 6.4
1. List the layers of Earth from the surface to the centre of Earth.
2. State the name given to the giant slabs of rock that make up Earth’s lithosphere.
3. Describe the differences between oceanic and continental crusts.
tectonic plates
Tectonic plates are massive pieces of Earth’s lithosphere, which is the outermost and rigid layer of the planet. The lithosphere is divided into several large plates that float on the partially molten rock below. Tectonic plate movement is driven by several forces, including slab pull, ridge push and convection in Earth’s mantle.
As you can see from Figure 6.21, the major tectonic plates are named after the continents that lie on them. Australia is situated in the middle of the Australian plate, which is largely the reason why Australia does not experience significant geological activity. You will find out more about this in the next section. There are a few major plates and dozens of smaller or minor plates. No matter how small, every tectonic plate plays a role in shaping Earth. One of the smallest plates, the Juan de Fuca plate located off the eastern coast of North America, is largely responsible for the volcanic activity there.
How do the plates move?
Slab pull is the force that results from the sinking of a dense oceanic tectonic plate into the mantle at a subduction zone, an area where one plate sinks into the mantle. This sinking motion generates a pulling force on the rest of the plate, causing it to move towards the subduction zone.
Ridge push is the force that results from the elevated position of the oceanic ridges. As new magma rises to fill the gap created by the separating plates, the ridge pushes the plate away from it.
Ridge push
Plate is pushed away from the ocean ridge
UNCORRECTEDSAMPLEPAGES
Slab pull
Plate is pulled by the weight of its cold, dense subducting section
Plate is dragged by the convection current in the
slab pull the pulling force exerted by a cold, dense oceanic plate plunging into the mantle due to its own weight subduction zone the area where a collision between two of Earth’s tectonic plates causes one plate to sink into the mantle underneath the other plate ridge push a force that causes a plate to move away from the crest of an ocean ridge and into a subduction zone convection currents the transfer of heat due to temperature differences between the upper and lower layers of Earth’s mantle, causing movement of rocks within the mantle
6.23
pull, ridge push and convection currents all cause tectonic plates to move.
Convection in the mantle is the process by which heat is transferred from Earth’s interior to the surface. The temperature increases as you move down through the mantle and get closer to the core. The core is thousands of degrees hotter than the surface of Earth. The heat is generated by radioactivity in the core and heats the rock in the lower mantle, causing it to become less dense and rise towards the crust. As it rises towards the cooler surface, it begins to cool down and become denser. It is pushed aside by the hot rock that is still rising below it and eventually falls back towards the core, as shown in Figure 6.22. This cycle of hot rock rising and cooler rock sinking is called a convection cycle and creates convection currents in Earth’s lower mantle.
Cool rock Hot rock
Figure 6.22 Convection currents in Earth’s mantle drive the movement of the tectonic plates.
Ocean trench
Crust
Ocean
Hotter mantle rises
Cooler mantle sinks
Ocean ridge
mantle
Convection currents
Mantle
Figure
Slab
Quick check 6.5
1. Recall what the major tectonic plates are named after.
2. Describe the differences in structure between the rocks in the upper and lower mantle.
3. Explain why hot rock rises.
4. Describe how this movement of rocks in the mantle drives the movement of tectonic plates.
UNCORRECTEDSAMPLEPAGES
Observing convection currents
Aim
To observe convection currents
Materials
• dark food colouring
• cold water
• 250 mL beaker
• ice cube trays
• Bunsen burner
• gauze mat
• tripod
• heatproof mat
Method
1. Mix 100 mL of water with some food colouring in a beaker (the darker the coloured water the better).
2. Pour this mixture into the ice cube trays and place the trays in a freezer until the water has frozen.
3. Half fill a 250 mL beaker with cold water.
4. Set up your equipment as shown in the diagram.
5. Set the Bunsen burner to a blue flame and concentrate the heat on one corner of the beaker.
6. Drop an ice cube into the beaker and observe the water.
Results
Record your observations.
Discussion
1. Describe what happened to the ice cube when it hit the warm water.
2. Describe the distribution of the coloured water from the ice cube just after it had melted.
3. Explain what you observed.
4. Discuss what happened to the distribution of the coloured water from the ice cube as the Bunsen burner heated up the water.
5. Explain what you observed.
6. Describe and explain the appearance of the water at the end of the experiment.
7. Draw a labelled diagram to show what was happening to the water in the beaker.
Practical 6.2
Cold water
Beaker
Tripod
Bunsen burner
Gauze mat
Heatproof mat
Figure 6.24 Experimental set-up
how fast is australia moving?
Australia is situated in the middle of the Australian plate. Since the last adjustment was made to Global Positioning System (GPS) coordinates in 1994, the continent has moved 1.5 m. That’s about seven centimetres a year. In contrast, the North American plate has been moving roughly 2.5 cm a year. This means that maps drawn after 1994, but still using the pre-1994 data, do not show Australia in its correct position for the time the map was drawn, let alone today. Older maps are even more out in their placement of Australia. Corrections to its geographical location have been made four times over the past 50 years. However, because continents move so slowly, most maps do not need to be updated for continental drift. Look at the map in Figure 6.25 and you will see that 1.5 m would make little observable difference to its location on the map. It is only important to the mapping systems, such as the GPS used worldwide for navigation, and other applications that rely on very accurate mapping, such as traffic signal timing and synchronisation of mobile phone base stations.
GPS Global Positioning System, a radio navigation system that allows land, sea and airborne users to determine their exact location, velocity and time
UNCORRECTEDSAMPLEPAGES
Try this 6.2
Constructing a timeline
Construct a timeline of evidence to show the development of the theory of plate tectonics.
What happens at plate boundaries?
You have learned that convection currents in Earth’s mantle cause the tectonic plates floating on top to move in different directions. The direction of plate movement causes different types of plate boundaries to form. Figure 6.26 shows the major tectonic plates and the direction they are travelling. There are three types of plate boundaries: destructive (convergent, plates move towards each other), constructive (divergent, plates move away from each other) and transform (conservative, plates slide past each other).
boundaries plate boundaries the edges where two tectonic plates meet
Figure 6.25 Maps drawn using GPS data from before 1994 do not show Australia in its correct geographical location due to the relatively fast movement of the Australian plate.
6.26 The major tectonic plates and their direction of travel. The small triangles on the lines indicate a convergent plate boundary.
Explore! 6.3
the Chile triple Junction
The Chile Triple Junction is located on the sea floor of the Pacific Ocean off the southern coast of Chile. Use the internet to answer the following questions.
1. List which three major tectonic plates meet at the Chile Triple Junction.
2. Discuss why the triple junction is unusual.
UNCORRECTEDSAMPLEPAGES
Figure
Caribbean plate
Cocos plate
Nazca plate
South American
Scotia plate
Antarctic plate
Figure 6.27 The Chile Triple Junction
Destructive boundaries
A destructive plate boundary occurs when plates are moving towards each other. The plates are colliding, so they are also called convergent plate boundaries. The effects and the features that form at these boundaries depend on what the two plates are made from. You have already learned that there are two types of crust: oceanic and continental. Oceanic crust is thin and dense; in comparison, continental crust is thicker and less dense. So, what happens when plates with two different types of crust on top of the upper mantle collide?
Quick check 6.6
1. Describe the movement of plates at a destructive plate boundary.
UNCORRECTEDSAMPLEPAGES
6.28 A destructive, or convergent, plate boundary
2. Recall what factor affects the features that form at this type of plate boundary.
When an oceanic plate meets a continental plate
The rocks in the oceanic crust are denser than the rocks in the continental crust, so when they collide, the denser oceanic plate will sink beneath the continental plate in a process called subduction. As the oceanic plate moves down into the mantle, it begins to melt, forming magma This magma can rise up through the continental plate to form volcanoes.
plate
6.30 The Hikurangi subduction zone is located off the coast of New Zealand’s North Island.
The Hikurangi subduction zone located off the east coast of the North Island of New Zealand has formed because of the subduction of the Pacific plate underneath the Australian plate. It poses the largest threat of earthquakes and tsunamis to the residents of New Zealand.
Mountains and deep ocean trenches form at a convergent or destructive boundary. For example, the Andes Mountains on the west coast of South America continue to grow in size because the Nazca oceanic plate is subducting beneath the South American continental plate.
Figure 6.31 The Andes Mountains in South America formed due to the subduction of the Nazca plate underneath the South American plate.
Figure
Figure 6.29 A subduction zone forms when the denser oceanic plate subducts underneath the less dense continental plate.
Figure
When two continental
plates meet
In this case, both plates have the same density, so when they collide, subduction does not take place. Instead, the pressure of the collision tends to force the crust upwards from both plates. Mountains are formed but without volcanoes, as is the case for subduction.
Mountainrange
The Indian plate and the Eurasian plate are colliding in this type of boundary. These plates collided over 50 million years ago, causing a huge uplift of the land and forming the Himalayan Mountain range, the highest mountain range in the world.
When two oceanic plates meet
Several things may happen when two oceanic plates meet. If one plate is less dense than the other, a subduction zone will be created. If they are equal in density, the collision may create a ridge instead, potentially forming islands.
1. State the term that describes the action of one plate sinking underneath another.
2. List some of the features that can form at destructive plate boundaries.
3. Discuss why subduction does not take place when two continental plates collide.
mount Everest is getting taller
As the Eurasian and Indian plates are constantly moving towards each other, Mount Everest –the highest mountain in the world at 8849 m tall – is actually getting taller each year, by four millimetres in fact. If your ambition is to climb Mount Everest, then you had better do it sooner, rather than later, if you do not want to have to climb even further!
Figure 6.32 The formation of mountains when two continental plates collide
Figure 6.33 The Himalayan Mountain range, the highest in the world, was formed and is continuing to form at a destructive plate boundary.
how dense are different rocks?
Aim
To compare the densities of different rock types
Materials
• 4 different types of rock (basalt, granite, sandstone and chalk)
• 10 mL measuring cylinder
• displacement can
• balance
Method
1. Draw the results table below.
2. Measure the mass of each rock type and record in your results table.
3. Fill the displacement can with water.
4. Holding the 10 mL measuring cylinder at the spout of the displacement can, gently drop in one of the rocks.
5. Record the volume of water expelled in cubic centimetres (cm3) in the results table. (Note: 1 mL = 1 cm3)
6. Repeat twice more with the same piece of rock, refilling the can before each procedure.
7. Following the same procedure, repeat for the other rock types.
8. Calculate the average volume of water expelled from the displacement can.
9. Using the formula below, calculate the density of each rock type.
density (g/cm3) = mass (g) volume (cm3)
UNCORRECTEDSAMPLEPAGES
Results
Basalt
Granite
Sandstone
Chalk
Discussion
1. Organise the rocks from most dense to least dense.
2. Using your results, explain why oceanic crust made of basalt subducts underneath continental crust made predominantly of granite at destructive plate boundaries.
3. Explain why the experiment was conducted three times for each rock type.
4. Explain why you should always measure at the bottom of the meniscus when measuring water levels.
5 Compare the density of each rock that you calculated to densities obtained from secondary sources on the internet. How close were you to those values?
constructive (divergent)
a type of plate boundary that occurs when plates move away from one another
rift valley an elongated depression in Earth’s surface formed by the separation of tectonic plates
Constructive boundaries
Plates moving away from one another are called constructive plate boundaries. They are also widely known as divergent plate boundaries and can occur beneath the ocean or on land.
In the ocean
At constructive plate boundaries, plates move apart.
UNCORRECTEDSAMPLEPAGES
When plates move apart in the ocean, magma (molten rock) rises to fill the gap. As it reaches the colder surface, the magma cools, forming igneous rock and gradually building more oceanic crust. The Mid-Atlantic Ridge, a series of underwater volcanoes running down the Atlantic Ocean between Africa and America, is an example of this type of plate boundary. Here, the North American and South American plates are moving away from the Eurasian and African plates.
6.36 The Laki crater row in Iceland that opened during the eruptive period of 1783–1784 is part of a volcanic fissure running through the country, which is situated on the tectonic plate boundaries of the Mid-Atlantic Ridge.
On land
Constructive plate boundaries that occur on land form rift valleys. An active rift valley is currently separating the Horn of Africa from the rest of Africa. This rift valley will eventually be filled with water when it drops below sea level, creating a new island. It is already having damaging effects, with major roads in cities cracking and caving under the strain. Scientists think the rift valley is moving so fast due to a superplume. A superplume occurs when heat from Earth’s core rises up through the mantle, intensifying the convection currents and causing the plates to separate much faster.
Figure 6.34
Figure 6.35 A volcanic crater of basalt rocks near Portugal
Figure
Quick check 6.8
1. Describe the movement of plates at a constructive plate boundary.
2. List some of the features that can form at this type of boundary.
3. Recall why constructive plate boundaries are also known as divergent boundaries.
Transform boundaries
At transform plate boundaries, plates are moving parallel to one another, but in opposite directions. Crust is neither created nor destroyed, so they are sometimes called conservative plate boundaries. When plates move in this way, a tremendous amount of pressure can build up due to friction, which stops the plates from moving. When the force of the plate movement overcomes the friction, the pressure is released and an earthquake occurs as the plates move suddenly. An example of a transform plate boundary is the San Andreas Fault, which runs down the east coast of North America through California. Here, the North American plate and the Pacific plate are sliding past each other.
VIDEO Causes of earthquakes transform (conservative) a type of plate boundary that occurs when plates move parallel to one another
UNCORRECTEDSAMPLEPAGES
6.37 At transform plate boundaries, plates slide past one another.
1. Describe the movement of plates at a transform plate
2. List one of the characteristics of this
3. Recall why transform plate boundaries are also known as conservative boundaries.
Figure
Figure 6.38 The San Andreas Fault is the boundary between the North American and Pacific plates.
Figure 6.39 Earthquakes occur at transform boundaries. The earthquake that occurred at the San Andreas Fault in 1906 caused this fence to separate by a huge distance.
Try this 6.4
tectonic plate simulations
Use the internet to navigate to Tectonic Explorer by The Concord Consortium. This is a computer model of a plate system on a fictional Earth-like planet. Use it to simulate multiple plate system scenarios and observe the different types of plate interactions responsible for patterns of events and landforms observed on Earth’s surface.
Table 6.1 summarises each type of plate boundary.
Type of boundary interaction
Destructive (convergent)
Constructive (divergent)
Transform (conservative)
UNCORRECTEDSAMPLEPAGES
Diagram
Type of movement
Plates move towards each other
Plates move away from each other
Plates move parallel to each other in opposite directions
What happens to the crust?
Key features
Destroyed Mountains
Trenches
Subduction zones
Volcanoes Earthquakes
Created Volcanoes Rift valleys Ocean ridges
ConservedEarthquakes
Try this 6.5
modelling plate boundaries
You can model plate boundaries in different ways. Your teacher can provide you with a range of materials for you to explore modelling interactions at plate boundaries.
Table 6.1 A summary of each type of plate boundary
Figure 6.40
Section 6.2 review
Online quiz
Section questions
Section 6.2 questions
Remembering
1. Name the three types of plate boundaries.
Teachers can assign tasks and track results
2. State the name of the mechanism that causes tectonic plates to move.
3. Select the correct words to label the following diagram of the structure of Earth.
Go online to access the interactive section review and more!
UNCORRECTEDSAMPLEPAGES
4. Name a real-life example of each of the three types of plate boundaries.
5. Name two types of crust.
6. Identify the type of plate boundary where the following features would occur. a) trenches
b) mountains
c) earthquakes d) volcanoes
Understanding
e) ridges
f) rift valleys
g) subduction zones
7. Describe how temperature affects the structure of rocks in the mantle.
8. Explain why the physical states of the inner and outer core differ.
9. At destructive plate boundaries, crust is destroyed. Explain why the overall amount of crust on Earth has stayed the same despite this destruction.
10. Summarise how magma forms at a subduction zone.
Applying
11. Compare oceanic and continental crusts.
Evaluating
12. Propose why mountains and trenches continue to increase in size.
13. Construct a labelled diagram to show an oceanic plate subducting underneath a continental plate.
14. Propose reasons why countries like Australia do not experience significant amounts of geological activity.
15. Discuss why tectonic plates move across the surface of Earth.
16. Propose your own reasons why some tectonic plates move faster than others.
17. Discuss the evidence that led to the acceptance of the theory of plate tectonics as a development of the earlier idea of continental drift.
Uncorrected 2nd
6.3 The effects of plate movement
Learning goals
At the end of this section, I will be able to:
1. Describe how volcanoes, earthquakes and tsunamis form.
2. Distinguish between S and P waves and the information they provide about earthquakes.
3. Examine patterns of earthquake and volcanic activity over time and propose explanations.
4. Relate the extreme age and stability of a large part of the Australian continent to its plate tectonic history.
5. Research Aboriginal and Torres Strait Islander Peoples’ cultural accounts that provide evidence of earthquakes and volcanoes.
If you live near a plate boundary, you are at risk of experiencing some of the geological activity discussed. In this section, you will examine the reasons for, and effects of, three types of natural disasters that can occur at plate boundaries. volcanoes
Where do volcanoes form?
Volcanoes can form at two types of plate boundaries. When two plates move apart at a constructive plate boundary, magma rises and seeps into the gap, as in Figure 6.41.
At a destructive boundary (particularly at subduction zones), friction caused by one plate subducting underneath another produces intense heat. This heat is enough to melt the rock of the subducting plate, forming magma. As the magma rises to the surface, it will form volcanoes.
When this magma erupts at the bottom of the sea, it can make a chain of volcanoes called island arcs. Figure 6.42 shows the island arc of the Aleutian Islands in the northern Pacific Ocean. They are made up of a long chain of volcanoes associated with the Aleutian Trench.
Figure 6.41 A volcano forms at a constructive plate boundary where magma rises to fill the gap when the
6.43 The Ring of Fire is an active area of many subduction zones around the Pacific Ocean.
Over three quarters of the world’s active volcanoes can be found in an area called the Pacific Ring of Fire, the shape of which can be seen in Figure 6.43.
Volcanoes are unique geological features in that they do not always occur where two plates meet. They can form anywhere that a hotspot exists. A hotspot is a pocket of magma that sits just underneath the crust. It has the potential to erupt at any time, forming volcanoes. As the tectonic plate above the hotspot moves, the volcano created by the hotspot also moves, allowing for another hotspot volcano to form. Chains of volcanic islands like the Hawaiian islands have been made in this way.
NW
Seamount
Ni’ihau Kaua’i (5.6-4.9 Ma)
UNCORRECTEDSAMPLEPAGES
O’ahu (3.4 Ma)
(1.8 Ma)
PLATE
Ma)
Motion of Pacific plate drags the plume head
Ma)
6.44 The Hawaiian island chain formed as the Pacific plate moves across a hotspot. The oldest island, Ni'ihau, formed around 5.6 million years ago (Ma) and the top of the newest volcano, Lo'ihi, is less than 1000 m below the sea surface.
Island hotspots
hotspot a pocket of magma that sits just underneath the crust
Figure
Moloka’i
Maui (1.3
Hawai’i (0.7–0
Mauna Loa Kilauea Lõ’ihi
The Hawaiian Hotspot
Volcanoes are progressively older
Figure
VIDEO
Quick check 6.10
1. Recall the type of plate boundaries where volcanoes occur.
2. State the name of the area of the world that contains the greatest number of active volcanoes.
3. Discuss what hotspot volcanoes are and how they differ from volcanoes formed in other ways.
UNCORRECTEDSAMPLEPAGES
What happens during a volcanic eruption?
When the pressure of the magma rising to the surface increases quickly, a volcano can erupt. When magma reaches the surface, it is called lava. The type of lava produced by a volcano makes a huge difference to the effects of a volcanic eruption. Lava with large amounts of silica is viscous (thick and sticky) like golden syrup. Air pockets can build up in viscous lava leading to a very explosive eruption. Lava that contains a small amount of silica is less viscous, but it will travel further from an eruption, putting larger areas at risk.
Lava is not the only hazard of a volcanic eruption. Gas and ash clouds, acidic gas causing acid rain and pyroclastic flows, as shown in Figure 6.46, made up of hot gas and rock can also cause major damage, not only to the surrounding areas but across the world.
Figure 6.45 The viscosity of the lava has a huge effect on the damage caused by a volcanic eruption.
Figure 6.46 Pyroclastic flows from the eruption of the Sinabung volcano in Indonesia in October 2017 lava molten rock from inside Earth (magma) that has reached the surface
Quick check 6.11
1. Distinguish between magma and lava.
2. Explain how the viscosity of lava affects a volcanic eruption.
UNCORRECTEDSAMPLEPAGES
Explore! 6.4
Oral traditions about earth movements
Aboriginal and Torres Strait Islander Peoples have a deep and rich cultural history that includes detailed oral traditions and songs that are passed down unbroken from generation to generation. Many of these accounts provide evidence of earthquakes and volcanoes that have occurred in Australia over thousands of years.
According to oral traditions of the Gunditjmara People, in ancient times, four enormous giants arrived in the south-eastern region of Australia. While three of them departed to other parts of the continent, the fourth remained still and transformed into a volcano that came to be known as Budj Bim. The lava that spewed forth from the volcano was formed from the giant‘s teeth.
Recent scientific findings have uncovered evidence to support the timing of this account, which is passed down through generations by the Gunditjmara People. The evidence indicates that Budj Bim, along with another nearby volcano, emerged roughly 37 000 years ago because of a swift succession of eruptions. This discovery suggests that the oral tradition could be the oldest story still in circulation today.
Research the scientific basis of the Gugu Badhun oral traditions that recount ‘the earth being on fire along watercourses’ and ‘a time when a witchdoctor made a pit in the ground and lots of dust in the air, causing people to get lost in the dust and die’.
Figure 6.47 A nineteenth century drawing of the lake in the crater at the top of Budj Bim
Figure 6.48 For thousands of years, the Gugu Badhun People have lived in the upper Burdekin River valley in Northern Queensland. Uncorrected 2nd sample
Explore! 6.5
the hunga tonga–hunga ha‘apai volcanic eruption in 2022
In January 2022, the Hunga Tonga–Hunga Ha‘apai volcano erupted underwater with a force that caused a 15 m tsunami that demolished homes and killed at least three people in Tonga.
The eruption also damaged undersea communication cables, cutting Tonga off from the rest of the world for weeks and delaying efforts to help the victims.
Complete some research and answer the questions.
UNCORRECTEDSAMPLEPAGES
1. What did the eruption rate on the Volcanic Explosivity Index?
2. The eruption was equivalent to a historical volcanic eruption that took place in 1883. Where did this occur?
3. What records were broken by the volcanic eruption?
4. Explain whether volcanic eruptions only affect the surrounding area. Use this case study as an example in your answer.
5. Using the tsunami travel time map shown in Figure 6.50, determine the tsunami travel time to the East Coast of Australia.
Figure 6.49 This satellite image shows the volcanic ash thrown out of Hunga Tonga–Hunga Ha'apai volcano in 2022, from the force of the eruption.
Figure 6.50 Tsunami travel time map of the Hunga Tonga–Hunga Ha’apai volcano eruption and tsunami, 15 January 2022
Earthquakes
Where do earthquakes occur?
Earthquakes occur when there is a sudden movement of land. This can happen at a transform, constructive (divergent) or destructive (convergent) plate boundary. Friction between two plates must be overcome before the plates can slide past each other. When the driving force is strong enough to overcome this friction, the two plates will suddenly move, sending out waves of energy called seismic waves. The exact point under Earth where the earthquake occurs is called the focus The point directly above the focus, on the surface of Earth is called the epicentre.
seismic wave a wave that moves through Earth during an earthquake focus the exact point under the surface of Earth where the earthquake occurs epicentre the location on Earth’s surface directly above the focus of an earthquake seismometer an instrument that measures the intensity and duration of seismic waves during an earthquake seismogram the pattern produced when seismic activity is recorded by a seismometer
How are earthquakes detected?
Earthquakes are detected using an instrument called a seismometer. A simple seismometer is shown in Figure 6.52. Its basic structure uses a weight hanging from a spring suspended from a frame that moves along with the motion of Earth. A rotating drum is attached to the frame and a pen is attached to the weight.
When the land moves from side to side, the base remains fixed to the ground and moves with it, but the mass on the end of the spring stays in its original position. It is not affected by the movement of the ground. The pen attached to the mass records the movement of the box in relation to the stationary mass. The resulting pattern is called a seismogram. Note that digital seismometers are also available for many smartphones.
WORKSHEET
Earth’s surface
Epicentre
waves
Figure 6.51 A diagram showing the location of an earthquake’s focus and epicentre
Figure 6.53 A seismogram
The two main types of seismic waves produced by an earthquake are primary (P) waves and secondary (S) waves (see Figure 6.54). The properties of these waves are summarised in Table 6.2.
Name
Movement
Materials they can travel through
Level of damage caused
Table 6.2 The properties of
UNCORRECTEDSAMPLEPAGES
Longitudinal (back and forth)Transverse (side to side or up and down)
Liquids and solids
Solids only
Minimal damage causedVery destructive due to sideto-side movements
As P waves are the faster of the two waves, they are detected by the seismometer first. The first seismic activity detected by the seismometer on the seismogram in Figure 6.55 is the P wave. The S waves are slower and so arrive second. S waves are also the most intense and so register larger movements on the seismogram.
Lag time – the time between the arrival of the P and S waves
Lag time – the time between the arrival of the P and S waves
UNCORRECTEDSAMPLEPAGES
1. Identify the two plate boundaries at which earthquakes occur.
2. Recall why they occur at these boundaries.
3. Recall the name given to the part of Earth where the earthquake is generated.
4. State the name of the equipment used to detect seismic activity.
5. Recall which type of seismic wave is faster and therefore first to arrive during an earthquake. Earthquake focus
Explore! 6.6
how do P and s waves give us evidence for the structure of Earth?
The properties of P waves and S waves generated by an earthquake can be used to determine the properties of the layers of Earth. In 1936, Danish scientist Inge Lehmann discovered that Earth has a solid inner core inside a molten outer core after she analysed data from seismic stations around the world. She noticed some irregularities in the data that disproved the accepted idea that the core was entirely molten. It wasn‘t until 1970 that her theory was confirmed!
P waves detected S waves detected
1. What can you conclude about the movements of P and S waves through Earth using the diagram in Figure 6.56?
2. Interpret the properties of the seismic waves listed in Table 6.2 to make conclusions about the physical properties of the outer core and the mantle.
3. When P waves travel through the inner core and outer core they appear to bend. Discuss why you think this is.
4. What is the S wave shadow zone? Deduce why it occurs.
Figure 6.55 A seismogram of seismic activity within Earth
Quick check 6.12
S wave shadow zone
Figure 6.56 The pattern of seismic activity away from an earthquake’s focus
Figure 6.57 Inge Lehmann
Richter scale a system used to measure the strength of an earthquake
tsunami a great wave produced by an earthquake or volcanic eruption in the ocean
The effects of earthquakes
The severity of an earthquake is measured using the Richter scale: the more severe the earthquake, the higher the number on the Richter scale. The Richter scale is a logarithmic scale. This means that an earthquake measured as four on this scale is ten times more severe than an earthquake measured at three.
Did you know? 6.4
the largest earthquake on record
The largest earthquake ever recorded occurred in Chile on 22 May 1960. It was recorded at 9.5 on the Richter scale. The earthquake killed 1655 people and displaced more than two million people from their homes.
tsunamis
A tsunami is a devastating natural disaster that can cause massive destruction to coastal areas. The primary cause of a tsunami is an underwater earthquake or volcanic eruption that generates a large amount of energy, resulting in massive waves. The movement of Earth’s tectonic plates can cause an underwater earthquake, which can displace large amounts of water and create a series of waves that can travel long distances. Similarly, a volcanic eruption can cause an underwater landslide or an explosive release of gas, which can trigger a tsunami.
UNCORRECTEDSAMPLEPAGES
On Boxing Day 2004, an earthquake was measured in the Indian Ocean at 9.1 on the Richter scale. The tsunami waves produced following this earthquake reached up to 15 m high in some places near to land and affected more than 14 different countries. A quarter of a million people died, and two million people were left homeless.
Figure 6.58 Tsunami waves breaching the embankments after an earthquake measuring 9.0 on the Richter scale occurred off the coast of northern Japan in 2011.
Figure 6.59 An aerial view of the devastation caused by the Boxing Day tsunami in 2004
Figure 6.60 A Hawaiian tsunami evacuation zone, located 260 m above sea level
Quick check 6.13
1. Determine how many times more intense a magnitude 7.0 earthquake is, compared to a magnitude 5.0 earthquake on the Richter scale.
2. Explain what a tsunami is and how it forms.
UNCORRECTEDSAMPLEPAGES
Is australia at risk?
The extreme age and stability of a large part of the Australian continent can be attributed to its plate tectonic history. Unlike other continents, such as the Americas, Africa and Europe, Australia is in the centre of a tectonic plate, the Australian plate, which means that it is not affected by the boundary interactions of multiple plates and not directly at risk from major earthquakes and volcanoes.
The Australian plate, which encompasses the entire continent and parts of the surrounding ocean, has been relatively stable for hundreds of millions of years. The Australian plate is surrounded by several relatively inactive plates, including the Antarctic plate, the Pacific plate and the African plate.
The age of the Australian continent is also a contributing factor to its stability. Much of the continent is made up of ancient cratons, which are large areas of stable, ancient rocks that have not been affected by tectonic activity for billions of years. These cratons make up the core of the continent and have provided a stable foundation for the younger sedimentary rocks and soils that cover much of the continent.
The Australian plate is moving and colliding with the plates at its northern boundary. This results in a significant amount of pressure building up, which can cause earthquakes in Australia. As a result, although Australia is more stable than other continents, it still has more earthquakes than other regions that sit in the middle of tectonic plates.
craton the stable interior portion of a continent
Figure 6.61 Rescue workers trying to find survivors under the rubble beneath the Kent Hotel in Hamilton, Newcastle, NSW, after the 1989 magnitude 5.6 earthquake that killed 13 people
The Ellendale volcanic region, located in the Kimberley region of Western Australia, is famous not only for its volcanic rocks but also for being a source of diamonds. The volcanic rocks in the area, mainly basalt, were formed by eruptions that took place around 1.8 billion years ago. These eruptions brought volcanic materials to the surface, including kimberlite pipes, which are known to contain diamonds. Over millions of years, the diamonds in these pipes have been weathered and transported by rivers, sometimes ending up in the region’s soil. The volcanic activity in Ellendale was part of a larger geological event that involved tectonic plate movements, allowing magma to rise and form these valuable deposits. The Ellendale diamond field has been a significant source of high-quality yellow diamonds, making the region important both geologically and economically.
UNCORRECTEDSAMPLEPAGES
Figure 6.62 You can find yellow diamonds in Ellendale, located in the West Kimberley region of Western Australia. The Ellendale mine contributes approximately 50% of the world's yellow diamonds.
Figure 6.63 The last significant volcanic activity on the Australian continent occurred over 4000 years ago, at Mount Gambier in South Australia.
Go online to access the interactive section review and more!
Section 6.3 review
Online quiz
Section 6.3 questions
Remembering
Section questions
Teachers can assign tasks and track results
UNCORRECTEDSAMPLEPAGES
1. Recall the name for the volcanic hazard that produces hot, fast-moving gas and rocks.
2. Name the equipment used to measure the seismic activity of Earth.
3. Name the scale used to measure the magnitude of an earthquake.
4. Name the point on Earth’s surface directly above the focus of an earthquake.
Understanding
5. Describe how earthquakes cause tsunamis.
6. Explain why plates at a transform or destructive plate boundary do not slide past each other all the time.
7. Explain how the silica content of lava can affect the outcome of a volcanic eruption.
8. Summarise the reasons why the Ring of Fire in the Pacific is so volcanically active.
Applying
9. On the seismogram below, identify which is the P wave and which is the S wave.
10. Identify the lag time on the seismogram in Question 9.
Analysing
11. Compare the properties of P waves and S waves.
12. Contrast magma and lava.
Evaluating
13. Hannah says that volcanoes only affect the people who live in the country of the eruption. Rounak thinks that volcanic eruptions can affect many countries. Decide who is right and give reasons why.
14. There are many different types of volcanoes. Deduce definitions for the following types of volcanoes.
a) dormant
b) extinct
c) active
15. Decide whether more geological activity is experienced by countries in the middle of a plate or by countries on a plate boundary. Outline your reasoning.
16. Discuss the intensity and frequency of geological activity in Australia.
17. Evaluate the following hypothesis: ‘An earthquake of greater magnitude will cause more damage because there is more energy transferred’.
6.4 Predicting and responding to natural disasters
UNCORRECTEDSAMPLEPAGES
Learning goals
At the end of this section, I will be able to:
1. List methods that can be used to map or predict plate movements.
2. Evaluate the impact of tectonic events on human populations and examine engineering solutions designed to reduce the impact.
As technology improves, we can use it to improve our understanding of geological patterns and changes. This greater understanding has allowed scientists to predict the movement of tectonic plates. It also assists governments and aid organisations to respond quickly and more effectively when plate movements result in natural disasters.
measuring and mapping change
Global Positioning System (GPS)
Forecasting the movements of tectonic plates has become an important area of geology. To do this, geologists use GPS and small base stations on the surface of Earth. GPS relies on twenty-four satellites that orbit Earth as well as GPS receivers on the ground that detect the radio signals from the satellites. To determine precise locations on Earth, the GPS receiver must receive signals from at least four different satellites. GPS receivers used for plate boundary observation can determine their location to a precision equal to the size of a grain of rice.
Gravity mapping
Gravity can be stronger and weaker at different points of Earth’s surface. Earth’s surface is very uneven due to mountains and ocean trenches, both of which affect gravity. Where rocks are denser the gravity is stronger, and where they are less dense it is weaker. This means that the gravity map tends to show warm colours (high relative gravity) in mountainous regions and cold colours (low relative gravity) in valleys and ocean trenches. This mapping technique helps scientists locate mountains and trenches under water. The internal structure of Earth can also affect gravity as the materials within the interior do not have a uniform distribution. Scientists can create a gravitational map of Earth, called a geoid, using these gravitational measurements. Uncorrected 2nd sample pages
Figure 6.64 GPS is used to measure position and therefore the
Figure 6.65
Earth
Geoids are not typically used to directly show tectonic movement but changes in Earth’s gravity field can indirectly provide information on tectonic movement. For example, if tectonic plates shift or collide with each other, this can cause changes in the density and thickness of Earth’s crust, which can in turn alter the gravity field. By measuring and mapping these changes in the gravity field, scientists can infer the movement of tectonic plates.
Satellite gravity mapping can help to create detailed 3D models of Earth’s interior structure, which can provide insight into the movement of tectonic plates and the processes that drive them.
Computer modelling
Computer models that simulate the way tectonic plates move are becoming more and more accurate. A new model built by scientists in 2012 was found to be highly accurate in predicting plate motion and the way in which plate boundaries deform. The model focuses on the mantle and it allows for variations in the physical properties of the mantle that can either speed up or resist plate movement.
UNCORRECTEDSAMPLEPAGES
The Earthquake Commission (EQC) is funding a new modelling technique pioneered in New Zealand that has the potential to enhance the seismic resilience of buildings worldwide. Researchers at the University of Canterbury are developing a ground-motion simulation model that can predict earthquake damage based on the soil beneath buildings, thereby providing valuable information to engineers and improving the resilience of structures against large earthquakes.
Figure 6.66 3D visualisation and geological modelling suite being used by geologists to interpret seismic data from an oilfield
Try this 6.6
Investigating earthquakes
Use the internet to navigate to Seismic Explorer by The Concord Consortium. This is a data visualisation tool that shows real-world earthquake, volcanic and plate motion data. Use Seismic Explorer to investigate earthquake and volcanic eruption distribution patterns and make connections between the natural disasters and plate boundaries. You can also use crosssections to investigate earthquake depth patterns.
Quick check 6.14
1. List two pieces of technology used in predicting plate movements.
2. Recall what the computer model constructed in 2012 allowed for, so that plate movement could be modelled more accurately.
Explore! 6.7
sharing information
Seismic data are collected and shared between governments across the Asia–Pacific region through various regional and international networks and organisations. These organisations work to collect data from seismometers and other monitoring equipment located throughout the region to provide information to government agencies responsible for earthquake and tsunami monitoring and warning.
Research the following key organisations and complete the table to describe their role in seismic data collection and sharing in the Asia–Pacific region.
Organisation
Pacific Tsunami
Warning Center (PTWC)
Indian Ocean
Tsunami Warning System (IOTWS)
International
Seismological Centre (ISC)
Regional Integrated
Multi-Hazard Early
Warning System for Africa and Asia (RIMES)
UNCORRECTEDSAMPLEPAGES
How does it monitor risk?
Figure 6.67 DART® (Deep-ocean Assessment and Reporting of Tsunamis) real-time tsunami monitoring systems are positioned throughout the ocean and play a critical role in forecasting tsunamis.
Once seismic data are collected and shared, governments in the Asia–Pacific region use this information in various ways, including for tsunami alerts. When an earthquake is detected, government agencies responsible for earthquake and tsunami monitoring use this data to assess the risk of a tsunami and issue warnings to coastal communities in the affected areas. This may involve sending out alerts through various channels, including radio, television and social media, and mobilising emergency response teams to evacuate coastal areas if necessary.
responding to natural disasters
Natural disasters strike unexpectedly and cause widespread destruction, injury and loss of life. Responding to natural disasters requires a coordinated effort at local, state and federal levels, and new advances in technology are helping to support this.
Drones
Drones have become increasingly important in responding to natural disasters due to their ability to reach remote or inaccessible areas quickly and efficiently. In disaster response operations, drones can be used to gather real-time images and data that can help emergency responders assess damage, identify survivors and plan rescue operations.
In the aftermath of a disaster, drones can be used to conduct rapid assessments of affected areas and identify potential hazards, such as blocked roads or damaged infrastructure. This information can then be used to prioritise response efforts and allocate resources more effectively.
Drones equipped with thermal cameras can also be used to locate survivors and assess their condition. Survivors who are given assistance quickly after a natural disaster have the highest chance of survival. Drones are also useful for getting medical aid into areas that have been blocked off by landslides or collapsed buildings.
FINDERs
UNCORRECTEDSAMPLEPAGES
In the aftermath of the 2023 earthquake in Turkey, disaster relief teams utilised NASA-developed technology capable of detecting the smallest body movements associated with vital life processes. The technology, known as FINDERs or Finding Individuals for Disaster Emergency Response, operates using microwave radar sensors to remotely detect the heartbeat of survivors trapped under rubble or in avalanches.
2nd
Figure 6.68 Members of a British charity called Serve On used drones to help identify areas that were worst affected by an earthquake in Nepal.
VIDEO Responding to natural disasters
UNCORRECTEDSAMPLEPAGES
Quick check 6.15
1. State the name given to scientists who study volcanoes.
2. Give one use of drones after an earthquake.
3. State the benefit of using AI when assessing a natural disaster.
reducing vulnerability
Natural disasters can have devastating impacts on communities and their infrastructure. It is crucial to have effective strategies in place to reduce vulnerability to these hazards. These strategies involve a range of actions, such as structural engineering designs, land-use planning, and emergency preparedness and response plans.
Land-use planning
Land-use planning can reduce vulnerability to natural disasters by ensuring that development occurs in areas with minimal risk and that appropriate measures are taken to protect people and property. Land planners will consider where to locate critical infrastructure, such as hospitals, schools and emergency response centres, and where to restrict development in high-risk areas.
Land-use planning can also include requirements for building codes and standards that increase the resilience of structures to natural hazards. For example, buildings in earthquake-prone areas may require reinforced foundations and walls, while structures in flood-prone areas may need to be elevated above the flood plain.
Construction techniques
Most buildings are designed to support vertical forces; for example, the walls support the roof. However, earthquakes also produce sideways or horizontal forces, which is why many buildings struggle to withstand high-magnitude earthquakes. A building can be made ‘earthquake proof’ in three ways: • base isolation – Buildings do not sit directly on the ground, but are supported by ball bearings and springs, which act like shock absorbers.
Figure 6.69 The FINDER device uses microwave radar sensors to remotely detect heartbeats and locate survivors.
• vibration control – Mass dampers are built to sway in the opposite direction to the building’s sway during an earthquake.
• seismic resistance – The walls, roof and foundations are tied together into a rigid box that holds together when shaken by an earthquake.
Earthquake-resistant house
UNCORRECTEDSAMPLEPAGES
Quick check 6.16
1. Give one way in which a building can be earthquake proofed.
2. Discuss why many existing buildings are not able to withstand high-magnitude earthquakes.
Explore! 6.8
Cultural building techniques
Cultural building techniques in construction have led to the development of structures and materials that are better able to withstand the effects of earthquakes. Bamboo has been used for centuries as a building material in earthquake-prone regions, such as South-East Asia, South Asia and Latin America. It is flexible and resilient, which allows it to withstand the forces of an earthquake, and as it is lightweight, making it less vulnerable to damage. Builders have incorporated some bamboo properties, such as the ability to bend without breaking, into modern earthquake-resistant building designs. Researchers have also developed bamboo-reinforced concrete, which is a combination of bamboo and concrete that is more resistant to breaking during an earthquake.
Adobe is a technique that involves making bricks from a mixture of clay, sand and straw, and then allowing them to dry in the sun. Adobe structures have been used for centuries in earthquake-prone areas of Latin America, but traditional adobe construction responds poorly during earthquakes. Research how adobe techniques have been refined over time to improve their earthquake resistance.
Figure 6.70 Buildings can be made earthquake proof by three different methods.
Figure 6.71 A certified earthquake- and cyclone-resistant bamboo house being built in Martinique
Investigating how high-frequency earthquakes affect buildings
Aim
To investigate how high-frequency earthquakes affect buildings of different heights
Planning
Complete some research and write a rationale about the effects of earthquakes on buildings of different heights. Hint: research the 1985 Mexico City earthquake.
Materials
• ruler × 2
• rubber bands
• pieces of card
• paper clips
Method
1. Draw the results table below.
2. Set up the experiment as shown in the diagram below. Each ‘tower’ is made of four card strips held together at the top by a paper clip and two rulers at the bottom. The rulers are held in place using rubber bands.
UNCORRECTEDSAMPLEPAGES
3. Vibrate the rulers in a slow and gentle way in the direction shown in the diagram.
4. Slowly increase the rate of vibration until the cardboard strips begin to resonate (start to regularly and strongly vibrate). Note: This simulates a high-frequency earthquake. The results would differ for low-frequency earthquakes.
5. Count the number of complete vibrations that occur in 10 seconds.
6. Continue to vibrate the rulers until you have recorded the three trials for each strip in your results table.
Results
Height of strip (cm)
Number of vibrations in 10 seconds
Mean number of vibrations Frequency (vibrations per second) 123
UNCORRECTEDSAMPLEPAGES
1. Calculate the frequency by dividing the mean number of vibrations by 10.
2. Plot a graph of height of strip against frequency of vibrations.
Discussion
1. Identify any trends, patterns or relationships in your results.
2. Determine the height of buildings that would be damaged most by high-frequency earthquakes.
3. Identify any potential sources of error in this experiment.
4. Suggest any changes that could be made to the method to improve the quality of the data in future experiments. Justify your suggestions by explaining how each change will improve the data quality.
Conclusion
Draw a conclusion from this experiment regarding building height and high-frequency earthquake damage. Justify your answer with data.
Emergency response plans
Emergency response plans are designed to ensure that communities are ready to respond quickly and effectively in the event of a disaster. These plans may include completing risk assessments, using early warning systems, undertaking evacuation planning and providing training and education programs that help residents plan and prepare for disasters.
Figure 6.72 A tsunami evacuation route sign in San Francisco
Explore! 6.9
reducing natural disaster impacts
Countries located near plate boundaries in the Asia–Pacific region, such as Japan, Indonesia and New Zealand, are particularly vulnerable to geological hazards such as earthquakes, volcanic eruptions and tsunamis. However, scientific responses have helped to support these communities and reduce the impact of these natural disasters.
Produce a presentation on either the use of new building materials, improved predictions or early warning systems to show how the impact of natural disasters can be reduced.
Figure 6.73 To make concrete more suitable for seismic activity, engineers add steel (in the form of rebar), which is much more flexible.
UNCORRECTEDSAMPLEPAGES
using a shake table to design earthquake-proof building bases
Aim
To observe the effect of base isolation on damage to buildings during an earthquake
Materials
• 100 g masses
• plastic or paper straws
• masking tape
• cardboard
• string
• wooden block
• wooden dowels or pens
Planning
Research base isolation. Propose if base isolation will create more or less damage to a building during an earthquake.
Method
1. Using the equipment provided, except for the wooden block, dowels and pens, design and build two identical earthquake-proof buildings. (You may want to refer to the STEM activity at the end of this chapter for the building creation.)
2. Draw the results table below.
3. Put your finished design on a table and shake the table for 20 seconds. Record what happened in your results table.
4. Now lay the pens or the wooden dowels on the table so they align.
5. Place the wooden block on top of the pens or dowels and put your second building on top.
6. Shake the table again for 20 seconds and record what happened in your results table.
Practical 6.5
Results
Structure
Without base isolation (just on the table)
With base isolation (on the pens and wooden block)
Discussion
Observations
UNCORRECTEDSAMPLEPAGES
1. Identify which structure was the most earthquake resistant and why.
2. Discuss how base isolation helps the building survive an earthquake.
3. Discuss how design and construction decisions make the building more earthquake resistant.
4. Recommend what you would do differently next time in the construction of your building. Explain why.
Evaluating the impact
Evaluating the impact of natural disasters on human populations involves examining the degree and extent of damage caused by the event, including the number of casualties, injuries and homes destroyed.
The socio-economic impact of the event must also be assessed, including the disruption to local infrastructure, the impact on essential services and the cost of recovery and reconstruction efforts. These assessments can help to inform policy decisions and emergency response strategies, as well as guide the allocation of resources to affected communities.
Figure 6.74 The February 2023 earthquake in Turkey, which killed more than 43 000 people, will cost the Turkish economy more than US$100 billion.
Go online to access the interactive section review and more!
Section 6.4 review
Online quiz
Section 6.4 questions
Remembering
1. Recall what GPS stands for.
Section questions
UNCORRECTEDSAMPLEPAGES
2. Name the three methods of earthquake proofing buildings.
3. Identify the name of NASA’s first robot used to explore volcanoes.
Understanding
4. Explain why scientists need to study the inside of volcanoes.
5. Explain how GPS can map the position of tectonic plates.
Applying
6. Summarise the advantages of using drones after an earthquake.
Analysing
7. Compare the three methods of protecting buildings from earthquakes.
Evaluating
8. Propose reasons why humans cannot enter some parts of volcanoes.
9. Discuss the benefits and shortcomings of using technologies to map plate movement and Earth’s geology, using examples.
10. Think about the various earthquake-proofing methods you have learned about. Propose which earthquake-proofing method you would choose and justify your choice.
Chapter review
Chapter checklist
Success criteria Linked questions
6.1 I can describe the evidence for the theory of continental drift. 13
6.1 I can describe how Marie Tharp’s topographic maps provided support for the acceptance of the theory of plate tectonics. 17
6.2 I can construct a timeline of evidence to show the development of the theory of plate tectonics. 10, 13, 14, 17, 21
6.2 I can describe the consequence of three types of plate boundaries. 11, 12, 19, 20
6.2 I can model interactions at plate boundaries. 16
6.2 I can describe the different forces involved in tectonic plate movement. 3, 7
6.3 I can describe how volcanoes, earthquakes and tsunamis form.18, 29
6.3 I can distinguish between S and P waves and the information they provide about earthquakes. 8, 15, 24
6.3 I can examine patterns of earthquake and volcanic activity over time and propose explanations. 29
6.3 I can relate the extreme age and stability of a large part of the Australian continent to its plate tectonic history. 28
6.3
UNCORRECTEDSAMPLEPAGES
I can describe Aboriginal and Torres Strait Islander Peoples’ cultural accounts that provide evidence of earthquakes and volcanoes. 9
6.4 I can list methods that can be used to map or predict plate movements. 1
6.4 I can evaluate the impact of tectonic events on human populations and examine engineering solutions designed to reduce the impact. 23
Scorcher competition
Review questions
Remembering
1. State the name of one piece of technology used to measure plate movements.
2. Name the tectonic plate that contains Australia.
3. Name one mechanism in Earth’s mantle that causes tectonic plates to move.
4. Identify five major tectonic plates using the image below.
5. Match the layer of Earth (A–D) to its physical properties (1–4).
A Crust 1
B Mantle
C Outer core
D Inner core
Made of metals (iron and nickel)
Very hot temperatures
Under intense pressure from the layers above so is a solid structure
2 Made of dense solid rock that flows in hot temperatures
3 Thinnest layer
Supports all the life on Earth
4 Made of metals (iron and nickel)
Very hot temperatures
Liquid
6. Identify the continental and oceanic plates (A and B) at the subduction zone in the diagram in Figure 6.75.
7. Identify the source of heat causing convection currents in Earth’s mantle.
8. Identify the type of seismic wave from the description.
a) a transverse wave that cannot travel through liquids
b) a longitudinal wave that can be detected on the opposite side of Earth to the epicentre of an earthquake
9. In Gunditjmara oral traditions, recall what the lava that came from the Budj Bim volcano was formed from.
10. List the following scientists in order of when they were involved in the development of the theory of plate tectonics: Marie Tharp, Harry Hess, Alfred Wegener, Frederick Vine, Drummond Matthews, Lawrence Morley.
B
A
Figure 6.75 Subduction zone of the continental and oceanic plates
Understanding
11. Describe the three types of plate boundaries and how they affect the amount of crust present.
12. Explain how mid-ocean ridges form.
13. Summarise the evidence proposed by Alfred Wegener for his continental drift theory.
14. Explain why the rocks in the sea floor are magnetised and how this supports Hess’s theory of seafloor spreading.
15. Describe how a seismometer works.
16. Using the diagram in Figure 6.76, model how convection currents in the mantle move tectonic plates.
17. Describe how Marie Tharp’s topographic maps provided support for the acceptance of the theory of plate tectonics.
18. Describe how a tsunami forms.
Applying
UNCORRECTEDSAMPLEPAGES
19. Infer whether the following effects indicate a constructive, destructive or transform plate boundary.
a) no mountains form
b) island arcs
c) crust is conserved
20. Classify the following as constructive, destructive or transform plate boundaries.
a) the Himalayas
b) Mid-Atlantic Ridge
c) Mariana Trench
Analysing
21. Examine the results from Harry Hess’s and Marie Tharp’s mapping of the sea floor. How did this account for movements of tectonic plates?
22. Compare the two types of destructive plate boundaries.
23. Analyse what evidence would be necessary to support the conclusion that all buildings in an earthquake area should be made of bamboo.
24. Contrast P and S waves.
Evaluating
25. At the East African Rift zone, the plates are moving away from each other. Predict what will happen to the continent of Africa in the next million years.
26. Determine which island is the oldest from the diagram in Figure 6.77. What type of volcano is shown in the diagram?
27. Predict what you think will happen to Earth’s continents in the next 100 million years.
28. Discuss why Australia is considered to be tectonically stable.
Lithosphere
Mantle Core Cool rock
Figure 6.76 The internal layers of Earth
Oahu Maui Hawai'i Platemovement
Figure 6.77 Plate movement away from Hawai’i
29. Propose an explanation for the locations of global earthquake and volcanic activity shown in the map in Figure 6.78.
Data questions
New Zealand is a country that lies very close to a fault boundary and consequently experiences thousands of earthquakes a year. Earthquakes are categorised using the Richter scale, which measures earthquake magnitude on a scale of 0 to 10 (see Table 6.3). The magnitudes of 10 New Zealand earthquakes from 2010 to 2019 are presented in Table 6.4.
Observation
UNCORRECTEDSAMPLEPAGES
0.0–2.9
3.0–4.9
5.0–5.9
6.0–6.9
7.0–7.9
Not felt by humans
Felt by humans and not damaging
Small risk of damage to buildings
Moderate risk of damage to buildings
High risk of damage to buildings 8.0+
High probability of severe destruction
Table 6.3 Severity of earthquake observed with Richter scale value
Figure 6.78 Global map of earthquake and volcanic activity
1. Identify the most severe earthquake recorded in Table 6.4.
2. Determine the earthquakes that had a high risk of damage to buildings.
3. The media are reporting a new earthquake in New Zealand that measures 6.5 on the Richter scale. Identify the likely observations relating to buildings in the area.
4. Categorise the earthquakes presented in Table 6.4 as ‘not felt’ or ‘felt’ by humans.
5. Identify a trend in the Richter scale and severity of earthquakes.
6. Based only on the 10 earthquakes presented, infer whether there is a higher chance that an earthquake in New Zealand would not be felt or would damage buildings.
7. There are over 10 000 earthquakes a year in New Zealand. Justify whether your answer to Question 6 would be reliable.
8. The largest magnitude earthquake ever recorded in New Zealand was 8.2 on the Richter scale, while the largest in Japan was 9.0. Justify whether it is possible to suggest that Japan is more at risk than New Zealand for severe earthquakes?
9. The media in New Zealand are reporting a mild earthquake that caused a tremor that did not damage buildings but moved furniture in buildings in the area. Deduce the magnitude of this earthquake on the Richter scale.
Table 6.4 The magnitude on the Richter scale of 10 earthquakes that occurred in New Zealand between 2010 and 2019
stEm activity: Earthquake-proof structures
6.79 (a–c) Damage caused by earthquakes in Papua New Guinea. Earthquakes occur all over the world, in developed and underdeveloped countries. They have the power to destroy whole cities, move entire mountains and lift or drop the ground by many metres. (d) Scientists analyse data collected during an earthquake.
Background information
In this chapter, you have gained an insight on the inner workings of our planet. You learned that, contrary to appearances, our planet has been very active for over four billion years. Our planet is constantly changing via many important geological processes over eons, and some of the movements produce earthquakes.
Unfortunately, poorer countries have been greatly affected by earthquakes over the centuries, as whole populations live in earthquake-prone areas (for example, the Pacific Ring of Fire and the Andes). Experts have demonstrated that most deaths in earthquakes occur because buildings and dwellings collapse due to poor construction.
Papua New Guinea (PNG) is located in the Australasia ‘ecozone’, which includes Australia, New Zealand, eastern Indonesia and several Pacific island groups, such as the Solomon Islands and Vanuatu. PNG is one of the poorest countries in the world and is severely affected by earthquakes. Earthquakes are particularly severe in PNG because of a combination of factors – steep terrain, poor infrastructure and housing, lack of roads and extensive seasonal rains – all of which create an environment that is prone to collapse after an earthquake.
Knowledge has the power to improve people’s lives. How can you use technology and your knowledge of geology to improve the lives of people living in these high-risk areas?
DESIGN BRIEF
Design and test building designs to improve durability in earthquake risk zones and present this information in a format that would be useful to a small PNG community.
activity instructions
In groups (maximum of four people), you will investigate how housing design can affect the stability of a building, by building a series of small structures and testing their durability on a shaker table. It will be useful to allocate roles for this activity: project manager, engineer, builder and presenter.
Role Responsibility
Project managerMaking sure the project is on time and within a budget. The project manager is responsible for all of the parts of the project.
EngineerConducting research on the current models, finding new ways to improve and drawing a sketch of the proposed design
Builder Creating the proposed design and checking that the design is functional
Uncorrected 2nd sample
PresenterResearching information on cultural awareness of the local community and how to present in the most effective way, and creating a presentation to match this
UNCORRECTEDSAMPLEPAGES
Figure
Together, the group members need to manage their time and help each other through each stage.
Suggested materials
• wooden sticks
• sticky tape
• glue
• mobile phone or video recording equipment for vlog (if chosen as mode to communicate ideas)
• software for creating a presentation
• software for video editing
Research and feasibility
1. Research current house design in villages and list the features, including types of materials used.
2. Discuss and research as a group how a structure’s strength can be improved.
3. Research social and cultural information about PNG communities.
Design and sustainability
4. As a group, discuss some design features you could use in a model house structure and make multiple sketches with ideas.
5. Decide as a group which design will be the most sustainable and suitable to build, with the PNG communities in mind.
6. Decide on and design the format you will use for your presentation for the PNG community.
Create
7. Construct your design using allowable materials.
8. Test your design by performing the following tests. Draw a results table.
A) Shake test: Place your design on a table and secure it using tape. Shake the table forwards and backwards four times. Describe how successful your design was. Did it fail? And if so, where and why?
B) Weight test: Your design has survived the shake test! Now, it is time to compare how it behaves when 0.5 kg masses are placed on top of it. Describe how your design behaved under the weights.
C) Combination test: Your design is still standing – that is great! Now, repeat tests A and B at the same time. Describe what happened.
9. Reflect and, if there is time, create and test another design.
10. Create the presentation while building and testing your design.
Evaluate and modify
11. Take time to think about the investment required to change the lives of villagers. Imagine that a 10 cm wooden stick used to build your model costs around $10 to purchase and that the piece that joins them costs $2. Calculate the current cost of building a house using cubes.
12. Evaluate the effectiveness of your design. It is important to remember who your target audience is throughout this project.
13. Give your presentation to the class and reflect on how it demonstrates cultural awareness and how well it communicates effective building methods.
UNCORRECTEDSAMPLEPAGES
Chapter 7 Rocks and minerals
Introduction
Rocks are all around us, from the gravel in our gardens to the mountains that tower over us. They come in many different shapes, sizes and colours and are made up of a variety of different minerals. But what exactly are rocks and how do they form? In this chapter, you will learn about Earth’s crust and the rocks that make up its composition. You will learn about the three types of rock – igneous, metamorphic and sedimentary – and how rocks can change from one form to another via the rock cycle. You will also learn about the mining industry and how resources contained in the rocks are extracted to make useful materials, such as metals for technology, and glass and cement for building.
UNCORRECTEDSAMPLEPAGES
Chapter map
Section 7.1
Section 7.2
Section 7.3
Section 7.4
Types of rock
The rock cycle
Resources can be extracted from rocks in the mining process.
• Exploration
• Planning and design
• Construction
• Mining
• Processing
• Closure and rehabilitation
Minerals can be classified based on physical properties, such as:
• colour
• lustre
• transparency
• streak
• hardness
• cleavage
Minerals are the building blocks of rocks.
• Igneous rock
• Sedimentary rock
• Metamorphic rock
Rocks can be classified based on physical properties, such as:
• crystal size and shape
• grain size and shape
• colour
• density and porosity
UNCORRECTEDSAMPLEPAGES
Curriculum
Earth and space sciences
Rocks are composed of minerals; the key processes of the rock cycle are involved in the formation of igneous, sedimentary and metamorphic rocks; the properties of these rocks reflect their formation and influence their use.
• classifying a range of common rocks using observable physical properties
• linking key processes of the rock cycle and the formation of rock types to processes within and between tectonic plates
• exploring the traditional geological knowledge of Aboriginal and Torres Strait Islander Peoples in the selection of different rock types for different purposes
Minerals can be classified using physical properties, including colour, streak, lustre, transparency, hardness and cleavage; useful resources can be extracted from minerals.
• using a key to classify minerals based on their physical properties
• exploring a local mineral resource, such as bauxite, diamonds
Collaborating and applying
Illustrate how the development of scientific knowledge has benefited from collaboration across disciplines and the contributions of people from a range of cultures.
• investigating how knowledge of the location and extraction of mineral resources relies on expertise from across disciplines
Illustrate how science understanding and skills have influenced the development of individual, community and workplace practices.
• examining the impact of mining on local ecosystems and the community
2. Consider the role of forces and heat energy in the formation of igneous, sedimentary and metamorphic rocks.
3. Compare how quickly or slowly different rock formation processes can occur.
4. Describe the major processes of the rock cycle.
Minerals
Minerals are solid, naturally occurring substances composed of elements such as oxygen, silicon, aluminium, iron and calcium, among others. They feature a specific chemical composition and the atoms are arranged in highly ordered repetitive patterns, giving a geometric crystal structure. There are over 5000 types of minerals, but a relatively small number of common types form the majority of the rocks in Earth’s crust.
Minerals can be classified based on their physical properties, which help us identify and distinguish them. Classification of minerals is covered in detail in Section 7.3. Once minerals are classified, we can extract valuable resources from them and use them for different purposes. Minerals like gold, copper and diamonds are used in products such as jewellery and electronics.
Rocks
Rocks are a naturally occurring substance made up of one or more minerals.
Rocks can be broadly classified according to how they form:
• igneous – formed from molten rock
• sedimentary – formed from the products of erosion
• metamorphic – altered by heat and pressure.
WORKSHEET Formation of rocks
UNCORRECTEDSAMPLEPAGES
mineral a naturally occurring chemical substance that is formed in the ground, with constant chemical composition, crystal structure and physical and chemical properties crystal a substance with a specific chemical composition, in which the atoms are arranged in an ordered way to form a geometric shape rock a naturally occurring substance composed of minerals, making up Earth’s outermost layers, formed as part of the rock cycle
igneous describes rocks made from lava (above Earth’s surface) or magma (below the surface) sedimentary describes rocks made from deposited materials that are the products of weathering and erosion
metamorphic describes rocks that are changed by being exposed to high temperature, pressure or both
Figure 7.1 Silica molecules (a) are connected into a continuous crystal framework (b), which makes up the mineral quartz (c).
inner core
the solid centre of Earth; probably made of iron
outer core the liquid layer surrounding the inner core; probably made of liquid iron mantle the layer of Earth underneath the crust that is made up of solid and semi-molten rock and surrounds the outer core
crust the solid outer layer of Earth that supports all life on Earth
lithosphere the solid outer layer of Earth consisting of the crust and top layer of the upper mantle; it is split into giant slabs called tectonic plates
Did you know? 7.1
Gemstones
Gemstones are a subset of minerals that are prized for their beauty, rarity and durability. They are cut and polished to enhance their visual appeal and can be used in jewellery, decorative objects and other luxury goods. Some of the most well-known gemstones include diamonds, emeralds, rubies and sapphires, but there are many other varieties that are highly valued by collectors and enthusiasts.
Rocks and earth
In Chapter 6, you learned about the four layers of Earth’s geosphere: the inner and outer core, mantle and crust. The inner core of Earth is currently thought to be mostly solid iron, while the outer core is made of liquid iron and nickel. Surrounding the outer core is the mantle, comprising mostly solid and semi-molten rock. Earth’s outer layer is the solid crust. Continental crust (supporting land) is on average 35 kilometres thick, while oceanic crust (supporting ocean) is around 10 kilometres thick. Rocks are formed and reformed in the lithosphere, which includes the crust and the uppermost mantle.
The composition of Earth’s mass is dominated by a few key elements, with iron being the most abundant, followed by oxygen, silicon and magnesium. These elements make up the bulk of the planet’s solid materials, including the rocks and minerals that comprise Earth’s crust and mantle. Each type of rock is unique in its composition and properties.
UNCORRECTEDSAMPLEPAGES
Table 7.1 These four elements make up most of Earth’s mass.
Figure 7.2 (a) Diamond and (b) graphite are both made of carbon atoms. However, the arrangement of the atoms determines their properties.
Quick check 7.1
1. Define and distinguish between rocks and minerals.
2. Recall where rocks are formed on Earth.
3. State the elements that make up most of Earth’s mass.
The rock cycle
The Moon has stayed unchanged for millions of years, but the geology of Earth is very different. James Hutton, the father of modern geology, tried to explain why the surface of Earth is so complex. He came up with two conclusions.
• Earth is very old – Hutton called this deep time.
• Earth’s surface has been constantly changing throughout its history. The rock component changes constantly due to some key processes, which together are called the rock cycle.
Deposition, compaction and cementation
geology the study of rocks, Earth’s dynamic structure and the processes through which our planet (and other planetary objects) have formed deep time the idea, first suggested by James Hutton, that Earth is very old rock cycle the constant process of change that rocks go through, between igneous, metamorphic and sedimentary forms
magma hot molten rock found beneath Earth’s surface crystallisation the formation of solid mineral crystals from a liquid, either by cooling or evaporation lava molten rock from inside Earth (magma) that has reached the surface
UNCORRECTEDSAMPLEPAGES
Figure 7.3 In the rock cycle, the three types of rock can change, through the action of weathering and erosion, deposition, compaction and cementation, melting and cooling, and heat and pressure.
Melting and crystallisation
The rock cycle is driven by processes occurring within and between tectonic plates. As you can see in Figure 7.3, the melting of rock forms magma (molten rock). This process occurs at temperatures between 500°C and 1600°C, often at tectonic plate boundaries or hotspots. When magma cools, crystallisation occurs, leading to the formation of igneous rock. Cooling can happen either below Earth’s surface, where magma cools slowly and forms large crystals, or above the surface, where lava cools quickly, producing small or microscopic crystals. Tectonic activity,
2nd
such as subduction, can push rocks deep underground, where they melt and restart the cycle. This movement of Earth’s plates also contributes to the transformation of rocks into different types over time. You will explore more about the rock cycle and how tectonic processes influence rock formation in section 7.2.
7.4 Granite is an igneous rock, composed of four types of minerals. The crystals are considered large, as they are visible with the naked eye, indicating the rock cooled slowly, probably underground.
Did you know? 7.2
Igneous rocks
UNCORRECTEDSAMPLEPAGES
‘Igneous’ and ‘ignite’ come from the same Latin word, ignis, which means ‘fire’. This is an easy way to remember that igneous rocks are formed from molten rock (magma or lava).
Figure 7.6 ‘Igneous’ comes from a Latin word meaning ‘fire’.
Figure
Figure 7.5 The Granite Skywalk, Castle Rock, Porongurup National Park.
Explore! 7.1
What is a meteorite?
From time to time, rocks arrive on Earth from space, in the form of meteorites that land on the surface. Use the internet to answer the following.
1. Describe the composition of meteorites.
2. Outline where meteorites originate from.
3. Propose whether meteorites pose a threat to life on Earth. Justify your argument using examples of meteorites that have landed on Earth and their impact.
Quick check 7.2
1. State the three types of rocks formed in the rock cycle.
2. Describe the role heat plays in rock formation in the rock cycle.
Weathering
Weathering is an important process that contributes to the formation of sediments. When rocks and minerals are exposed to the elements, they can be broken down into smaller particles through physical, chemical and biological weathering. The size and composition of sediments can vary widely depending on the type of rock and the weathering processes that created them.
Physical weathering is the process of breaking down rocks into smaller pieces without changing their chemical composition. Temperature changes, pressure and mechanical forces from weathering agents, such as wind, water, ice and gravity, can cause physical weathering. Freeze–thaw action is a specific example of physical weathering caused by the repeated freezing and thawing of water in cracks and crevices of rocks. When water enters a crack in a rock and freezes, it expands and widens the crack. The repeated expansion and contraction due to freeze–thaw action can cause the rock to break apart into smaller pieces.
meteorite a rock from space (meteor) that has entered the atmosphere as a ‘shooting star’ and reached the ground
UNCORRECTEDSAMPLEPAGES
sediments sand, stones and other materials that slowly form a layer of rock
physical weathering the process of breaking down rocks into smaller pieces or particles, without changing the chemical composition
Figure 7.7 An iron meteorite that landed on Earth from space
Water enters a crack in rock Water freezes and expands, widening crack
Ice melts, and water moves deeper into crack
Process repeats until rock splits
Figure 7.8 The stages of freeze–thaw action
chemical weathering the process by which rocks are broken down and chemically altered, via chemical reactions dissolution when water dissolves minerals in rocks karst an area of land formed of rock such as limestone that is worn away by water to make caves and other formations
Chemical weathering is the process by which rocks are broken down by chemical reactions. Rainwater is naturally slightly acidic because it contains carbon dioxide from the air, which forms carbonic acid when it dissolves in water. This slightly acidic water can react with certain types of rock, such as limestone, to dissolve them over time. As rainwater seeps through the ground, it can dissolve and carry away minerals from the rock, leading to the formation of underground caves, rivers and other unique geological features. The dissolution of the rock can lead to the formation of stalactites and stalagmites, which are mineral formations that grow from the ceiling and floor of the cave, respectively. When they eventually meet, they can form columns.
When limestone contains underground rivers, it can give a very characteristic landform called a karst landscape (see Figure 7.10), which has caves, sinkholes, limestone outcrops and dry valleys with no water because the river that formed them has gone underground. The Nullarbor Plain between South Australia and Western Australia is the world’s largest karst landscape.
7.9 Limestone caves, such as the Jenolan Caves in New South Wales, are often developed as tourist attractions because of the beautiful limestone features they contain. These are often formed by the dissolution of limestone by slightly acidic water over many years, and also by the deposition of calcium carbonate to form stalagmites and stalactites.
UNCORRECTEDSAMPLEPAGES
Figure
Figure 7.10 The entrance to a cave in a typical karst landscape. Rainwater enters the cave and can travel underground for many kilometres.Uncorrected 2nd sample
Did you know? 7.3
exploring cave systems
A person who studies caves scientifically is called a ‘speleologist’, but a person who explores caves as a pastime is called a ‘caver’ or a ‘spelunker’.
Danggu Gorge
Danggu Gorge was originally part of a reef formed by algae and lime-secreting organisms that are now extinct. This reef developed during the Devonian period, when the receding waters allowed these organisms to build a reef up to two kilometres thick. Today, the remnants of this ancient reef stand as a limestone range that rises up to 100 metres above the plains. Fossils from the Devonian period can still be found embedded within the limestone strata. Science as a human endeavour 7.1
SAMPLEPAGES
Biological weathering is a form of physical weathering that occurs when rock is broken down into smaller particles by living things. For example, human feet can wear dips into the tops of stone steps (see Figure 7.13), plant roots grow into small cracks in rocks and make the cracks bigger, and people who do not stay on pathways in national parks damage the vegetation, which can eventually lead to erosion.
Quick check 7.3
1. Distinguish between physical, chemical and biological weathering, giving an example of each.
biological weathering the disintegration of rocks that is caused by living things
Figure 7.11 Cavers explore underground cave systems, looking for amazing rock formations like this.
Figure 7.12 Danggu Gorge
erosion the transport
Erosion
Erosion occurs when rock that has been broken loose by weathering is transported or moved to a new location. It includes rocks or rock particles falling due to gravity, being carried away in the wind or moved by waves, ocean currents, running water or even ice in a glacier.
Weathering results in rock fragments of various sizes, and the particle size determines the way in which it may be eroded. Classifying rocks based on their size is discussed in Section 7.3. Small particles, such as sand, can be blown by the wind, but larger particles like pebbles and boulders require higher energy forms of transport, such as river currents or ocean waves. Mud, which is a viscous fluid composed of silt, clay and water, can be carried by a slowmoving river. Larger boulders within the river system may only be eroded in times of flood, when the water is moving faster and with greater energy. Glaciers are capable of carrying giant boulders, trapped in ice, for many kilometres. Glaciers are also powerful weathering agents, because the ice leaves a smooth surface as it passes over the bedrock.
UNCORRECTEDSAMPLEPAGES
During the last ice age, the world, including Australia, was very different. Large quantities of water were trapped in giant ice sheets that spread out from the poles and covered much of Europe and North America. Because of this, the sea level was much lower, and it was possible to walk on land from Victoria to Tasmania and from Queensland to Papua New Guinea. Although neither the Australian mainland nor Tasmania was covered in an ice sheet, glaciers formed on Cradle Mountain in Tasmania and the surrounding areas. The landscape was transformed by the ice moving over the rocks, leaving the characteristic smooth surface.
The profile of Wave Rock (see Figure 7.17) demonstrates the erosive power of wind. Sand grains carried by wind have worn down this rock and carried away the debris. Initially, it was chemical weathering (vegetation breaking down) that weakened the rock, and then the wind-borne sand started its work at the weakened lower levels of rock. Eventually, a wave-like shape formed.
Figure 7.13 These steps have been ‘weathered’ by people walking on them. The particles of stone have been washed away or eroded by the rain.
of rock fragments (that have resulted from weathering)
Figure 7.14 The Pinnacles are natural limestone formations, created around 25 000 to 30 000 years ago after the sea receded, leaving behind deposits of seashells. Over time, coastal winds eroded the surrounding sand, gradually exposing the pillars.
Figure 7.15 The Natural Bridge in Torndirrup National Park was caused by the gradual weathering of the granite rock by the Southern Ocean.
UNCORRECTEDSAMPLEPAGES
Try this 7.1 erosion by wind
You will need the following materials:
• Petri dish
• water
• dry sand
• pebbles of various sizes (approximately 5–65 mm in diameter)
• drinking straw
• newspaper Place the Petri dish on the edge of the newspaper. Moisten the bottom of the Petri dish with just a little bit of water, before filling it with sand. Place five pebbles on top of the sand and spread them out evenly. Gently blow through the straw, away from the edge of the newspaper, so the sand lands on the newspaper and does not make a mess.
What do you observe? Which size particles were eroded by the ‘wind’ and which were not affected?
Deposition, compaction and cementation
Particles or sediments that are eroded come to rest when the wind or water moves more slowly or the ice melts. When the particles reach their destination, they are dropped, in a process called deposition. Often deposition occurs on ocean beds or lake beds. The particles are often deposited in visible layers, which become compacted or compressed by the weight of the layers above and cemented together. These processes finally form sedimentary rocks.
Figure 7.18 Sedimentary rocks are very common, covering over 70% of Earth’s surface. Some contain fossils that are billions of years old. Note the different layers of sediment, all cemented together.
deposition process that occurs when eroded particles stop moving and build up to form sedimentary rocks compaction the process of particles becoming closely positioned together, using minimal space cementation the sticking together of sediment
Figure 7.16 Dove Lake on Cradle Mountain in Tasmania. The smooth appearance of the rocks is due to the action of glaciers 20 000 years ago.
Figure 7.17 Wave Rock is made of granite that is over two billion years old.
Quick check 7.4
1. Distinguish between weathering and erosion.
2. Explain the processes of deposition, compaction and cementation.
2. How long does each layer take to settle? Can you explain why this occurred? fossil the remains, shape or trace of a bone, shell, microbe, plant or animal that has been preserved in rock for a very long time
Sometimes animal and plant remains are mixed in with the sediments and preserved as fossils. On the seabed, this process can continue in the same place for millions of years and can create layers of sediment many metres high containing fossils from different time periods, with the oldest at the bottom.
Try this 7.2
Deposits on a lakebed
Aim
To model and observe how sediments are deposited on a lakebed
Materials
• soil
• sand
• gravel
• water
• jar with lid
Method
1. Add soil, sand and gravel to a jar and mix them. Fill the jar to halfway.
2. Add water. Fill the jar three quarters full and put the lid on.
3. Make sure the lid is tight and shake the jar for one minute. How do you predict the particles will settle?
4. Observe how the particles settle. Time how long it takes for each layer to form.
Results
Draw a diagram representing the different layers and label them.
Discussion
1. Do the larger particles end up on the top layer or the bottom layer?
Heat and pressure
Rocks that are deep underground may be exposed to extreme pressure, high temperature or both. This can change the nature of the rock, often making it harder and denser. These processes create metamorphic rocks. Mudstone is a sedimentary rock made from mud. When it is exposed to high pressure and temperature it turns into slate, a metamorphic rock. If the temperature and pressure are increased again, it turns into schist, another type of metamorphic rock.
UNCORRECTEDSAMPLEPAGES
Quick check 7.5
1. In order to understand the unique characteristics of different types of rocks, it is essential to examine how they are formed. Distinguish between the three kinds of rock in terms of how they are formed.
Uplift
Uplift refers to the movement of rocks from deeper parts of Earth,s crust to the surface. This occurs through tectonic activity, volcanic eruptions or erosion of overlying rock layers. As rocks are uplifted, they are exposed to environmental processes, including weathering, erosion and deposition. These processes can break down and reshape the rocks, leading to the formation of new sediments and minerals. Uplift is also involved in the creation of mountain ranges, as tectonic forces cause rocks to be pushed upwards and folded into complex structures.
Explore! 7.2
koikyennuruff
Koikyennuruff (the Stirling Range) is a mountain range located in the southern part of Western Australia, stretching 65 kilometres from east to west. The formation of Koikyennuruff is primarily due to uplift, a geological process that took place over millions of years.
The uplift was caused by tectonic forces that pushed Earth’s crust upwards, raising the ancient rocks of the region. Initially, these rocks were sediments deposited in a sea around 2000 million years ago. Around 1140 million years ago, tectonic movements caused these sediments to be pushed up and heated, transforming them into quartzite, slate and other rocks. This uplift resulted in the creation of Koikyennuruff and its dramatic peaks.
UNCORRECTEDSAMPLEPAGES
Over time, erosion has further shaped the range. The forces of wind and rain have worn down the mountains, carving out deep valleys and creating the spectacular rugged formations seen today. The unique climate created by the range’s height and its surrounding lowlands has led to a rich diversity of wildflowers, with many species found only in this region.
Figure 7.19 Slate is a metamorphic rock formed when mudstone is subjected to high pressure and temperature.
Figure 7.20 Pieces of schist, formed when slate is subjected to high temperature and pressure
Figure 7.21 Koikyennuruff
radioactivity energy released from the nucleus of an atom when the atom decays
Energy sources for the rock cycle
It takes a lot of energy to move rocks around, break them up, heat them until they melt, or change them physically or chemically.
Type
of
rockSource of energy
Metamorphic
IgneousEarth’s formation and elements that are radioactive
SedimentarySun
Details
When Earth was formed, it contained radioactive atoms left over from a supernova. This radioactive energy has been released ever since and is what keeps the centre of Earth at a high temperature.
The energy of the Sun causes weathering through rain, wind, waves and ice formation. It also causes rocks to heat up during the day and cool down at night.
Table 7.2 The energy required for the formation of the different rock types comes from different sources.
Speed of rock formation
Different rock formation processes occur at different rates, and the speed at which they occur depends on various factors, such as the type of rock being formed, the environmental conditions and the geological processes involved.
Type of rock
UNCORRECTEDSAMPLEPAGES
General speed of formation
IgneousDays to months (extrusive igneous rocks); up to millions of years (intrusive igneous rocks)
Extrusive: obsidian and pumice (which are non-crystalline) can cool and form in minutes to days, while basalt takes weeks or months, dependent on the basaltic lava flow.
Intrusive: can take thousands to millions of years due to the slow cooling of magma. Slower cooling leads to larger crystals.
MetamorphicMillions of years.
Requires existing rock to be subjected to heat and pressure for recrystallisation. May occur more rapidly at tectonic plate boundaries due to shearing forces, but still over long geological timescales.
SedimentaryThousands to millions of years.
Deposition of sediment can occur very quickly (e.g. landslides) or slowly (e.g. coral reef growth). However, compaction and cementation generally take millions of years to form solid sedimentary rock.
Table 7.3 The speed at which rocks form can vary widely.
Did you know? 7.4
Radiometric dating
Scientists can measure the amounts of different types of radioactive elements in a metamorphic or igneous rock. They compare them to calculate the age of the rock. So far, the oldest terrestrial rock to be discovered on Earth is a piece of metamorphic rock called gneiss from Canada that is estimated to be between 3.8 and 4.3 billion years old. It was formed long before there was life on Earth, and it is almost as old as Earth itself.
Figure 7.22 This piece of rock is a sample of Acasta Gneiss, the oldest body of rock yet discovered on Earth.
Try this 7.3
Rock
cycle poster
Make a poster of the rock cycle and annotate it with details of the different processes you have learned about in this section. You are going to add to this poster in section 7.2, so make sure you leave space around the outside for extra information about the types of rocks.
UNCORRECTEDSAMPLEPAGES
Section 7.1 questions
Remembering
1. Recall the name of the layer on Earth in which rocks are formed and reformed.
2. In Scotland, James Hutton saw igneous rock with millions of years’ worth of sedimentary rock lying on top of it. Recall two observations that Hutton published after seeing this.
3. Name the most common type of rock exposed on Earth’s surface.
Understanding
4. Copy the image of the rock cycle in Figure 7.23 and label the missing processes. Then explain each of the processes.
5. Summarise how the different types of rock from the previous question are formed.
Applying
6. Make use of what you have learned about weathering to identify one reason why weathering is important to the rock cycle and one reason why we might want to stop weathering.
7. Imagine that Earth’s core suddenly lost its thermal energy. Identify which type(s) of rock formation would be affected and explain why.
Analysing
8. Contrast rocks, minerals and crystals.
Evaluating
9. Examine Figure 7.24 and decide whether it is a mineral or a rock. Justify your answer.
10. ‘Once igneous rocks are formed, the only physical change they can experience is being broken down into smaller pieces until they are melted again.’ Discuss whether you agree with this statement and provide your reasoning.
Figure 7.24 Mineral or rock?
Section 7.1 review
Online quiz
Go online to access the interactive section review and more!
Section questions
Teachers can assign tasks and track results
Igneous rock
Metamorphic rock
Sedimentary rock
Heat and pressure
Magma Sediments
Figure 7.23 The rock cycle
Types of rocks
7.2 Types of rocks
Learning goal
At the end of this section, I will be able to:
1. Describe the formation of igneous, sedimentary and metamorphic rocks.
Igneous rocks
Beneath Earth’s thin outer crust is molten and semi-molten rock, called magma. When the surface crust becomes fractured, thin or weakened, molten magma can reach the surface and a volcano is formed. You may recall from the previous section that igneous rocks are formed when lava cools quickly following a volcanic eruption, sometimes within minutes. Igneous rocks can also be formed when magma cools and solidifies slowly underground in a magma chamber after it has been pushed close to the surface.
extrusive describes igneous rocks formed on Earth’s surface; also called volcanic rocks
intrusive describes igneous rocks formed underground; also called plutonic rocks
UNCORRECTEDSAMPLEPAGES
The crystals within igneous rocks can be used to identify them. The crystals may be anything from several centimetres long to visible only with a microscope. The size of the crystal gives a clue to how long the igneous rock took to cool and, hence, how close to the surface the rock was formed. When magma breaks through the crust and flows on the surface, it is called lava. The lava solidifies to form extrusive igneous rocks. Basalt, an igneous rock, has the interesting property of forming large hexagonal pillars as it cools. Pumice, also an extrusive igneous rock, floats on water!
Another way for molten magma to form rocks is if it stops and cools before it gets to the surface and solidifies underground. This rock will cool more slowly and so there is more time for crystals to grow, which means the individual crystals are bigger. Igneous rock formed in this way is called intrusive or plutonic. Although this rock is hidden when it is formed, it can be exposed later when the layers above have been eroded. Granite is an example of a plutonic igneous rock formed beneath the surface of a volcano. It is often used to make kitchen benchtops.
7.26 The hexagonal pillars of basalt found at the Giant’s Causeway in Northern Ireland are an example of lava flowing onto the surface, solidifying and forming igneous rock.
7.27 An example of intrusive igneous rock. This unusual landform in New South Wales contains the remains of an ancient volcano. Belougery Spire, on the left, was the magma chamber. The Breadknife, running along the right, was a crack in the volcano that filled with magma.
Figure 7.25 Igneous rock and lava in Hawaii
Figure
Figure
UNCORRECTEDSAMPLEPAGES
Did you know? 7.5
Banded iron formations
Banded iron formation is a type of layered sedimentary rock made up of alternating bands of chert and iron oxide, which can range from silver to black. It is the primary source of iron ore and is found in various regions across Western Australia.
The Hamersley Province in north-western Western Australia contains the world’s thickest and most extensive banded iron formations, which are approximately 2.45 to 2.78 billion years old.
Banded iron formation is particularly interesting because it no longer forms on Earth today, providing evidence of ancient processes that are no longer active. These formations originated in ancient oceans that were beginning to experience increased oxygen levels, providing a record of the chemical conditions of these early oceans.
1. List three examples of igneous rocks.
2. Describe in your own words how intrusive and extrusive igneous rocks are formed.
3. Describe the relationship between crystal size and the time the crystal takes to form.
Crystals
and cooling rate
Aim
To determine the effect that cooling rate has on crystal size formation
Planning
1. Write a rationale about crystal growth and the factors that can affect it.
2. Write a specific and relevant research question for your investigation.
3. Identify the independent, dependent and controlled variables.
4. Write a hypothesis for your investigation.
5. Write a risk assessment for your investigation. Investigation 7.1
Figure 7.28 (a) Granite has a distinctive mosaic of crystals of different colours, while (b) obsidian has a glassy black surface.
Figure 7.29 Banded iron formations at Dales Gorge
clasts
small pieces of preexisting rock that form a sedimentary rock conglomerate sedimentary rock composed of rounded rock fragments larger than two millimetres
Materials
• saturated potassium nitrate or magnesium sulfate solution
• water
• test tubes
• beakers
• ice
• hand lens
UNCORRECTEDSAMPLEPAGES
Method
Using the materials above, design an experiment to investigate how cooling rate affects the size of crystals formed from saturated potassium nitrate or magnesium sulfate.
Hint: To create crystals, you need to use a saturated solution of potassium nitrate or magnesium sulfate.
Results
Record your results. Consider different ways your results could be presented.
Discussion
1. Describe any patterns, trends or relationships in your results.
2. Explain any trends you have identified.
3. Identify any limitations in your investigation.
4. Suggest some improvements for this experiment.
Conclusion
Draw a conclusion from this experiment, using data to support your statement.
sedimentary rocks
There are three different types of sedimentary rocks: clastic, organic (biological) and chemical. Each type is formed from pieces of other existing rock or organic material and can take thousands to millions of years to form.
Clastic sedimentary rocks are made up of small pieces of other rocks, which are called ‘clasts’. Over time, clasts can be transported by wind, water, ice or other forces and then deposited in a new location. Eventually, the layers of clasts become compacted and cemented together to form a solid rock. Sedimentary rocks can be classified based on their texture, composition and origin.
Clastic sedimentary rocks
Sedimentary rocks mainly made of gravel
Conglomerate is a poorly sorted coarsegrained sedimentary rock that is composed of large rounded clasts that are greater than two millimetres in size, along with sand and claysized particles in a cementing matrix of quartz or calcite. The clasts in a conglomerate are usually well rounded as they have been transported a long distance from their source, indicating a highenergy environment, such as a river or beach.
Figure 7.30 Conglomerate displays a random pattern of rounded clasts.
Breccia is also a coarse-grained sedimentary rock, but it is made up of large, angular clasts that have been cemented together. The clasts in a breccia are usually less rounded than those in a conglomerate and have been transported a shorter distance. Breccia often forms in areas where there has been a lot of tectonic activity or landslides, as the rocks are broken into angular fragments during these events.
Sedimentary rocks mainly made of sand
Sandstone is a medium-grained sedimentary rock that is made up of sand-sized silicate grains. The sand grains are typically well rounded, indicating a long period of transport and weathering. Sandstone varies in colour and composition depending on the minerals that make up the sand grains. Most sandstone is composed of quartz or feldspar.
Uluru is a sedimentary rock made of sandstone, but the layers are almost vertical. The rock that forms Uluru would originally have been horizontal, but over time the movement of Earth’s crust tilted it. The top of the rock has been weathered and eroded, until today just the end is showing. This is evidence that Earth is very old.
Sedimentary rocks mainly made of silt or clay
Mudrocks are fine-grained sedimentary rocks composed of silt and clay-sized particles, which are abundant on Earth’s surface. Mudstone is typically deposited in low-energy environments, such as swamps or lakes, where the water is calm enough for fine particles to settle out. The particles in mudstone (see Figure 7.35) are too small to be visible to the naked eye. Shale is another type of mudrock that can be easily split into layers, or laminations, due to the flat shape of the clay particles. When exposed to high temperatures and pressure, it becomes the metamorphic rock, slate, which is used as a roofing material in some parts of the world.
breccia sedimentary rock composed of angular broken pieces of rock larger than two millimetres
sandstone sedimentary rock composed mainly of sand-sized silicate grains
UNCORRECTEDSAMPLEPAGES
Figure 7.31 Sedimentary rock made from angular pebbles is called breccia.
Figure 7.32 The Bungle Bungle Range is famous for its distinctive banded domes, which are composed of sandstone that was deposited around 360 million years ago.
Figure 7.33 Uluru is an ancient sedimentary rock tilted nearly 90° by the movement of Earth’s crust.
Figure 7.34 Wulingyuan in China is noted for more than 3000 quartzite sandstone pillars and peaks.
UNCORRECTEDSAMPLEPAGES
Table 7.4 Wentworth grade scale for classifying particles
Biological sedimentary rocks
Organic or biological sedimentary rocks are formed from the remains of living things, such as plants, animals or shells. Over time, these remains can accumulate and become buried and, with high pressure, they become compacted and cement together to form a solid rock. For example, chalk is made up almost entirely of the microscopic skeletal remains of a type of plankton called coccolithophores. These organisms are covered in small plates made of calcium carbonate, which accumulate on the ocean floor when they die and sink. Over time, these plates are compacted and cemented together to form chalk.
Uncorrected 2nd
Sometimes, gaps in the chalk fill with dissolved silica (from sea creatures with silica-rich skeletons) and form flint nodules. Flint was one of the first substances used to make tools.
Other examples of organic sedimentary rocks include coal, which is made from compressed plant material, and limestone, which is formed from the deposition of calcium carbonate sediments from the shells and skeletons of sea creatures.
Explore! 7.3 how coal is made
UNCORRECTEDSAMPLEPAGES
Organic material from living creatures can also form sedimentary layers. Layers of plant material form coal, while oil is formed mostly from plankton.
Research the following questions.
1. List three different uses for coal.
2. Coal is a non-renewable resource. Are there any alternatives to coal for the uses you listed in the previous question?
Figure 7.36 Coccolithophore cells covered with calcium carbonate scales
Figure 7.37 A flint nodule found in chalk. Flint is a chemical sedimentary rock as it is formed from dissolved silica.
Figure 7.38 How coal is formed. Left: In the Carboniferous Period, trees died and formed a layer of wood. Middle: The wood was compressed by the layers of sediment above. Right: The compressed wood was transformed by heat and pressure into coal.
Figure 7.35 Fossilised leaves in mudstone
Chemical sedimentary rocks
Chemical sedimentary rocks are formed when minerals dissolved in water (such as calcium carbonate or salt) precipitate out and form solid crystals. Over time, these crystals can accumulate and become cemented together to form a solid rock. Limestone can also form from the precipitation of calcium carbonate, and in this case it is considered a chemical sedimentary rock rather than a biological one. Rock salt is another chemical sedimentary rock, made of halite, a mineral composed of sodium chloride (NaCl).
7.39 The Henderson Cliffs, composed of tamala limestone, in Beeliar Regional Park
Did you know? 7.6
Identifying underground resources
7.40 Rock salt is a sedimentary rock made of halite, a mineral composed of sodium chloride, NaCl.
UNCORRECTEDSAMPLEPAGES
Advances in deep earth imaging techniques have greatly enhanced our ability to identify and locate mineral, energy and water resources beneath surface sedimentary rock. One technique is seismic reflection imaging, which uses sound waves to create images of subsurface structures. By analysing the way that these sound waves bounce off different layers of rock and other geological features, detailed 3D models of Earth’s interior can be built. This technique has been particularly useful for identifying oil and gas reservoirs, as well as underground aquifers. Another technique is magnetotelluric (MT) imaging, which measures variations in Earth’s natural electromagnetic field to identify subsurface structures. This has proven especially effective for identifying mineral deposits, as different minerals have unique electrical properties.
Did you know? 7.7
Coral beaches
While most beaches are made of quartz sand, some beaches near coral reefs are entirely composed of tiny fragments of coral made of calcium carbonate. These coral-derived sands are formed through the natural breakdown of coral skeletons and other marine organisms by wave action, weathering and grazing from marine animals like parrotfish. As a result, the sand on these beaches tends to be lighter in colour and has a different texture compared to typical quartz sand.
Figure 7.41 Fragments of coral found on a coral beach
Figure
Figure
Sedimentary rock type
ClasticShale
Example Features
Low-res
Mostly compacted clay minerals, easily split into layers
Mudstone and siltstoneVery fine grains of sand and silt
Sandstone Fine to coarse grains
Breccia
UNCORRECTEDSAMPLEPAGES
Angular fragments of pebbles and/or boulders held together by a matrix of clay, silt and/or sand
ConglomerateRounded fragments of pebbles and/or boulders held together by a matrix of clay, silt and/or sand
BiologicalCoal
Limestone
ChemicalLimestone
Rock salt
Gypsum
Metamorphic rocks
Compacted plant remains, composed mostly of carbon
Composed of broken shell fragments, corals, composed mostly of calcium carbonate (calcite)
Formed by the precipitation of calcium carbonate
Formed by the evaporation or precipitation of sodium chloride
A crystalline mineral composed of calcium sulfate that is found in sedimentary rock
The third type of rock in the rock cycle is metamorphic rock. Earth’s crust is very thin in proportion to its size, and the rocks that lie beneath the surface are subjected to high pressure and temperature. Metamorphic rocks are either igneous or sedimentary rocks that have been irreversibly changed by being subjected to these conditions. For example, if limestone (sedimentary) is subjected to high pressure and temperature, it turns into marble (metamorphic).
Rocks that have been changed into metamorphic rock tend to be denser and harder than before. Layers may become twisted when rocks are metamorphosed. Over millions of years, buried metamorphic rocks can eventually make their way to the surface again. These rocks are found all over the world and they constitute about 10% of Earth’s surface.
Foliated metamorphic rocks have a layered or banded appearance, with the mineral grains arranged in parallel layers. This banding is the result of the intense pressure and heat that the rock experienced during its formation. The pressure causes the mineral grains in the rock to realign, giving the rock a distinct pattern. Examples of foliated metamorphic rocks include schist, gneiss and slate.
Figure 7.42 Folds in schist (a), gneiss (b) and slate (c)
Table 7.5 A summary of sedimentary rocks
Non-foliated metamorphic rocks, on the other hand, do not have a layered or banded appearance. Instead, they have a more uniform texture and composition. Examples of non-foliated metamorphic rocks include marble and quartzite.
VIDEO Igneous, sedimentary and metamorphic rocks a b
UNCORRECTEDSAMPLEPAGES
Try this 7.4 Metamorphic pasta
You will need the following materials:
• 2 textbooks
• penne pasta (or any long type of pasta)
Scatter the pasta around in a random manner on a flat surface, between the two books, as shown in Figure 7.44. Keeping the book spines parallel to each other, slowly bring the spines together, with the pasta pieces in between. As the pasta pieces are compressed, they should align. How does this demonstrate the way in which metamorphic rock is formed?
7.44 As you compress the pasta, the pieces align.
Quick check 7.7
1. Recall how sedimentary rocks are formed.
2. List three examples of sedimentary rocks.
3. Describe how metamorphic rock is formed.
4. Recall three examples of a metamorphic rock and what components make up each one.
Figure
Figure 7.43 (a) Marble and (b) quartzite
Try this 7.5
Chocolate rock cycle
You can model the rock cycle using chocolate, which can be easily weathered, heated, cooled and compressed, unlike rocks. By creating ‘sedimentary’, ‘metamorphic’ and ‘igneous’ chocolate, you can model the transformations that rocks undergo over time.
Be careful Do not consume food items in the laboratory.
You will need blocks of dark and white chocolate, aluminium foil or cupcake holders, hot water and a plastic knife or scraping device.
To create the ‘sedimentary’ chocolate, scrape small shavings from the chocolate blocks and put them onto a piece of aluminium foil. Fold over the foil and press down, creating chocolate that represents sedimentary rock.
To make the ‘metamorphic’ chocolate, place a small pile of sedimentary chocolate, unused shavings and small chunks of chocolate into aluminium foil or a cupcake holder and float this on warm water. The heat from the water will melt the chocolate, and after removing the foil, the partially melted and cooled chocolate will resemble metamorphic rock.
To create ‘igneous’ chocolate, place a small pile of sedimentary and metamorphic chocolate, along with chunks of chocolate, into aluminium foil or a cupcake holder and float this on hot water. Watch as the chocolate melts into a smooth liquid, then carefully remove the foil and allow the molten chocolate to cool. This melted and cooled chocolate represents igneous rock.
Try this 7.6
summing up
Using the poster you began in Section 7.1, annotate it with information about the three different rock types you have learned about and their characteristics and examples.
Explore! 7.4
stone pigments
Aboriginal and Torres Strait Islander Peoples use paints, dyes and pigments originating from plant, animal and mineral sources.
1. Investigate one of the following pigments and what rock (sedimentary/ metamorphic/igneous) or mineral is used, as well as the chemical and/or physical processes involved:
• red pigment
• black pigment
SAMPLEPAGES
• white pigment
Figure 7.45 Wandjina rock art
2. Fixatives can be applied to paints, enabling the pigment to bind to surfaces and increase the durability of the paintings. Name some fixatives historically used by Aboriginal and Torres Strait Islander Peoples.
Fossils
The bodies of different organisms may be deposited in sediment and form part of the sedimentary rock – this is how they become fossils. Fossils can include footprints of animals or faeces (coprolites). There are various types of fossils, depending on how the impression was formed. Some common types are listed in Table 7.6.
Fossil type
UNCORRECTEDSAMPLEPAGES
Details
MouldWhen a plant or animal decays in sediment, it may leave a hollow impression of itself.
Image
Figure 7.46 The mould of an ammonite
CastWhen an animal or plant dies, its body creates a space in the sediment. This gap fills with minerals, such as silica, over time, and the shape of the animal is preserved as rock.
Figure 7.47 A fossilised trilobite, an extinct creature that once dominated life on Earth ImprintThese fossils leave behind a twodimensional (flat) print.
Figure 7.48 Leaves are pressed flat by the pressure in the sedimentary layers and all that is left is a dark area, like a shadow.
True form/ whole body
Indirect or trace
This is the most common type of fossil. It consists of parts of the remains of living things, mainly the hard parts, e.g. teeth, shells, bones.
Figure 7.49 True form fossils are also found intact in a medium such as amber (tree resin that has become fossilised).
These fossils do not consist of part of the organism. They are indirect records of biological activities, such as footprints, teeth marks or burrow marks.
Figure 7.50 From a set of footprints, scientists can tell how fast the animal was moving, whether it was solitary or moved in groups, and how heavy it was. One example is dinosaur footprints in the Broome sandstone.
Table 7.6 Five common types of fossils
how did it become extinct?
The fossil record is the history of life as it is seen from fossils. It can tell us about groups of animals that are extinct, such as dinosaurs, and how animals and plants relate to each other. Unfortunately, the fossil record is incomplete because specific conditions are required for fossilisation to take place. Not all dead things become fossils.
Interpretation of the fossil record has always presented difficulties for palaeontologists (scientists who study fossils). For example, for many years it was believed that the extinction of dinosaurs was gradual, but in 1980 evidence was found of a meteor impact that is now thought to have caused mass extinction. Also, disappearance from the fossil record does not always mean that a species is extinct; there may be many other reasons for its absence from the record.
UNCORRECTEDSAMPLEPAGES
Palaeontologists Steven Holland and Mark Patzkowsky designed computer models to aid the study of mass extinctions, and are using the models to decipher the fossil record more accurately. Their work is still in progress; however, it provides an initial guideline for analysis and assessment of extinction events.
Section 7.2 questions
Remembering
1. Recall the name that is given to rocks formed during a volcanic eruption.
2. Recall the name given to rocks formed when sedimentary rocks change due to high temperature and pressure.
3. Recall the name of sedimentary rocks formed from small, rounded rocks.
4. Name five common fossil types.
Understanding
5. Summarise how marble is formed and what type of rocks are involved.
6. Explain how the vertical layering of the rock forming Uluru indicates that Earth is old.
7. Use what you have learned about igneous rocks to explain how the rock formation if Figure 7.52 came to be.
Figure 7.51 Computer models can aid research in various fields, including the study of fossils.
Section 7.2 review
Online quiz
Go online to access the interactive section review and more! Section questions Teachers can assign tasks and track results
Figure 7.52 A set of basalt columns at Organ Pipes National Park in Victoria
Applying
8. Look at the igneous rocks in Figure 7.53. Identify which one is intrusive and which is extrusive. Explain your reasoning by first recalling the difference between intrusive and extrusive.
Figure 7.53 Which one is intrusive and which is extrusive?
UNCORRECTEDSAMPLEPAGES
Analysing
9. Classify the types of fossils shown in Figure 7.54.
Figure 7.54 Types of fossils
Evaluating
10. Discuss why the water in the Swan River is brown (see Figure 7.55). Use the following terms in your explanation: particles, sediment, weathering, erosion, deposit, rock.
Figure 7.55 Why is the water brown?
11. ‘This rock is clearly seen to be made of distinct and different layers. Therefore, it must be a rock, not a mineral.’ Evaluate this statement and explain your reasoning.
7.3 Classifying and using rocks
Learning goals
At the end of this section, I will be able to:
1. Classify rocks based on their physical properties, using a dichotomous key.
2. Classify minerals based on their physical properties, using a dichotomous key.
3. Describe the traditional geological knowledges of Aboriginal and Torres Strait Islander Peoples that are used in the selection of different rock types for different purposes.
Classifying rocks and minerals is a skilled job, but it can be simplified by knowing some of the key characteristics of the different rock types, as well as the tests that can be done on rocks and using a dichotomous key. Dichotomous keys provide a framework for classifying a sample based on observable characteristics and a series of yes/no questions.
Did you know? 7.8
Dangerous rocks
Most minerals and rocks are harmless. However, some can pose a hazard and need to be handled with care. Beware of handling some metal ores, especially those containing mercury, lead or copper, and always wash your hands after handling rocks. Asbestos, which contains crystals in the form of fibres, is dangerous when airborne and is known to cause cancer of the lung.
Identifying minerals
Minerals can appear similar to one another, so geologists use a series of tests that can identify minerals based on their properties.
Colour
Minerals exist in a variety of colours but cannot be correctly identified based on this characteristic alone, for two reasons:
1. The same mineral can exist as different colours, due to impurities.
2. Two different minerals can appear the same colour.
Lustre
In addition to colour, the mineral may be described according to its lustre – how dull or shiny the surface is and therefore how it interacts with light. You may sometimes hear minerals described as resembling other materials, such as ‘pearly’ or ‘metallic’.
Figure 7.56 Asbestos is a dangerous mineral and should not be handled.
ore a rock that can be mined and smelted to produce a metal
opaque blocking light completely
translucent allowing some light through, but no clear image can be seen through the substance
transparent allowing light to pass through, and a clear image can be seen through the substance
streak test
a test used to help identify a mineral by scratching a rock on a hard ceramic tile
Mohs scale
a scale from 1 to 10 that indicates the relative hardness of a mineral
Transparency
Minerals may be opaque, which means no light passes through them. Others are translucent, allowing the passage of some light, or transparent, allowing light to pass through and a clear image to be seen through them.
Streak
When a mineral is scratched onto a hard ceramic surface, it can leave behind a coloured streak, which is a more reliable indicator of its colour than the colour of its surface. For example, gold and pyrite (fool’s gold) have a similar surface colour, so a streak test is useful to distinguish between them.
Hardness
Three polished translucent samples of quartz. The yellow form is often referred to as citrine and the purple form as amethyst. Amethyst can be found inside all three types of rocks – igneous, metamorphic and, less commonly, sedimentary.
Geologists use the Mohs scale, developed by Friedrich Mohs in 1812, as a measure of mineral hardness. Minerals are rated according to their ability to scratch each other, on a scale from 1 to 10. Any mineral with a high Mohs scale number can scratch any mineral with a lower number. The softest mineral, having a value of 1 on the Mohs scale, is talc (metamorphic), and the hardest is diamond (metamorphic), having a value of 10. Your fingernail is about 2.5 and a steel knife is about 5.5. A set of tools called Mohs picks can be used to determine where on the Mohs scale a mineral in an unknown rock lies. For example, if a mineral can be scratched by pick number 6 and not by pick number 7, then it has a hardness of 6.
Figure 7.57
Figure 7.58 Examples of a streak test
Figure 7.59 The streak test for (a) gold shows up as gold, while the streak test for (b) pyrite, also known as ‘fools gold’, shows up as a dark green-grey.
Figure 7.60 A set of Mohs hardness picks for assessing minerals using the Mohs scale
Cleavage
The way in which atoms are arranged in a mineral will determine how the mineral breaks, or fractures, when struck. Cleavage is the tendency of a mineral to break (cleave) along identifiable lines of weakness according to its crystalline structure.
Identifying minerals
Aim
To design and use a key to identify different minerals based on their physical properties
Materials
• a variety of minerals (e.g. quartz, calcite, feldspar, mica, gypsum, talc)
• streak plates (or white porcelain tiles)
• magnifying glass
• rulers
Method
1. You will be given a set of named mineral samples.
2. For each mineral, record the following observations:
Colour: Write down the overall colour of the mineral.
cleavage the tendency of a mineral or rock to break in a particular way because of its structure
UNCORRECTEDSAMPLEPAGES
• scratch test kit (e.g. a set of common objects with known hardness, like a steel nail)
• mineral identification chart (optional)
• paper and pens for recording observations
Streak: Rub the mineral on a streak plate (or white tile). What colour does the streak leave behind?
Lustre: Does the mineral have a shiny (metallic) or dull appearance?
Hardness: Perform a scratch test using the materials provided. Can the mineral be scratched by a coin, glass or steel nail?
Transparency: Is the mineral transparent (you can see through it), translucent (you can see light through it) or opaque (you cannot see light through it)?
Cleavage: Does the mineral break in flat, smooth pieces or jagged edges?
3. Based on the physical properties you observed, create a dichotomous key to help identify the minerals. Your key should have yes/no questions that guide someone to the correct mineral.
Example of a key step:
Is the mineral transparent or opaque?
Yes → Go to Step 2
No → Go to Step 3
4. Use the key you created to identify the mineral samples. Follow the steps carefully and see if your key leads to the correct mineral identification.
5. If your key doesn’t work as expected or is confusing, try to improve it. Revisit the properties and adjust your questions to make them clearer or more specific.
Conclusion
Discuss your experience in class. What worked well when using the key? What challenges did you face? How can classification keys be useful in real-life situations, such as in mining or geology?
Extension
Test your key on an unknown mineral sample and see if you can identify it.
Research how mineral identification is used in industry and create a short presentation for the class.
Practical 7.1
Figure 7.61 (a) Muscovite (the most common mica mineral) features flat cleavage planes like the pages of a book. (b) Galena is a mineral that cleaves into identifiable cubes.
Quick check 7.8
1. Define an ore and explain why some are harmful.
2. List the six characteristics of minerals that can be used to help classify them.
Identifying rocks
UNCORRECTEDSAMPLEPAGES
The six mineral identification tests are useful for helping you to identify specific rocks according to their chemical composition. However, the physical properties of a rock, such as the presence and size of crystals and grains, and their density and overall colour, allow you to classify them according to how they have been formed.
1. Igneous rocks – formed from cooling molten rock: either intrusive or extrusive. They can differ in colour and texture but tend to be hard and homogeneous (no layers). Some have holes because of gas that was trapped as the lava cooled. Some are characterised by visible crystals.
2. Sedimentary rocks – formed from layers of sediment being compacted and cemented together. They often appear grainy and may contain fossils. They may be easy to crumble.
Figure 7.62 Examples of igneous rock are (a) pumice and (b) diorite.
Figure 7.63 Examples of sedimentary rock are (a) rock salt and (b) limestone.
3. Metamorphic rocks – igneous, sedimentary or other metamorphic rocks that have been subjected to high pressure and/or temperature. They often appear layered (foliated) and may have crystals arranged in bands. Metamorphic rocks are typically hard and dense.
Crystal size and shape
Most igneous and metamorphic rocks are composed of crystals. Some crystals are visible to the naked eye, while others require the use of a microscope or hand lens to be seen. Fast-cooling lava creates small crystals in extrusive igneous rocks, while slow-cooling magma produces larger crystals in intrusive igneous rocks. If the crystals are intergrown (knitted together throughout the rock sample) then it is likely to be igneous, whereas if the crystals are arranged in layers or bands, the sample is likely to be a metamorphic rock.
Grain size and shape
UNCORRECTEDSAMPLEPAGES
If a rock sample contains visible grains, then it is likely to be a clastic sedimentary rock. Coarse-grained sedimentary rocks feature grains >2 mm in size and include conglomerate and breccia. Sandstone, mudstone and siltstone feature moderately sized grains, while shale is composed of fine grains. The Wentworth grade scale is a tool used by geologists to classify the size of particles in rocks (see Table 7.4).
The size and shape of grains in a sedimentary rock give clues about its history. When the grains are all roughly the same size, the rock is referred to as ‘wellsorted’. This indicates the sediment has travelled a long distance from the source, as larger grains are deposited closer to the source and finer grains are eroded and travel further. A ‘poorly sorted’ sedimentary rock sample indicates the sediment has not travelled far.
Figure 7.64 Examples of metamorphic rock are (a) gneiss and (b) granulite.
Figure 7.65 Gabbro is an intrusive igneous rock with dark crystals visible to the naked eye.
Colour
UNCORRECTEDSAMPLEPAGES
The presence of layers within the rock sample is highly suggestive of sedimentary rock. However, if the layers are folded or deformed, this can indicate a sedimentary rock that has been subjected to heat or pressure and is now a foliated metamorphic rock.
Felsic rocks are light-coloured igneous rocks that have a high silica content. They are enriched with lighter elements such as silicon, oxygen, aluminium, sodium and potassium and feature more than 50 per cent light-coloured crystals. Mafic rocks are rich in magnesium and iron, and feature more than 50 per cent dark-coloured crystals.
Figure 7.66 Rock samples that are (a) mostly felsic, (b) a mix of mafic and felsic and (c) mostly mafic.
Density and porosity
While specific rock types differ in their density, the following general rules apply:
• Sedimentary rocks tend to be less dense than igneous and metamorphic rocks, as they are more porous Sedimentary rocks with larger grains (and more space in between) – particularly well-sorted sedimentary rocks –are more porous than fine-grained rocks.
• Mafic (dark-coloured) igneous rocks tend to be more dense than felsic (light-coloured) rocks.
• Extrusive igneous rocks may have holes (called vesicles) formed from hot gases that were trapped during rapid cooling. Vesicular rocks, such as pumice, scoria and some basalt, are less dense that other igneous rocks.
• Metamorphic rocks, which have been formed under high heat and/or pressure, are often the most dense.
UNCORRECTEDSAMPLEPAGES
Density can be calculated by finding the rock’s mass and dividing this by the volume. To find the volume, you can submerge the rock in a vessel with a known volume of water and measure the new volume. The difference between the two measurements approximates the volume of the rock sample.
Table 7.8 summarises the general characteristics of the three different rock types.
Igneous rock
• May contain holes
• Often contains crystals
• Crystals vary in size from small (invisible to the naked eye) to large.
• Usually hard and dense
Sedimentary rock Metamorphic rock
• Usually contains grains
• Grains are cemented together.
• Grains vary in size from small to very large.
• Usually soft
• Flat layers may be visible.
Table 7.8 General characteristics of the three rock types
using keys to identify rocks
• May feature layers (which can be folded/deformed)
• Often cleaves along a straight plane
• More dense than sedimentary rocks
Now that you’ve explored the mineral identification tests and the physical properties of different rock types, it’s time to challenge yourself to identify specific rocks. There is no one standardised dichotomous key or branching flow chart that is used. An example of a key is shown in Figure 7.68. WIDGET A key to identifying rocks
Try this 7.7
Identifying rocks
With a sample rock from your teacher, work in pairs to use the flow chart in Figure 7.68 to try and identify the rock. To begin with, consider whether the rock is likely to be igneous, sedimentary or metamorphic. Then, with reference to its colour, density and crystal or grain structure, try to identify it by name.
Figure 7.67 Pumice is an extrusive igneous rock with many holes and low density.
Clasts present?
(clastic)
Crystals present?
Identifying 12 common rocks and minerals
Aim
To practise identifying and finding patterns, by classifying 12 of the most common rocks and minerals found in Earth’s crust
UNCORRECTEDSAMPLEPAGES
Materials
• 0.1 mol/L hydrochloric acid
• dropper
• beaker of water
• hand lens
• disposable gloves
• Petri dishes for the hydrochloric acid test ×12
• Two of each of the following rocks: basalt, chalk, gneiss, granite, limestone, mica, pumice, quartz, quartzite, sandstone, schist, slate
Figure 7.69 Twelve common rocks found in Earth’s crust, in random order
Method
1. Use this dichotomous key to identify the rock and the rock type. You can work in 12 groups, each group being responsible for one rock type (each group will hold two rocks: one for the general test and one for the hydrochloric acid test).
Rocks are composed of one or more minerals. For this practical, if a rock is made up of only one type of mineral, identify the rock as a ‘mineral’.
1Is the rock composed of crystals?
2Are the crystals flat and silvery?
3Are the crystals large and transparent?
YesGo to 2
NoGo to 5
Yes Mica (igneous, metamorphic)
NoGo to 3
YesQuartz (igneous) NoGo to 4
4Are the grains small, easily removed by rubbing, and layered?YesSandstone (sedimentary) NoGranite (igneous)
5Do bubbles appear when acid is placed on the rock? You will need to place the rock in the Petri dish and use the dropper to place 1–2 drops of hydrochloric acid on the rock. Do not handle the rock after hydrochloric acid has been added to it.
YesGo to 6
NoGo to 7
6 Using a fresh rock, can the rock be scratched easily with a fingernail? YesChalk (sedimentary) NoLimestone (sedimentary)
7 Place the rock in a beaker of water. Does the rock float on the water? YesPumice (igneous) NoGo to 8
8Is the rock translucent (allows some light to pass through)?
YesQuartzite (metamorphic) NoGo to 9
9Does the rock have visible layers that may be curved or bent?YesGneiss (metamorphic) NoGo to 10
10Does the surface of the rock appear to be made up of plates?YesSchist (metamorphic) NoGo to 11
11Does the rock cleave to form layers with a flat surface?
YesSlate (metamorphic) NoBasalt (igneous)
2. Once you have identified your rock, label it. When all the rocks have been identified, sort them into the four groups: igneous rocks, metamorphic rocks, sedimentary rocks and rocks made up of only one type of mineral.
Results
Copy and complete this table to identify common characteristics of the different types of rocks.
Rocks made up of only one type of mineral Igneous rocks Sedimentary rocks Metamorphic rocks
Common characteristics
UNCORRECTEDSAMPLEPAGES
Discussion
1. Discuss why you think pumice floats on water.
2. Design some rules and a different dichotomous key or chart to classify rocks as minerals, or igneous, sedimentary or metamorphic rocks. Identify any difficulties you encounter in doing this.
Uncorrected 2nd sample
Table 7.9 Dichotomous key for rock identification
Science inquiry 7.2
It used to be hotter
Studying the first billion years of Earth’s evolution has always been uncertain. It is difficult to compare ancient rocks with modern rocks, as the original rocks have often been destroyed or changed over time. Researchers at Louisiana State University have shown that komatiites (three-billion-year-old volcanic rocks) were formed from the hottest lava that ever erupted on Earth. Temperatures were close to 1600°C, which is about 400°C hotter than the volcanic eruptions in modern-day Hawaii!
using rocks
UNCORRECTEDSAMPLEPAGES
The way that rocks are formed determines their physical properties, and this in turn determines their usefulness and value to humans. Table 7.10 gives some common uses of the different types of rock.
Type of rockExamples Properties Uses
Igneous (intrusive)
GabbroGabbro has high durability, scratch resistance and compressive strength.
GraniteGranite is non-porous (withstands spills on benchtop). It also doesn’t react with acidic food. It is hard (resists scratching) and features a range of colours and patterns.
Building materials Sculptures
Igneous (extrusive)
Sedimentary (clastic)
BasaltBasalt is hard, tough, dense and resists fracturing. It has a porous structure that allows water drainage.
Road construction Building materials
PumiceDue to its holes, pumice is lightweight, porous and soft.
SandstoneSandstone is abrasive and has been traditionally used as a grinding stone. Sandstone is durable and can be easily split along its sedimentary planes for use in construction.
An abrasive in cleaning and polishing products
Construction and building materials
Figure 7.70 Komatiite
Benchtops
Figure 7.71 A granite kitchen benchtop
Figure 7.72 A basalt building in Germany
VIDEO Using rocks
Type of rockExamples Properties Uses
Sedimentary (chemical)
Sedimentary (biological)
LimestoneThe carbonate in limestone neutralises acids in soil, raising the pH.
Limestone is a source of calcium, used to make Portland cement (which is mixed with gypsum, water, sand and gravel to make concrete).
Limestone is dense, meaning it blocks heat and sound transfer in buildings.
Rock saltLowers the freezing point of water, so it can be used to melt ice and snow on roads.
Can be processed to form sodium chloride (table salt) for consumption
CoalCoal is abundant and relatively easy to mine and extract energy from via combustion.
Construction
Production of cement, glass and fertilisers
UNCORRECTEDSAMPLEPAGES
Metamorphic (foliated)
Chalk Chalk is soft and porous, meaning it can be washed off surfaces. Its fine-grained texture makes it smooth and comfortable to hold.
SlateSlate is dense and non-porous, making it an ideal roofing material in wet and windy climates.
De-icing roads
Food preservation and flavouring
Metamorphic (non-foliated)
MarbleMarble is hard and durable, in addition to being heat and fire resistant. It is cool to touch and features beautiful patterns/colours.
Table 7.10 (continued)
Fuel
Writing on a chalkboard (which used to be made from slate).
Building materials
Decorative stones
Building materials
Decorative stones
Figure 7.73 The exterior of the Great Pyramid (Giza, Egypt) is clad in limestone.
Figure 7.74 A coal-fired power station
Figure 7.75 Slate roof tiles
Figure 7.76 The marble staircase at His Majesty’s Theatre, Perth
Type of rockExamples
Properties
Pure mineralsQuartzPure quartz is very hard. When melted, the silica crystal structure breaks down, it becomes clear and can be formed while molten.
Uses
Producing glass
UNCORRECTEDSAMPLEPAGES
7.10 (continued)
Traditional geological knowledge
The traditional geological knowledge of Aboriginal and Torres Strait Islander Peoples is based on a deep understanding of the land. This knowledge has been passed down from generation to generation and originates from both observations and spiritual connections to the land.
Aboriginal and Torres Strait Islander Peoples rely on their geological knowledge of the properties of rocks, as well as their understanding of the cultural significance of different rock types (many of which have spiritual or ceremonial value). For example, certain types of rocks have been selected for use because their structural and chemical properties have practical uses for specific tasks. Grinding stones are used to grind and crush various materials and are typically made from abrasive rocks such as sandstone or basalt. In northern Queensland, the local Bama People use a specialised grindstone, known as a morah stone, to process toxic plants, such as the Zamia palm, black bean and cycad. This grooved grindstone is formed from slate, which is hard and non-porous, meaning it would not absorb the toxic chemicals in the plants. The grooves are likely to be made with an even harder rock, such as granite or the mineral quartz.
Aboriginal and Torres Strait Islander Peoples have developed varying techniques for quarrying and crafting stone tools for various purposes. Stone tools are used in day-to-day life for activities such as hunting, harvesting and preparing. Hand quarrying involves identifying and extracting suitable rocks from natural outcrops or from boulder fields. Different groups of Aboriginal and Torres Strait Islander Peoples have used a variety of rocks, such as basalt, sandstone, quartzite, chert and flint, depending on what is available on Country. These rocks are then shaped and transformed into a variety of objects, such as grindstones, hammerstones, anvils, cutting tools and weapons. Analysis of stone tools has revealed elemental compositions that are very different from local quarry sites and rock outcrops, which suggests that specialty stones and tools are carried for use over hundreds of kilometres.
Figure 7.77 Stained glass at the Forrest Chase Complex, Perth
Figure 7.78 Grinding grains using (a) rocks, and (b) a grinding stone
quarrying the removal of rock, sand and minerals from the surface of Earth without deep excavation
Table
Flaked stone tools are produced by striking a hard and brittle silica-rich rock (such as quartzite or flint) with a hammerstone, in order to remove a sharp fragment. These sharp tools can then be used as knives and spear tips. Stone artefacts do not rust or biodegrade, so they provide a valuable source of information about where and how Aboriginal and Torres Strait Islander peoples lived, hunted and prepared food.
Explore! 7.5
stone tools
Aboriginal and Torres Strait Islander Peoples have used a variety of rocks, such as basalt, sandstone, quartzite, chert and flint, depending on what is available on Country. These rocks are then shaped and transformed into a variety of objects, such as grindstones, hammerstones, anvils, cutting tools and weapons. The techniques involved in creating stone tools require knowledge from the various disciplines of science.
Conduct research to investigate the following questions.
1. Explain how having knowledge of the geological, biological, chemical and physical sciences helps to create stone tools that are fit for the intended purpose.
2. Determine why the following rock types are used as the named tools in various Aboriginal and Torres Strait Islander Peoples’ cultures.
a) the use of flint as a cutting tool
b) the use of quartzite as an anvil
c) the use of limestone as a hammerstone
d) the use of sandstone as a grindstone
e) the use of silcrete as a knife blade
f) the use of basalt as an axe head
3. Examples of techniques and methods for toolmaking are knapping, lithic reduction, percussion flaking, pressure flaking and grinding. Describe what each of these processes involves and how they help create stone tools from the raw material.
Explore! 7.6
Culturally significant rocks
Rocks and rock formations hold particular cultural significance for Aboriginal and Torres Strait Islander Peoples. Burringurrah is a place of great spiritual significance for the Wadjari People.
UNCORRECTEDSAMPLEPAGES
Research the spiritual and cultural connection that certain Aboriginal and Torres Strait Islander Peoples have with the following rock formations:
• Walga Rock
• Ngilgi Cave
• Kandimalal
Figure 7.79 Wil-im-ee Moor-ring (Mount William stone axe quarry) located in western Victoria was an important source of raw material for the manufacture of greenstone ground-edge axes, which were traded over a wide area of south-eastern Australia.
Figure 7.80 Burringurrah is a place of great spiritual significance for the Wadjari People.
Section 7.3 review
Online quiz
Section 7.3 questions
Remembering
Section questions
Teachers can assign tasks and track results
1. Name six characteristics that can be used to help classify minerals.
Understanding
2. Igneous rocks may contain holes. Explain why this is the case.
3. Sedimentary rocks often look like the grains are cemented together, and they are often soft. Explain why this is the case.
4. Metamorphic rocks sometimes have a layered look. Explain why this is the case.
Applying
5. Identify the following rocks, using the dichotomous key in Practical 7.2
a) The rock in Figure 7.81 does not bubble when acid is placed on it.
c) The rock in Figure 7.83 bubbles when acid is placed on it. It cannot be scratched easily with a fingernail.
Analysing
b) The rock in Figure 7.82 does not bubble when acid is placed on it. It sinks in water.
d) The rock in Figure 7.84 does not bubble when acid is placed on it. The crystals are not easily removed.
6. Using the rocks in Question 5 and the dichotomous key in Practical 7.1, determine the rock type for each example, and explain how the appearance of each rock links to the rock type.
Evaluating
7. ‘All types of rock can be classified according to their physical characteristics only.’ Discuss whether you agree with this statement.
Go online to access the interactive section review and more!
Figure 7.82 What kind of rock is this?
Figure 7.81 What kind of rock is this?
Figure 7.83 What kind of rock is this?
Figure 7.84 What kind of rock is this?
7.4 The mining process
Learning goals
At the end of this section, I will be able to:
UNCORRECTEDSAMPLEPAGES
1. Describe the six stages of the mining cycle.
2. Describe how the mining of ores and minerals impacts local environments and examine environmental rehabilitation initiatives.
Some minerals are useful to humans and can be mined. Mining is the process by which minerals and other useful materials are extracted from Earth. Salt, slate, gold, marble and coal can be used as they are found. Others need to be processed to make useful products, such as metals or building materials like cement.
The extraction of metals, ores and other materials from Earth has a very long history. Archaeologists have named two periods of human history, the Bronze Age and the Iron Age, according to the metals that people were producing at that time.
The mining process has several stages: exploration, planning and design, construction, mining, processing, and closure and rehabilitation.
1. exploration
Before any mining project begins, mining companies enlist the expertise of geologists to scout areas and search for mineral deposits. It is important that they find out the quality of the mineral and the size of the deposit. This is to determine whether it would be cost effective for the mineral to be mined, as a mining project is extremely expensive once it has started.
Mining companies should also communicate with the traditional owners of the land to ensure that they are aware of any important cultural or archaeological sites so that they can be protected.
In 2020, Rio Tinto blasted a 46 000-year-old Aboriginal sacred site in the Pilbara region, Western Australia. This led to an unreserved apology to the Puutu Kunti Kurrama and Pinikura traditional owners and a call for legislative change to protect Aboriginal and Torres Strait Islander Peoples’ heritage sites at risk of demolition.
pMI guns
In modern mining, new technology is available to confirm a geologist’s identification of a rock in just a few seconds. A positive material identification (PMI) gun uses high-energy radiation (X-rays) to excite the material in a rock and records the response. Each different element has a unique response, like a fingerprint. By analysing the signal given out by the rock, the percentage of each element can be found.
2. planning and design
UNCORRECTEDSAMPLEPAGES
Geologists and geophysicists use a technique called reflection seismology to determine the structure of the rocks that lie beneath the surface. An explosive charge, or other methods, is used to make a loud sound and, as the sound travels down, it is reflected from the layers beneath the surface. Once an area has been identified, a thin cylinder of rock, called a core sample, is extracted to positively identify any minerals found.
If the results of the exploration strongly suggest that mining in a certain area would yield good results, then the project moves into the planning stage. Collaboration occurs among project managers, mining engineers, ecologists, environmental scientists, finance consultants and other experts to design safe, sound, economically viable and socially responsible plans.
Figure 7.86 Miners can use a PMI gun to determine the composition of a rock.
Figure 7.87 Core samples taken from a diamond mine
the use of shockwaves to investigate the structure of rocks underground
Figure 7.88 Social responsibility in
Explore! 7.7
environmental impacts of mining
Mining of ores and minerals can have significant impacts on local environments. Some of the issues caused by mining are listed below.
• soil and water contamination
UNCORRECTEDSAMPLEPAGES
• deforestation and habitat destruction
• land subsidence and sinkholes
• air pollution
• greenhouse gas emissions
• water overuse
These impacts can be long lasting and can have significant consequences for local ecosystems, wildlife and human communities. Mining companies are required to follow regulations and guidelines to reduce these impacts.
The environmental impacts and benefits of mining can be both short term and long term.
Conduct research on recent applications for new projects in your region. What role did government, both state and federal, play in allowing or blocking the application?
3. Construction
After research is carried out, planning is completed and permits are approved, the project moves to the construction stage. This may involve building roads, mining facilities and housing.
4. Mining
Mining is the process by which the minerals are recovered, using various tools and machines. When you think of mining, most people imagine an underground tunnel, which is a technique of mining that goes back to Roman times. Underground mining is highly skilled and can also be dangerous. The advantages of underground mining are that there is generally little impact on the environment, and minerals can be extracted from much larger depths than surface mining.
Another method of mining is called surface mining, such as strip mining and open-cut mining. Large quantities of a mineral can be extracted using this technique. Surface mining can only be used if the mineral is close to the surface. This method has become much more common in recent years, especially for the extraction of metal ores. It is relatively safe compared with underground mining, but there is a significant impact on the environment. Coal and iron ore are usually mined in this way in Australia.
Figure 7.89 Constructing a mining site involves many people, such as construction workers, builders, landscape architects and engineers.
Figure 7.90 An underground coal mine
There has been interest in mining deep-sea deposits, such as manganese–cobalt nodules in the Pacific Ocean; however, there are strong environmental concerns associated with deep-sea mining, and, to date, it is too difficult and expensive.
The depth of mineral deposits and the physical properties of the rock, such as the strength, porosity and density, determine the mining method used. Open-cut mining involves removal of the waste rock (called overburden) that overlies the target ore, and blasting, which is the use of explosives to break up the hard waste rock and ore. This can then be processed to extract the valuable mineral.
Making thinking visible 7.1
here now/there then: Coal mining
UNCORRECTEDSAMPLEPAGES
Coal mining in Australia is controversial for several reasons, including issues surrounding the environmental impact, Indigenous land rights and climate change. Attitudes to coal mining have changed over time.
• Create a two-column table.
• In column A, list present ideas and values about the topic.
• In column B, list past ideas and values about the topic.
• Compare columns A and B.
• Why do you think ideas and values have changed?
• How could we find out more about the ideas and values people had in the past?
The Here now/there then thinking routine was developed by Project Zero, a research centre at the Harvard Graduate School of Education.
Explore! 7.8
Mining extraction processes
There are different types of mining. Underground mining and surface mining are two of these; another two methods are placer mining and in-situ leach mining. Research these methods and answer the following questions.
1. What is involved in placer mining and in-situ leach mining?
2. List some advantages and disadvantages of the types of mining.
3. Which of the mining types have the least environmental impact? Justify your answer.
4. Describe some of the ethical issues that need to be considered with regard to mining.
Explore! 7.9
fully automated mines
Australia has the largest number of autonomous mining trucks in the world. Use the internet to search for ‘Christmas Creek automated mine’. Do some research with regard to advances in mining technology and automation and answer the following questions.
1. Identify the advantages of fully automated mining technology.
2. Assess the concerns that have been raised for fully automated mining. Do you think these concerns are justified?
Figure 7.91 An open-cut coal mine in Australia supplies about 20% of the world’s coal and about 40% of the world’s iron ore.
Figure 7.92 Christmas Creek Mine
smelting the process of extracting a metal from rock by heating it in the presence of carbon electrolysis a method of extracting a metal from its ore or purifying it using electricity
Quick check 7.9
Copy and complete the following table to summarise what you have learned about the mining process so far. Remember, there are still two stages to go, so leave space in your table for these stages.
Mining process Details Examples of people involved
1 Exploration
2 Planning and design
3 Construction
4 Mining
5 6
5. processing
Recall that ore is rock that contains the metal being mined. There are several ways to process the ore so that only the intended metal is extracted.
Grinding
The ore is usually first crushed so that the pieces are smaller and easier to process.
Smelting
Smelting is a process that allows a metal to be extracted from its ore. The ore is heated in the presence of carbon (charcoal) and a chemical reaction takes place that frees the metal from the oxygen it is bound to in the ore.
Purifying
Electricity can be used to purify an impure sample of metal in a process called electrolysis. The sample is connected to a positive terminal and a pure piece of the metal is connected to the negative terminal. The terminals are placed in a solution containing the metal and, when the circuit is connected, the metal in the impure sample slowly moves through the solution from positive to negative. Any impurities are deposited near the positive terminal. When this is done with copper ore, the impurities may contain valuable metals, such as gold.
SAMPLEPAGES
Figure 7.93 Use of electrolysis in purifying copper
Remining
Remining involves extracting valuable minerals from waste materials that have already been mined. Remining critical metals, such as lithium, cobalt, tin, tungsten and indium, can reduce the need for new mining sites. In addition, remining limits the impact on pristine areas, while also providing economic benefits by unlocking additional value from previously mined sites. While remining has not yet been widely adopted in Australia, it is a promising approach that aligns with the growing sustainability priorities of mining companies.
UNCORRECTEDSAMPLEPAGES
electrolysis of copper
Aim
To see how metals can be purified using electricity and to demonstrate electroplating
Materials
• 2 copper plates to act as electrodes
• 2 alligator leads
• a metal fork or spoon
• 0.5 mol/L copper sulfate solution
• beaker
• 3 V DC power supply
Method
Part 1
Be careful
Wear personal protective equipment.
Electrical shocks may occur. Ensure the recommended voltage output is not exceeded. Turn off the power supply when changing the circuit.
1. Place two copper electrodes in a beaker containing a solution of copper sulfate.
2. Connect the electrodes to a battery or low-power direct-current supply (make sure it is switched off when you do this) using alligator leads.
3. Switch it on and leave it for a while (it may take 20–40 minutes). The cathode will slowly grow, and the anode will become smaller.
4. Switch the power supply off.
Part 2
1. Replace the copper plate connected to the negative terminal with a fork.
2. Switch the power supply on. Copper will move from the other plate to the fork. When it reaches the fork, it will be deposited on the surface and a thin layer of copper will appear. This is called electroplating.
Results
Record your observations for each part of the experiment.
Discussion
1. Describe what you think happened when the power supply was switched on in Part 1 of the experiment.
2. Deduce some uses for electroplating, which you saw in Part 2 of the experiment.
3. Distinguish between electrolysis and electroplating.
Practical 7.2
6. Closure and rehabilitation
The final step in mining is closure and rehabilitation. When the resources in a mining site have been exhausted, the site closes down, all facilities are packed up and often removed, and a rehabilitation plan is developed. The purpose of this is to return the land to the state it was in before the mine was built. For example, if it was agricultural land, then the plan would involve trying to restore the land to its original level of productivity. Rehabilitation involves scientists, government personnel, bush regenerators and local wildlife experts, among others.
UNCORRECTEDSAMPLEPAGES
Phytomining can be used as a tool for rehabilitating areas that have been impacted by mining activities. In many cases, mining can leave behind soils that are contaminated with heavy metals and other pollutants, which can have long-term negative impacts on the environment and surrounding communities. Phytomining can be used to help remediate these contaminated soils by using hyperaccumulator plants to absorb and accumulate the contaminants. Once the plants have accumulated the pollutants, they can be harvested and removed from the site, effectively removing the contaminants from the soil. This process not only reduces the amount of pollutants in the soil, but it can also provide a potential source of revenue through the recovery of valuable metals.
Figure 7.94 The sap from Pycnandra acuminata, found in New Caledonia, contains up to 25% nickel by weight.
Did you know? 7.9
Rehabilitation and biodiversity
Rehabilitation of the land also takes into consideration the native plants and animals that were in the site before it was mined. Disturbed areas are reshaped to reflect their original state as closely as possible, and care is taken to preserve plant species. Over 25 years ago, what is now Lake Kepwari was known as Western Five, a significant open-cut coal mine essential for electricity production and central to the local economy. Now, the lake spans nearly 100 hectares and is surrounded by 120 hectares of revegetated land that is home to native wildlife. The area is now safe, stable and non–polluting.
Explore! 7.10
sustainable
mining
Many mining companies are making sustainability a core element in their business strategies. Research how the following practices have increased efficiency and limited environmental impact at mine sites.
• use of renewable energy sources
• waste reduction and recycling
• use of digital technologies such as automation, artificial intelligence and advanced analytics
• regeneration of mine sites
• adoption of circular economy practices
7. The mining industry in australia
The mining industry is one of the most important industries in Australia. Table 7.11 shows a summary of some of the metal resources mined in this country.
Mining and quarrying are not just for metals. Stones are extracted to build roads. Coal, a sedimentary rock, is mined as a major energy source – Australia ranks fourth in the world for coal supply. Limestone, also a sedimentary rock, is quarried to make cement. When sand is mixed with small amounts of limestone and sodium carbonate, then heated until it melts and allowed to cool, it forms glass.
UNCORRECTEDSAMPLEPAGES
Gemstones such as diamonds and opals are mined in Australia, and gemstone mining is a major source of income for some Australian towns. Coober Pedy, for example, is the largest opal-mining area in the world.
Figure 7.95 The rehabilitated Western Five coal mine
Figure 7.96 Australia produces around 95% of the world’s opals.
Resource Details
IronAustralia is the world’s largest exporter of iron ore.
Uranium The worldwide nuclear power industry needs uranium ore as fuel. There are no nuclear power stations in Australia, but about 10% of the world’s uranium is mined here.
GoldAustralia’s early history was highly influenced by gold, as many immigrants came during the gold rush days. Gold mining is still a large industry, and ore containing even a small amount of gold is mined, due to the high value of the gold. Gold mines in Australia account for 9% of the world’s production and some of these mines are huge operations, occupying many hectares.
Table 7.11 Some important metals mined in Australia
Explore! 7.11
Coal mining in Western australia
Coal mining makes up a significant portion of Western Australia’s mining industry, but coal mine sites often face community concerns over the environmental impact of mining and burning coal. Conduct some research and answer the following questions.
1. Name the type of rock that coal is sourced from in Western Australia.
2. Describe the cost and energy advantages of coal.
3. Describe the environmental impacts of mining and burning coal.
Explore! 7.12
Mineral resources in Western australia
Western Australia is rich in mineral resources, supplying valuable materials to Australia and the world. One important resource is bauxite, which is mined in the Darling Range, south of Perth. Bauxite is the main ore of aluminium, a lightweight and durable metal used in construction, transport and packaging. Mining companies extract bauxite and process it into alumina, before refining it into aluminium metal.
Another key resource is diamonds, found in the Kimberley region at the Argyle and Ellendale mines. Argyle Diamond Mine, which closed in 2020, was famous for producing rare pink diamonds, among other types. Diamonds are used in jewellery but also in industry for cutting and drilling tools due to their hardness.
1. Research how bauxite or diamonds are mined and processed in Western Australia.
2. What are the environmental impacts of mining these resources? How are they managed?
3. How do these industries contribute to the Western Australian economy?
UNCORRECTEDSAMPLEPAGES
Figure 7.97 Huntly Mine, located southeast of Perth, mines bauxite.
Figure 7.98 (a) Argyle Diamond Mine, located in the East Kimberley region of Western Australia, and (b) a pink diamond
Quick check 7.10
1. Add the last two mining processes to your table from Quick check 7.9.
Mining process Details Examples of people involved
5 Processing
6 Closure and rehabilitation
2. List some of the metals, rocks and minerals mined in Australia.
UNCORRECTEDSAMPLEPAGES
Section 7.4 review
Online quiz
Section 7.4 questions
Remembering
Go online to access the interactive section review and more! Section questions
Teachers can assign tasks and track results
1. Recall the steps of the mining process, in chronological order.
2. Name three processes that can be used in the processing stage of mining to obtain the intended metal.
3. Recall some metals and resources that are significant for the Australian mining industry.
4. State an example of technological progress in the mining industry and explain how it helps the mining process.
Understanding
5. Explain the importance of performing the exploration stage before designing a mine.
6. Summarise how geologists determine the content and structure of the rocks under the surface.
Applying
7. Imagine you are a mining engineer tasked with developing a new mine. Describe the key factors you would need to consider at each stage of the mining process, from exploration to processing, to ensure the operation is efficient and sustainable.
Analysing
8. Compare surface mining with underground mining, giving at least two advantages and disadvantages of each.
Evaluating
9. Propose why electroplating with silver or gold is a very popular technique in jewellery making.
Chapter review
Chapter checklist
UNCORRECTEDSAMPLEPAGES
Success criteria
7.1 I can describe the role of forces and heat energy in the formation of igneous, sedimentary and metamorphic rocks.
7.1 I can compare how quickly or slowly different rock formation processes can occur.
7.1 I can describe the major processes of the rock cycle. 12
7.2 I can describe and explore the formation of igneous, sedimentary and metamorphic rocks. 3, 4, 5, 13
7.3 I can compare the observable properties of different types of rocks and identify them using a dichotomous key.
7.3 I can describe the tests available to classify rocks. 6
7.3 I can describe the traditional geological knowledges of Aboriginal and Torres Strait Islander Peoples that are used in the selection of different rock types for different purposes.
7.4 I can describe the six stages of the mining cycle. 7
7.4 I can describe how the mining of ores and minerals impacts on local environments and examine environmental rehabilitation initiatives.
7.4 I can describe how Aboriginal and Torres Strait Islander Peoples have used quarrying to access rocks for use as or production of everyday objects.
13, 15
Review
Remembering
1. Name the two types of igneous rock.
2. Name the process that involves heating an ore in the presence of carbon to extract a metal.
3. Recall the stages in the formation of sedimentary rock.
4. Name the two conditions that allow metamorphic rocks to form.
5. Figure 7.99 shows limestone in the Naracoorte Caves of South Australia.
a) Identify the property of the limestone that allows the caves to form. b) Name the geological name for this type of weathering.
Figure 7.99 Naracoorte Caves, South Australia
6. Recall the test for a rock that contains carbonates.
7. Recall the six stages of the mining cycle. Understanding
8. Describe how you can physically distinguish between a rock and a mineral.
9. Describe the difference between igneous rocks that have cooled slowly and those that have cooled quickly.
10. Describe one impact that mining has on local environments.
11. Illustrate a diagram of the rock cycle.
Applying
12. a) Infer the geological process that occurred to produce the formation shown in Figure 7.100.
b) One feature of metamorphic rock is that it can appear layered. The rock shown in Figure 7.101 is layered. However, it is sedimentary rock. Evaluate why this might be the case.
UNCORRECTEDSAMPLEPAGES
Analysing
13. Contrast between breccia and conglomerate.
14. Examine the image in Figure 7.102 and determine whether it is a rock or a mineral.
Evaluating
15. A geological sample is made of a single crystal. Deduce whether or not this geological sample is a mineral and explain your reasoning.
Figure 7.100 The Old Man of Hoy, a 137-metre sea stack made of Old Red Sandstone, located off the coast of Orkney, Scotland
Figure 7.101 Rock layers at Karijini National Park in Dales Gorge
Figure 7.102 Rock or mineral?
16. a) The sedimentary rocks in Figure 7.103 are lying at an angle. Determine the geological event that might have caused this to happen.
b) Figure 7.104 shows a fossil lying on a beach. Deduce where it would have come from.
17. Figure 7.105 shows grooves in sandstone due to many years of Aboriginal or Torres Strait Islander Peoples using it for a particular purpose. Deduce why these grooves have been formed.
7.105 What caused the grooves in the rock?
18. Propose the type of rock that would be the best for use as an axe by Aboriginal and Torres Strait Islander Peoples.
Figure 7.103 The Pilbara near Karijini National Park Figure 7.104 The Jurassic Coast in the United Kingdom
Figure
Data questions
Iron ore is a key Australian export, and an Australian iron-ore deposit commonly contains the minerals hematite, magnetite and pyrite, among others. The iron content of these minerals is presented in Table 7.12, and an example of the percentage of mineral components at different depths of an iron-ore deposit drill sample is shown in Figure 7.106.
UNCORRECTEDSAMPLEPAGES
Figure 7.106 Mineral content of an iron-ore exploration extract, depending on the depth of drilling
Table 7.12 Examples of minerals found in Australian iron ores
1. Identify which mineral described in Table 7.12 presents the highest iron content.
2. Identify the mineral with the highest content in the ore at 400, 1100 and 1800 m.
3. Classify the minerals hematite, magnetite and pyrite as ‘oxides’ (containing oxygen, O) or ‘sulfides’ (containing sulfur, S).
4. Contrast the iron content in hematite, magnetite and pyrite and suggest which of these minerals is the least sought after.
5. Deduce which mineral has the lowest overall content in the ore at depths 0–3000 m.
6. Given the response to Question 5, infer a reason why the mining company has concerns about mining beyond 1500 m in depth.
7. Some miners had thought that they had found gold at a depth of 1800 m, but analysis revealed an iron-based mineral. Which mineral did they find? Justify your answer with reference to the colours of the minerals and their abundance at a depth of 1800 m.
8. At close to 3000 m depth, the content of hematite is raised again. Predict the percentage of hematite content at 3100 m in this drill sample.
9. Predict the colour of the rock sample taken at 1200 m depth.
Magnetite
Pyrite
Hematite
sTeM activity: Underground bunkers and asteroids
Background information
A bunker is a structure built underground for people to shelter or live in, protecting them from dangers on the surface of Earth. For example, many homes in parts of the world that are prone to tornados have a bunker to protect the homeowners. During the Second World War, many major cities had huge bunkers built beneath them to protect residents from bombs.
When designing a bunker, engineers need to think about how people live and what requirements exist for people to be able to live underground for a period of time. They obviously do not need to take creature comforts into account, but people will still need to have access to food, fresh water and toilets, and somewhere to sleep. Engineers calculate the amount of space that will be required for the number of people intending to use the bunker.
Engineers also need to consider the type of rock and soil that the bunker will be built beneath. They work alongside geologists to determine suitable locations, with rock that is not too soft, so it will support the structure of the bunker, and not too hard, so it is not too difficult to cut into.
DESIGN BRIEF
Design an underground bunker to survive the imminent impact of an asteroid.
activity instructions
BREAKING NEWS: AN ASTEROID IS HEADING FOR EARTH!
Scientists have calculated that the asteroid will collide with Earth in 20 days. The impact will be so destructive that all humans will need to stay in bunkers underground for at least three months. Your team of engineers has been tasked with building an underground bunker for the people in your local suburb.
Suggested materials
• large plastic container
• soil and crushed rock
• cardboard
• icy pole sticks
• scissors
• sticky tape
• glue
• slotted masses/weights
UNCORRECTEDSAMPLEPAGES
Figure 7.107 A bunker provides protection from dangers above.
Research and feasibility
1. Research how many people are in your local suburb and decide as a group if multiple bunkers will have to be built. Decide as a group how many people you will build a bunker for.
2. Research the local rock formations in your area. Decide whether your bunker needs to be built underground or into local rock formations. You will need to research the common types of rock and the difficulty in excavating/drilling using Mohs hardness scale. You may need to consider other factors of the rock type that may be important when considering strength.
Design and sustainability
3. Decide as a group the volume of your bunker, based on the number of people, and what your group believes are space requirements, then sketch proposed local area locations and a design for your bunker. Include annotations on your sketch for the bunker design, giving additional information on the thought processes behind it.
4. Discuss as a group how you can build a model of your proposed bunker for testing. Think about the type of local rock, your bunker shape and how to make an effective model. Include in your discussion how you are planning to test your bunker to show its durability.
Create
5. Build the model of your bunker, and then test it using varying weights or methods.
Evaluate and modify
6. Describe some of the difficulties you encountered while calculating and estimating the amount of space people will need to live in.
7. Did you need to make compromises about quality of life for the people living in your bunker, to save space? Explain how you came to your decisions.
8. Describe some modifications you could make to your bunker to withstand more force.
9. Evaluate the feasibility of constructing a bunker located within the rock type you have chosen.
UNCORRECTEDSAMPLEPAGES
Chapter 8 Energy
Introduction
Your senses can detect several types of energy – your eyes detect light, your ears detect sound, and your skin can feel heat. You use your muscles to move and to give objects kinetic energy, or to lift objects, giving them gravitational potential energy. The food you eat contains chemical potential energy, which is used by your cells. The cells in your brain are constantly exchanging electrical energy, and your nervous system uses electrical energy to send messages between your brain and the rest of your body. In this chapter, you will explore the different types of energy and how energy can be transferred or transformed.
UNCORRECTEDSAMPLEPAGES
Chapter map
There are various types of energy.
Section
Section
Section
UNCORRECTEDSAMPLEPAGES
Curriculum
Physical sciences
The different forms of energy can be classified as either kinetic or potential energy; energy transformations and transfers cause change within systems.
• electrical, thermal, sound and light energy can be classified as kinetic energy. 8.1
• gravitational, chemical, nuclear and elastic energy can be classified as potential energy.8.1
• energy transformations in systems, such as gravitational potential energy to kinetic energy, elastic potential energy in rubber bands or springs to kinetic energy, chemical energy to thermal energy
• energy transfers in systems, such as boiling water in a beaker, throwing a ball
Heat is transferred by conduction in solids, convection in liquids and gases, and radiation in all states; heat can be reflected and absorbed.
chemical potential energy conduction conductor (heat) convection elastic potential energy electrical energy electromagnetic spectrum energy energy transfer free electron generator gravitational potential energy heat input energy insulator (heat) joule kinetic energy law of conservation of energy light energy nuclear energy
output energy potential energy radiation radioactive rotational kinetic energy sound energy temperature thermal energy travelling wave turbine waste energy wave energy
8.1 What is energy?
Learning goals
At the end of this section, I will be able to:
1. Define energy.
2. Provide examples of different forms of kinetic and potential energy.
3. Distinguish between heat, thermal energy and temperature.
Energy is the capacity to do work and it can neither be created nor destroyed. That is, the amount of energy in our universe is always the same. However, energy can change form; it can be transferred from one object to another, or it can be stored for later use. For all the different types of energy, the unit of measurement is the joule (J). One joule is the work done by a force of one newton (N) over one metre. That is to say, 1 J = 1 Nm.
While we experience energy in different ways, including light, heat, sound and movement, all types of energy can be categorised as either kinetic or potential energy.
Kinetic energy
The energy an object has when it is moving is called kinetic energy (Ek). The amount of kinetic energy depends on the mass of the object and its speed. Objects that are spinning or rotating also have kinetic energy, but this energy is called rotational kinetic energy
the capacity to do work; the total amount of energy is conserved in any process
joule the unit of energy or work done by a force of one newton over a distance of one metre kinetic energy the energy of moving matter rotational kinetic energy the energy an object has because it is rotating potential energy the energy stored in something because of its position, shape or composition; e.g. due to height above the ground, being stretched or compressed, or in chemical form
Figure 8.1 A jumping kangaroo has kinetic energy. What potential energy might it have?
Potential energy
Some objects can store energy until it is ready to be used, but the energy still exists. This stored energy is called potential energy because it has the potential to do work. For example, a stretched rubber band has stored elastic potential energy. The energy is not being used at that point, but it has the potential to make something happen. Some forms of potential energy are summarised in Table 8.1.
Form of potential energy
Gravitational potential energy (Ep)
UNCORRECTEDSAMPLEPAGES
Description
Energy stored when an object is lifted up; energy released when the object falls
Electrical energyEnergy stored in electrostatic situations (e.g. thunderclouds, capacitors); energy released when current flows (includes sparks like lightning)
Chemical potential energy
Elastic potential energy
Energy stored in chemicals such as food, fuel and batteries. For example, the chemical potential energy in batteries is released when connected to an electric circuit, in which the chemical potential energy is converted to electrical energy.
Energy stored when an object is stretched or compressed; energy released when an object returns to original size and shape
Nuclear energyEnergy stored in nuclei of atoms; energy released when unstable (radioactive) atomic nuclei decay or undergo fission or fusion
Table 8.1 Potential energy is a form of energy that can be stored.
Try this 8.1
Kinetic and potential energy
Observe the image in Figure 8.2. How might the kinetic and potential energy in this system interact as Newton’s cradle is in full swing?
Did you know? 8.1
Forms of energy we can detect with our senses
The types of energy that we can detect with our senses are listed in Table 8.2.
Form of energy
Thermal energy
Sound energy
Light energy
Description
We can sense both hot and cold temperatures with our skin.
Our ears can hear sound energy.
Our eyes can see light energy.
Table 8.2 Types of energy, other than kinetic energy, that we can sense
Figure 8.2 Newton’s cradle in action
Forms of energy
Thermal energy
The thermal energy of an object or a system describes the total kinetic energy of its particles. This energy is related to temperature, which is a measure of the average kinetic energy of all of the particles in an object. To change an object’s temperature, thermal energy needs to be either added (to raise it, i.e. heating) or removed (to lower it, i.e. cooling). The total amount of thermal energy in an object is influenced by three factors:
• temperature – Objects with higher temperature have more thermal energy than identical cold objects.
• mass – Heavier objects have more thermal energy than lighter ones of the same material and temperature.
• material – Some materials are better at storing thermal energy than others. The total thermal energy depends on all three factors. For example, a warm bath contains a lot more thermal energy than a burning match. This is because, even though the match has a higher temperature, the hot bath is much bigger, and water is very good at storing thermal energy. Increasing the temperature of water is one of the most expensive energy costs in the home, because heating water requires a lot of energy.
Wave energy
Boiling point of water
UNCORRECTEDSAMPLEPAGES
Water waves carry wave energy as the waves move on the surface of the water. The waves can vary in size, from small ripples formed when a stone is thrown into water, all the way up to ocean swell – long waves that travel along the surface of the ocean. Because waves in water are generally able to move from place to place, they are called travelling waves
Water waves are not the only type of waves that can carry energy. Waves can travel through earth after an earthquake. These are also an example of a travelling wave. They occur when the ground suddenly moves and can transmit a huge amount of energy.
thermal energy the energy contained within a material that is responsible for its temperature temperature a measure of the degree of heat present in a substance; gives an indication of the average kinetic energy of the particles wave energy the energy carried by a travelling wave (e.g. an ocean swell) or trapped in a standing wave (e.g. a guitar string) travelling wave a wave that can carry energy from one place to another
Figure 8.3 A warm bath contains more thermal energy than the flame of a candle.
Figure 8.4 These water waves at Eagle Bay have wave energy.
Figure 8.5 The energy of an earthquake damaged this road in Christchurch, New Zealand, in 2011.
sound energy
a form of travelling wave; sound consists of vibrations in the air
light energy a form of energy that travels as electromagnetic waves and can travel in a vacuum electromagnetic spectrum a way of organising electromagnetic waves according to their energy and wavelength
Sound energy
Sound energy is a form of wave energy. When sound is emitted from an object, the particles in the surrounding air are repeatedly compressed and then stretched. This disturbance travels through the air at about 343 m/s. Sound energy consists of a travelling wave of vibrating air particles.
Light energy
Light energy is a special kind of wave that is part of the electromagnetic spectrum. Unlike sound, light waves do not require particles, so light energy can also travel in a vacuum, such as space. Light waves include all the colours of the visible spectrum: red, orange, yellow, green, blue, indigo and violet. The electromagnetic spectrum also includes waves that humans cannot see. Gamma rays emitted from radioactive materials, X-rays used in hospitals, ultraviolet (UV) light that causes sunburn, infrared radiation (also called heat), microwaves used by mobile phones and radio waves used for long-distance communication are all types of light waves on the electromagnetic spectrum.
UNCORRECTEDSAMPLEPAGES
Figure 8.6 Sound energy travels as vibrational waves in the air.
Figure 8.7 5G communication is possible due to radio waves, a form of light energy.
Making thinking visible 8.1
think, feel, care: the Matilda effect
Ruby Payne-Scott was an Australian radio engineer and astronomer who worked throughout the 1940s as a respected and prominent scientist. Up until 1966, the Australian Public Service required women to resign from their profession when they married. Payne-Scott married in 1944 and in 1950 she was made to resign from her role as a scientist. In the process, her work in the field was often discredited and overlooked by her male colleagues. The ‘Matilda effect’ is a term coined to describe the systematic and historical tendency to undervalue or disregard the contributions of women in science.
What do you know about Ruby Payne-Scott and the Matilda effect and what further questions do you have?
UNCORRECTEDSAMPLEPAGES
Do you think the Matilda effect could still be an issue today? Why is it important to acknowledge and celebrate the contributions of all scientists, regardless of gender or context? What can you do to raise awareness about the Matilda effect and support the recognition of women in science?
The Think, feel, care thinking routine was developed by Project Zero, a research centre at the Harvard Graduate School of Education.
Quick check 8.1
1. Provide five examples of objects that could have kinetic energy.
2. State two types of wave energy.
Gravitational potential energy
When an object is lifted, it gains gravitational potential energy. ‘Gravitational’ means related to the pull of Earth, and ‘potential’ means the energy is stored. The gravitational potential energy (Ep) gained by an object when it is lifted depends on three things:
• the strength of gravity
• the mass of the object
• the object's height above the ground.
Uncorrected 2nd
Figure 8.8 Ruby Payne-Scott was a female Australian researcher in radioastronomy.
Figure 8.9 The water at the top of the King George Falls, in the Kimberley region of Western Australia has gravitational potential energy that is converted to kinetic energy when falling 100 m to the lake below.
Did you know? 8.2
sir Isaac newton’s apple
There is a story that has been told for hundreds of years regarding the situation that led to Sir Isaac Newton’s discovery that gravity is a universal law applying to planets and the Moon as well as objects on Earth. There isn’t enough evidence to determine whether it is true or not, but, in any case, it is a fun story!
The story goes that in the mid-1600s, Sir Isaac Newton was sitting under a tree when an apple fell onto his head. In this moment he pondered, ‘If this apple falls towards Earth, could the same law of physics be holding the Moon in its orbit?’. This thought sparked years of work that culminated in the publication of his book Philosophiae Naturalis Principia Mathematica in 1687. His work included his laws of motion, now known as Newton’s laws of motion, and the universal law of gravitation.
To answer his original question, Newton confirmed that the Moon is constantly falling towards Earth and is attracted according to the same law that attracts the apple, but rather than collide with Earth, it stays in orbit. Can you imagine the amount of gravitational potential energy that the Moon has?
UNCORRECTEDSAMPLEPAGES
Try this 8.2
Investigating energy with a bouncy ball
Take a bouncy ball and hold it above your head. Drop the ball and let it bounce twice.
Describe the transformations involved as Ep changes to Ek over the two bounces. Explain where elastic potential energy fits in.
Electrical energy
Electrical energy is carried by charged particles, called electrons, that can transport charge from one atom in a wire to the next, carrying energy as they do so. The rate of movement of charge through an electrical circuit is called current (I) and is measured in amperes or amps (A). Circuits often contain resistance (R), which restricts the movement of charge. Resistance is measured in ohms (Ω).
Figure 8.10 Sir Isaac Newton wondering whether the Moon falls towards Earth
Voltage (V) is related to the amount of electrical energy each unit of charge carries. For example: AAA batteries supply 1.5 joules of electrical energy per unit of charge, so they have a voltage of 1.5 volts; smartphones operate at 5 volts; combustion engine car batteries are 12 volts; and since 2000 in Western Australia, electricity in the home is 230 volts. Voltage, current and resistance are related by ‘Ohm’s Law’, V = IR. Electrical energy is covered in depth in Chapter 9.
Explore! 8.1
Electric vehicles (EVs)
EVs run on the electrical energy produced by a battery. This battery can be recharged using electrical energy.
1. Use the internet to research the types of materials used in EV charging cables.
2. If materials of less resistance are used, would there be less heat energy produced?
UNCORRECTEDSAMPLEPAGES
Did you know? 8.3
Lightning strikes
Electrical energy can be very dangerous when it causes a large electric current to flow through the body. The highest voltages on Earth are in lightning strikes, which can be hundreds of millions of volts. Think about thunderstorms: what other forms of energy are released when lightning strikes?
Figure 8.11 EV charging cables are designed to transfer electrical energy to car batteries, with minimal loss of heat energy.
Figure 8.12
lightning strike
Quick check 8.2
1. State some types of energy that can be stored.
2. Look at the following image. Explain where you would stand to have the greatest gravitational potential energy.
Figure 8.13 Where is gravitational potential energy greatest?
3. Figure 8.14 shows a roller coaster. Roller coasters are a great example of Ep. Answer the following questions, remembering that as an object loses Ep, it gains Ek (kinetic energy).
UNCORRECTEDSAMPLEPAGES
8.14
a) Identify the step (A, B, C, D or E) where the cart would have the greatest Ep
b) Identify the step where the cart would have the greatest Ek.
Figure
A roller coaster
Chemical potential energy
Many substances contain stored chemical potential energy, which can be released in a chemical reaction. For example:
• Trees store chemical potential energy in their wood, which is released when the wood is burned.
• The food we eat contains chemical potential energy, which is released slowly in our bodies, giving us the energy we need to keep warm and move around.
• Cars have engines that convert the chemical potential energy in petrol to kinetic energy, heat and sound.
• Batteries store chemical potential energy that can be used to power household devices or electric vehicles when required.
Elastic potential energy
Elastic potential energy is energy that is stored whenever an elastic material is either stretched or compressed by a force. For example, energy is stored in a rubber band when it is stretched and in a rubber ball when it is compressed. Trampolines, bungee cords and springs are all examples of objects that can store elastic energy. Another name for elastic potential energy is ‘spring energy’.
chemical potential energy the energy stored in the chemical bonds between atoms elastic potential energy the energy stored when an elastic material is compressed or stretched
Figure 8.15 Fireworks near the Matagarup Bridge in Perth. Fireworks contain chemical potential energy, which is released when the fireworks are lit.
Figure 8.16 A large rubber band stores energy when it is stretched.
Figure 8.17 A bungee cord stores elastic potential energy when it is stretched.
Try this 8.3
Exploring elastic potential energy
Take a rubber band and stretch it as tightly as possible. Explain how the stretched rubber band is an example of potential energy. Point the rubber band at the wall and let it go. Explain how the potential energy stored in the band was converted to a different form of energy.
UNCORRECTEDSAMPLEPAGES
Nuclear energy
The nucleus (plural nuclei) of atoms contains nuclear energy, a form of potential energy. Most nuclei are stable and do not release this nuclear energy, but the radioactive nuclei of some atoms can undergo radioactive decay, emitting electromagnetic wave energy and/or particles with kinetic energy. The electromagnetic radiation emitted is high energy gamma rays, part of the electromagnetic spectrum. One source of radioactive energy is fission, in which an atomic nucleus splits into smaller fragments releasing energy as it does so. Nuclear power stations use the fission reactions of a radioactive material such as uranium to produce thermal energy, which in turn is used to generate electricity.
Unfortunately, such radiation can be hazardous to health, as high energy gamma rays and particles with high kinetic energy are capable of damaging human cells. Great care must be taken to prevent people being exposed to it in nuclear power stations.
Making thinking visible 8.2
the explanation game: types of energy
Observe the scene in Figure 8.18. Figure 8.18 A pool party always involves energy!
What are the types of energy, and where do you notice them, in Figure 8.18?
Explain why you think those types of energy are present.
The explanation game thinking routine was developed by
Explore! 8.2
the relationship between mass and energy
In 1893, physicist Nikola Tesla and philosopher Swami Vivekananda met at the Congress of the World’s Religions in Chicago. They discussed the interrelatedness of energy and matter, with Vivekananda being interested in the relationship between matter and spiritual energy and Tesla interested in physical mass and energy. Their collaboration was significant in bridging the gap between the perspectives of scientists and those of spiritual leaders around the world but also in highlighting the potential relationship between mass and energy.
1. Use the internet to explore how Albert Einstein’s theory of special relativity provided more information on the relationship between mass and energy in 1905.
UNCORRECTEDSAMPLEPAGES
Quick check 8.3
1. State three examples of chemical potential energy.
2. Explain what is happening to a material if elastic potential energy is being stored.
3. State the name of the process in which energy is released from the nucleus when it breaks apart or releases a particle.
Try this 8.4 a world without energy
Think about a world in which there is no electrical energy. Suppose there was no light or sound energy either. Could life exist in such a world? Write down a few sentences to say if you think it could and what it would be like. Now imagine that there is no potential or kinetic energy of any type. What would that world be like? Discuss and collate your ideas as a class and see if you agree.
Figure 8.19 (a) Swami Vivekananda and (b) Nikola Tesla met for the first time in Chicago in 1893.
Go online to access the interactive section review and more!
Section 8.1 review
Online quiz
Section questions
Section 8.1 questions
Remembering
Teachers can assign tasks and track results
UNCORRECTEDSAMPLEPAGES
1. Recall the correct energy forms and definitions to complete the table below.
Form of energy
Kinetic
Definition
Energy an object possesses when it is lifted above the ground
Chemical Yes
Is this an example of potential energy?
2. Recall the three factors that determine how much thermal energy could flow from an object.
3. State the form of energy contained in a piece of wood.
4. State the forms of energy a piece of wood gives out when it burns (see Figure 8.20).
5. Identify the form of energy, other than thermal from exertion, gained when a student climbs stairs (see Figure 8.21).
6. Identify the forms of energy emitted by lightning (see Figure 8.22).
7. Identify a form of energy that is not a form of wave energy.
8. Identify the forms of energy possessed by a helicopter as it hovers in the air (see Figure 8.23).
Figure 8.20 Wood stores energy that can be released in a form of useful energy when burned.
Figure 8.21 Students climbing stairs
Figure 8.22 Lightning
Figure 8.23 A hovering helicopter
Understanding
9. Identify the main form of energy that peanuts contain.
10. Look at the diagram in Figure 8.24 and use it to answer the following questions.
a) Identify which letter represents the position where the ball has the most Ep
UNCORRECTEDSAMPLEPAGES
b) If the ball moved from C to A, state if there would be an overall gain or loss of Ep
Applying
11. Describe a situation that involves elastic potential energy.
12. Describe how sound energy travels.
13. Explain what is meant by the term ‘potential energy’.
14. Explain which balloon in Figure 8.25 has the most elastic potential energy.
Analysing
15. Look at the following list of energy sources and organise them from most used to least used in your household:
• electrical energy
• chemical potential energy
• sound energy
• light energy
• thermal energy
16. Examine Figure 8.26 and identify all the different forms of energy that you can see evidence of.
Evaluating
17. List the devices in your home that use energy. Include at least two that don’t use electricity, and at least one of these should be a manual (unpowered) device. For each device in the list, determine the form of energy used as the input (that operates it) and the forms of energy that it outputs (include the ‘useful’ output as well as the outputs that represent wasted energy).
Figure 8.26 A laundry contains many different forms of energy.
Figure 8.24 Gravitational potential energy
Figure 8.25 Elastic potential energy of balloons
from hotter objects or regions to colder
or
8.2 Transferring heat
Learning goals
At the end of this section. I will be able to:
1. Describe the difference between thermal energy and heat.
2. Explain heat transfer by conduction, convection and radiation.
Energy can be transferred from one object to another. A common example of this is the transfer of thermal energy within an object or between objects. In order to explain how thermal energy transfer occurs, it is necessary to revisit the particle model of matter.
Particle model
In year 7 you learned about the particle model of matter. The particle model of matter can explain the properties of solids, liquids and gases. According to the particle model:
• All matter is made up of particles.
• Particles are attracted to each other.
• Particles are always vibrating in place or moving around.
• As temperature increases, particles move or vibrate faster.
Particles are always vibrating in place or moving around because they have kinetic energy. Objects at a higher temperature on average have faster moving particles and, therefore, a higher average kinetic energy.
In section 8.1 you learned that the thermal energy of an object or a system relates to the total kinetic energy of its particles. The term heat is used in science to specifically describe the thermal energy that is transferred between objects. In contrast, thermal energy is something an object possesses whether or not there is a transfer of energy (see Figure 8.27).
• High average kinetic energy of particles
• High temperature
• High thermal energy
UNCORRECTEDSAMPLEPAGES
Heat only transfers this way
Hot solid: particles vibrate fast
• Low average kinetic energy of particles
• Low temperature
• Low thermal energy
Cold solid: particles vibrate slowly
Figure 8.27 The particles in hot and cold solid objects of the same mass. The relationship between average kinetic energy of particles, thermal energy, heat and temperature is shown. This diagram also applies to liquids and gases, but those particles aren’t vibrating; instead they are moving around.
Remember that the temperature of an object is a measure of the average kinetic energy of all its particles. It tells us what the level of thermal energy is, but not how much thermal energy or heat is present. You can imagine it like the level of water in a dam: that tells us how high it is, but it doesn’t tell us how much water there is in total. Heat always transfers from hotter objects to colder ones, so temperature can indicate whether heat transfer will take place, and in which direction.
Therefore, the thermal energy of an object can be explained by the particle model as the total energy all of its particles have due to their movement or vibration. Note that it is the kinetic energy of an object’s particles, not the motion of the object itself, that relates to thermal energy.
Quick check 8.4
1. Explain the relationship between the thermal energy and the kinetic energy of an object.
2. Explain what heat means in science.
3. State what temperature measures, in terms of particle theory.
4. Determine whether the particles in a cup of water at 30°C would, on average, move faster or slower than the particles in a cup of water at 45°C.
thermal energy
To change an object’s temperature, thermal energy needs to be added (to raise the temperature by heating) or removed (to lower it by cooling). As described in section 8.1, the amount of thermal energy in an object depends on three factors:
• temperature – Objects at higher temperatures have more thermal energy than identical objects at lower temperatures.
• mass – Heavier objects have more thermal energy than lighter ones of the same material and temperature.
• material – Some materials are better at storing thermal energy than others.
The total thermal energy depends on all three factors. For example, a warm bath at 35°C contains a lot more energy than a cup of hot chocolate at 75°C. The particles in the hot chocolate have greater average kinetic energy than the particles of water in the bath, and the higher temperature of the hot chocolate is a measure of that average kinetic energy. However, the mass of the bath water is much greater than the mass of hot chocolate in the cup. This means that there are many more particles of water in the bath than in the cup of hot chocolate. All those moving particles in the bath have greater total kinetic energy, even though their average kinetic energy is less. Therefore, the bath water has greater thermal energy than the hot chocolate.
Figure 8.28 A bath of warm water contains more thermal energy than a cup of hot chocolate, even if the bath is at a lower temperature.
UNCORRECTEDSAMPLEPAGES
Try this 8.5 testing water temperature
Take three large containers and fill one with room-temperature water, one with warm water (be careful that it is not too hot) and one with cold refrigerated water. Place one hand in the cold water and the other in the warm water for two minutes. Take your hands out of the warm and cold containers of water and place both of them in the room-temperature water. How does the water feel?
Something to think about:
1. Why did you leave your hands in the warm and cold water for two minutes?
2. Why did your hands detect different temperatures when you put them into the room temperature water?
Investigating thermal energy
Introduction
The specific heat capacity of a substance is the amount of energy that is required to raise the temperature of 1 kilogram (kg) of that substance by 1°C. For example, water has a specific heat capacity of 4200 J/kg/°C, meaning it takes 4200 J to raise the temperature of 1 kg of water by 1°C.
Be careful
Follow general fire safety. Use appropriate personal protective equipment when handling hot equipment.
The amount of thermal energy stored or released in a system as the temperature is changed can be calculated using the following equation.
change in thermal energy = mass × specific heat capacity × change in temperature
ΔQ = mcΔT
where:
ΔQ = change in thermal energy (J)
m = mass (kg)
c = specific heat capacity (J/kg/°C)
ΔT = change in temperature (°C)
Note: Δ means ‘change in’.
Aim
To investigate the heating of different volumes of water when provided with the same amount of energy
Materials
• Bunsen burner
• heatproof mat
• tripod
• gauze
Method
1. Draw the results table below.
• matches
• 600 mL glass beakers ×4
• thermometer
• stopwatch
2. Put 200 mL of water in a beaker and measure the temperature. Record this in your results table.
3. Remove the thermometer and heat the water over the Bunsen burner for two minutes.
4. Stir the water and measure the final temperature after it has been heated. Record this in your results table.
5. Repeat steps 2–4 with 300 mL, 400 mL and 500 mL of water, using a new beaker each time. Make sure the initial temperature of the water is the same.
Results
Complete the following table.
UNCORRECTEDSAMPLEPAGES
1. Calculate the change in thermal energy (ΔQ) using the equation given above. Remember, 1 litre of water weighs 1 kg, so 200 mL of water weighs 0.2 kg.
2. Plot a graph of volume against change in thermal energy.
Discussion
1. Identify any trends or patterns in your results.
2. Predict what you think would happen if the following substances were used. You may need to conduct some research on specific heats of different substances. Explain the reasoning behind your predictions.
a) liquid mercury
b) sunflower oil
c) ethanol
Conclusion
Draw a conclusion about volume and thermal energy from this experiment, supporting your statement with data.
UNCORRECTEDSAMPLEPAGES
1. Define the ‘thermal energy’ of an object.
2. State three factors that the total thermal energy of any object depends on.
3. Explain why a bath of warm water contains more thermal energy than a burning match.
heat transfer
Heat transfer is the movement of thermal energy from an object at a higher temperature to an object at a lower temperature. Heat transfer is generally faster when there is a larger temperature difference between the two objects. As thermal energy is transferred to an object with a lower temperature, the particles within that object will begin to vibrate or move more quickly, which is indicated by an increase in the object’s temperature.
In Figure 8.29, three types of heat transfer are occurring simultaneously. As you roast your marshmallow over the flames, you notice that heat is travelling along the metal skewer, which is starting to feel warm in your hands – conduction. You might also notice that the air above the fire is hotter than beside the fire and will burn the marshmallows – convection. Finally, as you sit around the camp fire, you feel an intense warmth on your skin – radiation.
conduction the transfer of thermal energy through collisions between particles convection the transfer of thermal energy due to the movement of particles in a liquid or gas
Quick check 8.5
conductor (heat)
a substance that allows heat to pass through it easily
free electron
an electron that is not associated with an atom
insulator (heat)
a substance or material that does not allow heat to pass through it easily
Conduction
When energy is transferred between particles of matter by contact, the process is referred to as conduction. A particle, an object or a region with a higher temperature naturally transfers thermal energy to a particle, an object or a region with a lower temperature. When substances gain energy, their particles start to vibrate faster. If a faster vibrating particle bumps into a slower vibrating one, it transfers some energy to it (see Figure 8.30). This causes the slower vibrating particle to vibrate faster, increasing its kinetic energy and, therefore, its temperature.
Note that conduction does not only happen in the solid state. A solid surface with a high temperature transfers thermal energy to particles of a cooler gas or liquid that are in contact with it, also by conduction.
Figure 8.30 A time sequence showing heat flowing through the particles of a solid by conduction. The heat source (not shown) is on the left of the particles. At first, only the particles next to the heat source become hot and vibrate. They bump into particles next to them, which warm up, and so on.
Conduction occurs when you warm up your hands when holding a hot drink. Your hands warm up because thermal energy is being transferred from the mug to your hand. How would holding the hot drink feel different if it were a polystyrene cup? Or a metal cup? Some substances, such as metals, are good conductors of heat. This is because the electrons in metals can leave their atoms and move around as free electrons. These free electrons move quickly and result in vibrations (and the associated kinetic energy) passing more quickly between particles in a metal. So thermal energy in metals spreads quickly from hot to cold (see Figure 8.32).
Figure 8.31 Warming up your hands with a hot drink on a cold day is an example of heat transfer by conduction.
Other materials, such as polystyrene, do not conduct heat well and are called insulators.
Figure 8.32 Free electrons can travel through metals and help thermal energy spread quickly
areas.
Convection
Convection is the flow of thermal energy through a liquid or a gas caused by movement of the liquid or gas itself. Heating water in a pot and warming up a room with a heater are both examples of heating by convection.
Have you ever heard the saying, ‘Hot air rises’? In a building with two or more floors connected by an open stairwell, the top floor will be warmer if there are no doors to block the flow of air. When a liquid or a gas is heated, the particles vibrate faster and the space between them increases, causing the liquid or gas to expand. This means that the warmer regions become less dense than the colder regions, and so begin to rise. Figure 8.33 shows water in a pot being heated from the bottom, causing the hot water to rise. Away from the heat source, at the top of the pan, the water cools again. The water becomes more dense and sinks back down to the bottom where it will be heated again. This cycle is called a convection current.
Convection is a major factor driving weather patterns. The Sun heats Earth’s surface, warming the air, which then rises, creating an upward current in the atmosphere. As the warmer air rises, cooler air from elsewhere flows in to replace it and we feel this air movement as wind. As the convection current continues, the air cools as it gets higher, potentially causing any water vapour within it to condense and form a cumulus cloud. Within Earth, convection currents move layers of magma. In the oceans, convection creates currents.
8.33 When
is
UNCORRECTEDSAMPLEPAGES
the hotter, less dense
• Particles move faster
• Particles spread out
• Hot fluid is less dense and rises
• Particles move slower
• Particles come together
• Cold fluid is more dense and sinks
at the bottom rises and the colder, more dense water sinks to take its place.
VIDEO Convection
water sinks
water sinks Hot water rises
Figure
water
heated,
water
Explore! 8.3
Indian Ocean Dipole
The Indian Ocean Dipole (IOD) describes the oscillation of Indian Ocean surface temperatures across the western (African side) Indian ocean and the eastern (Western Australian side) Indian ocean. A positive IOD means there are higher temperatures in the western Indian ocean with corresponding lower temperatures leading to droughts in Western Australia. A negative IOD means the opposite, with warmer and wetter weather in Western Australia.
Use the Australian Bureau of Meteorology website to answer the following questions.
1. Explain how the movement of thermal energy by convection currents produces the weather patterns observed during periods of positive and negative IOD.
2. Explain how a positive IOD affects temperatures and rainfall in Western Australia.
3. Explain how a negative IOD affects temperatures and rainfall in Western Australia.
Radiation
Any object with thermal energy can radiate heat, which doesn’t depend on particles to transfer the energy. This type of heat transfer occurs when you stand in direct sunlight or in front of a fire. Thermal radiation, or radiant heat, is a form of electromagnetic radiation (like visible light and radio waves) and travels in waves (a type of wave energy). This differs from convection and conduction, as it does not rely on particles and can travel through a vacuum.
Explore! 8.4
how do animals stay warm?
Conduction, convection and radiation all play an essential role in nature. All warm-blooded animals can generate their own body heat, and they radiate heat energy. In contrast, coldblooded animals do not generate their own body heat all the time, so they need to lie in the sunshine to get warm.
Conduct some research on how animals living in cold environments reduce heat loss from conduction, convection and radiation.
UNCORRECTEDSAMPLEPAGES
1. State the type of heat transfer that occurs when you burn your hand on a hot plate.
2. Use the particle model to describe thermal conduction in a solid.
3. Describe how thermal energy travels within a liquid or a gas.
Figure 8.34 A positive Indian Ocean Dipole can lead to droughts in Western Australia.
Figure 8.35 Chocolate muffins are baked using radiant heat in an oven.
Figure 8.36 A cold-blooded bobtail lizard (Tiliquia rugosa) sunbathing
Practical 8.2 Self-design
Modelling heat transfer
Aim
To design your own experiment that models the three types of heat transfer, with the hypothesis that if objects of different temperatures are placed in contact, heat energy will transfer from an object of higher temperature to an object of lower temperature until both objects reach the same temperature
Materials
• metal, wooden and plastic spoons
• water
• Bunsen burner
Method
Be careful Follow general fire safety. Use appropriate personal protective equipment when handling hot equipment.
UNCORRECTEDSAMPLEPAGES
• tea bags and tea leaves
• ice blocks
• radiant heater
Design an experiment that demonstrates the three types of heat transfer. In a group, discuss ways in which you could do this. Choose the best method and plan the experiments. You must include information on variables, a risk assessment and a step-by-step method for carrying out the experiment.
Results
Record your observations for each of the experiments in an appropriate manner.
Discussion
Explain how your self-designed experiments demonstrated how thermal energy is transferred through conduction, convection and radiation.
Did you know? 8.4
Clothing technology
Australia has a large variety of climatic regions, and various Aboriginal and Torres Strait Islander Peoples have developed different technologies that enable them to live and thrive successfully in even the most extreme climates. For warmth, traditional animal skin cloaks can be worn with the fur lining facing inwards, next to the body. This traps a layer of air and provides valuable insulation. However, during rainy seasons, the cloak is worn with the fur on the outside, because the hairs have water-repellent properties. Fat can be rubbed onto the outside of the fur to further increase insulation. These heat-conserving cloaks reduce thermal conduction, convection and radiation.
Figure 8.37 Artwork by William Barak, an influential Aboriginal spokesperson, depicts the use of possum skin cloaks.
summary of heat transfer
The particle model can be used to explain conduction and convection, as they both involve the transfer of thermal energy through particles. Although radiation also involves the transfer of thermal energy, it does not require the presence of particles. Thermal radiation is an electromagnetic wave that can travel through particles but also outer space where there are close to no particles. This is why we can feel the warmth of the Sun despite it being about 150 million kilometres away. Therefore, radiation can also be classed as light energy.
Type of heat transferDescription
Conduction
Transfer of thermal energy by direct physical contact between particles
Atoms are always vibrating or moving, but when heat is applied to an object, the atoms next to the heat vibrate or move more, so their kinetic energy increases. They ‘bump’ neighbouring atoms, passing on this kinetic energy and allowing heat energy to move through the object or substance.
You warm up your hands when holding a hot drink. Your hands warm up because thermal energy is being transferred from the mug to your hand.
Convection
Transfer of thermal energy by particle motion in a fluid (liquids and gases)
Radiation
UNCORRECTEDSAMPLEPAGES
Transfer of thermal energy without the presence of particles
When a liquid or a gas is heated, the particles vibrate and move faster and the liquid or gas expands. This means that the colder regions are more dense than the warmer regions, and so the colder liquid or gas sinks to the bottom. As it is heated, in turn, the material rises to the top, creating a convection current.
Radiant heat travels in waves because it is a form of electromagnetic radiation.
Heating water in a pot from the bottom causes the hot water to rise. The cold water sinks and replaces the hot water at the bottom, and is then also heated.
When making toast, the bread does not touch the source of heat but gets toasted because of the transfer of thermal energy through space by radiation.
Table 8.3 The three different processes of heat transfer
Section 8.2 review Online quiz Go
UNCORRECTEDSAMPLEPAGES
Section 8.2 questions
Remembering
1. Define ‘thermal energy’.
2. State the conditions required for conduction to occur.
3. Recall the three factors that determine how much thermal energy is present in an object.
Understanding
4. Explain how an object that has a higher temperature can have less thermal energy than an object that has a lower temperature.
5. An electric oven has a heating element underneath its bottom surface, and two wire racks (shelves), a top and a bottom. It does not have a fan to circulate the air inside. A recipe calls for the baking dish to be placed in the hottest part of the oven. Explain whether you should place it on the top rack or the bottom rack.
Applying
6. Explain why energy is received on Earth from the Sun by radiation and not by convection or conduction.
7. Convection occurs in liquids and gases. Explain why convection does not (as a general rule) occur in solids.
Analysing
8. Classify the following as heat transfer by either conduction, convection or radiation.
a) heat escaping from the bottom of a cup of a hot coffee
b) heat from a stove plate transferring to a frying pan placed on it
c) an ice cube melting in your hand
9. Differentiate between heat conductors and insulators in terms of their ability to transfer heat quickly.
10. Cleo says insulation keeps out the cold. Critique this statement.
Evaluating
11. Decide at what point thermal energy transferring between two substances in contact will stop being transferred.
12. One litre of gas in a cylinder is rapidly compressed by a piston until it occupies 0.1 L. As a result, the molecules of gas have less space to move and they undergo many more collisions, which causes them to speed up. Predict what happens to the temperature of the gas.
13. The temperatures of two cups of water are measured. One is 20°C and the other is 30°C. Using your understanding of temperature and particles, discuss how the movement of particles differs.
8.3 Energy is conserved
Learning goals
At the end of this section, I will be able to:
1. Define the law of conservation of energy.
2. Describe how energy is transferred and transformed using flow diagrams.
In section 8.2, you learned that thermal energy can be transferred between objects. In fact, all types of energy can be transferred from one object to another or even transformed into another type of energy. When energy is transferred or transformed, it always obeys the law of conservation of energy: energy can neither be created nor destroyed. In any process, the amount of energy present at the beginning must equal the amount of energy present at the end.
Did you know? 8.5
the sum of the amounts of light,
and other forms of energy emitted.
Where does the sun get its energy from?
Einstein stunned the world when he proposed that mass can be converted into energy (and vice versa), according to a simple and famous formula:
E = mc2
In this formula, E = energy, m = mass and c = the speed of light (3 × 10⁸ m/s). Basically, the formula means that a small amount of mass can be converted into a lot of energy, or the reverse.
This explains where the Sun has been getting its energy from, to shine so bright for so long. Deep inside the Sun, nuclear reactions are converting five billion kilograms of matter into energy every second. This energy is emitted at the Sun’s surface as light and heat.
Will the Sun ever run out of fuel? Luckily for us, the answer is not for a very long time. The Sun is so big that, even at its current rate, much less than 1% of its mass has been radiated away since it was formed. As the Sun loses mass, its luminosity increases and it is estimated that in a billion years, a 10% brighter Sun will have rendered Earth inhospitable to life. It will take a few more billions of years before it runs out of fuel.
Figure 8.38 Town lights in Albany, Western Australia. The law of conservation of energy means the amount of electrical energy used by each light is exactly the same as
thermal
Figure 8.39 The Sun will not run out of fuel any time soon.
1. State the law of conservation of energy.
2. Explain the meaning of the law of conservation of energy.
Energy is the ability of an object to do work, and this energy can be transferred from one object to another. This is known as an energy transfer. For example, a golf club has kinetic energy when it swings through the air. When the club hits a golf ball, some of this kinetic energy is transferred to the ball, making it move.
Energy transformations
There are many ways in which energy can be converted from one form to another. Combustion involves burning and converts chemical potential energy into thermal and light energy. Machines use fuel or electrical energy and convert it into kinetic energy. Generators, powered by steam turbines, can convert kinetic energy into electrical energy. In leaves, the biological processes in photosynthesis convert light energy from the Sun into chemical potential energy in the form of carbohydrates, such as sugars. Thermal energy or sound energy is often produced as a by-product of energy transfers and transformations. Energy transformations can be represented in a flow diagram (see Figure 8.41). On the left-hand side of the flow diagram are the energy inputs. On the right-hand side are the energy outputs. Waste energy may be included as an energy output but is sometimes omitted. A brief description of how the machine works may be placed between them, and arrows can be added to show the flow of energy.
UNCORRECTEDSAMPLEPAGES
Some energy flow diagrams may have intermediate steps involving another form of energy. For example, a battery-powered torch has a more complex energy flow diagram (see Figure 8.43).
energy transfer the movement of energy from one place or object to another generator a device that converts rotational kinetic energy into electrical energy, i.e. the opposite of a motor turbine a device that converts
Figure 8.40 When a golfer hits a golf ball, they transfer kinetic energy from the golf club to the ball.
For example, Figure 8.42 shows the energy flow diagram for a candle that has been lit.
machine
Figure 8.41 A simple energy flow diagram
Figure 8.42 Energy flow diagram for a burning candle
Investigating an electric kettle
An electric kettle uses electrical energy to boil water. It contains a heating element that converts electrical energy to thermal energy when electricity passes through it. The heating element then heats the water in the kettle to 100°C, at which point the water boils.
UNCORRECTEDSAMPLEPAGES
Figure 8.45 shows a flow diagram representing the changes in energy in the example of the kettle.
1. Explain what occurs during an energy transformation. 2. Provide two examples of an appliance that transforms energy.
Figure 8.44 An electric kettle converts electrical energy into thermal energy.
Figure 8.45 Energy flow diagram for an electric kettle
Explore! 8.5
Fire starting
Aboriginal and Torres Strait Islander Peoples use several different methods to light fires. Specific practices differ among communities. The most common are called the fire drill and fire saw methods.
UNCORRECTEDSAMPLEPAGES
For the fire (or hand) drill method, a V-shaped notch is cut into a flat piece of wood (called the hearth). Bark or dried grass is placed under the hearth to catch embers and a long, thin stick (called the drill stick) is pushed into the notch and twirled vigorously by rubbing it between the hands. The friction between the two pieces of wood causes the end of the drill stick to glow red and embers are formed. The hearth is tapped to move the embers to the bark or dried grass, and then they are blown on until a flame forms.
The fire saw method works by rubbing two pieces of wood together in a sawing motion. One piece of wood has a notch at the end of it (or a split branch can be used), while the other is a piece of hardwood with a sharp edge (for example, a boomerang). The hardwood saws the notched piece until embers form, which ignite flammable material placed beneath it.
Two other methods used less commonly are the fire plough and percussion methods. The first method is mainly used by people in the north-west of Australia. It involves rapidly rubbing a stick back and forth within a trough or groove cut into the base timber to create embers.
Percussion methods of fire starting are used by groups in south-central Australia and involve striking stones together to create sparks that can then ignite dried grass.
1. Which method do you predict is the most efficient to start a fire?
2. Conduct some research and find out whether your prediction was correct or not.
3. Draw an energy flow diagram for the fire drill method.
Figure 8.46 Can you identify the drill method and the saw method in this illustration?
Investigating a car accelerating from rest
A petrol-powered car accelerating on a flat road uses its engine to convert the chemical potential energy of the fuel into kinetic energy as the car increases its speed.
Figure 8.47 An accelerating car is gaining kinetic energy.
Figure 8.48 shows a flow diagram for a petrol-driven car accelerating from rest.
UNCORRECTEDSAMPLEPAGES
Figure 8.48 Energy flow diagram for a petrol-driven car accelerating from rest
If the car was powered by an electric battery, then the energy flow diagram would be slightly different (see Figure 8.49).
8.49
rube Goldberg machine
Introduction
Machines are useful – we use them to make tasks easier. However, some machines are not as efficient or useful as others. These machines were named after Rube Goldberg, an American inventor and cartoonist. A Rube Goldberg machine is a type of machine that relies on a significant number of energy transfers and is designed to carry out a simple task in a very complicated and convoluted way.
Energy transfers and transformations occur throughout Rube Goldberg machines due to the chain reactions involved. An energy transformation is a change in energy from one form to another, and energy transfer is the movement of energy from one place to another.
Aim
To design and construct a Rube Goldberg machine to complete a common task
Materials
As chosen by students but may include:
• dominoes
• playing cards
• marbles
• rubber bands
• string
• springs
• toy cars
• balloons
• toilet paper or paper towel rolls
• cardboard boxes (varying sizes)
Method
UNCORRECTEDSAMPLEPAGES
• bouncy balls
• cans
• plastic bottles
• flat cardboard
• ramps
• books (preferably sturdy ones, such as old textbooks)
• sticky tape
• appliances (fans, lamps etc.)
1. Identify a simple common task that you would like to be done by a machine.
2. Draw a plan of your Rube Goldberg machine.
3. Start building your machine, ensuring that you test each step as you progress.
4. Once your machine is complete, make a video recording of it in action.
Figure 8.50 Original artwork for Rube Goldberg’s ‘self-operating napkin’ machine
Results
Remember to take a video of your machine in action.
Discussion
1. Explain the energy transfers and transformations that took place in your Rube Goldberg machine.
2. How could you reduce the amount of waste energy produced by your Rube Goldberg machine to make it more efficient?
3. Compare your final machine to your plan. Which parts (if any) are different? Why did you change them?
4. Propose any improvements or extensions you would make if you were to build another machine.
Try this 8.6 Energy transfer and transformation infographic
Create a digital infographic using your preferred software, comparing and contrasting the energy transfer and transformation of at least five different forms of energy. Present your infographic to your classmates and try to teach them something new!
Investigating a bow and arrow
When a bow is stretched to shoot an arrow, the wood and bowstring bend with an elastic force, and this stores energy. The further the bow string is pulled, the more energy is stored. When the arrow is released, the elastic potential energy is converted to kinetic energy as the arrow increases its speed.
UNCORRECTEDSAMPLEPAGES
Figure 8.51 Energy flow diagram for an arrow being shot from a bow
Figure 8.52 A bow and arrow converts elastic potential energy to kinetic energy.
Investigating a hot-air balloon
Sometimes a machine can convert a source of energy into two or more forms at the same time. The operation of a hot-air balloon involves multiple energy changes. When the hot-air balloon first takes off, chemical potential energy is stored in the form of natural gas (in the gas cylinder in the basket of the balloon). When the gas is burned, it releases thermal energy, which heats the air in the balloon, as well as some waste sound energy. The air in the balloon expands as it warms up, and this makes the air inside the balloon lighter than the air around the balloon. The balloon then rises, due to buoyancy forces, gaining kinetic energy and gravitational potential energy as it gains altitude.
UNCORRECTEDSAMPLEPAGES
Figure 8.54 A hot-air balloon converts chemical potential energy to thermal energy, then kinetic energy as it moves and then gravitational potential energy as it gets higher.
Investigating an aircraft taking off
When an aircraft takes off, it starts moving slowly from one end of the runway and then accelerates under full power until it leaves the ground at the other end. When it first starts its take-off, the jet has chemical potential energy stored in the form of aviation fuel in its tanks. The fuel is ignited in the jet engines to create a force that accelerates the aircraft along the runway, gaining kinetic energy as it does so. When the aircraft reaches sufficient speed, it lifts off and gains gravitational potential energy as it rises into the air.
VIDEO Energy transformations in a hot-air balloon
Figure 8.53 Energy flow diagram for a hot-air balloon
input energy the energy that a machine or device uses as its source of energy
output energy the energy that a machine or device provides or wastes
An aircraft in flight is burning fuel and making noise while in movement. This thermal and sound waste energy can even be quantified in an energy flow diagram. In Figure 8.55, the approximate percentages of the two forms of waste energy have been added to the flow diagram for the jet aircraft. These can be included if they are known. Remember, the total amount of input energy must exactly equal the total output energy when waste energy is included.
Kinetic energy 45% (aircraft)
UNCORRECTEDSAMPLEPAGES
Chemical potential energy, 100% (aviation fuel)
Fuel burns in the jet engines to create thrust
Gravitational potential energy 15% (aircraft)
Thermal energy 39% (waste)
Sound energy 1% (waste)
In this example, the useful energy is kinetic energy (45%) and gravitational potential energy (15%), which adds up to 60%. This means that 60% of the energy input is converted to useful energy and the efficiency rating of the aircraft’s engines is 60%. The other 40% is wasted through thermal and sound energy.
Figure 8.55 An aircraft converts chemical potential energy to kinetic energy and gravitational potential energy.
Figure 8.56 Energy flow diagram for a jet aircraft taking off
1. Draw flow diagrams for the following energy transformations.
a) a television converting electrical energy to sound, thermal and light energy
b) a light bulb converting electrical energy to light and thermal energy
c) a human converting chemical potential energy from food into kinetic energy when moving
Waste energy
Useful energy is the output energy that the process is designed to produce. Waste energy is any other form of energy, usually thermal energy or sound, that is not wanted. An electric filament light bulb uses electrical energy to create light as useful energy; any thermal energy produced is waste energy. A petrol-driven lawnmower converts chemical potential energy in the petrol into kinetic energy and rotational kinetic energy, with thermal energy and sound as waste forms of energy.
When a candle burns, chemical potential energy is converted by combustion into light, with thermal energy released as waste energy. A tennis player converts chemical potential energy in food to kinetic energy but releases thermal energy as waste energy. Quick check 8.9
UNCORRECTEDSAMPLEPAGES
Figure 8.57 A filament light bulb emits light energy but also thermal energy as waste.
Figure 8.58 The chemical potential energy in petrol is converted into kinetic energy to move the lawnmower.
A two-step example is a battery-powered TV remote control. The input energy source is chemical potential energy in the battery. This is converted first to electrical energy and then to wave energy in the form of infrared light, with some waste thermal energy also. In the same way, a battery-powered radio converts chemical potential energy (in the batteries) to electrical energy then to sound.
UNCORRECTEDSAMPLEPAGES
Explore! 8.6
Battery recharge cycles
Have you ever noticed that an older model of mobile phone or laptop runs out of battery faster than when it was new? Perhaps the chemical potential energy stored is just not as much as it used to be? Is energy lost as a byproduct, such as heat?
Use the internet to find a credible source of information to answer the question: how does battery energy output change over many recharging cycles?
Figure 8.59 A tennis player has kinetic energy but may release waste energy as heat or sound.
Figure 8.60 A TV remote converts chemical potential energy to wave energy (infrared light).
Figure 8.61 Does a smartphone battery really recharge to 100%?
Try this 8.7
Energy transformations on roller coaster rides
Observe the roller coaster ride in Figure 8.62. Construct an energy flow diagram to represent the energy transformations in this ride.
Section 8.3 review
Online quiz
UNCORRECTEDSAMPLEPAGES
Go online to access the interactive section review and more! Section questions Teachers can assign tasks and track results
Section 8.3 questions
Remembering
1. Look closely at Figure 8.63.
Figure 8.63 A playground
a) Identify the components of the playground that involve gravitational potential energy.
b) State a way in which elastic potential energy could be incorporated into this playground setting. Uncorrected 2nd sample
Figure 8.62 What energy transformations occur on a roller coaster ride?
Understanding
2. Describe the difference between an energy transfer and an energy transformation.
3. Describe the energy transformation that occurs in the Sun.
4. Describe four situations that involve potential energy.
Applying
5. Draw an energy flow diagram for each of the following situations.
a) A stone is dropped from the top of a building.
b) A car is slowing down as it moves up a hill.
c) A charcoal fire is burning in a barbeque.
d) A bungee jumper jumps from the top of the jump to the bottom.
e) An electric train starts from rest and builds up to full speed.
f) A person rides on an escalator from the bottom to the top.
g) A dog is sprinting.
Analysing
6. Think about all the different types of energy we encounter every day; driving a car is one example. Pick another example and consider how you can make the process more energy efficient.
Evaluating
UNCORRECTEDSAMPLEPAGES
7. Cars are energy inefficient.
a) Determine the input form of energy and the useful and wasted forms of energy output.
b) Propose some other forms of transport that are more energy efficient.
Figure 8.64 Cooking food on a charcoal fire barbeque
Figure 8.65 An electric train
Figure 8.66 People riding escalators
Figure 8.67 An Australian shepherd in full flight
Chapter review
Chapter checklist
UNCORRECTEDSAMPLEPAGES
Success criteria
Linked questions
8.1 I can define energy. 1, 9
8.1 I can describe the different types of kinetic and potential energy.2, 3, 4
8.2 I can distinguish between temperature, thermal energy and heat.8
8.2 I can compare the transfer of energy by conduction, convection and radiation. 5
8.3 I can define the law of conservation of energy. 12
8.3 I can describe how energy is transferred and transformed using a flow diagram. 11, 14
Scorcher competition
Review questions
Data questions
Review questions
Remembering
1. Define energy and its units.
2. State the kind of energy you increase if you climb a mountain.
3. Recall the term for energy that is stored when a spring is compressed.
4. Select the correct description for each term in the table below.
Term
Description
Sound energyThe energy that moving objects have
Kinetic energyA form of wave energy that can travel through space
Wave energyA form of wave energy consisting of vibrations in the air
Thermal energyEnergy carried by a wave travelling on or through a substance
Light energyThe energy that moves between two objects of differing temperatures
5. Define conduction, convection and radiation.
6. State whether each of the following sentences is true or false.
a) When bouncing a ball, elastic potential energy is involved.
b) An object can have energy even when it is stationary.
c) An object must be moving to transform energy from one form to another.
d) When driving a car, chemical potential, gravitational potential and kinetic energy are involved.
Go online to access the interactive chapter review
7. Name an object that transforms:
a) electrical energy into thermal energy.
b) elastic energy into kinetic energy.
c) chemical potential energy into kinetic energy.
d) chemical potential energy into thermal energy.
8. Describe the difference between heat and temperature.
9. Look around your environment and identify as many examples of energy as you can see.
10. As you go about your day, identify all the different types of energy transformations that occur.
Applying
11. Draw a flow diagram showing the energy transformation that occurs in a gas stove.
12. Explain why a light bulb with an input energy of 1200 J cannot produce 1500 J of light energy.
13. Explain the difference between an energy-efficient light bulb and a less efficient light bulb.
14. Use the diagram of a waterwheel in Figure 8.68 to draw an energy flow diagram for this process.
Analysing
15. Consider the Sun’s role in life on Earth. Explain why there would be no life on Earth without the Sun.
Evaluating
16. Discuss the pros and cons of using nuclear energy.
Figure 8.68 An overshot waterwheel
Data questions
A group of students is testing the advertising claims of 10 different brands of rechargeable AA batteries, which are a source of chemical potential energy. Each AA battery is claimed to provide at least 1.50 V when new. The initial voltage for three new batteries of each brand was recorded by preparing a circuit with a multimeter, and the data are presented in Table 8.4.
UNCORRECTEDSAMPLEPAGES
Table 8.4 Recorded voltage for three new AA batteries of different brands
1. Identify the battery with the highest initial voltage.
2. A ‘flat’ AA battery can be considered, in this case, to have a voltage of less than 1.3 V. Determine whether any of the newly purchased AA batteries are already flat.
3. For the first battery tested of each brand, remove any flat batteries as outliers and calculate the mean initial AA battery voltage.
4. With respect to the initial voltage claim of at least 1.5 V, identify any patterns that appear in the observed initial voltages.
5. Classify the battery brands as those that meet their claim of an initial voltage of 1.5 V and those that don’t consistently meet their claim.
6. Now categorise the battery brands that do meet their claim into those with an initial voltage much higher than the claim (1.60 V+) and those consistently just above the claim (1.50–1.59 V).
7. Battery brand 9 also claims to have the ‘longest lasting AA battery’. Justify whether the data in Table 8.4 supports this claim.
8. After complaints to battery brand 3 about the quality of their batteries, a spokesperson revealed that there was a 10% chance of a battery in their packs being sold with a voltage of less than 1.5 V. Justify this claim with respect to the reliability of the data presented in Table 8.4.
9. Predict whether these AA batteries would return to their ‘as new’ initial voltage after being recharged from flat.
stEM activity: Wind power
Background information
Wind power has been used for generations as a method of generating useable energy. Wind turns the turbine and generates mechanical energy, which has been used for many things over the years. From providing energy to pump water from a reservoir to electricity generation, wind power has many uses, and a major benefit is its ability to be generated in remote areas.
DESIGN BRIEF
Design a wind turbine capable of lifting an object.
activity instructions
In groups, you will design and construct a simple wind turbine capable of lifting weights from the floor up to bench height. Your turbine must be efficient in its energy conversion and sustainable in its design.
Attachment allowing shaft to spin (made from masking tape)
cup
UNCORRECTEDSAMPLEPAGES
Figure 8.69 Different types of wind turbines
Pencil (shaft)
Blades made of card String
Suggested materials
• a medium-sized fan (to simulate a constant flow of wind)
• cardboard (different thicknesses if possible)
• masking tape (optional)
• string
• pencils
• scissors
• paper or plastic cup for carrying the load
• masses (you can use Lego® characters as well)
• electronic scale (optional)
Research and feasibility
1. Research and discuss in your group how wind turbine blades are shaped to capture the maximum amount of wind. Consider the materials used in construction, different shaped turbines and their use in high and low wind areas.
2. Discuss in your group the constraints of your building materials and testing area.
Design and sustainability
3. Sketch and label multiple turbine designs within your group and discuss the effectiveness of the design features based on research.
4. Propose a measure of design efficiency. Think about how you can quantitatively measure how effective one design/prototype is compared with another. This may include measures for sturdiness, speed of lift and maximum capacity. Discuss in your group the relationship between blade shape and blade spin for your design.
5. Prepare a table you can use to test different designs and to find the optimal shape for the wind conditions you are testing for. Trial different fan speeds to see their effect.
6. Discuss how sustainable your design is and its effect on the environment. Does blade design affect this?
Create
7. Build your design and test using the weights.
Evaluate and modify
8. Discuss and suggest three possible solutions to the problems you encounter.
9. Predict what would happen to the cup if the fan (wind) was turned off when the cup was halfway between the floor and the tabletop. Now test this scenario and write down your observations.
10. Evaluate and present the most effective design to the class and discuss why you believed this to be the most effective wind turbine design in this situation.
2nd
UNCORRECTEDSAMPLEPAGES
Chapter 9 Electricity
Many objects, including some household appliances and cars, rely on electricity to operate. The way they function depends on how the electrical components within them are arranged; this is called their electrical circuit. In this chapter, you will learn about what electricity is and how electricity flows in a circuit. You will learn about various components in an electrical circuit and how using different electrical circuits and components changes their uses. Electricity also needs to be used safely in everyday households, and there are many ways in which appliances are designed to protect their users.
Chapter map
Section 9.1
Section 9.2
Section 9.3
Battery Power supply
Light bulb
LED
Resistor
Variable resistor
Current electricity
involves a circuit made of
• Power source
• Load
• Connecting wires
Electricity
Ohm’s law
V = IR or I = or R = R V I V
Measurements:
Voltage, V, in volts (V)
Current, I, in amperes (A)
Resistance, R, in ohms (Ω)
Circuit diagrams are used to indicate how a circuit is set up.
Static electricity
involves electrostatic charge.
e.g. lightning
Circuit diagrams have many household applications
Safety
• Earthing
• Double insulation
• Fuse
• Circuit breaker
• Safety switch
• Short circuit
UNCORRECTEDSAMPLEPAGES
Curriculum
Physical sciences
The flow of electricity through a circuit is affected by the type of circuit; a load placed in a circuit transforms electrical energy into other forms of energy; safety switches and circuit breakers are devices installed in buildings to protect people and electrical systems.
• drawing circuit diagrams, using appropriate symbols, and constructing models of series and parallel circuits
9.1, 9.2, 9.3
• comparing safety switches and circuit breakers and researching regulations regarding their use 9.3
short circuit static discharge static electricity voltage voltage drop voltmeter
UNCORRECTEDSAMPLEPAGES
9.1 Electricity
Learning goal
At the end of this section, I will be able to:
1. Define ‘electricity’, ‘static electricity’ and ‘current electricity’.
UNCORRECTEDSAMPLEPAGES
Electricity is a form of energy that results from either the accumulation of charge or the flow of charge. Charge can be positive (+) or negative (–). Atoms contain positive charge in the form of protons and negative charge in the form of electrons (see Figure 9.1). Electricity is the movement of the negatively charged electrons, carrying energy from atom to atom in a conductor.
electricity an imbalance of charge on objects electrostatic charge a charge that stays on an object static discharge a sudden transfer of electrostatic charge
Figure 9.1 The modern Bohr model of the atom with neutrons, which have no charge, positively charged protons and negatively charged electrons. The net charge is zero, but when the atom loses an electron, the atom becomes a positively charged ion.
Static electricity and charge
Static electricity is produced when there is an imbalance of charge on objects; that is, there is a build-up of positive or negative charge. Usually, objects are neither positively nor negatively charged, but have an overall charge of zero. An imbalance can occur when electrons are transferred from one object to another. When negatively charged electrons are removed from an object, it becomes positively charged, whereas adding electrons to an object causes it to become negatively charged. The charge build-up is called electrostatic charge because it stays on the object (‘static’ means stationary or still).
You may have experienced the effects of static electricity when you have combed your hair, or you may have received a small shock when you touched a metal door handle. This is caused by the sudden flow of electrons from a charged object to you and is called static discharge. One of the most dramatic demonstrations of the energy of static electricity is seen during a thunderstorm. A bolt of lightning releases an enormous amount of energy in an electrical discharge. Figure 9.2 This lightning strike is an example of a powerful static discharge.
Electron
Proton Neutron
Explore! 9.1
lightning’s static electricity
Lightning occurs because of the same principle involved when you receive a small shock from a car or a doorknob, or see sparks when you take your jumper off. When particles of ice bump into each other in storm clouds, a huge amount of charge builds up. The top of the cloud becomes positively charged, while the bottom of the cloud becomes negatively charged. Eventually, the attraction between the charges becomes too great and a discharge of electrical energy occurs between them, producing lightning in the cloud. Sometimes the lightning moves from the cloud to the ground.
Conduct some research to answer the following questions.
1. a) Statistically, does lightning strike more men than women?
b) Propose several reasons why this might be the case.
2. Explain what the lightning 30-30 rule is.
UNCORRECTEDSAMPLEPAGES
The presence of electrostatic charge can be dangerous. Aeroplanes being refuelled must be ‘grounded’ (that is, connected by wires to the earth) so that static electricity does not cause a spark and an explosion (see Figure 9.4).
Figure 9.3 When the difference in electrical charge becomes too great, lightning discharges between clouds.
Figure 9.4 The aeroplane is connected to earthing wires during refuelling to avoid sparks and a possible explosion.
Try this 9.1
Hair and static electricity
Blow up a balloon and tie it off. Rub it against your hair or ask a friend who has fine hair to rub the balloon against their hair. What do you observe? Can you explain what happened in terms of movement of charge?
Figure 9.5 When a balloon is rubbed against hair, electrons from the hair transfer to the surface of the balloon, giving the balloon an overall negative charge, while the hair now has a positive charge. Recall that like charges repel and opposite charges attract, so the hair (+) is now attracted to the balloon (–).
Did you know? 9.1
History of static electricity
The Ancient Greek philosopher Thales of Miletus, in about 600 bc, was the first to describe a form of static electricity. When he rubbed a piece of amber (fossilised tree resin) on fur, Thales noticed that he could attract light objects such as hair, straw and small pieces of wood shavings. He could even produce small electrical sparks by more vigorous rubbing of the amber. In Ancient Greek, the word for amber is elektron, which gave its name to the electron and electricity.
1. Outline the structure of an
2. Define: a) electricity b) charge c) static electricity
3. Describe how rubbing two different materials together can create static electricity.
4. Explain how static electricity is created by combing your hair.
2nd
Figure 9.6 Amber rubbed on fur can produce static electricity.
Quick check 9.1
atom.
current the flow of electric charge, which may continue in a steady manner for a period of time component a part of a circuit
Current electricity
Static electricity is when charge gathers in one place, but in current electricity, charges move and may continue moving in a steady manner for a period of time. These charges are electrons. When the charge passes through an electrical component, such as a light bulb, it transfers energy to that component. The component then converts that energy into other forms of energy such as movement, light and heat.
Try this 9.2
Uses of electrical energy
What are some electrical appliances you see used in the classroom or at home? In each case, what is electrical energy being converted into? What type of energy does a remote control convert electrical energy into?
Circuits
load something that uses energy in a circuit
UNCORRECTEDSAMPLEPAGES
• connecting wires (to carry the moving electrons). circuit a structure through which charges
For electrical energy to be transferred, circuits must be configured to allow a flow of charge. Electric circuits can be simple (for example, a torch) or complex (for example, a computer’s central processing unit), but they all consist of the same basic components and follow the same principles in their operation.
It is current electricity that moves in a circuit. If there is a break in the loop, then the electricity stops flowing. Electrons need a path out of and back to the power source to continue moving around the circuit. An electric circuit always has these three components:
• a power source (provides energy to electrons, such as a battery or power pack)
• a load (uses the energy, such as a light bulb)
Figure 9.7 Electricity is used to run many household items.
Power source
Figure 9.8 shows the symbol for a cell, the power source in a circuit. It consists of two vertical lines. The longer line represents the positive terminal, and the shorter line represents the negative terminal. Because there is an imbalance of charge, when the two terminals are connected in a circuit, electrons flow from the negative to the positive terminal. The cell supplies the energy to the electrons, which are then pushed around the circuit. An everyday battery, like you might have in a torch, is an electrochemical cell. Technically, a battery is made up of two or more cells. An example is a lead–acid car battery – it usually consists of six cells and, therefore, lasts longer than a single cell. A power pack is a bank of multi-cell batteries. In this text, we use battery in a general sense to mean a portable source of power (including cells).
Did you know? 9.2
What happens to used batteries?
Australians use about 350 million batteries every year. About 80% of these (amounting to 6000 tonnes) are alkaline batteries, which are the most commonly used dry cell. Most people do not use the recycling options available, and only about 4% of batteries are recycled. Batteries can contain cadmium, lead, mercury, nickel and lithium, which are all toxic and harmful to the environment. When buried in landfill, these toxic metals corrode the battery casing and are released into the water supply.
Let’s all do our part and recycle disposable batteries!
Load
Electrons moving through a circuit carry energy from the power source to components that can transform that energy into other forms of energy as the electrons pass. These energy transformations occur because of the presence of ‘loads’ in the circuit, which are components that use the energy carried by the electrons. For example, in light bulbs, the energy being carried by the electrons is transformed into light and thermal energy.
Figure 9.8 The symbol for the power source in a circuit has two lines. The shorter line represents the negative terminal, while the longer line represents the positive terminal of the power source.
two or more cells dry cell a battery in which the electrolyte is absorbed in a solid to form a paste
UNCORRECTEDSAMPLEPAGES
Figure 9.11 shows the most common circuit symbol for an incandescent light bulb. Only a small amount of the energy is transformed into light energy – about 96% is wasted as thermal energy. Light bulbs that are not very energy efficient can get quite hot!
cell a single electrical energy source that produces a current battery a portable source of power; made up of
Figure 9.9 The dry cell is typically in the form of non-rechargeable AA and AAA batteries.
Figure 9.10 An older-style incandescent light bulb transforms electrical energy into light and thermal energy. These are typically only 3–4% efficient in transforming electrical energy into light.
9.11
incandescent light bulb is a circle with a cross in the middle.
alternating current (AC) a form of electricity in which the current reverses direction in regular cycles
direct current (DC) a form of electricity in which the current flows in one direction
LEDs
Light-emitting diodes (LEDs) are semi-conductor devices that emit light and can be used in electric circuits, as shown in Figure 9.12. They transform electrical energy into light energy much more efficiently than light bulbs, with only 20% of the energy being lost as thermal energy. The lifespan of LEDs is also much longer than that of incandescent light bulbs. LEDs are often used in appliances such as watches, microwaves, calculators, traffic lights and TV screens. The symbol for an LED is shown in Figure 9.13.
Connecting wires
UNCORRECTEDSAMPLEPAGES
9.13 The two arrows on the circuit symbol for an LED indicate that light is being emitted.
Current is the name given to the electrons (charge) flowing through the connecting wires in a circuit. While we know that it is the negatively charged electrons that move, in circuit diagrams the current is shown going in the opposite direction; that is, in the imagined direction of a positively charged particle moving from the positive to the negative terminal of the power source (see Figure 9.14). This is called conventional current and follows the direction defined in the 1700s when electricity was first being experimented with. At that time, electrons were unknown, so scientists assumed it was the positive charges moving, not negative charges (electrons).
An alternating current (AC) electricity source (like an AC power pack) reverses the direction of the current about 50 times every second. This is the type of power supply most commonly used with appliances. By contrast, a battery produces a direct current (DC), which flows in one direction only. In this chapter, you will mainly be using DC sources.
Figure 9.12 LEDs (light-emitting diodes) are semi-conductor devices that emit light and can be used in electric circuits.
Figure
Load (light bulb)
Figure 9.14 In this simple circuit, conventional current is indicated as flowing from the positive terminal to the negative terminal of a cell. The connecting wires are drawn as straight lines.
Quick check 9.2
1. Contrast current electricity and static electricity.
2. Contrast direct current and alternating current.
3. Identify what flows in the connecting wires of an electric circuit.
4. Suggest why a circuit must be ‘closed’ or complete for it to work.
UNCORRECTEDSAMPLEPAGES
Section 9.1 questions
Remembering
1. Recall the electric charge on a neutron, an electron, a proton and an atom.
2. Name the charged particles that carry an electric current through a circuit.
3. Define:
a) direct current
b) conventional current
4. State the role of the connecting wires in an electric circuit.
Understanding
5. Explain how rubbing amber produces electric sparks.
Applying
6. Draw a simple circuit diagram that shows how to light an LED using a battery with one cell.
Analysing
7. Contrast static electricity and current electricity and give examples of each.
Evaluating
8. It is often difficult to completely empty the plastic bag that contains breakfast muesli because small oat flakes seem to get stuck to the inside of the bag. Propose a possible explanation for this effect.
9. Lightning bolts contain large amounts of electrical energy. Propose reasons why the electricity from lightning bolts is not captured for our electrical needs.
Section 9.1 review
quiz
questions
9.2 Simple circuits
Learning goals
At the end of this section, I will be able to:
1. Construct a circuit diagram, using correct symbols for components.
2. Define ‘voltage’, ‘current’ and ‘resistance’ and their units.
3. Use Ohm’s law to calculate voltage, current and resistance in a circuit.
Circuit diagrams
The circuit in Figure 9.15 shows a battery pack connected to a light bulb with connecting wires and a switch. When the switch is pressed down, it completes the circuit, so electrons can flow from the negative terminal of the battery through the circuit and back to the positive terminal.
To understand a circuit and analyse how it works, it is necessary to identify its component parts and see how they work together to make the circuit operate. We can represent a circuit as a diagram in which each symbol represents a different electrical component. Figure 9.15 shows a circuit (a) and the same circuit represented by a circuit diagram and symbols (b).
As you investigate current electricity in closed circuits, you will use more of these simplified diagrams to represent circuits. You will begin by looking at the different symbols for the different components of circuits.
Circuit symbols
You have already seen some common electrical components and their circuit symbols in section 9.1 (battery, load and connecting wires). Table 9.1 shows several other useful electrical components and their circuit symbols.
Connecting wire
Open switch
Closed switch Cell
a device for measuring electric
voltmeter a device for measuring voltage between two points in an electric circuit
Making thinking visible 9.1
Parts, purposes, complexities: Electric circuits
1. List the minimum parts required for a circuit in which current flows.
2. What is the function of each part?
3. What components can be added to an electic circuit to make it more complex? What is the function of these components?
Parts,
Drawing circuit diagrams
A circuit diagram is a diagrammatical representation of an electric circuit using basic symbols. It is a simple and fast way to see how all the circuit components are connected. Circuit diagrams should always be drawn with a ruler and pencil. All lines should be straight and joined at right angles.
UNCORRECTEDSAMPLEPAGES
Power supply Connecting wires
(light bulb)
Figure 9.17 The left drawing shows the inside of a torch, but you use a simplified diagram like the right one to represent the circuit. The batteries are the energy source and the light bulb is the load. Can you think of one component that needs to be added to the diagram?
The
purposes, complexities thinking routine was developed by Project Zero, a research centre at the Harvard Graduate School of Education.
Figure 9.16 Electric circuits can be complex.
Load
Try this 9.3
Circuit diagrams
Draw circuit diagrams for the following circuits.
UNCORRECTEDSAMPLEPAGES
1. List five components that could be included in a circuit.
2. Draw the circuit symbol for each component listed in Question 1.
3. Explain why circuit diagrams are used.
4. List the rules that apply to drawing a circuit diagram.
Voltage
When electrons flow from the negative terminal of a circuit, they flow towards a positively charged terminal. Voltage is the potential difference between two points in an electric circuit. The potential difference describes the difference in electrical potential energy between the negative and positive terminals.
Potential difference can be likened to the water pressure in a backyard hose. As the water tap is opened more, the water pressure at the start of the hose increases, and so the water moves faster to the other end of the hose to escape. Similarly, a high voltage is when there is a large difference
voltage the potential difference between two points in an electric circuit; measured in volts (V) potential difference the difference in electrical potential energy between the negative and positive terminals in an electric circuit
Quick check 9.3
voltage drop the reduction in voltage that occurs across a component or section of an electric circuit because of the resistance of the conductive material coulomb the amount of charge transferred in 1 second with a current of 1 amp ampere the unit of electrical current, usually shortened to amp (A); 1 amp = 1 coulomb per second
between the negative charge at one end of the circuit and the positive charge at the other end, causing charged particles to rush through the circuit, creating current.
Voltage is measured in volts (V), using a voltmeter. A voltmeter can measure the voltage of components of the circuit. A voltmeter must be connected to the start and the end of the component as the voltage will be measured across the component. This is called connecting in parallel to the circuit. The circuit symbol for a voltmeter is shown in Figure 9.18.
9.18 The circuit symbol for a voltmeter is a circle with a capital V in the middle.
Voltage drop is a phenomenon that occurs in electric circuits when the voltage level decreases across a component or a section of the circuit. This drop in voltage is caused by the resistance of the conductive material that the current is flowing through. Voltage drops can reduce the efficiency and performance of electrical systems.
Current
Current is the movement of charge or electrons around a circuit. It is possible to measure the rate at which charge passes any point in a circuit. Imagine being able to see the electrons moving along a conductor carrying an electric current. You could count the number that pass any particular point in a second and use that number as a measure of the current (in electrons per second). The unit of current is defined this way: 1 coulomb of charge per second is 1 ampere (A), or amp for short. A coulomb can be described as the amount of charge transferred in 1 second with a current of 1 amp. You can increase the electric current flowing through a circuit by increasing the voltage, as charge will flow more quickly with a greater magnitude of potential difference.
To measure the current in specific locations of a circuit, an ammeter is used. An ammeter is connected in line to measure the current through a circuit. This is called connecting in series with the circuit. The circuit symbol for an ammeter is shown in Figure 9.19.
An ammeter can measure current in amperes (A) or in milliamperes (mA):
9.19 The circuit symbol for an ammeter is a circle with a capital A in the middle. Connected in parallel Connected in series
Figure 9.20 When building a circuit, you need to place the ammeter in series and the voltmeter in parallel.
Figure
Figure
Quick check 9.4
1. Define:
a) voltage
b) voltage drop
c) voltmeter
d) current
e) ampere
f) ammeter
2. How does current differ in a circuit when the switch is open and when the switch is closed? Explain your answer.
resistance
The resistance in an electric circuit is a measure of a material’s ability to resist the flow of current. Resistance is measured using the unit ohm. The symbol for ohms is the last letter in the Greek alphabet – omega (Ω).
Conductors
If current can flow easily through a material, the material has a low resistance. Low-resistance materials are generally called conductors. Metals are a good example of conductors.
UNCORRECTEDSAMPLEPAGES
Some metals are much better at conducting electricity than others. Copper is an excellent conductor of electricity. It is used in electric wiring, electric motors, telecommunications and electric cars. Gold is also an excellent conductor of electricity. However, it is much more expensive than copper. Because it does not easily oxidise and therefore deteriorate, gold is used in small amounts in critical electronic components such as computer chips and spacecraft electronics. Aluminium is another
Figure 9.21 High-voltage (typically 550 000 V) power lines distributing electricity most often use aluminium wires as their main conductor.
very good low-resistance conductor. It is not as good a conductor as copper, but it is much lighter. This makes it suitable for conducting electricity in the high-voltage transmission lines that cross the country.
A digital multimeter, as shown in Figure 9.22, is a tool used to measure current, voltage and resistance.
Did you know? 9.3
Saving lives
A defibrillator is a device that treats life-threatening heart problems by delivering a measured dose of electric current to the heart. When the heart is not beating properly, blood is not circulated around the body. To get the heart pumping, an electric shock is delivered to the heart. An automatic external defibrillator comes with instructions, which allows it to be used by untrained people and significantly improve survival rates for people having a heart attack.
UNCORRECTEDSAMPLEPAGES
Figure 9.22 Digital multimeters can measure current, voltage and resistance.
Figure
Insulators
High resistance means that it is difficult for electrons to pass through the material. Some materials have such high resistance that they block electric current almost completely. Such materials are called insulators. Examples of good electrical insulators are various plastics, glass, ceramics, wood and rubber. insulator (electricity) a material that does not allow current to flow through it easily
Quick check 9.5
1. Define ‘resistance’.
2. Explain what a conductor and an insulator are and give an example of each.
Ohm’s law
Georg Simon Ohm was a German physicist. In 1827, Ohm began his research with the battery invented by the Italian scientist Alessandro Volta. Constructing his own equipment, Ohm found that electric current was directly proportional to the voltage applied across some conductors; that is, if you double the voltage, you double the current. There was also inverse proportionality between resistance and current; that is, if you double the resistance, you halve the current. This relationship is known as Ohm’s law, in which R is the resistance in ohms (Ω), V is the voltage in volts (V) and I is the current in amperes (A).
UNCORRECTEDSAMPLEPAGES
Figure 9.24 The formula triangle for Ohm’s law. To use the formula triangle, cover the variable you want to calculate. If the other variables are on the same row, multiply them together. If they are on different rows, divide the top variable by the bottom variable.
For example, if a circuit has a 2.5 V power source and a 1 Ω resistor, the current would be: I = 2.5 V 1 Ω = 2.5 A
If the resistance is changed to 2 Ω while keeping the voltage at 2.5 V, then the current decreases to:
Recall that resistance is how difficult it is for electrons to travel around a circuit. So, if you increase resistance, the current must decrease.
Quick check 9.6
1. Explain the relationship between current and voltage as stated in Ohm’s law.
2. Using the formula V = IR, calculate the:
a) resistance of a circuit where the voltage supplied is 6 V and the current is 2 A.
b) current in a circuit where the resistance is 50 Ω and the voltage is 25 V.
Uncorrected 2nd
c) voltage in a circuit where the resistance is 100 Ω and the current in the circuit is 0.5 A.
Ohm’s law a scientific law that states that the current that flows through most conductors is directly proportional to the voltage applied
Investigating resistance
Aim
To investigate how the length of a wire affects its resistance
Materials
• DC power supply (6 V)
• 6 connecting leads
• resistance wire such as constantan or nichrome
• alligator clips
Planning
• ammeter
• voltmeter
• metre ruler
1. Write a rationale about the factors that affect resistance.
2. Create a relevant and specific research question for this investigation.
Be careful
Electric shocks could occur.
Ensure the voltage output is not exceeded. Turn off the power supply when changing the circuit.
Do not let the two alligator clips touch.
3. Identify the independent, dependent and controlled variables for this investigation.
Method
1. Connect the circuit shown in the diagram by following these instructions.
a) Start on the positive side of the power supply.
b) Connect a lead from the positive socket to the positive side of the ammeter.
c) Connect a lead from the negative side of the ammeter to the alligator clip attached to the resistance wire at the zero end of the ruler.
d) Connect another lead from the other alligator clip to the negative side of the battery. This lead will be used to connect to the other side of the resistance wire and disconnect the power supply between taking readings.
e) Connect a lead from the positive side of the voltmeter to the alligator clip that you connected to the ammeter.
f) Connect a lead from the negative side of the voltmeter to the other alligator clip attached to the switch lead.
ruler
Resistance wire
2. Draw a suitable results table. (Hint: You should have four columns.)
3. Record the length of the wire between the alligator clips, and the readings on the ammeter and voltmeter in your results table.
UNCORRECTEDSAMPLEPAGES
4. Move the alligator clip attached to the disconnection lead to different points on the resistance wire, recording the ammeter and voltmeter readings at each length of wire. The voltmeter readings might not change.
continued …
Metre
Results
Record your results in your results table.
1. Calculate and record the resistance for each length of wire, using the Ohm’s law equation.
2. Plot a graph of length of wire (metres) against resistance (Ω), including a straight line of best fit.
Discussion
1. Identify any trends, patterns or relationships in your results.
2. Explain your results using your own scientific knowledge.
3. Your line of best fit might not go through the origin. Explain where the extra resistance came from.
Conclusion
Draw a conclusion from this experiment about length of wire and resistance, using data to support your statement.
Variable resistors
Resistors can be tailored for various circuits to control the amount of current that flows through the other components. There are also variable resistors, which can have their resistance adjusted to change the amount of current flowing through a circuit. These can be used to control the sound volumes on stereos and televisions, or the brightness of the lights in dimmer switches. Some fixed resistors are shown in Figure 9.25. These are 1000 Ω resistors; the coloured bands can be used to work out the value of the resistance. The symbols for fixed and variable resistors are shown in Figure 9.26.
A light-dependent resistor (LDR) is a special type of variable resistor because its resistance depends on the amount of light falling on it. As light intensity increases, resistance decreases. LDRs are used in light-sensitive electronic circuits and act as light-sensitive switches; for example, they are used for lights that turn on automatically when it gets dark.
UNCORRECTEDSAMPLEPAGES
Figure 9.26 The symbol for a fixed resistor (left) is either a rectangle or a zigzag line. The symbol for a variable resistor (right) is the same, but with an arrow through it.
Thermistors are another special type of variable resistor. Their resistance changes as the temperature increases or decreases. Thermistors regulate the temperature in air conditioners and refrigerators according to the relationship between voltage and resistance.
Quick check 9.7
1. Explain how a variable resistor works and give an example of how it may be used in your home.
Figure 9.25 Fixed resistors have coloured bands that indicate their value.
Go online to access the interactive section review and more!
Explore! 9.2
robotic sensors
Humans have five main senses: sight, smell, touch, hearing and taste. Engineers take a lot of inspiration from these senses and incorporate them into other pieces of technology, such as robots. For example, there are now robotic vacuum cleaners with sensors that tell the robot what part of the room it is in and where it has already vacuumed.
Conduct some research to answer the following questions.
1. How are sensors being used in robots?
2. How can the study of human senses help people in the medical field?
Section 9.2 review
Online quiz
UNCORRECTEDSAMPLEPAGES
Section questions
Section 9.2 questions
Remembering
1. Define the following terms and give an example of each.
a) conductor
b) insulator
c) resistor
d) variable resistor
2. Recall the device that measures current.
3. Recall the device that measures voltage.
4. State Ohm’s law.
Understanding
5. Draw the symbols for the following electrical components.
a) single cell
b) three cells in a row
c) open switch
d) resistor
Uncorrected 2nd sample
e) light bulb
Teachers can assign tasks and track results
Figure 9.27 The robotic vacuum cleaner has sensors that tell it where it has already cleaned.
Figure 9.28 Bionic hands need to be able to replicate the senses in a working human hand to operate effectively.
6. a) Explain why an ammeter must be connected in line with the other components of a circuit (‘in series’).
b) Explain why a voltmeter must be connected across the component for which voltage you are measuring in a circuit (‘in parallel’).
7. Summarise how a variable resistor works.
Applying
8. Both aluminium and copper conduct electricity. Identify which of these two conducting metals you would be most likely to find in the following. Give reasons.
a) household wiring
b) high-voltage transmission lines
9. Contrast voltage and voltage drop.
Analysing
10. The circuit shown was constructed from a 6 V battery, a switch, a 6 V light bulb and a voltmeter.
a) Identify each of the electrical components on the diagram.
b) Identify which side of the battery is positive on the diagram.
c) Copy and complete the table and deduce the voltage across each component when the switch is open (off) and closed (on).
Component
Battery
Switch
Light bulb
UNCORRECTEDSAMPLEPAGES
Voltage (V)
Switch openSwitch closed
11. The circuit shown has been constructed from a 6 V battery, a switch, a 6 V light bulb with a resistance of 5 Ω and an ammeter.
Copy and complete the table and deduce the current flowing through the circuit when the switch is open and closed for different positions of the ammeter.
Position of ammeter
Between power source and switch
Between switch and light bulb
Between light bulb and power
Evaluating
Current (A)
Switch openSwitch closed
12. Use your knowledge of light-dependent resistors to propose a household appliance that uses them.
13. Conduct some research and discuss measures that could stop the wastage of resources associated with the excessive use of dry cell non-rechargeable batteries in Australia.
14. Propose three arguments for and three arguments against the widespread adoption and use of electric cars in Australia.
WORKSHEET
More circuits and their applications
9.3 Applications of series and parallel circuits
Learning goals
At the end of this section, I will be able to:
1. Draw series and parallel circuits.
2. Describe the safety aspects of household electricity.
Series circuits
A torch circuit in which the batteries, the switch and the light bulb are connected one after the other is an example of a series circuit (see Figure 9.29).
Figure 9.29 A series circuit diagram of a torch contains the symbols for a power source, light bulb and switch.
Series circuits are easy to construct. However, if any part of the circuit fails, the circuit will not work because there is a break in the path through which current must flow. In the torch circuit, a flat battery, a faulty switch or a faulty light bulb would cause the circuit to stop working. Troubleshooting a faulty torch circuit would require systematically looking at each of these three components in turn.
Could you use a series circuit for car headlights? If one headlight bulb burned out, both headlights would stop working. This would be extremely dangerous if you were travelling at night.
In a series circuit, the voltage, or energy, is shared among the load. For example, in the circuit in Figure 9.30, if the light bulbs are identical, the voltage across each is half that of the power source. The current is the same throughout the circuit.
Figure 9.30 (a) A car headlight circuit modelled as a series circuit. (b) The matching circuit diagram with a 6 V power source and identical light bulbs
Try this 9.4
Series circuits
Two circuits will be set up for you by your teacher. They are shown here. Note the brightness of the light bulb in circuit 1.
Now look at circuit 2, where the two light bulbs are connected in series.
1. Do the light bulbs in circuit 2 glow as brightly as the light bulb in circuit 1? Explain your answer.
2. Predict what would happen if you disconnected the lead between the two light bulbs in the circuit.
3. Disconnect the lead and note what happens. Explain what you observe.
4. What happens if you add another light bulb in series? Explain what you observe.
Parallel circuits
An alternative car headlight circuit could be constructed using the same components that you used previously, but in a way that will prevent both lights from turning off if one doesn’t work. In this instance, you will model the headlight circuit using a parallel circuit, as shown in Figure 9.31.
In a parallel circuit, the current is split at each branching. For example, if the light bulbs in Figure 9.31 are identical, the current in each branch is half that of the power source. The voltage is the same across all the components.
Now if one headlight fails, the other one will still work because there is a clear connecting path between the battery and the other headlight when the switch is on. You may have seen a car travelling with just one headlight at night. This indicates that car headlights have been wired in parallel.
circuit a circuit in which each component is connected in a separate conducting path
Figure 9.31 (a) A car headlight circuit modelled as a parallel circuit. (b) The matching circuit diagram; the blue arrows indicate current split.
In a parallel circuit, each component is connected in a separate conducting path. This means that if one load component of the circuit is faulty, the other load components will still work. Most modern string lights are connected in parallel. If one of the 200 light bulbs fails, then the other 199 bulbs will still glow. In older-style string lights, all the bulbs were connected in series. This meant that if one bulb failed, then none of the bulbs would glow. The bulbs had to be replaced one by one until the whole circuit lit up again when the faulty one was found!
Quick check 9.8
1. Describe the differences between a series and a parallel circuit.
2. Explain why you would not wire your house in series configuration.
3. How does the brightness of light bulbs compare in series and parallel circuits?
4. Copy and complete the values in the following diagrams. Assume that the light bulbs are identical. WIDGET
Figure 9.32 Modern string lights are wired in a parallel circuit.
Try this 9.5
Parallel circuits
Two circuits will be set up for you by your teacher. They are shown here. Note the brightness of the light bulb in circuit 1.
Now look at circuit 2 where the two light bulbs are connected in parallel.
UNCORRECTEDSAMPLEPAGES
1. Do the light bulbs in circuit 2 glow as brightly as the light bulbs in circuit 1? Explain what you observe.
a) Predict what would happen if you disconnected the bottom light bulb in circuit 2.
b) Disconnect the lead. What happens to the brightness of the other light bulb? Explain what you observe.
c) What happens if you add another light bulb in parallel? Explain what you observe.
d) What happens if you add another light bulb in series with the bottom bulb? Explain what you observe.
Series and parallel circuits
Aim
To observe and compare the values of current and voltage in series and parallel circuits
Materials
• DC power supply (6 V)
• 6 V light bulbs ×2
• 6 V bulb holders ×2
• connecting leads with alligator clips
• ammeter
• voltmeter
Be careful
Electric shocks could occur. Ensure the voltage output is not exceeded. Turn off the power supply when changing the circuit.
Method
Series
1. Set up circuit 1 so that the two light bulbs are connected in series.
2. Measure the current at positions 1–3. Then measure the voltage across the power supply, bulb 1 and bulb 2. Record the readings in your results tables.
Parallel
1. Set up circuit 2 so that the two light bulbs are connected in parallel.
2. Measure and record the current at positions 1–6. Then measure the voltage across the power supply and each light bulb. Record the readings in your results tables.
Results
Copy and complete the following tables.
Current
Discussion
1. Explain your observations about the current values in the series circuit.
2. Explain your observations about the current values in the parallel circuit.
3. Explain your observations about the voltage values in the series circuit.
4. Explain your observations about the voltage values in the parallel circuit.
Household electricity
In your house, all your electrical appliances and lights transform the electrical energy into other forms of energy as the electrons flow through the different components. Power stations supply AC to homes. In Australia, electricity is supplied to homes at a voltage of 230 V and is referred to as
Power points (sockets) in the home have three slots: active, neutral and earth (see Figure 9.33). When you plug in an electrical device and switch the power on, current flows between the active and neutral slots through the appliance. The third slot is the earth slot. It is normally connected to a
Electrical plugs are designed to fit into these sockets. They may be two-pin plugs or three-pin plugs (see Figure 9.34). This is because some electrical appliances are double insulated and only require a connection between the active and neutral pins. These appliances use a two-pin plug. You might have a laptop computer with a two-pin plug. Other electrical appliances, such as toasters, must be earthed to protect the user from stray current. These appliances use a three-pin plug.
Safety
Earthing
In Australia, toasters and some other appliances have a plug with three pins, but how does earthing protect you? If your toaster has a metal casing, and there is a fault in the appliance, the metal casing might accidently become ‘live’. Then, because the bottom earth pin fits into the earth socket, the electric current will flow via the earth pin to the ground (see Figure 9.35). This prevents the current going through the body of a person who might be touching the metal case of the toaster.
mains electricity the electricity that is supplied to homes double insulated having two levels of insulating materials between the electrical parts of an appliance and any parts on the outside that you touch earthed having an earth pin in a plug through which the electric current will flow to the ground in the case of a fault
UNCORRECTEDSAMPLEPAGES
Figure 9.35 In an earthed appliance, like this toaster, any metal parts that can come into contact with the active part of the circuit and become ‘live’ automatically cause a large current to run to earth and blow a fuse or trip a circuit breaker. This is much better than having the current run through the user of the appliance!
Figure 9.33 An Australian power point has three slots: active, neutral and earth.
Figure 9.34 Power cords in Australia have either (a) a two-pin plug or (b) a three-pin plug.
Double insulation
Many newer small electrical appliances have two pins, without the earth pin. Typical examples you may have at home are computers, printers, hair dryers and drills. These appliances are double insulated. They have two levels of insulating materials between the electrical parts of the appliance and any parts on the outside that you touch. The symbol placed on all double-insulated appliances is shown in Figure 9.36.
So, the primary difference between an electric drill with a three-pin plug and another electric drill with a two-pin plug is the case material. If the drill case is made of conductive material (for example, metal), then it must have an earth pin (three-pin plug). Industrial appliances generally have three pins because they may experience rougher treatment in an industrial environment. In contrast, a domestic appliance is more likely to have double insulation and two pins.
Did you know? 9.4
Electrical wiring
In Australia, the following colour code is currently used for electrical wiring. Some older electrical appliances may still have the old colour code (described in brackets):
• brown – the active wire, which is at mains voltage, 230 V (It used to be red – a colour normally associated with danger.)
• blue – the neutral wire, which is nominally at 0 V (It used to be black.)
• green and yellow stripes – the earth wire, which is connected to the earth (It used to be plain green.)
Figure 9.36 An appliance with this symbol on it is double insulated.
Figure 9.37 The modern colour code for electrical wires: brown for the active wire, blue for the neutral, and green and yellow for the earth
Try this 9.6
Household electrical devices and appliances
Work in a group of three or four students.
1. Create a table with the same headings as in the following table but with four blank rows underneath.
*Note: new smoke alarms are connected to the mains electricity (230 V) and have a 9.0 V back-up battery for blackouts. N/A – not applicable
2. The characteristics of four electrical devices are shown in the table above. Brainstorm in your group four other electrical devices commonly used in and around the home. Place them in your table and determine their characteristics.
3. Explain why some plug-in devices have three pins while others only have two.
4. Explain why some devices have rechargeable batteries and others have non-rechargeable batteries.
5. If there was a power outage in your area from 6 p.m. to midnight, which of the electrical devices in your table would it be inconvenient to do without?
6. In the event of a sustained power outage (say, 24 hours), which of the electrical devices in your table would it be critical to do without?
Electrical
hazards
The mains electricity supply in Australia presents a potential hazard to life. Even a relatively small current passing through the human body can be deadly. Anyone using electricity should be aware of the associated dangers. All electrical work should be carried out by qualified electricians. People are injured or die every year because of carelessness, negligence and do-it-yourself electrical work. One of the main causes of electrocution in the home is the use of damaged cords and plugs. Frayed cords and plugs can expose the active, neutral and earth wires inside the plastic wire covering. If the plastic coatings are cracked, you could come in direct contact with a bare active wire. As Table 9.2 shows, the human body is very sensitive to relatively small currents. You can feel one-thousandth of an amp (1 mA), and a current of only 20 mA causes your muscles to involuntarily contract – meaning you cannot let go of the wire! If someone makes contact with you to save you, their muscles will most likely be paralysed as well, placing two people at risk of electrocution.
Most modern homes have quick-acting special safety switches that can cut the current off in less than one-thirtieth of a heartbeat.
With appropriate care and caution, many of these unfortunate electrical incidents can easily be avoided.
Current (mA)
1
10
20
50
90
150
200
500
Fuses and circuit breakers
Effect on the human body
Can be felt
Causes pain
Paralysed muscles – very difficult to let go
Severe shock
Breathing is affected
Breathing is very difficult
Death is likely
Serious burning, breathing stops, death inevitable
fuse a short length of conducting wire or strip of metal that melts when the current through it reaches a certain value, breaking the circuit
circuit breaker a device that carries out the same function as a fuse by breaking the circuit when the current through it exceeds a certain threshold
residual current device (RCD) a safety switch that trips the power when current leaks from circuits
A fuse is a short length of conducting wire or strip of metal that melts when the current through it reaches a certain value, breaking the circuit. Many fuses used in cars are designed this way. Look at Figure 9.39 – notice the fuse on the right no longer provides an electrical connection.
In most modern houses, fuses have been replaced with circuit breakers. A circuit breaker (see Figure 9.40) carries out the same function as a fuse by breaking the circuit when the current exceeds some safety limit, such as 20 A.
Safety switches (also known as residual current devices, RCDs) are different from circuit breakers. RCDs detect when current ‘leaks’ from circuits, possibly into a person. When 30 mA leaks from a circuit, these devices trip the power, preventing an electric shock.
Table 9.2 The size of the current and its effect on the human body
Fuse
Figure 9.39 The wire inside a fuse will break if the current passing through it gets too high.
Figure 9.40 Circuit breakers
Short circuit
A short circuit occurs when frayed electrical cords or faulty electrical appliances allow the current to flow from one conductor to another (for example, from active to neutral or from active to earth) with little or no resistance. The current increases rapidly, causing the wires to get hot and possibly cause a fire.
UNCORRECTEDSAMPLEPAGES
Explore! 9.3
Circuit breakers and RCDs in Western Australia
Use the internet to research the following WA Electrical Requirements (WAER).
1. Are all WA households required to have a main switch circuit breaker installed?
2. What is the minimum number of RCDs required to be installed on the main switchboard of WA households?
Did you know? 9.5
tasers
Law enforcement officers around the world are using alternative weapons, such as pepper sprays and rubber bullets, instead of traditional firearms (guns and rifles) to minimise serious injuries and deaths. One such weapon is the taser, which uses a peak voltages of 50 000 V to immobilise a suspect.
But what does a 50 000 V shock do to a person’s brain? Research has found that this electric shock can impair a person’s ability to process and remember information. Cognitive function greatly declines immediately after being tasered, which can pose problems for those who are being questioned by law enforcement officers shortly after being tasered. This newfound knowledge may change the protocols surrounding taser use, which is now heavily regulated.
Figure 9.41 A short circuit can cause a fire.
short circuit when current is allowed to flow from one conductor to another with little or no resistance
Figure 9.42 Tasers are used by law enforcement officers.
Go online to access the
Quick check 9.9
1. Recall the voltage of mains electricity in Australia.
2. State the purpose of the third socket of a power plug.
3. Explain why some appliances do not have an earth socket.
Section 9.3 review
6. Explain why some electrical appliances are not earthed.
7. Draw a diagram to show how four 1.5 V batteries can be connected in parallel. What is the total voltage provided by this battery circuit? Label the positive and negative terminals of each battery.
Applying
UNCORRECTEDSAMPLEPAGES
8. a) Explain what happens to your muscles when you experience a current of 20 mA from a live wire from the mains electricity. Draw a simple diagram modelling this scenario and label the components.
b) Explain why you should not grab a person who is being electrocuted by a current of 20 mA or more.
9. Explain the function of a safety switch in an electrical circuit.
10. A circuit breaker in your home fuse box continually trips when you are using your toaster. Explain what this means and what you should do next.
11. Explain what would happen if an electrician with red–green colour blindness was using the old colour code for electrical wiring and connected the metal case of the toaster to the active wire (A – old colour red), the toaster element to the neutral wire (N – old colour black) and the earth wire (E – old colour green), as shown in Figure 9.43.
UNCORRECTEDSAMPLEPAGES
Analysing
12. A student constructs circuit 1 as shown. The circuit contains a 6 V battery and two identical light bulbs. The current through the circuit is 2.0 A.
a) Identify whether this is a series or a parallel circuit. Explain your answer.
b) Determine the voltage drop across each light bulb.
c) Calculate the resistance of one light bulb.
13. A student constructs circuit 2 as shown. The circuit contains a 6 V battery and two identical light bulbs of higher resistance than in Question 12
a) Identify if this is a series or a parallel circuit. Explain your answer.
b) Determine the voltage drop across each light bulb.
c) Calculate the resistance of one light bulb.
Evaluating
14. Decide whether the use of tasers in Australia is justified. Write down three arguments supporting and three arguments against the adoption and use of tasers by the police in Australia.
15. Discuss why household circuits supplying your lights, television, computers, washing machines and similar appliances are wired in parallel, while the fuses (and circuit breakers) to these circuits are wired in series with the circuits.
Toaster element
Metal case
Figure 9.43 A circuit diagram of an incorrectly wired toaster
Go online to access the interactive chapter review
Chapter review
Chapter checklist
UNCORRECTEDSAMPLEPAGES
Success criteria
Linked questions
9.1I can define electricity, static electricity and current electricity. 2
9.2I can construct circuit diagrams using the correct symbols. 5
9.2I can define voltage, current and resistance. 4
9.2I can calculate the voltage, current or resistance of a circuit using Ohm’s law. 8
9.3I can draw series and parallel circuits. 12, 13
9.3I can describe the safety aspects of household electricity. 14
Scorcher competition
Review questions
Remembering
Review questions
Data questions
1. State whether the following statements are true or false. If they are false, explain why.
a) Static electricity can be produced by rubbing amber on fur.
b) The nucleus of an atom contains protons, neutrons and electrons.
c) The unit of charge is the volt.
d) Six thousand tonnes of disposable batteries are sent to landfill annually in Australia.
e) Tasers can be very dangerous.
2. Name the two types of current electricity.
3. Recall the three components that an electric circuit needs.
4. For a certain electrical circuit, 20 coulombs of charge flow past a point in 5 seconds. Define the term ‘current’ and calculate the current in amperes.
6. Describe the energy transfers that occur in a working electrical circuit containing a cell and a light bulb.
7. Explain how a safety switch can protect you from stray current.
Applying
8. A 12 volt car battery has an internal resistance of 0.02 Ω. Calculate the current passing through this circuit.
9. Explain what a good electrical insulator is and give an example of where it may be used.
10. Explain why electrical wires made from gold or silver are not used for sending power from the power stations into households.
Analysing
11. Contrast how an ammeter and a voltmeter would be connected in a circuit.
12. a) If one or more of the bulbs were broken in the circuit on the right, identify how it would affect the other bulbs. Copy and complete the following table regarding the circuit.
Bulb broken
1 (on/off)
2 (on/off)
Bulb 1
Bulb 2
Bulbs 2 and 3
3 (on/off)
b) If one or more of the bulbs were broken in the circuit on the right, identify how it would affect the other bulbs. Copy and complete the following table regarding the circuit.
Bulb broken
1 (on/off)
2 (on/off)
Bulb 1
Bulb 2
Bulb 3
Bulbs 2 and 3
3 (on/off)
13. a) If one or more of the switches were open in the circuit, identify how it would affect the bulbs. Copy and complete the following table regarding the circuit shown on the right.
B and C
b) If one or more of the switches were open in the circuit, identify how it would affect the bulbs. Copy and complete the following table regarding the circuit shown on the right.
3
A, B, C and D
A, B and E
A, C, D and E
Evaluating
14. Propose reasons why:
a) household electrical wires are coated in plastic.
b) many household appliances are double insulated.
15. Decide whether solar energy is a suitable source of electrical power for domestic use.
Data questions
Solar panels are used across Australia to convert the energy provided by sunlight into electricity. The electricity produced by a typical commercial solar panel in Western Australia throughout a sunny day is shown in Figure 9.44. The efficiency and price of six different solar panel models are shown in Table 9.3.
UNCORRECTEDSAMPLEPAGES
1. Identify the time of the day the solar panel presented in Figure 9.44 produces the most electricity.
2. Calculate how many hours per day the solar panel can produce electricity.
3. Identify the pattern of electricity production throughout a sunny day.
4. Refer to Table 9.3 and identify the relationship between the efficiency of a solar panel and the price per square metre.
5. Infer whether the cost of a solar panel is directly proportional to the efficiency.
6. Deduce why electricity is not produced between midnight and 4 a.m. and again between 8 p.m. and midnight.
7. Predict the effect on the data in Figure 9.44 if the weather was overcast and rainy.
8. A domestic household owner in Western Australia would like to install solar panels on the roof of their home. The owner would like a solar panel with an efficiency above 20% to cover 3 m2.
Deduce the type of solar panel and the lowest price that the homeowner could pay for these requirements.
9. Based on the general shape of the data presented in Figure 9.44, justify why the angle at which the solar panel is oriented on a roof is important for electricity production.
Table 9.3 Efficiency and cost of different solar panel models
StEm activity: Can you see the renewables?
Background information
Have you ever thought about the amount of carbon emissions produced when you perform an internet search on your smartphone or tablet?
Experts have estimated that a simple search consumes enough energy to release 0.2 grams of carbon dioxide into the atmosphere. The number might seem small but imagine the emission from more than 15 billion connected devices today!
Governments worldwide invest in renewable and sustainable energy sources because fossil fuel sources are limited. As the world’s population grows, greenhouse gases are being released into the atmosphere at an alarming rate. Now, more than ever, it is important that we all do our best to change our current practices into more sustainable ones.
There are many ways to demonstrate this message to the world; one of the most powerful involves storytelling. Good stories have the power to bring us together and encourage us to understand and empathise with many causes.
Recently, digital storytelling has been used by many professionals (including famous social media influencers) to tell (or sell) their ideas, opinions or products.
DESIGN BRIEF
Design and create a 60-second infomercial to be shared in your local area that promotes the use of renewable energy.
Activity instructions
In teams (maximum of four people), use the digital storytelling process (described on the following page) to create a 60-second video to answer a specific scenario. It is recommended that you and your colleagues think about assigning roles and tasks for this project (e.g. videographer, researcher, movie editor) so everyone has the chance to develop and use different skills.
Scenario
Your local council has just informed its residents that they wish to invest in securing the energy needs for its residents for the next 20 years. One local company, Coal Co., has lobbied heavily for funds to expand an old open-cut coal mine in the region. Another company, a new start-up business, Argus Renewables, has hired your team to create a 60-second video to gain support from residents for the development of a large solar farm in the region.
UNCORRECTEDSAMPLEPAGES
Suggested materials
• mobile device, camera to record footage
• laptop or tablet with a video editor
• paper to create a storyboard
• your imagination!
Research and feasibility
1. Discuss within your group who your target audience is going to be. Include discussion about your local area.
2. Conduct some research on advantages and disadvantages of renewable energy, compared with non-renewable energy, that should be communicated to your audience through the infomercial. Make a table to rank them in order of importance for your project. You can use the table below as a guide.
3. Conduct some research on the population of your local area. Discuss and then list important information about your target audience. Considering this information about your target audience, add comments to your advantages and disadvantages research.
Design and sustainability
4. As a group, decide on the key issues you are going to present in your infomercial. Then write the script for the video, assign roles to individual members and reflect on what is required to achieve the goal.
5. Design a storyboard to put the script together with a visual representation.
Create
6. Create the video by recording the storyboard sections. As a group, gather short clips and images, and/or record your own video using a mobile device.
7. Put it all together using video-editing tools such as iMovie, Movie Maker or Adobe Spark (recommended).
Evaluate and modify
8. In your group, discuss the challenges you encountered throughout this project. List the strategies or actions that allowed you to overcome each challenge.
9. Evaluate the effectiveness of your infomercial by sharing it with your target audience.
10. Create a range of evaluative questions to use to gauge the success of your infomercial. Show your infomercial to a target audience and use the questions to test its effectiveness.
Renewable vs non-renewable energy
Advantages of renewable energy compared with non-renewable energy
Rank of importance
Comments when considering target audience
UNCORRECTEDSAMPLEPAGES
Disadvantages of renewable energy compared with non-renewable energy
Glossary
Chapter 1: Science inquiry skills
Accuracy how close a measurement is to the true value
Causation when a change in one variable directly causes a change in another variable
Condition the different levels of the independent variable
Controlled variable a variable that is kept constant in an experiment to ensure it does not influence the results
Correlation a relationship between two variables, for which a change in one variable is associated with a change in another variable, but it does not mean that one causes the other
Dependent variable the variable that is measured during an experiment (as it responds to the independent variable)
Error the difference between the observed value and the true value
Exponential trend when the rate of change increases or decreases over time, proportional to the current value, resulting in a curved line when graphed
Extrapolation using existing data (such as a line of best fit) outside the original data set to make a prediction
Fair test an experiment in which all variables are kept constant except for the independent variable being tested
Hazard a danger or threat that has the potential to cause harm to you or your environment
Hypothesis an educated guess that can be tested through experimentation
Independent variable the variable that is deliberately changed during an experiment
Inference to link an observation with past knowledge and assign meaning to the observation
Interpolation using existing data (such as a line of best fit) within the original data set to make a reliable prediction
Investigable question a research question that can be answered through completing an experiment
Mode the most frequently occurring value or values in a data set
UNCORRECTEDSAMPLEPAGES
Line of best fit a line or curve that best shows the overall trend in a set of data points on a graph
Mean sum of all the values divided by the number of values
Median the middle value of the data set after all the values have been ranked (sorted in ascending order); there should be as many numbers below the median as there are above
Peer review to read, check and give an opinion about something that has been written by another scientist or expert working in the same subject area
Precision how close measurements are to each other
Prediction a statement that describes what is expected to happen if the hypothesis is true
Primary source a first-hand record or account
Random error error caused by limitations of the measurement device or the observer and does not follow a regular pattern
Reproducible able to be reproduced or copied
Risk the likelihood that a hazard will actually cause harm
Secondary source a second-hand account; a source that summarises, analyses or interprets primary sources
Systematic error error that occurs through a poorly calibrated device (consistently too high or consistently too low)
Trial a run-through of an experimental method that is usually repeated several times, to obtain data that can be averaged, to reduce any effect of variables not being completely controlled
Variable a factor or condition that can be controlled, changed or measured in an experiment
Chapter 2: Cells
Bacteria very small prokaryotic organisms that lack membrane-bound organelles and a nucleus; most have cell walls
Biconcave concave on both sides
Cell membrane the barrier that separates the inside of the cell from the external environment
Cell wall a rigid structure that surrounds each plant cell, shaping and supporting the cell
Cellular respiration a process that occurs inside the mitochondria, during which oxygen and glucose react to form carbon dioxide and water, producing useable energy
Chloroplast a structure in a plant cell that contains chlorophyll and conducts photosynthesis
Cytosol the water-based mixture that fills the cell, containing different molecules; many chemical processes that happen within a cell occur in the cytosol
Differentiation the process by which cells become specialised
DNA the material containing the code that allows the cell to produce copies of itself and to regulate the functions within the cell
Double helix a description of the structure of DNA, in which two strands wind around each other like a twisted ladder
Embryo the early stages of growth and differentiation of a multicellular organism
Endoplasmic reticulum an organelle that is involved in making and transporting fats, carbohydrates and proteins
Enzyme a protein that speeds up chemical reactions in living organisms
Eukaryote any cell or organism that possesses membrane-bound organelles and a nucleus
Function the job that an object does
Golgi body a structure in a cell involved in the modification, packaging and transport of proteins and lipids
Macroscopic visible to the naked eye
Membrane-bound organelle an organelle that is surrounded by an outer covering made of fat
Microscopic can only be seen clearly with the use of a microscope
Mitochondrion a structure in a cell that converts the energy from food into the form needed by the cell during cellular respiration
Multicellular composed of many cells
Neuron a nerve cell
Organelle a specialised structure in a cell that has a specific function or role
Prokaryote a unicellular organism that lacks membrane-bound organelles and a nucleus
Protist a eukaryotic organism that is part of the kingdom Protista
Ribosome a structure in a cell that reads genetic information to assemble proteins
Specialised cell a cell that has undergone structural changes that allow it to perform a specific task
Stem cell a cell that can develop into a cell of any other type
Structure a physical part of an object
Unicellular composed of just one cell
Chapter 3: Body and plant systems
Adhesion when molecules stick to other surfaces
Alveoli the tiny sacs at the end of bronchioles in the lungs; the site of gas exchange with the capillaries
Aorta the largest vessel leaving the heart, from the left ventricle, carrying oxygenated blood to the body
UNCORRECTEDSAMPLEPAGES
Vacuole a structure in a cell that stores water and nutrients
Zygote a fertilised egg cell
Artery a thick muscular, elastic vessel that carries blood away from the heart
Asexual reproduction a method of reproduction in which a single parent produces offspring genetically identical to itself
Atrioventricular node a natural pacemaker that controls the heartbeat and is located between the atria and the ventricles
Atrium (plural: atria) one of the two upper chambers of the heart, the left and right atria
Bronchi (singular: bronchus) the two branches of the airways that split off the trachea, one main left bronchus to the left lung and one main right bronchus to the right lung
Bronchioles smaller tubes that branch off the two large bronchi and lead to the alveoli
Budding a type of asexual reproduction by organisms such as yeast and hydra, in which the daughter offspring grows off the side of the parent and drops off
Capillaries the smallest blood vessels, one cell thick, and the site of gas exchange with cells
Capillarity the ability of a liquid to rise in narrow spaces without the help of external forces
Carbon dioxide a waste product produced in cellular respiration
Cellular respiration a process that occurs inside the mitochondria, during which oxygen and glucose react to form carbon dioxide and water, producing useable energy
Cohesion when molecules stick to each other
Cross-pollination pollination that occurs when pollen is transferred from a flower on one plant to a flower on another plant
Diaphragm a dome-shaped muscle that separates the chest and abdominal cavities; it contracts to draw air into the lungs
Differentiation the process by which cells become specialised
Diffusion the passive movement of particles from an area of high concentration to an area of lower concentration
Embryo the early stages of growth and differentiation of a multicellular organism; in humans, 2–8 weeks after fertilisation
Embryo sac the female gamete in flowering plants
Epiglottis a flap of elastic cartilage that covers the opening of the trachea during swallowing, preventing food and liquids from entering the airways
Ethical relating to ethics, the field of considering what is right and wrong
External fertilisation a method of fertilisation in which gametes are released into the environment and fertilisation occurs outside the body
Fragmentation a type of asexual reproduction in which a parent organism splits into multiple fragments, each of which can potentially develop into a new independent individual
Gamete a sex cell (egg or sperm), which contains half the genetic material required to make an organism
Gestation the pregnancy period, when offspring are developing inside the mother
Gonad the reproductive organ where gametes are produced; testis in males and ovary in females
Guard cells specialised cells located on either side of a plant stoma that regulate gas exchange by opening and closing the stoma
Haemoglobin the red pigment in blood that binds to oxygen, allowing red blood cells to carry oxygen
Internal fertilisation a method of fertilisation in which male gametes are delivered into the female reproductive system and fertilisation takes place inside the female
Lenticels small slits on trunks or branches of trees that allow gas exchange
Menstruation the cyclical shedding of the uterine lining; also known as the menstrual period
Nectar a sweet liquid produced by flowers to attract pollinators
Organ a group of tissues working together to perform a function
Organ rejection when an organ transplant recipient’s immune system recognises an organ as foreign and attacks it
Organ transplantation the process of removing a donor organ and surgically implanting it into a recipient, to improve organ function or replace a diseased organ
Ovum egg; the female gamete
Parthenogenesis a type of asexual reproduction in which an egg develops into an embryo without being fertilised by a male gamete
Pharynx the throat region where the nasal cavity and oral cavity meet, leading into the trachea
UNCORRECTEDSAMPLEPAGES
Organism a living creature, such as a plant or an animal
Ovaries the female reproductive organs that produce eggs (ova)
Ovulation the release of an ovum (egg) from the ovary into the fallopian tube
Ovule a structure in a flowering plant where the female gamete is produced and where seeds develop
Phloem vascular tubes that transport sugars and nutrients throughout the plant
Plasma the yellow liquid component that makes up 55% of blood; carries water, dissolved gases, nutrients and proteins
Platelets tiny cell fragments that assist with blood clotting
Pollen the male gamete in flowering plants
Pollination the process by which pollen, containing the male reproductive cells of a plant, is transferred from the male part of a flower to the female part of a flower
Puberty the time of transition from juvenile form to adult form
Scrotum a sac that encloses the testes
Seed a plant embryo enclosed in a protective coating
Seed dispersal the spread of seeds away from the parent plant
Self-pollination pollination that occurs when pollen is transferred from the same flower or from another flower on the same plant
Sexual reproduction a method of reproduction that involves two parent organisms and results in genetic variation in the offspring
Sinoatrial node a natural pacemaker that controls the heartbeat and is located in the wall of the right atrium
Sperm the male gamete
Spore a reproductive body, produced by fungi and some plants, that develops into a new individual
Stomata (singular: stoma) tiny pores (holes) in leaves that facilitate the entry and exit of gases such as oxygen and carbon dioxide
Testes the male reproductive organs that produce sperm
Tissue a group of similar cells performing the same function
Tissue engineering the combined use of cells and engineering to improve or replace biological tissues
Trachea the tube that carries air down to the lungs; also known as the windpipe
Transpiration a plant’s loss of water through the stomata of leaves
Valve a structure that prevents the backward flow of blood
Vascular bundles a transport system in plants, composed of xylem and phloem
Vegetative propagation a form of asexual reproduction in which only one plant is involved
Vein a thin-walled vessel with valves that carries blood back to the heart
Vena cava the large vessel that returns deoxygenated blood from the body to the heart, emptying into the right atrium
Ventricle one of the two lower chambers of the heart, the left and right ventricles
Xenotransplantation transplanting organs from one species into another
Xylem vascular tubes that transport water in one direction through the plant
Zygote a fertilised egg cell
Chapter 4: Particles of matter
Alloy mixture of metal elements
Atom the smallest indivisible particle that makes up all matter
Chemical bond strong force of attraction between two atoms
Chemical formula a symbol for a compound that shows which elements, and how many atoms of each element, are present in one molecule or one basic unit of that compound
Chemical substance matter that contains only one type of particle
Colloid a mixture in which particles of one chemical substance will not dissolve but remain distributed throughout another chemical substance
Compound chemical substance made up of two or more different types of atoms
Conductivity the ability of a substance to conduct (carry) electricity or heat
Diatomic element an element that exists as a molecule consisting of two atoms of the same type
Ductility the ability of a substance to be drawn into a wire
Element chemical substance made up of only one type of atom
Emulsion a colloid of two or more liquids
Heterogeneous mixture a mixture that can be separated into its parts, and the parts retain their original properties; the mixture is not blended evenly
Lustre the ability of a substance to become shiny when polished
Malleability the ability of a substance to be bent or flattened into a range of shapes
Metal a chemical substance that is shiny (lustrous), can conduct electricity and heat, is malleable and ductile, and is usually silvery/grey
UNCORRECTEDSAMPLEPAGES
Homogeneous mixture a mixture of two or more substances that are evenly distributed and do not separate out easily
Lattice a three-dimensional shape of atoms that pack together very tightly and form bonds that are extremely strong because the atoms bond to each other in multiple directions
Metalloid a non-metallic substance that has some of the properties of both metals and non-metals
Mixture a substance made up of two or more different pure substances (compounds or elements) that are not chemically bonded together
Molecule two or more atoms chemically bonded by strong covalent bonds
Monatomic made up of single atoms, all of one type
Non-metal a chemical substance that is dull, cannot usually conduct electricity and is brittle
Periodic table an organised list of all the known elements and their symbols
Polyatomic element an element that exists as a molecule containing more than two atoms of the same type
Polyatomic ion an ion made up of more than one atom
Polymer a long molecule made of a chain of atoms in a pattern that repeats
Pure substance material that is made up of just one type of chemical substance
Saturated a solution containing the maximum amount of dissolved solute
Suspension a mixture in which one chemical substance will eventually settle out of the solvent
Chapter 5: Physical and chemical change
Bioluminescence a chemical reaction that produces light in living things
Chemical change when one or more substances undergo a chemical reaction and a new substance, or substances, is formed; usually irreversible
Chemiluminescence a chemical reaction that produces light
Combustion a reaction that involves the burning or exploding of a chemical substance in the presence of oxygen
Corrosion the gradual and natural process of metals reacting with oxygen to form a new chemical substance; an example is rusting
Decomposition a reaction in which one substance breaks down into smaller ones
Diffusion the passive movement of particles from an area of high concentration to low concentration
Dissolve the process by which individual molecules of a solute are separated from one another and surrounded by solvent molecules, causing them to no longer be visible in a solution
Endothermic an absorption of heat in a chemical reaction characterised by a decrease in surrounding temperature
Exothermic a release of heat in a chemical reaction characterised by an increase in surrounding temperature
Galvanisation the process of coating iron or steel in zinc to prevent corrosion
Hydrocarbon chemical substance containing only hydrogen and carbon atoms
Kinetic energy the energy of moving matter
Physical change when the physical properties of a substance change in some way, but no new chemical substance is formed; usually reversible
Potential energy (chemical) the energy stored in the chemical bonds between atoms
Precipitate the solid that forms when two solutions are mixed and undergo a chemical change
Products the chemical substances that are present at the end of a chemical reaction
Reactants the chemical substances that are present at the beginning of a chemical reaction
Chapter 6: Our changing Earth
Asthenosphere the softer layer of rock under the lithosphere
Constructive (divergent) a type of plate boundary that occurs when plates move away from one another
Continental drift the theory of how the continents on Earth have moved over millions of years
Convection currents the transfer of heat due to temperature differences between the upper and lower layers of Earth’s mantle, causing movement of rocks within the mantle
Core the inner part of Earth’s structure
Craton the stable interior portion of a continent
Crust the solid outer layer of Earth that supports all life on Earth
Destructive (convergent) a type of plate boundary that occurs when plates move towards one another
Epicentre the location on Earth’s surface directly above the focus of an earthquake
GPS Global Positioning System, a radio navigation system that allows land, sea and airborne users to determine their exact location, velocity and time
Hotspot a pocket of magma that sits just underneath the crust
Lag time the time between the arrival of the P and S waves
UNCORRECTEDSAMPLEPAGES
Focus the exact point under the surface of Earth where the earthquake occurs
Geoid a model of Earth’s surface approximating the height of sea level as it would be if affected by gravity alone (and not by currents or tides)
Geosphere the parts of Earth that are solid (e.g. the mantle and crust)
Lava molten rock from inside Earth (magma) that has reached the surface
Lithosphere the solid outer layer of Earth consisting of the crust and top layer of the upper mantle; it is split into giant slabs called tectonic plates
Magma hot molten rock found beneath Earth’s surface
Mantle the layer of Earth underneath the crust that is made up of solid and semi-molten rock and surrounds the outer core
Pangaea the supercontinent that has since broken into pieces and drifted apart
Plate boundaries the edges where two tectonic plates meet
Plate tectonics the theory that Earth’s lithosphere is broken up into many pieces called tectonic plates and that they are moved by convection currents in the mantle
Pyroclastic consisting of or relating to small pieces of rock from a volcano
Richter scale a system used to measure the strength of an earthquake
Ridge push a force that causes a plate to move away from the crest of an ocean ridge and into a subduction zone
Rift valley an elongated depression in Earth’s surface formed by the separation of tectonic plates
Seafloor spreading a process by which new oceanic crust is produced as sea floor moves away from ocean ridges
Seismic wave a wave that moves through Earth during an earthquake
Seismogram the pattern produced when seismic activity is recorded by a seismometer
Seismometer an instrument that measures the intensity and duration of seismic waves during an earthquake
Slab pull the pulling force exerted by a cold, dense oceanic plate plunging into the mantle due to its own weight
Subduction when a more dense oceanic plate sinks underneath a less dense continental plate
Subduction zone the area where a collision between two of Earth’s tectonic plates causes one plate to sink into the mantle underneath the other plate
Tectonic plates giant slabs of rigid rock that float on the partially molten rock below Earth’s surface and make up the lithosphere
Transform (conservative) a type of plate boundary that occurs when plates move parallel to one another Tsunami a great wave produced by an earthquake or volcanic eruption in the ocean
Chapter 7: Rocks
Biological weathering the disintegration of rocks that is caused by living things
Breccia sedimentary rock composed of angular broken pieces of rock larger than two millimetres
Cementation the sticking together of sediment
Chemical weathering the process by which rocks are broken down and chemically altered, via chemical reactions
Clasts small pieces of pre-existing rock that form a sedimentary rock
Cleavage the tendency of a mineral or rock to break in a particular way because of its structure
Compaction the process of particles becoming closely positioned together, using minimal space
Conglomerate sedimentary rock composed of rounded rock fragments larger than two millimetres
Crust the solid outer layer of Earth that supports all life on Earth
Crystal a substance with a specific chemical composition, in which the atoms are arranged in an ordered way to form a geometric shape
Crystallisation the formation of solid mineral crystals from a liquid, either by cooling or evaporation
Deep time the idea, first suggested by James Hutton, that Earth is very old
Density a substance’s mass per unit of volume
Deposition process that occurs when eroded particles stop moving and build up to form sedimentary rocks
Dissolution when water dissolves minerals in rocks
Electrolysis a method of extracting a metal from its ore or purifying it using electricity
Erosion the transport of rock fragments (that have resulted from weathering)
Extrusive describes igneous rocks formed on Earth’s surface; also called volcanic rocks
Igneous describes rocks made from lava (above Earth’s surface) or magma (below the surface)
Inner core the solid centre of Earth; probably made of iron
Intrusive describes igneous rocks formed underground; also called plutonic rocks
UNCORRECTEDSAMPLEPAGES
Fossil the remains, shape or trace of a bone, shell, microbe, plant or animal that has been preserved in rock for a very long time
Geology the study of rocks, Earth’s dynamic structure and the processes through which our planet (and other planetary objects) have formed
Karst an area of land formed of rock such as limestone that is worn away by water to make caves and other formations
Lava molten rock from inside Earth (magma) that has reached the surface
Lithosphere the solid outer layer of Earth consisting of the crust and top layer of the upper mantle; it is split into giant slabs called tectonic plates
Magma hot molten rock found beneath Earth’s surface
Mantle the layer of Earth underneath the crust that is made up of solid and semi-molten rock and surrounds the outer core
Metamorphic describes rocks that are changed by being exposed to high temperature, pressure or both
Meteorite a rock from space (meteor) that has entered the atmosphere as a ‘shooting star’ and reached the ground
Mineral a naturally occurring chemical substance that is formed in the ground, with constant chemical composition, crystal structure and physical and chemical properties
Mohs scale a scale from 1 to 10 that indicates the relative hardness of a mineral
Opaque blocking light completely
Ore a rock that can be mined and smelted to produce a metal
Outer core the liquid layer surrounding the inner core; probably made of liquid iron
Physical weathering the process of breaking down rocks into smaller pieces or particles, without changing the chemical composition
Porous a material that contains tiny holes or pores
Quarrying the removal of rock, sand and minerals from the surface of Earth without deep excavation
Radioactivity energy released from the nucleus of an atom when the atom decays
Reflection seismology the use of shockwaves to investigate the structure of rocks underground
Rock a naturally occurring substance composed of minerals, making up Earth’s outermost layers, formed as part of the rock cycle
Rock cycle the constant process of change that rocks go through, between igneous, metamorphic and sedimentary forms
Sandstone sedimentary rock composed mainly of sand-sized silicate grains
Sedimentary describes rocks made from deposited materials that are the products of weathering and erosion
Sediments sand, stones and other materials that slowly form a layer of rock
Smelting the process of extracting a metal from rock by heating it in the presence of carbon
Streak test a test used to help identify a mineral by scratching a rock on a hard ceramic tile
Surface mining method of mining that extracts a mineral from the surface, such as by digging an open pit
Translucent allowing some light through, but no clear image can be seen through the substance
Transparent allowing light to pass through, and a clear image can be seen through the substance
Underground mining traditional method of mining by digging tunnels underground to extract ore
Chapter 8: Energy
Chemical potential energy the energy stored in the chemical bonds between atoms
Conduction the transfer of thermal energy through collisions between particles
Conductor (heat) a substance that allows heat to pass through it easily
Convection the transfer of thermal energy due to the movement of particles in a liquid or gas
Elastic potential energy the energy stored when an elastic material is compressed or stretched
Electrical energy energy carried by electricity moving in a wire; voltage is used to measure how much energy is carried by each unit of electricity
Electromagnetic spectrum a way of organising electromagnetic waves according to their energy and wavelength
Energy the capacity to do work; the total amount of energy is conserved in any process
Energy transfer the movement of energy from one place or object to another
Free electron an electron that is not attached to an atom
Generator a device that converts rotational kinetic energy into electrical energy, i.e. the opposite of a motor
Input energy the energy that a machine or device uses as its source of energy
Insulator (heat) a substance or material that does not allow heat to pass through it easily
Joule the unit of energy or work done by a force of one newton over a distance of one metre
UNCORRECTEDSAMPLEPAGES
Gravitational potential energy a type of potential energy; the energy an object has because of its height; Ep = mgh, where m is the mass of the object in kg, h its height in metres and g is acceleration due to Earth’s gravity, 9.8 m/s2
Heat thermal energy transferred from hotter objects or regions to colder objects or regions
Kinetic energy the energy of moving matter
Law of conservation of energy the law that states that energy cannot be created or destroyed
Light energy a form of energy that travels as electromagnetic waves and can travel in a vacuum
Nuclear energy a non-renewable source of energy that uses the energy released by the nucleus of radioactive atoms
Output energy the energy that a machine or device provides or wastes
Potential energy the energy stored in something because of its position, shape or composition; e.g. due to height above the ground, being stretched or compressed, or in chemical form
Radiation the transfer of energy from a source without the involvement of particles
Radioactive having or producing the energy that comes from the breaking up of atomic nuclei
Rotational kinetic energy the energy an object has because it is rotating
Sound energy a form of travelling wave; sound consists of vibrations in the air
Temperature a measure of the degree of heat present in a substance; gives an indication of the average kinetic energy of the particles
Thermal energy the energy contained within a material that is responsible for its temperature
Travelling wave a wave that can carry energy from one place to another
Turbine a device that converts the kinetic energy of a fluid into useful work, e.g. a windmill
Waste energy the non-useful output energy from a machine or device; waste energy is often in the form of thermal energy and sound
Wave energy the energy carried by a travelling wave (e.g. an ocean swell) or trapped in a standing wave (e.g. a guitar string)
Chapter 9: Electricity
Alternating current (AC) a form of electricity in which the current reverses direction in regular cycles
Ammeter a device for measuring electric current
Ampere the unit of electrical current, usually shortened to amp (A); 1 amp = 1 coulomb per second
Battery a portable source of power; made up of two or more cells
Cell a single electrical energy source that produces a current
Circuit a structure through which charges can move
Circuit breaker a device that carries out the same function as a fuse by breaking the circuit when the current through it exceeds a certain threshold
Component a part of a circuit
Conductor (electricity) a material that allows electric current to flow through it easily
Coulomb the amount of charge transferred in 1 second with a current of 1 amp
Current the flow of electric charge, which may continue in a steady manner for a period of time
Direct current (DC) a form of electricity in which the current flows in one direction
Double insulated having two levels of insulating materials between the electrical parts of an appliance and any parts on the outside that you touch
Dry cell a battery in which the electrolyte is absorbed in a solid to form a paste
Earthed having an earth pin in a plug through which the electric current will flow to the ground in the case of a fault
Electricity a form of energy that results from the accumulation or the flow of charge
Electrocution when an electric current passes through the body, causing injury or death
Electrostatic charge a charge that stays on an object
Fuse a short length of conducting wire or strip of metal that melts when the current through it reaches a certain value, breaking the circuit
Insulator (electricity) a material that does not allow current to flow through it easily
Load something that uses energy in a circuit
Mains electricity the electricity that is supplied to homes
Ohm the unit of electrical resistance (Ω)
Ohm’s law a scientific law that states that the current that flows through most conductors is directly proportional to the voltage applied
UNCORRECTEDSAMPLEPAGES
Parallel circuit a circuit in which each component is connected in a separate conducting path
Potential difference the difference in electrical potential energy between the negative and positive terminals in an electric circuit
Residual current device (RCD) a safety switch that trips the power when current leaks from circuits
Resistance the degree to which a substance resists the flow of current; measured in ohms (Ω)
Series circuit a circuit in which the batteries and other components are all connected one after the other
Short circuit when current is allowed to flow from one conductor to another with little or no resistance
Static discharge a sudden transfer of electrostatic charge
Static electricity an imbalance of charge on objects
Voltage the potential difference between two points in an electric circuit; measured in volts (V)
Voltage drop the reduction in voltage that occurs across a component or section of an electric circuit because of the resistance of the conductive material
Voltmeter a device for measuring voltage between two points in an electric circuit
specialised cell
a cell that has undergone structural changes that allow it to perform a specific task
zygote
a fertilised egg cell differentiation the process by which cells become specialised embryo the early stages of growth and differentiation of a multicellular organism
stem cell
a cell that can develop into a cell of any other type
2.4 Extension: Specialised cells
Learning goal
At the end of this section, I will be able to:
1. Describe the structure and function of specialised cells in multicellular organisms.
In multicellular organisms, various specialised cells perform specific functions to ensure proper body function. Unlike unicellular organisms, for which a single cell must carry out all life processes, multicellular organisms have cells that are differentiated to carry out particular tasks. These specialised cells play important roles in multicellular organisms by performing specific functions that contribute to the organism’s overall survival.
All cells in the body come from a single fertilised egg known as a zygote, which undergoes division and differentiation into different specialised cells, forming an embryo. Cells that have the potential to turn into any other type of cell are called stem cells. Once a stem cell differentiates into a specific cell type, it can only replicate into cells of the same type.
Stem cells don’t only exist in embryos. There are still some stem cells in your body today that are ready to turn into any type of cell you need. They can be found in different tissues around your body and are activated by certain triggers, such as an injury. For example, if you cut yourself, stem cells below the layers of your skin turn into skin cells to help replace the damaged cells. This replacement is not always perfect and, if the damage is too extreme, it can leave a scar.
The tissue that makes up a scar contains the same key protein found in normal skin – collagen – but in a different arrangement. In normal tissue, collagen has a cross-weave structure, with the fibres arranged in random orientations. However, in scar tissue, it has a parallel alignment in which all fibres run in the same direction. There is a simple reason for this: open wounds are dangerous and need to be healed as soon as possible. Parallel alignment is the faster way of repairing this tissue.
SAMPLEPAGES
Blood cells
Liver cells
Neurons
Cardiac cells
Bone cells
Stem cell
Intestinal cells
Fat cells
Epithelial cells
Muscle cells
Figure 2.43a Embryonic stem cells can become many types of cells in a process known as cell differentiation.
Explore! 2.2
Stem cell therapy
Because stem cells can turn into any type of cell, they have the potential to be used in treating and curing many types of diseases and conditions. These treatments are known as stem cell therapy.
1. Research the blood cancer called leukaemia.
2. Investigate how stem cell therapy is used to treat leukaemia and summarise your findings.
Figure 2.43c A stem cell can replicate and differentiate into any of the 200-plus cell types in the body, therefore forming all our organs.
UNCORRECTEDSAMPLEPAGES
1. Multicellular organisms are often made up of specialised cells. Describe what the term ‘specialised cells’ means.
2. Use the term ‘differentiation’ to explain how specialised cells form.
3. Describe what stem cells are and their use in medicine.
Explore! 2.3
Growing synthetic organisms
In 2022, researchers grew fully synthetic (no sperm or egg cells were involved) mouse embryos outside the womb using stem cells. The embryos were able to grow to day 8.5, developing the beginnings of a brain, intestinal tract and a beating heart. This breakthrough will tell scientists a lot about embryo development and organ growth, including how to grow whole replacement organs from scratch.
Examples of specialised cells
Specialised cells are organised into tissues, which are groups of similar cells working together to perform a specific function. These tissues are further organised into organs, which are structures composed of multiple tissue types that work together to carry out complex functions.
Even though most of our cells contain the same basic components, the different types of specialised cells within our bodies all have certain features or structures that allow them to perform a specific function. A structure is any physical part of an object, and a function is an activity that the structure helps the object to complete.
Quick check 2.8
Figure 2.43d (a) A naturally formed mouse embryo compared with (b) a synthetic embryo grown using stem cells
Making thinking visible 2.2
creative hunt: Specialised cells
The image shows roughly 100000 cells from a rhesus macaque monkey. Similar cells are clustered together, with every dot representing a single cell. The lines connecting the dots reflect how similar they are. Each colour represents cells from a different tissue. For example, brain cells are shown in grey, lung cells in pink and liver cells in green.
What is the purpose of the image?
What are the main parts of the image?
What do you think is particularly creative about the image?
Who do you think the image is intended for?
2.43e A representation of monkey cells. The image was shortlisted for the Wellcome Photography Prize in 2019.
The Creative hunt thinking routine was developed by Project Zero, a research centre at the Harvard Graduate School of Education.
Some examples of how specialised cells are adapted to their function are provided in Table 2.2.
Specialised cell
UNCORRECTEDSAMPLEPAGES
Cell body (soma)
Axon
How structure relates to function
Red blood cells have a biconcave shape, which increases their surface area for oxygen transport and allows them to deform as they pass through narrow capillaries.
They lack a nucleus to maximise space for haemoglobin, the oxygen-carrying molecule. As they do not have a nucleus, they cannot undergo cell division, and so all red blood cells are produced in the bone marrow. Your red blood cells are replaced every 120 days.
Nerve cells, or neurons, allow all the parts of your body to work together, by transferring signals to and from your brain to each part of your body via the nervous system. They are long, thin cells that connect to each other via highly branched ends. They have long axons, which are specialised to carry electrical signals over long distances, at very fast speeds. The longest nerve cell in your body is your sciatic nerve, which stretches from the bottom of your spine to your big toe.
Figure 2.43f Red blood cells
Dendrite
Myelin sheath (Schwann cell)
Figure 2.43g Motor neuron
Figure
Specialised cell
How structure relates to function
Intestinal cells have microvilli, tiny hair-like projections that increase surface area for nutrient absorption.
UNCORRECTEDSAMPLEPAGES
Root hair cells have a large surface area, which increases water and nutrient absorption.
Xylem cells are long and form continuous tubes from roots to leaves, allowing water flow. They are strong and lack cytoplasm (because the cells are dead), maximising water movement.
Sperm cells carry half the genetic information of a normal human body cell. Their purpose is to combine with an egg cell in a process known as fertilisation, which is the first step of reproduction. This means that the sperm cells must be able to move. That is why they have a specialised tail, called a flagellum, which beats in a corkscrew motion and allows the sperm cell to swim. Sperm cells have many mitochondria in their midpiece, to provide energy for fast movement. Their heads also contains an acrosome, a sac of digestive enzymes that digest through the membrane of the egg cell, allowing the sperm nucleus to enter.
Microvilli
Figure 2.43h Epithelial cells in the small intestine
Figure 2.43i Root hair cell
Lignin wall
Figure 2.43j Xylem tissue, made of cells with strong lignin walls
Midpiece Head Flagellum
Figure 2.43k A sperm swimming towards an egg
Did you know? 2.7
Astrocytes
Researchers at the Perron Institute and the University of Western Australia have discovered a new type of brain cell that helps protect the blood–brain barrier, a system of blood vessels that supplies nutrients to the brain and keeps it safe from harmful substances. As we age or experience brain disorders, the blood–brain barrier can weaken.
These newly identified brain cells, called astrocytes, help maintain the blood–brain barrier by passing mitochondria to cells that line the blood vessels in the brain and producing a special protein that is also found in bones, which helps protect the barrier. If these cells stop working properly, the blood–brain barrier becomes leaky, which can lead to problems in the brain.
This research gives scientists new ideas for creating treatments to help fix the blood–brain barrier in cases of aging or disease.
Practical 2.4
Specialised cells
Aim
To observe specialised cells under the microscope
Materials
• prepared slides of blood
• prepared slides of neurons
• prepared slides of blood vessels
• compound microscope
• transparent ruler
Method
Part A: Estimating the field of view
UNCORRECTEDSAMPLEPAGES
Be careful
Ensure that you carry the microscope appropriately. Carry it with one hand holding the arm and one hand under the base. Do not make big changes in magnification, so the glass slide does not get damaged.
1. Place the transparent ruler on the stage of the microscope.
2. Starting on the lowest magnification, focus on the ruler.
3. Measure the diameter of the area you can see under the microscope (field of view) using the ruler.
4. Record this measurement (in mm) in the FOV table.
5. Calculate the FOV diameter in micrometres (μm) by multiplying the FOV in millimetres by 1000.
6. Calculate the FOV for each of the higher magnifications by repeating steps 2–5
Part B: Estimating the size of the object
7. Place your first prepared slide on the stage of the microscope.
8. Focus on the object using the lowest-power lens.
Figure 2.43l An astrocyte stained so it appears yellow
9. Estimate how many of the cells will fit in a straight line across the middle of the FOV.
10. Divide the total FOV diameter that you have already calculated by the estimated number of cells that will fit across the FOV.
11. Record your estimated diameter for the object in the results table.
12. Draw a scientific drawing of the cell you are observing.
13. Repeat steps 8–12 for each slide.
Results
Copy the following tables and use them to record your observations and measurements.
Magnification (ocular lens × objective lens)
UNCORRECTEDSAMPLEPAGES
Cell Scientific drawing and magnification
Blood Neuron
Blood vessel
Discussion
diameter (mm)
diameter (μm) (mm × 1000)
Number of times cell would fit across the FOV FOV diameter
Estimated diameter of object (FOV/ number of times object fits across)
1. Describe how the size and shape of each of the cells you observed benefits its function.
2. Assess the accuracy of your estimated sizes.
3. Suggest a way of improving your size estimates.
Figure 2.43m (a) A prepared slide and (b) drawing of ciliated columnar epithelium
Section 2.4 review Online quiz Go
UNCORRECTEDSAMPLEPAGES
Section 2.4 questions
Remembering
1. Define the term ‘differentiation’.
2. Name three examples of specialised cells in the human body.
Understanding
3. Explain why specialised cells are important for the functioning of multicellular organisms.
4. Describe how the structure of a root hair cell is adapted to its function.
5. Identify the following specialised cells from their description:
a) a type of cell found in the small intestine, with a border of microvilli that increase surface area for absorption
b) a type of cell found in the nervous system, responsible for transmitting electrical signals
c) a type of plant cell found in the roots, responsible for absorbing water and nutrients from the soil
Applying
6. Design a specialised cell and describe its structure and function. Consider how its structure helps it to perform its specific role.
7. Explain how the shapes of various specialised cells help them to carry out their function within the body.
Analysing
8. Analyse the structure of a cell in the small intestine that allows it to efficiently absorb nutrients from digested food.
Evaluating
9. Discuss the ethical considerations surrounding the use of stem cells in medical research and treatment.
3.7 Organ disorders
Learning goals
At the end of this section, I will be able to:
1. Describe how a disorder in cells or tissues can affect how an organ functions.
2. Describe how an artificial organ mimics or augments the function or functions of a real organ.
Each of the organ systems in your body relies on the specialised functions of many different organs working together to keep you healthy. But when cells or tissues within an organ become diseased or dysfunctional, it can impact the overall functioning of the organ. The treatment of an organ that is not functioning properly depends on the specific type of dysfunction and the underlying cause. Less severe organ dysfunction can often be managed with medication, surgery or changes to diet and lifestyle. These treatments aim to restore or support the function of the affected organ.
Organ transplants
UNCORRECTEDSAMPLEPAGES
In cases where the damage is too extensive and the organ can no longer function properly, more drastic measures are required. One such solution is organ transplantation – a medical procedure in which a healthy organ from a donor is used to replace the failing organ in the recipient’s body. This is done through a medical procedure known as organ transplantation, in which a healthy organ from one body is used to replace the damaged organ in another.
The first successful human organ transplant was a kidney transplant performed in 1954 by Dr Joseph Murray and Dr David Hume in Boston, using a kidney from the patient’s identical twin. Kidneys filter waste products out of your blood and produce urine. Diseases and environmental factors that can damage your kidneys include medications, alcohol and diabetes. We have two kidneys in our body, but we can manage with only one. Therefore, some people volunteer to donate one of their healthy kidneys to a friend or family member who needs a replacement.
For an organ transplant to be successful, the donor (person giving the organ) and the recipient (person receiving the organ) must have similar matching markers on their cells. If these markers are not matched, the body will recognise the new organ as a foreign invader and attack the organ using the immune system. This is known as organ rejection. Unfortunately, the chances of two people being a match is extremely low, even within families. This means that there is a high demand for organs but a very low supply available.
Organ donation is sometimes possible when a person dies and has previously indicated that they would like to donate their organs. This donation can save multiple lives, as organs such as the heart, lungs, kidneys, liver, large intestine, pancreas and some tissues, such as skin and corneas from the eye, can all be donated. In 2023, 1396 Australians received an organ, donated by 513 deceased and 253 living organ donors and their families.
organ transplantation the process of removing a donor organ and surgically implanting it into a recipient, to improve organ function or replace a diseased organ organ rejection when an organ transplant recipient’s immune system recognises an organ as foreign and attacks it
Figure 3.117a Most of us have two healthy kidneys. If they are damaged, one option is a kidney transplant.
Not many deaths occur in a way that allows organ donation. In Australia, organ donation typically occurs when a person dies in a hospital setting. This is because the organs need to be removed as soon as possible after death to ensure their viability for transplantation. Sometimes the families of registered organ donors refuse to give consent, which is why it is very important that people discuss their wishes with their families and consider registering their intentions on the Organ Donor Register.
UNCORRECTEDSAMPLEPAGES
Did you know? 3.16
Organ donation
Organ donation rates in Australia remain relatively low, with only 36% of eligible adults currently registered as organ donors. Australia has a voluntary organ donation system, and the number of registered donors has not kept pace with the demand for life-saving organ transplants.
One potential strategy for increasing organ donation rates is to introduce a system by which people can register as organ donors when they apply for or renew their driver’s licence. This method has been used successfully in South Australia, where the option to register as a donor has contributed to nearly doubling of the state’s organ donation rates. By making the process of registering as an organ donor more accessible and straightforward, more people are likely to sign up, as they may not have previously taken the initiative to do so through other channels.
In Western Australia, the idea of linking organ donor registration to the driver’s licence process is under consideration once again, after it was removed from the state’s system around 20 years ago. The Western Australian Government has acknowledged the need to improve organ donation rates and has committed to consulting with communities across the state to better understand their views on the topic and to increase awareness of the importance of organ donation.
Quick check 3.17
1. If an organ is damaged, recall the first treatment options before a transplant is considered.
2. Name some of the organs and tissues that can be donated in Australia.
3. Describe what would happen if a transplanted organ came from a donor who was not a good match for the recipient.
Explore! 3.14
downsizing dialysis
Dialysis is a medical treatment used to remove waste products and excess fluid from the blood of people with kidney failure. The treatment involves patients travelling to a clinic, where they are connected to a large 100 kg machine that filters the blood outside of the body and returns it to the patient. Usually, each treatment lasts about four hours and is done three times per week.
Figure 3.117b An artificial kidney could replace the need for large dialysis machines.
This leads to some significant environmental impacts, particularly with regard to water waste as each four-hour session uses 120–180 litres of water.
Many companies are developing alternatives to clinic-based dialysis. Research the benefits of the following new innovations:
Because of the high demand but low supply of organs available for transplantation, scientists are developing new ways to overcome this problem. One method is xenotransplantation. This is the process of transplanting organs from a species different to the recipient.
Doctors have been transplanting porcine (pig) heart valves into humans since 1965, as pig organs are a similar size and shape to human organs. However, there are two main biological challenges that scientists face with any pig–human transplant procedure:
• The biological markers on pigs’ cells and organs do not match those in humans, and so the human recipient’s body can reject the organ.
• There are viruses in pigs’ genetic material that could infect and harm humans who receive a pig organ.
In 2022, doctors successfully transplanted a pig heart into an American man, but sadly he died two months after the procedure, possibly due to an infection from the heart. Later in the year, surgeons successfully transplanted genetically engineered pig hearts into two brain-dead patients in New York. Over three days of monitoring, the new hearts functioned perfectly, and neither body caught any diseases. The hearts were sourced from pigs that had 10 genetic modifications, including four that blocked pig DNA to prevent rejection and abnormal organ growth, as well as six human transgenes to improve pig–human compatibility. Pig–human transplants will become increasingly common within the next few years.
xenotransplantation transplanting organs from one species into another
Figure 3.117c In March 2024, the first ever genetically modified kidney from a pig was successfully transplanted into Richard Slayman after his body rejected a previous human transplant. Slayman died in May 2024 from causes unrelated to the transplant.
Circulatory system
Other organs
UNCORRECTEDSAMPLEPAGES
Figure 3.117d Some of the possible transplant tissues and organs we could get from pigs
Explore! 3.15
ethical organs
Organoids are tiny clusters of cells that organise themselves into miniature and rudimentary versions of our organs. They present biomedical researchers with an opportunity to study organ development and experiment with drug technologies. Organoids develop from stem cells that have been grown in tiny ‘wells’ and made to differentiate into specialised cells, such as neurons. These neurons then make connections and begin to behave in a similar way to how they do in a patient’s actual brain.
Figure 3.117e A developing human cerebral organoid, made from hurman brain cells. The organisation, structure and nervous signalling are sirnilar to brain tissue. Such organoids are used to study nervous system diseases.
The development of organoids has had a significant impact on using live animals in laboratory research. Many people object to the use of live animals in research, and the use of organoids has the potential to reduce the number of animals used.
Complete some research and discuss how the use of organoids has impacted the ethical, environmental, social and economic issues associated with using live animals in laboratory research.
Organ regeneration
The liver is the largest internal organ in your body and the only one that can not only repair itself but also regrow damaged or lost tissue. It is located just below your ribs, on the right side of your body. The liver is involved in many important processes, such as producing enzymes for digestion, storing vitamins and removing toxins from your blood. If the liver is exposed to too many toxins over a long period of time, it can become damaged and not perform its job properly.
Alcohol is a toxin that the liver filters out of the blood. People who regularly drink too much alcohol can permanently damage their liver. Fatty liver is the earliest stage of liver damage caused by excessive alcohol consumption, occurring when the liver begins to accumulate excess fat. If the person continues to drink, they can develop alcoholic hepatitis, a condition in which the liver becomes inflamed and damaged, and then fibrosis, in which the liver becomes scarred. Cirrhosis is the final stage of liver damage from alcohol consumption, in which healthy liver tissue is replaced with fibrous tissue. Cirrhosis can lead to several serious health problems, including liver failure. If caught early enough, a change in lifestyle habits can reverse or limit the damage done to the liver. In severe cases, however, liver transplantation surgery may be necessary.
As you learned earlier in this section, organ transplants come with many risks, and matching donors are hard to find. That is why scientists are working on the ability to regenerate or grow organs from living healthy tissues. This process is called tissue engineering and it is a fast-growing area of research. This means that healthy living organ donors can donate part of their liver and their liver can grow back to nearly the same size over time. Because of the regenerative properties of the liver, scientists can grow whole new organs from as little as a quarter of an original liver.
If scientists can grow and regenerate organs using the patient’s own tissue, then the body will not reject the transplanted organ.
artificial organs
UNCORRECTEDSAMPLEPAGES
Advances in technologies have enabled the repair and replacement of organs using synthetic materials. An artificial organ can mimic or enhance the function of a real organ in several different ways.
Regardless of their design, artificial organs are constructed using materials that are compatible with the human body. Some artificial organs are also equipped with sensors and other devices that can monitor and adjust their function in real time.
tissue engineering the combined use of cells and engineering to improve or replace biological tissues
Figure 3.117f The stages of liver disease
Normal liver
Liver fibrosis
Fatty liver
Cirrosis
Purpose Description
Replacement Some artificial organs are designed to replace a damaged or failing organ.
Figure 3.117g An artificial heart can be implanted in a patient with heart failure to help pump blood.
SupplementationArtificial organs can supplement the function of a real organ.
Figure 3.117h Dialysis machines and artificial kidneys can be used to filter the blood and remove waste products in patients with kidney failure.
EnhancementArtificial organs can enhance the function of a real organ.
3.117i A cochlear implant can be surgically implanted in the ear to enhance hearing in individuals with hearing loss.
Control Artificial organs can control the function of a real organ.
Figure 3.117j A pacemaker can be used to control the heartbeat and regulate the electrical activity of the heart.
Uncorrected 2nd sample
Table 3.3 Different purposes of artificial organs
Figure
Try this 3.10
The benefits of artificial organs
Research the benefits of using artificial organs and create a persuasive text that influences a specified audience regarding their use. You may want to think about their cost effectiveness, their medical outcomes and the impact on organ donor waiting times.
UNCORRECTEDSAMPLEPAGES
Quick check 3.18
1. Contrast organ replacement and organ regeneration.
2. Define ’xenotransplantation’.
3. Summarise two potential problems with xenotransplantation.
4. Name two toxins that are removed by the liver.
5. Recall the size of a section of liver from which the organ can regrow.
investigating the impact of salt on liver function
careful Safety glasses and gloves must be worn.
The liver breaks down hydrogen peroxide, a toxic substance that is produced as a by-product of various metabolic processes in the body. Hydrogen peroxide can cause damage to cells, so it must be quickly broken down into non-toxic products. The liver does this by using the enzyme catalase, which converts hydrogen peroxide into water and oxygen. Some research has suggested that a high salt diet may lead to high risk of liver damage and fibrosis.
Aim
To explore how salt impacts liver function, specifically the activity of the enzyme catalase, which is responsible for decomposing hydrogen peroxide into water and oxygen. You will investigate how varying concentrations of salt solution affect the enzymatic activity of cow’s liver by measuring the rate of oxygen bubble production during the breakdown of hydrogen peroxide.
Planning
1. Write a rationale about the role of the liver and factors that can affect liver function.
2. Write a specific and relevant research question for your investigation.
3. Identify the following variables in your experiment: independent, dependent and three controlled variables.
4. Construct a hypothesis for your experiment: predict what effect the different concentrations of salt solution will have on the number of oxygen bubbles being created.
5. Write a risk assessment for your investigation.
Materials
• 5 large test tubes
• liver solution (100 g of cow liver blended with 100 mL water)
• 10 mL measuring cylinder
• 0%, 10%, 20%, 30%, 40% salt solutions
• 3% hydrogen peroxide solution
• test tube rack
• disposable gloves
• marker
• stopwatch
Practical 3.9
Be
Method
1. Place the test tubes in a rack and label them 0%, 10%, 20%, 30%, 40%.
2. Add 3 mL of liver solution and 3 mL of the first salt solution and allow them to combine for three minutes.
3. Mark the level of the solution with a marker.
UNCORRECTEDSAMPLEPAGES
4. Add 2 mL of hydrogen peroxide to the test tube and time until the bubbles stop being produced.
5. When the bubbles stop being produced, record the time in the results table.
6. Repeat steps 3–5 after combining liver solution and a different salt solution in each of the remaining tubes.
Results
1. Draw a results table for your experiment.
2. Produce a suitable graph for your experiment.
Analysis
1. Describe any patterns, trends or relationships in your results.
2. Explain any trends you have identified.
Evaluation
1. Identify any limitations in your investigation.
2. Using your results, suggest a range of salt percentage that you would test in a follow-up investigation.
3. Explain the reason that a test tube containing no salt was included in the experiment.
Conclusion
Draw a conclusion from this experiment regarding the effect of salt on liver function, using data to support your statement.
ethics of organ transplants
When we discuss organ transplants, we must think about the ethical implications of taking an organ from one person and using it in another. ‘Ethics’ is the term we use to discuss what is right and wrong in society. As there are many different beliefs, cultures and people around the world, ethics can vary from country to country or from person to person. When something is considered right, we say it is ethical, and if it is considered wrong, we say it is unethical.
Our laws are linked to the ethical beliefs of a nation and can change over time as people’s perception of ethics evolves. However, just because something is considered unethical does not necessarily mean that it is illegal.
Some donated organs, such as kidneys and partial livers, come from living donors. This creates an ethical dilemma for the doctor who is performing the surgery. Should they risk the life of a healthy person to save or improve the life of a patient? Some questions they must consider are:
• Does the living donor know and understand all the risks?
• What if something goes wrong during surgery and puts the donor’s life at risk?
• What if the transplant is rejected by the patient and the organ goes to waste?
• What happens if the donor is left with long-term pain, infection or impaired health after the surgery?
The donor may be under a lot of pressure from friends or family, which can make them feel forced into donating.
At any one time, there are around 1600 people on the Australian organ transplant waiting list. There are many rules in place to ensure that organs are allocated to patients in a fair process that is not affected by race, religion, gender, disability, social status or age, unless, for example, an adult organ is too large for a child, or a child’s organ is too small for an adult.
There is a very limited number of organs available at any one time, and so the wait for an organ could be any time from six months to more than four years. As a result of this, several factors are used to decide who gets an organ, such as:
• how long the person has been waiting for a transplant.
• how well the organ matches the patient.
• how urgent the transplant is for the patient’s health.
3.117k
make decisions based on law, but ethics may also be a consideration in the decision-making process.
• whether the organ can be brought to the person in time.
Try this 3.11
The pros and cons of organ donation
Create a table showing the possible advantages and disadvantages (risks) for both an organ donor and a recipient.
Explore! 3.16
Opt in or opt out?
In some countries, such as Wales and Spain, all adults are automatically registered as organ donors. These adults can ‘opt out’ of the registration if they do not wish to be an organ donor. Many do not opt out. Spain consequently has one of the shortest waiting times for organ transplants in the world.
Research the current percentage of Australians who are registered organ donors and our average waiting list times and compare these with Spain’s.
Answer the following questions and justify your opinion with evidence.
1. Do you think Australia would benefit from an ‘opt out’ organ donation system?
2. What are some of the advantages and disadvantages of an ‘opt out’ system?
3. Discuss the ethical issues that arise from organ transplantation.
UNCORRECTEDSAMPLEPAGES
Figure
Judges
Section 3.7 review
Section 3.7 questions
Remembering
1. State the function of the kidneys.
2. Name two factors that can damage the kidneys.
3. List the two main challenges that scientists face with xenotransplantation.
4. Name the largest organ inside a human.
Understanding
5. Define ‘organ donor’.
6. Define ‘organ transplant’.
7. Explain why organs are sometimes rejected.
Applying
8. Summarise how too much salt can be harmful to a person.
9. Identify one organ that can regenerate.
10. Identify how Australian rules keep organ donation fair.
Analysing
11. Compare ethics to laws.
12. Patients who are waiting for a kidney transplant might undergo daily or weekly dialysis treatment. Dialysis involves attending a hospital and being connected to a machine that filters your blood and then returns it to your circulation. The graph in Figure 3.1171 shows percentage survival rates for patients on dialysis versus patients who receive a kidney transplant. Use the graph to answer the following questions.
a) Determine the difference in survival rates at the 1-year mark for dialysis patients versus transplant recipients.
b) Determine the difference in survival rates at the 5-year mark for dialysis patients versus transplant recipients.
c) Using your knowledge of organ transplantation, account for the difference in survival rates for these two patient populations. (What advantages does transplantation offer?)
Evaluating
13. Justify why liver regeneration would be more beneficial than a liver transplant.
Figure 3.117l Survival rate of patients on dialysis versus patients who have received a kidney transplant