

Tori Shaw
Erin Checkley
Sarah Chuck
Gemma
Dale
Brodie Reid

Shaftesbury Road, Cambridge CB2 8EA, United Kingdom
One Liberty Plaza, 20th Floor, New York, NY 10006, USA
477 Williamstown Road, Port Melbourne, VIC 3207, Australia
314–321, 3rd Floor, Plot 3, Splendor Forum, Jasola District Centre, New Delhi – 110025, India 103 Penang Road, #05–06/07, Visioncrest Commercial, Singapore 238467
Cambridge University Press & Assessment is a department of the University of Cambridge.
We share the University's mission to contribute to society through the pursuit of education, learning and research at the highest international levels of excellence.
www.cambridge.org
First edition © Kerry Ardley, Emma Bone, Eddy de Jong, Christopher Humphreys and Cambridge University Press 2019 Second edition © Victoria Shaw, Erin Checkley, Sarah Chuck and Cambridge University Press 2025
This publication is in copyright. Subject to statutory exception and to the provisions of relevant collective licensing agreements, no reproduction of any part may take place without the written permission of Cambridge University Press & Assessment.
First published 2019 Second Edition 2025
Cover designed by Loupe Studio Text designed by Shaun Jury Typeset by QBS Learning
Printed in Malaysia by Vivar Printing
A catalogue record for this book is available from the National Library of Australia at www.nla.gov.au
ISBN 978-1-009-60334-8
Additional resources for this publication at www.cambridge.edu.au/GO
Reproduction and Communication for educational purposes
The Australian Copyright Act 1968 (the Act) allows a maximum of one chapter or 10% of the pages of this publication, whichever is the greater, to be reproduced and/or communicated by any educational institution for its educational purposes provided that the educational institution (or the body that administers it) has given a remuneration notice to Copyright Agency Limited (CAL) under the Act.
For details of the CAL licence for educational institutions contact:
Copyright Agency Limited
Level 12, 66 Goulburn Street
Sydney NSW 2000
Telephone: (02) 9394 7600
Facsimile: (02) 9394 7601
Email: memberservices@copyright.com.au
Reproduction and Communication for other purposes
Except as permitted under the Act (for example a fair dealing for the purposes of study, research, criticism or review) no part of this publication may be reproduced, stored in a retrieval system, communicated or transmitted in any form or by any means without prior written permission. All inquiries should be made to the publisher at the address above.
Cambridge University Press & Assessment has no responsibility for the persistence or accuracy of URLS for external or third-party internet websites referred to in this publication and does not guarantee that any content on such websites is, or will remain, accurate or appropriate. Information regarding prices, travel timetables and other factual information given in this work is correct at the time of first printing but Cambridge University Press & Assessment does not guarantee the accuracy of such information thereafter.
Please be aware that this publication may contain images of Aboriginal and Torres Strait Islander people who are now deceased. Several variations of Aboriginal and Torres Strait Islander terms and spellings may also appear; no disrespect is intended. Please note that the terms 'Indigenous Australians' and 'Aboriginal and Torres Strait Islander Peoples' may be used interchangeably in this publication.
Cambridge University Press & Assessment acknowledges the Aboriginal and Torres Strait Islander Peoples of this nation. We acknowledge the traditional custodians of the lands on which our company is located and where we conduct our business. We pay our respects to ancestors and Elders, past and present. Cambridge University Press & Assessment is committed to honouring Aboriginal and Torres Strait Islander Peoples' unique cultural and spiritual relationships to the land, waters and seas and their


Tori Shaw has been committed to sharing her love for science with Year 7–12 students for over 20 years. She has worked in both government and independent schools, has been an assessor for the VCAA and IBO, and co-authored Cambridge's VCE Biology series. Her greatest joy comes from making science accessible, exciting and fun for all students. She is currently the Head of Science at Kingswood College in Melbourne.
Erin Checkley has taught Science and Mathematics across Years 7–12 for the past 12 years. Transferring from a career in physiotherapy, she discovered a passion for curriculum development through studying her Master of Education at the University of Melbourne and a strong desire to build students' critical thinking skills. Erin is currently teaching as a Science specialist in Years Prep–4 at Ballarat Clarendon College.
Sarah Chuck has taught 7–10 Science and VCE Biology for eight years. Having taught in an all-girls context for most of her career, she is passionate about increasing female engagement in STEM and fostering a sense of confidence and belonging among her students. Sarah has been a VCAA assessor and STAV council member, and is currently Head of Science at a Catholic secondary college in Melbourne.
The publisher would like to thank Dr Brodie Reid, Dr Gary Turner, Dr Gemma Dale, Jeremy Walker, Naomi Sutanto, Paris Beasy, Rebecca Leibhardt, Samuel Parsons and Stephanie McDougall for reviewing and contributing to this resource.
Special thanks to Sharon Davis and Julie Bover of Goorlil Consulting, and to Kingswood College.
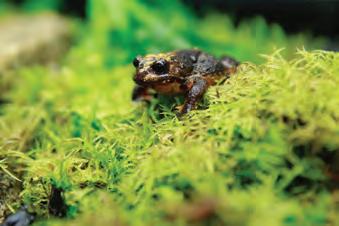
The Baw Baw frog (Philoria frosti) is the only amphibian species endemic to Victoria. It is only found on the Mount Baw Baw plateau, in a unique ecosystem made up of a collection of bogs containing sphagnum moss, which is featured on the cover of this publication. The Baw Baw frog population has declined significantly due to the spread of chytrid fungus, and it also faces threats including climate change, deforestation and the introduction of invasive species. It is listed as Critically Endangered on Victoria's Flora and Fauna Guarantee Act 1988 Threatened List.
Glossary
Definitions of key terms are provided next to where the key term first appears in the chapter.
Students are encouraged to conduct research online to find and interpret information.
These provide quick checks for recalling facts and understanding content. These questions are also available as Word document downloads in the Interactive Textbook.
These are descriptions of what the student will learn throughout the section.
These are short facts that contain interesting information.
Science as a human endeavour
These are recent developments in the particular area of science being covered. They may also show how ideas in science have changed over the years through human discovery and inventions.
Section questions
Question sets at the ends of sections are categorised under five headings: Remembering, Understanding, Applying, Analysing and Evaluating. Cognitive verbs have been bolded. These questions are also available as Word document downloads in the Interactive Textbook.
Hands-on activities
Classroom activities help explore concepts that are currently being covered.
Visible thinking style classroom activities help consolidate the concepts currently being covered.
These activities focus on developing science inquiry skills, including using laboratory equipment. Practicals can be conducted within one lesson, while Investigations are longer and cover more areas of the experimental design. These activities are also available as Word document downloads in the Interactive Textbook.
Worked example
Worked examples are provided for topics that require calculations, or to reinforce important skills.
Chapter checklist
Success
1.1I can explain the choice of independent, dependent and controlled variables in a scientific investigation.
14b
1.1I can refine a research question to target specific information or data collection techniques. 11, 14a
1.1I can assess the validity of an investigation by defining the terms repeatability, replicability, reproducibility, accuracy and precision.
1.1I can describe the difference between random and systematic errors, and calculate both absolute and relative uncertainty.
1.2I can assess and minimise experimental risk.
1.2I can apply skills in the use of specialised laboratory equipment, such as titration equipment. 11
1.2I can explain the use of data loggers, models and simulations for gathering reliable data. 5
1.2I can describe the ethical considerations of using animal and human participants in research. 7, 14d
1.2I can outline research design features that might be employed in trials involving human participants that will increase the reliability and validity of the findings. 13, 14c
1.3I can evaluate the validity of claims in primary and secondary data.4, 9, 12
1.3I can communicate research findings clearly and effectively through the use of structured practical reports and scientific posters. 14e
Data questions
Applying
1. The table below shows the effect of changing the pH of a pond on the number of tadpoles in the pond.
Table showing the number of tadpoles according to the pH of pond water
Review questions
Remembering
1. Recall what a scientist should do if they discover an Aboriginal or Torres Strait Islander artefact during fieldwork.
2. Define the following terms. a) independent variable b) dependent variable c) extraneous variables d) controlled variables
a) Identify the independent and dependent variables in this study.
b) Identify the optimum pH for tadpole survival.
3. Recall the reason a safety data sheet (SDS) should be understood before conducting an experiment.
c) Identify an outlier in the data.
Chapter checklists help students check that they have understood the main concepts and learning goals of the chapter.
Chapter review question sets are categorised under five headings: Remembering, Understanding, Applying, Analysing and Evaluating. Cognitive verbs have been bolded. These questions are also available as Word document downloads in the Interactive Textbook.
Data questions help students apply their understanding, as well as analyse and interpret different forms of data linked to the chapter content. These questions are also available as Word document downloads in the Interactive Textbook.
4. List the research design features of a randomised controlled trial that make it the 'gold standard' in scientific research.
d) Identify at which pH value the data were most precise.
Analysing
2. High school students were analysing the amount of ethanoic acid in a commercial vinegar sample and had made up a dilute solution of 0.1 mol L–1 ethanoic acid based on the concentration of ethanoic acid given on the bottle of vinegar. The students set up a titration with 20.00 mL of their ethanoic acid in a conical flask (via pipette) and filled a burette with 0.1 mol L–1 NaOH. If the ethanoic acid content quoted on the vinegar bottle was correct, the students hypothesised that 'If 20 mL of 0.1 mol L–1 ethanoic acid is present, then 20 mL of 0.1 mol L–1 NaOH will be required to reach an end point'. The titration data from the two students attempting six repeated trials are tabulated in the table below.
Table showing the titres required to reach the end point
a) Identify and circle any outliers in each student's trials.
b) Calculate the mean volume of NaOH required to reach the titration end point, after removing outliers for each student.
c) The 'true' value for the titration, given the actual concentration of ethanoic acid, should have been 20.00 mL of 0.1 mol L–1 NaOH. Recognise the validity of this experiment for identifying the concentration of ethanoic acid.
d) Contrast the data tabulated. Was each student accurate?

e) Analyse the data tabulated. Were the students precise?
f) Justify whether the data presented by students 1 and 2 provide evidence to support the hypothesis.
g) Based on the data presented, infer whether the experiment was repeatable and reproducible.
STEM activities encourage students to collaboratively come up with designs and build solutions to problems and challenges.
DOC
VIDEO
These icons indicate that there is a video in the Interactive Textbook.
WIDGET
These icons indicate that there is an interactive widget in the Interactive Textbook.
These icons indicate worksheets, activities or question sets can be downloaded from the Interactive Textbook.
QUIZ
Automarked quizzes can be found in the Interactive Textbook for every section.
SCORCHER
Competitive questions can be found in the Interactive Textbook for every chapter review.
DOC
These icons indicate questions can be completed in workspaces in the Interactive Textbook. Question sets can be completed online, or downloaded from the Interactive Textbook.
The Interactive Textbook (ITB) is an online HTML version of the print textbook, powered by the Edjin platform. It is included with the print book or available as a separate digital-only product.
Definitions pop up for key terms in the text.
Videos summarise, clarify or extend student knowledge.
Widgets are accompanied by questions that encourage independent learning and observations.
Quizzes contain automarked questions that enable students to quickly check their understanding.


3
2

Sometimes

Traditional land management
Practicals are available as a Word document download, with sample answers and guides for teachers in the Online Teaching Suite.
Worksheets are provided as downloadable Word documents.


The rubber vine Cryptostegia grandiflora) is a flowering plant that is listed as a Weed of National Significance. It can spread quickly, forming dense thickets that smother native vegetation and prevent native animal access to waterways.

Research how traditional land management practices have been effective in controlling major weeds such as rubber vine and parkinsonia (

on an angle over the drop to protect the sample.
4 Place the slide onto the stage of the microscope and focus, using the lowest power magnification first.
Results
1 Draw a scientific drawing of the Euglena you observe. Use a sharp pencil.
2 Use the internet to research the structure of Euglena. Label your scientific drawing.
Discussion: Analysis
Euglena can make sugars like plants can, but they also have a simple ‘eye’ spot (sensitive to light, not a true eye).
Euglena can also move, as you have observed. From your observations, justify whether you believe Euglena is more similar to animals or plants.
Conclusion
State whether Euglena is a unicellular or multicellular organism, and summarise what you observed under the microscope.
Workspaces enable students to enter working and answers online and to save them. Input is by typing, handwriting and drawing, or by uploading images of writing or drawing.
Self-assessment tools enable students to check answers, mark their own work, and rate their confidence level in their work. Student accounts can be linked to the learning management system used by the teacher in the Online Teaching Suite.


The Online Teaching Suite is automatically enabled with a teacher account and is integrated with the teacher's copy of the Interactive Textbook. All the assets and resources are in one place for easy access. The features include:
• the Edjin learning management system with class and student analytics and reports, and communication tools
• teacher's view of a student's working and self-assessment
• chapter tests and worksheets with answers as PDFs and editable Word documents with answers
• editable curriculum grids and teaching programs
• teacher notes (including suggested responses if relevant) for Practicals, Try this, Making thinking visible, Explore! and STEM activities.
• diagnostic tools, including ready-made pre- and post-tests and intuitive reporting.


Introduction
In this chapter, you will continue to explore how the scientific method provides a framework for planning and conducting safe, valid and reproducible experiments. Investigable research questions and well-reasoned hypotheses guide experimental design, and appropriately used technology can aid in minimising errors in the methodology. Scientists must then process, represent and analyse the experimental data, and examine potential correlation between variables, in order to accept or reject their hypotheses and generate evidence to support their claims. A structured practical report provides a template for sharing new understandings and communicating the entire scientific process.
The scientific method gives a framework for research and involves…
Questioning and predicting
Planning and conducting
Processing, modelling and analysing
Evaluating
Section
Section 1.2
Section 1.3
Communicating
Experimental design
• Overview of the scientific method
• Developing investigable research questions
• Defining the experimental variables
• Constructing reasoned predictions and hypotheses
• Conducting safe and valid experiments: risk assessment, methodology, sample sizes, minimising errors with technology
Drawing conclusions from data
• Types of experimental data
• Processing data: descriptive vs inferential statistics, measures of centre and spread
• Representing data: tables, column and bar graphs, histograms, scatterplots
• Analysing data: line of best fit, relationships between variables, making predictions
Communicating your conclusions
• Structure of a practical report
• Framing your discussion: analysis and evaluation
• Forming conclusions
• Respecting Traditional knowledge

Questioning and predicting
investigable questions, reasoned predictions and hypotheses can be used in guiding investigations to test and develop explanatory models and relationships (VC2S10I01)
Planning and conducting valid, reproducible investigations to answer questions and test hypotheses can be planned and conducted, including identifying and controlling for possible sources of error and bias in sampling or in making observations; safe, ethical investigations include undertaking risk assessments and following protocols when accessing cultural sites and artefacts on Country and Place (VC2S10I02)
equipment can be selected and used to generate and record data sets that show precision, including consideration of sample size and using digital tools as appropriate (VC2S10I03)
Processing, modelling and analysing data and information can be organised, processed and summarised by selecting and constructing representations including tables, graphs, descriptive statistics, models, symbols, formulas and mathematical relationships (VC2S10I04)
information and processed data can be analysed and compared to identify and explain qualitative and quantitative patterns, trends, relationships and anomalies (VC2S10I05)
Evaluating the validity and reproducibility of investigation methods and the validity of conclusions and claims can be evaluated, including by identifying assumptions, conflicting evidence, biases that may influence observations and conclusions, sources of error and areas of uncertainty (VC2S10I06)
arguments based on a variety of evidence can be constructed to support conclusions or evaluate claims, including consideration of any ethical issues and cultural protocols associated with accessing, using or citing secondary data or information (VC2S10I07)
Communicating
communicating and justifying scientific ideas, findings and arguments for diverse audiences involves the selection of appropriate presentation formats, content, scientific vocabulary, conventions, models and other representations, and may include the use of digital tools (VC2S10I08)
Victorian Curriculum v2.0 F–10 © VCAA 2024
Accurate
Causation
Continuous data
Control group
Controlled variable
Discrete data
Exponential
Extraneous variable
Extrapolation
Half-life
Correlation
Culturally responsive
Dependent variable
Descriptive statistics

Hypothesis
Independent variable
Inferential statistics
Interpolation Investigable
Nominal data
Non-linear
Ordinal data
Origin
Outlier
Personal error
Prediction p-value
Random error
Repeatability
Safety data sheet
Systematic error
Validity
At the end of this section, I will be able to:
1. Recall the steps of the scientific method.
2. Develop an investigable research question.
3. Identify the independent, dependent, controlled and extraneous variables in a scientific investigation.
4. Construct a hypothesis to test an identified relationship.
5. Plan and conduct a safe and valid experiment.
6. Discuss how to minimise errors using technology.
Scientists the world over, from students through to research professionals, follow a systematic approach towards experimentation known as the scientific method. The framework shown below outlines the steps involved in planning, conducting, analysing and reporting upon an investigation, to ensure the claims are valid.
STEP 1: Observe and ask questions
A research question may be identified once an area of scientific interest has been analysed.
STEP 2: Do background research (rationale)
A rationale is a concise version of a literature review. A scientist who is interested in conducting an experiment on a certain topic of interest will first search relevant scientific literature. This requires the ability to find and analyse past research articles and results.
STEP 3: De ne variables and state a hypothesis
A hypothesis is a testable prediction about the relationship between two or more variables. It is formulated using the scientific knowledge obtained from the scientific literature. It is not just simply a haphazard guess without any prior knowledge-it is more of an educated guess. You should also state your independent, dependent and controlled variables.
STEP 4: Outline methodology
An experiment may include controlled laboratory experiments, naturalistic observations, case studies, surveys and interviews. Conducting the experiment requires a specific methodology. The methodology usually contains at least two sections:
• Materials (lists the scientific equipment and materials required to conduct the experiment)
• Method (a step-by-step procedure of how the experiment is conducted).
There may also be a section detailing how risks are to be managed during the experiment, including how any waste products should be disposed of. If human participants are used, the methodology should detail their demographics, how they are to be sampled and allocated, the research design and the ethics approval process.
STEP 5: Collect and record the data
Data collection is of utmost importance in any scientific experiment. This step involves organising, summarising and representing the data that was collected in the experiment (raw datal in a meaningful way. Generally, descriptive statistics are used to organise and summarise the data. Graphs and tables can be used to represent the data, calculation of means, medians or modes can be used to summarise the data. Error bars can be included to represent uncertainty in any measurements.
STEP 6: Analyse the data
The tables and charts of data then need to be examined. Analysing data can reveal relationships, trends and patterns. The meaning of each of the results should be summarised and there should be an identification of the uncertainty and limitations of evidence.
STEP 7: Evaluate the data
This is a discussion of the reliability and validity of the experimental process. Suggested improvements and extensions to the experiment should be included.
STEP 8: Form a conclusion
This is an insightful interpretation of experimental evidence through a justified conclusion that is linked to the research question.
STEP 9: Communicate your ndings
A scientific report is completed to document the research and share the findings with other scientists. Common methods used to report the research findings include: practical reports, oral presentations and poster presentations.
The success of a scientific investigation depends on several factors before it even begins:
• a specific and worthwhile research question
• reasoned predictions and precisely controlled variables
• careful planning and identification of risks, sources of error and ethical issues before they arise.
Science is a discipline that relies heavily on collecting and analysing data. The aim of any scientific investigation is to gather data that can be analysed to provide answers to research questions. The research question should be investigable, and practical in terms of the skills and resources required. Scientists must also consider if the research question is worthwhile. Ideally, the conclusions drawn would offer some new scientific understanding or demonstrate a concept in a new way.
For a question to be investigable, it needs to meet the criteria outlined in Table 1.1. investigable able to be tested through research or experimentation
Description
SpecificThe question needs to be clear and unambiguous. It should be well defined so that it can be investigated systematically.
TestableThe question should be testable through experimental procedures. It should be possible to collect data or information that can be used to answer the question.
Relevant The question should be relevant to the field of study. It should address an important issue or problem and have the potential to contribute to existing knowledge.
FeasibleIt should be possible to collect the necessary data or information, and conduct the investigation using the available resources, time and budget.
NovelIdeally, the question should not have been investigated before or should have a different approach or perspective from previous investigations.
After going for a run, you may have noticed several physiological responses, such as sweating, feeling hot, vasodilation (the dilation of blood vessels, which gives your skin a red appearance), and an elevated heart rate and rate of breathing.
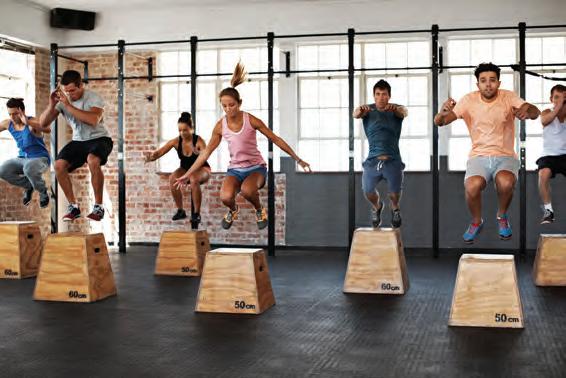
1. Formulate an investigable research question regarding exercise and one of the responses mentioned above.
2. Critique your research question against the criteria from Table 1.1:
a) Is it specific and unambiguous?
b) Is it possible to conduct an experiment to test it? Some of the physiological responses shown above are much easier to objectively measure than others.
c) Is it relevant?
d) Is it feasible? (e.g. What materials would you require? Do you have the skills, time and access to the necessary resources?)
e) Is it novel?
Once an investigable question has been developed, it is necessary to conduct some background research on the topic. This may involve reading about explanatory models, reviewing publications of other scientists' results and writing a short rationale that justifies the need for your research. This will also help in defining the experimental variables and informing the materials, method and data analysis techniques you will use.
1. List the first four steps in the scientific method.
2. Name three criteria an investigable question should meet.
3. Develop an investigable question regarding plant growth.
Your research question might lead to an experiment that investigates whether there is a cause-andeffect relationship between two variables. For example, you might be interested in how the height of a ramp influences the distance a toy car will travel. The variable that is deliberately changed by the experimenter is known as the independent variable. The variable being measured, as a result of changes to the independent variable, is the dependent variable
In the example shown below (see Figure 1.2), the experimenter might conduct multiple trials of the experiment, changing the height of the ramp each time. Therefore, the height of the ramp (in centimetres) is the independent variable. The distance the car travels (in centimetres, i.e. the distance it takes to come to a stop) is the dependent variable. It is important to specify the units of measurement you will use for your variables.
Figure 1.2 How does the height of a ramp affect the stopping distance of a toy car?
Other factors can have an impact on the investigation, either by introducing a source of error or by affecting the dependent variable. These are referred to as extraneous variables. In the experiment shown above, the floor surface (such as tiles versus carpet) could have a significant effect. In order to make a claim regarding causation, the scientist conducting the experiment must keep all extraneous variables the same throughout the experiment. This process is called controlling the variable. For example, if temperature or time of day is likely to affect the dependent variable, you would keep the temperature of the room consistent or conduct each trial at the same time of day. In this way, the influence of extraneous variables is eliminated, and they become controlled variables.
independent variable the variable that is systematically manipulated or changed in order to investigate its effect on the dependent variable dependent variable the variable that is measured in response to the independent variable extraneous variable a variable other than the independent variable that may affect the dependent variable; if not controlled, can influence experimental results and lead to false conclusions causation one event is caused by another event occurring controlled variable a variable that is kept constant so as not to affect the dependent variable in an experiment
control group a group that is not subjected to the independent variable in an experiment, and therefore provides a baseline for comparison hypothesis a proposed explanation or an educated guess that can be tested through further investigation or experimentation prediction a statement that describes what is expected to happen if the hypothesis is true¸ Quick check 1.2
In certain experimental designs, it is appropriate and necessary to include a control group. This allows for a direct comparison of the effect of the independent variable. The control group do not receive the 'intervention' of having the independent variable changed. For example:
• In an experiment investigating how moderate exercise affects heart rate, there should be a control group in which the participants do not undertake any exercise. The participants in the control group would take repeated measures of their heart rate at rest over the same time period as the intervention (exercising) group, and the data would act as a baseline for comparison. This would allow the experimenter to infer that it was the exercise resulting in the increased heart rate, rather than an environmental factor such as an increase in temperature during the experiment.
• In an experiment investigating how increasing temperature affects the action of enzymes in breaking down food, matched test tubes at each temperature (without the enzyme present) act as control groups. They allow the experimenter to infer that it is the enzyme that is having an effect (breaking down the food), rather than the change in temperature itself.
A hypothesis is based on existing knowledge and observations. It is an educated guess that is made before conducting an experiment or making observations. For a hypothesis to be considered scientific, it must be testable and should be able to be supported or refuted (shown to be wrong). It is typically a statement that can be tested through experimentation or observation, and which indicates the expected effect the independent variable will have on the dependent variable.
You can use the following 'If … then …' framework for constructing a hypothesis: If the ___________ increases/decreases, then the ___________ will increase/decrease.
variable here
For example:
'If the height of the ramp (in cm) increases, then the stopping distance of the car (in cm) will increase.'
A reasoned prediction is a longer statement that describes what is expected to happen if the hypothesis is true. It is used to guide the design of an experiment or the collection of data.
1. Describe the difference between an extraneous variable and a controlled variable.
2. Construct a hypothesis, using the ‘If ... then ...’ framework, relating to plant growth and amount of sunlight.
The culmination of your background research and thorough experimental design is conducting a safe and valid investigation. As a researcher, you must select appropriate methods and techniques for data collection and analysis, consider risk, minimise sources of bias and uphold ethical principles throughout experimentation.
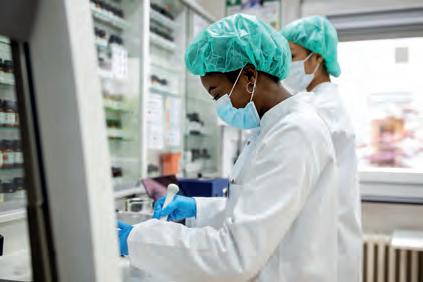
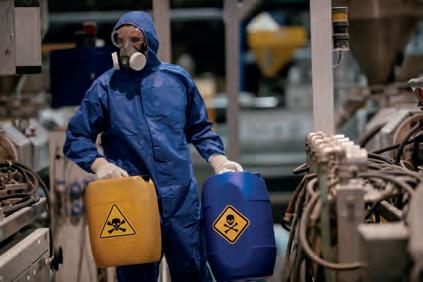
Identifying potentially hazardous materials and processes used in experimental investigations is an essential part of planning and conducting experiments. Hazards can include biological and chemical materials, such as infectious bacteria and flammable liquids, respectively.
Researchers must carefully evaluate the risks associated with the use of these materials and take appropriate measures to ensure the safety of themselves, their colleagues and the environment. This may involve:
• using personal protective equipment (PPE), such as gloves, safety glasses and respirators to prevent exposure to hazardous substances
• complying with safety protocols, as specified on the safety data sheet (SDS), for handling and disposing of materials
• ensuring that all equipment is properly maintained and calibrated
• ensuring everyone is familiar with emergency procedures (e.g. what to do in the case of a chemical spill or fire and when to evacuate).
It is crucial to choose an appropriate method for an experiment to ensure that the results are valid and reproducible. Validity refers to the extent to which an experiment measures what it is intended to measure. A valid experiment should produce results that are a true reflection of the phenomenon being studied. Repeatability refers to the ability to repeat an experiment and obtain consistent results each time it is performed.
Ensuring both validity and repeatability relies upon:
• using reliable and accurate measurement tools
• selecting large enough sample sizes
• adequately controlling any extraneous variables
• using appropriate data analysis techniques
• clearly documenting procedures in a step-by-step method so that other researchers could reproduce the study. This is true of both laboratory experiments and other methodologies, such as fieldwork and observational studies.
When designing and conducting scientific experiments, it is important to identify and address potential sources of error to ensure that the results are accurate and reliable. Errors can include systematic errors, such as consistent errors in instruments or the experimental procedure, and unpredictable random errors that occur due to chance. Personal errors are a type of random error and include mistakes and miscalculations.
safety data sheet a document that provides information regarding hazardous chemicals and substances validity the extent to which a study accurately measures or tests what it was intended to measure or test
repeatability how consistent the results are when the same scientist repeats the experiment under the same conditions as the original experiment accurate measures closely match the ‘true’ or accepted values systematic error an error that causes measurements to differ from the true result by a consistent amount, often due to faulty or uncalibrated equipment
random error an error caused by limitations of the measurement device or the observer, that does not follow a regular pattern
personal error a type of random error that arises from mistakes or miscalculations by the person conducting the experiment
To identify these sources of error, researchers need to carefully examine the methods used in the experiment. Once potential sources of error have been identified, researchers may need to conduct further testing or implement additional controls to minimise their impact. This may involve using more precise instruments, repeating experiments to establish consistency, or controlling variables that could influence the results.
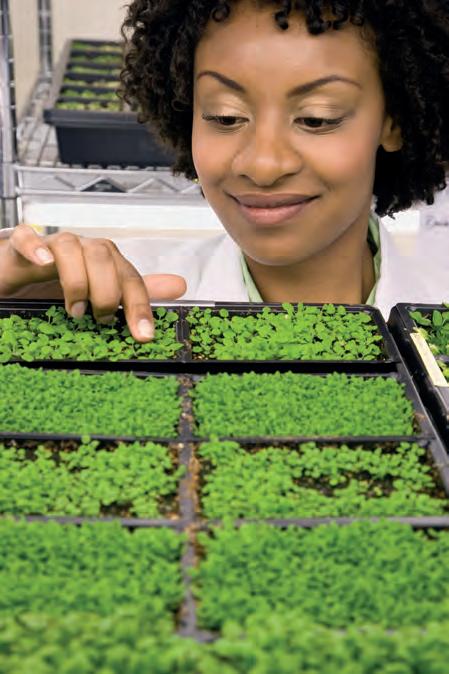
When designing and conducting an experiment, it is important to use an appropriately sized sample. A large sample size reduces the chance that the results have been obtained due to random errors, and yields more accurate and reliable results. For example, when investigating the effects of a new fertiliser, it should be trialled on hundreds of different seedlings in different conditions before drawing conclusions about its efficacy. The data could be collated and averaged to reduce the statistical impact of plants that grew extremely poorly or unusually well. When using a sample size that is too small, the results become highly subject to chance. If a sample size of just five seedlings was used, and the plants failed to grow because by chance the lighting conditions were inadequate, then the scientist might falsely conclude that the fertiliser was ineffective. Likewise, if the five seedlings used were somehow not representative of normal seedlings (e.g. they were all poor specimens), then the results would not be valid or useful.
However, a large sample size is not always necessary or feasible, particularly in cases where the data is highly consistent, or due to experimental or financial limitations. A balance must be struck.
Quick check 1.3
1. State whether a small sample size affects the validity or replicability of a scientific study.
2. Recall what ‘SDS’ stands for.
3. Contrast random and systematic experimental errors.
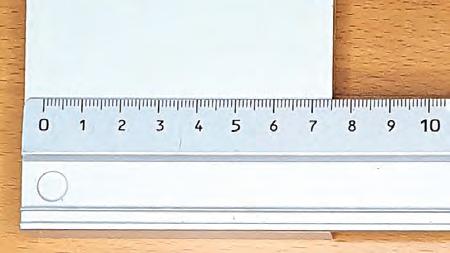
When completing an experiment, it is essential to use appropriate instruments that provide the required degree of accuracy. The accuracy of an instrument refers to its ability to measure a value close to the true value. Different instruments have varying degrees of accuracy. For example, a measuring cylinder can be used to measure liquids, but it has a lower degree of accuracy than a pipette (see Figure 1.6).
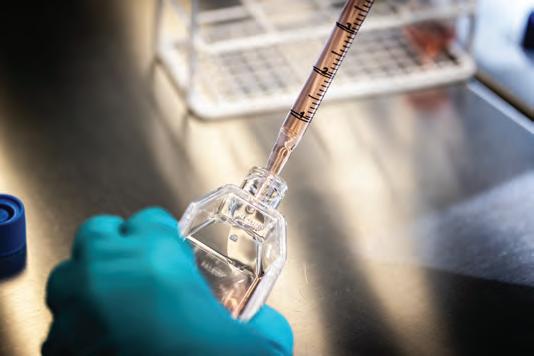

gives a greater degree of accuracy for measuring out liquids than does (b)
A data logger is an electronic instrument used to collect data over time. They can be attached to other devices, such as temperature and pH probes, to monitor how a variable changes over the course of an experiment. This saves the experimenter time as they do not have to take repeated measurements manually, and it reduces the possibility of experimenter error in timing their measurements or interpreting the scale on the measurement instruments. Data loggers can also be used with equipment such as weather stations to monitor environmental conditions over longer periods of time.
When using data loggers, it is important to choose the correct scale and select the appropriate range of values for the data logger to measure. For example, if you are monitoring the outdoor temperature in Melbourne, you might choose a scale that ranges from –5°C to 50°C, which is wide enough to capture the expected range of temperatures.
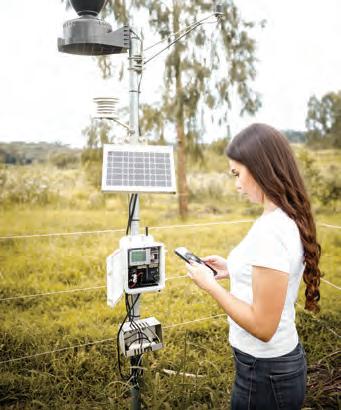
1.7 Weather stations are systems that measure and record weather conditions such as temperature, humidity, wind speed and direction, and precipitation. They typically contain a variety of sensors and instruments that are connected to a data logger, which collects and stores the data.
Digital tools have revolutionised the way scientific data is collected, managed and analysed, and they can make data collection more efficient for larger sample sizes. Digital tools such as online surveys, mobile apps and wearable devices can be used to collect large amounts of data quickly and accurately.
Relying on digital tools for data collection can reduce the potential for human error and bias. For example, online surveys can be programmed to skip irrelevant questions, ensuring that respondents only answer questions that apply to them.
Go online to access the interactive section review and more!
Wearable devices can capture physiological data automatically, reducing the risk of participants measuring data incorrectly or responding in subjective ways.
Digital tools can also help in data management and analysis, particularly for larger sample sizes. Digital tools can be used to automate data entry, reducing the time and resources required for collecting and collating data. They can also facilitate complex data analysis, allowing large amounts of data to be analysed quickly and efficiently.
Section 1.1 review

Remembering
1. List three examples of personal protective equipment (PPE).
2. Recall the five criteria for a research question to be considered ‘investigable’.
3. Define ‘independent variable’, ‘dependent variable’, ‘extraneous variable’ and ‘controlled variable’.
Understanding
4. Outline one advantage of using digital tools, such as data loggers, to capture experimental data.
5. A faulty stopwatch has a stiff ‘stop’ button and hence regularly overestimates the recorded time by half a second. Identify which type of experimental error is represented in this scenario.
Applying
6. Sequence these steps of the scientific method in the correct order:
• do background research
• communicate your findings
• observe and ask questions
• test the hypothesis with an experiment
• define variables and state a hypothesis
Analysing
7. Contrast systematic and random errors.
Evaluating
• analyse the data
• evaluate the data
• form a conclusion
• collect and record the data
8. An experiment investigating learning examines how a mouse’s behaviour changes in response to food rewards. When a mouse correctly travels through a maze, it receives a piece of cheese. The maze is made progressively more complex by adding corners, and the time taken to reach the cheese is recorded by the experimenter using a stopwatch.
a) Identify the independent variable and the dependent variable in this experiment.
b) Construct a hypothesis for this experiment.
c) Justify why conclusions drawn from this experiment are not reliable, given the small sample size.
d) Propose a digital tool that could be used to minimise experimenter error.
At the end of this section, I will be able to:
1. Classify data types.
2. Calculate descriptive statistics for a dataset.
3. Select and construct appropriate representations of data.
4. Analyse and connect a variety of data and information to identify and explain patterns, trends, relationships and anomalies.
At the conclusion of a scientific investigation, the gathered data must be processed, modelled and analysed, to collect evidence to support or refute the hypothesis and generate valid conclusions. The way that data is handled and represented depends on the data type. Calculating descriptive statistics and identifying trends and anomalies offers insight into the relationships between variables and the likelihood of causation.
Data that has been generated from your own research is referred to as primary data. You may also access secondary data, which has been collected by other authors. Secondary data includes the data reported by the Census, raw data collected by someone else, or published research summaries.
In 2026, the Australian Bureau of Statistics (ABS) will conduct their next five-yearly national Census of Population and Housing in Australia. Compulsory paper questionnaires and online forms collect data from every member of the population on topics such as income, ancestry, religion, work, health and education. This gives a snapshot of the social, economic and cultural make-up of Australia and is used to inform government policies. You can access and download deidentified Census secondary data on the ABS website for use in your own research or projects.
continuous data quantitative (numerical) data points that have a value within a range; this type of data is usually measured against a scale that may include decimals or fractions
discrete data quantitative (numerical) data points that tend to have whole numbers; this type of data is usually counted
ordinal data qualitative (categorical) data where the categories have an order
nominal data qualitative (categorical) data where the categories have no clear order
descriptive statistics
mathematical tools used to summarise and describe datasets (e.g. measures of centre and spread)
inferential statistics mathematical tools that allow scientists to make claims regarding cause-and-effect relationships between variables by analysing the changes in datasets p-value determines the statistical significance of results by gauging the level of probability that the difference between two group’s results is due to chance
Quantitative data is numerical in nature and can be categorised as continuous or discrete. Continuous data is typically measured, and the values fall along a range (e.g. mass in milligrams). Discrete data is typically counted and tends to include whole integer values (e.g. the number of seeds that germinated).
Qualitative data is descriptive or categorical in nature. It is often less objective than quantitative data because it relies on the interpretation of the observer. Qualitative data is valuable for describing phenomena that cannot be captured numerically. Ordinal data uses categories that have a natural order (e.g. classifying the amount of bubbles produced in a reaction as none, low, moderate or high). Nominal data uses mutually exclusive categories that have no natural order (e.g. the classification of red blood cells under the microscope as normal, shrivelled or lysed).
this 1.2
Data can be represented in a variety of ways. Examine the graph below and classify the type of data that was collected.
Descriptive statistics are used to organise and summarise data. This includes calculating percentages, measures of central tendency and measures of spread. Descriptive statistics only describe the data and do not allow for interpretation of relationships or claims of causation between the variables. Spreadsheet software allows for efficient calculations of descriptive statistics for large datasets.

Inferential statistics allow scientists to infer cause-and-effect relationships between variables. Mathematical calculations can generate a statistic known as the p-value, which tells us the probability that the difference in two group's results is due to chance. You will see this statistic used widely in professional publications such as scientific journals.
For example, one group of plants were provided with fertiliser in addition to water (experimental group) and one group received water alone (control group). A hypothesis was generated that 'If increased levels of fertiliser are provided, then the growth of the plant will also increase.' After several weeks, their growth was measured and the experimental group demonstrated greater growth. Water only (control group) Water and
But how does the researcher know if this was due to the independent variable, or due to other extraneous variables or even due to chance? Inferential statistics allow the researcher to calculate the statistical significance of the difference. If the generated p-value is less than 0.05, then this means there is a less than 5% chance the results are due to chance; that is, there is a 95% chance that the difference is the result of the independent variable (fertiliser). This p-value is an accepted cut-off in scientific literature and allows the scientist to confidently conclude that the hypothesis is supported.
When conducting experiments with multiple trials, several values are obtained, which then need to be summarised into one representative value. Using descriptive statistics, we can calculate the average to gauge the central value (or 'central tendency') of a dataset. The three commonly used measures of central tendency are the mean, median and mode.
The mean is used to measure the centre of a dataset and is the most common statistic used to represent an average. The mean is the sum of all the values collected divided by the number of values present. However, it may not be a fair representation of the data as the mean is heavily influenced by outliers – values that are either very large or very small.
The median is an alternative way of measuring the centre of your data. It is found by arranging values in ascending order and then locating the middle data point (or average of the two middle points in the case of a dataset with an even number of values). The median is the value that has an equal number of data points above it and below it. The median is the true middle of the data and is a good measure of the average when your data includes outliers.
The mode is the most frequently occurring value or values in a dataset.
Worked example 1.1
determining the mean, median and mode of a dataset
mean the total of a set of values divided by the number of values in that set outlier an extreme data point – a number that is very different from the rest of the data collected median the middle value of the dataset after all the values have been ranked (sorted in ascending order); there should be as many values below the median as above it mode the most frequently occurring value or values in a dataset
A group of students want to find out how long it takes to boil 500 mL of water using a particular brand of kettle. They replace the water after every boil, repeating this 10 times. Their results in minutes are: 2, 4, 4, 2, 2, 2, 3, 2, 13, 4.
Determine the mean, median and mode of the dataset.
Calculating the mean
(2 + 4 + 4 + 2 + 2 + 2 + 3 + 2 + 13 + 4) 10 = 3.8
Determining the median 2, 2, 2, 2, 2, 3, 4, 4, 4, 13
To calculate the mean, we add all the values. Then we divide that total by the number of values. In this case, there are 10 values.
First, we need to order the values from smallest to largest. 2, 2, 2, 2, 2, 3, 4, 4, 4, 13
If there is an odd number of values, then we pick the middle number. In this case, there is an even number of values, so we must find the mean of the two middle numbers.
(2 + 3) 2 = 2.5
Determining the mode
2, 2, 2, 2, 2, 3, 4, 4, 4, 13
To find the mean of the two middle numbers, we add them together and divide by 2. In this case, the median is 2.5 minutes.
First, we need to order the values from smallest to largest. 2, 2, 2, 2, 2, 3, 4, 4, 4, 13
The value ‘2’ occurs more frequently than any other value in this dataset, therefore the mode is 2 minutes.
We can also measure the distribution of the data. This provides information about the spread of a particular variable's values. The simplest way of doing this is to calculate the range, which is the difference between the smallest and largest values. Note that outliers can be excluded from range calculations if you judge them to be the result of an error; however, this is an important point of discussion in your evaluation of the data.
Using the data from Worked example 1.1, determine which data point is a likely outlier, and calculate the range of the data. The results of time taken for water to boil in minutes (ranked) are: 2, 2, 2, 2, 2, 3, 4, 4, 4, 13.
Create a line plot of the data:
2, 2, 2, 2, 2, 3, 4, 4, 4
Smallest Largest
Range = 4 – 2 = 2 minutes
Creating a line plot allows us to easily see that 13 minutes is likely to be an outlier. Given it was a measurement of the time taken for water to boil, this is likely to be a result of a procedural or human error.
Remove the outlier from the dataset, re-rank, and identify the smallest and largest values.
Subtract the smallest value from the largest value.
Range bars can be plotted on graphs to visually represent this information. The larger the range bars, the more variation in the variable's values, suggesting that the data is less reliable. Descriptive statistics and their associated errors and uncertainties provide strong evidence of the reliability and accuracy of the data and can give scientists confidence in the outcome of their experimentation.
Try this 1.3
descriptive statistics
Consider the following dataset: 17, 14, 18, 21, 21, 19, 12, 20, 16.
1. Calculate the mean, median, mode and range of the data.
2. Put the data into a spreadsheet software program and explore how you can determine the mean, median, mode and range of the data by using formulas and functions within the program.
To analyse the trends in data and make meaning of the results, it is important that results are organised in tables and presented in appropriate and meaningful ways. The data type informs the choice of representation: bar and column graphs are appropriate for qualitative data, while histograms, scatterplots and line graphs are useful for quantitative data.
Tables are useful for recording data during an experiment, but also for displaying results, including descriptive statistics such as averages. The independent variable should be listed in the first column,
with the unit of measurement in the title rather than replicated for each measurement. The dependent variable measurements should be listed in the second and subsequent columns, with or without a final column showing the mean (see Figure 1.11).
Independent variable placed in first column, one column of dependent variable results for each trial.
Consistent number of decimal places
Unit of measurement specified in heading. Clear title
Table: ‘Height of bubbles produced when bicarbonate soda reacts with vinegar, according to the mass of bicarbonate soda’
Figure 1.11 A table of results clearly communicates the experimental data.
Bar and column graphs have rectangular bars that are proportional in height (or length) to the values they represent. A column graph has vertical bars, and a bar graph has horizontal bars. They are useful for comparing data between different categories or groups, and are suitable for large datasets. They both consist of four parts:
• a title that explains the information being graphed; titles for graphs should be written above the graph
• axes with labels that explain what each side of the graph is showing, including units. In a column graph, the independent variable tends to go on the horizontal axis (the x-axis) and the dependent variable goes on the vertical axis (y-axis). The opposite is true for a bar graph
• a scale of numbers that increases evenly from bottom to top (or from left to right if the bars are horizontal)
• category labels that explain what each bar is showing.
Figure 1.12a shows an example of a column graph and Figure 1.12b shows the same information presented as a bar graph.
1. The information in the table shows the results of an investigation into the number of fish species feeding on ocean plants. Represent this data as a column graph.
2. Calculate the mean, median, mode and range of this data.
Histograms may resemble a column graph, but they are actually used to plot the frequency of continuous (quantitative) data that is divided into intervals. They are suitable for large sets of data. The range of values of the dependent variable (the measured data) is plotted on the x-axis and the frequency is plotted on the y-axis, represented by the height of the bars. There are no gaps between the bars.
A scatterplot is used to identify the relationship between two variables. It is suitable for large datasets of discrete or continuous (quantitative) data. The data is displayed on a Cartesian plane, with the independent variable on the x-axis (horizontal), and the dependent variable on the y-axis (vertical). A dot (or cross) is typically used to denote a data point, and is placed where the x and y values intersect. For example, if plotting the temperature (dependent variable) at a certain time of day (independent variable), then the measurement of 20°C obtained at 9 am would be represented by a data point drawn at (9, 20), which corresponds to 9 on the x-axis (time) and 20 on the y-axis (temperature).
A scatterplot consists of similar parts to the column graph, including a title, and labelled and evenly scaled horizontal and vertical axes. When setting up your scatterplot, it is particularly important to ensure that the axis label scale is appropriate and consistent. The point where the x and y axes intersect (0, 0) is called the origin
Figure 1.14 The first two scatterplots are not correct because (a) the graph does not have evenly increasing increments along the horizontal axis and (b) the graph scale is not evenly spaced. (c) This scatterplot is correct because the scale is evenly spaced with evenly increasing increments.
When plotting more than one variable (dataset), you can use different colours or shapes to distinguish the datasets (e.g. using circles for males and crosses for females). Once the data points are plotted, they can be further analysed in terms of correlation and line of best fit. The data points are not typically connected with a line unless the independent variable is continuous in nature (e.g. time or mass); however, this would then be referred to as a line graph.
Table 1.2 shows the results from an investigation into plant height that took place over 25 days. Only the averages are shown. The data is then shown as a scatterplot in Figure 1.15.
Table 1.2 Mean plant height over time
Figure 1.15 Data relating to mean plant height over time, represented in a scatterplot. The independent variable (time in days) is continuous, so it would be appropriate to connect these data points, forming a line graph.
A study was undertaken on the effect on plant growth in an aquarium of the amount of fish food added. Eight aquariums (A–H) containing aquatic plants were set up in a laboratory. Food was added to each aquarium each day, in the amounts shown in the table below. After three weeks, the increase in mass of plants in each aquarium was measured. The results are shown in the table.
1. Identify the independent variable in this experiment.
2. Identify the dependent variable in this experiment.
3. Use this information to draw a complete scatterplot of this data. Hint: Your Cartesian plane should take up at least half of an A4 notebook page, to allow enough room to plot your points. Using pencil allows any mistakes to be easily corrected.
Once you have graphed your data, you can determine if there are any patterns, trends or relationships.
Line of best fit
It may be difficult to see how the variables relate to each other on a scatterplot, especially when there are many data points. A 'line of best fit', also known as a trend line, can be drawn to represent all the points and highlight a trend (relationship between the x and y variables).
Your line of best fit is not intended to connect each data point. Rather, the line should aim to 'average' the data by running through the centre of the data, with approximately half the data points above the line and half below. The line may touch some or none of the data points, but it often does not touch all of them unless there is a perfect linear relationship between the variables (i.e. the dependent variable increases/decreases at the exact same rate as the independent variable).
Your line of best fit:
• should run as close as possible to as many data points as possible (data points 'hug' the line)
• may be linear (straight) or non-linear (curved) if that better suits the spread of data points. Do not force a straight line over data that is clearly curved or displaying a pattern such as exponential growth
• be continuous and drawn as a solid line within the original dataset. If extended beyond the original dataset, it can be dotted/dashed (see section on extrapolation in 'Making predictions')
• not be forced through the origin (0, 0), if one is used on the graph.
Line of best fit
Figure 1.16 A scatterplot with a (linear) line of best fit. Note how the line runs through the middle of the data, with approximately half the points above the line and half the points below.
Correlation measures the association between two variables and provides valuable insights into how changes in one variable relate to changes in another (see Figure 1.17). Given that research questions and hypotheses often directly speculate about the effect of the independent variable on the dependent variable, this is an important statistical tool.
You will recall that when constructing a scatterplot, the independent variable should be plotted on the x-axis, and the dependent variable should be plotted on the y-axis. By observing the pattern of the data points on the graph, you can make inferences about the relationship between the variables:
correlation a statistical measurement of the extent to which two variables change in relation to one another
The points lie close to the line of best fit, which has a positive gradient. This shows as the independent variable increases, the dependent variable increases.
The points lie close to the line of best fit, which has a negative gradient. This shows as the independent variable increases, the dependent variable decreases.
There is no pattern in the results. There is no relationship between the independent and dependent variables.
Figure 1.17 The relationship between two variables can be positive or negative, or there may be no correlation.
It is important to note that correlation does not equal causation. A correlation may actually be caused by a third extraneous variable. Avoid using words like 'proves' or 'causes' when discussing the possible relationship between variables. Instead, you can use the following sentence stem to indicate the direction of the relationship:
'As the independent variable state how it changes , the dependent variable state how it changes . '
Try this 1.4
Visually inspect the scatterplots shown below. Use the sentence stem for describing correlation to state the relationship between the variables. An example has been completed for you.
Graph
Direction of correlationInterpretation
growth (mm)
As the amount of rainfall (in mm) increases, the tree growth (in mm) also increases.
You should also comment on the strength of the relationship. Statistical methods are available for quantifying this; however, a visual inspection of the data using a scatterplot allows for a good estimation. The strength of the correlation can be approximated by considering how tightly the data values hug a line of best fit.
If the data values do not appear to follow a linear relationship, the relationship may be non-linear or there may be no relationship between the variables at all (see Figure 1.18). If the relationship appears non-linear, fitting a line of best fit can be difficult. In this case, use a software program such as Microsoft Excel, a website such as Desmos, or a graphics calculator to generate the non-linear equation and plot the curved line of best fit.
Figure 1.18 When a line of best fit is drawn on a scatterplot, (a) the data points do not appear to show a relationship between the variables. However, (b) when a curved line of best fit is drawn on the same dataset, the non-linear relationship is evident. The scatterplot in (c) shows data points with a random distribution, suggesting there is no correlation (no relationship) between the variables.
Try this 1.5
radioactive decay
While oxygen-16 is the most abundant form of oxygen present on Earth, there are also numerous unstable isotopes, each of which has a different mass number (due to having a different number of neutrons in the nucleus). A scientific team has an unlabelled pure sample of one of the unstable isotopes of oxygen. This isotope is radioactive, meaning it will decay over time. To establish which isotope they have, the team has taken readings over time of the mass of the sample and established the half-life
Isotope
Oxygen-1470.6
Oxygen-15122.0
Oxygen-1926.5
Oxygen-2013.5
Oxygen-213.4
a) State the type of graph that has been used.
b) Describe the relationship between mass and time.
c) Identify the half-life of the sample, in seconds.
d) With reference to the table of values, propose which isotope the sample was.
A line of best fit can be used to make predictions inside the existing dataset. This is known as interpolation and can be done graphically (with the aid of a ruler), or it can be calculated mathematically if you have determined the equation of the line of best fit using graphing software. Interpolation is useful for finding missing data points – you can use the other data to predict the dependent variable value for an independent variable value that you did not test. interpolation using a line of best fit to make predictions within an existing dataset; predictions tend to be reliable
extrapolation extending a trend, pattern or relationship observed in a limited range of data to estimate values beyond that range; predictions can lack reliability
Extrapolation is the process of estimating a value outside the range of the data by extending a trend or pattern from the observed data. This is shown graphically by extending the line of best fit with dots/dashes (see Figure 1.19). Such predictions are less reliable as they are beyond the original dataset and therefore assume the relationship continues. The larger your dataset (more points on the scatterplot) or the greater the correlation (more closely the points hug the line), the more confident you can be in the accuracy of an extrapolated prediction. Making predictions a long way outside your original dataset further reduces the accuracy.
in here = interpolation
Actual data points from experiment
Predicting in dotted regions = extrapolation
Figure 1.19 A scatterplot showing a line of best fit. Predicting the time taken for the reaction to start with an acid concentration of 2.5 mol L−1 (shown in dark red) would be considered interpolation, and the prediction should be reliable. Predicting outside the original data set using the dashed region of the line of best fit is extrapolation. This gives a less reliable prediction. An example would be predicting the time taken for an acid concentration above 3 mol L−1 (shown in green).
1. Determine the mean, median, mode and range of the following dataset: 10.2, 21.0, 18.5, 18.6, 10.2, 10.4, 16.7, 17.5
2. State whether interpolation or extrapolation is more reliable.
Understanding
3. Describe the type of data that would best be represented in a bar or column graph.
4. Describe one difference between a histogram and a column graph.
Applying
5. Classify this experimental data as continuous, discrete, ordinal or nominal:
a) The colour of a solution after a chemical reaction
b) The duration of a pendulum swing in seconds
6. Construct a scatterplot of the following data from an experiment that investigated the stretch in a spring with increasing masses added.
7. Construct an appropriate graph for the following data relating to the temperature of water with each minute of heating.
Analysing
8. Compare the use of descriptive and inferential statistics.
9. State whether a correlation exists between the variables shown on the following scatterplots; classify the direction of the correlation if one exists. a) b) c)
Evaluating
10. Propose a time when it would not be appropriate to represent data on a scatterplot where the x and y axes intersect at (0, 0). a) b) c)
Culturally responsive learning from and connecting respectfully with Aboriginal and Torres Strait Islander people from different language groups and communities; building strong, meaningful and collaborative relationships that value their knowledge and cultures
At the end of this section, I will be able to:
1. Communicate research findings effectively based on analysis of evidence.
The aim of scientific research is to validate knowledge and generate new understandings. However, it is essential that we critically reflect on the scientific process and consider the validity of our data before forming conclusions that may be inherently biased or based on assumptions.
As a student, you will present your research findings in structured practical reports. For professional scientists, they need to tailor their communication methods and styles to reach broad audiences and share their reasoned conclusions. They must also consider the work of the scientists who have come before them, including the invaluable contributions of Aboriginal and Torres Strait Islander Peoples, ensuring their engagement is respectful, collaborative, and culturally responsive
As part of your secondary school science studies, you will undertake experiments and research and present your findings in practical reports and scientific posters. These differ in terms of detail and depth, but both are formal ways of reporting your findings and must use appropriate scientific language and accepted conventions, such as acronyms and units of measurement.
Practical reports feature structured headings that align with the steps in the scientific method:
Scientific method
Observe and ask questions
Do background research (rationale)
Define variables and state a hypothesis
Outline methodology
Collect and record the data
Analyse the data
Section of a practical report
Aim or research question
Introduction
Method (includes materials)
Results
Discussion
Evaluate the data
Form a conclusion
Conclusion
A guide on structuring a practical report follows:
The research question written as a statement.
Rationale: Summary of the background research and justification of the investigation. Ensure definitions, acronyms and relevant formulas are included to help peers understand the investigation.
Variables: Define experimental variables.
Hypothesis: State your hypothesis and/or reasoned prediction.
May include:
• Description of experimental results/ observations
• Raw data in results table
• Descriptive and inferential statistics in tables
• Graphical representation of the data, with trends clearly indicated such as line of best fit
General format:
• The claim of causation that can be made from the experiment regarding the independent and dependent variables
• The evidence from your data that supports this claim (specific data should be stated)
Title of investigation
• An explanation of whether the data supports or refutes the hypothesis
Discussion • Analysis • Evaluation
Conclusion
References (optional)
The methodology
Materials: List the scientific apparatus and materials required to conduct the experiment. Note concentration of any chemicals used.
Method: A step-by-step procedure of how the experiment was conducted, written in third-person passive voice.
Risk management: Optional Ethical considerations: Optional
• Interpret the results (tables/ graphs). Identify trends and anomalies in the data, and justify removal of outliers if necessary.
• Discuss relationship between the independent variable and dependent variable based on trends evident in the data.
• Compare results with the expected results, with reference to controlled and extraneous variables.
• Discuss limitations of the experimental design and potential sources of error.
• Suggest improvements or extensions to the method.
• Relate your findings to previous findings/research.
The discussion section of a practical report or scientific poster typically includes a section dedicated to the analysis of the data and a section for an evaluation.
The analysis of the results should make reference to the tables of raw data and representative graphs:
• Trends should be highlighted, with any possible correlations described in terms of their direction and strength.
• The relationship between the independent variable and the dependent variable should be discussed, based on these trends.
• Any anomalies in the data should be indicated, and if outliers have been removed from the data analysis process, this needs to be justified. Consider if the outlier represented a human error or an instrument error.
The evaluation should be a critical and justified discussion of the reliability and validity of the experimental process.
This involves considering the quality of your data, including:
• identifying any outliers and giving potential reasons for their appearance. Consider the possibility of random errors.
• how your results compare to expected results and previous research. Consider how well extraneous variables were controlled, and the possibility of systematic errors.
• the accuracy of your data. How closely does the line of best fit align with your data? Are the error bars large or small?
In terms of the methodology, you should discuss:
• any limitations or potential sources of error in the experimental design and how these could be improved in the future
• any problems you encountered and the impact they had on the results
• how any problems could be resolved in the future
• any extensions to the method for future use, or recommendations for future research.
The discussion in the following example relates to an experiment investigating how the acceleration of a model car was affected by the angle of the ramp it travelled down. Results were as shown:
The data indicates a strong correlation between the angle of the ramp and the acceleration of the model car. As the angle of the ramp increased, acceleration also increased, which is reflected in the decreasing times for the car to travel down the length of the ramp. At a ramp angle of 15°, the car took 0.94 seconds (on average) to reach the end of the ramp, but this decreased steadily to only 0.53 seconds when the angle of the ramp was raised to 60°. This supports the hypothesis.
There is a potential outlier for Trial 3 at a ramp angle of 45°. This data point was removed from the calculation of the mean time for this ramp angle, as it was assumed to have resulted from personal or instrument error.
The results aligned with those of other groups. While every effort was made to carefully release the car without administering a pushing force, this may not have been adequately controlled from group to group or between trials. All other variables, such as ramp surface and the condition of the model car, were adequately controlled.
A potential limitation in the experimental design was the use of manual stopwatches for recording the elapsed time. Group members may have been inconsistent in recording the ‘end’ time based on when the front of the car exited the ramp or when the back of the car exited the ramp. Differences in reaction speed may also account for variation in the trial times. This potential source of random error could be minimised by recording the trials using a camera and pausing the video to obtain a more accurate measurement of the time. This would improve the accuracy of the obtained data, and therefore the reliability.
Trend is identified. Supporting experimental data is referred to, and anomalies are identified. Reference made to whether hypothesis is supported.
Results compared with expected results; reference made to controlled variables.
Limitations of experimental design noted.
Potential source of error identified, impact on results noted and future improvements suggested.
The conclusion section of your practical report or scientific poster is where you answer the original research question and state whether your hypothesis was supported or refuted. You should start with a general statement of your findings, but then justify and support this with actual data from your results. You can also use your own scientific knowledge to explain your results. The strength of a conclusion depends on the quality of the data collection and evaluation of the trends present: the experiment must be thoroughly planned and well executed in order to yield valid data to base the conclusions upon. This is especially critical when the investigation aims to support or refute a claim.

The conclusion in this example relates to the same experiment mentioned earlier, which investigated the relationship between ramp angle and acceleration. This conclusion follows the provided framework:
From this experiment, we can conclude that as the angle of the ramp increases, the acceleration of the model car also increases. The data showed a reduction in the time taken for the car to travel along the ramp, from 0.94 seconds at a ramp angle of 15°, to 0.53 seconds at a ramp angle of 60°. This indicates greater acceleration with larger ramp angles.
a flaw in the experimental design
Make a claim regarding your experimental findings.
Support the claim by referring to your experimental observations/data.
Explain how the data supports your claim.
Research that involves human subjects is fraught with danger in terms of adequately controlling extraneous variables. There are so many factors that influence the way our bodies work and our thoughts and behaviour. How scientists recruit study participants can also be problematic, especially if the results are then to be generalised to a broader population under the assumption that the sample was representative.
A 2010 article published in the journal Behavioural and Brain Sciences claims that a significant portion of psychology literature focuses on WEIRD participants – Western, Educated, Industrialised, Rich and Democratic – yet this group is ‘among the least representative’ of all humans.

Figure 1.21 Humans are a diverse bunch! Poorly designed experiments that feature human participants may lead to flawed conclusions.
Aboriginal and Torres Strait Islander Peoples' knowledges are deeply grounded in their custodianship of Country and have been developed for at least 65 000 years through careful observation and robust experimentation. Contemporary science uses systematic methods of observation, experimentation and analysis to develop an understanding of the natural world.
Acknowledging and identifying the relationship between Aboriginal and Torres Strait Islander Peoples' knowledges and contemporary science promotes a more accurate, holistic and inclusive and collaborative approach to knowledge generation. This is known as working 'both ways' or combining Traditional knowledge with western scientific methods. When working 'both ways', it is important to recognise the value and contributions of both approaches.
When communicating Aboriginal and Torres Strait Islander knowledge, it is important to be culturally responsive and respectful, maintain cultural protocols, and avoid racist narratives, language or images. You should seek permission from the relevant Aboriginal and Torres Strait Islander Peoples before engaging with or communicating about their knowledge. Avoid stereotypes and use appropriate language. This includes being aware of the differences between different nations and languages and using the correct terminology when discussing specific cultural practices or beliefs.
Did you know? 1.3
Spinifex grass, which covers almost one-third of Australia, has long been harvested for its durable, fine nanofibers, which can be used to strengthen rubber and latex products. However, researchers have now developed a medical gel from the grass that could potentially be more effective in treating ailments such as arthritis, as well as assisting with the delivery of other drugs in both medical and cosmetic applications.
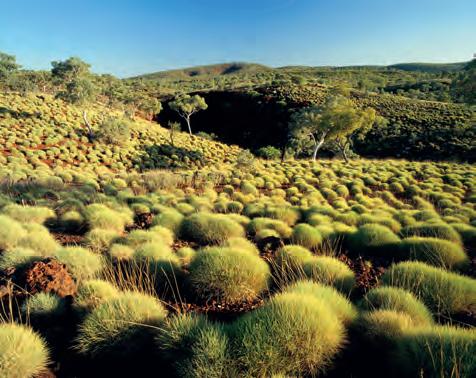
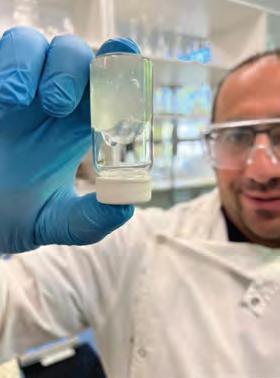
The Indigenous-owned Bulugudu organisation is the majority shareholder of Trioda Wilingi, a bioscience company based in Brisbane and affiliated with the University of Queensland. The company has secured investment from its shareholders to advance the development of medical gels using spinifex grass. The grass is harvested and processed at a laboratory in Camooweal, in the north-west region of Queensland. Only two machines of their kind are currently available in Australia to extract resins from the grass before it is transported to Brisbane for manufacturing.
Aboriginal and Torres Strait Islander Peoples have a rich history of medicinal knowledge and practices that have been developed and refined over tens of thousands of years. Their understanding of physiology and the environment continues to contribute significantly to the advancement of modern medicine.
The Wiradjuri people of central New South Wales have a history of treating respiratory illnesses by constructing steam pits heated by fire, lined with eucalyptus leaves and overlaid with possum rugs. This practice triggered Western scientists to further investigate the medicinal qualities of Eucalyptus, and they relied on Aboriginal people’s knowledge about how to formulate the plant for effective use. Modern research has shown that eucalyptus oil has antiviral and antibacterial qualities, and it is now manufactured for commercial use in the same way that the Wiradjuri people have been using it for thousands of years.
As two other examples:
• The use of emu oil as a topical anti-inflammatory has been adapted from Aboriginal knowledge.
• The Kakadu plum, which has the highest concentration of vitamin C of any fruit in the world, has been used to treat the disease scurvy. Its antioxidant properties have also been studied for their potential in cancer treatment. Aboriginal people now harvest and share the fruit for medicinal uses to the world.
Research some other plants that different groups of Aboriginal and Torres Strait Islander people use as medicine. Explore whether their use has been adapted by western science. Kangaroo apple and banksia flowers are a good place to start.

Remembering
1. Describe the process of working ‘both ways’.
Understanding
2. Outline the three key things to include in the conclusion of a practical report.
Applying
3. Explain how the analysis and evaluation sections of the discussion differ.
Analysing
4. A marine biologist counted the number of fish eggs present in coastal rockpools that were at varying distances from the shoreline. She recorded the raw data in a table.
Suggest whether the outlier is the result of a random or systematic error.
Evaluating
5. ‘Trees that receive greater rainfall will always grow taller’. Evaluate the credibility of this conclusion with reference to the student’s experimental data, shown below.
Chapter checklist
Success criteria
Linked question
1.1I can recall the steps of the scientific method 2
1.1I can develop an investigable research question 5
1.1I can identify the independent, dependent, controlled and extraneous variables in a scientific investigation 12a, 14
1.1I can construct a hypothesis to test an identified relationship 9
1.1I can plan and conduct a safe and valid experiment 4, 10
1.1I can discuss how to minimise errors through the use of technology8
1.2I can classify data types 6
1.2I can calculate descriptive statistics for a dataset 12d, 12e
1.2I can select and construct appropriate representations of data 1, 7, 11a, 12f
1.2I can analyse and connect a variety of data and information to identify and explain patterns, trends, relationships and anomalies 3, 11b, 11c, 11d, 12b, 12d
1.3I can communicate research findings effectively based on analysis of evidence 13
Review questions
Remembering
1. State the type of data that can be represented in a scatterplot.
2. List the numbered steps in the scientific method.
Understanding
3. State the purpose of extrapolation.
4. List three risk management responsibilities that might be assigned to the lead scientist in a research team.
5. Outline the five criteria that can be used to evaluate if a question is ‘investigable’.
6. Classify the following according to data type (ordinal, nominal, discrete or continuous):
a) number of bacteria in the growth medium
b) size of balloon (deflated, partially inflated, fully inflated)
c) gender of offspring
d) volume (mL)
7. Decide on the appropriate graph to use and construct one for the following data. It was obtained from a survey of the methods used to heat houses in a neighbourhood.
8. A data logger and probe are used in an experiment to track temperature changes over a 24-hour period, with readings taken every 1 minute. Explain how this digital tool reduces the chance of random errors, but how it could introduce a source of systematic error if it is poorly calibrated.
9. Construct a hypothesis regarding the speed a sound wave travels through materials of different density (solids, liquids and gases).
Analysing
10. Reflect on why an appropriate sample size is important in any scientific investigation.
11. A pathologist wanted to know the effect of adding an unknown substance X to bacteria. She conducted an experiment comparing bacterial colonies where the substance had been added and where it had not been added. She counted the number of bacterial colonies over a number of hours. The results are shown in the following table:
a) Construct a graph of the data points and draw a line of best fit for each dataset.
b) Describe the two results in terms of correlation.
c) Determine the relationship between substance X and bacterial colony growth.
d) Using extrapolation, predict the number of bacterial colonies after 10 hours if no substance X is added.
12. The table below shows the effect of changing the pH of a pond on the number of insect larvae in the pond.
a) Identify the independent variable and dependent variable of this study.
b) Identify the optimum pH for insect larvae growth.
c) Identify an outlier in the data.
d) Calculate the mean and median number of insect larvae in a pond with a pH of 7.5.
e) Calculate the range of the number of insect larvae in a pond with a pH of 6.5.
f) Construct a graph of the number of insect larvae in trial pond 1 against the pH of water. Label the axes correctly and write an appropriate title.
Evaluating
13. Justify how a scientific conclusion can be supported by evidence.
14. Read the following text.
Research has been conducted on the effect of short, daily exercise on mice and rats. The mice and rats were all exercised mildly for 10 minutes once a day. When the mice and rats exercise, it was shown that they develop more new brain cells, compared to if they do not exercise. These new cells were mostly located in or around the hippocampus, which is involved in the creation and storage of memory, improving their memory and learning abilities when tested.
Source: Gretchen Reynolds, ‘Even a 10-minute walk may be good for the brain’, The New York Times, 24 October 2018.
Using the information, categorise the following variables as independent, dependent or controlled.
a) Memory ability
b) Exercise intensity
c) Age of rodent
d) Exercise undertaken
e) Exercise duration
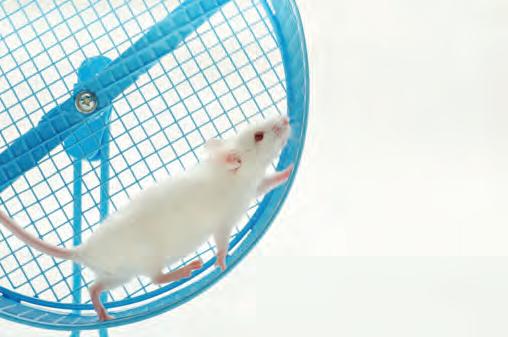
A Victorian scientist designed an experiment to show how the temperature at which water boils changes at different heights above sea level. The scientist did this by boiling water while on a hike up Mount Arthur, in Victoria’s Alpine National Park. The mountain is 1657 m high. The scientist used the same volume of water in the same beaker, the same heating apparatus and the same thermometer to measure the temperature. The results are presented in Figure 1.24.
Figure 1.24 The different temperatures at which water boils at different heights above sea level on Mount Arthur
Applying
1. Identify two controlled variables in this experiment.
2. Use the graph to determine the independent variable in the experiment.
3. Calculate the range of the data presented.
Analysing
4. Identify the trend in the temperature at which water boils, as height above sea level changes.
5. From the trend line, use interpolation to infer the temperature at which water would boil at 700 m above sea level on Mount Arthur.
Evaluating
6. Inspect the data and conclude if there are any outliers that should have been removed from the dataset prior to plotting the trend line.
7. Justify whether the linear trend line is an appropriate model for the data.
8. Extrapolate to estimate the height above sea level that would allow water to boil at 94 °C.
9. Mountains in the Alps in Europe can be twice the height above sea level of Mount Arthur. Predict the temperature that water would boil at on a 3300-m high peak in the Alps.
From a cuddly newborn, to the bacteria that colonise its gut, the survival of every species is dependent on the production of offspring. In this chapter, you will explore the benefits and disadvantages of reproducing asexually. You will contrast this with sexual reproduction, and examine how the specific structures of male and female reproductive organs (and in turn, the gametes they produce) influence their function. By studying the reproductive strategies of different organisms, we can gain an understanding of how their reproductive methods and levels of parental care are related to their complexity and environment.

Reproduction is a defining characteristic of living things, allowing species to survive
Two methods
Asexual reproduction
• Binary fission
• Fragmentation
• Vegetative propagation
• Spore formation
• Budding
• Parthenogenesis
Reproduction in plants
• Asexual: natural vs. human-induced
• Sexual reproduction in flowering plants
Sexual reproduction
Sexual reproduction in animals
Fusion of two gametes to form a zygote → embryo → development of a foetus → birth
Parental care
Section 2.1
Section 2.2
Section 2.3
Section 2.4
The human reproductive system

the structures of reproductive cells and organs in plants and animals are related to their functions; processes of sexual and asexual reproduction enable survival of a species (VC2S10U01)
• examining how the reproductive organ structures work collectively in males and females as systems
• explaining how the forms of male and female gametes relate to their specific functions2.3
• identifying and comparing sexual and asexual reproductive strategies in plants
• exploring how sexual reproduction produces a greater rate of variation among offspring compared with asexual reproduction
• examining how the reproductive strategies of multicellular animals are related to their environments and the complexity of the organisms
• examining how the number of offspring produced by animals is related to the amount of parental care
the use of scientific knowledge to address socio-scientific issues and shape a more sustainable future for humans and the environment may have diverse projected outcomes that affect the extent to which scientific knowledge and practices are adopted more broadly by society (VC2S10H03)
• researching citizen science projects related to public health and examining why people would choose to be involved
Victorian Curriculum v2.0 F–10 © VCAA 2024
Glossary terms
Asexual reproduction
Binary fission
Budding
Cloaca
Cross-pollination
Differentiation
Embryo
Embryo sac
External fertilisation
Fertilisation
Fragmentation
Gamete
Gestation
Gonad
Hormone
Internal fertilisation
Menstrual cycle
Menstruation
Ovulation
Ovule
Ovum
Parthenogenesis
Pollen
Pollination
Puberty
Scrotum
Secondary sexual characteristic
Seed
Seed dispersal
Self-pollination
Sexual reproduction
Sperm
Spore
Testes
Trait
Vegetative propagation
Mitosis
Nectar
Zygote
At the end of this section, I will be able to:
1. Describe the six methods used by animals, plants and microbes to asexually reproduce.
Reproduction is the biological process by which living things produce offspring. There are two main types of reproduction: sexual and asexual. Sexual reproduction involves two parent organisms, and results in offspring with genetic variation. Humans and most other animals reproduce through sexual reproduction, creating diversity in their offspring.
In contrast, asexual reproduction involves only one parent organism and results in offspring that are genetically identical to the parent. This type of reproduction is common in singlecelled organisms, such as bacteria and amoebas, but can also be undertaken by plants and animals under certain circumstances. Asexual reproduction is a highly efficient way of reproducing because it does not require the involvement of another organism, and every organism is capable of reproducing.

2.1 A stained transmission electron micrograph of the bacterium Escherichia coli, undergoing binary fission, a type of asexual reproduction in which a cell splits into two identical individuals.
There are biological advantages to asexual reproduction, particularly for organisms that are geographically isolated or have limited mobility. It can be beneficial because:
• the process requires less energy than sexual reproduction and is typically faster, leading to rapid population growth
• the organism expends less energy and does not waste time on trying to find a suitable mate
• offspring are clones of the parent organism, so beneficial traits can be passed on.
If the parent organism is well adapted to the environment, then passing on successful traits to the next generation of genetically identical organisms is a good thing. However, there are also disadvantages to asexual reproduction. If environmental conditions change or a disease is introduced that the organisms are susceptible to, the lack of genetic variation places the species at risk of extinction. Conversely, the rapid population growth often associated with asexual reproduction can lead to overcrowding and competition.
Did you know? 2.1
the irish potato Famine (1845)
In Ireland, during the harsh economic climate of the mid-nineteenth century, potatoes accounted for up to 80% of a typical person’s daily energy intake. Over-reliance on growing several high-yielding potato varieties greatly reduced the genetic variation present in the crops, and left them susceptible to late blight, a disease caused by a water-borne mould. Over the period 1845–1849, blighted potato crops rotted in the field, leading to widespread starvation in Ireland and the deaths of over one million people.

Figure 2.2 A rotting potato, infected with late blight
reproduction a method of reproduction that involves two parent organisms and results in genetic variation in the offspring asexual reproduction a method of reproduction in which a single parent produces offspring genetically identical to itself trait a characteristic belonging to an individual; under genetic control (although the environment may have an influence)
binary fission a type of asexual reproduction in which the cell divides, creating two identical cells; the most common form of reproduction in prokaryotes, such as bacteria fragmentation a type of asexual reproduction in which a parent organism splits into multiple fragments, each of which can potentially develop into an independent individual
vegetative propagation a form of asexual reproduction in which only one plant is involved
The six types of asexual reproduction discussed below all involve the replication and division of a single parent cell into two genetically identical copies. The mechanisms of growth vary and are tailored to suit the structure of the organism and the environmental conditions it exists within.
Binary fission is a type of asexual reproduction and is used by many single-celled organisms, such as bacteria and protozoans. In binary fission, the genetic material within the parent cell is replicated, and then the cell elongates and constricts at the centre. This causes the cell to divide into two genetically identical daughter cells, each containing a copy of the genetic material (see Figure 2.3). Binary fission is a rapid process and enables the organism to produce large numbers of offspring quickly.
Fragmentation is a form of asexual reproduction in which an organism splits into several fragments, each of which can grow into a new individual. This mechanism of reproduction is observed in certain multicellular organisms such as flatworms and sea anemones.
In fragmentation, the parent organism breaks into two or more fragments, each of which contains a portion of the parent's body, including its organs and tissues. These fragments can then regenerate missing parts and develop into complete, independent individuals over time.

Plants may reproduce asexually via a process called vegetative propagation (also called vegetative reproduction), which involves the growth of specialised tissue, such as runners, tubers or bulbs, from the roots or shoots of the plant. These growths can potentially break off from the parent plant and develop into an independent, but genetically identical, organism. In this sense, it is similar to fragmentation. If you have ever taken a cutting from a plant and grown it in a new location, this is a form of vegetative propagation. This is explored in further detail in Section 2.4 Plant reproduction.


Fungi and some plants, such as ferns, produce single-celled spores, which are released into the environment. The spore is a clump of unspecialised cells surrounded by a protective coating. These spores are carried by the wind to a new location. If conditions at the new location are favourable, the spores germinate and grow into new individuals that are genetically identical to the parent. Note that spores can be formed by sexual or asexual reproduction.

Budding is a type of asexual reproduction in which a new genetically identical individual grows as an outgrowth or bud from the parent organism. This process is commonly observed in simple organisms such as hydra (tiny freshwater organisms) and yeast.
In budding, the new individual develops as a smaller version of the parent organism and remains attached to it until it is fully formed. The bud grows until it reaches a certain size, then detaches from the parent organism to become a separate individual (see Figure 2.9).

formation can provide a means of survival in harsh environments. For example, a fungus can produce spores that remain dormant until conditions become favourable for growth.

spore a reproductive body, produced by fungi and some plants, that develops into a new individual budding a type of asexual reproduction, used by organisms such as yeast and hydra; involves the daughter offspring growing off the side of the parent and then dropping off
parthenogenesis
a type of asexual reproduction in which an egg develops into an embryo without being fertilised by a male gamete
Parthenogenesis comes from the Greek words for 'virgin birth' and is a form of asexual reproduction in which an egg develops into an embryo without being fertilised by a male gamete. Most animals that reproduce by parthenogenesis are invertebrates, such as bees, wasps, ants and aphids. These species can switch between sexual and asexual reproduction. However, parthenogenesis has also been documented in more than 80 vertebrate species, with about half of these being lizards or fish.
Egg cells contain half of the mother's genetic material, but when they are formed, a smaller cell is produced as a by-product that also contains some of the mother's genetic material. In one form of parthenogenesis, the gamete and smaller by-product cell merge. This slightly shuffles the genes, so the offspring are similar, but not genetically identical, to the mother.
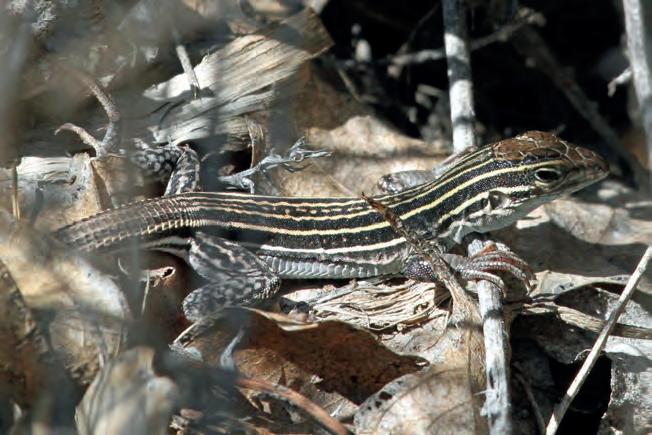
Did you know? 2.2
Offspring produced by parthenogenesis in species that have the XY sex-determination system usually have two X chromosomes, resulting in a female offspring. In species such as birds or Komodo dragons that have the ZW sex determination system, the ZW mother is capable of reproducing via parthenogenesis and creating either ZZ (male) eggs or ZW (female) eggs. The female eggs are not viable, hence all the Komodo dragon hatchlings born this way will be exclusively male.
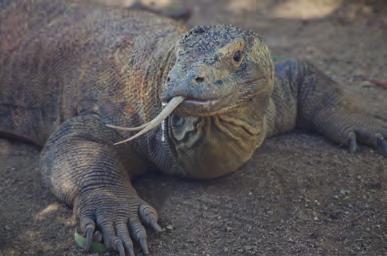
Occasionally, certain animals such as aphids can give birth to male offspring that are fertile and genetically identical to their mother, except for the absence of a second X chromosome. Although these males are typically capable of reproducing, their sperm only contains X chromosomes, resulting in the production of exclusively female offspring.
assign tasks and track results
Remembering
1. List the six forms of asexual reproduction, and give an example of an organism that reproduces by each method.
2. Recall how many parent organisms are required for asexual reproduction. Understanding
3. Explain why it could be advantageous for an organism to reproduce asexually.
4. Explain how a flatworm that has been surgically cut in half can regenerate into two organisms.
Applying
5. A bacterial cell undergoes binary fission every 20 minutes. After an hour, calculate how many cells would be present in the Petri dish.
6. Outline the effects that reproducing asexually has on the genetic variation in a population.
Analysing
7. While exploring a rockpool, a child comes across two sea stars (as shown) and exclaims ‘A Mum and a baby!’. Deduce which type of asexual reproduction has occurred based on the appearance of the sea stars.

8. Propose why organisms produced from asexual reproduction are referred to as clones.
Go online to access the interactive section review and more!
9. A fellow student suggests that asexual reproduction is only used by very basic organisms, such as bacteria and single-celled parasites. Justify why this student is incorrect by referring to some multicellular organisms and the types of asexual reproduction they employ.
10. A new species of lizard is discovered, and a zoologist captures a female of the species. One year later, the lizard lays eggs that hatch into many female lizards. Determine the method of reproduction she has used.
WORKSHEET
At the end of this section, I will be able to:
1. Describe how sexual reproduction creates a greater rate of variation among offspring than asexual reproduction does.
2. Describe how the reproductive strategies of multicellular animals are related to their environment and the complexity of the organism.
3. Describe how the number of offspring produced by animals is related to the amount of parental care.
gamete a sex cell (egg or sperm); contains half the genetic material required to make an organism gonad the reproductive organ where gametes are produced; testis in males and ovary in females
fertilisation
the fusion of the male and female gametes (sperm and egg)
zygote a fertilised egg cell
embryo a fertilised egg cell in the early stages of growth and differentiation; in humans, 2–8 weeks after fertilisation
You will recall that sexual reproduction combines the genetic input from two parents to create a new, unique organism that is not identical to either parent. This is the method used by humans, most animals and many plants. While sexual reproduction costs the organism time and energy, the benefit is that it creates diversity in the population.
Sexual reproduction involves the fusion of two gametes (sex cells containing half the normal amount of genetic information) – one from each parent. Gametes are specialised cells produced by the gonads, which are the reproductive organs. In males, the gonads are the testes, while in females, they are the ovaries.
During sexual reproduction, the male gamete, or sperm cell, and the female gamete, or egg cell, unite in a process known as fertilisation to form a zygote (see Figure 2.12). The zygote contains the complete set of genetic material necessary to form a new organism of the same species (23 chromosomes from the egg cell and 23 chromosomes from the sperm cell, in humans). The zygote then undergoes cell division and develops into an embryo (see Figure 2.13).
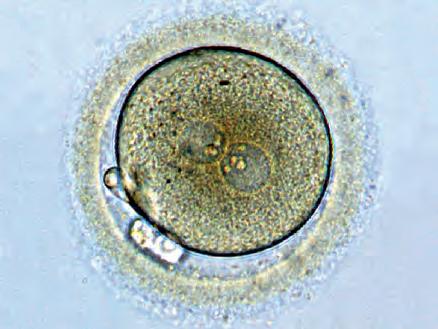

1. Define:
a) sexual reproduction c) gonads e) embryo.
b) gametes d) zygote
2. Compare and contrast sexual and asexual reproduction.
3. Recall the number of parents involved in asexual and sexual reproduction.
4. Name the female gonads and gametes and the male gonads and gametes.
Did you know? 2.3
Attracting a mate is essential in sexual reproduction. Many animals, such as birds, use elaborate and impressive courtship rituals to signal to the opposite sex that they are ready to mate. Rituals include:
• behavioural adaptations, such as special mating calls (songs) and dances
• physical adaptations, such as special feathers and colour patches
• physiological adaptations, such as releasing hormones called pheromones to attract a mate.
Bowerbirds are known for their unique and elaborate mating rituals. One aspect of these rituals is the use of colour to attract mates. Male bowerbirds create intricate displays called bowers, which they decorate with various objects such as leaves, flowers and feathers. One popular decoration is the colour blue, which is known to be attractive to female bowerbirds. Male bowerbirds will gather blue objects such as flowers, feathers and even bottle tops and wrappers to decorate their bowers, in the hopes of catching the attention of a female.
In general, more complex organisms tend to have more intricate and varied reproductive strategies, which may involve specific courtship behaviours and elaborate mating displays. These strategies are often shaped by the selective pressures of the environment, such as competition for mates and access to resources.
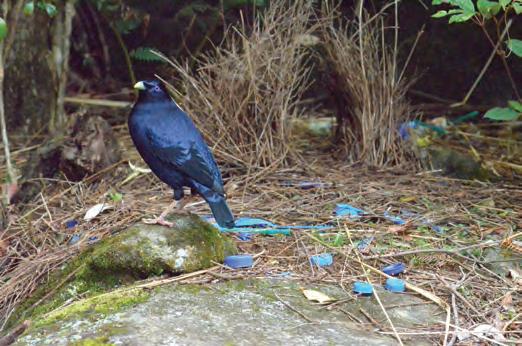
internal fertilisation
a method of fertilisation in which male gametes are delivered into the female reproductive system and fertilisation takes place inside the female external fertilisation
a method of fertilisation in which gametes are released into the environment and fertilisation occurs outside the body
Fertilisation can occur inside an organism or in the external environment. Internal fertilisation is the method of fertilisation in which male gametes are delivered into the female reproductive system and fertilisation takes place inside the female. This is the method of fertilisation of most animals living in a terrestrial environment, because it protects the gametes and zygote from drying out.


2.16 Internal fertilisation allows reproduction to take place on land without gametes drying out.
External fertilisation typically occurs outside the parent animals and is commonly observed in organisms that live in an aquatic or semi-aquatic environment, such as amphibians and fish. This method of fertilisation requires eggs and sperm to be expelled from the organisms' bodies, to then be united in water.
One potential problem with external fertilisation is that the eggs and sperm may not meet, due to either being eaten by predators or unfavourable environmental conditions, such as strong currents. Consequently, organisms that rely on this method of fertilisation have evolved to produce large quantities of eggs and sperm cells, which are released simultaneously and near each other.
1. Define: a) internal fertilisation b) external fertilisation.
2. State the type of fertilisation that occurs in mammals.
3. Describe some advantages of internal fertilisation and some disadvantages of external fertilisation.
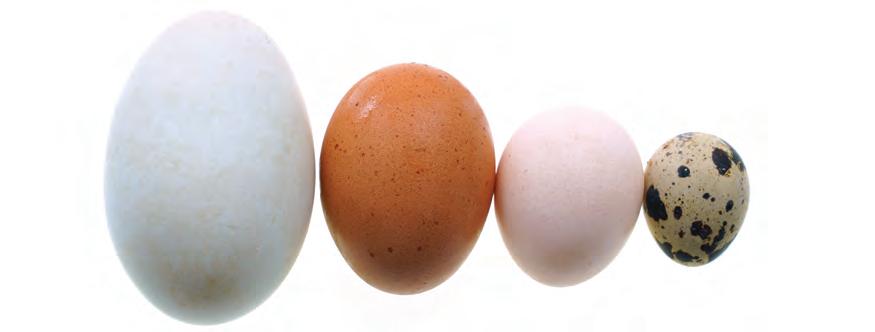
Assisted reproduction to save endangered species
In 2023, scientists achieved a world-first successful embryo transfer in a southern white rhino. Although this technique is widely used in humans and domestic animals, it was the first time it had been used in rhinos. The transfer relied on the development of completely new methods, protocols and equipment specifically designed to implant an embryo through the digestive tract of the two-tonne rhino. The embryo was created using an egg from a female southern white rhino from a zoo in Belgium. The egg was then fertilised in a laboratory with sperm from a male in Austria, and implanted into a surrogate female in Kenya. Tragically, this female died from an unrelated infection, but the foetus had been developing well until that point.
This has given scientists hope that the technology could be applied in a bid to save the closely related northern white rhino, a sub-species that is considered functionally extinct since only two infertile females remain alive. Prior to the deaths of the last male northern white rhinos, sperm was collected and used to create 30 embryos. However, due to the age and health of the two remaining females (who are kept under tight security at a facility in Kenya), the northern white rhino embryos would need to be implanted into the womb of a southern white rhino surrogate. The team from Biorescue, a German group aimed at fighting species extinction, are confident that transferring the embryo into a different sub-species will work.
Yet researchers admit that even if successful, this technique alone will not be sufficient to save the species. Since the 30 frozen embryos were all created from the eggs of one of the living females, there would not be enough genetic diversity to produce a viable population. The team is also exploring experimental techniques, such as producing northern white rhino sperm from stem cells and gene editing, to create more diversity in the embryos and save the northern white rhino.
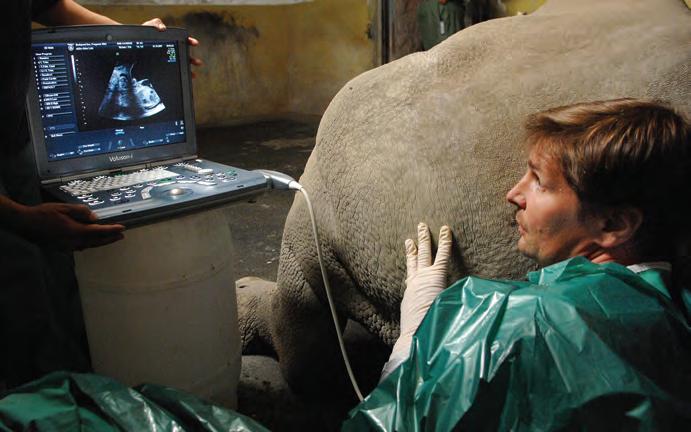
Consider the ethical concerns around using these advanced reproductive techniques to save the northern white rhino. For example, some people would argue that we are using the technology to fix an undesirable outcome of human activity (species extinction) when we should be addressing the underlying causes, such as habitat loss and hunting.
1. Do humans have the right (or the responsibility) to intervene and save this species, or should we accept the end of the evolutionary line for the northern white rhino?
2. If saving the species is dependent on gene editing (changing the species genetically) are we really conserving the same species at all?
3. Would the same efforts be made for a species that was not so widely known and popular?
gestation the pregnancy period, when offspring are developing inside the mother
Gestation refers to the period during which offspring develop inside the mother's body until they can survive outside the body. This is commonly known as 'pregnancy'. Gestation typically lasts about 280 days (approximately 9 months) in humans, but varies among different mammalian species. More complex organisms tend to have longer gestation times.

years!
Did you know? 2.4
Mice are prolific breeders, with a gestation period of 19–21 days. A female mouse can produce 5–10 litters a year, with each litter ranging from three to 14 pups. On average, a litter contains 6–8 pups, resulting in a potential output of at least 32–56 pups annually from a single female mouse. Moreover, mice have a rapid reproductive cycle, with the mother capable of mating again immediately after giving birth. The offspring can start reproducing as early as six weeks old and can have up to 10 litters a year themselves. One mathematician estimated that in a perfect world for mice, just two initial mice could result in a total of five million mice being produced in a year.
This quick gestation time plays a significant role in creating mouse plagues; that is, an explosion in the mouse population. This phenomenon only occurs in China and Australia and can have a devastating impact on agriculture, natural ecosystems and public health.
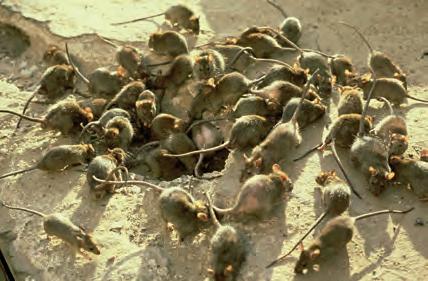
In humans, the time from fertilisation to birth is about 38 to 40 weeks. The baby's due date is calculated based on the first day of the last known menstrual period (see Section 2.3), but it is not always accurate. All babies develop via the same sequence of developmental stages; however, only 5% are actually born on their due date.
The unfertilised egg is released from the ovary and travels along the fallopian tube towards the uterus (see Figure 2.21). There is a 12–24-hour period in which the egg can unite with a sperm cell and become fertilised after it has been released. Once fertilised, the egg is referred to as a zygote.

mitosis a process in which a single eukaryotic cell divides into two identical daughter cells differentiation the process by which cells become specialised
Days 6–12 Embryo starts implantation Ovary Fallopian tube
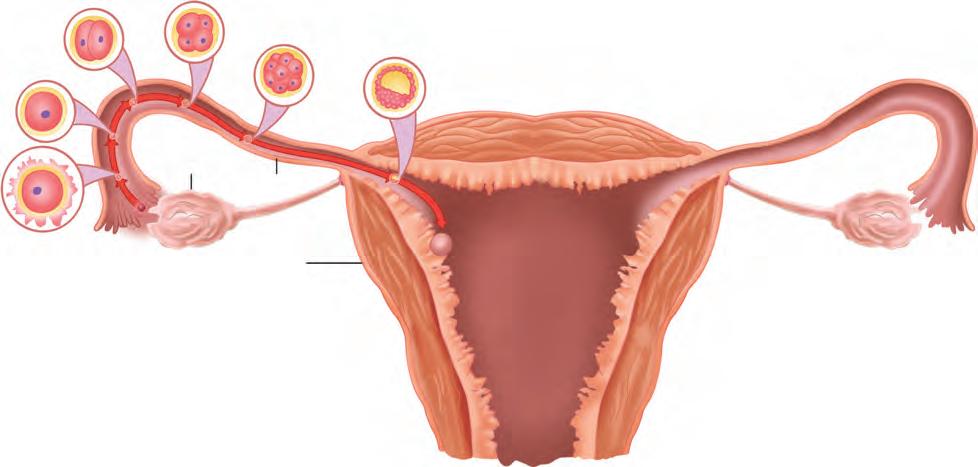
Embryonic stage
During the embryonic stage, which spans from week 2 to week 8, the cells of the developing embryo divide extensively and undergo differentiation into various types of cells, including neurons, liver cells and skin cells. This period of differentiation is a crucial phase in human development. During this time, the embryo is highly vulnerable to the negative effects of alcohol, disease and drugs, which can cause birth defects, such as limb abnormalities, or hinder the proper growth of the brain. Although all major organs are formed by the eighth week, they are not yet fully developed at this stage.
Foetal stage
From approximately week 8 until birth, the foetal stage of development takes place. This is characterised by a period of accelerated growth, during which the organs become fully developed and functional. During this stage of development, the foetus is still susceptible to the effects of alcohol, disease and drugs.
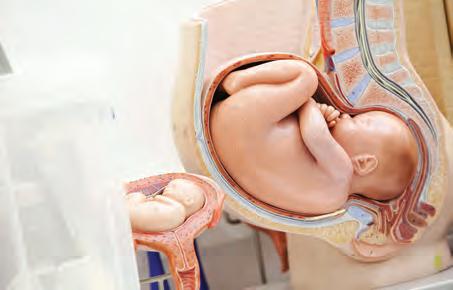
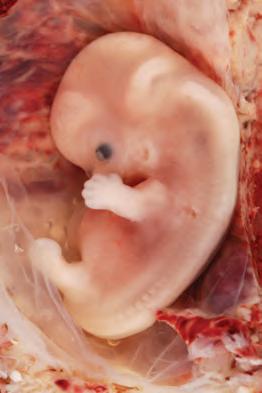
investigating gestation and development
How much time does it take different animals to develop from an embryo to infant form? Conduct some research to answer the question and then copy and complete the following table.
Animal Gestation period Time until they can walk/move Time relying on parent for food Average lifespan
Human 280 days
Dog
Giraffe
Choose your own animal
ivy Ai
Australia has developed an artificial intelligence system that is used to predict the likelihood of a viable pregnancy from transfer of a single embryo to a woman undergoing in-vitro fertilisation (IVF). IVF is a fertility treatment procedure where eggs are removed from a woman’s ovaries, fertilised with sperm in a laboratory, and then transferred back into the woman’s uterus to try to achieve a successful pregnancy.
The artificial intelligence system is called ‘Ivy’ and it uses data from previous IVF cycles to predict the probability of a successful pregnancy based on various factors, such as a woman’s age and body mass index (BMI) and the quality of the embryo. Ivy AI was trained on data from more than 24 000 IVF cycles, and it uses machine learning algorithms to analyse and identify patterns in the data.
The system provides a personalised prediction of the likelihood of pregnancy for each patient, which can help doctors and patients make more informed decisions about how many embryos to transfer. The goal is to maximise the chances of a successful pregnancy while minimising the risk of multiple pregnancies, which can be associated with complications for both the mother and the babies.
The use of Ivy has reduced the number of multiple pregnancies and led to a higher success rate for single embryo transfers. This not only improves the chances of a healthy pregnancy but also reduces the costs associated with multiple cycles of IVF.
Conduct some research to determine how assisted reproductive technologies have become widely used since their initial development.
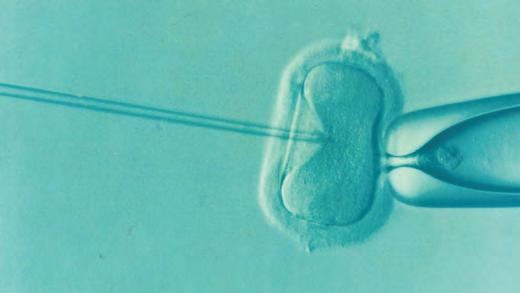
Quick check 2.3
1. Define ‘gestation’.
2. Recall the length of the gestation period in humans.
3. Copy and complete the following table to summarise the stages of embryonic development in humans.
Stage
Egg to zygote
Zygote to embryo
Embryonic stage
Foetal stage
The onset of birth remains somewhat of a mystery. A complex cascade of hormones and interactions between mother and baby results in the beginning of labour, which can last from a few hours to several days. During labour, the cervix thins and dilates, and the uterus contracts to facilitate the delivery of the baby through the vagina, usually head first. Complications can occur due to the positioning of the baby or medical issues. For example, a baby may present as 'breech', which means it is positioned to come through the vagina feet first. In medical emergencies, a surgical procedure known as a caesarean section (C-section) may be required. This involves making an incision across the mother's abdomen and removing the baby in an operating theatre.
Duration
Description
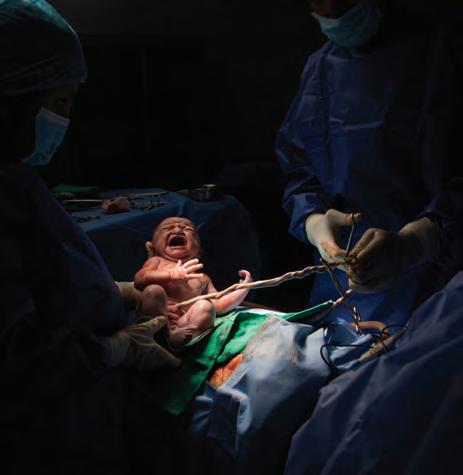
During gestation, babies receive nutrients and oxygenated blood from the maternal placenta, via the umbilical cord. This is also how wastes are removed from the foetal bloodstream. When the baby emerges and takes their first breath, their respiratory system takes over, and previously fluidfilled lungs begin to exchange gases and absorb oxygen into the bloodstream. The umbilical cord is typically clamped and cut once it is no longer pulsing and has gone pale. The final stage of labour involves the mother delivering the placenta.
Like humans, most other mammals undergo internal development, where offspring develop within the uterus and receive direct nourishment from the mother via the umbilical cord. Baby mammals tend to be born generally resembling the adult organism, only smaller.
However, two sub-classes of mammals undergo a different pattern of development.
Monotremes, such as the platypus, are egg-laying mammals. Marsupials, such as kangaroos, give birth to extremely underdeveloped young, which must make their way through the mother's fur from the vagina to the pouch, where they attach to a nipple and continue to develop (see Figures 2.26 and 2.30). Offspring of birds, reptiles, amphibians and insects typically undergo external development outside the mother's body. They develop within a waterproof egg and hatch when they are developed enough to survive in their environment.
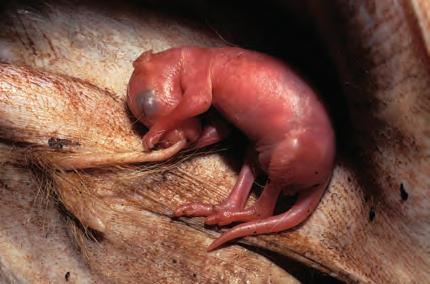
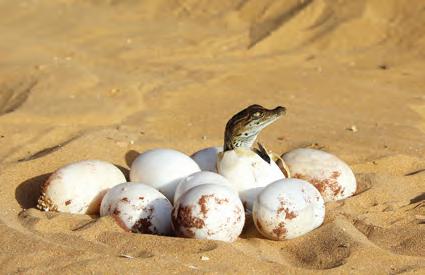
A defining characteristic of mammals is that they feed their offspring milk. Newborns placed skin-to-skin on their mother’s chest will instinctively crawl upwards and root around with their mouths to locate the nipple, looking for their first breastfeed. The golden-yellow early milk they receive is called colostrum. It is produced in small quantities but is rich in nutrients, antibodies and growth factors, to help colonise the baby’s gut with beneficial bacteria and build their immune system.
Throughout your life, you have been nurtured by adults. But not all living beings provide parental care to their offspring. Many organisms do not look after their young after laying eggs. For instance, after laying their eggs on the beach, female turtles return to the ocean and do not provide any further care to the eggs or hatchlings. The eggs are left to develop on their own in the sand, and once the hatchlings emerge, they must fend for themselves and make their way to the ocean to start their lives.
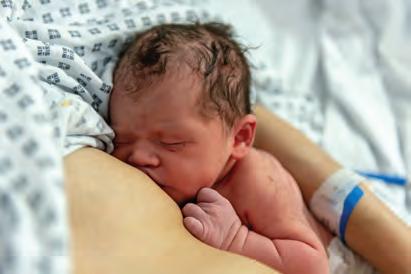
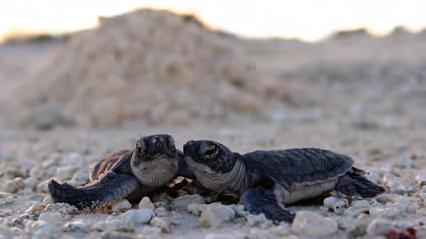
2.29 Organisms that do not provide parental care frequently produce a large quantity of eggs, which increases the likelihood of some offspring surviving predators, disease and competition and reaching adulthood. Approximately 1 in 1000 turtle hatchlings survives to adulthood.
The amount of parental care provided by animals is generally inversely related to the number of offspring they produce. Species that produce few offspring typically invest a lot of time and resources into each offspring, providing extensive parental care to ensure their survival. In contrast, species that produce many offspring, such as the turtle, generally provide minimal parental care, because the sheer number of offspring increases the chance that some offspring will survive.

dr Helen mayo
Dr Helen Mayo was an Australian doctor and social reformer who dedicated her life to improving the health and welfare of women and children. She was the second woman to gain a medical degree from the University of Adelaide, but she is best known for her work in reducing infant mortality rates in South Australia in the early twentieth century. The practices adopted by society based on Dr Mayo’s research and recommendations caused the infant mortality rate to decline rapidly. Dr Mayo’s work had a lasting impact on public health in Australia, and her recommendations for improving infant care and nutrition are still widely used today.
Conduct some research to discover the recommendations that Dr Mayo made that led to a significant reduction in infant mortality rates in South Australia.
While octopuses do not undergo pregnancy, they do lay eggs, albeit in an unusual manner. During mating, male octopuses use specialised arms known as hectocotyli to transfer packets of sperm to the female. The female can retain the sperm for later use when fertilising her approximately 200 000 eggs. After fertilisation, she proceeds to lay the eggs, either suspending them near her den or attaching them to the sea floor. Unusually for an animal that lays so many eggs, the female displays intense care towards her eggs, continually fanning water over them to provide aeration and protect them from harm.
Section 2.2 review
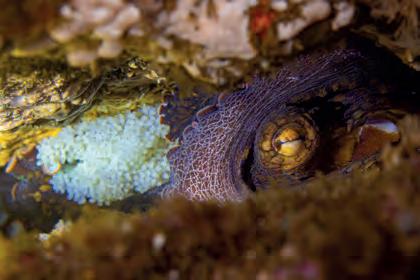
Section 2.2 questions
Remembering
1. Recall the two types of reproduction.
2. State the two cells that are required for sexual reproduction.
3. Define ‘gamete’.
4. Recall where gametes are made.
Understanding
5. Explain why an aquatic animal can use external fertilisation more easily than a land-dwelling animal can.
6. Summarise the benefits of internal fertilisation.
Applying
7. Explain why it could be advantageous for an organism to reproduce sexually.
8. Describe the differences between internal fertilisation and external fertilisation.
Analysing
9. Distinguish between sexual reproduction and asexual reproduction.
10. Connect methods of fertilisation with methods of embryo development, in relation to where they take place – internally or externally. Include examples. Consider why for an animal a particular method of fertilisation might not go with a particular method of embryo development.
Evaluating
11. Construct a short timeline of the human gestation period. Ensure you include the terms ‘egg’, ‘zygote’, ‘embryo’ and ‘foetus’
12. Many courtship displays demonstrate a male individual’s strength through physical feats, or their health through the vibrancy of their colourings. Discuss why this would be useful information for the female. Online quiz
At the end of this section, I will be able to:
1. Examine how the male and female reproductive organ structures work collectively as a system.
2. Describe how the forms of male and female gametes relate to their specific functions.
As previously discussed, humans rely on internal fertilisation to sexually reproduce. Male and female reproductive organs are structured in a way that facilitates this process. While these organs share similarities (such as the production of gametes in the gonads), their physical structures and hormonal systems are vastly different.
NOTE
It is important to note that this chapter uses the terms 'male' and 'female' to indicate biological sex. This is different to, and independent of, gender, which refers to the socially constructed roles, behaviours, expressions and identities of people, which can vary widely.
The female reproductive system supports the production and transport of eggs, as well as the growth and development of a fertilised egg ovum into a foetus during pregnancy (see Figure 2.33).
Fallopian tube
Carries the ovum from the ovary to the uterus
Ovary
After puberty, an ovum is released from here once every month
Cervix
The opening at the top of the vagina, leading to the uterus
Uterus
If an egg is fertilised, it will implant into the wall of the uterus (endometrium) and develop into a foetus
Vagina
Connects the cervix to the outside of the body; sperm is deposited here
The male reproductive system consists of several organs and structures that work together to produce, store and transport sperm (see Figure 2.34).
Bladder
Holds urine for excretion
Prostate
Gland that releases an alkaline liquid that helps to neutralise the acidic conditions of the vagina
Seminal vesicle
Gland that releases a liquid that mixes with the sperm to form semen
Sperm duct (vas deferens)
A tube that transports sperm from the testes to the penis
Testes
Contains erectile tissue and the urethra
Urethra
Tube through which semen and urine leave the body Penis
After puberty, produce sperm continuously for the remainder of the male’s lif
Sperm (inside the testes)
The male gamete; adapted to swim into the fallopian tube to fertilise an egg
Scrotum
A protective sac of skin that holds the testes and responds to changes in temperature
WORKSHEET
Human reproductive organs DOC
ovum egg, or female gamete
puberty the time of transition from juvenile form to adult form
2.33
The female reproductive system
Figure 2.34 The male reproductive system
ovulation the release of an ovum (egg) from the ovary into the fallopian tube menstruation the cyclical shedding of the uterine lining; also known as the menstrual period
sperm the male gamete testes the male reproductive glands that produce sperm scrotum a sac that encloses the testes
The forms of female and male gametes are adapted to their specific functions. They both contain half the amount of genetic material as body cells. This is important for sexual reproduction, as when a sperm and egg meet during fertilisation, the resulting zygote will have the normal number of chromosomes.
An egg or ovum is large and immobile. The larger size allows for the storage of nutrients and proteins required for the early stages of embryonic development. An egg also has a protective coat to prevent multiple sperm from fertilising it. At birth, females typically have from one million to two million eggs stored in their ovaries, enclosed in small sacs called follicles. However, many of these eggs will naturally deteriorate before they reach puberty.
Once they reach this stage, one egg is released from the ovaries into the fallopian tube each month in a process known as ovulation. If this egg remains unfertilised, the uterine lining is shed, along with the remains of the egg, resulting in menstruation
After reaching puberty, males begin to generate sperm in their testes, which are held in a sac known as the scrotum, located outside the body. This area remains approximately 2–3°C cooler than core body temperature; this temperature is best suited for efficient sperm production.
Sperm are smaller and more streamlined in shape than eggs. The streamlined shape of a sperm enables it to move quickly and efficiently through the female reproductive tract to reach the egg. It also has a long, whip-like tail or flagellum that enables it to swim (see Figure 2.35b). The midpiece of the sperm contains many mitochondria, which provide energy for the sperm to swim. The sperm also has a sac of enzymes in its head, which helps it to penetrate the egg membrane. Unlike eggs, sperm are continuously produced in large quantities throughout a male's life.
1. Identify where eggs are released from and what structure they are released into.
2. Describe what happens when an egg is released but not fertilised.
3. Recall what the vas deferens is.
4. Draw up a table to summarise the parts of the female and male reproductive systems and their function.
Try this 2.1
modelling fertilisation
Construct a model or a diagram showing the structures of the female reproductive system and the process of fertilisation (from ovulation until the zygote implants in the uterine wall).
During their early stages of life, all animals undergo a process of transformation from their juvenile form to their adult form, which is facilitated by various hormones that control and regulate different processes in the body. This process is commonly referred to as puberty.
In humans, puberty generally occurs later than in other animals. People who have ovaries usually go through puberty at 9–14 years, whereas people who have testes go through puberty at 12–16 years. The timing of puberty varies among individuals, and this variation is normal. In both sexes, the production rate of growth hormone (GH) doubles during puberty, causing individuals to grow taller.
The hypothalamus, a part of the brain, produces gonadotropin-releasing hormone (GnRH), which stimulates the pituitary gland to release two important hormones called luteinising hormone (LH) and follicle-stimulating hormone (FSH).
In people who have ovaries, LH and FSH produced in response to the production of GnRH are responsible for triggering the production of oestrogen and progesterone in the ovaries. Oestrogen is responsible for the development of secondary sexual characteristics such as breasts, wider hips, and pubic and underarm hair (see Figure 2.36).
In people who have testes, LH and FSH are responsible for triggering the production of testosterone in the testes. Testosterone is responsible for the development of secondary sexual characteristics such as facial and body hair, a deeper voice and larger muscles. The increase in testosterone levels during puberty also leads to the enlargement of the testes, scrotum and penis.
Deepening of voice
Growth of underarm hair
Growth of body and facial hair
Muscle development
Enlargement of testes, scrotum and penis
Widening of hips
Growth of pubic hair
Figure 2.36 Secondary sexual characteristics in puberty
hormone a chemical messenger secreted by endocrine glands that controls and regulates different processes in the body secondary sexual characteristic any physical characteristic developing at puberty that helps distinguish different reproductive systems but is not directly involved in reproduction
menstrual cycle a cycle controlled by hormones to prepare a female body for fertilisation of an egg; if fertilisation does not occur, menstruation will follow
Did you know? 2.7
During puberty, hormonal changes in the body can lead to body odour and acne. Body odour is caused by the apocrine sweat glands, which are in the armpits and groin. These glands produce a thick, oily sweat that can have a strong odour when it mixes with bacteria on the skin’s surface. During puberty, hormones stimulate the apocrine sweat glands to produce more sweat, leading to increased body odour.
Hormones also stimulate the sebaceous glands in the skin’s pores to produce more sebum, an oily substance that helps keep the skin moisturised. However, excessive production of sebum can clog the pores, and acne can result.

Figure 2.37 Some unpleasant side effects of puberty are body odour and acne.
Hormones also control the menstrual cycle, which usually lasts about 28 days (see Figure 2.38).
cycle
Anterior pituitary hormones
Ovarian hormones
Lining of the uterus
Luteinising hormone (LH)a
Follicle-stimulating hormone (FSH)
Progesterone
Menstruation
Follicular phase
0 days7 days14 days
Ovulation
The cycle repeats every 28 days Oestrogen
Luteal phase
Menstruation
28 days
Figure 2.38 The link between the different hormones in the female reproductive system and the action of the follicles. After the follicle releases an egg, it is known as the corpus luteum
1. The pituitary gland in the brain releases FSH.
2. FSH causes one of the eggs in an ovary to mature. It also stimulates the ovaries to make oestrogen.
3. Oestrogen stimulates the pituitary gland to release LH.
4. LH triggers the release of an egg (ovulation).
5. Oestrogen also inhibits further production of FSH (stopping other eggs from maturing). It also repairs the uterine lining (endometrium).
6. Once the egg has been released, progesterone is produced by the empty follicle (called the corpus luteum or yellow body). This maintains the uterus lining and inhibits LH.
a) If pregnancy occurs, the follicle continues to produce progesterone and a placenta is formed.
b) If pregnancy does not occur, then the corpus luteum stops secreting progesterone and decays into the corpus albicans (whitening body). As a result, the progesterone and oestrogen levels drop towards the end of the menstrual cycle, the uterine lining breaks down and menstruation occurs.
Humans have separate openings for different bodily functions: an anus and a urethra to excrete waste, and a separate opening for reproduction. But not all animals are like that. In fact, it is much more common to have a single opening that does all of the above. This organ is called the cloaca and it is found in amphibians, reptiles, birds, some fish and even monotremes. This is why it can sometimes be tricky to distinguish between the sexes of certain animals. For example, birds mate by pressing their cloacas together in a process known as a ‘cloacal kiss’, where muscular undulations move the sperm from the male to the female. Did you know? 2.8
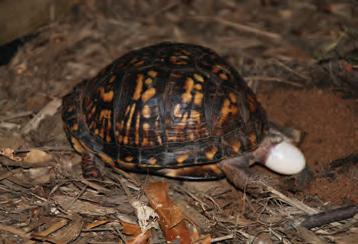
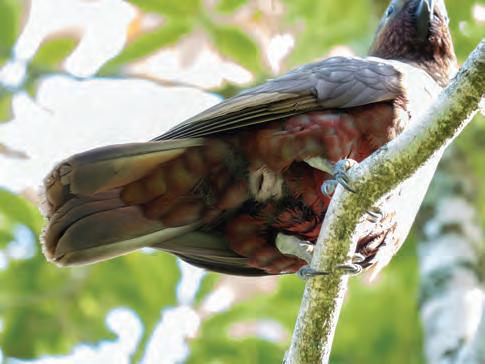
Research has confirmed that the average age of puberty has been decreasing, with people assigned female at birth experiencing puberty about three months earlier per decade since the 1970s. A similar but less pronounced trend has been observed in people assigned male at birth. The cause remains unclear, with no specific risk factor or combination of factors explaining the change. Researchers are exploring potential factors such as obesity and certain chemicals such as BPA and phthalates. Additionally, doctors worldwide reported a surge in early puberty cases during the Covid-19 pandemic, suggesting stress may play a role.

2.41 Phthalates are a group of chemicals that are commonly used as plasticisers to make plastic products more flexible and durable. They are also used in personal care products. However, phthalates have been associated with various health risks, including hormone disruption that may lead to early puberty.
Section 2.3 questions
Remembering
1. Recall where the female and male gametes are produced.
2. Name three signs of puberty for people with testes and three signs of puberty for people with ovaries.
3. Recall what the onset of puberty indicates.
4. State the location of the cervix.
5. State the function of the testicles.
Understanding
6. Describe the cloaca.
Applying
7. Refer to the graph of the menstrual cycle in Figure 2.38. Identify the: a) hormones that peak just before ovulation (when the egg is released) b) hormone that is at its greatest concentration when the uterine wall is at its thickest.
Analysing
8. Classify the following structures as belonging to the female reproductive system, the male reproductive system or both: fallopian tube, penis, gonads, prostate gland, scrotum, ovary, vas deferens, cervix.
Evaluating
9. Determine why a person who has blocked fallopian tubes might find it difficult to become pregnant.
10. As a person with testes ages, their prostate can increase in size. Propose a reason why this could affect urination.
Learning goal
At the end of this section, I will be able to:
1. Identify and compare sexual and asexual reproductive strategies in plants.
Plants can reproduce both asexually and sexually. Sexual reproduction in plants, as in animals, involves the fusion of gametes, resulting in a zygote and embryo. This process leads to genetic diversity, which can increase the chances of survival in changing environments.
Although asexual reproduction does not contribute to variation in the population, it offers plants several benefits: it is a quick process, requires less energy and enables plants to produce offspring in environments that are unfavourable for sexual reproduction. A plant may also reproduce asexually to take advantage of good conditions, such as following heavy rainfall, or to regenerate quickly after a fire.


Moss and ferns reproduce asexually via spore formation, in a similar fashion to fungi. Conifers and flowering plants use vegetative propagation to reproduce asexually. Vegetative propagation can occur naturally or through human manipulation. Both methods are summarised in Tables 2.1 and 2.2.
Natural methods of vegetative propagation
Bulb
Definition
• Underground stem for food storage
• Food is stored in large leaves
• Each bulb develops into a new plant
Onions, hyacinths, daffodils
Examples

Runner
Tuber
• A stem that grows on top of and across the ground, from an existing stem
• New plants grow from the runners
• Underground stem that contains stored food
• The eyes of a potato can develop into new plants
Strawberries, some grasses

Potatoes, sweet potatoes

Rhizome
• Long modified stem that grows horizontally under the ground
• New plants grow from the rhizome
Long grasses, ferns, irises, ginger, asparagus

Human-induced methods of vegetative propagation
Cutting
Definition
• Taking pieces of a root or stem
• Each piece grows into a new plant
Grafting
• Connecting part of a plant to another plant, combining the two plants
Bananas, roses, sugar cane
Examples

Citrus, grapes, apples, stone fruit, roses
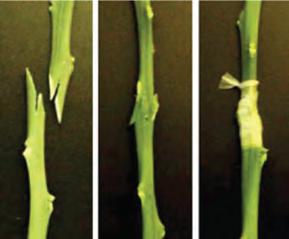
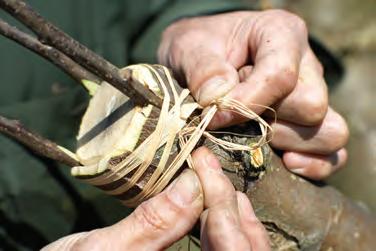

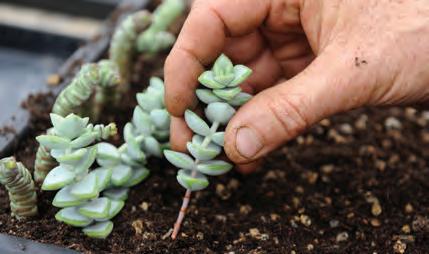
Quick check 2.6
1. Define: a) asexual reproduction b) sexual reproduction.
2. State two advantages of asexual reproduction in plants.
3. Define ‘rhizome’.
4. Name one plant that can be grown from a cutting.
Aim
To model the process of asexual reproduction, using potato tubers
Materials
• potatoes with eyes that are already starting to grow
• cotton wool
• Petri dish
• windowsill
• water
• knife
• chopping board
Method
1. Place the cotton wool in the Petri dish.
2. Add enough water to make the cotton wool damp but not wet.
3. Cut the potato into 3 cm pieces with one eye on each piece.
4. Press a piece of potato into the wet cotton wool with the eye on top.
5. Re-water the cotton wool every few days to prevent it from drying out completely.
6. Once the stem begins to grow, measure and record the growth each day over 2 weeks.
Results
Use your data and the data from two other groups in your class to calculate the average stem growth each day. Use the average data to produce a line graph.
Remember:
• Place the independent variable on the horizontal axis.
• Place the dependent variable on the vertical axis.
• Label both axes.
• Write a title.
• Use more than 75% of your graph paper.
• Use equal spaces between each number plotted.
Copy and complete the following table in your science book.
Table showing stem length over time
Discussion: Analysis
1. Describe a trend you see in your graph.
2. Explain why you calculated an average using other groups’ data as well as your own.
Discussion: Evaluation
1. Suggest another plant that could be used for a similar activity.
2. Propose an independent variable that you could add to this activity to turn it into a different experiment.
Conclusion
1. Make a claim regarding potatoes and their mode of reproduction. Start your sentence with ‘This experiment suggests that ...’
2. Support your claim by referring to your experimental observations, and include potential sources of error.
3. Explain how the data supports your claim. Start your sentence with ‘This means that...’.
If you sit near a patch of flowers on a summer's day, you may see a bee or a butterfly visiting the flowers. Many flowers rely on these insects to help them reproduce by sexual reproduction. The flower is the sexual organ of the plant. The pollen it produces is the male gamete (similar to sperm) and the female gamete, known as the embryo sac, is inside the ovule. The parts of a flower are shown in Figure 2.51.
The colourful part of the flower that attracts insects or other pollinators
The sticky head on the top of a stalk in the centre of the flower. Pollen grains from other plants stick to the stigma Stigma
Style
The long stalk that the pollen grain grows through into the ovary
The long stalk that holds the anther
The male part of the flower; consists of the filament and anther Stamen The part of the stamen that produces and holds pollen

The female part of the flower; consists of the stigma, style and ovary
Where the female gamete (ovule) is housed
the male gamete in flowering plants embryo sac the female gamete in flowering plants ovule a structure in a flowering plant where the female gamete is produced and where seeds develop
pollination the process by which pollen, containing the male reproductive cells of a plant, is transferred from the male part of a flower to the female part of a flower nectar a sweet liquid produced by flowers to attract pollinators
Pollination is the fertilisation process in which the pollen from one flower reaches the ovule of another flower. Bees and other insects are attracted to brightly coloured and scented flowers. As a bee feeds on the sweet nectar of the flowers, they pick up pollen on their bodies (see Figure 2.52). When the bee moves to the next flower, some of the pollen on the bee sticks to the stigma of the new flower, and the pollen grain then grows down the style to the embryo sac in the ovule. This is where fertilisation occurs and seeds develop.
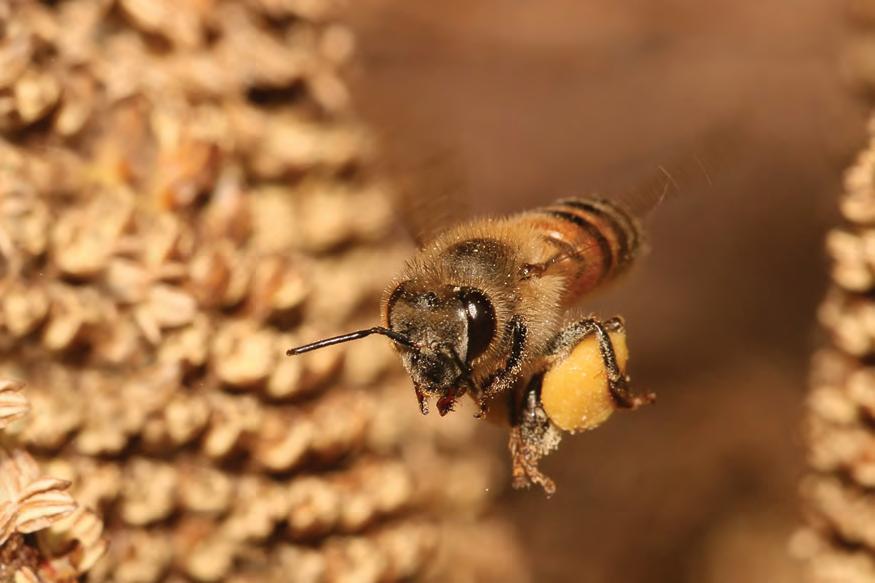
Making thinking visible 2.1
Compass points: Robot pollinators
In recent years, there has been global decline in the population of pollinators, such as bees, butterflies, birds and bats, which are crucial to the reproduction of many crops and wild plants. This decline is mainly attributed to habitat loss, pesticide use, climate change and diseases, and has significant implications for food security, ecological balance and biodiversity.
The RoboBee, the world’s tiniest flying robot insect, was unveiled by US researchers in 2013, after 12 years of experimentation in the laboratory. RoboBee was designed to address the current pollinator crisis. However, there was a slight issue with the robot bees: they required an exceptionally lengthy extension cord to venture out into the field.
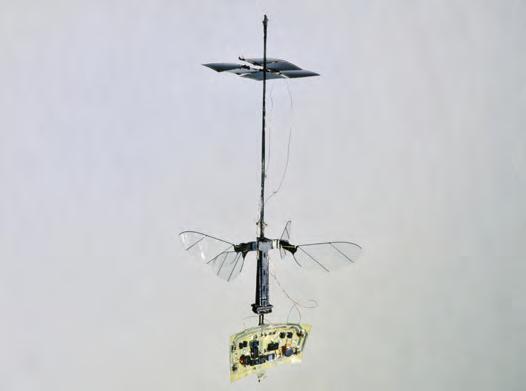
Figure 2.53 The 2019 untethered prototype of the RoboBee, with an additional set of wings
A new version of the RoboBee was introduced in 2019, featuring an additional set of wings to allow the removal of the power cord and soft ‘muscles’ to prevent the robot from disintegrating when crashing into crops (see Figure 2.53).
In 2017, Dr Eijiro Miyako, a materials chemist at Japan’s National Institute of Advanced Industrial Science and Technology, transformed a toy drone into a fast but somewhat hazardous pollinating robot. To achieve this, he attached a patch of horsehair to the drone and coated it with an ionic liquid gel, resulting in a sticky surface that could collect and transport pollen between plants.
However, the drone faced two immediate issues. First, it damaged the flowers. Second, it required a human operator to control it, which, given the significant number of bees required for pollinating, would be very expensive for farmers when hiring people to pilot the drones.
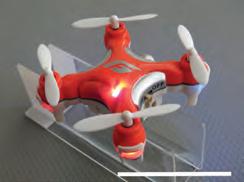
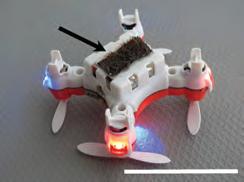
Dr Miyako and his team then attempted a different approach by using a drone equipped with a bubble gun that released soapy bubbles filled with pollen. In lab experiments, the researchers tested the technique on pear flowers, and the results were promising. The bubbles ruptured on contact with the pistil, allowing the pollen to adhere and form pollen tubes, which helped in fertilisation. However, excessive bubbles stunted pollen growth, possibly because of the soap’s properties. The team is working on developing an environmentally friendly soap bubble solution that biodegrades more quickly, potentially leading to an even more effective and sustainable pollination method. However, this approach is not suitable for use on windy days!
Complete the Compass points activity about robot pollinators:
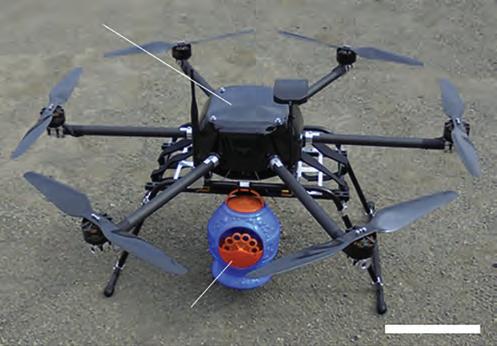
1. E = Excited: What excites you about RoboBee and robot pollinators? What are the potential benefits?
2. W = Worrisome: What worries you about this idea? What are the potential drawbacks?
3. N = Need for information: What other details or facts do you need to evaluate this idea?
4. S = Suggestion for progress: What is your current viewpoint or proposal about robot pollinators? How can you continue to assess this concept?
The Compass points thinking routine was developed by Project Zero, a research centre at the Harvard Graduate School of Education.
self-pollination pollination that occurs when pollen is transferred from the same flower or from another flower on the same plant cross-pollination pollination that occurs when pollen is transferred from a flower on one plant to a flower on another plant
Pollination is an important process that allows plants to reproduce. After fertilisation, the ovary swells and grows into a fruit. There are different methods by which pollen can be transported from one flower to another to allow pollination to occur – examples are wind, insects, birds and animals.
When male gametes fertilise female gametes on the same plant, it is called self-pollination. When pollen from one plant fertilises the ovule of another plant, it is called cross-pollination. Crosspollination results in genetically diverse offspring that increase variation in the species, making it better able to survive changes in the environment.
1. Draw up a table with two columns. In the first column, list the four methods of moving pollen from one flower to another. Then conduct some research on the types of flowers that use each method of pollination. In the second column, summarise what you have found out about the characteristics (shape, colour, size) of these different types of flowers, including their stamens and pistils.
2. What are the advantages and disadvantages of self-pollination? Conduct some research to find out how plants prevent self-pollination occurring.


Did you know? 2.10
Pollen grains come in many shapes and sizes, depending on the plant that produces them. This is why pollen from certain plants can trigger an allergic reaction in some people, while other pollen has no effect. Palynology is the name for the study of pollen grains. Palynologists study pollen samples found in such places as archaeological digs and crime scenes. Palynology suggests that Australia’s oldest flowering plants are approximately 126 million years old, and they resembled modern magnolias, buttercups and laurels.
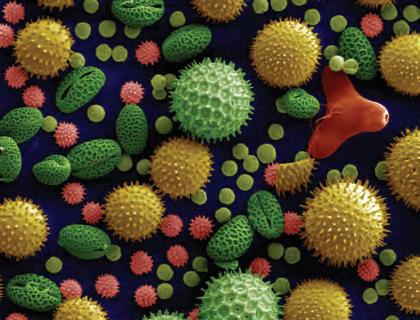
Humans are attracted to flowers because of their beautiful and varied colours and scents, but there is much more to flowers than the colours we can see. Unlike us, many insects can perceive wavelengths beyond the visible spectrum. When flowers are viewed under ultraviolet light, distinct patterns resembling landing strips or bullseye targets become apparent. You can see these patterns in Figure 2.58. These patterns serve as a guide for insects, directing them precisely to the nectar source.


Name the male gamete and the female gamete of plants.
2. Bees and insects can transfer pollen from one flower to another flower. Name some other ways that pollen can be transferred.
3. Draw up a table to summarise the parts of the flower and their role in sexual reproduction.


such as pine trees have separate (a) male and (b) female cones on the same tree. They do not have flowers. They are wind pollinated – male cones release pollen to the wind. When ready, the female cones open and the pollen is blown inside to fertilise the female gametes, which develop into seeds. To reduce self-pollination, female cones are on the higher branches and male cones are on the lower branches.
Aim
To identify the parts of a flower, and link their structure to their role in reproduction
Materials
• variety of flowers for dissection
• hand lens
• stereomicroscope
• tweezers
• single-sided razor blade
• chopping board
Method
Be careful
Be very careful when handling the razor blade.
1. Refer to Figure 2.51 to help you to identify the parts of your flower. Draw a diagram of your first flower. Note the number of petals and sepals, and label these on your diagram.
2. Holding the flower carefully with tweezers on the chopping board, cut the flower in half vertically. This means you should now be looking at a vertical section of the flower, similar to the top picture in Figure 2.51.
3. Draw a diagram of the flower, and label all the parts you can recognise. Add ‘M’ next to the male parts of the flower and ‘F’ next to the female parts of the flower.
4. Gently remove the sepals and petals, by pulling them down towards the stem. Use a microscope to look at the tip of the petal at low magnification. Record your observations of the petal’s texture in your results.
5. Remove the flower’s stamens, by breaking or gently cutting them off the stem. Examine the pollen with your microscope. Record your observations of the pollen’s shape and texture in your results.
6. Gently remove all parts except the pistil, so that it remains alone on the stem. Carefully cut the pistil in half lengthwise and use your hand lens to look at the inside. Record your observations of the style, ovary and ovules in your results.
7. Repeat steps 1–6 with the other flowers.
Results
Your results should consist of:
• labelled diagrams of the whole flowers and vertical sections of the flowers
• observations made during the dissection.
Discussion: Analysis
1. Consider the different flowers you looked at. List the similarities and differences between them.
2. Explain why these differences between flowers might exist.
3. Use a flow chart to summarise the process of sexual reproduction in plants. Use the names of the parts of flowers that are involved and their role in reproduction.
Citizen
Bees pollinate most of our crops, but bee numbers are decreasing rapidly. Bees can fly between flowers at about 25 km/h and visit up to 5000 flowers in one day. In fact, bees are so important that artificial hives are moved all around the country to help pollinate new crops.
With the bee industry facing challenges such as invasive pests and extreme weather, bee experts are urging citizen scientists to help count various species of insects to assess the health of pollinators. The Australian Pollinator Count is a long-term citizen science project to monitor the status of pollinator populations, including more than 2000 species of bees, along with thousands of species of flies, butterflies, moths and wasps.
Suggest why people want to be involved in citizen science projects.

When managing an avocado and lychee farm in Mareeba, far north Queensland, James Wheildon began exploring the use of flies for pollination. Flies are just as efficient at pollinating as bees, and are ideal because they visit flowers year-round, seek sugar from nectar and easily pick up pollen. Wheildon became known as the ‘fly guy’ after locals advised him to use dead animals to attract flies for pollination. However, he found the method was not practical because the dead animals did not last long and were a health risk. As a result, he developed FlyGro, a product that would attract flies for pollination. When water is added to FlyGro, it starts to ferment and emits a gas that attracts flies, dramatically boosting numbers and therefore pollination.
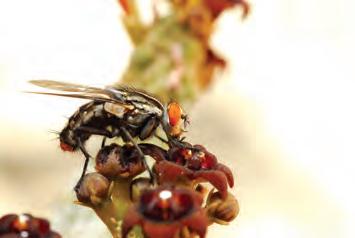
VIDEO Seed dispersal methods
seed a plant embryo enclosed in a protective coating
seed dispersal the spread of seeds away from the parent plant
After fertilisation in conifers and flowering plants, the embryo develops inside a seed or nut. In flowering plants, the seeds are usually inside a fruit, which develops from the ovary after flowering. The everyday use of the term 'fruit' usually refers to an edible product such as apples, lemons, grapes and nectarines, but in plant science, the term 'fruit' refers to any seed-containing structure that develops from the ovary of a flowering plant. This includes bean pods, wheat grains and corn kernels.
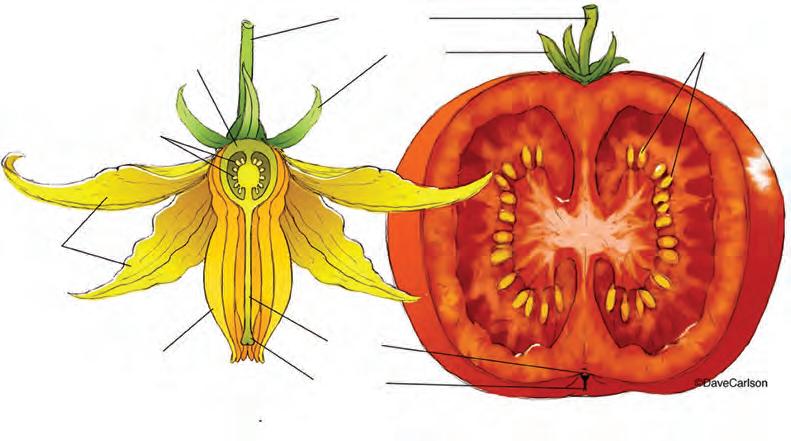
2.62 A tomato plant flower showing how the ovary develops into the fruit
Pine trees and other conifers produce cones (see Figure 2.63), which are specialised structures that hold and protect the seeds. The cones can vary in size and shape, and they can remain on the tree for several years before they mature and release the seeds. When the cones are mature, they open to release the seeds, which are usually small and winged to aid in dispersal by the wind.
Seeds are often eaten by birds and mammals, so plants produce large numbers of seeds to increase the chance of survival. Even then, the seeds may land in inhospitable areas where they lack the resources to grow, such as enough soil, sunlight or water. Because adult plants require a lot of space and similar resources, it would not be advantageous for seeds to be dropped and germinate immediately next to their parent plants. Therefore, many plants have developed creative methods of seed dispersal to spread the seeds further away and improve the chances of survival.

2.63 A pine cone ready to drop its seeds
A group of plants known as impatiens use ballistic force to disperse their seeds (although they do not typically travel far). At the slightest touch, the ripe seed pod bursts open, flinging its seeds in multiple directions (see Figure 2.64).
Certain plants produce seed pods with spikes, thorns or hooks that can become caught in animal fur (or on human clothing) and carried to a new location (see Figure 2.65). When the animal scratches at the itchy sensation, the seed pods can detach and fall to the ground.


Some plants have extra sweet fruit, which encourages animals to eat them, and the seeds they contain (see Figure 2.66). These seeds have a tough coat so that they will not be digested. The seeds eventually pass intact through the animal, becoming deposited in a new location, where they may begin to grow.

Wind is not only a method of pollination, but can also be used for dispersing seeds. Some plants, such as the dandelion, produce seeds with specialised parachute-like tuft called a pappus, which is easily caught in the breeze (see Figure 2.67). The seeds are very light, allowing them to travel long distances before coming to rest. A dandelion head is not one flower; it has many florets. Each head can produce around 500 seeds, making dandelions very efficient at dispersing seeds, and a very hardy weed.
A coconut is one giant seed. It is hollow, so it can float (see Figure 2.68). This is how coconuts can move between islands and possibly even across oceans.


1. Draw a table to summarise the different ways in which seeds can disperse. Include examples where appropriate.
The Royal Botanic Gardens in Kew, England, is leading a seed conservation program to preserve rare and threatened wild plants. Kew’s 2020 report on the State of the World’s Plants and Fungi indicates that 40% of the world’s plants are at risk of extinction due to the deterioration of natural ecosystems, changes in land use, and the unpredictable effects of climate change.

On 1 March 2023, the Millennium Seed Bank announced they had successfully stored more than 2.4 billion individual seeds of 40 020 various species of wild plants. Dubbed the ‘Noah’s Ark for plants’ by experts, the Millennium Seed Bank is the most prominent global storage facility for wild seeds.
Research the Australian Seed Bank Partnership and the work that is being done to conserve Australia’s native plant diversity.
Aim
To design an experiment to test the conditions necessary for a seed to germinate, using the materials provided. You may investigate other factors that contribute to the plant’s germination (e.g. light levels, water, nutrients, heat).
Planning
1. Write a rationale about the factors that affect seed germination.
2. Write a specific and relevant research question for your investigation.
3. Choose a suitable independent variable to test.
4. Identify the dependent and controlled variables.
5. Write a hypothesis for your investigation.
6. Write a risk assessment for your investigation.
7. Construct a detailed method to explain the procedure you will follow in your experiment. Include all of the instruments and exact measurements you will use. Set the method out in step-by-step form. Include the number of repeats you expect to conduct. Do not forget to mention how the data will be recorded. Remember, another scientist should be able to read this procedure and replicate your experiment exactly, so be detailed in your instructions.
8. After confirming with your teacher that your method is satisfactory, carry out your investigation.
Materials
• Petri dish or glass jar
• paper towel
• water
• seeds
• sugar
• salt
Results
1. Draw a results table for your experiment.
• water
• black paper
• heat lamp
• cotton wool
• fertiliser
2. Produce a suitable graph for your experiment.
Discussion: Analysis
1. Describe any patterns, trends or relationships in your results.
2. Explain any trends you have identified.
Discussion: Evaluation
1. Identify any limitations in your investigation.
2. Propose another independent variable that could have been tested, to expand on your results.
3. Suggest some improvements for this experiment.
Conclusion
1. Make a claim regarding seeds and germination conditions. Start your sentence with ‘This experiment suggests that...’.
2. Support your claim by referring to your experimental observations, and include potential sources of error.
3. Explain how the data supports your claim. Start your sentence with ‘This means that...’.
Section 2.4 questions
Remembering
1. State four methods of asexual reproduction that occur naturally in plants.
2. State the purpose of the petals of a flower.
3. Define ‘pistil’.
Understanding
4. Explain why some flowering plants’ ovaries develop into fleshy fruit.
5. Explain how seed dispersal by wind is effective.
Applying
6. Describe some ways in which a plant can be pollinated.
Analysing
7. Compare a peach with a pine cone.
8. Distinguish between self-pollination and cross-pollination.
Evaluating
9. Hay fever is caused by pollen irritating the nasal passageways. Hana lived in Korea for 15 years and never experienced hay fever. Since moving to Australia, Hana has had hay fever every summer. Propose a reason for this.
10. A new volcanic island forms in the middle of the Pacific Ocean. Predict the first type of plants that will grow on the island. Justify your answer based on the plant’s method of seed dispersal.

Chapter checklist
Success criteria
Linked questions
2.1I can describe the six methods used by animals, plants and microbes to asexually reproduce 1, 14
2.2I can describe how sexual reproduction creates a greater rate of variation among offspring than asexual reproduction does 7, 11, 17
2.2I can describe how the reproductive strategies of multicellular animals are related to their environment and the complexity of the organism 4, 5, 8, 12
2.2I can describe how the number of offspring produced by animals is related to amount of parental care 10
2.3I can examine how the male and female reproductive organ structures work collectively as a system 2, 13, 16
2.3I can describe how the forms of male and female gametes relate to their specific functions 9
2.4I can identify and compare sexual and asexual reproductive strategies in plants 3, 6, 11, 15, 18
Review questions
1. Recall the type of asexual reproduction used by:
a) an amoeba
b) a flatworm
c) a strawberry plant
d) ginger.
2. State the function of the following structures in the human reproductive system:
a) ovary
b) scrotum
c) fallopian tube
d) prostate
e) uterus.
3. Name the parts of a flower that have the following functions:
a) attracts pollinators
b) the site of seed development
c) produces the male gametes
d) produces the female gametes
e) site where the male gamete sticks to the female part of the plant.
4. State the two methods of fertilisation in animals. For each method, name one animal that uses it.
Understanding
5. Explain why internal fertilisation exists in some animals rather than external fertilisation.
6. Explain four different ways that seeds might be dispersed.
7. Describe how sexual reproduction results in a greater rate of variation among offspring than asexual reproduction.
Applying
8. Describe how the reproductive strategies of multicellular animals are related to their environment.
9. Explain how a sperm’s structure is related to its function.
10. Describe how the number of offspring produced by animals is related to the amount of parental care they are likely to receive.
Analysing
11. Contrast sexual reproduction and asexual reproduction to show the advantages and disadvantages of each method.
12. Distinguish between external development and internal development of offspring, naming an example organism for each.
13. Compare the changes in secondary sexual characteristics during puberty in people with ovaries versus people with testes by using a Venn diagram.
Evaluating
14. If a female reptile with XX sex chromosomes reproduces by parthenogenesis because of a lack of male mates in the area, what can you predict about the offspring?
15. Construct a comic strip or diagram to model how sexual reproduction occurs in a flowering plant. Ensure the reproductive organs are labelled appropriately.
16. Construct a timeline of the human gestation period, indicating the name of the structure at each stage and the timeframes involved.
17. A biologist is investigating a species of frog that lives in an environment that is changing rapidly. Propose why sexual reproduction would be a better strategy for this species of frog.
18. The flowers of certain orchids closely resemble the shape of a female wasp (see Figure 2.71). Justify a reason for this adaptation.

Meera wanted to find out the effect of substance A and substance B on hydra budding. She conducted an experiment for 6 days with three identical samples of hydra. She gave the same amount of food to each sample every day. She also daily added 1 drop of substance A to sample A, and 1 drop of substance B to sample B. The control was given no added substances.
The graph in Figure 2.72 shows her results.
Applying
Figure 2.72 The number of hydra buds in the samples each day
1. Identify the sample that had the highest number of buds at the end of the 6 days.
2. Identify the sample that had at least one day with no buds.
3. Determine how many days it took for each sample to reach more than 10 buds.
4. Calculate the difference in the number of buds between sample A and sample B on day 5.
Analysing
5. Contrast the patterns for the three samples.
6. Identify whether the number of buds in the control sample shows a linear or an exponential growth pattern, giving reasons for your choice.
7. Deduce which substance, A or B, is a growth activator (i.e. helps growth) and which is a growth inhibitor (i.e. prevents growth).
8. Compare the control sample with sample A after day 4. What evidence is there to suggest that sample A was getting crowded?
9. Predict how many buds there would be for each sample if Meera extended the experiment to the seventh day.

While introduced honey bees are used commercially to pollinate crops, Australia’s native bees (of which there are over 1700 species) also have a role to play in ensuring food security.
Bees have evolved specialised skills for transferring pollen that suit the plants they feed on.
Blue banded bees use a strategy known as buzz pollination, in which they grab hold of the flower and move their flight muscles rapidly to dislodge pollen from the anthers. Other species of bee have specialised bristles on their forelegs to rake the pollen out.

Design a pollen distribution prototype robot or machine that can be used in areas with declining bee populations.
In groups, you will research bees and pollination. Then you will design and create a scale drawing of a pollen distribution prototype. You won’t need to build this, so be creative and incorporate as many types of technology as possible.
1. Conduct some research on how bees support the reproduction of plants. You may want to print out an image of a bee and annotate its features.
2. Discuss how a pollen distribution prototype could be built to mimic the behaviours of bees.
3. Conduct some research on different types of technology that are used in robotics and flight.
4. As individuals, sketch your own ideas, and then present them to the group. Discuss the key connections between how bees distribute pollen and your prototype. Discuss the best aspects of each person’s sketch.
5. As a group, sketch a design and annotate its key features, incorporating sustainable ideas. This means making sure that your prototype can be reused easily. Discuss in your group the size of your prototype, and the materials or manufacturing that would be required.
6. As a group, create a scale drawing of your group’s prototype to present to the class. You will need to agree on a scale and a size. Your scale drawing should include colours and annotations.
7. Present your prototype design to the class in a 1-minute demonstration of your scale diagram.
8. Discuss with the class your ideas for the design and sustainability of the prototype.
9. Evaluate the issues arising from a human solution to an environmental problem.


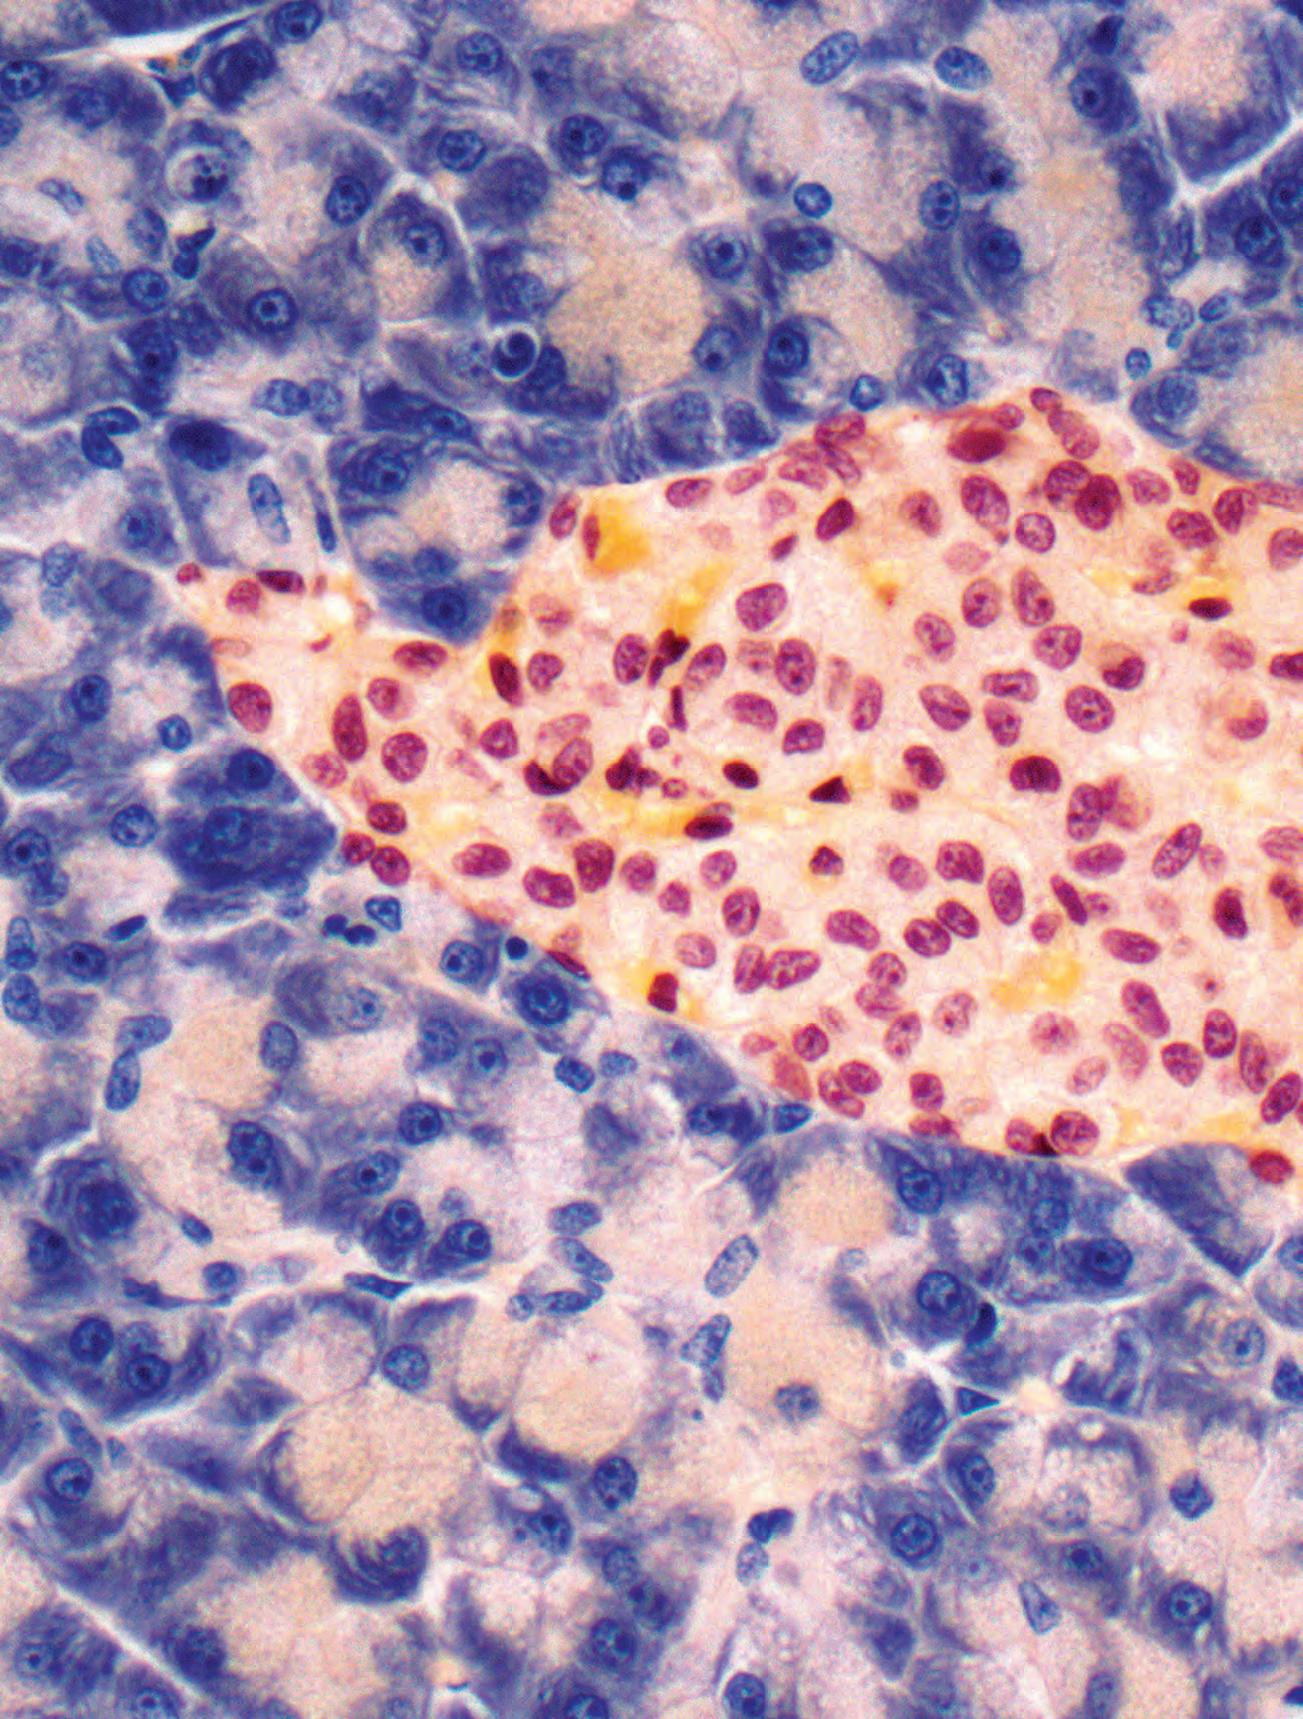
Introduction
The human body is a complex, multicellular organism that must detect and appropriately respond to changes in the external and internal environment. Body systems, such as the nervous and endocrine systems, must work collaboratively to detect stimuli, process this information and coordinate a response. In this chapter you will learn about negative feedback, which is a critical mechanism that helps to achieve homeostasis – the maintenance of the body’s internal environment within a narrow range of conditions, despite fluctuations in the external environment. Humans depend on this to keep us alive.
Nervous system
• Electrical message (action potential) via neurons
• Fast acting, short duration
Coordinate communication
Endocrine system
• Chemical message (hormones) via bloodstream and lymphatic system
• Slow acting, long duration
Section 3.1
Section 3.2
Section 3.3
Body systems work together to regulate homeostasis
• Body system interactions
• Stimulus–response model
• Negative and positive feedback
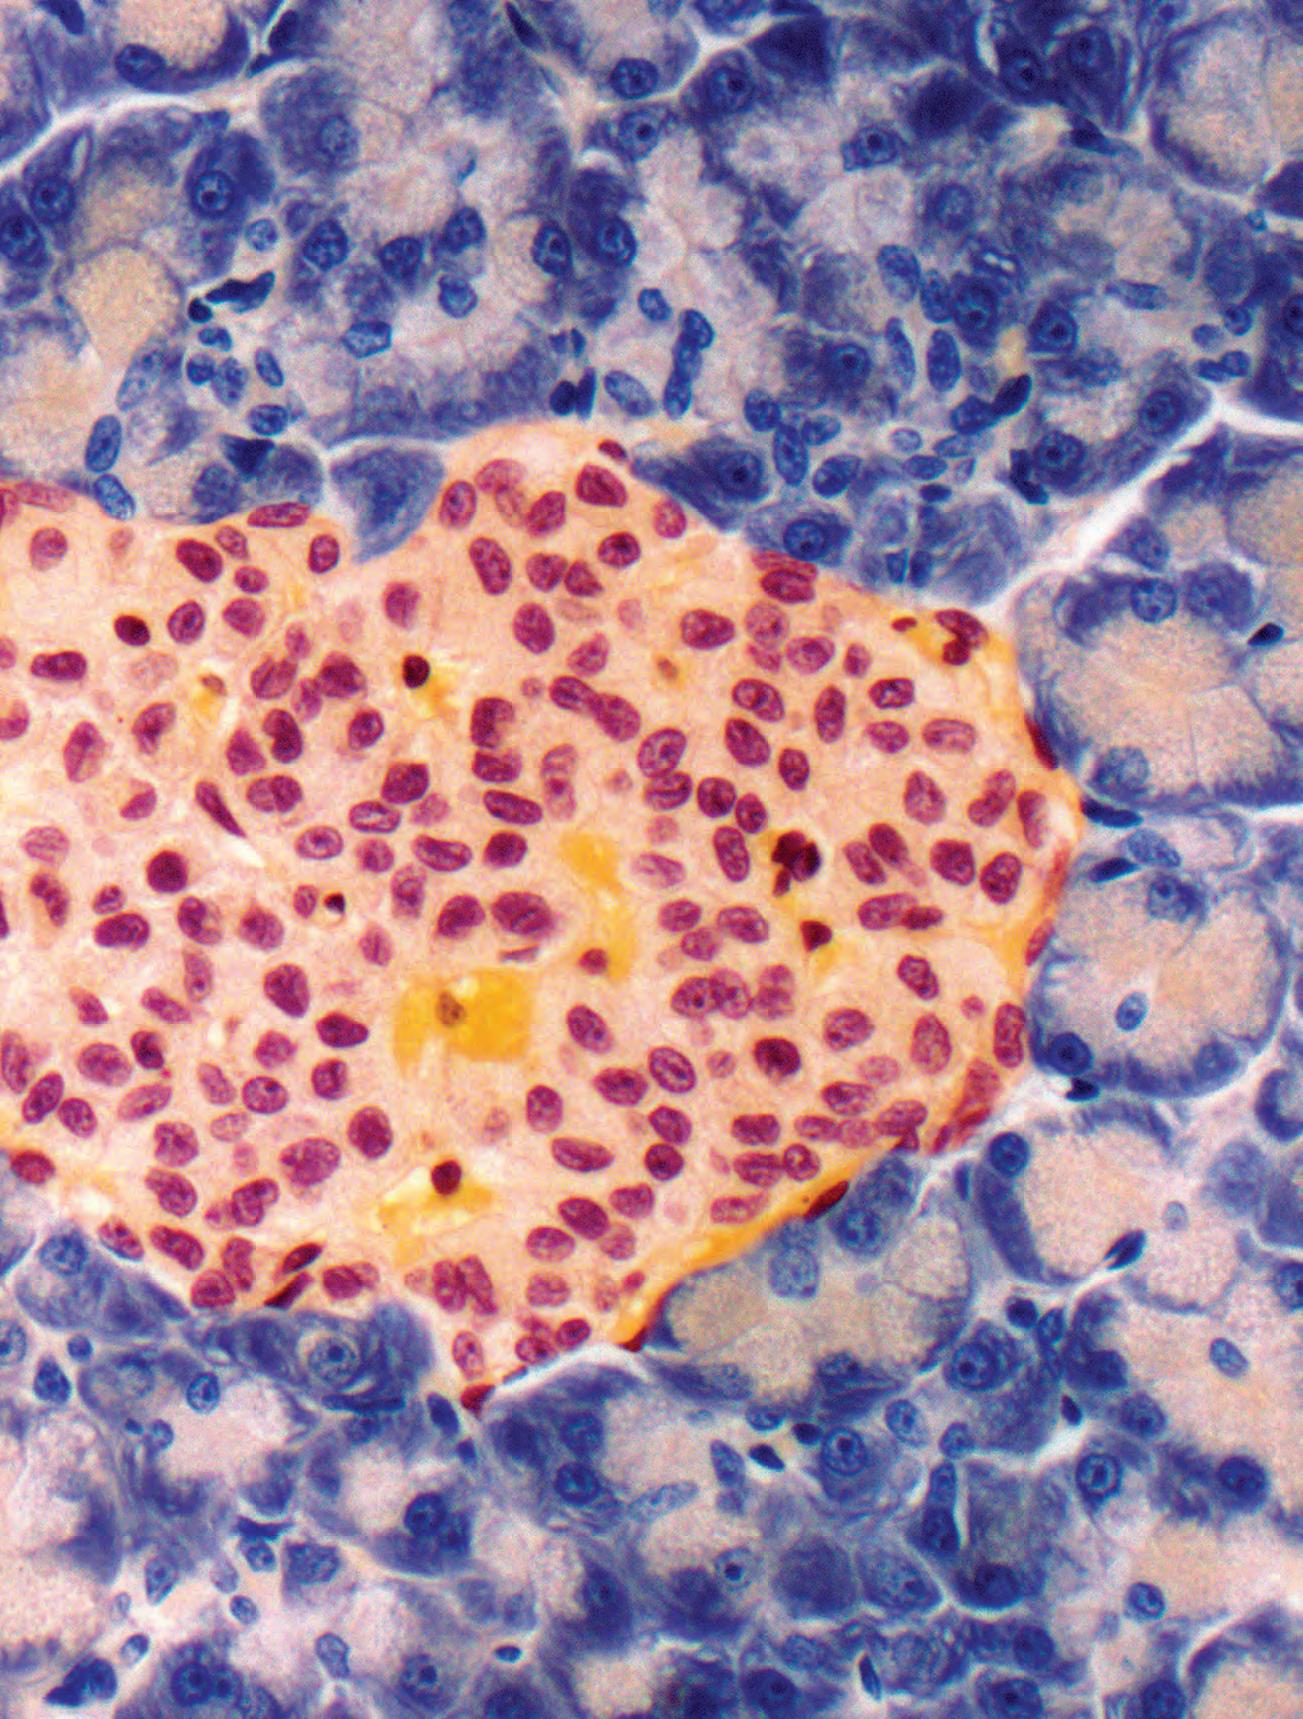
the nervous and endocrine systems work together to regulate and coordinate the body’s response to stimuli, ensuring homeostasis, including through negative feedback mechanisms (VC2S10U02)
• exploring the body’s observable responses to external stimuli (such as changes in light or temperature, and presence of danger or pathogens) or internal stimuli (such as dehydration and hunger)
• using models, flow diagrams and virtual simulations to investigate and represent the relationships between body systems that are necessary to coordinate a response to a stimulus
• comparing the roles and functions of electrical impulses and hormones in the body’s responses to external stimuli
• modelling how the process of regulation is monitored and adjusted by connections between the receptor, command centre and effector
• examining how negative feedback mechanisms serve to maintain balance in internal systems, such as those for body temperature, blood sugar, iron levels and extracellular pH, and how an understanding of feedback mechanisms has enabled the development of pharmaceuticals (such as insulin for type 1 diabetes) and products to maintain or enhance performance (such as electrolyte solutions)
• examining the effects of a condition such as diabetes-induced blindness or hypothermia on a feedback system
communicating and justifying scientific ideas, findings and arguments for diverse audiences involves the selection of appropriate presentation formats, content, scientific vocabulary, conventions, models and other representations, and may include the use of digital tools (VC2S10I08)
• developing an interactive presentation that shows feedback loops in human body systems 3.3
Action potential
Autonomic nervous system
Cellular respiration
Control centre
Effector
Endocrine system
Excretion
Glucagon
Homeostasis
Hormone
Insulin
Interneuron
Motor neuron
Nervous system
Neuron
Neurotransmitter
Osmoregulation
Pathogen
Positive feedback
Receptor
Reflex action
Response
Sensory neuron
Somatic nervous system
Stimulus
Synapse
Negative feedback
Target cell
Learning goals
At the end of this section, I will be able to:
1. Describe how the body responds to external or internal stimuli.
2. Describe the relationships between body systems that are necessary to coordinate a response to stimuli.
3. Explain how the process of regulation is monitored and adjusted by connections between the receptor, command centre and effector.
4. Describe how positive feedback mechanisms maintain the direction of a stimulus and accelerate its effect.
Coordination: It’s a team effort!
Within the human body, 11 major organ systems interact with each other to enable humans to grow, maintain life and reproduce. Each system depends on other systems to keep the body functioning at an optimal level, and each is made up of organs with highly specific functions. The systems are:
• circulatory (sometimes called cardiovascular)
• endocrine
• skeletal
• reproductive
• digestive
• excretory
• nervous
• muscular
• immune
• integumentary (skin and outer body coverings)
• respiratory.
Every multicellular organism depends on its body systems working together. The body does an amazing job of maintaining a stable internal environment, despite considerable changes in the external environment. This process is known as homeostasis
Body systems working together
Messaging
The nervous system and endocrine system work together to control and coordinate the body's activities. The nervous system sends electrical signals called nerve impulses to different parts of the body, whereas the endocrine system releases hormones into the bloodstream. Hormones act as messengers, travelling through the bloodstream to target organs and tissues. Some of the bodily functions regulated by these systems are heart rate, blood pressure and body temperature. You will learn more about the nervous and endocrine systems later in this chapter.
Hair
Skin
Integumentary system
• Encloses internal body structures
• Site of many sensory receptors
Cartilage
Skeletal system
• Supports the body
• Enables movement (with muscular system)
Bones
Nails
Joints
Muscular system
• Enables movement (with skeletal system)
Brain
• Helps maintain body temperature
Spinal cord
Skeletal muscles
Nervous system
• Detects and processes sensory information
• Activates bodily responses
Tendons
Pituitary gland
Thyroid gland
Pancreas
Adrenal glands
Endocrine system
Peripheral
nerves
Circulatory system
• Secretes hormones
• Regulates body processes
Heart
• Delivers oxygen and nutrients to tissues
• Equalise temperature in the body
Blood vessels
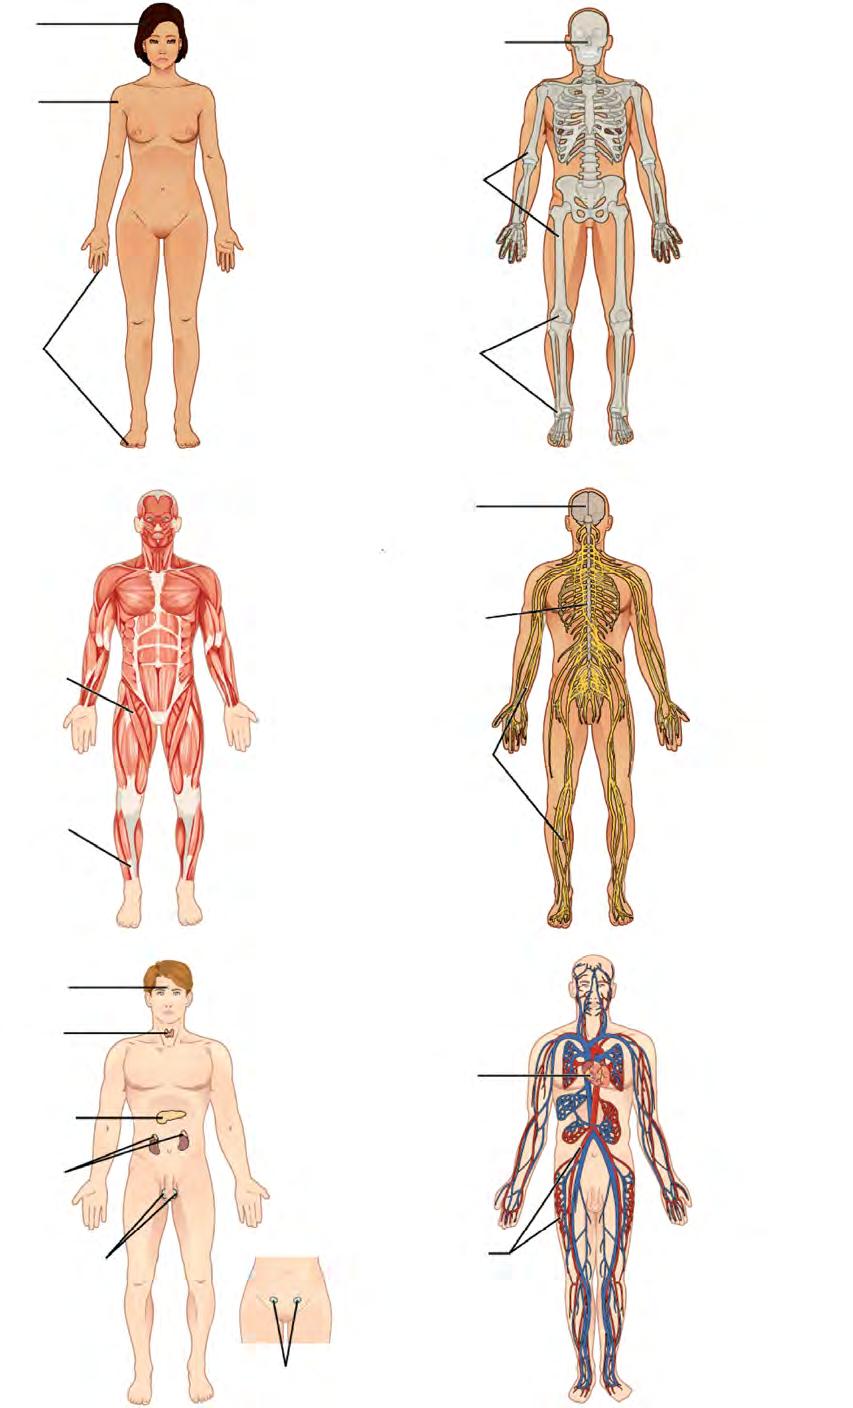
3.1 The different body systems work together to maintain homeostasis.
Thymus
Lymph nodes
Spleen
Lymphatic system
• Returns fluid to blood
• Defends against pathogens
Nasal passage
Trachea
Lungs
Lymphatic vessels
Stomach
Liver
Gall bladder
Large intestine
Small intestine
• Removes wastes from undigested food Digestive system
• Processes food for use by the body
Kidneys
Urinary bladder
Epididymis
• Produces sex hormones and gametes
• Delivers gametes to female Male reproductive system
Mammary glands
Uterus
Respiratory system
• Removes carbon dioxide from the body
• Delivers oxygen to blood
Urinary system
• Controls water balance in the body
• Removes wastes from blood and excretes them
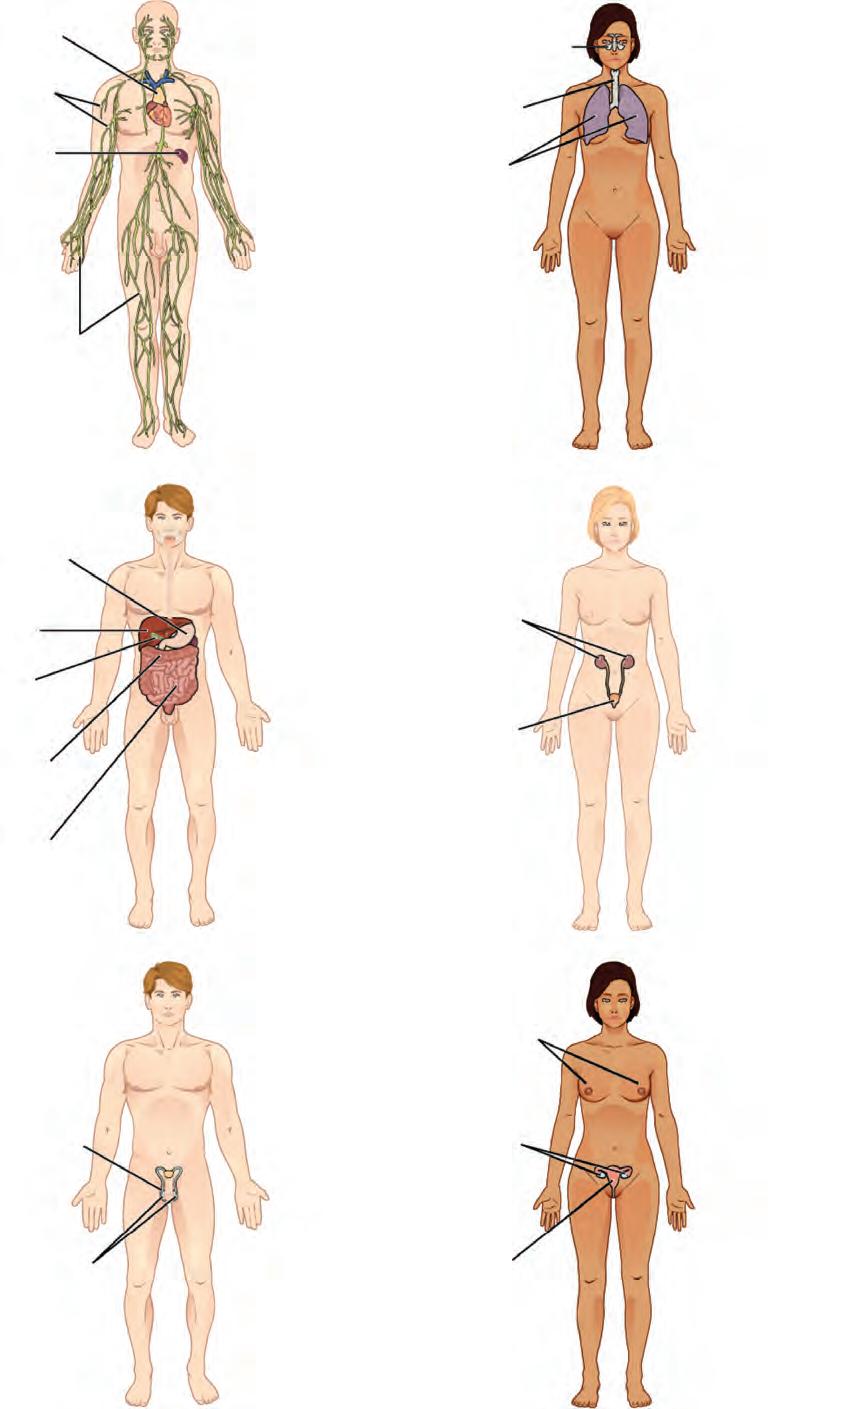
Female reproductive system
• Produces sex hormones and gametes
• Supports embryo/ foetus until birth
• Produces milk for infant
excretion
the process of eliminating waste products, excess water and other unnecessary substances from the body
stimulus (plural: stimuli)
a change in the environment that is detected by the human body
receptor a specialised structure that allows the body to detect and respond to stimuli
effector
a muscle, gland or organ that carries out a response or action in response to a stimulus
The muscular system and circulatory system work together to maintain blood flow and oxygenation. The circulatory system consists of the heart, blood vessels and blood. The heart pumps blood through the blood vessels, which transport oxygen and nutrients to the body's tissues. The muscular system helps to maintain blood flow by contracting and relaxing the muscles surrounding blood vessels. This helps to regulate blood pressure and maintain a steady flow of blood to the body's tissues.
The respiratory system and circulatory system work together to provide the body with oxygen. The respiratory system includes the lungs and airways. Oxygen is absorbed across the internal surface of the lungs and transported to the body's tissues by the circulatory system.
The circulatory system transports wastes such as carbon dioxide away from body cells and to the lungs. Here, the gases are exchanged in the lungs and exhaled. The digestive system and excretory system work together to maintain nutrient balance and remove waste products. The digestive system breaks down food into nutrients that can be absorbed by the body. The nutrients are then transported by the circulatory system to the body's tissues. The excretory system removes waste products from the body, including excess water, salts and urea. This is called excretion
Quick check 3.1
1. Define ‘homeostasis’.
2. Explain why homeostasis is important for your survival.
3. Explain how the circulatory and respiratory systems work together to achieve oxygenation.
To achieve homeostasis, the body needs to respond to changes within the body's internal and external environment. A stimulus is any change in the environment that can be detected by the human body. The change can be physical or chemical. Stimuli include changes in temperature, light, sound, pressure and chemicals in the air or food.
Changes in the environment are detected by receptors within the body. If a response is required, certain actions are brought about by effectors within the body to bring the body back to its 'normal' or optimum level.
Receptors are specialised structures throughout the human body that allow it to detect and respond to various stimuli. They occur in all types of tissue, from the skin to the internal organs. There are many types of receptors, each specialised to detect a specific type of stimulus (Figure 3.2). The different receptors are described in Table 3.1.
Stimulus
ChemoreceptorBlood vessels, brainChanges in blood chemistry (e.g. oxygen, carbon dioxide, pH levels)
MechanoreceptorSkin, muscles, joints, inner ear
PhotoreceptorRetina of eye
ThermoreceptorSkin, brain
Olfactory receptorNose
Physical distortion or deformation (e.g. touch, pressure, stretching, sound)
Light energy
Changes in temperature (e.g. heat or cold)
Chemicals in air (odours)
Gustatory receptorTaste buds on tongueChemicals in food and drink (taste)
NociceptorSkin, muscles, joints, organs
Table 3.1 A summary of receptors in the body
Tissue damage or potentially harmful stimuli (e.g. heat, cold, pressure, chemicals)
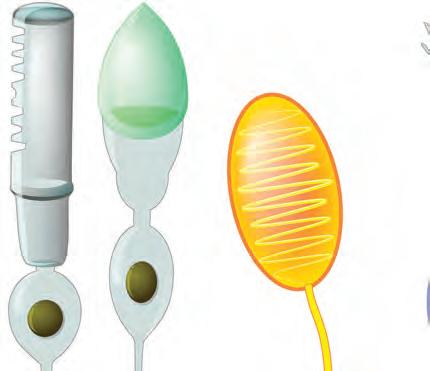
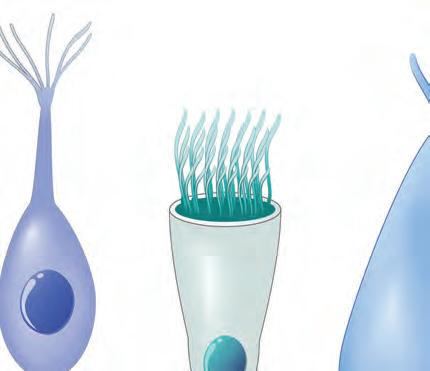

Vision
Photoreceptors detect light.
Touch
Mechanoreceptors detect mechanical forces such as pressure or movement.
Thermoreceptors detect temperature changes.
Nociceptors detect damage to body tissues, causing pain perception.
Smell
Olfactory chemoreceptors detect chemical stimuli.
Hearing
Mechanoreceptors detect mechanical forces from the vibrations in the eardrum.

Taste
Gustatory chemoreceptors detect chemical stimuli.
Figure 3.2 The different sensory receptors associated with your five senses. Their shape is closely associated with their specialised functions.
When a receptor is activated, it sends a signal to the control centre, which is often the brain or spinal cord, to process the information and determine the appropriate response. The control centre then sends signals to the effectors, which are the organs, tissues, and cells that carry out the necessary actions to produce a response to the stimulus.
control centre often the brain or spinal cord, which receives signals from receptors and sends out signals to effectors to produce a response to a stimulus response the reaction to a stimulus
The five-step stimulus–response model is shown in Figure 3.3.
Stimulus A change in the inte rnal or ex te rnal environment that tri gge rs a re sponse
Receptor
Control centre
Spe ci alised ce lls that de te ct the change and transmit a si gnal to the control ce ntre
The structure (often in the brai n, but some ti me s in an organ) that re ce ived the si gnal and coordinate s the re sponse
Effector The organ or muscle that carrie s out the re sponse
Response
A change occurs in the body as a result of the stimulus
Figure 3.3 (a) A flow chart outlining the stimulus–response model and (b) a description of the stages
Making thinking visible 3.1
see, feel, think, wonder: taste buds
The tongue is a complex organ that contains various types of papillae, which house specialised sensory receptors known as taste buds. Papillae are small, raised structures on the surface of the tongue, and they can be different shapes and sizes.
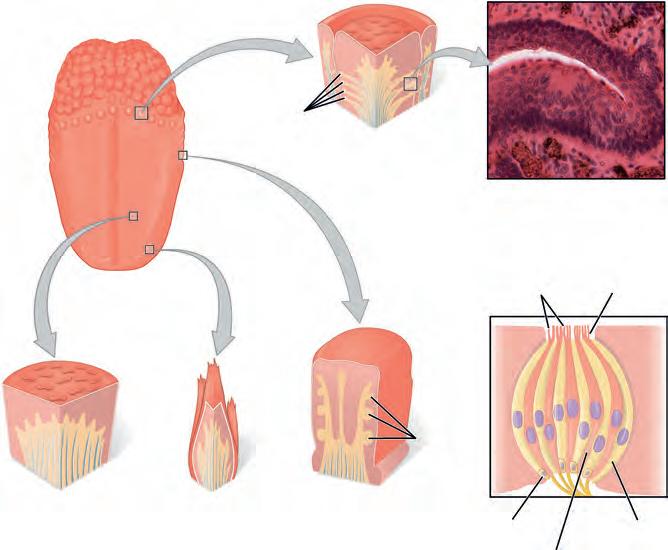
Taste buds play a crucial role in our sense of taste. The human tongue can contain thousands of taste buds, which detect different types of taste such as sweet, sour, salty, bitter and umami (savoury). Each taste bud is made up of groups of specialised cells called taste receptor cells, which are stimulated by different chemicals in the food we eat.
When a taste receptor cell is activated, it sends a signal to the brain, which then translates the information into the sensation of taste. The location and number of taste buds varies from person to person, which can influence individual preferences for different types of food.
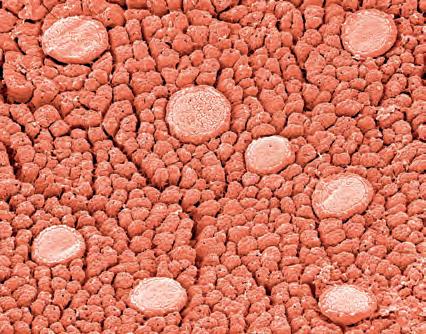
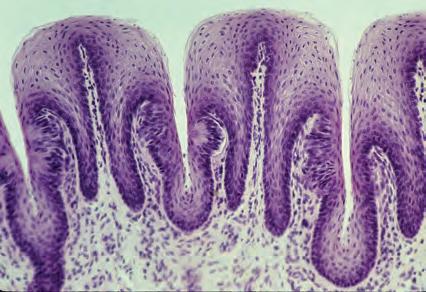
Look carefully at Figures 3.5 and 3.6 and answer the following questions.
1. Describe what you see in the images of papillae.
2. How do these images make you feel?
3. What do the images make you think about?
4. What questions do you have after looking at the images? What does it make you wonder about taste buds and other receptors?
The See, feel, think, wonder thinking routine was developed by Project Zero, a research centre at the Harvard Graduate School of Education.
Negative feedback mechanisms are essential for maintaining homeostasis. These mechanisms use a stimulus–response pathway, with an extra step called a 'feedback loop'. In this loop, the response works to fix the original problem (stimulus), and this correction is sent back as feedback (see the red arrow in Figure 3.8).
This mechanism relies on receptors detecting when something in the body goes outside the normal range. This information is processed, and the body responds to bring things back to within normal levels, or 'set point'. Negative feedback loops are used to maintain physiological parameters within narrow limits, such as temperature, blood glucose levels, blood pH and blood pressure.
The circulatory, integumentary, respiratory and muscular systems coordinate to regulate and maintain the body's core temperature within a narrow range.
If the body's core temperature starts to rise, thermoreceptors detect the increase in temperature and send signals to the hypothalamus (a part of the brain). The hypothalamus triggers several responses that work to bring the temperature back down. Sweat glands activate, releasing sweat onto the skin. As the sweat evaporates, it helps to cool the body down. Blood vessels in the skin also dilate (become larger), which allows more blood to flow to the surface of the skin, where it can release heat. These responses work together to reduce the body's temperature back to within the normal range.

The body responds to a decreased core temperature by constricting surface blood vessels, redirecting blood flow towards the central organs and shivering (as outlined in Figure 3.8). This response returns the core temperature to within normal limits and negatively feeds back to switch off the corrective mechanisms.
STIMULUS
A sudden drop in external temperature leads to a reduction in core body temperature
NEGATIVE FEEDBACK
The core body temperature returns to within normal range. This change is detected by the thermoreceptors, which in turn signal the hypothalamus to reduce the stimulation of the effector.
RESPONSE
The body’s core temperature increases
Thermoreceptors in the skin and brain detect the drop in temperature and send a signal to the control centre
CONTROL CENTRE
The hypothalamus in the brain receives the signal and sends a nerve impulse (electrochemical signal) to the effector
EFFECTOR Muscles begin to contract and relax rapidly (shivering) to generate heat
Figure 3.8 A summary of the stages of the stimulus–response model (and associated negative feedback loop) when core body temperature falls.
Extracellular pH refers to the pH level in the extracellular fluid (fluid located outside cells in the body). This fluid surrounds the cells and provides them with nutrients and removes waste products.
The normal extracellular pH range in humans is between 7.35 and 7.45, which is slightly alkaline. The respiratory and renal systems maintain the pH of the extracellular fluid within this narrow range. Any deviations from this range can lead to various health problems and can even be life-threatening.
Carbon dioxide is transported in the blood in the form of bicarbonate ions and dissolved carbon dioxide. When carbon dioxide combines with water in the blood, it forms carbonic acid, which makes the blood more acidic. To maintain the pH of the blood within the normal range, the respiratory and renal systems work together to eliminate excess carbon dioxide from the body. The respiratory system increases the rate and depth of breathing, which increases the elimination of carbon dioxide through exhalation, reducing the carbonic acid in the blood. This is why your respiration rate increases when you exercise: in addition to meeting rising oxygen demands, increased respiration helps to expel the extra carbon dioxide being produced by all the additional cellular activity (e.g. muscle contraction).
The excretory system also plays a role in regulating extracellular pH by excreting excess hydrogen ions or bicarbonate ions in urine.
One of the most well-known responses to a change in light is the constriction or dilation of the pupil in the eye, which helps to control the amount of light that enters the eye. This response is also controlled by negative feedback mechanisms – the constriction or dilation of the pupil is triggered by signals from specialised cells in the retina that detect changes in

light intensity and send signals to the brain, which in turn sends signals to the muscles that control the size of the pupil. When exposed to bright light, the pupil constricts to reduce the amount of light that enters the eye, whereas in low light, the pupil dilates to allow more light in (see Figure 3.9).
The body's sleep–wake cycle is also closely linked to changes in light. The hypothalamus in the brain contains a specialised group of cells called the suprachiasmatic nucleus, which acts as the body's master clock. The suprachiasmatic nucleus receives information from the eyes about changes in light and uses this information to regulate the release of various hormones such as melatonin that help to control the sleep–wake cycle (see Figure 3.10).


Light-induced activation of SCN prevents the production of melatonin by the pineal gland
Changes in light can also affect mood and behaviour. Exposure to bright light can help to boost mood and increase energy levels, whereas exposure to low light can have the opposite effect, making people feel tired and lethargic.
The fight-or-flight response is triggered by the release of stress hormones such as adrenaline and cortisol in response to perceived threats or stressors in the environment. These hormones increase heart rate and blood pressure, delivering more oxygen and nutrients to the body's tissues to prepare it for action. The rate and depth of breathing may also increase to ensure there is enough oxygen in the bloodstream to support the increased activity. This response is regulated by negative feedback mechanisms, as the release of hormones eventually decreases, causing heart rate and blood pressure to return to normal levels. Figure 3.11 Many organisms have a fight-or-flight response.
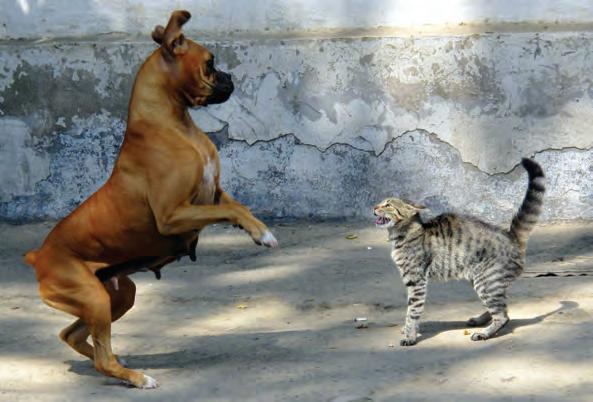
pathogen any organism that can cause disease, such as bacteria, viruses or fungi
The body's observable responses to the presence of pathogens such as bacteria, fungi and viruses are evidence of the immune response. These responses can include inflammation, fever, pain, swelling and changes in behaviour, such as fatigue and lethargy.
Inflammation is a common response; it occurs when the body sends immune cells and fluid to the site of infection to help fight off the pathogen. Fever is another common response – the body raises its temperature to create an inhospitable environment for the pathogen. Once the pathogen is eliminated, negative feedback mechanisms cause the body's immune response to decrease, returning it to its baseline state. The immune system is discussed in greater detail in Chapter 4.

1. State the part(s) of the body that are involved in maintaining homeostasis.
2. Create a stimulus–response model in your notes or on A4 paper and annotate it with information about each of the five parts, similar to Figure 3.3.
3. Define negative feedback.
4. Identify the body systems responsible for maintaining the pH of extracellular fluid.
5. Describe how the eye responds to decreasing light levels.
positive feedback a mechanism that maintains the direction of a stimulus and accelerates its effect
Unlike negative feedback, positive feedback mechanisms maintain the direction of a stimulus and accelerate its effect. In other words, positive feedback drives the system further from its initial state.
Positive feedback is important in childbirth (see Figure 3.13). During childbirth, the hormone oxytocin is released. This stimulates contractions in the uterus, leading to the further release of oxytocin and stronger contractions. This positive feedback loop continues until the baby is born.
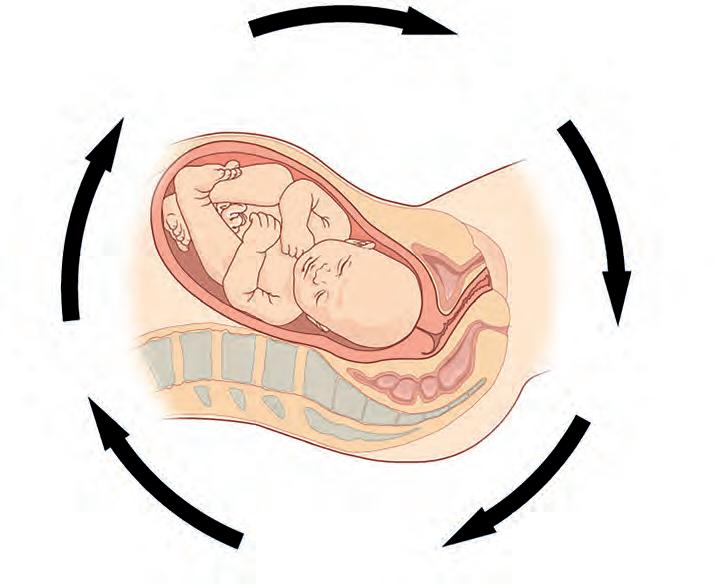
Oxytocin is also produced during breastfeeding. When a baby suckles on the breast, it triggers nerve endings in the nipple, which send a signal to the brain to release oxytocin. Oxytocin then stimulates the muscles surrounding the milk ducts in the breast, causing them to contract and push milk towards the nipple. This contraction further stimulates the nerve endings, which sends a signal to the brain to release even more oxytocin. This positive feedback loop ensures that more milk is produced and released in response to the baby's suckling.
Another example of positive feedback in organisms is the blood clotting process. When a blood vessel is damaged, platelets in the bloodstream are activated and begin to clump together at the site of injury (see Figure 3.14). The platelets release chemicals that further activate more platelets, leading to the formation of a blood clot that seals the wound. This positive feedback loop ensures that the clotting process (see Figure 3.15) is rapid and therefore effective in stopping bleeding.
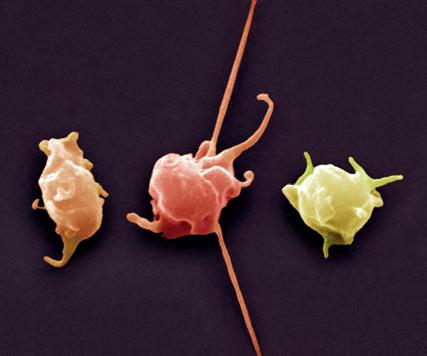
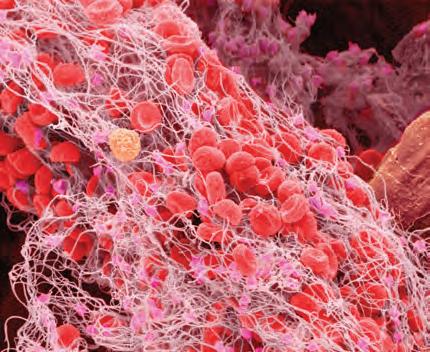
Section 3.1 review
Remembering
1. Homeostasis is the maintenance of a relatively stable internal environment. Name four things that are tightly regulated within the human body.
2. Identify the type of feedback that maintains the direction of a stimulus and accelerates its effect.
3. Recall which systems are involved in providing the body with oxygen and removing carbon dioxide.
4. State the normal pH range of extracellular fluid in humans.
Understanding
5. Describe the negative feedback mechanisms that occur when the body’s temperature increases.
6. Describe how the respiratory system can control extracellular pH.
Applying
7. Summarise the interactions that occur between body systems in order to deliver oxygen to body cells.
Analysing
8. Categorise the following examples as positive or negative feedback.
a) During childbirth, the hormone oxytocin stimulates contractions of the uterus. As the contractions intensify, more oxytocin is released, leading to stronger contractions until the baby is born.
b) When body temperature rises, the body begins to sweat, which cools the skin surface. As the skin cools, sweat production decreases until the body temperature returns to normal.
c) During blood clotting, platelets release chemicals that attract more platelets to the site of injury. As the number of platelets increases, the rate of chemical release also increases, leading to more platelets being recruited until the clot is formed.
d) In response to high levels of glucose in the bloodstream, the body produces insulin. Insulin helps cells to absorb glucose, which in turn reduces the amount of glucose in the bloodstream.
9. Contrast positive and negative feedback.
Evaluating
10. Discuss why the lungs and kidneys are both considered organs involved in excretion.
11. Construct a Venn diagram showing the digestive, circulatory and respiratory systems. In their overlapping zones, summarise in dot points how the systems interact.
12. Construct a labelled diagram showing the stages of the stimulus–response model.
At the end of this section, I will be able to:
1. Describe the role and function of electrical impulses in the body’s responses to internal and external stimuli.
The brain controls all bodily functions by communicating with different parts of the body every second of every day. It does this in two ways: by sending electrical signals and neurotransmitters via the nervous system and by communicating using chemical messengers (hormones) via the endocrine system.
The fundamental units of the nervous system are neurons (also spelled 'neurones') (see Figure 3.16).
A neuron is a single nerve cell responsible for transmitting signals between the brain and the body. Networks of neurons enable the communication of signals throughout the body, collectively making up the nervous system, which consists of up to one trillion neurons.
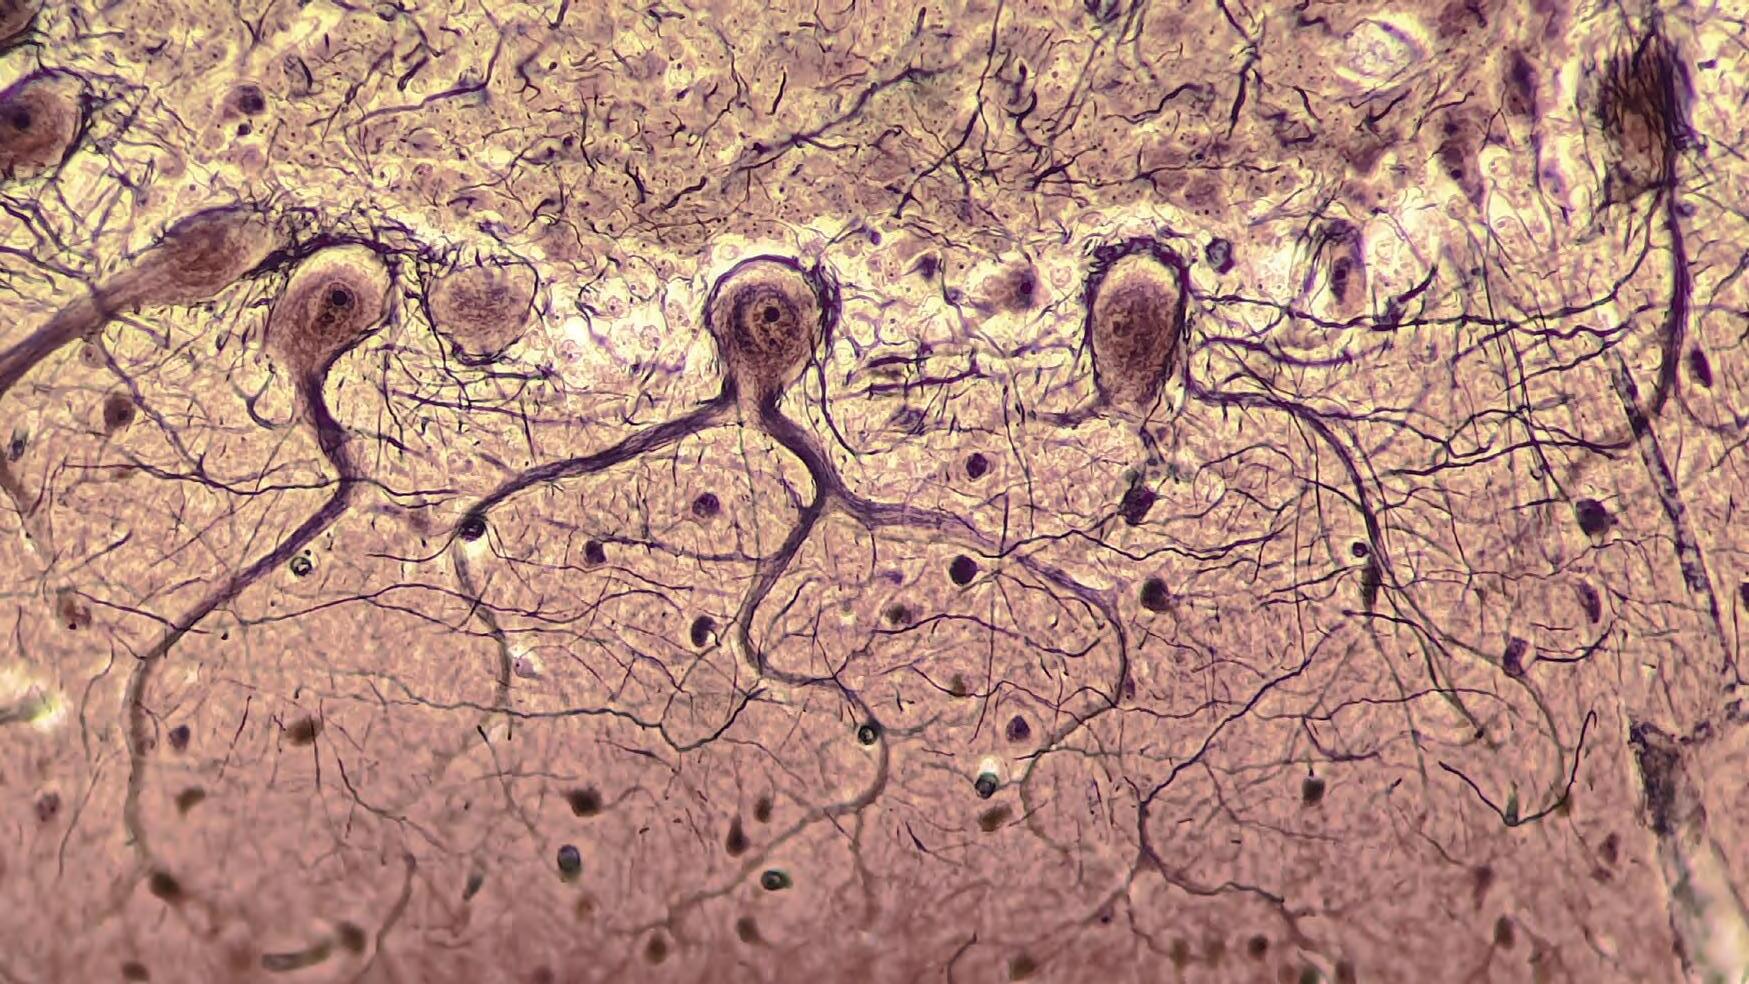
The human nervous system is composed of two main parts:
• central nervous system (CNS), which includes the brain and spinal cord
• peripheral nervous system (PNS), which is all the neurons and nerve networks throughout the body that lie outside the CNS.
The PNS is further divided into the somatic nervous system, which controls the voluntary movement of muscles, and the autonomic nervous system, which controls involuntary body functions, such as digestion, lacrimation (making tears) and salivation. The autonomic nervous system can be further divided into the sympathetic and parasympathetic systems, which have opposing excitatory and relaxing actions on the body. Figure 3.17 shows the key components of the human nervous system.
neuron a nerve cell
nervous system the body system consisting of the brain, spinal cord and peripheral nerves and receptors that communicate messages quickly within the body somatic nervous system the part of the peripheral nervous system involved with the voluntary control of body movements autonomic nervous system the part of the peripheral nervous system involved in involuntary physiological processes such as heart rate and digestion
sensory neuron
a nerve cell that transmits messages from the sensory receptors to the central nervous system
interneuron
a nerve cell that transmits information within the brain and spinal cord (central nervous system)
motor neuron
a nerve cell that transmits messages from the central nervous system to effectors
Nervous system
Brain
Spinal cord Central nervous system (CNS)
Somatic Control of voluntary muscle movements
check 3.3
Peripheral nervous system (PNS)
Autonomic Self-regulatory control over internal muscles, organs and glands
Sympathetic Fight-or-flight
Activates bodily functions responsible for preparing the body for action
Parasympathetic Rest-and-digest Maintains homeostasis
Conserves energy
1. State another name for an individual nerve cell.
2. Recall the components that make up the CNS (central nervous system) and the PNS (peripheral nervous system).
3. Describe the role of the somatic nervous system, giving examples that illustrate the somatic nervous system in action.
Neurons transmit neural information to, from and within the CNS. There are three types of neurons (see Figure 3.19).
• Sensory neurons transmit neural information from sensory receptor sites in the PNS to the CNS. The sensory information being transmitted could be from any of your five senses.
• Interneurons (also called relay neurons) transmit neural information within the spinal cord and brain. Interneurons connect the sensory and motor neurons and can only be found in the CNS.
• Motor neurons transmit neural information from the CNS to the PNS. The purpose of this information is to initiate a response in an effector, which could be a muscle or gland.
To help remember the three types of neurons, think of a SIM (sensory, inter, motor) card in a mobile phone.
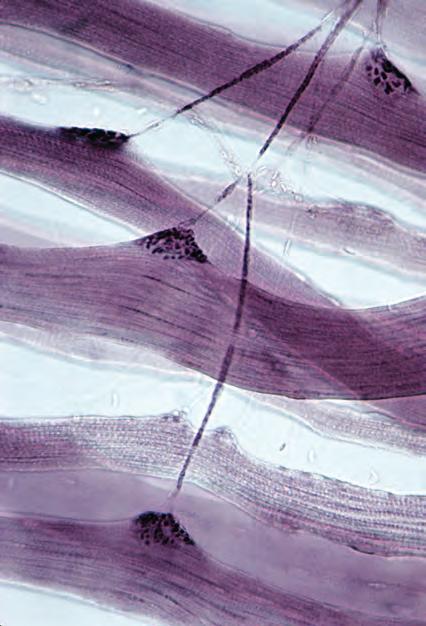


The key structures of the neuron include the dendrites, cell body (soma), axon, myelin sheath, axon terminals and synapse. The synapse is not a true structure – it is the junction between neurons. The synapse includes the axon terminal (of the sending neuron), the gap between the neurons (synaptic cleft) and the dendrite (of the receiving neuron). Chemicals called neurotransmitters are released from a neuron on one side of the synapse and travel across to bind to the neuron on the other side.
Table 3.2 and Figure 3.20 show the key structures of a neuron.
Figure 3.19 The three types of neuron (sensory, inter and motor) form an arc. The sensory neuron has receptors to detect a stimulus and the motor neuron stimulates the effector and causes the response. synapse the junction between two neurons neurotransmitter the chemical messenger that is released from one neuron and travels across the synapse to bind to the next neuron
Neuron
Dendrite Contains receptor sites that receive neurotransmitters from neighbouring neurons
Cell body (soma)Contains most of the cell’s organelles, including the nucleus
Nucleus Control centre of the cell; contains the cell’s genetic material
Axon Transfers electrical impulses from the cell body to the synapse. Axons are called ‘nerves’ when they are grouped together in a bundle.
Myelin sheathA fatty, insulating layer made of Schwann cells that covers the axon. It helps keep the electrical signals inside the cell, allowing faster transmission.
Schwann cellsSpecialised cells that form the myelin sheath
Axon terminal Found at the end of the axon and contains neurotransmitters that are held in vesicles. Neurotransmitters are released once an electrical impulse is received.
Synapse Electrical messages are passed along the neuron, but neurons do not touch one another. There is a gap between the neurons called a synapse. When an electrical impulse is received, the signal diffuses (travels) across the synapse in the form of chemical signals called neurotransmitters. The neurotransmitters then bind to the receptors on the dendrites of the neighbouring neurons.
Table 3.2 Neuron structures and their associated function
Nucleus
Cell body (soma)
Axon
Direction of impulse
Direction of impulse
Figure 3.20 The key structures of a motor neuron. The neural impulse travels in one direction only along the neuron, from the dendrites to the axon terminals.
Quick check 3.4
1. Name the three different types of neurons.
2. Recall where interneurons are found in the body.
3. Interneurons are sometimes called relay neurons. Explain why you think that is an appropriate name.
4. State the function of the myelin sheath that covers the axon.
5. A fly lands on someone’s face and they brush it off. Name the three types of neurons involved, in the order they would be activated when the stimulus is detected.
Create a poster with models of two neurons, showing their structure and function. Make sure your poster has the following features: a title, a model of two adjacent neurons, labels for every structure on one of the neurons (along with a dot point explaining their function) and a label for the synapse.
You will need a piece of A3 paper, and your teacher will provide you with a selection of materials to make the model neurons. Suggestions include pipe cleaners, aluminium foil, pom-poms, drinking straws, modelling clay/plasticine or similar.
1. Cut a pipe cleaner into three pieces. Wrap the pieces of pipe cleaner around a pom-pom. The pipe cleaner pieces will be the dendrites and the pom-pom will be the soma (the cell body of a neuron).
2. Wrap the end of another pipe cleaner around the soma, so you have a long piece coming down. This represents the axon.
3. Cut pieces of drinking straw about 2.5 centimetres (cm) long and thread them onto the axon. Leave gaps between the lengths of straw. You should have a bit of pipe cleaner left at the end. The straw represents the myelin sheath.
4. Take the end of the pipe cleaner near the bottom of the last myelin sheath, twist it into a loop and cut it so it splits – or add more small pipe cleaner pieces. You are beginning to make the axon terminals.
5. Repeat steps 1–4 for the next neuron.
6. Stick the neurons onto the sheet of paper and label the parts of one neuron with a dot point explaining the function of each structure (including the synapse).
7. Put up your posters in the classroom so that the axon terminals of one person’s poster connect to the dendrites on the next poster. You should have a chain of neurons forming a nerve!
An action potential is another name for the electrical or neural impulse that moves along a neuron. Once the action potential reaches the axon terminal, neurotransmitters pass the action potential on to the next neuron.
When a neuron is not sending a neural impulse along its axon, it is 'at rest'. Each neuron requires a minimum level of stimulation – called the neuron's threshold potential – to activate an action potential. When enough neurotransmitters arrive from other neurons, and the threshold is reached, an action potential will begin and move along the axon like a wave. If the threshold is not reached, no action potential can start. This is known as the 'all or none' principle. Once an action potential has been triggered, it is self-sustaining; that is, it will continue to the end of the axon without further stimulation.
The speed of an action potential moving along an axon varies for different neurons. The fastest travel more than 100 metres per second; the slowest travel at about one metre per second. The speed depends on two factors:
• the diameter (width) of the axon – the larger the diameter, the faster the impulse
• whether the axon is insulated with a myelin sheath – an action potential travels faster down an axon with a myelin sheath.
multiple sclerosis
Multiple sclerosis (MS) is a chronic and often disabling autoimmune disorder that affects the CNS. It is caused by the immune system attacking the protective myelin sheath that covers nerve fibres, leading to inflammation and damage to the CNS. This damage can cause a range of symptoms, including muscle weakness, fatigue, vision problems and difficulties with coordination and balance. MS can affect people of any age, but it is typically diagnosed between the ages of 20 and 40, and it is more common in women than men.
Conduct some research to answer the following questions.
1. Recent research has suggested a link between glandular fever (caused by the Epstein-Barr virus) and MS. What evidence has been found to suggest this link?
2. Why is the drug cladribine effective in MS treatment?


Figure 3.21 Multiple sclerosis affects many areas of the body.
When neurons communicate with each other, the action potential travelling down the axon causes neurotransmitters to be released from synaptic vesicles within the axon terminal. This part of the synapse is known as the presynaptic neuron. These specialised chemical messengers then move across the gap between neurons (the synaptic cleft). Scientists have managed to identify more than 100 different neurotransmitters in the human brain alone, but evidence suggests there are significantly more than that. Some of the more common neurotransmitters are described in Table 3.3.
Dopamine Acts within the brain on pathways associated with motor functions (movement) and emotional arousal and motivation
AcetylcholineTransmits the message from the axon terminals of a motor neuron to a skeletal muscle
Serotonin Produced in the intestine and central nervous system; regulates appetite, mood, memory and behaviour
Glutamate A neurotransmitter in the CNS, involved with memory and learning
Table 3.3 Some common neurotransmitters and their roles
A lack of dopamine-producing cells in the brain can cause Parkinson’s disease, a neurological condition characterised by tremors, stiffness and uncoordinated movements.
Curare is a plant-based toxin that was used by South American Indigenous peoples to paint the arrows of blow-darts. When shot at a victim, this toxin prevented acetylcholine from binding to the postsynaptic neuron, causing paralysis.
Some scientists theorise that low levels of serotonin are linked to depression.
High glutamate levels are involved with depression, anxiety and symptoms typical of attention deficit hyperactivity disorder (ADHD), such as the inability to concentrate. Low levels of glutamate are linked to insomnia, lack of concentration and low energy levels.
Once the neurotransmitters cross the synaptic cleft, they bind to special receptor sites on the dendrite of the next neuron – called the postsynaptic neuron. The receptor sites convert the information back into electrical signals, which are then transmitted to the cell body of the postsynaptic neuron and along the axon. This process continues until the last neuron in the pathway connects to a muscle or gland, causing a response. This process is shown in Figures 3.22 and 3.23.
Synapse
Synaptic vesicle
Presynaptic terminal
Neurotransmitter
Action potential Synapse
1
The action potential reaches the presynaptic (axon) terminal.
2 3 4
This triggers the release of neurotransmitters from the synaptic vesicles in the presynaptic axon.
The neurotransmitters bind to receptors on the postsynaptic dendrite.
The action potential transmits through the next cell (postsynaptic neuron).
Figure 3.22 Communication between neurons. An action potential triggers the release of neurotransmitters from their synaptic vesicles in the presynaptic neuron. The neurotransmitters move across the gap and bind to receptors on the postsynaptic neuron.
Uncorrected
Neurotransmitter 1 Will not bind
Neurotransmitter 2 Binds
Figure 3.23 Similar to a key fitting into a lock, a specific neurotransmitter will bind only to its corresponding receptor, which ensures that it only causes the intended response.
Recall that the human body produces many different types of neurotransmitters, and each neurotransmitter has a specific role in the functioning of the brain. Neurotransmitters do this by only binding to specific receptor sites. A neurotransmitter binds to a receptor in much the same way that a key fits into a lock, as Figure 3.23 shows.
Neurotransmitter messages can be categorised as either excitatory or inhibitory. An excitatory neurotransmitter increases the likelihood of the action potential being sent along the next neuron, whereas an inhibitory neurotransmitter decreases the likelihood of the action potential being sent along the next neuron. They are both considered important because they can initiate a response or stop something from happening at the effector site.
For example, GABA is the primary inhibitory neurotransmitter in the central nervous system and has a calming effect. Low levels of GABA have been linked with excess electrical activity in the brain, characterised by seizures.
Figure 3.24 An illustration of a synapse. (a) A synaptic vesicle in the axon terminal storing neurotransmitters, and the neurotransmitters (yellow) crossing the synapse to be received by the receptor sites (red) on the neighbouring neuron’s dendrite. (b) Neurotransmitters (yellow) being released across the synaptic cleft and being received by the receptor sites (red) of the dendrite if they share the same distinct size and shape.
The sciatic nerve contains the longest neuron in the human body. It extends from the spine to the tip of the toe and can be up to one metre in length. It is formed by the combination of five sets of paired nerve roots in a section of the spine and has a diameter of about two centimetres, which is about as thick as your thumb!
3.25 The sciatic nerve contains the longest neuron in the human body.
Headlines: mapping the human
The human brain consists of billions of neurons. These form a complex network of neural pathways, which are responsible for our thoughts and memories. Despite its importance, scientists still lack the technology to map even a small number of the connections within the human brain.
However, in March 2023, an international team of scientists at the MRC Laboratory of Molecular Biology, University of Cambridge, UK, and Johns Hopkins University, USA, successfully mapped a fruit fly brain. This is the most complex brain to be mapped to date. While different in scale and complexity to the human brain, the fruit fly brain has many similarities: it has two hemispheres, a brainstem-like structure, and a spinal cord equivalent. So, the fruit fly brain may offer insights into the functioning of the human brain.
3.26 The first digital connectome of an organism – a fruit fly. A connectome is a map of neural connections in the brain.
• Write a headline that captures the most important part of this research.
• How does your headline differ from what you might have said yesterday?
The Headlines thinking routine was developed by Project Zero, a research centre at the Harvard Graduate School of Education.
Quick check 3.5
1. State if an action potential is a signal between two neurons, along a neuron or along an axon.
2. Recall what the ‘all or none’ principle means.
3. Define ‘neurotransmitter’.
4. Describe the role of the postsynaptic neuron.
5. Recall three common neurotransmitters, including their functions.
6. Organise the stages of the following flow chart in the correct order, showing how an action potential passes from one neuron to another. Action potential stimulates synaptic vesicles to release neurotransmitters Action potential initiated once threshold is reached
Neurotransmitters released into synaptic cleft Action potential travels along axon of presynaptic neuron
Neurotransmitters bind to receptor sites on dendrites of postsynaptic neuron
Did you know? 3.2
Drugs are substances that affect the brain by altering the way neurons send, receive and process information. Certain drugs, such as marijuana and heroin, imitate naturally occurring neurotransmitters to activate neurons. Other drugs, such as cocaine and amphetamines, stimulate neurons to produce more of the natural neurotransmitters, amplifying signals, blocking recycling of the chemicals, and disrupting communication channels.
Neurodegenerative diseases refer to a variety of conditions that primarily affect neurons in the human brain. They include Parkinson’s disease, Alzheimer’s disease and multiple sclerosis. Parkinson’s disease is a progressive and degenerative neurological condition that impairs a person’s ability to control their body movements, resulting in both motor and non-motor symptoms. This is caused by the loss of cells in various areas of the brain, including the substantia nigra, where dopamine production occurs. As dopamine production decreases, the nervous system’s motor functions become impaired, leading to symptoms such as tremors and rigidity.
Although there is currently no cure for Parkinson’s disease, medication can help manage its motor symptoms by increasing dopamine levels or mimicking the neurotransmitter’s effects. The development of diagnostic and treatment technologies for neurodegenerative diseases relies on advances in brain imaging and diagnostic tools. For example, a NeuroMotor Pen developed by a British company can diagnose nerve disorders such as Parkinson’s disease by assessing a patient’s handwriting and drawing tasks. Abnormalities are identified and used as ‘digital biomarkers’ to monitor patient progress. Additionally, low-cost wearable sensors and mobile phone applications can continuously detect and quantify a patient’s symptoms, generating daily reports that alert doctors of any unusual data.
Conduct some research on one of the following topics.
• An imaging technique that allows us to identify and learn about Parkinson’s disease (e.g. PET scans or DaT/SPECT imaging)
• A technology developed to aid people with Parkinson’s disease (e.g. wearable sensor networks, MagnaReady’s line of men’s and women’s shirts with magnetic buttons, SteadyMouse, the NexStride mobility aid or GlideTrak)
Summarise your findings by explaining how technologies have improved knowledge and understanding of Parkinson’s disease or have helped people with Parkinson’s live better lives.
Try this 3.2
neurotransmission at the synapse
Use a stop motion app to create a short animation that clearly represents how neurotransmission occurs between neurons. Alternatively, you could construct a comic-book-style outline or a poster.
Label the following components.
• Presynaptic neuron (axon terminal)
• Synaptic vesicles
• Neurotransmitters
• Postsynaptic neuron (dendrites)
• Receptor sites
• Synapse
• Action potential
• Synaptic cleft
Your animation should show the movement of vesicles binding with the cell membrane and releasing neurotransmitters to the next neuron.
A reflex action is a fast, automatic response that protects the body from harm. At times, the body must react quickly without waiting for the brain to process the stimulus and issue instructions (relying on the stimulus–response model). During such instances, the spinal cord is mainly responsible for detecting the stimulus and initiating a response. While a message is passed to the brain, it is done so only after a brief delay, and the brain registers both the stimulus and the response after the reflex action has already taken place.
A reflex action, also known as a reflex arc, involves a maximum of three neurons. The signal travels to the spinal cord and then returns to the muscle, prompting a rapid contraction that does not involve the brain. Figure 3.28 shows an example of a reflex arc.
Figure 3.28 An example of a reflex arc. When you touch a prickly cactus with your finger, a receptor in a sensory neuron detects the pain and initiates an action potential. The impulse is carried to the spinal cord, where the sensory neuron connects to an interneuron. The interneuron then connects to a motor neuron that sends an action potential through to the muscle tissue. Your muscles contract and you move your hand away from the sharp cactus.
Try this 3.3
stimulus–response model
A person sees a can of soft drink sitting on the bench. They feel quite thirsty, so they reach out and pick up the can to have a drink.
Referring to the components defined in the following table, describe how the person’s actions fit the stimulus–response model.
Part of the
stimulus–response model
Stimulus
Definition of this part
Change in the environment
Receptors Detect the stimulus and stimulate the sensory neuron
Sensory neurons
Transmit an action potential (nerve impulse) to the integration area (the CNS)
CNS Brain coordinates an appropriate response by sending nerve impulse along interneurons which connect to motor neurons
Motor neurons
Effectors
Transmits an action potential (nerve impulse) to the effector organ (muscle or gland)
Act to cause the response
Response Body’s reaction to the stimulus
The 'knee-jerk' reflex is a common type of reflex action. During a knee-jerk reflex test, a healthcare professional taps the quadriceps tendon beneath the kneecap with a reflex hammer (see Figure 3.29). The quadriceps tendon is connected to the quadriceps muscle located on top of the thigh. The tap of the hammer induces a slight stretch within the quadriceps muscle. Receptors in the muscle detect this stretch and send a message to the muscle. The knee-jerk reflex is unique because it is monosynaptic, meaning that no interneurons are involved. Instead, the sensory neuron transmits the message directly across a synapse to a motor neuron in the spinal cord. The motor neurons then conduct the impulse back to the quadriceps, causing a muscle contraction that triggers a kick. This kick confirms to the healthcare professional that a specific section of the spinal cord and the associated nerves are functioning correctly. Various reflex tests are required to obtain a more precise health assessment of the entire nervous system.
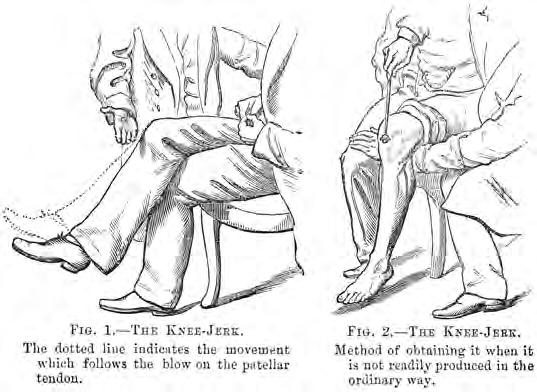
The knee-jerk reflex is in use whenever a person stands up. When standing upright, the muscles are continuously contracting and stretching to maintain balance. If a person leans back while standing, their quadriceps are stretched, and the reflex is activated. Since the person is standing, the muscle contraction that would usually cause a kick upwards instead brings them back to a stable central position. This reflex, in combination with the Achilles reflex, helps people maintain balance while walking.
Try this 3.4
Part A: testing your pupillary reflex
1. In a well-lit room, look closely at the eyes of your partner and estimate the diameter of their pupils in millimetres.
2. Ask your partner to close their eyes for 60 seconds and tilt their head down towards the floor. Time this using a stopwatch.
3. Ask your partner to tilt their head up towards the light and open their eyes. Observe the response in their pupils closely.
Part B: testing your knee-jerk reflex
1. Position your partner sitting in a chair, with one leg crossed over the other. Refer to Figure 3.29.
2. Using the side of your hand or a ruler, gently strike the patellar tendon just below the kneecap and observe what happens. Note: You may need to repeat this several times to get a result.
testing your reaction times
Reaction time is a measure of how quickly a person responds to a stimulus. Many factors can affect reaction time, including age, gender, practice, blood sugar, alcohol, caffeine and general fitness.
Aim
To investigate the effect of practice on reaction times
Materials
• stopwatch
• ruler
• well-lit room
Method
1. Write a rationale on reaction times and the factors that affect this.
2. Create a relevant and specific research question based on the experimental method outlined below.
3. Write a risk assessment for this investigation.
Do not practise the experiment before starting to collect the results. You should start measuring immediately to ensure that you can determine the effect of practice time.
4. Have your partner lean their forearm on a bench with their weakest hand extending over the edge. If they are left-handed, they should use their right hand and vice versa. Ask them to make a pincer grip with their thumb and index finger with a gap of 2 cm between them.
5. Dangle the ruler above their hand so that the end marked 0 cm is hanging between their thumb and index finger.
6. Instruct them to catch the ruler with their thumb and index finger when they notice you have released it.
7. Release the ruler without warning.
8. Take note of the measurement on the ruler where they have caught it. This is the number of centimetres that the ruler fell before the person responded. Use the conversion table (Table 3.4) to determine the reaction time.
9. Each person should complete the drop test 10 times. Record the ruler reading and reaction time for each test.
Table 3.4 Conversion table for reaction times
Results
1. Create a results table for this experiment.
2. Construct a graph of drop test number versus reaction time.
Discussion: Analysis
1. Identify any patterns, trends or relationships in your results.
2. The ruler drop experiment is not really testing a reflex. Draw a stimulus–response flow chart, highlighting the part that proves this is not a simple reflex. Explain why this is the case.
3. Compare your results with those of other people in your class. Do students who play particular sports or musical instruments have faster reaction times?
Discussion: Evaluation
1. Identify any potential sources of error in this experiment.
2. Suggest any changes that could be made to the method to improve the quality of the data in future experiments. Justify your suggestions by explaining how each change will improve the data quality.
Conclusion
1. Make a claim regarding practice and reaction times.
2. Support your claim by referring to your experimental data, and include potential sources of error.
3. Explain how the data supports your claim. Start your sentence with ‘This means that…’.
Did you know? 3.3
Conscious and unconscious responses
A reflex action is an unconscious process because the brain is not initially involved in activating a response. This is different from a conscious process where the brain is involved in activating a response. The differences are shown in the following table.
Conscious response to stimuli
Unconscious response to stimuli
Reaction involves the brain and a level of awareness Reaction does not involve a level of awareness by the brain
Attention must be paid to stimulusAttention does not have to be paid to stimulus
Voluntary or intentional reactionInvoluntary or unintentional
Goal is often directed or purposefulReflexive or automatic, increasing chances of survival
Can be a more complex responseMost are simple responses
Tend to vary
Can be learned
Can be controlled
Tend to occur in the same way each time
Do not require learning
May not be controllable
Section 3.2 review
Section 3.2 questions
Remembering
1. Name the three different types of neurons in the human nervous system.
2. a) Define ‘reflex action’.
b) Describe the role of a reflex action in defending the body against damage.
3. State an example of a reflex action.
4. State the function of dendrites.
Understanding
5. A person picks up a very hot cup of coffee and immediately drops it, breaking the cup. Create a flow chart of this action, beginning at the stimulus and ending in the response. Highlight the section of the flow chart that demonstrates whether this is a reflex or a response coordinated by the brain.
6. Draw a motor neuron, labelling all the key structures.
7. Describe how an action potential is triggered and transmitted from one neuron to the next.
8. Describe a synapse.
Applying
9. The diagram shows how an impulse moving along an interneuron causes an impulse to be sent along another type of neuron, neuron X.
a) Identify the name given to neuron X.
b) Describe how information passes from the interneuron to neuron X. Use the diagram to help you.
10. Explain how neurotransmitters cross a synapse.
11. If a drug blocks the receptor sites, explain the effect it could have on neurotransmission across the synapse.
12. Distinguish between the stimulus and the response in the knee-jerk reflex.
13. Identify two differences between a conscious and an unconscious response to stimuli.
14. Contrast the functions of the motor neuron and the sensory neuron.
15. Using the stimulus–response model, construct a flow chart showing the steps involved in the scenario that follows below. Be sure to include these terms on your flow chart: stimulus, motor neuron, muscle, interneuron, sensory neuron, receptor.
Scenario: A person is standing in a crowd and hears someone call their name. They turn their head to see who called them.
16. Imagine this: You sneak up behind someone and make a sudden loud noise. They respond by blinking, twitching, moving their head suddenly, screaming or throwing their hands up. Using your knowledge of reflexes, discuss whether their response is voluntary, and give some reasons why this reflex might be a helpful mechanism to have.
17. Caffeine is known to increase alertness levels. You usually feel tired when the neurotransmitter adenosine is released. Discuss how caffeine may affect adenosine receptors.
18. Dopamine is a neurotransmitter that is involved in making us feel good. Caffeine works by slowing down the rate of dopamine leaving the brain to your body, while at the same time not affecting the rate at which it is released into your brain. This leads to an increased level of dopamine in the brain for a short time. Deduce how this might affect your feelings and behaviour.


At the end of this section, I will be able to:
1. Describe the role and function of hormones in the body’s responses to external stimuli.
2. Describe how negative feedback mechanisms serve to maintain balance in internal systems.
3. Describe the effects of a disorder in a feedback system.
The nervous system works in tandem with the endocrine system. The endocrine system includes glands throughout the body that secrete hormones that regulate a variety of bodily processes, such as metabolism, digestion, blood pressure and growth. Although the endocrine system is not directly connected to the nervous system, the two interact in many ways. Some of the most important endocrine glands are in the brain. These include the pineal gland, the hypothalamus and the pituitary gland.
At the base of the forebrain is a tiny collection of neurons known as the hypothalamus (see Figure 3.31). The hypothalamus links the nervous and endocrine systems. It is responsible for regulating several behaviours, such as sleep, hunger, thirst, sexual behaviour, and emotional and stress responses. The hypothalamus also controls the pituitary gland and the release of several different hormones.
Other important glands in the body are the thyroid, thymus and adrenal glands, and the pancreas, ovaries and testes (see Figure 3.32). These glands are involved in regulating metabolism, fight-orflight responses and reproductive processes.


Hormones are chemical messengers sent by the endocrine system to communicate with other parts of the body. They are made by endocrine glands, which secrete the hormones directly into the circulatory or lymphatic systems. The blood or lymph carries the hormones around the body, so hormones are transported to, and have an effect in, a different part of the body from where they are made.
The cells that hormones affect are called target cells. Target cells have receptors on their surface that are specific to that hormone, which explains why hormones can circulate through the body freely without affecting other tissues.
Organisms are coordinated by many hormones, and small amounts of these chemicals can have major effects. Table 3.5 shows where some hormones are produced and what effect they have when they reach their target site.
Insulin Pancreas Reduces blood glucose levels by increasing glucose uptake by cells and promoting the conversion of excess glucose to glycogen in liver and muscle cells.
Glucagon Pancreas Increases blood glucose levels by stimulating the conversion of stored glycogen into glucose and releasing it into the bloodstream.
Adrenaline Adrenal glandSecreted during times of fear, stress or excitement. Increases heart rate, constricts blood vessels near the skin, dilates blood vessels to some muscles, raises blood pressure, and elevates blood sugar, preparing the body for physical action during the fight-or-flight response.
Erythropoietin Kidneys Promotes the production of red blood cells by the bone marrow.
Growth hormone (GH), antidiuretic hormone (ADH) and others
Pituitary glandGH promotes cell division, growth and repair in the body; ADH regulates the levels of water in the blood, by acting on the kidney tubules.
Melatonin Pineal glandRegulates sleep patterns by inducing sleep. It is released in darkness and ceases to be produced in light.
Testosterone Testes Promotes bone growth, muscle development, facial hair growth, and deepening of the voice in males during puberty.
Oestrogen Ovaries Promotes breast and hair development and changes the shape of the hip bones in females during puberty.
Various thyroid hormones, including thyroxine Thyroid Controls the body’s rate of energy production and metabolism and regulates the body’s sensitivity to other hormones.
Parathyroid hormoneParathyroid glandControls the amount of calcium in the blood and bones.
target cell a cell affected by a specific hormone
Thymosin Thymus Stimulates the development of T-cells, which are important in maintaining a healthy immune system.
Table 3.5 Endocrine glands and their hormones and actions
What might be causing the increasing rates of cancer and metabolic conditions such as diabetes? What is the potential explanation for declining fertility rates? One hypothesis is that exposure to endocrine-disrupting chemicals is affecting our bodily functions. Although the scientific research supporting this hypothesis is mostly based on studies conducted on rats and mice, some researchers believe that it is applicable to humans as well. These chemicals are present in many household products including plastics. As a result, understanding safe levels of exposure is a topic of ongoing research.
1. Where might you find endocrine-disrupting chemicals in your house?
2. What everyday products might you find that contain BPA (bisphenol A)?
3. Discuss the stages of your life during which exposure to endocrine-disrupting hormones might be more harmful.
4. List some ways you could limit your exposure to endocrine-disrupting hormones.
Did you know? 3.4
Adolescents typically need 9.25 hours of sleep a night, but their body clock is shifted 1–3 hours later than other age groups. This means that melatonin, a hormone that regulates sleep, is released later in adolescents, causing them to feel drowsy later than others. Factors such as digital technologies, social media, and academic or athletic commitments can further disrupt sleep patterns. As a result, many adolescents experience sleep deprivation and struggle to wake up in the morning.
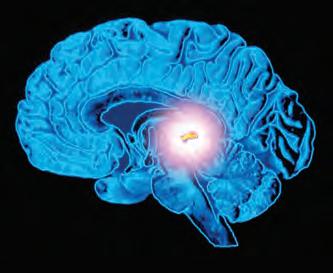
Try this 3.5
1. Every morning for 7 days, record the amount of sleep you had the previous night. Calculate your total sleep over the 7 days in hours.
2. The recommended number of hours of sleep for an adolescent in 7 days is: 9.25 × 7 days = 64.75 hours
Express the amount of sleep you got as a percentage by following this formula: percentage of required sleep = your hours 64.75 × 100
If the percentage is greater than 100, you are getting sufficient sleep. If it is below, you are suffering from sleep debt. The lower the percentage, the greater the sleep debt. For example, if you get 8 hours of sleep each night for 7 days, then 8 × 7 = 56 so, 56 64.75 × 100 = 86.49%. This means you are only getting 86% of the required sleep for a week and are suffering a 14% sleep debt.
3. Collect the results of the whole class and find the average sleep debt of your class.
Did you know? 3.5
Hypothermia is a medical condition that occurs when the body’s core temperature drops below normal levels, typically below 35°C. It can occur if the body’s feedback systems fail to work properly.
For example, if the hypothalamus is damaged or not functioning correctly, it may not be able to detect changes in body temperature and adjust the body’s response accordingly. This can result in the body losing heat faster than it can produce it, leading to hypothermia.

Another way that disorders in feedback systems can lead to hypothermia is by disrupting the body’s ability to produce heat. For example, if the thyroid gland is not functioning correctly and not producing enough thyroid hormone, it can slow down the body’s metabolism, leading to a decrease in heat production. This can also result in hypothermia.
Hypothermia can also lead to some unusual behaviours. Conduct some research on paradoxical undressing and terminal burrowing.
1. Recall the name of the part of the brain at the base of the forebrain that controls many bodily functions such as sleep, hunger and thirst.
2. Describe how hormones are transported around the body.
3. Name the hormone that is responsible for regulating sleep patterns and inducing sleep.
4. Define ‘target cells’.
5. Discuss the effects of oestrogen and testosterone.
Regulation of water levels in the blood is a very important example of homeostasis. It is often referred to as osmoregulation. The amount of water in the blood is measured continuously by a group of osmoreceptors in the hypothalamus of the brain. They can detect if there are low levels of water in the blood (the blood is very concentrated) or high levels of water in the blood (the blood is very dilute).
Figure 3.35 shows the osmoregulation stimulus–response model and associated negative feedback loop.
Blood too concentrated (not enough water)
NEGATIVE FEEDBACK:
Level of water in the blood increased back to normal
RESPONSE
Kidneys reabsorb more water into bloodstream and small volume of concentrated urine produced
RECEPTOR
Detected by cosmoreceptors in the brain (hypothalamus)
osmoregulation the regulation of water levels in the blood/body
CONTROL CENTRE
Hypothalamus stimulates pituitary gland to release more ADH (antidiuretic hormone)
EFFECTOR
More ADH released from the pituitary gland in the brain into bloodstream
feedback mechanism that occurs
insulin a hormone secreted by the pancreas that triggers cells to take up glucose from the bloodstream and the liver, which is then stored as glycogen, lowering blood glucose levels
Using the information provided in this chapter, construct a flow chart showing the stimulus–response model in action for negative feedback regulation of high water levels in the blood (blood becomes too dilute). Ensure your flow chart features all the stages: stimulus, receptor, control centre, effector, response and negative feedback.
glucagon a hormone secreted by the pancreas that triggers the liver and muscle cells to convert glycogen into glucose, raising blood glucose levels
Osmoregulation in response to dehydration is controlled by antidiuretic hormone (ADH), which is formed in the hypothalamus but stored in the pituitary gland. Many body systems are involved in the process.
1. Osmoreceptors in the hypothalamus (CNS) detect low blood water levels (the stimulus).
2. The hypothalamus triggers the pituitary gland (the effector; CNS) to release ADH.
3. ADH is carried by the blood (circulatory system) to the kidneys.
4. ADH increases the ability of the kidney tubules (excretory system) to reabsorb water and return it to the blood.
5. This response causes water levels in the blood to increase, and return to their normal level, completing the negative feedback loop.
Figure 3.36 shows a dehydration colour chart. By matching the colour of urine to the chart, you can tell whether you are dehydrated.
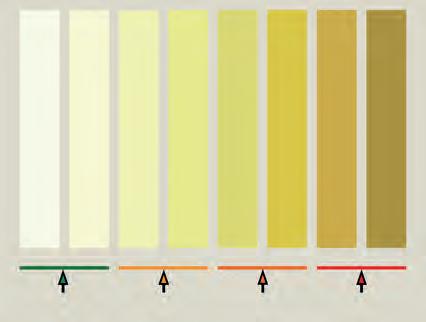
Adequately hydrated Mildly dehydrated Moderately dehydrated Severely dehydrated
urine indicates how concentrated it is, and therefore how dehydrated a person is.
1. Recall the organs that are involved in excretion of wastes.
2. State two functions of the excretory system.
3. Recall what ADH stands for and its role in osmoregulation.
4. State the part of the brain that monitors blood water concentration.
Body cells function best when conditions are stable within narrow physical and chemical ranges, and one of the substances that needs to be highly regulated is the concentration of glucose in blood. Your brain requires a constant glucose supply and is highly sensitive to changes in blood glucose levels, as both high and low blood glucose levels can have serious consequences on the body. The pancreas is the endocrine gland that acts as both the receptor and the control centre in regulating blood glucose levels.
Negative feedback mechanisms play a crucial role in maintaining blood glucose levels. These are controlled by the opposite actions of two pancreatic hormones. Insulin is released by the pancreas when blood glucose levels are high. Insulin signals the liver, muscle and adipose (fat) tissue to take up glucose and store it as glycogen or fat, decreasing the concentration of glucose in the blood. Glucagon is secreted by the pancreas when blood glucose levels are low. Glucagon signals the liver to break down glycogen and release glucose back into the bloodstream, increasing the concentration of glucose in the blood (see Figures 3.37 and 3.38). Once blood sugar levels return
to normal, negative feedback mechanisms signal the pancreas to reduce glucagon secretion, preventing blood sugar levels from rising too high. This balance of insulin and glucagon secretion is critical for maintaining stable blood glucose levels and preventing the harmful effects of hyperglycaemia (high blood sugar) and hypoglycaemia (low blood sugar).
More insulin released by pancreas
Blood glucose levels increase
Glucagon signals the muscle cells and liver cells to release the stored glycogen and convert it back to glucose → blood glucose levels rise Normal blood glucose levels
Blood glucose levels decrease
More glucagon released by pancreas
Insulin causes glucose to move from the blood into the cells. In liver and muscle cells, any excess glucose is converted to glycogen for storage → blood glucose levels fall
Figure 3.37 A flow chart showing how insulin and glucagon maintain stable blood glucose levels
In cases of hyperglycaemia, there is an excess of glucose in the bloodstream. Over time, this can cause damage to blood vessels, nerves and organs, leading to complications such as cardiovascular disease, kidney disease and vision problems. Hypoglycaemia occurs when glucose levels drop too low, which can result in symptoms such as confusion, dizziness and fainting. If left untreated, severe hypoglycaemia can lead to seizures, coma and even death.
Figure 3.38 After a carbohydrate-rich meal, insulin levels in the bloodstream increase because the body needs to decrease the blood glucose levels.
Try this 3.7 regulating blood glucose levels
Using the information provided in this chapter, construct a flow chart showing the stimulus–response model in action for negative feedback regulation of blood glucose levels. You may choose either scenario: blood sugar levels are too high or blood sugar levels are too low. Ensure your flow chart features all the stages: stimulus, receptor, control centre, effector, response and negative feedback.
Extension: Try to draw a double loop that shows both scenarios.
Diabetes is a medical condition where the body does not produce enough insulin or the body cells become resistant to insulin over time. It has become increasingly common in the Australian population, due in part to some lifestyle factors. Conduct some research to answer the following questions.
1. Contrast type 1 and type 2 diabetes.
2. Who is normally affected by each type of diabetes and at what age is it typically diagnosed?
3. How is each type of diabetes treated?

3.39 Adhesive patches can be used to continuously monitor blood sugar levels.
4. What are some of the factors that predispose people to developing diabetes?
5. Conduct some research on some of the new technologies that are being developed to support people with diabetes. You may want to consider new insulin pumps, infusion devices, continuous glucose monitors and smartphone apps.
1. After a meal rich in simple carbohydrates, your blood glucose levels rise sharply. Recall the hormone that is released by the pancreas to decrease the levels.
2. Define ‘hypoglycaemia’.
3. Outline the role that glucagon plays in the body.
Disorders in feedback systems can lead to diabetes-induced blindness through a process called diabetic retinopathy. In diabetes, the high levels of glucose in the blood can damage the blood vessels throughout the body, including those in the retina of the eye.
The retina is a layer of tissue in the back of the eye that is responsible for transmitting visual signals to the brain. The blood vessels in the retina can become damaged due to high blood sugar levels. The small blood vessels in the retina become weakened and leak fluid, leading to swelling and eventually scarring. As the condition progresses, new blood vessels may grow to compensate for the damage, but these vessels are often weak and prone to bleeding, which can further damage the retina and lead to vision loss.
Disorders in feedback systems, such as those that regulate blood sugar levels, can exacerbate the development of diabetic retinopathy. Poorly controlled blood sugar levels can accelerate the progression of the condition, making it more likely that a person with diabetes will develop blindness.
Complete some research to find out why people with diabetes also have to be careful about their foot care.
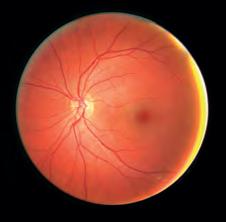
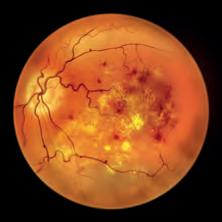
The two key hormones involved in regulating hunger are ghrelin and leptin. Ghrelin is produced by the stomach and stimulates hunger by increasing appetite and food intake. When the stomach is empty, ghrelin levels rise, signalling to the brain that the body needs food. Ghrelin then activates certain brain regions involved in appetite regulation, including the hypothalamus, which triggers the release of chemicals that increase appetite and food intake.
Ghrelin levels fluctuate throughout the day, with the highest levels typically occurring before meals and the lowest levels occurring after meals. Leptin is produced by fat cells (in adipose tissue) and signals to the brain that the body has enough energy stores, suppressing appetite and promoting energy expenditure (see Figure 3.41).


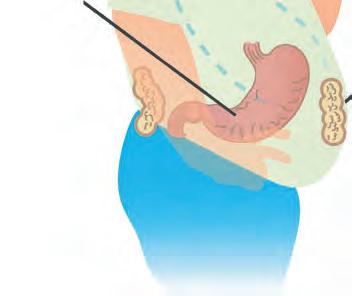


The understanding of feedback mechanisms has enabled pharmaceuticals and other products to be developed that address various health issues and enhance performance. For example, scientists have developed synthetic insulin that mimics the natural hormone’s actions to help people with type 1 diabetes maintain healthy blood glucose levels.
Similarly, sports drinks often contain electrolytes such as sodium, potassium and magnesium, which are essential for maintaining proper hydration and electrolyte balance during exercise. The feedback mechanism involving the kidneys and hormones such as aldosterone helps regulate electrolyte levels in the body. Understanding these mechanisms has enabled the development of sports drinks that help enhance athletic performance by promoting proper hydration and electrolyte balance.
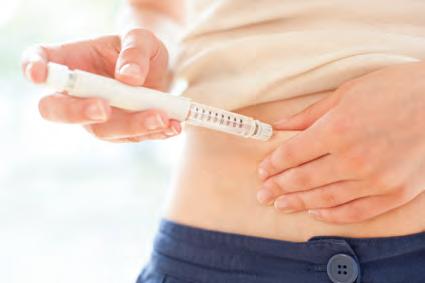


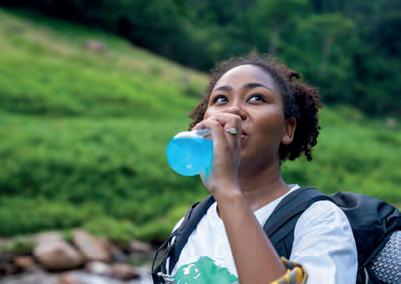
The homeostatic control of blood pressure is essential for survival. Both high and low blood pressure can be dangerous, resulting in damage to internal organs or even loss of consciousness. To maintain blood pressure within a safe range, the heart and blood vessels contain specialised pressure receptors called baroreceptors, which detect changes in blood pressure.
When blood pressure is too low, the brain stem receives signals from the baroreceptors and sends signals to the heart to increase its rate and to the blood vessels to constrict, raising blood pressure. Conversely, when blood pressure is too high, the brain stem sends signals to the heart to slow down and to the blood vessels to dilate, thereby lowering blood pressure.
The kidneys and antidiuretic hormone (ADH) are also involved in maintaining the homeostasis of blood pressure. The kidneys play a crucial role in regulating blood pressure by controlling the water balance in the body. When blood pressure is too high, the kidneys respond by decreasing the reabsorption of water, leading to increased urine production. This helps to eliminate excess water from the body, subsequently reducing blood volume and lowering blood pressure.
When blood pressure is low, ADH increases the kidneys' permeability to water, allowing them to reabsorb more water back into the bloodstream. This reduces urine production and helps to conserve water in the body, increasing blood volume and raising blood pressure.
Did you know? 3.7
Blood pressure monitors work by measuring the force of blood against the walls of the arteries as it circulates through the body. There are two main types of blood pressure monitors: manual and electronic.
Manual blood pressure monitors, also known as sphygmomanometers, have a cuff that is wrapped around the upper arm and inflated until it stops blood flow. The healthcare professional listens to two sounds in the artery as the cuff deflates. The first sound shows the pressure when the heart contracts and the second sound shows the pressure when the heart is at rest.
Electronic blood pressure monitors, also known as digital or automatic blood pressure monitors, use an electronic sensor to detect the vibrations of blood flow through the brachial artery. The cuff is wrapped around the upper arm and inflated automatically by the device. As the cuff deflates, the device measures the vibrations caused by blood flow and converts them into digital readings that display on a screen.

Iron is a vital nutrient that is necessary for many biological processes, including oxygen transport and DNA synthesis. However, excess iron can be toxic to the body, so it is essential to maintain iron levels within a narrow range.
The body’s negative feedback mechanisms regulate iron levels through the hormone hepcidin, which is produced in the liver. Hepcidin binds to ferroportin, a protein on the surface of cells that moves iron from the cell into the bloodstream. The binding of hepcidin causes ferroportin to degrade, which reduces the amount of iron that is released into the bloodstream.
When iron levels in the blood are low, the body produces less hepcidin, which allows ferroportin to move more iron into the bloodstream, increasing iron levels. Conversely, when iron levels are high, the body produces more hepcidin, lowering iron levels.
This negative feedback loop helps to maintain balance in internal iron levels by regulating the amount of iron that is absorbed from food and the amount that is released from iron stores in the body, such as the liver and the spleen.
In addition to hepcidin regulation, the body has other mechanisms to control iron levels, such as iron-binding proteins, which bind to excess iron and prevent it from causing damage to tissues and organs.
Complete some research to determine why adolescent girls are at a higher risk of having an iron deficiency.

Try this 3.8 regulating blood pressure
Using the information provided in this chapter, construct a flow chart showing the stimulus–response model in action for negative feedback regulation of blood pressure. You may choose either scenario: blood pressure is too high or blood pressure is too low. Ensure your flow chart features all the stages: stimulus, receptor, control centre, effector, response and negative feedback.
Then, convert your flowchart into an interactive presentation using slideshow/animation software. Users should be able to navigate through each step to explore how the body regulates blood pressure via negative feedback.
Extension: Try to draw a double loop that shows both scenarios.
Quick check 3.10
1. Recall the location of the baroreceptor sites that detect changes in blood pressure.
2. Other than the heart, name an organ that is involved in maintaining blood pressure.
3. Recall what parts of the body produce leptin and ghrelin.
Your body’s energy needs vary according to how active you are. When you are resting, you require less energy, so you consume less oxygen. During exercise, your respiratory and circulatory systems must work together to meet your increased energy needs.
As you exercise, your large muscle groups contract harder and more frequently, which requires energy. The cells require more oxygen because it is a required reactant of cellular respiration (breaking down glucose to release energy). This increased oxygen demand is achieved by:
• increasing your respiratory rate (breaths per minute) – breathing harder and faster means more oxygen can enter the bloodstream and you can also exhale more carbon dioxide
• increasing your heart rate and blood pressure – this pumps the oxygen faster to the cells.
Aim
To investigate the effect of low- and high-intensity exercise on heart rate and breathing rate
Materials
• stopwatch
• calculator
• (optional) sporting watch/device that can record pulse in bpm, or a pulse oximeter
Method
1. Construct a specific and relevant research question based on the experimental method.
2. Copy the results table.
3. Measure your partner’s resting heart rate by placing your index and middle fingers on the inside of their wrist (see Figure 3.46). Using the stopwatch, count the number of beats in a 15-second period. (Optional: Wear a heart rate monitor.)
4. Get your partner to count how many times they take a breath in this 15-second period.

5. Multiply both numbers by 4 to get heart rate (beats per minute) and breathing rate (breaths per minute). Record these in the table.
6. Instruct your partner to walk at their usual pace outside for a 2-minute period (low intensity). Then, immediately measure your partner’s heart rate and get them to count how many times they take a breath in a 15-second period.
7. Multiply both values by 4 and record this in the table.
8. Measure the heart rate and breathing rate twice more: once 1 minute after they stopped walking and once 2 minutes after.
9. Instruct your partner to run around outside for a 2-minute period (high intensity). Then, immediately measure their heart rate and get them to count how many times they take a breath in a 15-second period.
10. Multiply both values by 4 and record this in the table.
11. Measure the heart rate and breathing rate twice more: once 1 minute after they stopped running and once 2 minutes after.
Results
Copy and complete the following table.
Table showing change in heart rate and breathing rate in response to exercise
Time after exercise (min) Heart beats in 15 s
At rest (resting)
Low-intensity exercise (2-minute walk)
(breaths per minute)
High-intensity exercise (2-minute run)
Using Excel or graph paper, construct a graph showing the change in breathing rate and heart rate per minute when performing low-intensity and high-intensity exercise.
Discussion: Analysis
1. Describe any trends, patterns or relationships in your results.
2. Explain your results (both heart rate and breathing rate) with reference to the homeostatic mechanisms occurring in the body.
3. Compare how long it took for the heart rate and breathing rate to return to rest after low-intensity and high-intensity exercise.
Discussion: Evaluation
1. Discuss any potential sources of error in this experiment.
2. Propose at least two improvements to this experiment.
Conclusion
1. Make a claim regarding exercise intensity and the effects on heart rate and breathing rate.
2. Support your claim by referring to your experimental data, and include potential sources of error.
3. Explain how the data supports your claim. Start your sentence with ‘This means that…’.
Extension
1. Create your own experiment that measures the effect of low- and high-intensity exercise on heart rate and breathing rate.
Homeostasis is maintained by the endocrine and nervous systems working together. The nervous system plays the primary role in controlling and coordinating most actions of the human body. It works in partnership with the endocrine system, which produces particular hormones that are released into the bloodstream in response to external or internal changes.
The two systems work as a team by using chemical messengers and electrical impulses to communicate with cells and glands. The speed of message transmission and the length of the effects differ between the two systems: the nervous system provides fast-acting, short-lasting effects and the endocrine system triggers slow-acting, long-lasting effects.
The endocrine and nervous systems work in a coordinated way with all the other body systems to maintain a relatively stable internal environment and protect the body from harm.
The key differences between the features of the endocrine and nervous systems are summarised in Table 3.6.
Signals
Pathway
Electrical impulses along an axon, and chemical messages via neurotransmitters across synapses
Transmission by neurons in the nervous system
Chemical messengers (hormones)
Transported in the bloodstream (circulatory system) and lymph (lymphatic system)
Speed of information transfer Fast Slow
Duration of effectShort lived
Type of action and response
Target cells
Voluntary or involuntary
Localised cells
Example of actionA friend throws a ball towards you. Your sensory receptors capture the visual stimulus, and relay the message to your brain via a network of sensory neurons. Messages are conveyed by interneurons through the CNS. Motor neurons branching from the spinal cord to the muscles stimulate the muscle to contract, and you reach out and catch the ball.
Table 3.6 A comparison of the nervous and endocrine systems
Typically longer lasting
Involuntary
Systemic (many cells may be affected)
When a male reaches puberty, the pituitary gland secretes a hormone called luteinising hormone. This acts on the testes and stimulates them to release testosterone. As the amount of testosterone builds up, it triggers sperm production, muscle development, hair growth and changes to the voice.
3.3
Section 3.3 questions
Remembering
1. Name two endocrine glands in the brain.
2. Recall how hormones reach their target cells.
3. Recall the hormones secreted by the pancreas and what effect they have.
Understanding
4. Explain the difference in the speed of transmission within the nervous system as compared to the endocrine system.
Applying
5. Construct a Venn diagram that shows the similarities and differences between the nervous and endocrine systems.
Analysing
6. The graph below shows the results of a glucose tolerance test for two patients, A and B. Use data from the graph to identify which patient has diabetes.
7. A person who has undergone a serious and lengthy surgical operation stands up for the first time after the surgery. They lost a significant amount of blood during the procedure and their blood pressure is low, making them feel dizzy. Construct a stimulus–response model showing the steps the body would take to address this deviation from normal blood pressure.
Evaluating
8. The contraceptive pill contains a chemical that acts like the hormone oestrogen. The pill must be taken daily by women to be effective at preventing pregnancy. It attempts to stop sperm reaching an egg in several ways, including:
• suppressing ovulation so an egg is not released from the ovaries
• making the cervical mucus thicker so that it becomes more difficult for sperm to reach an egg
• decreasing the thickness of the lining of the womb so it is not thick enough for an egg to attach to it.
Deduce some reasons why the pill is not guaranteed to work 100% of the time.
Chapter checklist
Success criteria
Linked questions
3.1I can describe how the body responds to external and internal stimuli.1, 2, 13b
3.1I can describe the relationships between body systems that are necessary to coordinate a response to stimuli. 10
3.1I can explain how the process of regulation is monitored and adjusted by connections between the receptor, command centre and effector. 7, 11
3.1I can describe how positive feedback mechanisms maintain the direction of a stimulus and accelerate its effect. 17
3.2I can describe the role and function of electrical impulses in the body’s responses to internal and external stimuli. 3, 4, 5, 8, 9, 12, 13a, 15
3.3I can describe the role and function of hormones in the body’s responses to external stimuli. 12
3.3I can describe how negative feedback mechanisms serve to maintain balance in internal systems. 14, 16a
3.3I can describe the effects of a disorder in a feedback system. 6, 16b
Remembering
1. Define ‘homeostasis’.
2. A professional hockey player loses several litres of water during the game. Recall two homeostatic responses their body would use to retain water and maintain blood pressure.

3. Name the key structures A–G of the following neuron.
Understanding
4. Describe a synapse.
5. Describe the steps involved in neurotransmission across a synapse.
Applying
6. Describe how a disorder in a feedback system can lead to hypothermia.
7. Explain how the process of regulation is monitored and adjusted by connections between the receptor, command centre and effector.
Analysing
8. Compare the somatic and autonomic divisions of the nervous system.
9. Classify the following events as being under somatic or autonomic control.
a) Sweating
b) Walking
c) Lacrimation
d) Contractions of the intestine to move food along
10. Summarise how the digestive, circulatory and respiratory systems interact with each other.
11. Categorise the following organs as receptors or effectors.
a) Hypothalamus
b) Mechanoreceptors
c) Liver
d) Kidney tubules
e) Pancreas
f) Skeletal muscles
12. Compare the role and function of electrical impulses and hormones in the body’s responses to external stimuli.
13. Sophia accidentally touches a hot pan and automatically snatches her hand away from it. The diagram shows the structures involved in this action.
a) Identify the structures and label the diagram below.
a) High blood pressure versus low blood pressure
NEGATIVE FEEDBACK:
Blood pressure decreases back to normal level
NEGATIVE FEEDBACK:
Blood
increases back to normal level
RECEPTOR
Pressure receptors in the heart detect changes in the volume and pressure of blood being returned to the heart


b) Contrast Sophia’s response with when she uses an oven mitt to pick up the pan.
14. Copy and complete the flow charts to compare how the body responds to each of the following scenarios. You can do this by identifying what the letters represent.
EFFECTOR
Heart rate decreases and blood vessels dilate (relax)
CONTROL CENTRE
Interpreted in the ‘cardiovascular centre’ in the medulla (brainstem)
Heart
b) High blood glucose levels versus low blood glucose levels
RESPONSE
NEGATIVE FEEDBACK:
Blood glucose levels decrease back to normal
STIMULUS
NEGATIVE FEEDBACK:
Blood glucose levels increase back to normal
RECEPTOR Pancreas
EFFECTOR
Liver, muscle and adipose tissue cells
RESPONSE
Pancreas secretes insulin
CONTROL CENTRE
Pancreas secretes glucagon
EFFECTOR Liver cells
c) High levels of water in the blood versus low levels of water (dehydration)
RESPONSE
NEGATIVE FEEDBACK:
Blood water levels decrease back to normal
STIMULUS
Change in water volume level
(amount of water in blood)
NEGATIVE FEEDBACK:
Blood water levels increase back to normal
Kidneys reabsorb less water into the bloodstream, and produce a large volume of dilute urine
RECEPTOR
Water levels too high Water levels too low
RESPONSE
Kidneys reabsorb more water into the bloodstream, and produce only a small volume of concentrated urine
EFFECTOR
Pituitary gland … B
Hypothalamus inhibits pituitary gland
CONTROL CENTRE
Hypothalamus stimulates pituitary gland
EFFECTOR
Pituitary gland …
15. If a particular drug blocked the receptor sites on the dendrites of the postsynaptic neuron, propose how this may affect the neurotransmitters.
16. People with type 1 diabetes inject insulin to control their blood glucose level. A pancreas transplant is another treatment for type 1 diabetes. One risk of a pancreas transplant is organ rejection, because the body recognises the transplanted organ as ‘non-self’. Scientists have developed an artificial pancreas to treat type 1 diabetes; however, it is still at early stages of commercial use. The figure below shows how an artificial pancreas works.
2. Data is sent to the receiver wirelessly. The information is then viewed on a control device (e.g. smartphone or tablet), to calculate the dose of insulin required.


A woman with type 1 diabetes has an artificial pancreas. The woman eats a meal that causes her blood glucose level to rise sharply.
a) Discuss the steps that would occur to return the blood glucose levels to normal.
b) Assess some problems that could arise if using the artificial pancreas system above and decide whether it is a viable solution for individuals with type 1 diabetes.
17. Decide why positive feedback is important in childbirth.
A Year 9 student with diabetes measures their blood sugar level hourly and the data is plotted in blue in Figure 3.47. Another student, who does not have diabetes, also measures their blood sugar as a comparison, and this is plotted in orange. The students are careful to eat the same three meals on this day – breakfast, lunch and dinner at the same time – and the student with diabetes injects insulin after each meal.
012345 6 789 1011121314
Figure 3.47 Relative blood sugar level over a 24-hour period
Applying
1. Identify the homeostatic (steady state) blood sugar level for each student.
2. Determine the times that the students ate breakfast, lunch and dinner.
3. Recognise the peak blood sugar level for both students on this day.
Analysing
4. Identify any patterns or trends that appear in the data.
5. Contrast the change in blood sugar level after each meal and provide a reason for the difference.
Evaluating
6. Infer a reason for the lower peak in blood sugar for the student with diabetes after eating lunch than after the other meals.
7. Justify whether the comparison of data would be valid if the students ate different meals on this day.
8. After the student with diabetes ate dinner, deduce the time that insulin was injected into the bloodstream.
9. Predict what would happen to the plotted data if the student with diabetes did not use insulin directly after the breakfast meal.
24
Reacting to a stimulus may appear to be an automatic process, but it actually involves the coordination of the various receptors in our body with the brain. To illustrate this, consider a scenario where you are in a car with your friend, when suddenly a dog runs in front of the car. Your friend quickly reacts by pressing the brake pedal, and the dog escapes unharmed.
During this process, the light receptors in your eyes detect the sudden change in lighting conditions on the road and send this information for processing to the brain. The brain then determines if any action is necessary based on this information. Your friend’s brain compares the data from the light sensors with a vast collection of images in their memory and determines that the object in front of the car is likely to be a dog. The brain then sends signals through the nervous system to specific muscles, causing your friend to press the brake pedal.
This entire process takes around 0.25 seconds on average, but the speed may vary depending on levels of alertness. For instance, if your friend was distracted by texting while driving, the outcome could have been different.

if
Investigate whether texting is a distraction to people performing tasks.
or in
In this activity, you will use materials and your imagination to create an experiment that produces:
• at least three sets of data
• at least three bar graphs
• a conclusion that clearly responds to the following scenario.
The Department of Transport and Main Roads in Queensland has concerns about young people’s attitudes towards texting while driving. They have hired your start-up company to carry out a series of experiments in the community to investigate whether texting can impair a person’s reaction time.
• 30 cm ruler
• scissors
• cardboard
• paper
• pen
• mobile phone to record slow-motion videos
• Microsoft PowerPoint, Google slides or Apple Keynote for presentations
• video-editing software for making short documentaries
1. Conduct some research and make a list of the factors that influence a person’s reaction time.
2. Create a table like the one below, and make predictions of how these factors will decrease or increase a person’s reaction time. An example has been provided for you.
Being tired Decrease reaction time moderately When a person is tired, they have a decreased ability to absorb information, which decreases reaction time.
3. Discuss in your group, then list the important information you will need to record about your participants whose reaction times will be tested. Hint: Make sure you have thought about all the factors that might affect a person’s reaction time, such as sleep, exercise and video game playing.
4. Using the materials on the material list, design a way to test the effect of texting on a teenager’s reaction time.
5. Design a table that includes information about each participant’s recorded information.
6. Perform your experiment, making sure you collect multiple sets of data for each participant and their important information.
7. Discuss with your group the challenges you have encountered throughout this project. List the strategies or actions that allowed you to overcome each challenge.
8. Reflection is an integral and vital aspect of any project in the real world. How could you use digital tools (e.g. apps, video, slow-motion camera) to enhance this experiment?
9. If using a ruler for testing reaction times, the results may change depending on the type of ruler used, such as metal, plastic or timber. In this case, predict how the size or length of the ruler, and whether the dominant or non-dominant hand was used, might have affected the results.
10. Consider adding other distracting sounds and sights during the activity, such as turning on a TV set or flicking a torch on and off. Does response time slow when there are multiple sensory signals?
11. Create a graphical representation of your results and present them to the class like you would if presenting to the Queensland Department of Transport and Main Roads.
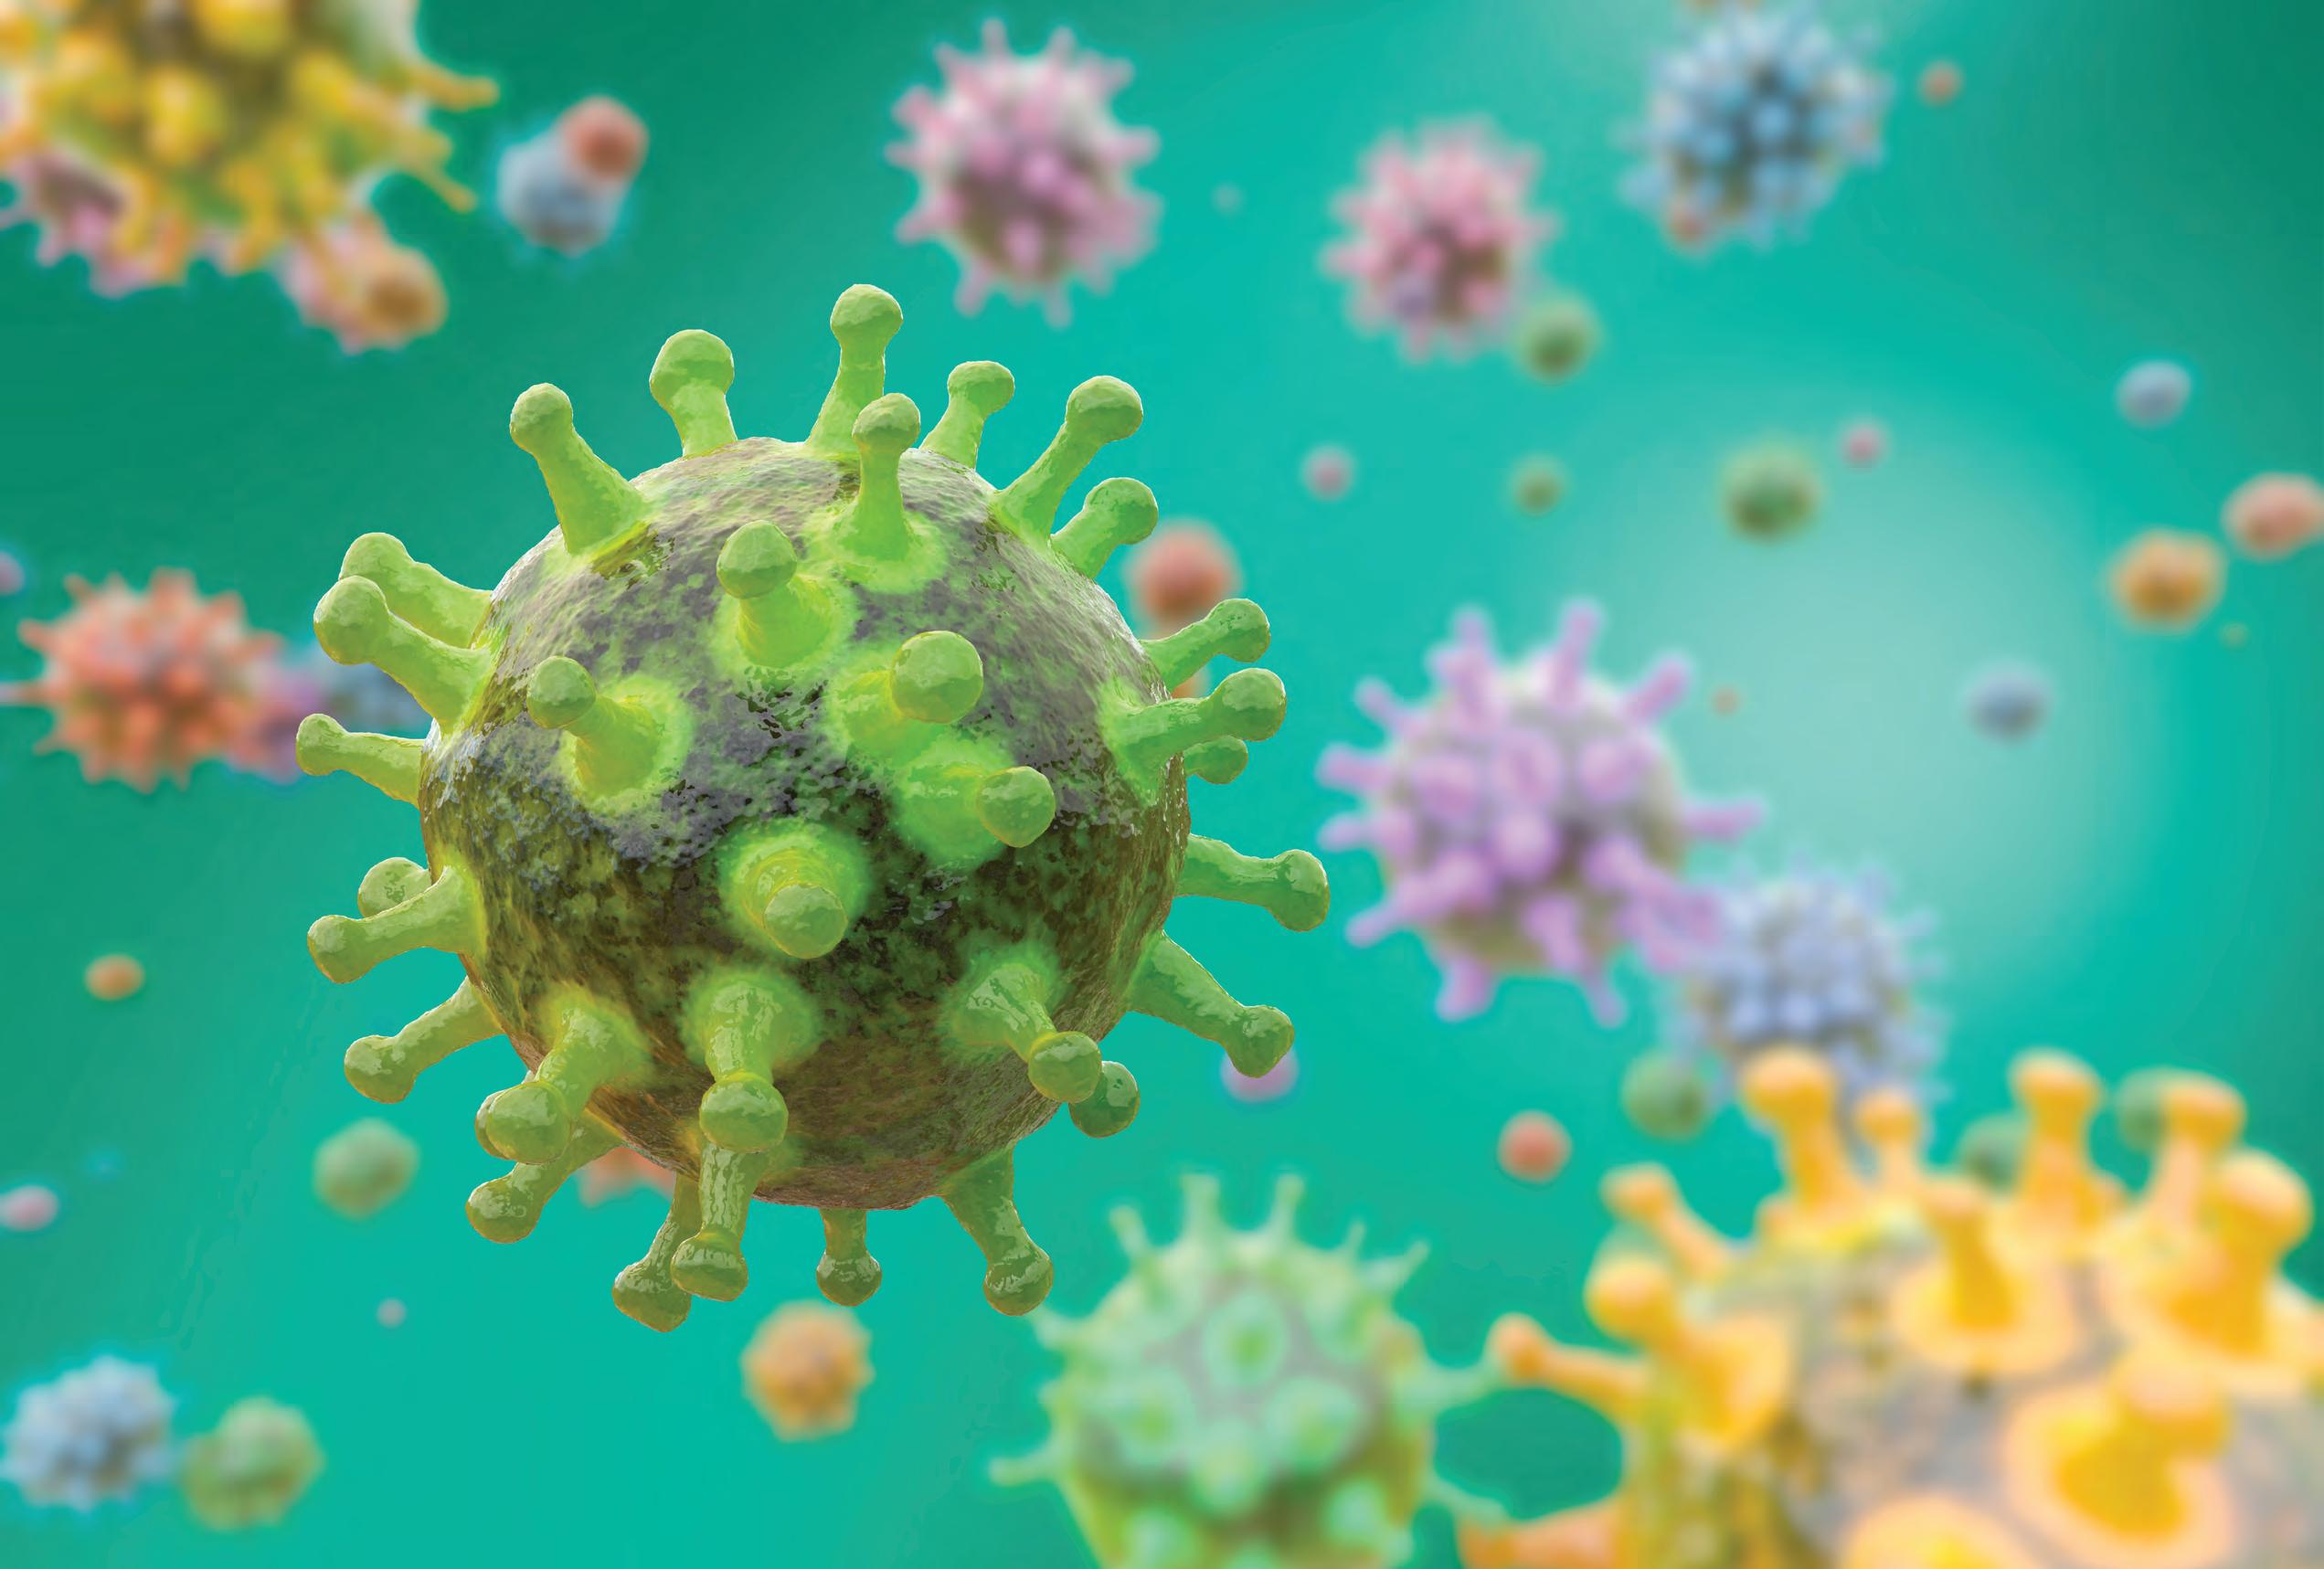
Through all stages of life, people encounter illness. Disease comes in many forms: from the common cold to cancer, everyone is at risk. In this chapter, you will learn to distinguish between infectious and non-infectious diseases. Throughout the chapter, you will explore different examples of infectious and non-infectious diseases and their causes. You will also consider the different ways in which infectious diseases can spread in a population and how to combat disease transmission to prevent epidemics or pandemics.
Non-infectious diseases are caused by genetic, lifestyle and environmental factors
Diseases cause symptoms of illness
Section 4.1
Section 4.2
Section 4.3
Infectious diseases are caused by pathogens
Pathogens are microbes that cause disease
Transmission can occur through direct or indirect contact
First line of defence Comprised of
The immune system fights pathogens
Second line of defence Third line of defence
Bacteria, fungi, viruses and parasites are examples of pathogens
infectious and non-infectious diseases are caused by different organisms and agents; measures to control the transmission of infectious diseases include personal hygiene, quarantine protocols, medical treatment and public education programs (VC2S10U03)
• differentiating between infectious diseases that are caused by different pathogens, such as tuberculosis (caused by bacteria), influenza (caused by viruses), candidiasis (caused by a fungus) and tapeworm infection (caused by a parasite)
• conducting an investigation to compare the effectiveness of handwashing by counting the number of bacterial colonies growing on agar plates
• visualising biological processes associated with diseases, such as viewing an animation about how a vaccine works or constructing a model to simulate blood flow in an artery blocked by cholesterol
• exploring the data and rationale for different strategies to stop the spread of infectious diseases, such as handwashing, mask-wearing, isolation and surface disinfection
• researching how factors such as genetics, age, malnutrition, environment and lifestyle may cause non-infectious diseases such as cancer, asbestosis, Alzheimer’s disease, diabetes and epilepsy
• researching the impact of diseases introduced with the arrival of Europeans to Australia, for example the severity of the impact of smallpox was partly because this virus was new to Aboriginal communities and so they lacked an immune response to it
• storyboarding for a social media clip that explains how healthy lifestyles may contribute to lower risk of non-infectious diseases
Victorian Curriculum v2.0 F–10 © VCAA 2024
Glossary terms
Antibiotic
Antibody
Antifungal
Antigen
Antiseptic
Antiviral
Bacteria
Binary fission
Budding
Cilia
Contagious
Disease
Epidemic
Fermentation
Fungi
Immune system
Infection
Infectious disease
Lymphocyte
Lysis
Memory cell
Microbe
Non-infectious disease
Normal flora
Outbreak
Pandemic
Parasite
Pathogen
Phagocytosis
Prokaryote
Septic
Transmission
Vaccine
Virus
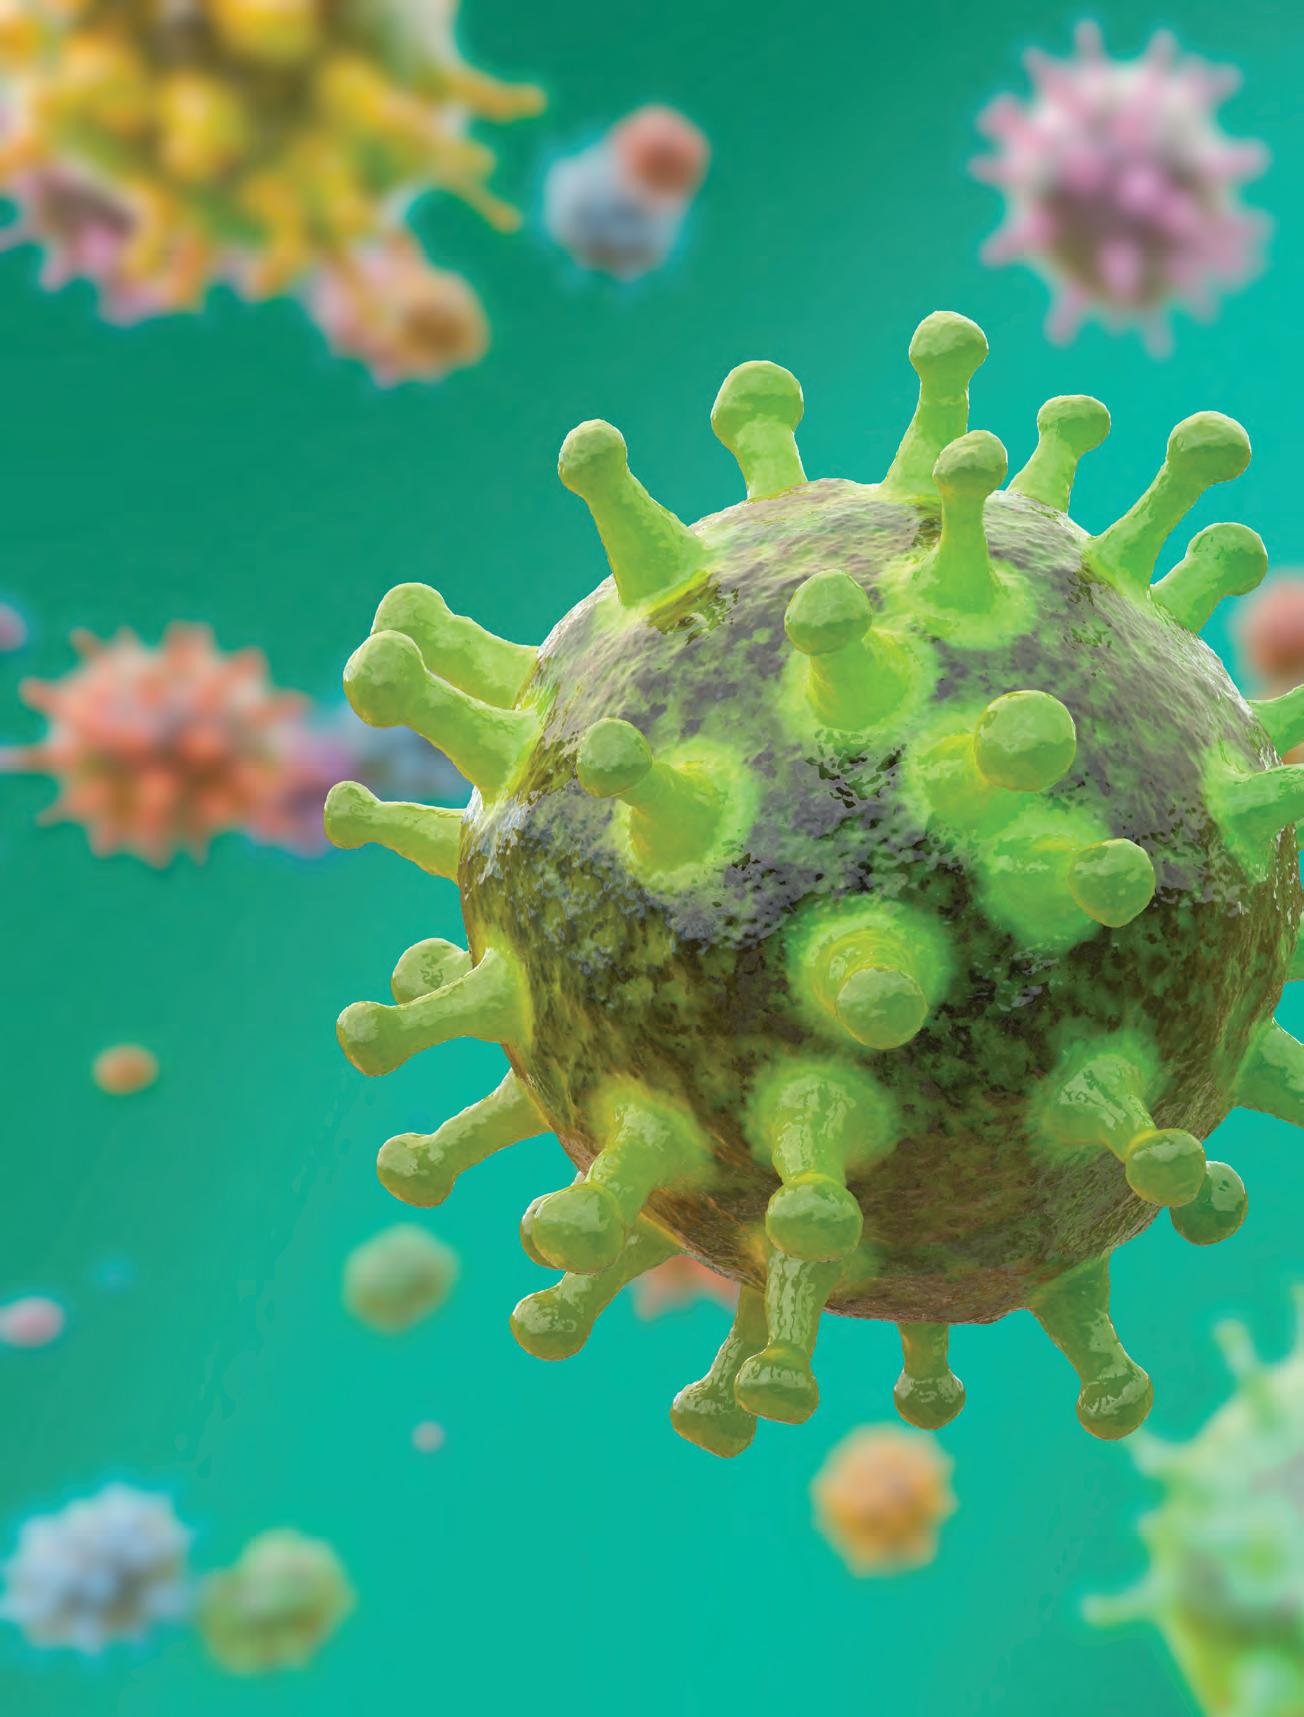
Learning goals
At the end of this section, I will be able to:
1. Define the term ‘pathogen’.
2. Describe the different types of pathogens.
3. List examples of common pathogens.
Everyone has been sick at some point in their lives. Think about the last time you caught a cold or fell ill with food poisoning. This happened because a microbe with the ability to cause disease entered your body and started to multiply. Microbes are organisms that are too small to see with the naked eye, such as bacteria or fungi. Not all microbes are harmful; our gut is full of beneficial bacteria that help us to digest food.
Human cell composition
The adult body has around 30 trillion human cells and 39 trillion microbes. Although these numbers vary between individuals, on average, this means we are made up of 43% human cells, with the rest being microscopic colonists.
Disease occurs when an organism displays symptoms of an illness. Microbes that have the ability to cause disease in humans are called pathogens. Pathogens make us sick by interfering with the normal functioning of our cells and tissues. They can do this by invading and destroying our cells or by releasing toxins that damage our tissues. For example, food poisoning is caused by eating food contaminated with large numbers of a bacterium called Salmonella. Salmonella release toxins that damage the cells of the small and large intestine, causing abdominal cramps and diarrhoea.

experiences symptoms
and coughing. Pathogens are categorised as either cellular or non-cellular. Cellular pathogens are living organisms made of cells, such as bacteria, fungi and parasites. Non-cellular pathogens include viruses, which are considered non-living because they are not made of cells. Individual pathogens within an infected individual reproduce very quickly under their optimum conditions and need to be destroyed as quickly as possible to avoid illness.
bacteria (singular: bacterium) microscopic, unicellular (singlecelled) organisms prokaryote a cell that lacks membrane-bound organelles (such as a nucleus)
Table 4.1 lists common diseases caused by bacteria, fungi, viruses and parasites.
Bacterial diseasesFungal diseasesViral diseasesParasitic diseases
Tuberculosis
Candidiasis Influenza Tapeworm infection
Tetanus Tinea
Strep throat
Syphilis
Pneumonia
Common coldToxoplasmosis
HIV Malaria
Chickenpox
Hepatitis
Table 4.1 Examples of diseases caused by different pathogens
Try this 4.1
Pick one example of each pathogen from Table 4.1 and research the symptoms associated with each.
Bacteria (singular: bacterium) are simple unicellular organisms called prokaryotes. All bacteria lack membrane-bound organelles (see Figure 4.3), although some bacteria contain a cell wall. Individual bacteria cannot be seen with the naked eye, but a bacterial colony (group of millions of bacteria) will be visible if it contains enough bacteria. Scientists therefore need a microscope to study individual bacteria. The best light microscopes at school can magnify about 1000 times. Scientists generally use electron microscopes, which can magnify cells up to 500 000 times.
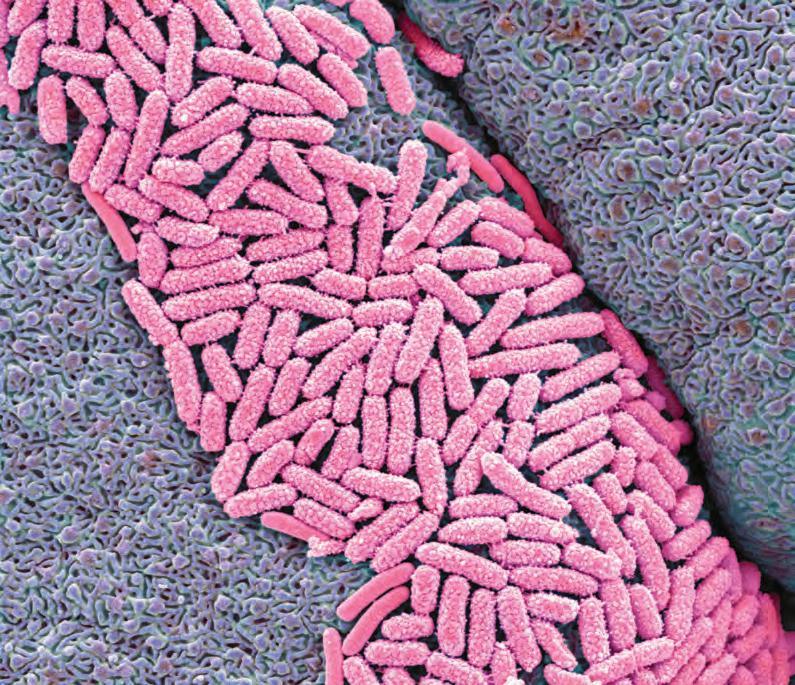
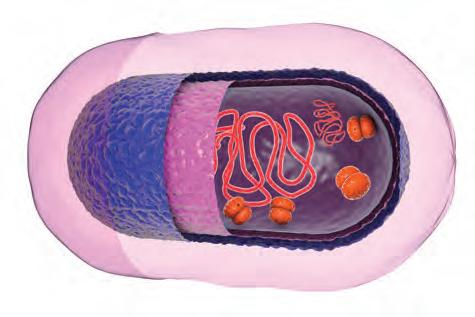
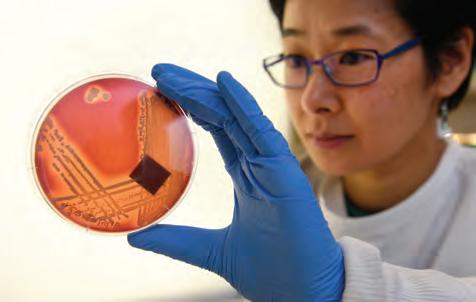
Most bacteria reproduce by a process called binary fission whereby the genetic information of the bacterium replicates and the cell divides into two. Each cell produced during binary fission is a genetic clone of the parent cell.
Some bacteria like Escherichia coli can divide every 20 minutes, under optimum conditions. So, if you start with only one bacterium, after 20 minutes, you will have two bacteria, then following another 20 minutes, four bacteria, and so on, until after just three hours, you have had nine cell divisions, equating to a growth from one through to 512 bacteria. After 20 divisions, under suitable conditions, there would be over one million bacteria. That is why you can quickly become ill when harmful bacteria invade your body.
Some bacteria can remain dormant inside the body without causing any symptoms of disease. Mycobacterium tuberculosis is the pathogen responsible for causing tuberculosis. Often affecting the lungs, M. tuberculosis is spread through respiratory droplets when infected people cough or sneeze. About one quarter of the world's population are infected with M. tuberculosis, but only 5–10% of people infected will develop tuberculosis.
Not all bacteria are harmful; of the estimated millions of species of bacteria that inhabit Earth, less than 5% of these species are thought to be pathogens. In fact, it is believed that around 50% of all the cells in and on our bodies are actually our own, with the rest being harmless and often useful bacteria that form what is referred to as our 'natural flora'.
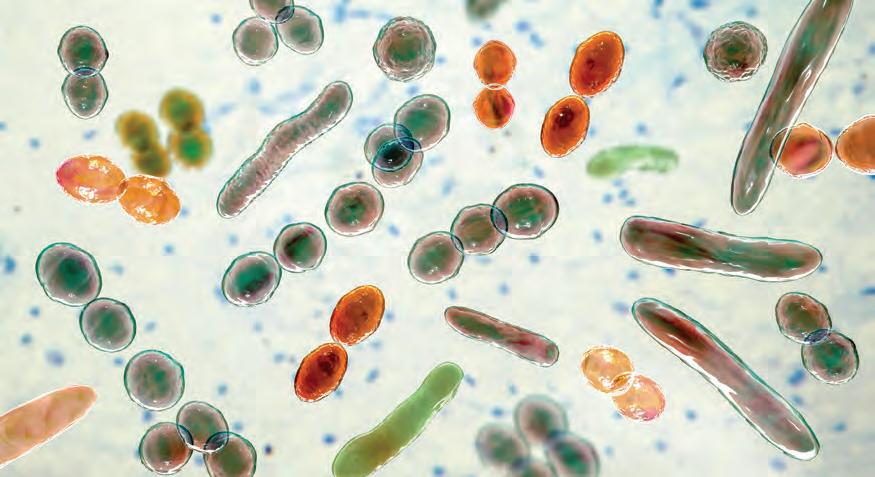
One way of classifying bacteria is by the shape of their individual cells. The main shapes are rods, spheres and spirals.
ShapeBiological name Diseases
RodBacillus (plural: bacilli)Tuberculosis Pneumonia
Magnified image
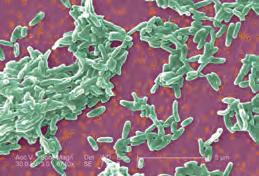
SpiralSpirillum (plural: spirilla)Syphilis
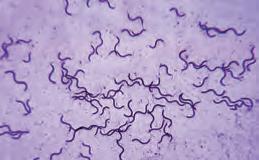
SphericalCoccus (plural: cocci)Strep throat
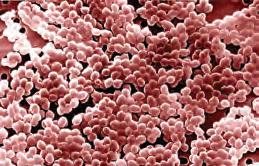
Table 4.2 Common pathogenic bacteria and their shapes
Practical 4.1: Teacher demonstration
observing bacteria under a microscope
At least three different microscopes have been set up to show some different types of bacteria that have been stained for you to see under a magnification of 1000.
Aim
To observe different types of bacteria under the microscope
Materials
• microscopes
• slides of different types of bacteria (e.g. Coccus, Bacillus, Spirillum)
Method
1. Using the microscopes, observe the bacteria under a magnification of 1000.
2. Using a pencil, sketch each type of bacteria. Provide a title for each sketch.
Results
Sketch what you can see under the magnification of 1000×.
Discussion: Evaluation
1. Were you able to differentiate between the three different types of bacteria? Write a few sentences to describe how you did this.
Conclusion
1. State whether the aim was achieved.
2. Support your statement by summarising your experimental observations.
using nutrient agar plates to grow bacteria
Aim
To grow bacteria on nutrient agar plates
Materials
• Petri dish containing sterile nutrient agar × 2
• sterile cotton buds × 2
• marker pen
• masking tape
• disposable gloves
Method
1. Label the bottom of one agar plate ‘Control’ and the other plate with the location you will swab. Include your initials so you can identify your plates next lesson.
2. Using a cotton bud, wipe over an object of choice, such as a phone screen, computer keyboard, mouse or door handle. Place the swab back inside the sterile packet.
3. Open the Petri dish labelled with the location of your swab and lightly rub the cotton bud over the nutrient agar as shown in Figure 4.5. Rotate the Petri dish 90 degrees and repeat.
Be careful
Ensure gloves are worn when handling nutrient agar plates. Do not sneeze or otherwise expose the agar to any pathogenic organisms. Hands are to be washed with soap immediately after handling nutrient agar plates. Sealed agar plates are not to be opened. Once plates have been observed, they will be collected and destroyed. All working surfaces are to be wiped down with disinfectant after all nutrient agar plates are collected.


4. Place the lid on top and secure with sticky tape.
5. Wipe down all work surfaces with disinfectant after all the nutrient agar plates have been collected.
6. The plates will be stored upside down (with the agar at the top) in an incubator at 37°C for 1–2 days.
7. Remove the plates from the incubator, place in a clear zip-lock bag and observe the colonies of bacteria that have grown. Warning: Microbes can produce harmful toxins, so it is very important to seal them in airtight containers. Taking careful precautions and minimising exposure to the microbes can protect us from dangerous infections. It is essential that the plates produced are sealed, collected and destroyed (incinerated or autoclaved).
1. Sketch the colonies that you can see on your agar plate. Try to distinguish between the bacterial colonies that have a smoother surface, compared to the colonies of mould that tend to have a furry appearance.
2. Count the number of colonies and record the type of colonies you have observed.
3. Record every group’s results in a class tally of number of bacterial colonies and number of mould colonies. Using the class results, construct a column graph highlighting the proportion of each type of colony.
Discussion: Analysis
1. Choose another student’s agar plate and comment on the similarities and differences as compared to your agar plate. Explain why this may be the case.
2. Rank the objects or places from the class results in order from least to most bacterial growth on the agar dishes. Explain why these differences exist by looking at the original location of the sample.
Discussion: Evaluation
1. Suggest two potential sources of error for this experiment.
2. Propose two ways in which this experiment could be improved.
Conclusion
1. Make a claim from this experiment regarding the growth of bacterial and mould colonies on agar. Start your sentence with ‘This experiment suggests that ...’
2. Support your claim by referring to your experimental observations, and include potential sources of error.
3. Explain how the data supports your claim. Start your sentence with ‘This means that ...’
1. Define the term ‘pathogen’.
2. Explain why bacteria are classified as prokaryotes by describing their structure.
3. Describe how a strain of pathogenic bacteria can cause disease.
4. List the different names and shapes of bacteria.
Faecal microbiota transplantation (FMT) is a treatment for recurrent infections by the bacterium Clostridium difficile (C. diff.). Faeces from a healthy donor is introduced into a patient’s gastrointestinal tract in order to add healthy bacteria to control the C. diff infection. Use the internet to explore how FMT is performed and why it is used against C. diff infections.
fungi (singular: fungus) single-celled or multicellular organisms that contain a nucleus and a cell wall made of chitin
Fungi are eukaryotic organisms that contain membrane-bound organelles such as a nucleus and mitochondria. They have a cell wall made of chitin and can be either unicellular or multicellular. Familiar fungi include yeasts, moulds and mushrooms. Unlike plants, fungi cannot photosynthesise to make their own food. Instead, they use their long, fibrous cells to penetrate plants and animals, breaking them down and extracting nutrients. You may have seen a furry growth on decaying food – this is a type of fungus. For example, the furry growth on a rotten orange is the mass of fruiting bodies produced by the fungus that has infected the orange. Mushrooms and toadstools are the fruiting bodies of fungi that feed on things in the soil. Several species of fungi, mostly yeasts, live harmlessly on the human body, but others can cause skin diseases like tinea and ringworm.
Candida is an opportunistic pathogen. This means that it commonly inhabits the human body without causing disease and only becomes pathogenic when conditions for growth are favourable.
Around 30–50% of people carry Candida albicans in their oral cavity, gastrointestinal and reproductive tracts, but helpful bacteria in the body stop C. albicans from overgrowing. When the amount of Candida is off-balance, the yeast overgrows and causes an infection called candidiasis.

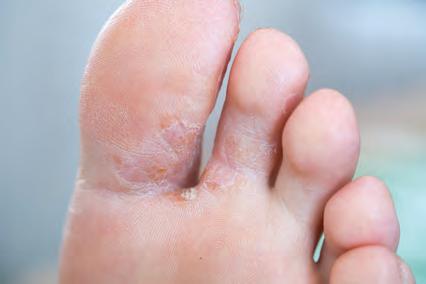

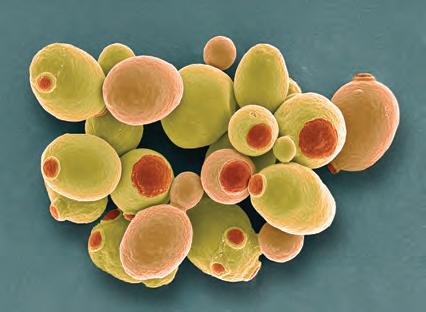
Yeast is a type of fungus and is very useful in the production of many foods. You might have some baker’s yeast in the cupboard at home – it is used when baking bread. Yeast exists as single cells and reproduces by a process called budding, where a yeast cell develops a small ‘bud’, which grows and eventually separates to form a new yeast cell.
Yeast feeds on sugar. This specialised process, known as fermentation, involves yeast, in the absence of oxygen, breaking down sugar to produce alcohol and carbon dioxide.
If the carbon dioxide is not allowed to escape, the resulting product (e.g. ginger beer) will be fizzy. A similar reaction causes the bubbles in baked goods that make breads and cakes rise.
Aim
To investigate the process of fermentation using yeast
budding a type of asexual reproduction, used by organisms such as yeast and hydra; involves the daughter offspring growing off the side of the parent and then dropping off fermentation a chemical process by which energy is produced in the absence of oxygen
Materials
• test tubes x 5
• test-tube rack
• sugar
• yeast
• 10 mL measuring cup
Method
• balloon
• limewater
• delivery tube with stopper
• teaspoon
• marker pen
1. Collect five test tubes. Place the first four in a rack and label them A, B, C and D (as shown in Figure 4.11).
2. Fill each test tube according to the following table.
Table showing the contents of the experimental test tubes
• 2 teaspoons sugar
• 10 mL warm water
• 1 small heaped teaspoon yeast
• 10 mL warm water
3. Place a balloon over the end of test tube C.
• 2 teaspoons sugar
• 1 small heaped teaspoon yeast
• 10 mL warm water
• 2 teaspoons sugar
• 1 small heaped teaspoon yeast
• 10 mL warm water
4. Attach a delivery tube to test tube D and place the outlet into some limewater in a fifth test tube, as shown in the diagram.
5. Leave all test tubes for approximately 30 minutes. Observe the results after this time.
Results
Create a table of results for your observations, including about smell.
Discussion: Analysis
1. Why was it important to use warm water but not water that was too hot?
2. Suggest some reasons for the different results obtained in test tubes A, B and C, making reference to the contents of the test tubes.
Discussion: Evaluation
1. Describe two potential sources of error in this experiment.
2. Suggest two improvements you could make to the experimental design.
Conclusion
1. Make a claim from this experiment regarding the fermentation process. Start your sentence with ‘This experiment suggests that ...’
2. Support your claim by referring to your experimental observations, and include potential sources of error.
3. Explain how the data supports your claim. Start your sentence with ‘This means that ...’
Viruses are tiny, non-cellular pathogens that are too small to see with a light microscope; an electron microscope is required to view them. They are made up of a core of genetic material surrounded by a protein coat. Viruses are unable to reproduce unless they enter a cell. When they infect a suitable host cell, they spring into action, taking over the cell and turning it into a virus-making factory. Once the host cell is full of viruses, it bursts (called lysis), releasing many more viruses that can infect other cells. The host cell dies in this process, leading to tissue damage. Different types of viruses target specific cell types. Influenza, for example, targets cells in the respiratory and intestinal tract, leading to symptoms such as a sore throat, cough and sometimes vomiting or diarrhea.
As you have learned, one of the key requirements for something to be considered living is the ability to reproduce. Since viruses depend on invading other cells and using the host cell to replicate and survive, viruses are not considered living. Nevertheless, viruses are an important part of all ecosystems, including the human body. In your body, viruses can infect both your own cells and the cells of the other bacteria that live inside you.
virus an extremely small noncellular pathogen comprised of infectious particles that are inactive outside a living host cell lysis breakdown of a cell due to the disruption of its membrane


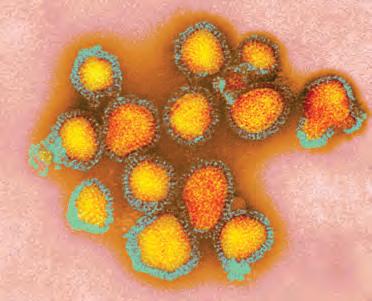
Quick check 4.2
1. List three common types of fungi.
2. Outline how fungi are able to obtain the nutrients they need to survive.
3. Describe the structure of viruses and how they reproduce.
4. Scientists argue that viruses are in fact non-living. Discuss why this may be the case.
Did you know? 4.2
Bacteriophages
Discovered independently by Frederick W. Twort in 1915 and Félix d’Hérelle in 1917, a bacteriophage (meaning ‘bacteria eater’) is a virus that only infects bacterial cells. Found everywhere on Earth, bacteriophages are being studied as an alternative to antibiotics.
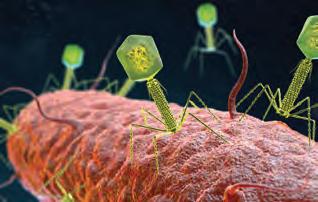
parasite an organism that lives on or in a host that causes harm by extracting nutrients from the host
Not all pathogens are microbes. Parasites are organisms that live on or inside a host. Some are large enough to see with the naked eye. Parasitic pathogens rely on their host for food, often at the expense of the host organism. Fleas, lice, mites and ticks are examples of parasites that live on the outside of a host organism. They commonly infest the skin of humans and animals, causing skin lesions and discomfort, and can also transmit other pathogens when transferred between host organisms.
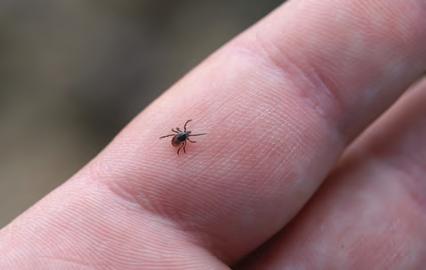
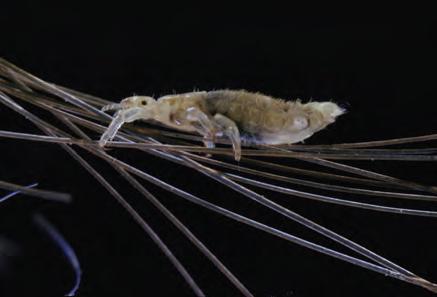
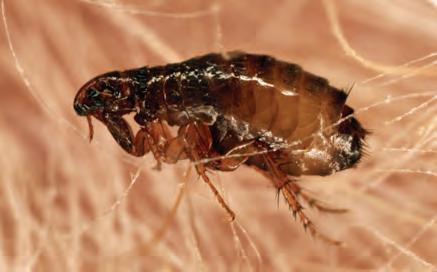
A tapeworm is a parasite that infects humans and animals and that lives inside the host. Like other parasites, tapeworms can only survive inside the host animal. It attaches to the walls of the intestines and absorbs nutrients from the food the host eats. Often, tapeworms do not cause noticeable symptoms. However, in severe cases, infection can cause nutritional deficiencies, unexplained weight loss, abdominal pain and nausea. If you have a pet cat or dog, you might be familiar with administering worm medication on a regular basis to prevent infection. Cats and dogs can become infected with tapeworm by ingesting fleas that are infected with tapeworm larvae.


I used to think … now I think…: Microbes and diseases
When we began the chapter, you had some initial ideas about microbes and diseases. Take a minute to remember what ideas you previously had and write a few sentences using the sentence starter, ‘I used to think…’
Now, think about how your ideas about microbes have changed because of what you have learned so far in this chapter. Write down what you now think about microbes, pathogens and diseases in a few sentences. Start your sentences with, ‘Now, I think…’
The I used to think… now I think… thinking routine was developed by Project Zero, a research centre at the Harvard Graduate School of Education.
Section 4.1 questions
Remembering
1. Define the term ‘parasite’.
2. Recall the structure of a virus.
3. Recall whether bacteria are classified as prokaryotes or eukaryotes.
4. State the biological name of each of the three pictured bacteria.
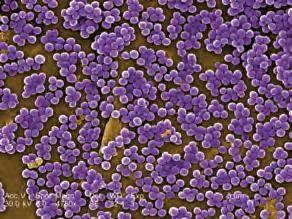
Understanding
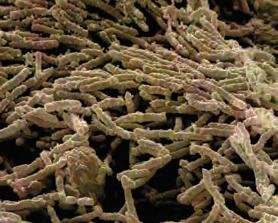
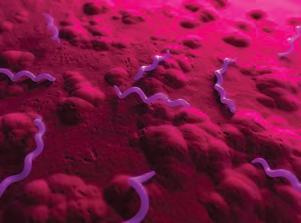
5. Explain why a virus is considered non-living.
6. Explain how a virus causes disease.
7. Describe how bacteria reproduce.
Applying
8. Categorise the following types of pathogens as cellular or non-cellular: a) Bacteria b) Fungi c) Viruses d) Parasites
9. Explain why you get a sore throat when infected with an influenza virus.
10. Describe one use of fungi in everyday life.
Analysing
11. Compare and contrast bacteria and viruses.
12. If a wound becomes infected with an initial amount of 100 bacteria that can reproduce every 20 minutes, calculate how many bacteria would be present after 4 hours.
Evaluating
13. Evaluate the claim that we are more bacteria than we are human.
At the end of this section, I will be able to:
1. Distinguish between infectious and non-infectious diseases.
2. Describe how infectious diseases can spread between people.
3. Describe methods for limiting the spread of infectious diseases.
When a pathogen enters our body and is able to reproduce, we have an infection. A disease caused by a pathogen is known as an infectious disease. The previous section explored a number of different pathogens that are able to cause disease in humans, such as Mycobacterium tuberculosis and influenza. This section will focus on how infectious diseases can spread from person to person and what we can do about it.
non-infectious disease
Not all diseases are infectious. Diseases that are not caused by pathogens are called non-infectious The causes of non-infectious diseases are complex; genetics, lifestyle and environmental factors, as well as their interactions, contribute to a person's chances of being affected. For example, a person's likelihood of developing cancer will be influenced by their genetics, exposure to certain chemicals or agents such as UV radiation, and their diet. Other common examples of non-infectious diseases include heart disease, Alzheimer's, cystic fibrosis and diabetes. These diseases are not contagious and cannot be spread within a population.

Consider the data shown below about the causes of death in Australia in 2022 and answer the following questions:
What do you see in the data?
What do you think about that?
What does it make you wonder?
Share of deaths from major causes, Australia, 2022
Share of reported deaths from major causes, based on the underlying cause listed on death certificates.
Cardiovascular disease
Dementias and neuropsychiatric disorders
Respiratory infections
Respiratory diseases
Diabetes, blood and endocrine disorders
Digestive diseases
Unintentional injuries
Intentional injuries
Infectious and parasitic diseases
Musculoskeletal diseases
Non-malignant cancers
Skin diseases
Congenital anomalies
Perinatal conditions
Nutritional deficiencies
Ill-defined injuries
Maternal conditions
Data source: WHO Mortality Database (2024)
Note: All deaths in a country may not have been registered with a cause of death.
OurWorldinData.org/causes-of-death | CC BY
The See think wonder thinking routine was developed by Project Zero, a research centre at the Harvard Graduate School of Education.
Choose one of the following non-infectious diseases and research the factors that contribute to causing the disease. Share a summary of your findings with the class.
• Cancer
• Asbestosis
• Alzheimer’s disease
• Diabetes
• Epilepsy
Create a storyboard for a social media clip that explains how a healthy lifestyle may contribute to a lower risk of developing non-infectious diseases. Ensure that the information you include is from reliable sources.
Between 2020 and 2021, 160 000 Australians were hospitalised due to coronary heart disease. In 2021, it accounted for 10% of all deaths in Australia. Coronary heart disease is caused by a build-up of cholesterol in blood vessels, narrowing the arteries and reducing blood flow to organs. A heart attack may result if blood flow to the heart is reduced due to a blockage in the coronary arteries. A combination of genetic and environmental factors causes coronary heart disease.
Aim
To construct a model to simulate blood flow in an artery blocked by cholesterol
Materials
• disposable plastic cups × 2
• straws of different diameters, cut to 5 cm in length × 2
• marker pen
• scissors
Method
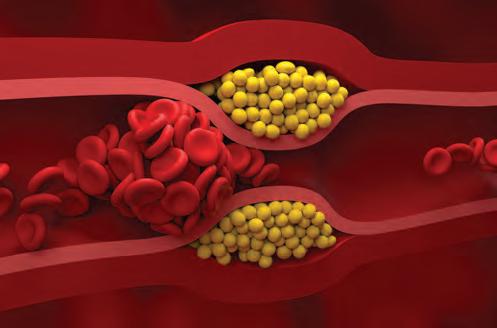
• a shallow tray
• 1 L of water coloured with red food colouring
• 500 mL measuring cylinder
• Blu-tack
1. Use the scissors to make a small hole approximately 2 cm from the bottom of each cup.
2. Insert the straws into the holes, widening the holes with the scissors if needed. Do not make the holes bigger than the straws.
3. Insert the straws into the holes, ensuring that they point slightly downwards.
4. Place Blu-tack around the straw on both the inside and the outside of the cup to seal the hole.
5. Place one of the cups in the tray and seal the end of the straw with Blu-tack.
6. Measure 400 mL of red water and pour it into the cup. Ensure that no water is leaking out of the straw.
7. Remove the Blu-tack from the end of the straw and time how long it takes for the water to stop flowing. Record this time in a results table.
8. Repeat steps 5–7 with the other cup.
Results
1. Record how long it took each cup to empty.
2. Calculate the flow rate by dividing 400 mL by the time it took for each cup to empty.
Discussion: Analysis
1. Explain what both straws in the model represent.
2. State which straw allowed the red water (the blood) to flow faster, and explain why.
3. Explain how this experiment models a blocked artery.
Discussion: Evaluation
1. Suggest two limitations of this model.
2. Propose two ways this experiment could be improved.
Conclusion
1. Make a claim from this experiment regarding the modelling of an artery blocked by cholesterol. Start your sentence with ‘This experiment suggests that ...’
2. Support your claim by referring to your experimental observations, and include potential sources of error.
3. Explain how the data support your claim. Start your sentence with ‘This means that ...’
Did you know? 4.3
Our cells contain genetic information in the form of DNA, which provides instructions on how we look and function. Mutations in DNA can result in faulty instructions, which can lead to disease. Cystic fibrosis is caused by a mutation in the CFTR gene, which maintains the flow of salt and fluids in and out of the cells in different parts of the body. People affected with cystic fibrosis have a build-up of thick mucus in their lungs and digestive tract, which leads to persistent lung infections and complications with digestion. A person can be a carrier for cystic fibrosis but not be affected by the disease. This means that a couple could pass on the disease to their children even if they are not affected by the disease themselves. Around 1 in 25 people are carriers for cystic fibrosis.
A disease that can be spread from person to person is said to be contagious. Non-infectious diseases are not contagious, but many infectious diseases are. For a pathogen to survive and reproduce in the population, it must move between hosts in a process known as transmission. There are two main types of transmission: direct and indirect. Direct transmission involves contracting a pathogen from an infected person either through physical contact or being near them. Indirect transmission occurs through contact with an infected surface or by breathing infected air.
Direct
Direct contactComing into direct, physical contact with the infected person
Droplet spreadInhalation of infected respiratory droplets
Indirect
Indirect contactTouching an object that has come into contact with the pathogen
AirbornePathogens can remain suspended in tiny particles in the air for long periods of time
Faecal-oralPathogens excreted in faeces can contaminate food and water
VectorAn organism that transmits a pathogen from one host to another
Hand shaking, hugging, sexual intercourse Varicella zoster (Chickenpox), Tinea pedis (Athlete’s foot)
Being near an infected individual who is talking, sneezing or coughing
SARS-CoV-2 (COVID-19), Bordetella pertussis (Whooping cough), influenza
Touching objects such as tissues, clothes or water bottles used by an infected individual Rhinovirus (common cold), Clostridium tetani (tetanus)
Inhaling contaminated air particles in a doctor’s office long after the patient has left
Eating food prepared by an infected person or swimming in contaminated water
Getting bitten by a mosquito carrying a pathogen
SARS-CoV-2 (COVID-19), Rhinovirus (common cold), influenza
Vibrio cholerae (cholera), Rotavirus (gastro)
Plasmodium (malaria)
outbreak a sudden increase in the incidence of an infectious disease within a certain area
epidemic an outbreak of an infectious disease that has spread to the wider community
pandemic an outbreak of an infectious disease that has spread across multiple continents
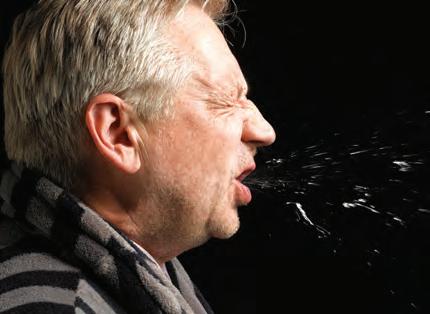
Figure 4.23 A sneeze can have up to 30 000 droplets, while a cough contains 3000 droplets.
When there is a sudden increase in the occurrence of an infectious disease in a population, it is called an outbreak. Nursing homes commonly experience influenza and gastro outbreaks because of the proximity and frequent contact between staff, patients and visitors. A more widespread increase in disease in a short period of time is described as an epidemic. Epidemics are less localised than outbreaks; they can sometimes affect entire nations. When the disease spreads across continents, it becomes a pandemic.


COVID-19 is a highly contagious respiratory disease caused by a new RNA virus, a coronavirus similar to the cold virus. The first case of COVID-19 was identified in Wuhan, China in December 2019. The World Health Organization declared a global pandemic in March 2020. As of late 2024, over seven million deaths globally have been attributed to COVID-19, making it one of the deadliest pandemics in history. It has also had an enormous economic and social impact.
Choose one of the pandemics listed below and research the disease involved, including the symptoms, countries affected, when it occurred and the death toll.
• The Black Death
• Spanish Flu
• Swine Flu
• HIV/AIDS
Knowing how a particular pathogen is spread among the population is helpful when considering how to control transmission if an outbreak occurs. Local and national government agencies monitor disease levels in Australia and have emergency response plans for impending outbreaks or epidemics. Governments around the world coordinate with the World Health Organization (WHO) and the United Nations (UN) to prevent or manage pandemics.
Preventing the transmission of pathogens between individuals is the most effective way to avoid or control a disease outbreak. This can include:
• good hygiene practices such as regular hand washing
• sterilising objects and surfaces
• wearing a mask
• ensuring access to clean water
• social distancing (avoid being near other individuals)
• quarantining (isolating infected individuals until they are no longer contagious)
• lockdown of areas or restricting travel (restrict the movement of people)
• getting a vaccine if one is available
• public education programs.
Quick check 4.4
1. Define the term ‘contagious’.
2. List two examples of a contagious disease.
3. Describe two ways to limit the spread of infectious disease.


Investigating the effectiveness of handwashing using different hand soaps
Aim
To measure the effectiveness of handwashing using different hand soaps
Materials
• Petri dishes containing sterile nutrient agar × 2
• sterile cotton buds × 2
• marker pen
• masking tape
• a variety of different hand soaps, including antibacterial handwashes
Method
1. Label the bottom of one agar plate ‘Control’ and the other plate with the handwashing agent you wish to investigate. Include your initials so you can identify your plates in the next lesson.
2. Wet your hands with water and use the sterile cotton bud to swab one finger for 15 seconds. Ensure you get around the nail and down the sides of the finger.
3. Open the Petri dish labelled ‘Control’ and lightly rub the cotton bud over the surface of the agar (as shown in Figure 4.5 in Practical 4.2). Rotate the Petri dish by 90 degrees and repeat.
4. Place the lid on top and secure with sticky tape.
5. Apply your chosen soap under clean, running water and lather up your hands, including the back, front, between the fingers and under the nails. Wash your hands for 30 seconds and then rinse well with water. Do not dry your hands.
6. Repeat steps 2–4, ensuring that you use the same finger you swabbed in the Control test.
7. The plates will be stored upside down (with the agar at the top) in an incubator at 37°C for 1–2 days.
8. Remove the plates from the incubator, place in a clear zip-lock bag and observe the colonies of bacteria that have grown.
Warning: Microbes can produce harmful toxins, so it is very important to seal them in airtight containers. Taking careful precautions and minimising exposure to the microbes can protect us from dangerous infections. It is essential that the plates produced are sealed, collected and destroyed (incinerated or autoclaved).
1. Sketch the colonies that you can see on your agar plate. Try to distinguish between the bacterial colonies that have a smoother surface, compared to the colonies of mould, which tend to have a furry appearance.
2. Count the number of colonies and record the type of colonies you have observed.
3. Record every group’s results in a class tally of number of bacterial colonies and number of mould colonies. Using the class results, construct a column graph highlighting the proportion of each type of colony.
1. Explain whether there was a difference in the number or type of colonies observed between your control plate and your hand washing plate.
2. Choose another student’s agar plate who used a different hand soap and comment on the similarities and differences compared to your agar plate. Explain why this may be the case.
3. Rank the hand soaps from the class results in order from least to most bacterial growth on the agar dishes. Explain whether there is a difference in the effectiveness of different hand soaps.
4. Explain the purpose of the control.
Discussion: Evaluation
1. Suggest two potential sources of error for this experiment.
2. Propose two ways in which this experiment could be improved.
Conclusion
1. Make a claim from this experiment regarding the effectiveness of handwashing using different hand soaps. Start your sentence with ‘This experiment suggests that ...’
2. Support your claim by referring to your experimental observations, and include potential sources of error.
3. Explain how the data support your claim. Start your sentence with ‘This means that ...’
exploring the data on hand washing
Maintaining good personal hygiene is critical to limiting the spread of pathogens. The data shows a clear connection between access to hand washing facilities and deaths from infectious diseases. Visit the Our World in Data website and search for the article ‘Hygiene and hand washing’. Using the article, write five facts about the link between death rates and hand washing.
Science as a human endeavour 4.1
With only five kilometres separating the northernmost Torres Strait Island from Papua New Guinea (PNG), there is a high risk of pest, weed and disease transmission to the north of Australia. Transmission can occur via wind or tidal movements, animal carriers, or onboard ships or aircraft. Pests such as fruit flies are known to be blown from PNG to the Torres Strait Islands in the wet season and can island hop the short distance to mainland Australia. Mosquitoes that thrive in tropical environments, as well as migratory birds, can also bring harmful pathogens, some of which we may have no immunity against.
Before European colonisation, Australia was untouched by many pests, weeds and diseases that were prevalent in other countries. This made Australia’s ecosystem especially susceptible to the devastating effects of these foreign invaders. Aboriginal and Torres Strait Islander Peoples work closely with the Australian Government to maintain an early warning system for exotic pest, weed and disease detection. The Northern Australia Quarantine Strategy (NAQS) has been working with Aboriginal and Torres Strait Islander communities for over 30 years to monitor the health of ecosystems. Indigenous ranger groups across the Torres Strait, Western Australia, the Northern Territory and Queensland monitor plant, animal and aquatic health. They work with the NAQS to provide ongoing insect surveillance, map plant species, collect and destroy potential threat material, and establish public awareness campaigns. With their deep knowledge of and connection to Country, Aboriginal and Torres Strait Islander communities play a key role in keeping Australia safe from biosecurity threats that could devastate our crops, livestock, precious ecosystems and the human population.
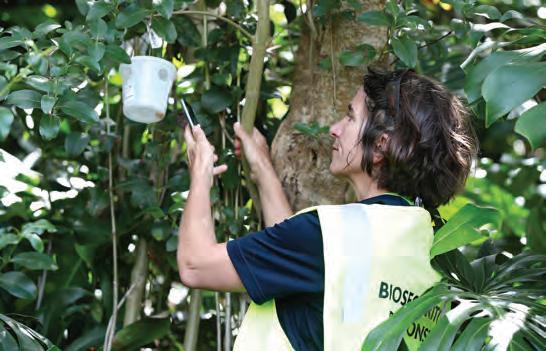
antibiotic
a type of medication used to treat bacterial infections
antiviral
a type of medication used to treat viral infections
antifungal
a type of medication used to treat fungal infections
antiseptic
a substance that stops or slows down the growth of microorganisms; used externally on skin
septic tissue infected with bacteria
Many infectious diseases have effective treatments, which means that getting sick is rarely a life-threatening situation. Have you ever gone to the doctor with a fever and been prescribed antibiotics? Antibiotics are a type of medication that kill bacteria. Doctors will prescribe a course of antibiotics to cure or prevent a bacterial infection. Antibiotics can be effective against certain types of bacteria but have little effect against others. Current research is focused on discovering new antibiotics and testing to determine on which bacteria they are most effective. Antibiotics are only effective against bacteria; antivirals and antifungals are used to treat viral and fungal infections. Our own cells are not affected by antibiotics because they are structurally very different to prokaryotes.
Antibiotics have been used in medicine since the 1930s as the traditional method of fighting bacterial infections in the human body. However, scientists are becoming increasingly concerned about drug-resistant bacteria, because infections often last longer, cause more severe illnesses, require more doctor visits or longer hospital stays, and may even cause death. Antibiotic resistance happens when not all of the bacteria are killed by a round of antibiotics. The bacteria that remain, which are left to grow and multiply, form a colony of bacteria that may now be resistant to that antibiotic, and those resistant bacteria can be passed on to other people!
While antibiotics can kill and stop the growth of bacteria, antiseptics can prevent the growth and development of other pathogens, without necessarily killing them. They tend to work on a large variety of microbes and are most often used externally; for example, antiseptic hand washes or to clean a wound. When harmful bacteria grow in living animal tissue, the tissue is said to be septic
Many of the antiseptics used in the past killed the bacteria in wounds but also damaged or killed the tissue around the wound. Modern antiseptics seldom injure the tissues.
At least 30% of antibiotic courses prescribed are unnecessary, meaning that no antibiotic is needed at all. For example, people often seek antibiotics when they are suffering from the common cold, but it is actually a viral infection, which antibiotics are useless against. The overuse of antibiotics has caused widespread antibiotic resistance and the creation of ‘superbugs’ that cannot be killed by several types of antibiotics.
Figure 4.31 A SEM of methicillin-resistant Staphylococcus aureus (MRSA). This type of bacteria is becoming resistant to many common antibiotics.
effectiveness of antiseptics against soil bacteria
Aim
To determine the effectiveness of different antiseptics against soil bacteria
Materials
• soil sample with bacteria (e.g. potting mix)
• test tubes × 5
• 200 mL beaker
• test-tube rack
• different antiseptics × 4: methylated spirits, iodine, QAC, Dettol (Note: QAC stands for quaternary ammonium compounds, a class of chemicals or disinfectants used alone or added to cleaning products.)
• distilled water
• nutrient agar plate
• marker pens
• disposable gloves
• disinfectant
• handwash (soap)
Method
Be careful
Ensure gloves are worn when handling nutrient agar plates.
Do not sneeze or expose the agar to any pathogenic organisms. Hands are to be washed with soap immediately after handling nutrient agar plates.
All working surfaces are to be wiped down with disinfectant after all nutrient agar plates are collected.
1. Construct a hypothesis for this experiment. In which test tubes do you think you will observe a growth of microbes?
2. Add a heaped teaspoon of soil to a beaker filled with 100 mL of water.
3. Put 5 drops of this soil/water mixture into each of the 5 test tubes. Label the test tubes A–E.
4. Add to each of the test tubes 5 drops of a different antiseptic.
Test tube A: Methylated spirits
B: Iodine (handle with care)
C: QAC
D: Dettol
E: Distilled water (as a control)
5. Label five areas A–E on the bottom of an agar plate as in Figure 4.32. (Hint: If you write the letters backwards, they will appear the correct way when later viewed from above.)
6. Using a cotton bud, smear a tiny amount of the contents of test tube A onto the agar in the area you have labelled ‘A’. Keep the agar plate covered as much as possible while you do this to prevent microbes in the air settling on the agar.
7. Using a fresh cotton bud each time, repeat with the contents of the other test tubes, matching the contents with its label on the agar plate.
8. Seal the lid with sticky tape.
9. Wipe down all work surfaces with disinfectant after all nutrient agar plates have been collected.
10. The plates will be stored upside down (with the agar at the top) in an incubator for 1–2 days.
11. After incubation, examine the agar plates. Take photos and discuss the types of microbes that are growing on your plates.
Results
Copy and complete the table.
Table showing the observations for the different antiseptics
Antiseptic
Methylated spirits
Iodine
QAC
Dettol
Distilled water (control)
Discussion: Analysis
Photo
Description of microbes
1. How does the pattern of microbial growth reveal the effectiveness of the antiseptic? What effect has the antiseptic had?
2. Do all the antiseptics tested have some effectiveness? How do you know?
Discussion: Evaluation
1. Identify two potential sources of error in this experiment.
2. Suggest two ways the experimental design could be improved.
Conclusion
1. Make a claim from this experiment regarding the effectiveness of different antiseptics. Start your sentence with ‘This experiment suggests that ...’
2. Support your claim by referring to your experimental observations, and include potential sources of error.
3. Explain how the data supports your claim. Start your sentence with ‘This means that ...’
The influenza virus particle contains two essential proteins on its surface: haemagglutinin and neuraminidase. In the 1980s, Australian scientist Peter Coleman and his colleagues at CSIRO determined the three-dimensional structure of the neuraminidase protein. They used this discovery to develop the first antiviral drug against influenza, zanamavir (Relenza®). Relenza is an antiviral medication that interferes with neuraminidase’s ability to release new virus particles from host cells, inhibiting the virus from spreading to other cells. Relenza was launched worldwide in 1999 and is used in over 70 countries. It is effective against all influenza strains and earns over 3 billion dollars in yearly sales. Peter Coleman’s work paved the way for a new class of antiviral drugs called neuraminidase inhibitors.


Section 4.2 questions
Remembering
1. Recall three examples of non-infectious diseases.
2. Describe the causes of non-infectious diseases.
3. Define ‘transmission’.
4. Describe one example of direct transmission and one example of indirect transmission.
Understanding
5. Describe the difference between direct and indirect transmission.
6. Explain the importance of good hygiene when limiting the spread of disease.
7. Explain how social distancing can decrease the transmission of disease.
8. Describe a method of prevention that can combat diseases transmitted via indirect contact.
Applying
9. Identify the mode of transmission in the following scenarios:
a) Shaking hands with someone who has a cold
b) Inhaling influenza particles in a classroom that were expelled by a student during the lesson before
c) Sitting in a doctor’s office next to someone who does not cover their mouth when coughing
d) Stepping on a rusty nail contaminated with Clostridium tetani
e) Sleeping in the same bed as someone with chicken pox.
10. A person has an ear infection caused by bacteria. Explain whether they are likely to be prescribed antibiotics or antiseptics by their doctor.
11. Explain why antibiotics do not work against a viral infection.
Analysing
12. Draw a Venn diagram to compare and contrast the terms ‘outbreak’, ‘epidemic’ and ‘pandemic’.
Questions 13 and 14 refer to the following information.
Antimicrobial substances A, B and C were tested for their effectiveness against a strain of bacteria growing on agar. The red areas are called ‘zones of inhibition’. This is the area around the antiseptic disc where bacteria were killed. Interpret the results shown below by answering the following questions.
13. Of the antimicrobial substances tested, which was the most effective? Explain your reasoning.
14. Of the antimicrobial substances tested, which was the least effective? Explain your reasoning.
Evaluating


15. Evaluate the claim that all contagious diseases are infectious, but not all infectious diseases are contagious.
immune system
the system of cells, tissues and organs that enables the body to protect itself against disease
cilia (singular: cilium)
hair-like structures that line the respiratory tract and sweep microbes and debris out of the airways
normal flora a population of microbes that permanently inhabit the human body and that do not usually cause disease
At the end of this section, I will be able to:
1. Describe the role of the immune system.
2. Describe how the first line of defence prevents entry of pathogens.
3. Explain how the second and third lines of defence respond to an infection.
4. Describe what it means to be immune to a disease.
5. Describe how vaccines help build immunity against pathogens.
We are exposed to pathogens all day, every day. So why are we not constantly sick? Our bodies have a built-in defence mechanism called the immune system that prevents and fights diseases. Just like the digestive or respiratory systems, the immune system comprises many different cells and tissues that work together to keep you alive and healthy. The primary cells of the immune system are white blood cells, of which there are many different types with specific jobs. The white blood cells discussed in this chapter have one job in common: to recognise 'self' from 'non-self'. If a cell or molecule is recognised as non-self, an immune response is launched to eliminate the foreign invader. Immune protection consists of three lines of defence. The first two lines of defence are considered non-specific; they respond the same way to every type of pathogen. Additionally, there is no 'memory' of prior infections. The third line of defence is specific, providing a targeted defence depending on the type of pathogen encountered. The responses in this line of defence retain a memory of previously encountered pathogens, protecting you from getting sick a second time.
The first line of defence aims to prevent infection: it is the first point of the human body that the pathogen encounters. This line of defence includes physical barriers such as intact skin, hairs, cilia and the mucous membranes in the respiratory and reproductive tracts. The hairs that line the entrance of your nostrils are there for a reason! They trap large particles like dust and pollen. The cells that line the respiratory tract secrete a sticky mucus that traps inhaled pathogens, and the cilia beat in an upward motion that pushes mucus and any foreign bodies away from the lungs. If a pathogen does not gain access to the host's cells and tissues, it cannot disrupt normal physiological functions and cause disease. An additional set of barriers are chemical in nature and act to restrict the growth of pathogens in the body. Stomach acid and molecules called lysozymes found in sweat and tears, for example, have the ability to destroy bacteria. Remember the helpful microbes colonising our bodies discussed in section 4.1? These friendly bacteria, called our normal flora, also play an important role in preventing infection.
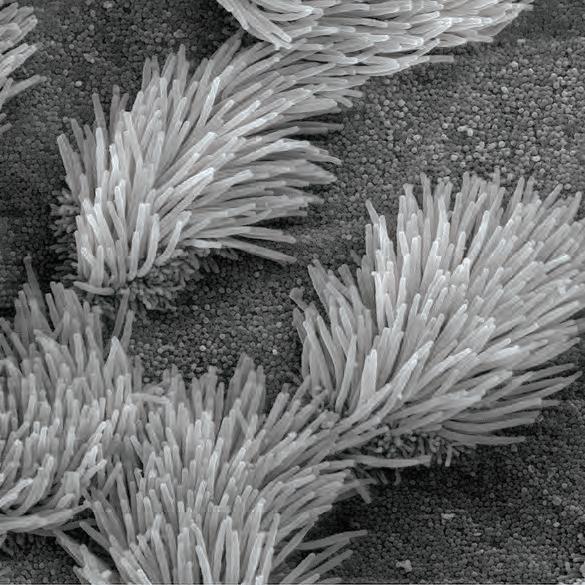
Our skin, gastrointestinal and reproductive tracts are covered in bacteria that usually do not harm us and that out-compete pathogenic bacteria and fungi for space and nutrients, preventing their colonisation of our body. For this first line of defence to work effectively, is important that our skin is intact. If we have a cut or a graze, this creates a pathway of entry into the body, giving bacteria or viruses access to living tissue.
The cilia and mucus that line your respiratory tract are called the mucociliary escalator. This is because the cilia move the mucus, with any pathogens or particles trapped in it, upwards like an escalator. The mucus is then swallowed, and any pathogens present are killed by your stomach acid.
Tears contain lysozyme to burst bacteria and continually wash the eye.

Trachea with cilia and mucous membrane. Mucus traps foreign material, before cilia move it.
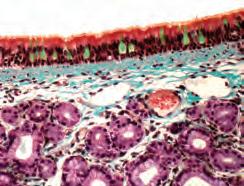
Normal bacterial flora in areas such as the digestive tract and genitals compete with pathogenic bacteria for resources and space.

Nose hairs and mucus help trap pathogens.
Stomach lining cells secrete strong acids to kill pathogens.
Intact skin acts as a physical barrier, secreting sweat, and has normal flora.
Second line of defence
phagocytosis a cellular process in which a white blood cell wraps around and ingests a cell or large particle to break it down using enzymes
If a pathogen gets past our first line of defence and starts to reproduce inside our cells or tissues, the second line of defence is activated. The second line of defence against infection is another non-specific response that works in the same way against different types of pathogens. Specialised white blood cells called macrophages and neutrophils are constantly circulating in your bloodstream on a search-anddestroy mission. Their role is to change the shape of their membrane to surround and then ingest dead cells and pathogens. This process is called phagocytosis. These specialised cells can also activate the inflammatory response, resulting in increased blood flow to the site of infection. Have you ever fallen over and cut or grazed your skin? If the wound became infected, you would have noticed the damaged area becoming swollen, red, hot and painful. This is due to the increase in blood flow to the area, which promotes healing and brings more white blood cells to the area of infection. You may have also noticed pus covering the wound, an accumulation of dead white blood cells and bacteria.
WORKSHEET Non-specific lines of defence
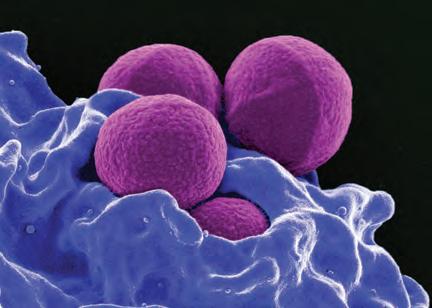
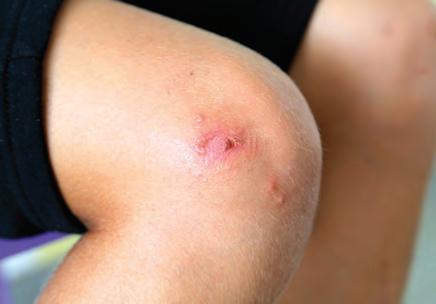
When a pathogen causes tissue damage, chemicals that cause the brain to raise the core body temperature above 37°C are released. This is called a fever; you have probably experienced this unpleasant symptom during a cold or flu. Rest assured, it serves a purpose! During a fever, the brain sets the body's thermostat to 38°C or 39°C, causing you to feel chills. Recall from Chapter 3 that in order to maintain homeostasis, the body will use muscle contractions to shiver and warm your body to this set temperature. The purpose of a fever is to activate heat-shock proteins and suppress pathogen growth. Our bodies work best at 37°C, so a fever that is too high (e.g. over 40°C) or lasts for too long can cause organ damage or death. This is why, as soon as the infection is cleared, the brain resets the thermostat to 37°C. When this happens, you will feel hot and start to sweat in order to cool back down.

1. Recall whether the second line of defence is specific or non-specific.
2. Recall the two cells that perform phagocytosis.
3. Describe what occurs during inflammation.
The third line of defence includes two main groups of specialised white blood cells known as lymphocytes – the B-cells and the T-cells (also known as B-lymphocytes and T-lymphocytes). These develop in the bone marrow and their letter indicates where they mature (B = bone marrow and T = thymus gland).
4. Explain why you get chills during a fever. lymphocyte a white blood cell that is involved in fighting disease; some produce antibodies antigen a substance that induces an immune response in the body VIDEO Third line of defence
There are 25 million to a billion T-cells in your body, with children having more T-cells than adults. There are two types of T-cells in your body: cytotoxic T-cells and helper T-cells. Cytotoxic T-cells help to eliminate viral infections by differentiating between infected and non-infected cells. To do this, they identify a special molecule called an antigen. Each T-cell has a unique receptor that can only bind with one kind of antigen, like a lock that can fit with a specific size and shape of key. Healthy cells have self-antigens on the surface of their membranes that the T-cells can identify as a regular part of that cell. Self-antigens do not activate T-cells. However, suppose a cell is infected with a virus. In that case, the cell will contain viral antigens on its surface that will signal the cytotoxic T-cell to identify it as foreign and destroy it. Once a virally infected cell is recognised and destroyed, a macrophage or neutrophil will phagocytose the dead cells to prevent the spread of the virus.
WORKSHEET
Specific lines of defence
antibody a Y-shaped molecule that binds to specific antigens memory cell a lymphocyte formed after exposure to a pathogen; can produce a faster and stronger immune response upon re-infection
The other type of T-cell is the helper T-cell. These cells act like team leaders and provide specific chemical instructions to other cells. These chemical instructions allow B- and cytotoxic T-cells to replicate and make thousands of clones of themselves to fight infection. Without helper T-cells, B-cells and cytotoxic T-cells would be unable to keep infections under control.
B-cells fight infection by making a special protein called antibodies. Again, working like a lock-andkey, antibodies are designed with specific binding sites that can only attach to certain antigens with the matching shape and size. Antibodies cause pathogens to clump together, attracting the white blood cells to perform phagocytosis and kill the pathogen. B- and T-cells can also form memory cells, which allow the immune system to mount a faster and stronger response when encountering a specific pathogen again. Sometimes, the second and subsequent responses are so effective that you might not even feel unwell or know you have been infected.
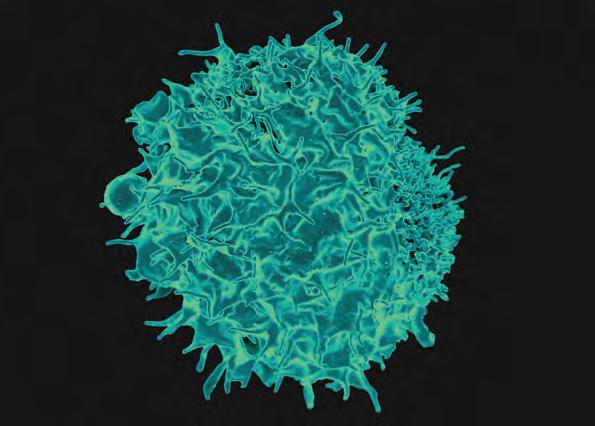


Antigen
Antibody binding site


Antibody


Antibody Bacterium
Antigens


Antibody
Figure 4.41 Different antibodies (here, green, red or yellow) bind only with their matching antigens. The antibodies clump the pathogenic bacteria together, making them easier to destroy.
Primary immune response
Initial exposure to antigen; for example, via a vaccine
Second exposure to antigen Secondary immune response
Figure 4.42 The secondary immune response to a previously encountered antigen on the surface of a pathogen is faster and stronger than the primary immune response.
Now you have learned about how the immune system fights disease, write a few sentences about how the ideas and information are connected to what you have experienced during illness.
Write down any new ideas that broadened your thinking or extended it in different directions after reading about the three lines of defence.
Write one challenge or puzzle that emerged for you.
The Connect, extend, challenge thinking routine was developed by Project Zero, a research centre at the Harvard Graduate School of Education.
1. Recall the two types of lymphocytes that carry out the third line of defence.
2. Explain the difference between B-cells and T-cells.
3. Describe how antibodies work.
Vaccines enable you to produce memory cells specific to a particular pathogen without ever being unwell! Vaccination involves injecting a dead or weakened pathogen (complete with all its identifying antigen flags) into your body. The altered version of the pathogen cannot cause an infection. However, the immune system still recognises it as a threat (because of the antigens) and produces antibodies and memory B- and T-cells in response. After the threat has passed, the antibodies break down, but the memory cells remain in the body for years, granting immunity to that pathogen. If you encounter that pathogen again, the memory cells are activated, producing larger amounts of antibodies in less time. This faster and stronger response often eliminates the pathogen without you even noticing you were infected.
vaccine a chemical substance composed of a dead or weakened version of a pathogen that is injected into the body to make a person immune against that pathogen

Almost all cervical cancers are caused by infection with human papilloma virus (HPV). HPV is transmitted via sexual intercourse and often shows no symptoms, so most infected individuals do not even know they have it. It can only be detected through cervical screening tests, such as a pap smear, which are recommended for anyone with a cervix. There are different types of HPV and these are categorised as low- or high-risk based on their ability to cause cancer. A persistent HPV infection can cause the cells of the cervix to become abnormal and eventually develop into cancer. HPV can also cause anal cancers, vaginal cancers, penile cancers and genital warts.
In the 1990s, University of Queensland researcher Professor Ian Frazer and his colleague, the late Dr Jian Zhou, started developing a HPV vaccine. Their vaccine, Gardasil, was approved in 2006, and Australia subsequently became the first country to add it to the National Immunisation Program. Gardasil-9 protects against seven of the high-risk types of HPV and is free for anyone aged 12–25 in Australia. In the first five years of the National HPV Vaccination Program, there was a 77% decrease in HPV-related disease among people with cervixes aged 18–24. Additionally, for those aged 20–24, the incidence of precancerous cervical cells decreased by 34%. If vaccination rates continue to be high, it is estimated that cervical cancer could be considered eliminated within the next 15 years.

In 1770, Lieutenant James Cook mapped the eastern coast of Australia. The First Fleet followed, arriving in Sydney in 1788. Prior to European settlement/invasion, Aboriginal and Torres Strait Islander Peoples had developed bush medicines and practices to combat disease. However, they had no immunity to the infectious diseases that were common in Europe. The most immediate consequence of colonisation by Europeans was a wave of epidemic diseases, including smallpox, typhoid, pneumonia, whooping cough, venereal diseases, measles and influenza, to name a few. Many of the European colonist populations had resistance to diseases like measles, bronchitis and scarlet fever, as they had already been exposed to the causative pathogens before arriving in Australia. However, these diseases were introduced by colonisers and spread rapidly through Aboriginal and Torres Strait Islander communities, killing many who had never been exposed before and devasting communities.
Section 4.3 questions
Remembering
1. Recall how many lines of defence against pathogens humans have.
2. State which lines of defence are non-specific and which are specific.
3. List examples of two physical barriers in the first line of defence.
4. Recall which two cells perform phagocytosis.
Understanding
5. Explain how the second line of defence fights pathogens.
6. Draw a labelled diagram of an antibody to show how it can help combat pathogens.
7. Explain why you cannot get sick from a vaccine.
8. Describe how inflammation is useful in clearing infection.
Applying
9. Explain why it is dangerous to have a fever for too long.
10. Sauerkraut and kimchi are two examples of probiotics (friendly microbes) in food. People who consume these foods claim that it helps with their digestive health.
a) State which line of defence the consumption of kimchi or sauerkraut would assist.
b) Explain how eating these foods could potentially protect an individual against getting ill.
Analysing
11. Compare and contrast the second and third line of defence.
12. Acquired immune deficiency syndrome (AIDS) is a disease that kills off helper T-cells. Infer why becoming infected by a pathogen is much more dangerous for a person living with AIDS.
Evaluating
13. Discuss the importance of achieving high coverage of vaccinated individuals in societies where infectious diseases are major health problems.
Go online to access the interactive chapter review!
Chapter checklist
Success criteria Linked questions
4.1I can define the term pathogen. 1
4.1I can describe the different types of pathogens. 2, 19a
4.1I can list examples of common pathogens. 3, 4
4.2I can distinguish between infectious and non-infectious diseases.7
4.2I can describe how infectious diseases can spread between people.6, 19b
4.2I can describe methods for limiting the spread of infectious diseases.11, 13, 17, 18
4.3I can describe the role of the immune system. 12, 15, 20
4.3 I can describe how the first line of defence prevents entry of pathogens. 14
4.3I can explain how the second and third line of defence responds to an infection. 5, 9, 10
4.3I can describe what it means to be immune to a disease. 16
4.3I can describe how vaccines help build immunity against pathogens.8, 21
Review questions
Remembering
1. Define the term ‘pathogen’.
2. Recall the four different types of pathogens.
3. Provide an example of a pathogenic bacterium.
4. Recall a virus that causes disease in humans.
5. A lymphocyte is a special type of white blood cell. Name the two different types of lymphocytes.
6. Recall four ways in which an infectious disease can be transmitted between people.
Understanding
7. Explain the difference between an infectious and a non-infectious disease
8. Describe how vaccination can prevent individuals from being infected by a disease.
9. Explain the difference between non-specific immunity and specific immunity.
10. Explain the role of antibodies.
Applying
11. Explain why viruses cannot be treated with antibiotics.
12. The body’s immune system may sometimes start to recognise ‘self’ antigens as foreign and ‘non-self’. Propose what might happen in this case.
13. If a virus is spread through respiratory droplets, describe two ways to prevent transmission of the virus.
14. Explain why intact skin is important for the first line of defence.
15. A child has had a fever above 40°C for three days. Explain why this happens and why it is dangerous.
16. Suggest what is meant by the term ‘immune memory’.
17. Compare the role of antibiotics and antiseptics.
18. ‘Superbugs’ are strains of bacteria that have adapted and become resistant after coming into contact with an antibiotic. Explain why superbugs are a significant problem in society.
19. The following image shows MRSA bacteria. The MRSA bacteria can survive on a healthy person’s skin or in their lungs without causing any symptoms or ill effects; however, in an immune-compromised person, MRSA can be life-threatening.
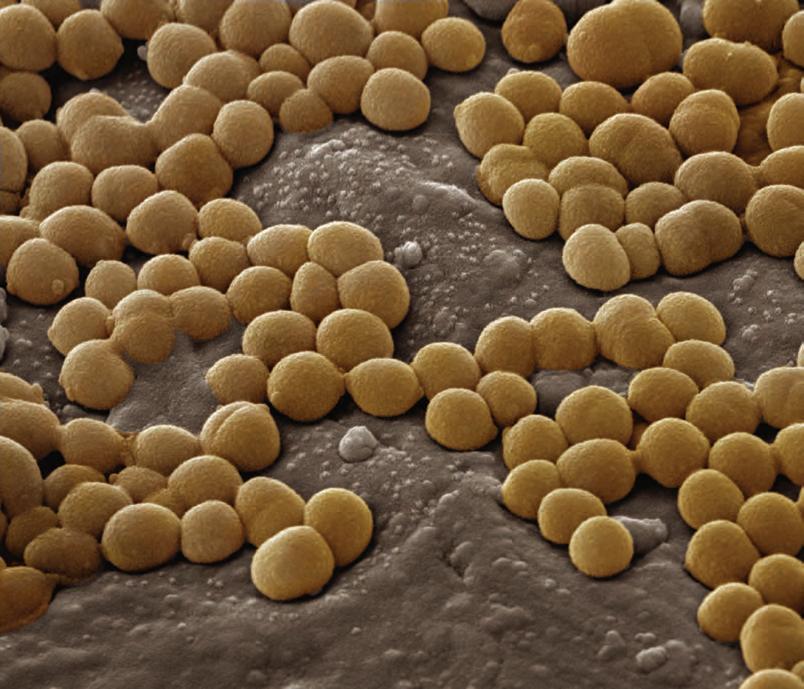
a) Suggest the scientific name for this type of bacteria.
b) Suggest two ways it can spread from one individual to the next, along with possible ways spread can be prevented.
20. The role of security in an airport is sometimes used as an analogy for the immune system, with non-self antigens compared to dangerous or illegal items and white blood cells acting as security officers. Evaluate the accuracy of this analogy.
21. Herd immunity describes a population’s resistance to a particular disease if a high proportion of individuals within the population are immune to the disease, usually through vaccination. Based on this information and what you have learned about how vaccination works, formulate and evaluate positive and negative viewpoints towards the compulsory vaccination of children.
To consider a disease eradicated, the agent that causes the disease must no longer be present anywhere in the world. Disease eradication is a permanent achievement, making control measures no longer necessary. Only smallpox, in 1980, and rinderpest, in 2011, have been eradicated. In theory, many diseases could be eradicated, but given current knowledge and technology, The International Task Force for Disease Eradication (ITFDE) has listed seven that are potentially eradicable in practice. These diseases are polio, Guinea worm disease, lymphatic filariasis, cysticercosis, measles, mumps and rubella.
Polio is an infectious disease that has no treatment and can lead to the permanent paralysis of body parts. It is close to being eradicated. Vaccines for polio have been used since the 1950s, which has led to the elimination of the disease from many developed countries. Two out of the three poliovirus types have been eradicated, with one remaining.
Figure 4.45 shows the estimated number of polio cases worldwide from 1980 to 2023, and Figure 4.46 shows the polio vaccine coverage worldwide from 1980 to 2021.

Applying
1. Identify the year in which the highest number of polio cases worldwide was recorded.
2. Identify the year in which polio cases fell below 100 000.
3. Calculate the increase in polio vaccine coverage between 1982 and 1983.
Analysing
4. Describe the trend in the data for polio vaccine coverage from 1980 to 2021.
5. State which years saw the steepest decline in polio cases and compare this to the number of polio cases for those years.
6. Analyse the data in both figures and explain whether there is a relationship between vaccine coverage and the number of people affected by polio.
Evaluating
7. Propose a reason why the data in Figure 4.46 would underestimate the number of polio cases recorded.
8. Evaluate the data above for its effectiveness in showing the progress that is being made towards polio eradication.
9. Suggest further pieces of data that would be helpful in analysing the current situation with polio.
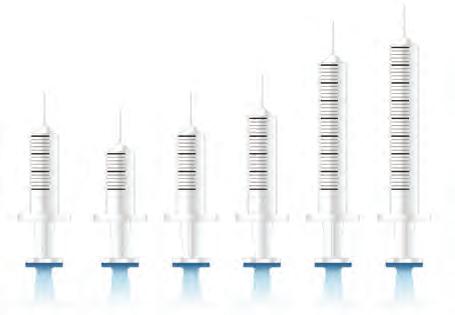
COVID-19, caused by the SARS-CoV-2 virus, emerged in late 2019 and quickly led to a global pandemic, significantly impacting health, society and economies worldwide. The virus spreads primarily through respiratory droplets and aerosols when an infected person coughs, sneezes or speaks. Symptoms range from mild (fever, cough, fatigue) to severe (difficulty breathing, organ failure), with the elderly and those with underlying conditions at higher risk.
In Australia, cities like Melbourne experienced some of the strictest lockdowns globally to curb the spread of the virus, with public health measures including mask mandates, social distancing and, later, widespread vaccination campaigns. While these measures were effective in reducing infections, the pandemic also highlighted challenges, such as the rapid spread of misinformation on social media, which made it harder for some people to access accurate guidance on preventing and managing the virus.
Scientific advancements, such as the development of vaccines in record time, played a crucial role in controlling the pandemic. Public health messaging also emphasised simple but effective strategies, like handwashing, mask-wearing and vaccination, to reduce the spread. However, to ensure that people understood and followed these guidelines, it was essential to have clear and engaging public awareness campaigns, particularly to address myths and educate diverse communities.
Design a public awareness campaign with the aim of reducing the spread of COVID-19.

Your task is to use your knowledge of the spread of disease to create a public awareness campaign based on the COVID-19 pandemic. The audience for your campaign is the people in your school community. You can present your work to the class through a poster, a social media post, an advertisement or any other relevant media.

1. Investigate COVID-19 by reviewing reliable sources, such as government health websites, scientific articles and information from public health organisations.
2. Identify the key messages your campaign will focus on, such as prevention, vaccination or combating misinformation.
3. Consider your audience: What information is most relevant to your school community’s students, teachers and parents?
4. Assess the resources available to you, such as materials, digital tools and time, to ensure your campaign is practical and achievable.
5. In your group, decide on the format of your campaign.
6. Think about sustainability: How will your campaign have a lasting impact? Can it be updated or adapted for future use?
7. Develop a clear and concise plan, including sketches, storyboards or outlines for your materials.
8. Develop your campaign materials based on your designs. Use tools such as:
• Canva or similar graphic design software for posters or infographics
• video editing tools like iMovie or Adobe Premiere for video content
• social media templates for Instagram posts or reels.
9. Ensure the content is accurate, engaging and visually clear. Use plain language where possible to ensure accessibility and consider multicultural communities with a particular focus on Aboriginal and Torres Strait Islander Peoples.
10. Gather feedback from your classmates about the effectiveness of the communication in your awareness campaign.
11. Explain any problems that might be encountered when implementing your campaign in the real world today. Could you incorporate technologies to help address these issues (e.g. artificial intelligence).
This chapter is all about atoms – those teeny particles that make up everything around us. The idea of the structure of the atom was developed by philosophers and scientists over thousands of years. Today when we talk about the structure of atoms, we can refer to their subatomic particles: protons, neutrons and electrons. In this chapter, we will investigate how these subatomic particles can affect atomic number, atomic mass and even how atoms of the same element can have different atomic masses. We will consider the formation of isotopes and learn about their stability and radiation, and you will see how different types of radiation can be used for new technologies, including in the medical and materials industries. Science is amazing!

Historical development of the atomic model
Current models:
• Planetary model
• Electron cloud model
Section 5.1
Section 5.2
Section 5.3
Section 5.4
Everything is made up of atoms
Subatomic particles:
• Proton
• Neutron
• Electron
Isotopes
Elements
Periodic table of elements contains:
• Atomic number
• Mass number
May undergo radioactive decay releasing
Compounds
Curriculum content
the model of the atom changed following the discovery of electrons, protons and neutrons; natural radioactive decay results in a change from unstable to stable atoms (VC2S10U06)
• comparing the masses and charges of protons, neutrons and electrons, and examining how the discovery of these particles resulted from experimental evidence and answered questions related to properties and behaviours of atoms
• explaining that differences in the number of neutrons in atoms of the same element results in isotopes and that naturally occurring isotopes of some elements are unstable
• describing in simple terms how different unstable isotopes decay, such as radon-222 emitting an alpha particle, iodine-131 emitting a beta particle and cobalt-60 emitting gamma radiation to form stable atoms
• defining half-life, examining the timescales of decay of different elements such as carbon-14 and uranium-238, and simulating or using digital simulations to examine radioactive decay, including half-life
• researching how radiocarbon and other dating methods including optically stimulated luminescence have been used to establish that Aboriginal and Torres Strait Islander Peoples have been present on the Australian continent for at least 65,000 years
• identifying where applications of radioactivity are used in medicine and industry, such as in diagnosing and treating cancer, and when checking for faults in materials used in aircraft and spacecraft
scientific knowledge is contestable and is validated and refined over time through expanding scientific methods, replication, publication, peer review and consensus (VC2S10H01)
• examining how Marie and Pierre Curie’s discoveries of new elements were validated5.4
Victorian Curriculum v2.0 F–10 © VCAA 2024
Alpha particle
Atom
Atomic number
Beta particle
Bioplastic
Compound
Electron
Gamma ray
Half-life
Ion
Ionic compound
Isotopes
Mass number
Molecule
Neutron
Nucleus
Nuclide notation
Proton
Radioactive decay
Radioisotopes
Relative atomic mass
Subatomic particle

At the end of this section, I will be able to: 1. Define the terms ‘atoms’, ‘elements’, ‘compounds’ and ‘molecules’.
You may recall from Year 8 that the word 'atom' comes from the Greek word atomos, which means 'indivisible' or 'un-cuttable'. If you cut a silver ring in half and then in half again, and continued to do this, you would eventually be left with an atom of silver (Ag). Scientists have now provided evidence that there are particles even smaller than an atom, and this is something you will explore later on in this chapter.
An atom is the smallest possible form of an element, and there is a unique atom for every element. So if a silver atom was cut in half, it would not be silver anymore, but would instead be two new elements.
Atoms are too small to be visible to the naked eye. A human hair is about as thick as 500 000 carbon atoms stacked over each other. Even with examples like this, it is almost impossible to truly understand the size of an atom.
You can only visualise an atom with a highly specialised microscope called a scanning tunnelling microscope. The world's first images of atoms were produced by a research team at the International Business Machines Corporation (IBM). In 1981, physicists Gerd Binnig and Heinrich Rohrer developed the first scanning tunnelling microscope. They were awarded the Nobel Prize in Physics in 1986 for their efforts. This discovery allowed scientists to view images of many different atoms that had previously gone unseen.

In 2013, researchers at IBM created the world’s smallest movie. They used carbon monoxide molecules and moved them by using the small tip of the scanning tunnelling microscope. The movie is called A Boy and His Atom – a boy meets an atom and they become friends. It was created using individual frames that were put together using stop-motion software. You can search for this film on the internet. Although it was constructed for fun, it shows just how far science has come in the study of atomic and molecular systems.

Quick check 5.1
1. Define ‘atom’.
2. Recall the name of the microscope that allowed scientists to view atoms.
Recall that all elements are made of only one unique type of atom and these atoms are identical to one another. For example, the element nickel is made up of only Ni atoms. All of the known elements are arranged on the periodic table according to their atomic and chemical properties (see Figure 5.3). They are represented by a symbol using one or two letters.
Connect, extend, challenge: element symbols
1. How do element symbols generally relate to their names in English?
2. Eleven element symbols in the periodic table do not match their English names. Can you identify all 11 elements?
3. Why is it important to know the origin of element symbols? How might this knowledge be important to a chemist?
The Connect, extend, challenge thinking routine was developed by Project Zero, a research centre at the Harvard Graduate School of Education.

Compounds are formed when two or more different elements combine in a fixed ratio by chemically bonding. The properties of the individual elements that make up a compound are usually different from the properties of the compound itself. For example, aluminium is a lustrous grey solid and oxygen is a colourless gas, but their compound (aluminium oxide) is a white solid. Compounds consisting of metal and non-metal atoms are often classified as ionic compounds.
The term molecule is often used to describe a chemical species made up of two or more atoms. For example, oxygen gas (O2) is a molecular element, whereas water (H2O) is a molecular compound. Both are molecules, but one is made up of only one type of element and the other contains different elements.
Practical 5.1
Aim
To show that compounds have different physical properties compared to their individual elements.
Materials
• 5 cm strip of magnesium ribbon
• tongs
Method
• crucible
• matches
• Bunsen burner
1. Copy the results table into your science book.
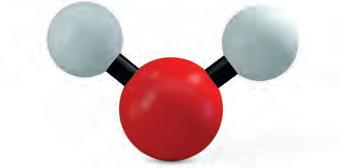
compound a substance formed by the chemical combination of two or more different elements in a fixed ratio
Be careful
Do not look directly at combusting magnesium. Ensure general fire safety is followed.
• heatproof mat
• safety glasses
2. Record your observations of the physical properties of magnesium and oxygen.
3. Set up a Bunsen burner on a heatproof mat.
4. Hold the piece of magnesium ribbon with the tongs and put it into the hottest part of the flame until it catches alight.
5. Collect the compound formed in a crucible and observe the contents.
6. Complete the table recording your observations of the physical properties of the compound formed.
Results
Copy and complete the following table.
Table showing the physical properties (appearance) of the substances in the reaction
Substance
Magnesium metal
Oxygen gas
Compound formed
Discussion: Analysis
Physical properties (appearance)
1. Predict the name of the compound that was formed in the demonstration.
2. Propose a word equation for the reaction demonstrated.
molecule a chemical species made up of two or more atoms; can be elemental or a compound
ionic compound a type of compound generally made up of both metal and non-metal atoms
elements and compounds DOC
WORKSHEET
Aim
To split molecules of water into atoms
Materials
• baking soda
• distilled water
• 250 mL beaker
• 250 mL measuring cylinder
• stirring rod
• spatula
Method
Be careful
Make sure connectors of leads are separated and not in contact with each other when attached to the switched-on power pack.
• power leads × 2
• alligator clips × 2
• power pack (or 9 V battery)
• safety glasses
• 15 cm square of thin cardboard
1. Using the 250 mL measuring cylinder, measure 150 mL of distilled water and pour into the beaker.
2. Add a heaped spatula of baking soda to the beaker and stir it with the stirring rod until the baking soda has dissolved. Note: The baking soda will enhance the conductivity of the solution, but it is not involved in the chemical reaction.
3. Attach each lead to the 9 V battery or the DC terminals of the power pack (setting the voltage to 9 V).
4. To the other end of each lead, attach an alligator clip, making sure the wires do not touch each other.
5. Cut the piece of cardboard to fit over the beaker, then make two holes in the cardboard, approximately 3–4 cm apart.
6. Put the ends of the leads with the alligator clips through the holes in the cardboard and into the beaker of baking soda solution, again making sure the leads do not touch each other at any point.
7. Leave this set up for 10 minutes. During this time you should see bubbles forming at each alligator clip.
Results
Compile a list of the observations that you made from this experiment. Remember, observations are what you can see happening, not an explanation of what is happening.
Discussion: Analysis
1. In this experiment, you split water molecules into their atoms. Identify which atoms make up water molecules and how many of each single atom there are.
2. Distilled water is water that has undergone a process to remove impurities. Propose why distilled water had to be used in this practical and suggest what, if any, effect this may have had on the outcome.
1. Determine the elements that form each of the following compounds.
a) Water (H2O)
b) Carbon dioxide (CO2)
c) Sodium chloride (NaCl)
2. Determine whether it is possible to predict if a substance is an element or a compound by its chemical formula or by its chemical name.
Section 5.1 questions
Remembering
1. Name two elements that you might find in the air.
2. Identify the different elements present in ethanoic acid (CH3COOH), which is found in vinegar.
Understanding
3. Explain why some elements on the periodic table have symbols that do not match their English names.
Applying
4. Explain why carbon dioxide (CO2) is not found on the periodic table.
Analysing
5. Compare an atom, an element and a compound.
6. Distinguish between molecules and compounds.
Evaluating
7. Decide which of the following substances contain compounds: oxygen, potassium, water, sugar, candle wax, hydrogen, petrol. Justify your choice.

Learning goal
At the end of this section, I will be able to:
1. Outline the different contributions scientists and philosophers have made to the development of the modern model of the atom.
When did the idea of the atom first come about, and how has it changed over time?
Discussions about the atom and its structure have been going on within the scientific community for hundreds of years. In this section, you will examine the major discoveries that have contributed to our understanding of the atom and highlight how new experimental evidence can lead to a scientific model being updated or replaced. Concepts can be improved or completely changed as new scientific discoveries are made over time.
democritus 460–370 bce
Democritus was the first philosopher to theorise about the atom. In 442 BCE, he hypothesised that if you take an object and cut it into smaller and smaller pieces, eventually you reach a point where you cannot cut it any smaller. You would end up with a piece that was indivisible. Democritus called this piece atomos, which means 'indivisible' in Greek. He thought, for example, that water was made of water atoms, bread was made of bread atoms and soil was made of soil atoms. This may sound silly now, but it was quite a sophisticated idea at the time. Keep in mind, Democritus had no modern technology such as microscopes to view these substances.
Aristotle 384–322 bce
Aristotle rejected the ideas of Democritus, instead believing that matter on Earth was made up of four elements – earth, air, fire and water – and the relative amounts of these elements determined how materials behaved. Aristotle had such an influence over people at the time that they forgot all about Democritus's theory.
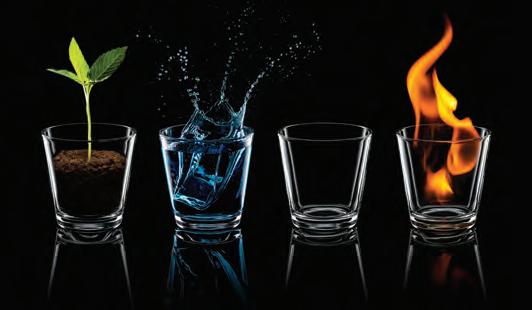
Dalton is credited with initiating research into modern atomic theory in 1803, more than 2000 years after Democritus first proposed his ideas on the atom. Dalton suggested that all elements, which had by then been arranged in the periodic table, contained atoms, and that atoms of the same element would be identical in size, shape and mass. Dalton imagined the atom as a solid sphere, so this theory was called the 'solid sphere model'. He also stated that compounds were a combination of elements. The question he could not answer was why atoms behave the way they do.
Figure 5.9 John Dalton was an English chemist, physicist and meteorologist. He is best known for initiating research into modern atomic theory.
Thomson was the first scientist to discover particles smaller than the atom, disproving Dalton's and Democritus's theories. Surprisingly, the first subatomic particle to be discovered was the lightest – the electron – and Thomson won a Nobel Prize for his work in 1906. By studying 'rays' within a cathode ray tube, Thomson was able to determine that these 'rays' had a mass 1000 times smaller than a hydrogen atom, the lightest piece of matter known to science at the time. He therefore concluded that these 'rays' were not rays at all, but very light particles. These particles were also attracted to a positively charged metal plate, indicating that they were likely to be negatively charged. He named these particles 'corpuscles', but they are now called electrons.
The first model of the structure of the atom was proposed by Thomson, who named it the 'plum pudding' model (see Figure 5.11). Thomson knew that electrons were negatively charged and that atoms were neutral, so he theorised that there must also be positive charge within the atom that equalled the negative charge of its electrons. He imagined the atom as negatively charged electrons (plums) embedded in a large 'sea' of positively charged 'pudding'.
Figure 5.10 Thomson proposed the plum pudding model and is credited with discovering the electron.
Negatively charged ‘plums’ (electrons)
Sea of positively charged ‘pudding’
Figure 5.11 The plum pudding model consists of negatively charged electrons (the plums) scattered through a sea of positive charge (the pudding).
WORKSHEET
The gold foil experiment
alpha particle
a positively charged particle that is emitted from the nucleus of some radioactive elements during radioactive decay (or disintegration) of an unstable atom
nucleus (plural: nuclei) the central part of the atom containing its protons and neutrons
In 1911, Ernest Rutherford and colleagues Hans Geiger and Ernest Marsden fired alpha particles (helium nuclei) at a thin piece of gold foil, in the famous gold foil experiment.
Rutherford predicted that if the atom was like Thomson's plum pudding model, then all the alpha particles should pass straight through the atom undisturbed. This is not what happened! As the gold foil experiment showed, although almost all (99.99%) of the alpha particles passed straight through the foil and were detected at the other side, indicating that the atom was mainly empty space, some of the alpha particles bounced back or were deflected as if they had hit something. Rutherford concluded that there must be an area of charge concentrated in the middle of the atom, with enough mass to cause the alpha particles to deflect or bounce back, thus disproving the plum pudding model (see Figure 5.13).
Figure 5.12 Rutherford stated that there was a large concentration of charge and mass situated in the centre of the atom and that most of the atom was empty space.
Figure 5.13 Comparison between atomic models: (a) Thomson’s plum pudding and (b) Rutherford’s central region of mass and charge
In analysing the results of this experiment, Rutherford devised his own model of the atom. This model depicts a charged area with substantial mass concentrated in the middle of the atom, called the nucleus. Rutherford and many other scientists assumed the nucleus to be positively charged because it repelled the positively charged alpha particles that were fired towards it. Rutherford concluded that the negatively charged electrons orbited around this central region. Rutherford's model is often called the 'nuclear' model of the atom. Although many other scientists contributed to the developing knowledge at the time, it was Rutherford who named the positively charged particles in the nucleus protons.
Try this 5.1
Consider:
• How is a gum ball like Dalton’s theory of the atom?
• How is a chocolate chip cookie like Thomson’s model of the atom?
• How could you represent Rutherford’s model of the atom using sweet treats?
Interactive digital simulations are also a type of modelling. Take a look at PhET’s Rutherford scattering simulation online to see how an animation can help us understand more about science.
millikan’s
In 1923, physicist Robert Andrews Millikan won the Nobel Prize in Physics for his now famous oil drop experiment, which provided evidence for the formal charge of the electron. Use the internet to answer the following questions.
1. What is the Millikan oil drop experiment?
2. How does the experiment provide evidence of the negative charge of the electron?
Millikan’s evidence was consistent with evidence from earlier discoveries, including Thomson’s discovery of the electron and Rutherford’s hypothesis that electrons exist in space around a dense positively charged nucleus. These three key findings were pivotal for the consolidation of knowledge about electricity – the movement of negatively charged electrons through a substance.
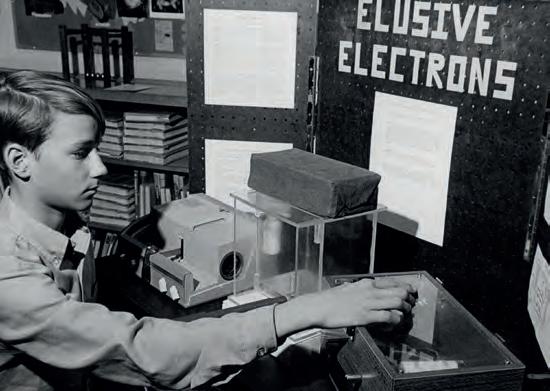
1. Recall the four elements that Aristotle believed made up all matter on Earth.
2. State the name of the subatomic particle that Thomson discovered and the name of his atomic model.
3. Complete the sentences below using the word list. alpha empty space plum pudding model nucleus passed through
Rutherford conducted the gold foil experiment, firing ____________ particles at a thin piece of gold foil. Most of these particles ____________; however, a small number were deflected back. Rutherford hypothesised that the reason for this was that the particles were either passing through a region of ____________ or hitting a central region of concentrated mass and positive charge, which he called the ____________. His findings disproved the ____________.
By the early twentieth century, scientists had a good idea about atomic structure; they just needed to identify where the electrons were actually situated in the atom.
Niels Bohr proposed his model of the atom (a modification of Rutherford's theory) in 1913 after observing the behaviour of electrons. Bohr was trying to compare the behaviour of electrons and the behaviour of light. He said electrons moved in fixed circular orbits around the nucleus in structures called shells, and that these shells were specific distances away from the nucleus and the same for all atoms. Bohr's model is often called the 'planetary model' because it resembles how planets orbit a central star.
Electrons located in shells that were further away from the nucleus had higher energies than those closer to it. He stated that when electrons absorb energy, or get excited, they jump to the next energy level or shell. When they fall back to their original level, they emit some light, which matches the amount of absorbed energy.
Scientists now know that Bohr's model has some flaws, but it provided some important understanding about the behaviour of electrons. This model, built off the work of Dalton, Thomson and Rutherford is the model you will recognise and use the most in your studies.
Nucleus containing protons
Although Bohr's model proposed that electrons existed in 'shells' around the nucleus, scientists knew very little about the position and behaviour of the electrons in the 'shells'. Erwin Schrödinger stated that it is impossible to predict where a specific electron will be situated in the atom at any given time. The only thing you can predict is where in the atom you are most likely to find an electron. This contradicted Bohr's idea of electrons being in fixed shells around a central nucleus. Schrödinger proposed the electron cloud model, which shows the locations in the atom with the greatest probability of containing an electron. This relates to the wave properties of the electron (quantum, or wave, mechanics).
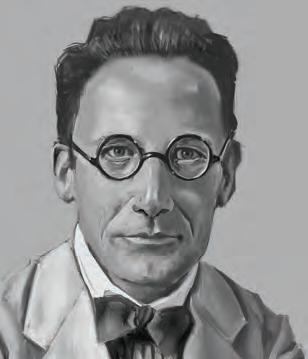
The last of the three subatomic particles to be discovered was the neutron. Since it has no charge and does not repel the protons in the nucleus, this subatomic particle was relatively undetectable. This was until James Chadwick started working with beryllium atoms and alpha particles in 1932. When he collided these two particles together, an unknown radiation made up of neutrally charged particles was released. He named these particles neutrons.
In high school, although we use the Bohr model (protons in the nucleus and shells of electrons), we also include neutrons in the nucleus in our diagrams, even though Bohr did not.
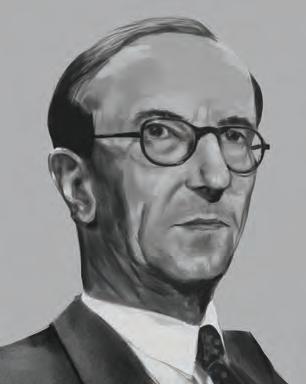
Figure 5.19 Chadwick discovered the neutron, the last subatomic particle to be discovered. This completed the atomic model in use today.
5.20 We use the Bohr model, also showing neutrons, because it is a simplification of the electron cloud model.
Quick check 5.4
1. a) Recall the name Bohr gave to the structures that contained electrons.
b) Describe how Bohr’s explanation of these structures differed from Rutherford’s model.
2. Identify the subatomic particle that Chadwick discovered.
The evolution of the atomic model is an excellent example of how individual scientists contributed to and continue to revise our understanding of atomic structure. However, it is important to note that this is still a model and there may be new discoveries to come. After all, at one time scientists thought that the plum pudding model was the correct model of atomic structure. It is important that scientists continue to ask questions, conduct experiments and critique other people's work to increase our understanding of atomic structure.
Our understanding of the structure of the atom and the particles within it did not stop with James Chadwick in 1932. In 1964, British-born theoretical physicist Professor Peter Higgs proposed the existence of another subatomic particle, which was later named after him: the Higgs boson. The detection of this particle became his goal and the goal of many other theoretical physicists.
In 2012, the European Organization for Nuclear Research (CERN) announced they had conducted experiments on the Large Hadron Collider (LHC), a particle accelerator built in a ring-shaped tunnel with a 27-kilometre diameter underneath the Franco–Swiss border. The experiments showed promising results of a particle that could be a Higgs-like boson.
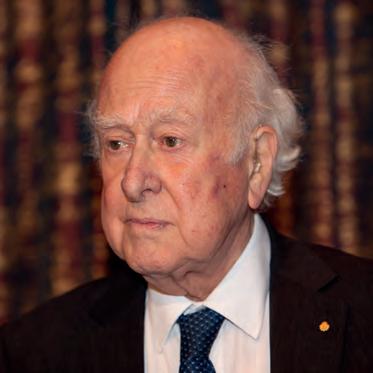
You can imagine the excitement Professor Higgs must have felt after all this time! In 2013, after almost 55 years of research, CERN finally had enough evidence to confirm that they had recorded the presence of a Higgs boson. Professor Higgs was awarded a Nobel Prize in Physics in the same year.
This is a great example of how, with hard work and persistence, you can achieve your goals!
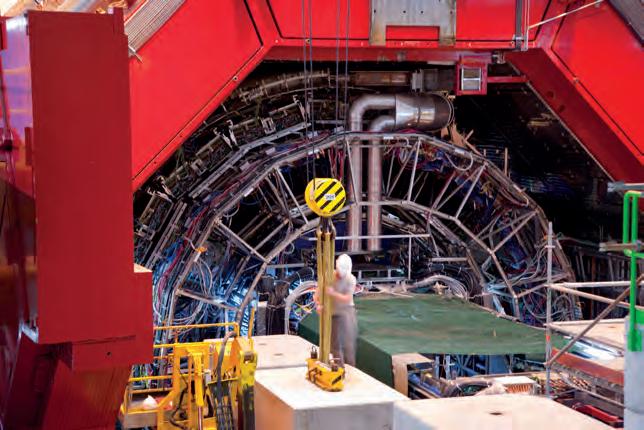
The 'Matilda Effect' refers to the systematic denial or minimisation of women's scientific contributions, with their work often attributed to male colleagues. This phenomenon has led to the historical erasure of many women scientists' achievements, perpetuating gender biases in the recognition and rewarding of scientific work.
The following examples underscore the challenges women have faced in the scientific community. Throughout the development of atomic theory, numerous women made significant contributions that were often overlooked, marginalised, or attributed to their male counterparts due to systemic misogyny:
Marie Curie's pioneering work in radioactivity was foundational to our understanding of atomic structure. She discovered the elements polonium and radium and coined the term 'radioactivity'. Despite her monumental contributions, she faced substantial gender-based discrimination. In 1903, when the Royal Institution in London invited the Curies to speak on radioactivity, only her husband, Pierre Curie, was permitted to speak.
Lise Meitner (1878–1968)
An Austrian Swedish physicist, Lise Meitner played a crucial role in the discovery of nuclear fission, the process that powers nuclear reactors and atomic bombs. Despite her significant contributions, it was her collaborator Otto Hahn who received the Nobel Prize in Chemistry in 1944 for this discovery, while Meitner's role was largely overlooked, exemplifying the systemic biases that led to the erasure of women's contributions in science.
A Canadian American applied mathematician and computer scientist, Charlotte Froese Fischer developed the Multi-Configurational Hartree-Fock (MCHF) approach to atomic-structure calculations. Her theoretical prediction of the existence of the negative ion of calcium was experimentally confirmed, marking the first known anion of a Group 2 element. Despite her significant contributions, she faced challenges in a male dominated field, reflecting the broader systemic issues that often led to the underrepresentation and undervaluation of women's work in science.
In this section, you have learned that the atom is made up of three different subatomic particles. However, there are actually a few more, including the Higgs boson. Another subatomic particle is the neutrino, which is hypothesised to act like an electron but have a neutral charge. Neutrinos don’t exist in an atom but are produced and emitted when two or more atoms fuse together under extremely high temperature and pressure, such as the

conditions on the Sun. These neutrinos then travel through space, with some reaching Earth. In 2015, Professors Takaaki Kajita and Arthur B. McDonald were awarded the Nobel Prize in Physics for their work showing that neutrinos have mass, just like electrons.

Professor Janet Conrad is an American physicist and a leading expert on neutrinos. She has played a key role in the Main Injector Neutrino Oscillation Search (MINOS) experiment, which was designed to study the behaviour of neutrinos as they travelled through Earth. She led a team that developed the software and algorithms used to analyse the data collected by the experiment. The MINOS experiment provided important evidence for the phenomenon of neutrino oscillation, which is the process by which neutrinos change their identity as they travel.
Remembering
1. Recall what the Greek word atomos means in English. How does this relate to the word ‘atom’?
2. Recall who discovered the neutron.
Understanding
3. Summarise what Rutherford predicted would happen, according to Thomson’s plum pudding model, when he fired alpha particles at gold foil.
4. Identify why some alpha particles bounced back towards the detector in Rutherford’s gold foil experiment.
Applying
5. Compare Rutherford’s model of the atom with the plum pudding model.
Analysing
6. Analyse the differences between Schrödinger’s and Bohr’s models of the atom.
Evaluating
7. Discuss the evidence that led to Rutherford concluding that most of the mass and all the positive charge of the atom were concentrated in the centre.
At the end of this section, I will be able to:
1. Compare the relative mass and charge of protons, neutrons and electrons.
2. Define the terms ‘ion’, ‘atomic number’ and ‘mass number’.
3. Determine the number of protons and electrons in the atom of an element.
4. Calculate the mass of an atom from the number of protons and neutrons.
Despite having a long history, it was only in the twentieth century that the idea of atoms became widely accepted. As new technologies developed, physicists discovered that the atom is made up of three main subatomic particles: protons, neutrons and electrons. There are different numbers of these subatomic particles in each element, which we will explore shortly.
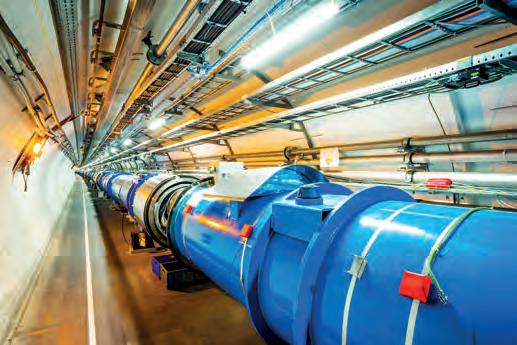
Since 2008, physicists have learned a lot more about particles within atoms from studies using CERN's LHC. Here, subatomic particles are smashed together at speeds close to the speed of light. The remains are then analysed. When the LHC was first built, some scientists believed it would create many miniature black holes that might even swallow Earth. Luckily, despite being the world's biggest machine, the LHC currently cannot produce nearly enough energy for this to occur.
ordinary hydrogen: An unusual
Hydrogen is the only element that does not contain all three subatomic particles. Most hydrogen atoms only contain one proton and one electron. It is missing a neutron!
Even with the most powerful microscopes, scientists cannot see inside the atom, so they create models of the atom to represent ideas that cannot be observed. To help visualise the structure of the atom, you can model it as a mini solar system. In the middle of our solar system is the Sun and orbiting the Sun are the planets, with most of the rest of the solar system being empty space. The atom has a similar kind of structure. In the middle of the atom is a structure called the nucleus, which is where the protons and neutrons are situated. Orbiting the nucleus in shells (also known as orbitals) are the electrons. The shells are drawn as circles and are at different energy levels depending on how far they are away from the nucleus.
subatomic particle one of the particles that make up an atom
proton a subatomic particle with a positive charge found in the nucleus of an atom; has a relative mass of 1
neutron a subatomic particle with a neutral charge found in the nucleus of an atom; has a relative mass of 1
electron a subatomic particle with a negative charge, found outside the nucleus of an atom; has a relative mass of 1 1836 of a proton or neutron
The first shell can 'hold' up to two electrons, and the second shell up to eight electrons before it is full. Each lower shell must be filled before electrons begin occupying the next shell.
Nucleus
Electron shell
Figure 5.26 A Bohr diagram shows the positively charged nucleus (containing both protons and neutrons) in the middle, with the negatively charged electrons orbiting in shells around it.
Just like the solar system, most of the atom is made up of empty space. To give you an idea of how empty the atom is, if the atom was the size of an Olympic athletics track, then the nucleus would only be the size of a pea!
Did you know? 5.3
maria Goeppert mayer
Maria Goeppert Mayer was a pioneering physicist whose work on the nuclear shell model revolutionised our understanding of the behaviour of subatomic particles. Born in Germany in 1906, Goeppert Mayer moved to the United States in the 1930s and began working on the physics of the atomic nucleus. Her research on the behaviour of protons and neutrons led to the development of the nuclear shell model, which explained the stability and behaviour of atomic nuclei based on the arrangement of their protons and neutrons.
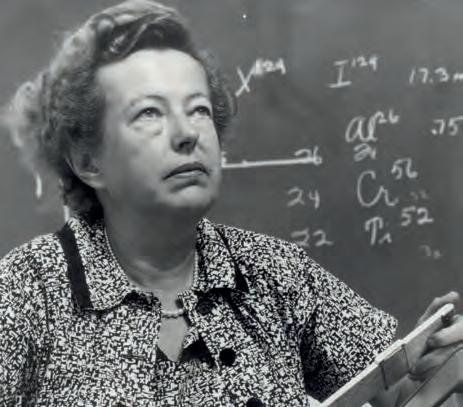
Figure 5.27 Despite her groundbreaking work, Goeppert Mayer struggled to find paid academic positions due to gender discrimination. Her achievements were finally recognised when she became the second woman to receive the Nobel Prize in Physics in 1963, decades after her initial contributions.
Quick check 5.5
1. Name the structure at the centre of the atom and state what it contains.
2. Identify the location of the electrons in modern atomic models.
To understand more about atoms and how they behave, we need to know more about the three subatomic particles within them.
You may be wondering what keeps the electrons inside the atom. If they are whizzing around at enormous speeds inside the atom, why don't they just fly off into space? The reason they remain has to do with the electrical charges of the subatomic particles. The protons in the nucleus in the middle of the atom have a positive charge (+1 each). Electrons orbiting the nucleus have a negative charge (–1 each). Positive and negative charges follow two basic rules of electrostatics: opposite charges attract and like charges repel. This means that the protons and electrons in an atom are attracted to each other, and this is what stops the electrons from flying off into space. Neutrons are electrically neutral, which means they have relatively no charge (0).
Protons and neutrons have very similar masses: a proton has a mass of 1.673 × 10⁻²⁴ grams (g) and a neutron has a mass of 1.675 × 10⁻²⁴ g. These numbers are very small and almost the same, so for practical reasons, both protons and neutrons are assigned a relative mass of 1 atomic mass unit (amu). These values are much easier to remember and work with. Electrons have a relative mass 1 1836 of a proton or a neutron.
Quick check 5.6
1. Copy and complete this table to summarise the differences in charge and relative mass of the three subatomic particles.
Explore! 5.2
particles smaller than the electron
Scientists once thought that the atom was the smallest particle that existed. Now we know that protons, neutrons and electrons make up the atom, but is there anything that makes up these subatomic particles? Because of its wavelike properties, it is extremely hard to define or measure the size of an electron. Some quantum physicists think that an electron could even be in two places at one time.
Research the particles that make up protons, neutrons and electrons, also known as quarks. What are their names? What is known about them?

The number of subatomic particles in an atom depends on the type of element being considered. Look at the periodic table in Figure 5.29 and you will notice that each element has a symbol and two numbers. These numbers provide information about the number of protons, neutrons and electrons in each atom of that element.
Figure 5.29 The periodic table gives you information about each element’s atoms.
The number on the top left above the element symbol is called the atomic number. The atomic number is sometimes called the proton number, as it tells you how many protons are in an atom of that element. For example, the atomic number of carbon is 6; therefore, a carbon atom has six protons.
Atomic number
Figure 5.30 For the element carbon, the atomic number is 6. Therefore, you can conclude that it has six protons.
The atomic number defines the element. Any atom that contains six protons will always be carbon, no matter how many neutrons or electrons it contains. If another proton is added to carbon, then a different element with seven protons is formed – otherwise known as nitrogen. Carbon is a black solid and nitrogen is a colourless gas; one proton can make a big difference to an element's properties!
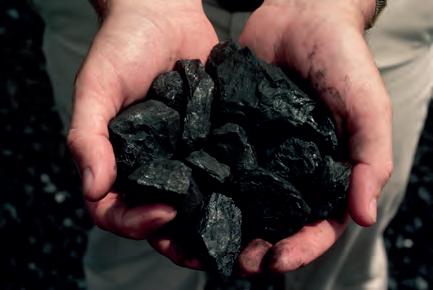

5.32 Nitrogen is a colourless gas with an atomic number of 7. It can be converted to a liquid by cooling it to –196°C.
This is the same for any other element on the periodic table. Hydrogen has one proton so any other substance with one proton will also be the element hydrogen. Atomic number
Figure 5.33 For the element hydrogen, the atomic number is 1, so you can conclude that it has one proton.
1. Using an element of your choice as an example, explain what the atomic number tells you about the atom.
The atomic number also gives you information about the number of electrons in an atom of an element. Recall that protons have a positive charge and electrons have a negative charge. An atom is neutral, meaning that it has an overall charge of zero. For the overall charge to equal zero (neutral), an atom must have the same number of positive protons and negative electrons. Carbon has an atomic number of 6, meaning it has six protons (six positively charged particles). Therefore, for the atom to have zero charge, it must also have six electrons (six negatively charged particles).
Unlike changing the number of protons, changing the number of electrons in an element will not change the type of element but it will change the chemical properties of the element. If the number of electrons in an atom changes, the atom becomes charged, and is referred to as an ion. Ions can be:
• positively charged, if they lose one or more of their negatively charged electrons. This is denoted by a superscript plus (+) sign after the chemical symbol.
• negatively charged, if they gain one or more negatively charged electrons. This is denoted by a superscript minus (–) sign after the chemical symbol.
For example, Mg2+ denotes a magnesium atom that has lost two electrons and now has an overall charge of 2+ (see Figure 5.34).
Protons (+) = 12
Electrons (–) = 12
Net charge = 0
Protons (+) = 12
Electrons (–) = 10
Net charge = 2+
Figure 5.34 If a magnesium atom loses two electrons from its outer shell, it has lost two negative charges. This gives the resulting magnesium ion an overall positive charge of 2+.
WORKSHEET
Numbers of subatomic particles 1 DOC
ion a charged version of an atom that has either gained electrons (and become negatively charged) or lost electrons (and become positively charged)
Aim
To investigate the effect of different ions on water hardness (Note: Water ‘hardness’ refers to the amount of dissolved calcium and magnesium ions present in water).
Materials
• test tubes × 8
• test-tube corks/bungs × 8
• test-tube rack
• dropping pipettes
• 100 mL beaker
• marker pen
• 50 mL soap solution in industrially denatured alcohol (This can be made by dissolving soap flakes or shavings from a bar of soap in industrially denatured alcohol.)
• 10 mL each of
– distilled or deionised water
– 0.1 mol L−1 sodium chloride
– 0.1 mol L−1 calcium chloride
– 0.1 mol L−1 magnesium chloride
Method
– 0.1 mol L−1 potassium nitrate – 0.1 mol L−1 sodium sulfate – 0.1 mol L−1 iron(II) sulfate
– 0.1 mol L−1 magnesium sulfate
1. Write a rationale about water hardness, what influences it and what problems hard water can cause.
2. Identify the independent and dependent variables for this experiment.
3. Identify as many variables that need to be controlled as possible, and describe how you will control them.
4. Develop a hypothesis to predict which ions will cause the hardest water.
5. Complete a risk assessment for this investigation that includes how the risks will be controlled.
6. Set up eight labelled test tubes in a test-tube rack. Place 1 cm depth of distilled water in one of the test tubes and place 1 cm of each of the seven different ion solutions in the remaining test tubes.
7. Use a dropping pipette to transfer approximately 1 cm depth of soap solution to each test tube.
8. Seal the test tubes with a bung or cork and shake them well.
9. Record which test tubes contain a lather (mass of bubbles) at the end of the shaking. If a lather is present, record its depth.
Results
Draw a results table that will allow the collection of sufficient and relevant raw data.
Discussion: Analysis
1. Identify the ion(s) that cause the hardest water. Justify your answer using your data.
Discussion: Evaluation
1. Discuss the purpose of the test tube containing distilled water. Explain how this may contribute to the reliability of the experiment.
2. Identify any potential sources of error in this experiment.
3. Suggest any changes that could be made to the method to improve the quality of the data in future experiments. Justify your suggestions by explaining how each change would improve the data quality.
Conclusion
1. Make a claim from this experiment about ions and water hardness.
2. Justify this claim using data from your results.
3. State whether your hypothesis was supported or not supported by the results.
When the number of electrons in an atom changes and an ion forms, the properties of the element are affected. You are going to conduct some research on some different elements, their structure and properties, and the ions they form.
1. When fluorine atoms become negatively charged ions, they can combine with other elements, forming fluorides such as sodium fluoride (NaF). Conduct some research on the properties of fluorine and compare this with the properties of sodium fluoride.
2. The elements in the last group (column) of the periodic table are known as the noble gases. They all have a full outer shell of electrons and do not form ions readily. The elements in the second last group of the periodic table (group 17) are known as the halogens, and all are one electron short of a full outer shell. Conduct some research and compare what type of ions noble gases and halogens form.
3. The elements in the first group of the periodic table are known as the alkali metals. They all have one electron in their outer shell. Conduct some research on what type of ions they form.
4. The elements in the second group of the periodic table are known as the alkaline earth metals. They all have two electrons in their outer shell. Conduct some research on what type of ions they form.
5. Predict the charge of ions formed from: a) sulfur b) barium c) iodine.

1. Explain how an atom becomes positively or negatively charged.
2. An atom of oxygen gains two electrons and becomes an ion. State the ion formed, using the atomic symbol for oxygen and its charge.
The mass number of an atom is the whole number sum of the protons and neutrons in the nucleus. For a single atom, the mass number can be calculated by the following equation:
Mass number = number of protons + number of neutrons
Electrons are not considered when calculating an atom's mass number, because their mass is so small that it is considered negligible. Note that the mass number is not the second number you see included in the periodic table.
The second number listed for each element in the periodic table is called the relative atomic mass (see Figure 5.35).
Relative atomic mass is rarely a whole number because every element consists of a mixture of atoms that have the same number of protons but different numbers of neutrons. Such atoms are called isotopes and will be discussed in the next section. The relative atomic mass shows the average mass of an element's atom when considering all natural isotope masses and their abundances.
Relative atomic mass
Figure 5.35 The atomic symbols for carbon showing the atomic number of 6 and relative atomic mass of 12.01. These numbers can be used to estimate the number of neutrons in a carbon atom.
WORKSHEET
Numbers of subatomic particles 2 DOC
mass number the sum of the protons and neutrons in the nucleus of an atom
relative atomic mass the average mass of an atom when considering all natural isotope masses and their abundances isotopes atoms of the same element, with the same number of protons but a different number of neutrons
Worked example 5.1
An oxygen atom has an atomic number of 8 (8 protons) and a mass number of 16. Calculate the number of neutrons.
Solution
Mass number = number of protons + number of neutrons 16 = 8 + number of neutrons
Number of neutrons = mass number – number of protons
Number of neutrons = 16 – 8 = 8
Try this 5.2 model making
Explanation
Substitute the known values (mass number and number of protons) into the equation.
Rearrange the equation to solve for the missing value (number of neutrons).
Using plasticine, make models to represent atoms of different elements (e.g. lithium, carbon and fluorine). Take photos of each model you make and label the:
• protons, neutrons and electrons
• nucleus and electron shells
• atomic number and mass number
Alternatively, you could use PhET’s Build an Atom interactive. Here you can practice applying your understanding of atomic structure, atomic number, mass number and forming ions by adding and removing electrons. Quick check 5.9
1. Locate the following elements on the periodic table. Using their atomic numbers and relative atomic masses (rounded to the nearest whole number), state the number of protons, neutrons and electrons in each atom.
Remembering
1. Name the three subatomic particles that make up the atom.
2. Identify which subatomic particle has the smallest mass.
3. Recall the name of the structure at the centre of atom where the protons and neutrons are located.
4. State the names of the two numbers that accompany each element on the periodic table.
5. Identify which of the numbers you named in Question 4 is always the largest.
6. Name the element that has an atomic number of 20.
Understanding
7. Illustrate a labelled diagram that shows the Bohr (or planetary) model of a beryllium atom that contains 4 protons, 5 neutrons and 4 electrons.
8. Illustrate a diagram of the electron cloud model of the atom.
9. An atom has a mass number of 45 and an atomic number of 16. Calculate how many neutrons it has. Show your working.
10. Identify the subatomic particles that have nearly the same mass.
Applying
11. Explain why the number of electrons is not included in the mass number equation.
12. Copy and complete the table, using the information in the periodic table to summarise the structure of the different elements.
13. Copy and complete the table below to summarise the ions formed by different elements.
Analysing
14. Compare the properties of protons, neutrons and electrons.
15. Compare the position of the electrons in the planetary and electron cloud models.
16. Compare the mass number and the atomic number of an element.
Evaluating
17. ‘The mass number determines the identity of the element.’ Propose whether this statement is true or false. Justify your answer.
18. Propose several reasons why models are useful in science. Explain the limitations of using models.
19. Justify why no two elements on the periodic table have the same atomic number.
20. Evaluate the statement: ‘Atoms are always neutral.’
At the end of this section, I will be able to:
1. Define the terms ‘isotope’ and ‘radioactive half-life’.
2. Define radioactive decay and describe the three types of nuclear radiation.
3. Compare the ionising and penetrating power of alpha, beta and gamma radiation.
4. Outline applications of radioactivity, such as radioactive dating and medical treatments.
Earlier in this chapter, you learned how changing the number of protons in an atom of an element changes that atom into a different element. You also saw how changing the number of electrons results in a charged atom called an ion. Now you will learn what happens when the number of neutrons in an atom is altered.
Two atoms that have the same atomic number (so are the same element) but different mass numbers are called isotopes. Since these isotopes must have the same number of protons as each other (since they are the same element), the difference in their mass numbers must come from having a different number of neutrons. (Remember: The mass of electrons is negligible.)
The presence of isotopes was first proposed by Frederick Soddy in 1913. He noticed that atoms of the same element could have different atomic masses but behave in the same way. He named these elements 'isotopes', which means 'same place', referring to their location on the periodic table. Scientists could not explain why this occurred until James Chadwick discovered the neutron.
Let's look at an example. Carbon exists naturally in three forms: carbon-12, carbon-13 and carbon-14 (see Figure 5.36). These are all the element carbon because they all have an atomic number of 6 (6 protons).
Figure 5.36 The three naturally occurring isotopes of carbon
However, they have different mass numbers (12, 13 and 14), which can be explained by them having different numbers of neutrons. Remember that the number of neutrons in an atom is calculated by subtracting the atomic number from the mass number. Therefore, carbon-12 has six neutrons, carbon-13 has seven neutrons and carbon-14 has eight neutrons. As they have different numbers of neutrons but the same atomic number, these are isotopes of carbon.
The relative atomic mass of an element shown on the periodic table is the average mass of all naturally occurring isotopes of that element. For example, the relative atomic mass of carbon is 12.01, which tells us that, in nature, carbon-12 is by far the most common carbon isotope. Indeed, 98.89% of all carbon atoms are carbon-12, with the second-most common carbon isotope being carbon-13 at 1.1%
Isotopes are named by writing the element name first and then the mass number. For example, the three isotopes of hydrogen are hydrogen-1 (H-1, also known as protium), hydrogen-2 (H-2, known as deuterium) and hydrogen-3 (H-3, known as tritium).
Another way of representing isotopes is to use nuclide notation. To do this, write the mass number at the top left of the element symbol and the atomic number at the bottom left of the element symbol (see Figure 5.37).
Figure 5.37 The three naturally occurring isotopes of hydrogen, represented using nuclide notation
The stability of an isotope depends on how likely it is to break down or decay into other elements. Heavy isotopes (i.e. those that have many more neutrons than protons) tend to be unstable, whereas lighter isotopes (i.e. those with a similar number of neutrons and protons) tend to be stable.
Unstable isotopes, such as the isotopes of the element uranium, are called radioisotopes. In these types of isotopes, radioactive decay occurs to achieve a stable nucleus (as discussed later in this section). Stable isotopes are not radioactive, or are radioactive to a much lesser extent, because their nucleus is stable and therefore not prone to radioactive decay. Elements can have more than one stable isotope, such as carbon-12 and carbon-13. Table 5.1 summarises the differences between stable and unstable isotopes.
Have a stable nucleus
Have an unstable nucleus Not radioactive Radioactive
Table 5.1 A comparison between stable and unstable isotopes
The mass number of chlorine on the periodic table is 35.45. Using this number to calculate the number of neutrons gives 18.45 neutrons. This cannot be correct because it is not a whole number. (You cannot have 0.45 of a neutron.) Conduct some research to answer the following questions.
1. Why is the mass number of chlorine recorded as 35.45 on the periodic table?
2. Chlorine has two naturally occurring stable isotopes, Cl-35 and Cl-37. What is the difference between Cl-35 and Cl-37?
3. Given the mass number of chlorine, which isotope of chlorine do you think is more abundant in nature?
Naming isotopes
1. Define ‘isotope’.
2. Determine the name of an isotope of magnesium with a mass number of 25.
3. Recall the characteristics of unstable isotopes.
nuclide notation a symbol notation in which the mass number is shown at the top left of an element symbol and the atomic number is shown at the bottom left radioisotopes the radioactive isotopes of an element
radioactive decay when an unstable nucleus emits radiation (alpha and beta particles or gamma rays) and breaks down to form another element
Did you know? 5.4
mass numbers in parentheses
Look at francium (Fr) on the bottom left of the periodic table. It has parentheses around its relative atomic mass (223.0). Elements written like this are radioactive, which means they are very unstable and that most of their isotopes decay into other elements quickly. The relative atomic mass in parentheses represents the most stable isotope of that element – the one that exists the longest. Can you find other radioactive elements on the periodic table?
Figure 5.38 Marguerite Perey, a French physicist, discovered the element francium, which is one of the rarest and most unstable elements on the periodic table. Perey was the first woman to be elected to the prestigious French Academy of Sciences.
When unstable atoms undergo the process of radioactive decay, the atom's nucleus becomes more stable, and radiation is emitted or released (see Figure 5.39).
The radiation can be in the form of energy or particles, and there are three main types:
• alpha (α)
• beta (β)
• gamma (γ).
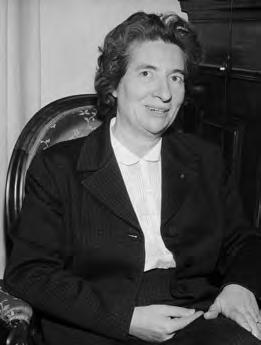
Figure 5.39 As an unstable atom decays and tries to become stable, the nuclei release energy in the form of ionizing radiation (alpha particles, beta particles and gamma rays).
An alpha particle consists of two protons and two neutrons, which is the same as the nucleus of a helium atom (without electrons). Therefore, when an atom undergoes alpha decay, its atomic number decreases by 2 and its mass number decreases by 4. When the atomic number changes, a new element is formed. In this case, the element has two fewer protons.
The equation in Figure 5.40 shows what happens when an atom of radon-222 undergoes alpha decay. Note that an alpha particle can be shown as either 4 2He or 4 2α and has a charge of 2+. As a helium nucleus is emitted, the radon-222 atom loses two protons and therefore becomes a polonium atom. The mass number also decreases by 4 from 222 to 218.
Figure 5.40 When a radon-222 atom undergoes alpha decay, it becomes a polonium-218 atom. The atom of radon has changed into an atom of polonium.
Beta particles are simply fast-moving electrons emitted from the nucleus. During beta decay, a neutron is transmuted (changed) into a proton and an electron. Consequently, the atomic number increases by one, which changes the identity of the element. The mass number of the remaining atom is not affected because it has lost a neutron but gained a proton.
The equation in Figure 5.41 shows what happens during beta decay. The iodine-131 atom gains a proton and loses a neutron to become a xenon atom, and a high-energy beta particle (electron) is emitted. Note: A beta particle can be shown as either 0 −1e or 0 −1β.
Figure 5.41 When an iodine-131 nucleus undergoes beta decay, it becomes a xenon-131 atom and emits a beta particle.
Gamma decay is different from alpha and beta decay in that the atom undergoing gamma decay is not changed; that is, the mass and atomic numbers are not altered. This is because gamma decay involves the emission of a high-energy wave (gamma ray) rather than a particle.
The equation in Figure 5.42 shows the gamma decay of radioactive cobalt-60. As the cobalt-60 nucleus is unstable, it is said to contain more nuclear energy than is required for stability and an asterisk (*) is included next to the mass number in the nuclide notation. The * indicates that the nucleus is excited or has more energy. A gamma ray is a wave of energy with no mass or charge, so the cobalt-60 atom is unchanged. However, the * is removed to denote that the nucleus is no longer excited.
Figure 5.42 When an excited cobalt-60 nucleus decays, a gamma ray is emitted.
As mentioned, a gamma ray (sometimes called a photon) is a high-energy wave and unlike the emissions from alpha and beta decay. You might be surprised to learn that this emission is a form of electromagnetic radiation with properties similar to light!
marie Curie
Marie Curie was the first woman to be awarded a Nobel Prize and is the only person to have been awarded two Nobel Prizes in different scientific fields: Physics in 1903 (with her husband, Pierre Curie, and Henri Becquerel) and Chemistry in 1911.
Marie Curie’s daughter Irène Joliot-Curie, was the second woman to win a Nobel Prize after discovering artificial radioactivity with her husband in 1934.
beta particle a negatively charged particle (electron) that is emitted from the nucleus of some radioactive elements during radioactive decay (or disintegration) of an unstable atom gamma ray a type of electromagnetic radiation; has high energy and a very short wavelength; produced when certain radioactive atoms decay
Conduct some research on the work of Marie and Pierre Curie that led to their scientific discoveries in radiation as well as the experiments that validated their discoveries.
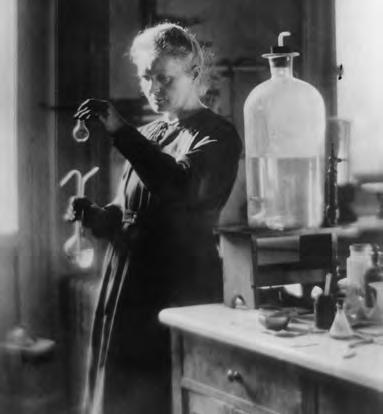
Figure 5.43 Marie Curie discovered the radioactive elements radium and polonium.
Ionising and penetrating powers
How dangerous a type of radiation is depends on its ability to penetrate materials and how much damage it can do (how ionising it is). Table 5.2 and Figure 5.44 summarise the properties of the three types of radiation.
Figure 5.44 The penetrating powers of alpha, beta and gamma radiation
Type of radiationPenetrating power
AlphaLeast penetrating. Can be stopped by a sheet of paper.
Beta Can penetrate paper but is stopped by a thin aluminium sheet.
GammaThe most penetrating. Can only be stopped by thick pieces of lead or concrete.
Table 5.2 Properties of the three types of radiation
Ionisation power
Very strongly ionising because it is a 42He2+ ion. Can cause the most damage, especially if inside the body.
Not as ionising as alpha particles but more ionising than gamma rays.
Not very ionising so causes the least damage. Can penetrate the body, and high-energy gamma rays are used to kill cancer cells.
1. Summarise the information about the types of radioactive decay in the following table.
Type of decay
Symbol
Description
Charge
Change in atomic number
Change in mass number
Penetrating ability
Ionising effect
2. Complete the following equations using your knowledge of radioactive decay.
a) 22688Ra → _____ + 42He
b) 146C → 147N + _____
c) 13153I → _____ + 0 −1e
investigating the penetration of alpha, beta and gamma radiation
You have been provided with the following materials. Suggest an experiment that could be done using this equipment to show the penetrating properties of alpha, beta and gamma radiation. You may wish to draw a diagram or write a method to demonstrate that you have done this task.
Aim
To investigate the penetrative strengths of ionising radiation
Materials
• alpha radiation source
• beta radiation source
• gamma radiation source
• Geiger–Müller tube (detects radiation)
• absorbing materials: sheet of paper, aluminium sheet, lead sheet
Method
Your teacher will demonstrate the experiment. This experiment emits dangerous radiation, so it can only be performed by a teacher and under strictly controlled conditions.
Results
Copy and complete the following table.
Table showing the penetrating power of the three forms of radiation
Radiation
Gamma
Discussion: Analysis
Material that stops most of the radiation from passing through
Penetrating power
1. Identify the most penetrating radiation and justify your choice.
2. Propose which type of radiation you think could cause the most damage if it gets into our bodies.
3. Conduct some research on the effects that radiation can have on the body to explain why it is so damaging.
Discussion: Evaluation
1. Discuss how the experiment could be modified to show the effect of different distances and thicknesses of absorbing materials.
Radioactivity is used in novel technologies, even in your own home! Ionisation chamber smoke detectors can detect very small amounts of smoke in a domestic household, even before occupants can smell smoke in the air.
An ionisation chamber in the smoke detector contains a very small amount of americium-241 (Am-241) foil. This radioactive element decays, emitting alpha and gamma radiation as shown in the following equations:
half-life the time taken for half of the atoms in a sample of radioactive material to decay
The alpha particles emitted are very strongly ionising and ionise the air in the chamber. This means the air in the chamber conducts electricity. If smoke particles enter the chamber, the electrical current is disrupted and the smoke detector sounds an alarm.
While this nuclear reaction might be happening in your own home, there is no need to worry. The radiation emitted by domestic smoke detectors is less than 40 kBq, which is considered safe under state regulation.
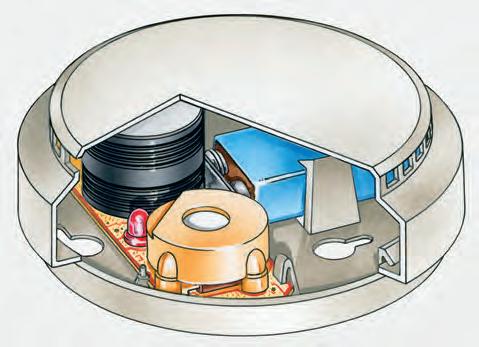

Figure 5.45 (a) A cross-section of an ionisation chamber smoke detector. It shows a battery (blue), a piezoelectric sounder (yellow) and an ionisation chamber (black). (b) An americium-241 ionisation chamber.
Some radioactive elements decay extremely quickly – over seconds, minutes or hours – while others decay steadily over thousands or millions of years. The time taken for half of the atoms in a sample of radioactive material to decay is known as its half-life. This is a useful value for comparing radioactive elements as well as predicting the age of radioactive materials.
Carbon-14 is a radioactive isotope of carbon with a half-life of approximately 5730 years (see Figure 5.46). This means that a pure sample of carbon-14 should take about 5730 years for half of its atoms to decay, in this case usually by beta decay to nitrogen-14. The abundance of carbon-14 and nitrogen-14 in a fossil can be analysed over time to identify the possible age of the fossil.
Original sample = 100% carbon-14
50% carbon-14, 50% nitrogen-14
1 half-life (5730 years) (11 460 years)
2 half-lives

25% carbon-14, 75% nitrogen-14
carbon-14
nitrogen-14
Figure 5.46 A radioactive material’s half-life is the time taken for half the atoms in a sample of that radioactive material to decay. For example, it takes 5730 years for half of a sample of carbon-14’s atoms to decay into nitrogen-14.
Try this 5.3
modelling radioactive half-lives
Place 100 five cent coins (alternatively counters with different markings on each side, or M&Ms) in a sealable plastic bag. Shake the bag, then pour the contents onto a white sheet of paper. Count and record the number of ‘undecayed’ coins (heads up) and put those coins back into the bag. The coins showing tails are ‘decayed’ and should be put to the side. Shake the bag again and then pour the contents out a second time. Again, count and record the number of ‘undecayed’ coins (heads) and put those coins back into the bag. Repeat until you either run out of coins or finish 10 trials. Graph your results.
Look at your graph and consider what this activity shows about radioactive half-lives.
Let's look an example. The remains of a First Nations ancestor, known as Mungo Man, were found in a dry lakebed in Mungo National Park, a place of deep cultural and spiritual significance to Gunditjamara people. Dating methods such as carbon-14 and thermoluminescence have been used to estimate the age of these remains, aligning with First Nations oral traditions that speak to the long-standing presence of their peoples on this continent. Scientists analysed samples from the remains to identify the amount of carbon-14 and nitrogen-14. As the half-life of carbon-14 is known, they could then use this information to calculate the amount of time that had passed since Mungo man died (see Figure 5.47).
Figure 5.47 Carbon-14, an unstable isotope, radioactively decays into nitrogen-14, a stable isotope. Therefore, as the amount of carbon-14 in a sample falls, the amount of nitrogen-14 rises. The point of intersection on the graph (5730 years) marks the half-life, the time by which exactly half of the carbon-14 has decayed.
In 2003, however, a panel of experts used a more contemporary and advanced range of optically stimulated luminescence dating methods, which revealed that the Lake Mungo remains were probably closer to 40 000 years old! Scientific dating methods have been used alongside Aboriginal and Torres Strait Islander knowledge to affirm the long history of First Nations peoples on this continent, which extends beyond 65 000 years. These methods do not replace the deep time histories held in First Nations oral traditions but provide additional ways of understanding time and environmental changes.
But what if the sample to be analysed is thought to be millions of years old? Carbon dating is only useful on samples up to around 60 000 years old. For older samples, other isotopes with longer half-lives can be used (see Table 5.3). For example, uranium-238 is a naturally occurring isotope with a very long half-life of about 4.5 billion years, making it useful for dating samples that are much older.
Original isotope (unstable)
to 60 000 years ago
000 years and older
Table 5.3 Isotopes commonly used for radioactive dating
Did you know? 5.5
Budj Bim: A living cultural landscape and UNESCO World Heritage site
Budj Bim is a sacred and living cultural landscape of Gunditjmara people, located in southwestern Victoria. For tens of thousands of years, Gunditjmara people have carefully managed this land, engineering an intricate system of stone channels, weirs and ponds to sustainably farm eels (kooyang). This sophisticated aquaculture system ensured a reliable food source, supporting permanent settlements and demonstrating deep scientific knowledge of water management, ecological balance and sustainable food production.
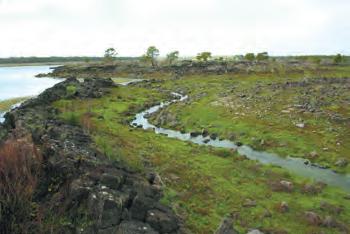
5.48 The Gunditjmara
Western scientific dating methods, including carbon dating, estimate that aquaculture practices at Budj Bim began at least 6700 years ago. However, this timeframe only scratches the surface of Gunditjmara people's enduring connection to this landscape.
Recognising its importance, Budj Bim was inscribed as a UNESCO World Heritage Site. It is the first in Australia to be listed exclusively for its First Nations cultural values.
Quick check 5.12
1. Define radioactive ‘half-life’.
2. Write a nuclear equation for the:
a) beta decay of C-14
b) alpha decay of U-238.
3. If an organism was known to exist 550–250 million years ago, state which radioactive isotope would be best to use to determine its accurate age.
4. You have 100 g of a radioactive isotope and its half-life is 10 years.
a) State how much of the isotope you will have left after:
i) 10 years
ii) 20 years.
b) Determine how many half-lives will occur in 40 years.
Affirming First nations deep time presence on Country
In 2017, excavations at a rock shelter near Kakadu National Park, on Mirarr Country, provided further scientific evidence of Aboriginal presence at Madjedbebe for at least 65 000 years. This aligns with Aboriginal knowledge that has long asserted an unbroken connection to Country. Western dating techniques, including radioactive dating, thermoluminescence and optically stimulated luminescence, were used to estimate this timeframe, reinforcing what Aboriginal communities know.
Similar techniques have also been applied at Moyjil in southwest Victoria, a site containing evidence such as charred rocks and weather-worn shells. Some researchers suggest this may indicate Aboriginal occupation dating back 120 000 years. First Nations knowledge holders, Elders, and researchers continue to lead efforts to deepen our understanding of these ancient histories.
Investigate how thermoluminescence and optically stimulated luminescence work, and how they complement other dating techniques such as carbon-14 dating in measuring time on Country.
There are 94 naturally occurring elements with around 250 stable isotopes and 3200 unstable radioisotopes. Stable isotopes and radioisotopes both have important uses.
Besides dating fossils and ancient rock art and providing evidence of human existence, perhaps the most well-known use for isotopes is in medicine to diagnose and treat illnesses. Cobalt-60 (Co-60) is used in radiotherapy to treat cancer cells; strontium-90 (Sr-90) is used in the treatment of skin cancer in pets; and gamma rays are produced when radioisotope decay is used to kill bacteria that may be present on medical equipment.
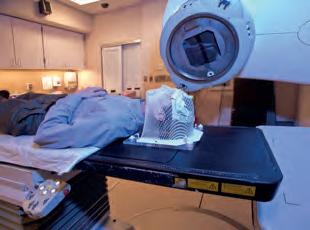
Knowing the half-life of the radioisotopes used in medicine is very important. For example, an isotope of fluorine-18, used in medical imaging, has a half-life of about 109 minutes. That means fluorine-18 must be prepared at the medical facility and used very quickly because it will all decay in a few hours!
Another interesting application of radioisotopes is in the materials industry. For example, Iridium-192 is a useful radioisotope with a half-life of about 74 days, which also gives it some longevity for application. It can be used as a diagnostic tool for finding faults in materials such as in pipelines, aircraft and spacecraft. Iridium-192 primarily decays by beta decay and gamma decay. These emissions penetrate materials to a different extent and thus the emissions can be used to image the inside of materials by detecting radioactive emissions that can pass through different materials.
Generate, sort, connect, elaborate
1. Generate a list of terms that come to mind when you think about sections 5.1 to 5.4.
2. Sort your terms according to how central or tangential they are. Place central ideas or key terms near the centre of your paper and more tangential ideas towards the outside of the page.
3. Connect your terms by drawing connecting lines between the terms that have something in common. Explain and write in a short sentence how the terms are connected.
4. Elaborate on any of the terms you have written so far by adding new terms that expand, extend or add to your initial terms.
You may like to view this as a revision tool that brings all of the concepts in this chapter together.
Generate, sort, connect, elaborate
Go
Section 5.4 review
Online quiz
Section 5.4 questions
Remembering
Section questions
Teachers can assign tasks and track results
1. Name three important uses of radioisotopes.
2. Name a radioisotope useful in treating human cancer.
Understanding
3. Describe the relationship between the mass of an isotope and its stability.
4. If an atom emits beta radiation, state what particle it gives off and how the atom is changed as a result.
Applying
5. Determine the name of an isotope of barium with a mass number of 130.
6. Determine the name of an isotope of potassium with 22 neutrons.
7. Summarise what happens to the nucleus of an element during alpha decay.
8. Complete the following equations to demonstrate your understanding of the types of radiation produced during radioactive decay.
a) → 0 −1e + 6028Ni
b) 21082Pb → _____ + 20680Hg
c) 18474W → 42He + _____
Analysing
9. Contrast stable isotopes and radioisotopes.
10. Compare these isotopes of sodium: Na-23 and Na-24.
11. a) If you have 16 g of radioactive substance, calculate how much will remain after three half-lives.
b) If you have 120 atoms of a radioactive substance, calculate how many atoms will remain after two half-lives.
12. An archaeologist finds an old bone and takes it for carbon-14 dating. She tells the scientist it is around 2000 years old. After testing, it is found that the bone is 25% through its first half-life. Do these findings support the archaeologist’s theory about the bone’s age? Explain.
Evaluating
13. Construct an equation to show the alpha decay of uranium-235 to thorium-231.
14. An element undergoes radioactive decay, but its atomic number and mass number are not affected. Deduce the type of decay.
15. During the radioactive decay of an isotope, a high-energy electron is released. Deduce the type of decay.
Chapter checklist
Success criteria
Linked questions
5.1 I can define the terms ‘atoms’, ‘elements’, ‘compounds’ and ‘molecules’. 1, 4, 14
5.2I can outline different contributions scientists and philosophers have made to the development of the modern model of the atom. 7, 9, 11, 21
5.3I can compare the relative mass and charge of protons, neutrons and electrons. 2, 15
5.3I can define the terms ‘ion’, ‘atomic number’ and ‘mass number’.8, 10
5.3I can determine the number of protons and electrons in the atom of an element. 5, 13
5.3I can calculate the mass of an atom from the number of protons and neutrons. 5
5.4I can define the terms ‘isotope’ and ‘radioactive half-life’. 3, 12
5.4I can define radioactive decay and describe the three types of nuclear radiation. 6, 17, 20
5.4I can compare the ionising and penetrating power of alpha, beta and gamma radiation. 18, 19
5.4I can outline applications of radioactivity, for example, radioactive dating and medical treatments. 16
1. State the names of the three subatomic particles within the atom.
2. Recall the relative charge of each subatomic particle:
a) Proton
b) Neutron
c) Electron
3. Define ‘radioactive half-life’.
4. State where the protons and neutrons are located within the atom.
5. a) If a neutral atom has 18 protons, state how many electrons it has. b) If the atom also has 22 neutrons, state the mass number.
6. Recall the type of particle that is released during beta decay.
Understanding
7. Describe the planetary model of the atom.
8. Outline how atomic number and mass number are different.
9. Explain how Rutherford’s gold foil experiment led to the discovery of the nucleus.
10. Apply your knowledge of the overall charge of an atom to explain what would happen to an oxygen atom if it had an extra electron (nine electrons).
11. Explain why the neutron was difficult to discover.
12. Describe the differences between isotopes of the same element.
13. Copy and complete the table below to summarise the three main isotopes of neon.
IsotopeMass
2010Ne
2110Ne
2210Ne
Analysing
14. Contrast an element and a compound.
15. Compare the properties of the subatomic particles in terms of their mass.
16. Cobalt therapy is a medical treatment that uses the decay of cobalt-60 to treat diseases such as cancer. Cobalt-60 is a radioisotope that decays into the stable isotope nickel. The gamma rays produced by cobalt-60 decay are directed to a specific part of a patient’s body to kill tumour tissue.
The decay of cobalt-60 is shown in the following half-life graph.
Explain why the cobalt-60 in a machine that directs gamma rays into a patient’s body must be regularly replaced.
Evaluating
17. Deduce the relationship between the mass of an element and how stable it is.
18. Ionising radiation is used in smoke detectors. Decide which type of radiation you would choose for this use and why.
19. Propose why radioactive sources in schools must be stored in lead-lined boxes.
20. Write a nuclear equation for the beta decay of iridium-192.
21. Discuss whether you expect the atomic model to change significantly in the future.
Justify your answer.
The isotope carbon-14 decays by beta radiation to form nitrogen-14 atoms, following the decay curve in Figure 5.50. Scientists can predict the age of a fossil by analytical techniques that measure the relative abundances decay curves of carbon-14 and nitrogen-14 in the fossil.
Figure 5.50 The relative abundance of carbon-14 (blue line) and nitrogen-14 (orange line) in an initial sample of carbon-14 over 31 515 years
Applying
1. A scientist has measured the relative abundance of carbon-14 in a sample of Aboriginal Australian rock art at 25% compared to nitrogen-14. Determine the age of the rock art.
2. The relative abundance of nitrogen-14 in a kangaroo fossil sample is 40%. Calculate the relative abundance of carbon-14.
3. Identify the relative abundance of nitrogen-14 in a fossil dated at 8595 years old.
Analysing
4. Contrast the two curves and comment on the relative rate of decay of carbon-14 and growth of nitrogen-14.
Evaluating
5. Deduce the half-life (time taken for half of the carbon-14 to decay to nitrogen-14) of carbon-14.
6. After 28 650 years, the relative abundance of carbon-14 is 3.125%. Predict the relative abundance of nitrogen-14 after another 5730 years (34 380 years total).
7. Predict and explain whether it would be possible to find a fossil with a relative abundance of carbon-14 of 0%.
8. The use of radiocarbon dating is most efficient with fossils less than 20 000 years old. Compare the carbon-14 decay curve before and after 20 000 years and elaborate on this comment.
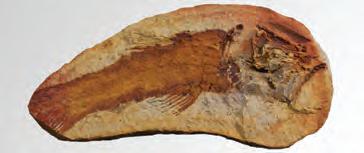
Plastic is one of the most commonly used substances today. It is used for everything from food packaging to toys, from building materials to clothing, and even medical implants. Plastic was invented in 1907 and has revolutionised the manufacturing of a multitude of different products because of its versatility. Plastic can be hard, soft, stretchy, bendable, strong or durable.
Molecules are atoms that are bonded together. Chemically, plastic consists of long chains of molecules called polymers. This is why the names of many plastics start with ‘poly’.
The polymers are made up of carbon and hydrogen, and sometimes oxygen, nitrogen, sulfur, phosphorus, fluorine or silicon.
a long chain of carbon atoms and
There are two main problems with the amount of plastic that is used. First, most plastic is made from crude oil, a limited resource that is harmful to the environment to extract. Second, because of its molecular structure, plastic is very difficult to biodegrade (break down). Plastic litter builds up in waterways and kills wildlife, as well as leaching harmful toxins into the environment.
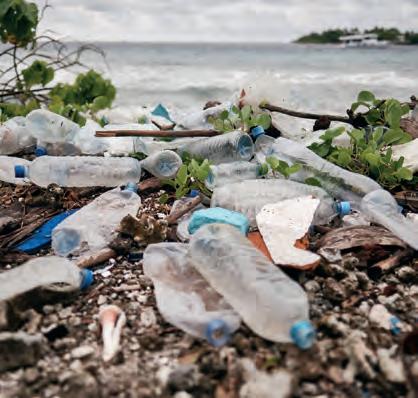

Bioplastics are a type of plastic made from renewable resources, such as plants. They can easily be made at home with readily available ingredients. Although they cannot solve the plastic problem alone, they can reduce carbon dioxide emissions, and some have the potential to biodegrade more easily than traditional plastics.
Design and create a product using bioplastics.
In groups of two or three, your task is to think of a product that is made of plastic and find a way of making it out of bioplastic.
Suggested materials
• corn starch
• vinegar
• glycerine
• water
• food dye (optional)
• saucepan
• wooden spoon
• hotplate
Wear safety glasses.
Be very careful when working around the hotplate and handling the hot mixture. Ensure the hotplate is cool before moving it.
• non-stick/baking paper/aluminium foil and tray
• cookie cutters or moulds to shape the plastic
• safety glasses
1. In your group, discuss different plastic products you use in your everyday life, and list all the benefits to manufacturing these products as a bioplastic.
2. List all the restrictions you must consider in your design based on the materials and space you have available.
3. Conduct some research on how you would use the suggested materials, or other materials safe for use in a school science laboratory, to manufacture the bioplastic.
4. Decide on a plastic product that you could make using a bioplastic. Justify your choice as a group by considering your constraints.
5. Design the method for manufacturing the bioplastic.
6. Design the mould you will use for making your product.
7. Create the mould you will use for your bioplastic product.
8. Follow your design method and construct your bioplastic product solution. Remember it may take a week for your bioplastic to set.
9. Describe any difficulties you encountered when creating your product out of bioplastic.
10. Suggest ways that the design of your product could be improved.
11. List the physical properties of your bioplastic and comment on how appropriate these properties were for your product.
12. Test your product by using it for its intended purpose under different conditions.
13. Evaluate the effectiveness of your product.
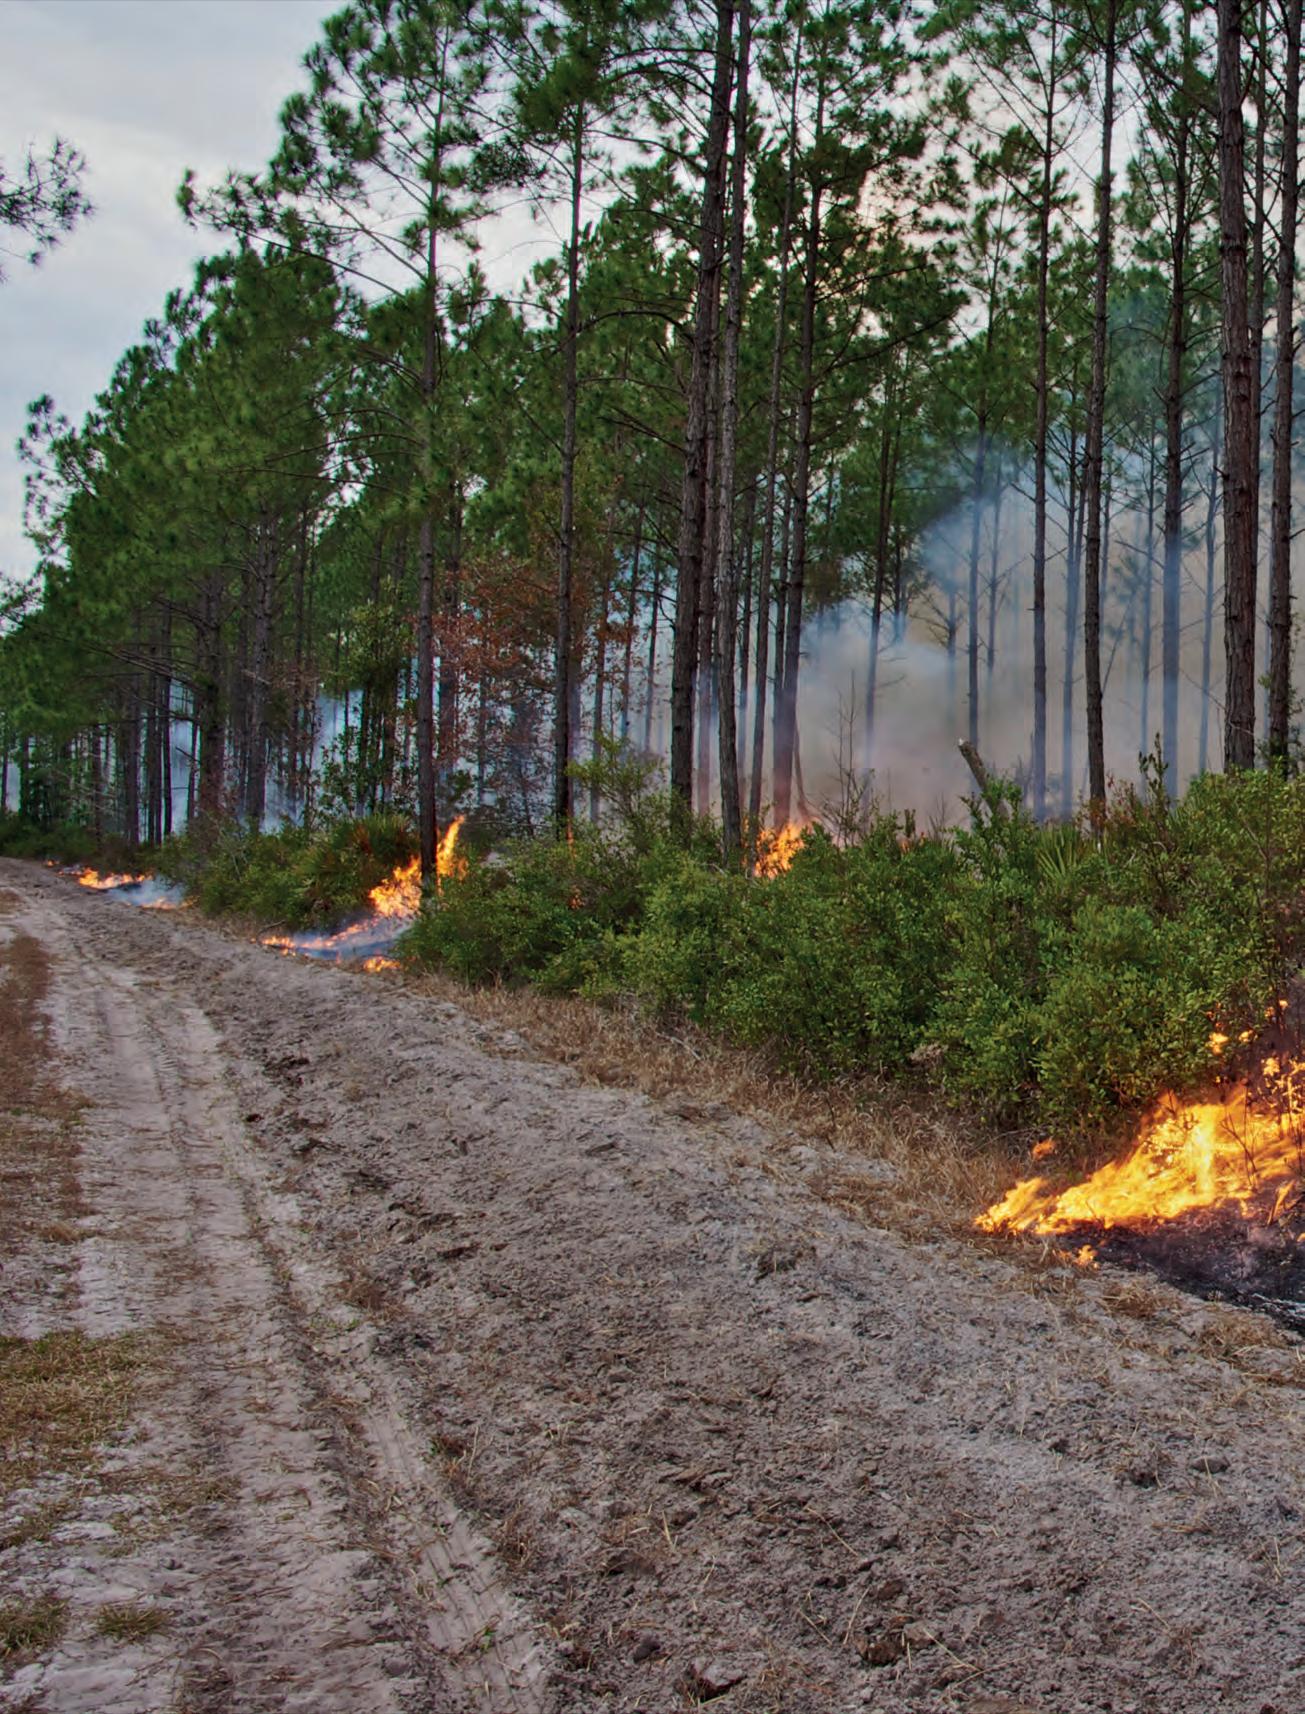
Chemical reactions occur when the atoms in reactants are rearranged, resulting in the formation of new products. The Law of Conservation of Mass states that mass cannot be created nor destroyed during a chemical reaction. In this chapter, you will learn about how this law is crucial for manufacturers because it allows them to predict and plan useful chemical syntheses. By considering green chemistry principles in chemical manufacturing, companies can benefit by meeting consumer and regulatory demands, reducing costs and being more environmentally sustainable.
Light Sound Colour
Temperature
Physical properties
Indicated by changes in
Written as
Chemical reactions
Chemical equations
Reactants → products
Principles of green chemistry
Used in
Made more sustainable through Includes
Industrial synthesis
Must obey the Law of Conservation of Mass
Extracting
Section
Section 6.2
Section
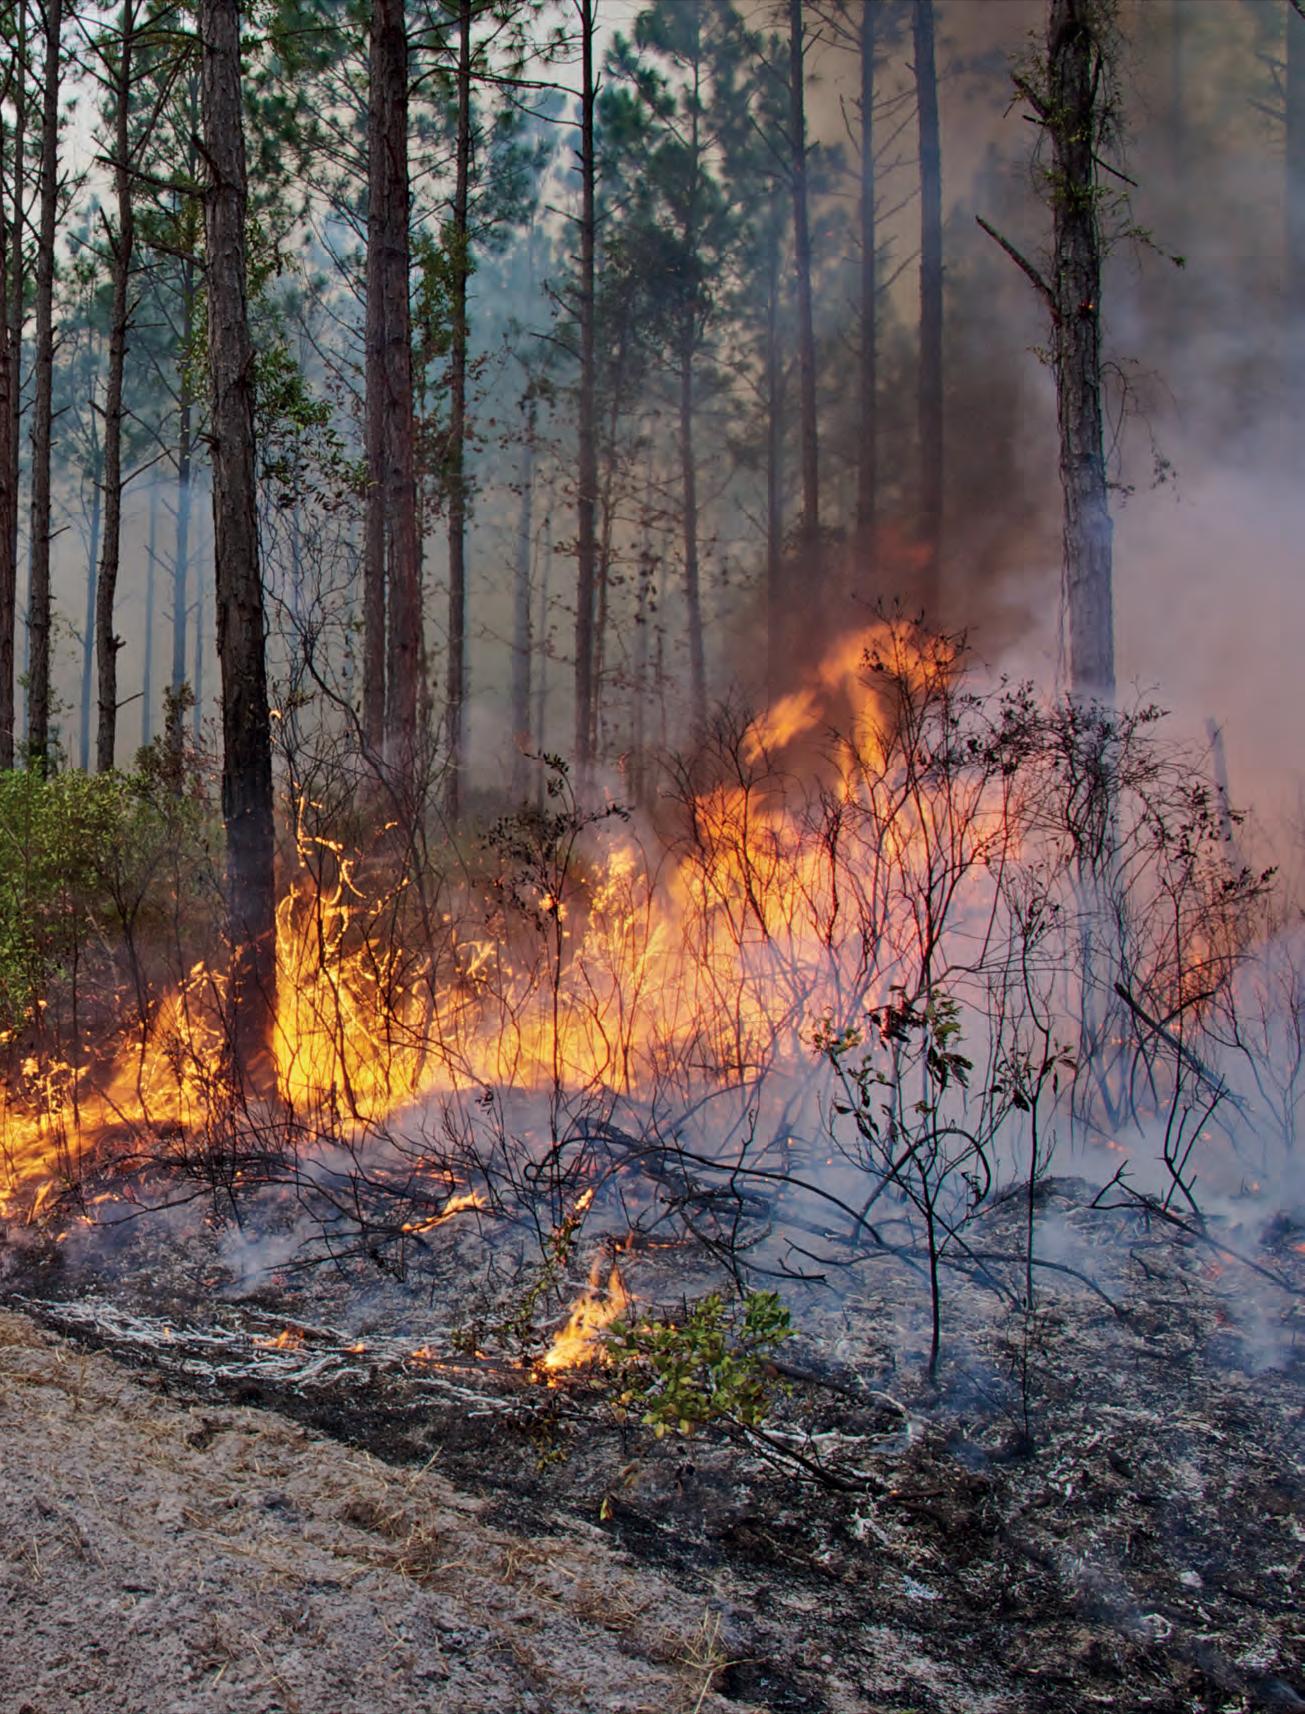
Curriculum content
chemical reactions are described by the Law of Conservation of Mass and involve the rearrangement of atoms; they can be modelled using a range of representations, including word and simple balanced chemical equations (VC2S10U08)
• identifying reactants and products in chemical reactions
• using models and representations to show the rearrangement of atoms in chemical reactions and to illustrate the Law of Conservation of Mass
• investigating chemical reactions in closed and open systems and relating data obtained to the Law of Conservation of Mass
• writing symbol equations that are easy to balance and explaining the rationale for balancing chemical equations with reference to the Law of Conservation of Mass
• investigating why most elements are not found in their elemental state
• explaining how implementing ideas related to green chemistry principles, such as minimising the amount of unusable waste products, energy use and using more environmentally friendly chemical processes, will affect the environment
scientific knowledge may be interpreted in different ways by individuals and groups in society; the values and needs of society can influence the focus of scientific research (VC2S10H04)
• examining why many manufacturers are adopting green chemistry processes
Curriculum v2.0 F–10 © VCAA 2024
Glossary terms
Balanced Catalyst
Chemical change
Chemical reaction Closed system Coefficient Electrolysis
Law of Conservation of Mass
Symbol equation Word equation
At the end of this section, I will be able to:
1. Recall the evidence of chemical change.
2. Define the term ‘chemical reaction’.
3. Identify reactants and products in a chemical equation.
4. Write a word equation.
Many areas of modern life require chemical reactions. The components of a lunchtime sandwich, the ink in a pen and the screen of a smartphone have all been carefully produced using chemical reactions. But what are chemical reactions? Do they have anything to do with chemical change?

Chalk talk: Chemical reactions
Your teacher has placed several pieces of butcher’s paper, each with a different prompt on it, around the room. You will walk around the room and respond to the different prompts by recording:
• What ideas come to mind when you think about this prompt? Can you explain what the prompt is saying? Can you provide examples?
• What connections can you make to the responses of others? Can you elaborate on the ideas of others?
• What questions arise as you think about the prompts and comments of others?
The Chalk
was developed by Project Zero, a research centre at the Harvard Graduate School of Education.
In Year 8 you learned about physical change and chemical change
Recall that a chemical change occurs when chemical substances react to form new chemical substances with different chemical compositions. In contrast, a physical change involves a change in size, shape or state of matter without any alteration in the chemical composition. While both types of changes can be reversible, some chemical changes require a significant amount of energy to reverse, making them 'irreversible' in practical terms. In contrast, physical changes, such as the boiling and freezing of water, are typically easily reversible.
chemical change a rearrangement of atoms that is often irreversible
chemical reaction
a process or chemical change that transforms one set of substances (the reactants) into another set of substances (the products)
rearrange move things into a different order
Table 6.1 lists some observable evidence or indicators of a chemical change.
Example
Sound producedHydrogen and oxygen reacting together to make water creates a loud bang. Change in colourA grey-coloured iron nail reacting with oxygen and water forms red rust (iron oxide).
Change in physical properties
Sodium (a soft metal) reacting with water (a colourless liquid) produces sodium hydroxide (a colourless solution) and hydrogen gas, which is observed as rapid bubbling, also referred to as effervescence.
Light producedThe production of fire is a chemical reaction called combustion, which involves the rapid oxidation of a fuel in the presence of heat and oxygen, which produces heat, light and by-products such as smoke and ash. Light is produced as a result of the excited atoms emitting photons as they return to their ground state.
Change in temperature Magnesium metal reacting with an acid releases heat, which can be measured with a thermometer.
Table 6.1 Indicators of a chemical change
Quick check 6.1
1. Recall examples of a chemical change.
2. ‘All chemical changes are irreversible.’ Propose whether this statement is true or false and explain your answer.
3. Classify each of the following as a physical or chemical change.
a) Vegetable scraps breaking down in the compost bin
b) Separating sand from gravel
c) Cutting fingernails
d) Drilling a screw into wood
e) Trees growing new leaves in spring
f) A stock cube dissolving in hot water
g) Fruit on the ground going mouldy
h) Breakfast cereal going soggy

When we see evidence that a chemical change has occurred, we can say that a chemical reaction has taken place. During chemical reactions, the atoms in the starting substances are rearranged to make new substances. For this to happen, chemical bonds holding the atoms together in the starting substances must be broken and new bonds must form in different arrangements to make the new substances.
Figure 6.2 shows a chemical reaction in which a made-up compound named AB is reacting with element C to make a new compound, BC, and element A. In this reaction, the bond between A and B in compound AB is broken and a new bond is formed between B and C to form compound BC – the atoms have been rearranged. The new substances are different from the starting substances; therefore, a chemical reaction has taken place.
Figure 6.2 Rearranging atoms in a chemical reaction
Notice the arrow in the chemical reaction in Figure 6.2. It separates the starting substances that react together from the new substances formed by the reaction. The arrow indicates that a reaction is occurring; when reading the equation aloud, read the arrow as 'yields'. For example, 'AB plus C yields A plus BC'. Equals signs are not used for chemical reactions as it implies the reaction can go forwards and backwards.
Let's look at a real-life example. Figure 6.3 shows the chemical reaction between carbon and oxygen. In this chemical reaction, the bond between the two oxygen atoms is broken, the atoms are rearranged, and new bonds are formed between each oxygen atom and the carbon atom. The new substance formed is called carbon dioxide.
Figure 6.3 The formation of carbon dioxide is a chemical reaction. The atoms in the starting substances are rearranged to make new substances.
The rearrangement of the atoms can affect the properties of the substances in chemical reactions. Carbon is a solid at room temperature and oxygen is a gas. The compound formed in this reaction, carbon dioxide, is a gas at room temperature. The arrangement of the atoms within a compound determines the properties of a substance, which is why the properties of the compound formed in Figure 6.3 are so different from the starting substances.
Quick check 6.2
1. Explain how new substances are formed during a chemical reaction.
2. Describe what is happening to the substances in the following equation.
A chemical equation is a way of representing what happens in a chemical reaction. It shows the substances that are reacted together and the substances that are made from the rearrangement of the atoms.
In a chemical reaction, the substances doing the reacting are called reactants. Reactants are always written on the left-hand side of a chemical equation (before the arrow). The new substances that are formed are called products. Products are always written on the right-hand side of an equation (after the arrow). Figure 6.4 shows a word equation for the reaction between magnesium and hydrochloric acid. A word equation shows the reactants and the products written in words with an arrow between them to represent the chemical change.
Figure 6.4 A word equation for the chemical reaction between magnesium and hydrochloric acid
reactant a substance that is reacting in a chemical reaction
product a substance that is formed in a chemical reaction
word equation a chemical reaction written using the names of the reactants and products involved
catalyst a chemical that speeds up a chemical reaction; it is not a reactant and is not used up during the reaction reaction conditions the conditions required for a chemical reaction to proceed
Not all chemical reactions happen spontaneously (i.e. without us having to do anything). Some reactions require heat or light energy to get started, some require high pressures and some need a chemical called a catalyst to speed up the reaction. Sometimes a catalyst is also needed when the reaction is spontaneous but occurs too slowly to yield the desired products, such as in industry.
These factors are examples of reaction conditions. When special reaction conditions are required, they are written above (and sometimes below) the arrow in a chemical equation. This shows that these conditions are required for the reaction, but that they are not directly involved in the reaction. For example, fertilisers are made from ammonia, a source of nitrogen. The ammonia in fertilisers is produced by the Haber process, where the reaction involves the use of a catalyst, high temperatures and high pressure. Figure 6.5 shows how these reaction conditions are included in the chemical reaction.
Figure 6.5 A word equation for the reaction that produces the ammonia in fertiliser, showing the reaction conditions required
1. State on which side of a chemical equation the products are written.
2. State on which side of a chemical equation the reactants are written.
3. Identify where the reaction conditions should be written in a chemical equation.
4. Identify what the arrow indicates in a chemical reaction.
Did you know? 6.1
You might have seen movies where fire and explosions occur. This is the work of very experienced scientists called pyrotechnicians. Pyrotechnics is the science of using chemical reactions for the production of heat, light and sound. On a movie set, the effects have to be carefully controlled and easily extinguished! A commonly used effect in movies is the production of flame using a ‘flame projector’. A combustible gas like propane (reactant) is ignited with an electric match and may be mixed with small amounts of other fuels that add soot (product) and colour. The colour of the flame is determined by the use of different metals from the periodic table.

experts.
Chemical equations can be presented in different ways.
1. Word equations show the names of the reactants and products. (We saw an example in Figure 6.4.)
2. Symbol equations show the chemical formulas of the reactants and products.
3. Particle representations use circles to represent the atoms, ions or molecules in a substance, such as their relative concentrations and how they react. (We saw an example in Figure 6.3.)
4. Chemical structures (as shown for caffeine in Figure 6.7) give shape and chemical bonding structure information; however, you will not use this type of presentation in Year 9. WORKSHEET Chemical reactions
Figure 6.7 A caffeine molecule can be presented using a structural formula to provide more information about chemical bonding.
Regardless of the type of chemical equation used, there is always an arrow separating the reactants on the left and the products on the right. The different types of equations only differ in the way the reactants and products are represented.
symbol equation a chemical reaction written using the symbols and formulas of the reactants and products involved
Figure 6.8 Chemical reactions can be represented using word equations (top) and symbol equations (bottom).
Practice writing some word equations for each of the following scenarios:
1. Copper and silver nitrate react to make copper nitrate and silver.
2. Calcium carbonate powder reacts with a solution of dilute hydrochloric acid to produce a solution of calcium chloride, liquid water and carbon dioxide gas.
3. When the methane reacts with oxygen in a Bunsen burner, the products are usually carbon dioxide and water.
4. Aluminium sulphate solution and calcium hydroxide solution produce a precipitate of aluminium hydroxide and solid calcium sulphate.
5. Water vapour reacts with sodium metal to produce solid sodium hydroxide and hydrogen gas.
6. Plants take in carbon dioxide and water, and in the presence of the sunlight make glucose sugar and oxygen.
7. Hydrogen peroxide naturally decomposes to produce water and oxygen gas, but the reaction is very slow. Adding the catalyst manganese (IV) oxide makes it occur very quickly.

Go online to access the interactive section review and more!
Section 6.1 review
Online quiz
Section 6.1 questions
Remembering
Section questions DOC
1. State what ‘→’ means in a chemical reaction.
2. Identify the reactants in the following reactions.
Teachers can assign tasks and track results
a) sodium hydroxide + iron carbonate → iron hydroxide + sodium carbonate
b) propane + oxygen → carbon dioxide + water
c) hydrogen + oxygen → water
d) calcium carbonate → calcium oxide + carbon dioxide
3. Identify the products of each of the reactions in Question 2.
Understanding
4. Select the correct definition from the table for each keyword.
Keyword
Reactants
Products
Definition
The substances formed in a chemical reaction
The type of environment that the reaction needs for it to happen, e.g. temperature or pressure
Reaction conditionsThe substances that are reacting in a chemical reaction
5. Describe what happens to the atoms in the reactants during a chemical reaction.
Applying
6. Nitrogen and oxygen gas exist in the atmosphere, but they do not react together. However, at the high temperatures and pressures in car engines, they will react with each other. Identify the reaction conditions needed to cause nitrogen and oxygen to react with each other.
7. Determine the word equations for the following scenarios:
a) Magnesium and chlorine react to make magnesium chloride.
b) When iron and oxygen react, they change to a new substance: iron oxide (rust).
c) The platinum catalyst in a car catalytic converter changes carbon monoxide and oxygen to carbon dioxide.
Analysing
8. Compare physical changes and chemical changes.
9. Categorise the following examples as physical changes or chemical changes.
a) Sugar dissolving in a cup of tea
b) Iron nail rusting
c) Ice melting to form water
d) Frying an egg
e) Toasting bread
Evaluating
10. The following equation shows what happens during respiration, during which glucose and oxygen (reactants) react to make carbon dioxide and water (products). Deduce the three mistakes that have been made and rewrite the equation correctly. carbon dioxide and water = glucose + oxygen
At the end of this section, I will be able to:
1. Define the ‘Law of Conservation of Mass’.
2. Explain the outcome of experiments based on the Law of Conservation of Mass.
3. Identify a balanced chemical equation for a chemical reaction.
In the late 1700s, scientists thought that for something to burn, it had to contain the element phlogiston (later known as oxygen). Antoine Lavoisier, a French scientist, was burning red precipitate (mercury oxide) in a closed environment, meaning that no substances could escape, and noticed that the mass of the substances at the end was the same as the mass of the substances at the start. In 1789, he called this Lavoisier's law – it was later renamed the Law of Conservation of Mass This is one of the fundamental laws of chemistry.
the law of Conservation of mass
The Law of Conservation of Mass states that matter can neither be created nor destroyed – but what does this mean? Imagine you have two clear solutions. Solution A contains 50 g of sodium chloride dissolved in water and solution B contains 50 g of silver nitrate dissolved in water. You can see that the mass of the solutions or reactants, before being mixed, is equal to 100 g. When the two solutions are mixed and a chemical reaction occurs, according to the Law of Conservation of Mass, the mass of the products should equal the mass of the reactants, as matter cannot be created nor destroyed. And indeed, this is the case. When you mix these two solutions together in a beaker, a white solid called silver chloride forms as a precipitate and the contents of the beaker still weighs 100 g (see Figure 6.10).
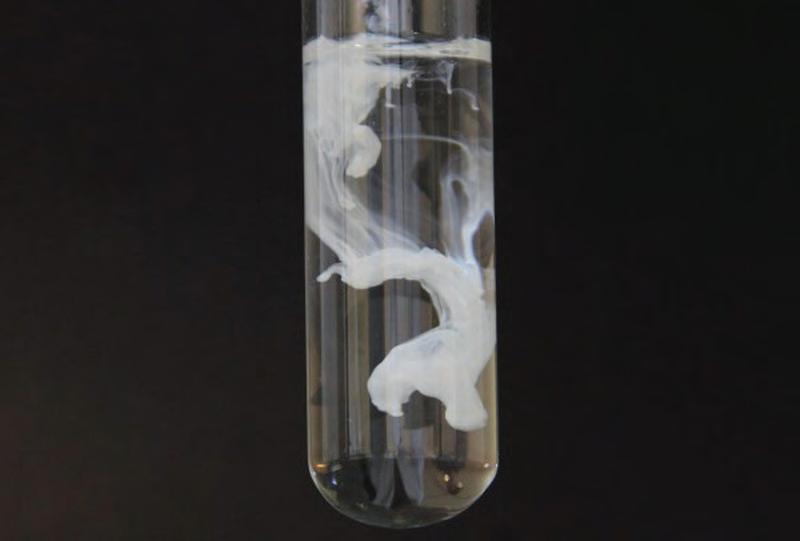
Let's consider another example. If you take the mass of all the ingredients used to make pikelets (flour, eggs and milk), when the pikelets have been cooked, the mass of all the pikelets made from the batter should equal the mass of the starting ingredients or reactants. This would follow the Law of Conservation of Mass. However, as cooking on the stove top is not a closed or sealed environment, there might actually be a difference between the two masses, as water can evaporate from the batter during cooking. This means matter appears to be lost as the products have less mass than the reactants.
closed system
an environment from which matter cannot escape open system an environment from which matter can escape
This example demonstrates why it is important to observe the conservation of mass in a closed system (one from which nothing can escape). In an open system, reactions that produce gases will appear to lose mass as that gas moves into the air. Conversely, reactions that take gas from the environment as a reactant will appear to gain mass in an open system.

Figure 6.11
If a chemical reaction, like cooking pikelets, occurs in an open system, it may appear that mass has been lost.
Try this 6.2
investigating the law of Conservation of mass
Complete these activities and consider if the Law of Conservation of Mass has been demonstrated or not. If not, think about why that may be the case. Revisit the terms ‘open system’ and ‘closed system’.
1. Grab a bag of unpopped microwave popcorn and record the mass. Cook the popcorn in the microwave as per the instructions on the bag. Once the popcorn has finished popping, weigh the bag again and record the mass. Follow the instructions for opening the bag, then weight the bag again and record the mass.
2. Place an unused glowstick on some scales and record the mass. Crack the glowstick so that it starts to glow and place it straight back onto the scales. Weight the glowstick and record the mass.
Be careful
Wear appropriate personal protective equipment.
Popcorn bag will be hot after heating. Handle with care. The steel wool activity generates smoke. Take appropriate precautions.
3. Pull some steel wool apart into thin strips and then bundle it into a loose ball. Place the steel wool in a glass petri dish or aluminium patty pan and weigh it. Record the mass. Touch a 9-volt battery to the steel wool and watch as it catches alight. Repeat several times until much of the wool has burned. After the steel wool has gone out, allow the Petri dish to cool for two minutes. Then weigh the Petri dish and steel wool a second time, and record the mass.
1. Identify who discovered the Law of Conservation of Mass.
2. State the definition of the Law of Conservation of Mass.
3. Determine the mass of the products if the mass of reactants is 30 g.
4. Discuss why it is difficult to observe the Law of Conservation of Mass in an open system.
5. Explain why the mass of a glass of water left out on a hot day decreases.
how does the law of Conservation of mass relate to chemical equations?
As a scientist, you need to factor in the Law of Conservation of Mass when you write chemical equations. Consider the reaction in Figure 6.12. Here, copper chloride (CuCl2) is being broken down into its elements: copper (Cu) and chlorine (Cl2).
For this reaction to obey the Law of Conservation of Mass, there must be the same number of atoms of each element in the reactant and the products.
Let's check:
reactants → products
1 copper atom
1 copper atom
2 chlorine atoms 2 chlorine atoms
So, there is the same number of atoms on each side of the equation and therefore the same mass. We say this equation is balanced as it follows the Law of Conservation of Mass. The only difference is how the atoms are arranged.
Figure 6.13 shows a word equation, particle representation and symbol equation for the reaction between magnesium (Mg) and oxygen (O2) to form magnesium oxide (MgO).
6.12 A word equation, particle representation and symbol equation showing the decomposition of copper chloride into its elements balanced when a chemical equation has an equal number of atoms of each element on both the reactant and product side of the equation
6.13 The combustion reaction between magnesium and oxygen forms magnesium oxide.
What do you notice about the number of each type of atom in the reactants compared to the product?
reactants → products
1 magnesium atom 1 magnesium atom
2 oxygen atoms 1 oxygen atom
The number of each type of atom in the reactants and the product is different. This means that this equation is not obeying the Law of Conservation of Mass and is not balanced.
How can we make the equation balanced? We cannot change the molecules that are formed or the substances reacting by changing their formula, but we can change how much of them there is. As we need another oxygen on the product side, let us make it 2 MgO, as shown in Figure 6.14.
Let's check again:
1 magnesium atom
2 oxygen atoms
2 magnesium atoms
2 oxygen atoms
The equation is still not balanced. What if we add one more magnesium atom to the left-hand side (reactants), as shown in Figure 6.15. Does that make the equation balanced?
reactants → products
2 magnesium atoms
2 oxygen atoms
2 magnesium atoms
2 oxygen atoms
Notice the numbers (in green) that have been added to the symbol equation to balance it (see Figure 6.15). They are called coefficients. The coefficients do not change the chemical substance, as they do not interfere with the formula by changing the subscript numbers. They just change the amount of the substance, in the same way that we might say 1 cup of flour or 2 cups of flour. It is still flour, but the amount has changed.
To show that a chemical reaction obeys the Law of Conservation of Mass, a balanced chemical equation is used. This provides more information than a word equation because the number of reactant and product atoms is shown. For now, you just need to concentrate on identifying whether equations observe the Law of Conservation of Mass and are balanced. In Year 10, you will learn the intricacies of how to balance chemical equations so that they follow this law.
Using Lego, practice balancing equations. Begin by drawing an arrow in the centre of a piece of paper. For each of the reactions below (a–c), make the reactants and the products. Make sure each element is a different colour (e.g. red for C, blue for O).
a) Reactants: CO and O2; Products: CO2
b) Reactants: Na and Cl2; Products: NaCl
c) Reactants: Na and H2O; Products: NaOH and H2
Position your reactants and products on the paper, either to the left or right of the arrow as necessary, and add ‘+’ symbols. Determine how many of each type of atom is on the left (in the reactants) and on the right (in the products). Does the equation demonstrate the Law of Conservation of Mass? If not, can you balance it?
One of PhET’s interactive digital simulations looks at reactants, products and leftovers. You may like to have a play around with the sandwiches, molecules and game mode to reinforce your understanding of the Law of Conservation of Mass and balancing chemical equations.

1. Explain why it is necessary to balance equations.
2. Two students were doing an experiment in the laboratory. They measured the mass of reactants as 50 g. After the reaction had completed, the mass of the products was 34 g. They noticed that a gas was given off during the reaction, so they wanted to find out the mass of this gas. Explain to the students how they could calculate this.
3. In each of the following examples, identify the coefficient (which can change) and the subscript (which cannot be changed without affecting the chemical substance).
a) 3H2
b) 2H2O
c) 2NH3
4. Identify which of the following symbol equations are balanced and therefore demonstrate the Law of Conservation of Mass. If the equation is not balanced, you could try to balance it.
a) Na + Cl2 → NaCl
b) 2CuO + C → Cu + CO2
c) N2 + 3H2 → 2NH3
d) 2H2O2 → 2H2O + O2
observing the law of Conservation of mass (1)
Aim
To observe the Law of Conservation of Mass by reacting magnesium and oxygen
Hypothesis
Be careful Do not stare directly at combusting magnesium.
Read through the materials and method and then write a hypothesis for this practical.
Materials
• 15 cm strip of magnesium ribbon
• tongs
• crucible
• matches
• Bunsen burner
• clay triangle
Method
1. Copy the results table into your science book.
• tripod
• heatproof mat
• safety glasses
• electronic balance
• fine sandpaper
2. Set up a Bunsen burner on a heatproof mat. Place the clay triangle on top of the tripod.
3. Weigh the crucible with its lid.
4. Examine the piece of magnesium. If it is not shiny and clean, gently use the sandpaper to remove any imperfections from the surface.
5. Loosely coil the magnesium ribbon and place it in the crucible. Weigh the crucible again with the lid on.
6. Calculate the mass of magnesium by subtracting the mass of the empty crucible.
7. Heat the crucible over the Bunsen burner on the blue flame, carefully lifting the lid using the tongs to allow sufficient air into the crucible.
8. Continue heating until the magnesium has fully reacted.
9. When the crucible has cooled sufficiently, weigh it and its contents again. Calculate the mass of the new compound by subtracting the mass of the empty crucible.
Results
Copy and complete the following table.
Table showing the mass of different components in the experiment, before and after heating
Item
Crucible + lid
Crucible + lid + magnesium before heating
Magnesium
Crucible + lid + compound after heating
Compound
Discussion: Analysis
Mass (g)
1. Describe your observations when the magnesium reacted in the crucible. List the evidence/indicators that a chemical change had occurred.
2. The formula for oxygen is O2. Write a balanced chemical equation for this reaction, using Figure 6.15 to help you.
3. State if your results demonstrate the Law of Conservation of Mass.
4. Explain why this reaction is a difficult example for showing the Law of Conservation of Mass.
5. Propose how you could have made it easier to demonstrate the Law of Conservation of Mass.
Discussion: Evaluation
1. Identify any potential sources of error in this experiment and how they have potentially affected the results.
2. Suggest any changes that could be made to the method to improve the quality of the data in future experiments. Justify your suggestions by explaining how each change will improve the data quality.
Conclusion
1. Propose a valid conclusion that can be drawn from these results.
2. Justify this conclusion using data from your results.
3. State whether or not your hypothesis is supported.
observing the law of Conservation of mass (2)
Aim
To observe the Law of Conservation of Mass by observing a chemical reaction
Hypothesis
Read through the materials and method, and write a hypothesis.
Materials
• 20 mL measuring cylinder × 2
• 20 mL 0.1 mol L−1 copper(II) sulfate (CuSO4)
• 20 mL of 0.1 mol L−1 sodium hydroxide (NaOH)
• 100 mL beakers × 2
• electronic balance
Method
1. Measure out 20 mL of 0.1 mol L−1 copper(II) sulfate, in a 100 mL beaker.
2. Measure out 20 mL of 0.1 mol L−1 sodium hydroxide into another 100 mL beaker.
3. Turn on a top loading electronic balance and zero it.
4. Place both beakers on the electronic balance together as shown in the figure, and record the mass in the results table.
5. Carefully pour the contents of one of the beakers into the other, taking care not to spill anything on the balance.
6. Replace the empty beaker back on the balance and weigh the mass of both beakers again.
7. Record the mass of the beakers in the table below.
Results
Copy and complete the following table.
Table showing the mass of the beakers before and after mixing Mass (g)
Beakers before mixing
Beakers after mixing
Discussion: Analysis
1. State the Law of Conservation of Mass.
2. A chemical reaction has taken place. The products of this reaction are copper(II) hydroxide, Cu(OH)2, and sodium sulfate, Na2SO4. Write a word equation for this reaction.
3. List the evidence that a chemical reaction has taken place.
4. This experiment was carried out in an open system. Define this term.
5. Is there evidence to suggest that mass is conserved in this chemical reaction? Explain.
Section 6.2 questions
Remembering
1. State the Law of Conservation of Mass.
2. Identify the mass of the products when the following react to completion.
a) 35 g of reactants
b) 12 g of reactants
c) 2 g of one reactant added to 24 g of another reactant
d) 6 g of one reactant added to 3 g of another reactant
Understanding
3. There are two reactants in a chemical equation and one product. The mass of the product is 30 g. The mass of the first reactant is 17 g. Describe how that the mass of the second reactant must equal 13 g to obey the Law of Conservation of Mass.
Applying
4. Emma carried out an experiment by reacting different amounts of magnesium with oxygen. Her measurements are shown in the following results table. Explain how her results support the Law of Conservation of Mass.
Analysing
5. Analyse the following chemical equations to find which obey the Law of Conservation of Mass.
a) C + O2 → CO2
b) CaCO3 → CaO + CO2
c) H2 + O2 → H2O
d) Na + Cl2 → NaCl
e) Ba + O2 → BaO
6. Rewrite any chemical equations from Question 5 that did not obey the Law of Conservation of Mass as balanced chemical equations.
7. Distinguish between an open system and a closed system.
Evaluating
8. Decide whether an open system or a closed system is better to observe the Law of Conservation of Mass. Justify your choice.
9. In a chemical reaction, the mass of the reactants was 15 g. The mass of the products was 12 g. Decide whether this reaction followed the Law of Conservation of Mass. Justify your choice.
10. Ginny and Paul leave a glass of water on their balcony. By the time they realise it has been left there, the volume of water in the glass has reduced. Ginny says that the mass of water molecules has been lost. Paul says there is less water and therefore less mass in the glass because the water has evaporated, and this mass has been added to the mass of the air.
a) Decide who you think is correct and justify your reasoning.
b) Design an experiment to demonstrate who was correct.
At the end of this section, I will be able to:
1. Describe how some chemical reactions are used to extract metals and produce elements.
2. Explain how manufacturers can improve chemical synthesis by using green chemistry principles.
Chemical reactions occur naturally to produce a range of naturally occurring chemical compounds (i.e. two or more different elements chemically bonded together). Industrial chemical manufacturers often take such compounds and use chemical reactions to re-form pure elements. This is a major industry in Australia, particularly in mining, in which metal compounds are mined and reacted to re-form pure metals.
Non-reactive metals
Metals that are very unreactive and can be found in the earth in the elemental form are known as native metals. For example, gold, silver and copper (see Figure 6.16) metals can be found in their elemental form.
As most metals in their elemental states are reactive, they are not found in their native state, they are found as compounds. This means the metal atoms are combined with other substances. These compounds are called ores.
Most relatively reactive metals exist in nature as compounds that have reacted with oxygen or sulfur to form metal oxide or sulfide mineral ores. The elemental form of the metal can be synthesised by reacting the metal oxides or sulfides with carbon (such as coal) at extremely high temperatures in a blast furnace. The carbon removes the oxygen from the metal ore, producing the products carbon dioxide and the pure form of the metal. The reaction below is an example of how iron is extracted from iron oxide in a blast furnace.

Word equation: iron oxide + carbon → iron + carbon dioxide
Symbol equation: 2Fe2O3 + 3C → 4Fe + 3CO2
extracting iron using a matchstick
Aim
To extract iron from iron oxide
Materials
• red iron(III) oxide powder
• sodium carbonate powder
• 100 mL beaker filled with water
• watchglasses
• crucible tongs
• weighing boat
Method
Be careful
Wear appropriate personal protective equipment.
• spatula
• Bunsen burner
• bench mat
• magnet
• safety match
1. Copy the results table into your science book.
2. Run the magnet over the iron(III) oxide powder, sodium carbonate powder and match head. Record whether they are magnetic.
3. Place a small amount of sodium carbonate powder in a watchglass. Do the same with the iron(III) oxide powder.
4. Check the rubber tubing for the Bunsen burner is intact and the air hole is closed, then set up and light the Bunsen burner.
5. Moisten the head of the match by dipping it into a beaker of water.
6. Roll the head of the match in the sodium carbonate powder and then in the iron(III) oxide powder.
7. Using the pair of tongs, hold the head of the match in a blue Bunsen burner flame – only let it burn halfway down the match.
8. Turn off the Bunsen burner and allow the match to cool.
9. Use the spatula to crush the charred head of the match into the weighing boat.
10. Run the magnet underneath the weighing boat and record what you see.
Results
Copy and complete the following table.
Table showing the magnetic nature of the different substances observed Substance Magnetic?
Iron(III) oxide powder
Sodium carbonate powder
Match head (before heating)
Charred remains (after heating)
Discussion: Analysis
1. In this experiment, you reacted iron(III) oxide powder with carbon to try to extract the metal. Which chemical did the carbon come from?
2. How did you know that iron metal was the product formed?
3. Write a word equation for the reaction studied.
4. Explain why most metals are not found in their elemental state so need to be extracted from compounds. Practical 6.3
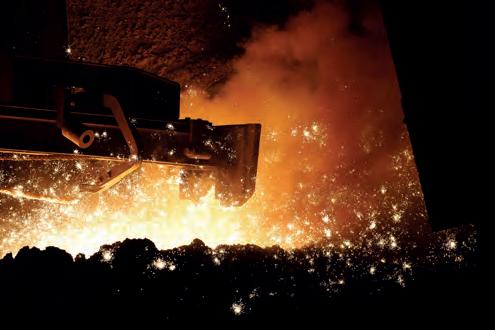
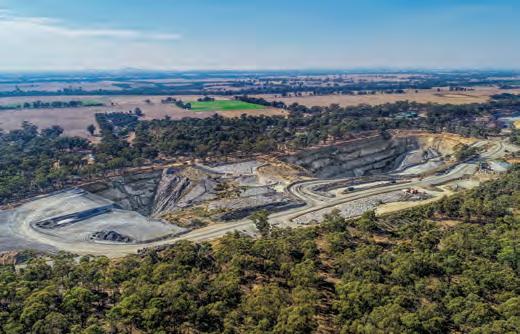
Some of the most reactive metals require a lot of energy to be converted back to their elemental form. To extract these metals, an electric current is passed through a molten (liquid) form of the impure metal, resulting in the extraction of the pure form of the metal, in a method called electrolysis. As this process is expensive, it is only used to extract reactive metals such as aluminium, sodium and potassium.
Quick check 6.6
1. Define ‘native metal’.
2. Name an example of a metal from this chapter that can be extracted by: a) reacting with carbon b) electrolysis.
From an environmental perspective, industrial synthesis of elemental metals can be considered highly energy consuming and unsustainable. For example, decomposing metal oxides in a blast furnace burning coal requires very high temperatures, consumes a lot of energy, and produces carbon dioxide, a greenhouse gas. Furthermore, electrolysis of reactive metals requires a significant amount of energy in the form of electrical energy, which is often produced by unsustainable coal-fired power stations.
However, the increase in consumer and regulatory demand for more green and sustainable approaches to chemical synthesis, has resulted in a significant shift towards green chemical synthesis. Chemical manufacturers have also considered the cost and benefits to their reputations of conducting chemical syntheses in sustainable ways.
In 1998, scientists Paul Anastas and John Warner published a book that detailed the 12 principles of green chemistry. These principles, some of which are detailed in Table 6.2, provide a framework for chemical manufacturers to produce products in a more sustainable way, including by optimising their chemical reactions.
chemistry green (environmental) something that has a reduced impact on the environment sustainable a way of using natural resources responsibly so they are available for future generations
Prevent waste
Use renewable feedstocks
Design for energy efficiency
Chemical syntheses should be designed to prevent waste, rather than having to clean up the waste produced.
Reactants should be sourced from renewable resources rather than non-renewable resources.
High temperatures and pressures use large amounts of energy, which are often produced from unsustainable sources. Ambient temperatures and pressures should be used in chemical syntheses.
Less hazardous synthesisChemical reactions should be designed so that products are not hazardous or toxic to humans or the environment.
Design for degradationChemical reactions should be designed so that products are naturally degradable and are broken down in the environment.
Chemical manufacturers produce a variety of products that we use every day, including common household objects. Many of these products have started to become more environmentally friendly or be produced by considering the 12 principles of green chemistry. For example, you might already use eco-friendly biodegradable toothbrushes, cutlery or cups. All chemical synthesis is heading towards a more sustainable future.

Greener energy and ethical innovation
In January 2024, researchers at MIT in the USA published some very exciting work. Today, lithium-ion batteries are used to power your laptop, your phone and even your car; however, the cathodes of the batteries traditionally contain cobalt. Cobalt is expensive, difficult to source, and environmentally destructive when mined. Cobalt mining is also deeply tied to exploitative labour practices, particularly in the Democratic Republic of Congo, where mining operations have been linked to human rights violations, child labour and the displacement of communities. Addressing these ethical concerns is as crucial as reducing environmental harm.
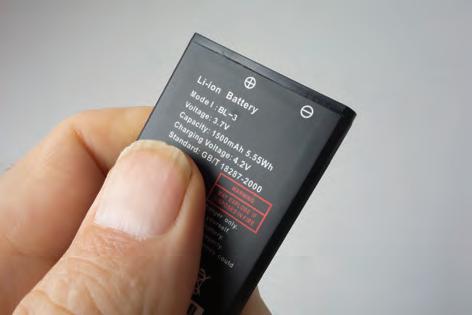
With a shift toward more sustainable and ethical chemistry, researchers have reported that a carbon based organic material widely available in nature may replace cobalt in batteries. This alternative offers the same performance without the ethical and environmental costs often associated with resource extraction.
reporter’s notebook: is everyone happy about the principles of green chemistry?
Imagine you are an online newspaper reporter who needs to differentiate the facts about the push for green chemistry from your personal thoughts and feelings about why it is important. This is an opportunity to step back from your own perspective and consider the views of others, such as the industries that need to change (the economic implications) and the people that will be affected (the social implications). You should also consider ethical implications. As a reporter, you will:
• Name the facts and reasons behind the push for greener chemistry.
• Identify the thoughts and feelings of the different groups involved or affected by the push for greener chemistry.
• Make your best judgement about the situation, based on this information.
The Reporter’s notebook thinking routine was developed by Project Zero, a research centre at the Harvard Graduate School of Education.
Some of the principles of green chemistry have been discussed in this chapter; however, there are more to explore. The American Chemical Society (ACS) has produced a pocket guide for quick reference.
Head to the ACS website and explore the details of each of the 12 principles of green chemistry.
Figure 6.20 The Green Chemistry Pocket Guide created by the American Chemical Society. Reprinted with permission from ACS Green Chemistry Institute®. Copyright 2023 American Chemical Society. Green Chemistry Pocket Guides: https://www.acs.org/greenchemistry/ principles/12-principles-of-greenchemistry.html
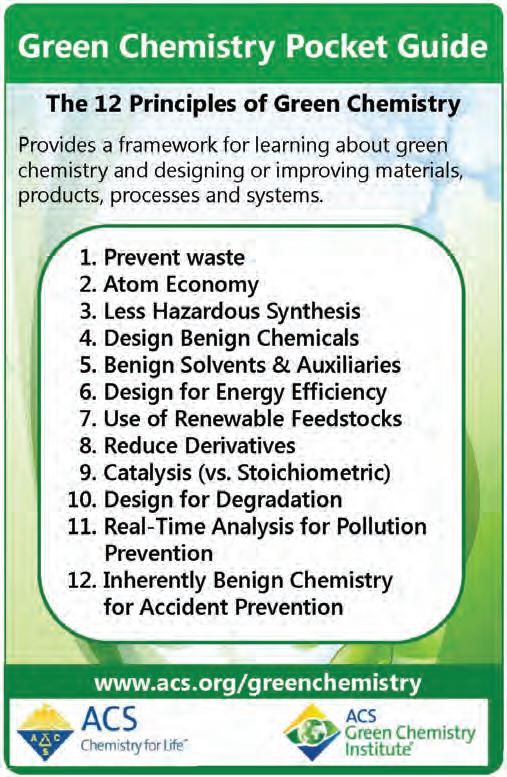
Did you know? 6.2
Dr Amy S. Cannon is recognised as the first person to earn a PhD in green chemistry. As the cofounder and executive director of Beyond Benign, a non-profit organisation that promotes sustainable science education and green chemistry principles, Cannon has made significant contributions to the advancement of safer chemicals and processes in both academic and industrial settings. She has also developed innovative educational programs that aim to educate future scientists on the importance of sustainability and green chemistry.

Section 6.3 questions
Remembering
1. Define ‘electrolysis’.
2. List three metals that can be found in the earth as native metals.
Understanding
3. Describe what is meant by the use of renewable feedstocks in green chemical synthesis.
4. List three household objects in your house that may have been synthesised according to green chemistry principles.
Applying
5. Outline what determines whether electrolysis, a blast furnace or open cut mining is the right approach for producing an element.
Analysing
6. Explain why extraction of iron using a blast furnace is not an energy-efficient chemical synthesis.
Evaluating
7. Evaluate how the 12 principles of green chemistry can be used to promote the use of renewable sources of energy such as solar power and wind power for chemical synthesis.
Chapter checklist
Success criteria Linked question
6.1I can recall the evidence of chemical change. 1
6.1I can define the term ‘chemical reaction’. 2
6.1I can identify the reactants and products in a chemical equation.2, 8
6.1I can write a word equation. 5
6.2I can define the Law of Conservation of Mass. 4
6.2I can explain the outcome of experiments based on the Law of Conservation of Mass. 10
6.2I can identify a balanced equation for a chemical reaction. 6, 8
6.3I can describe how some chemical reactions are used to extract metals and produce elements. 7,
6.3I can explain how manufacturers can improve chemical syntheses by using green chemistry principles. 3, 9
Review questions
Remembering
1. List five indicators of chemical change.
Understanding
2. Describe what is happening in the following reaction. Use the following keywords: ‘reactants’, ‘product’, ‘bonds’, ‘rearranged’, ‘chemical reaction’. Make sure to also mention the reaction conditions.
hydrogen oxygen heat water
3. Describe the green chemistry principle ‘design for degradation’.
4. Explain how a balanced chemical equation can provide evidence of the Law of Conservation of Mass.
Applying
5. Write word equations for the following chemical reactions:
a) Nitrogen gas and hydrogen gas react to produce ammonia (NH3).
b) Calcium carbonate is a white solid with the formula CaCO3. When heated, it breaks down to form solid calcium oxide (CaO) and carbon dioxide gas (CO2).
c) Water is formed when hydrogen gas and oxygen gas react.
d) When calcium carbonate reacts with nitric acid (HNO3), water, carbon dioxide and calcium nitrate (Ca(NO3)2) is formed.
Go online to access the interactive chapter review!
6. Rewrite each of the following chemical equations so that they obey the Law of Conservation of Mass:
a) Mg + O2 → MgO
b) H2 (g) + Cl2 (g) → HCl (g)
c) H2 + O2 → H2O
Analysing
7. Compare the conditions required for the reaction of a metal with carbon and an electrolysis reaction.
8. Analyse the following word equation and formula equation.
hydrochloric acid + magnesium → magnesium chloride + hydrogen 2HCl + Mg → MgCl2 + H2
Identify:
a) the reactants
b) the products
c) whether it observes the Law of Conservation of Mass
d) the chemical formula of magnesium chloride.
Evaluating
9. The chemical synthesis of sodium chloride (NaCl), or table salt, requires that sodium metal (Na) and chlorine gas (Cl2), both hazardous reactants, are heated at 800°C. This produces an explosive reaction. Propose three ways this chemical synthesis could be adjusted in line with the 12 principles of green chemistry.
10. Reactants weighing a total of 20 g were reacted together. Only 18 g of product was made. Propose what may have happened to the remaining 2 g of mass.
A variety of fuel sources are shown in Table 6.3, with the relative number of carbon atoms per fuel molecule and the mass of CO2 produced by burning 1 kilogram (kg) of each fuel. This information is also shown as a graph in Figure 6.22.
Table 6.3 The relative number of carbon atoms per fuel molecule and the mass of CO2 produced by burning 1 kg of the fuel
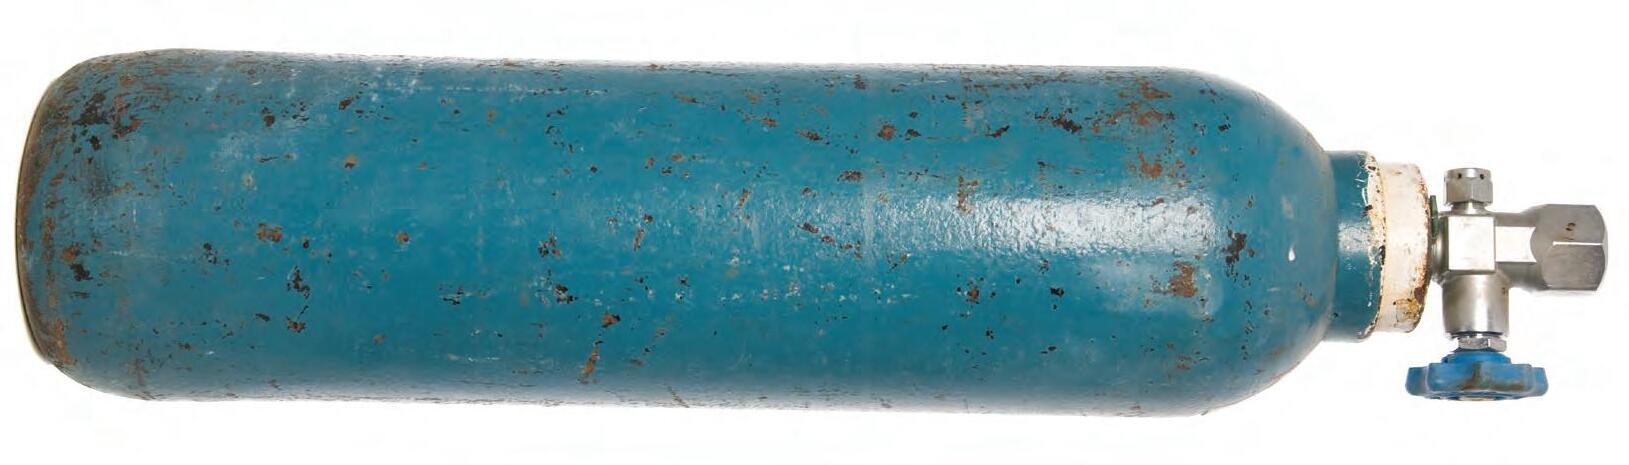
Number of carbons in fuel molecule
Applying
1. Identify the fuel that produces the lowest mass of carbon dioxide per kilogram burned.
2. A premium unleaded (petrol 98) brand has stated that their fuel produces less carbon dioxide emissions than a petrol 91 brand. Determine whether this statement is correct.
3. A coal mining company has argued that the mass of carbon dioxide produced by burning 1 kg of their fuel is less than 1 kg more than that produced from natural gas. Determine whether the evidence from Table 6.3 supports this claim.
Analysing
4. Identify the trend between the number of carbon atoms per reactant molecule and the mass of carbon dioxide produced.
5. Generally, at atmospheric temperature, fuel molecules with four carbons or less are gaseous fuels, and those with five or more carbons are liquid fuels. Coal is a solid fuel. Classify the fuels in Table 6.3 as gas, liquid or solid.
Evaluating
6. A fuel company is producing a new biofuel made primarily from ethanol, which is a molecule with two carbon atoms. Predict the mass of carbon dioxide that would be produced by burning 1 kg of this fuel.
7. For a given volume of coal and natural gas, deduce which one contains more carbon atoms.
8. Extrapolate the data to predict the mass of carbon dioxide that would be produced by burning a fuel with a relative number of carbon atoms per molecule of 11.

Baristas in Australian coffee shops have felt the frustration of milk curdling. They want to be able to offer their customers a range of choices of milk (e.g. cow’s, rice, almond, soy), but all these products respond differently when heated and added to tea and coffee.
Curdling is the process of coagulation that occurs when the protein components in the milk clump together. Certain blends of coffee can be quite acidic (low pH), and acid causes the proteins in milk to unravel and clump together, similar to what happens when an egg is boiled and the yolk solidifies. Soy milk is particularly susceptible to curdling.
As with many chemical reactions, temperature can affect the rate at which the reaction occurs. If you add an acid such as lemon juice or vinegar to hot milk, the milk will curdle almost immediately. But if you add an acid to cold milk, the reaction will not occur for some time.
Chemical engineers apply the principles of chemistry, biology, physics and maths to implement bestpractice strategies involving chemicals, drugs and food. In 2015, an Australian milk brand, MILKLAB, worked with baristas to create a range of soy milk that would not curdle in acidic coffee blends.
However, not all coffee shops can afford speciality products, so adding sodium bicarbonate (baking soda) to coffee to prevent soy milk curdling is a common cheap hack used by many baristas and coffee enthusiasts. Adding a small amount of sodium bicarbonate to the coffee before adding the soy milk can help neutralise the acidity and prevent curdling. However, it’s important to note that although this trick is safe and effective, adding too much baking soda can alter the flavour of your coffee, so it’s best to use it sparingly!


Create an infographic for baristas, based on your experimentation results, for best practice with milk. Use images from your experimentation process.
As the chemical engineer representing the Hipsters Coffee Union of Australia, you are responsible for ensuring that baristas know how to make a coffee in which the milk does not curdle, so no barista loses their job over split milk. You will propose the best pH, temperature and ratio of volume of coffee to milk for a range of milk types in order to prevent curdling.
To do this, you will need to design several tests or trials. Be sure your milk samples are fresh, use the same amount of milk for each test, determine a way of measuring the acidity of the milk and record the weight of any curdled milk produced. Be sure to record all your data, amounts and settings for your trials, so that you can create your infographic for the Union with confidence.
• white vinegar or fresh lemon juice (both have a pH of approximately 2)
• instant coffee
• a range of different milks, including cow’s milk and soy milk
• water
• beakers
• measuring cylinder
• transfer bulb pipettes
• spoons or stirring rods
• clear plastic cups for cold coffee
• kettle
• paper towels
• several pieces of cheesecloth or cotton fabric
• thermometer
• data-logging pH meter or alternative method for measuring pH
• digital balance
• permanent marker
• gloves
1. Conduct some research on the process of how milk curdles and list all the factors.
An infographic showing the milk and froth ratios for three popular coffee drinks
2. Conduct some research on and list the ingredients that are used in barista-made coffee, and the ratios involved. Take note of any temperatures and pH values of the ingredients. Make sure you include research on all the suggested materials.
3. Design an experiment that demonstrates the conditions under which combining coffee and milk either curdles the milk or achieves a smooth texture. Think about how milk curdles and see if you can replicate this situation.
Do not consume any of the food. Take care when handling boiling water.
4. Perform your experiment, ensuring you take photos and notes of all observations of the experiment along the way.
5. Create an A5 ‘cheat sheet’ of infographics for baristas so they can easily identify the ratios possible for normal milk and soy milk with the most acidic coffee blends. You may do this by hand or search for free infographic design tools on the internet.
6. Discuss your findings with your colleagues and present your infographic.
7. Propose the best ratio of coffee to milk for preventing the curdling of milk for acidic coffee blends with different milk products.
8. Identify possible sources of error in your testing procedure and suggest some ways to improve and modify your experiments in the future.
9. Predict how the temperature of the milk may have affected your findings.
Introduction
The first time people had a glimpse of Earth from space was in October 1946, when a film camera set to take photos every 1.5 seconds was launched on a rocket. Earth was photographed in greater detail in December 1968 by Apollo 8 astronauts on their trip to orbit the Moon. This encouraged us to understand Earth from a different perspective: as a global system.
Earth is a dynamic and ever-changing planet consisting of interconnecting spheres. In this chapter, you will learn about Earth’s chemical spheres and how they interact. You will study the processes by which carbon is cycled, and gain an appreciation of how humans are disrupting the balance and impacting the composition of our planet. Scientists have new tools at their disposal to measure, model and predict how our climate continues to change. It is critical our generation finds ways to mitigate the effects of climate change and better prepare for the impacts in the future.

Earth‘s interacting spheres
• Overlap • Interact
• Are affected by natural events
• Human influences on climate change
• Evidence for climate change
• Modelling and mitigating the impacts of climate change
carbon is cycled on Earth through key processes including photosynthesis, respiration, fire, weathering, vulcanism and the combustion of fossil fuels; these processes change the composition of Earth’s interrelated systems (atmosphere, biosphere, hydrosphere and lithosphere) over time (VC2S10U10)
• identifying Earth as a system, differentiating between Earth’s 4 systems and discussing interactions between these systems, such as pesticides applied to soils (lithosphere) leaching into waterways (hydrosphere) and affecting organisms (biosphere)
• examining the carbon cycle using diagrams, animations or simulations and explaining the role of photosynthesis and respiration in that cycle
• investigating the greenhouse effect and relating it to the role of carbon dioxide in maintaining temperatures that support life on Earth
• investigating how Aboriginal and/or Torres Strait Islander Peoples use fire-mediated chemical reactions to facilitate energy and nutrient transfer through the practice of cultural burning
• investigating how Aboriginal and/or Torres Strait Islander Peoples are reducing Australia’s greenhouse gas emissions by reinstating cultural burning practices
• conducting a field investigation to evaluate carbon sequestration in an ecosystem, such as measuring tree biomass, deadwood, leaf litter and soil depth, and using formulas to calculate approximate carbon storage
• identifying how carbon dioxide is captured and stored naturally or using technologies7.3 the dynamics of global climate change can be modelled and explained by examining the interactions between greenhouse gas emissions and energy exchanges within and between Earth’s systems; mitigating human-induced climate change requires addressing various activities including power generation, deforestation, manufacturing, transportation, food production and resource consumption (VC2S10U11)
• examining how interactions of radiation from the Sun with the atmosphere, ocean and land are the foundation for the global climate system
• investigating indicators of climate change such as changes in ocean and atmospheric temperatures, sea levels, biodiversity, species distribution, permafrost and sea ice
• identifying changes in global climate over time, exploring visualisations and using simulations to investigate why energy balances have changed
• examining the factors, including energy, that drive deep ocean currents, their role in regulating global climate and their effects on marine life
• predicting changes to the Earth system and identifying strategies designed to reduce climate change or mitigate its effects
• calculating an individual’s carbon footprint, examining the impact of human activities on atmospheric carbon dioxide levels and suggesting strategies to reduce carbon dioxide emissions

scientific knowledge is contestable and is validated and refined over time through expanding scientific methods, replication, publication, peer review and consensus (VC2S10H01)
• examining the scientific consensus supporting global warming and examining why scientists use different climate change models when there is a climate change consensus among scientists
advances in technologies have enabled advances in science, while science has contributed to developments in technologies and engineering (VC2S10H02)
• considering how computer modelling has improved knowledge and predictability of phenomena such as climate change and atmospheric pollution, and how quantum computers enhance modelling of complex weather and climate systems
• investigating how satellites generate global data including for ocean temperatures, sea levels, and forest and ice cover, and examining how that data is used to evaluate the effects of climate change
the use of scientific knowledge to address socio-scientific issues and shape a more sustainable future for humans and the environment may have diverse projected outcomes that affect the extent to which scientific knowledge and practices are adopted more broadly by society (VC2S10H03)
• examining how government initiatives such as Landcare support adoption of effective landrestoration practices that improve soil quality and increase carbon sequestration in soils
• considering how the traditional ecological knowledges of Aboriginal and/or Torres Strait Islander Peoples are being recognised by Western science and how these practices are being used by Traditional Owners in carbon farming initiatives to increase carbon sequestration and reduce greenhouse gas emissions
Glossary terms
Anthropogenic
Atmosphere
Bioaccumulate
Biodiversity
Biomass
Biosphere
Carbon sequestration
Carbon sink
Carbon source
Climate
Decomposer
Enhanced greenhouse effect
Geosphere
Glacial period
Global warming
Greenhouse effect
Greenhouse gas
Hydrosphere
Interglacial period
Keystone species
Lithosphere
Stratosphere
Sustainable ecosystem
Troposphere
Weather

atmosphere the mixture of gases above the surface of the Earth troposphere the layer of Earth’s atmosphere that is closest to Earth’s surface and where most of the weather occurs stratosphere the layer of Earth’s atmosphere above the troposphere; contains the ozone layer
At the end of this section, I will be able to:
1. Distinguish between Earth’s chemical spheres: atmosphere, biosphere, geosphere and hydrosphere.
2. List the five layers of the atmosphere.
3. Describe the effect of natural events such as earthquakes, volcanos and cyclones on the chemical spheres.
In your previous studies, you may have learned about two of Earth's cycles: the rock cycle and the water cycle. Matter on Earth is constantly moving, and that Earth itself is a dynamic system. There are various interacting spheres, each playing a crucial role in maintaining the balance of the planet.
Understanding how these spheres interact with each other, and how they are affected by natural and human-made events, allows scientists to identify and address the environmental challenges facing our planet today.
To make it easier to describe the movement of matter around Earth, scientists have split the planet into four major sub-systems called spheres. Despite their name, they are not spherical in shape. These spheres are the:
• atmosphere (the gases surrounding Earth)
• biosphere (the part of the planet that can support life)
• hydrosphere (all the water present on Earth)
• geosphere (all the Earth's geological materials, such as the interior and surface of Earth).
Let's look at each of these spheres in more detail.
The atmosphere consists of all the gases above Earth's surface; without it there would be no life on Earth. Two main gases make up the atmosphere: nitrogen and oxygen. There are also smaller proportions of other gases (see Table 7.1).
In total, the atmosphere is about 500 km thick and consists of five layers: the troposphere, stratosphere, mesosphere, thermosphere and exosphere (see Figure 7.1).

7.1 The
These layers allow us and other living things to breathe, protect us from the Sun's harmful ultraviolet (UV) radiation, protect us from meteorite bombardment and keep the surface temperature of Earth constant. The most important layers to us and other life on Earth are the troposphere and the stratosphere.

1. List Earth’s four chemical spheres.
2. Name the gas that is found at 21% concentration in Earth’s atmosphere.
3. List the five layers of Earth’s atmosphere.
The troposphere is the lowest layer of Earth's atmosphere, extending from Earth's surface up to an altitude of approximately 6–20 kilometres. It is where most weather occurs and it is the layer in which we live and breathe. The troposphere contains around 75% of the mass of the entire atmosphere, and is composed of mainly nitrogen and oxygen, along with trace amounts of other gases such as carbon dioxide, methane and water vapour. The temperature in the troposphere decreases with altitude, which is why the highest temperatures are near Earth's surface and the lowest temperatures are at the top of the layer. This temperature gradient leads to convection currents, which drive weather patterns and atmospheric circulation. The troposphere is critical for supporting life on Earth, as it provides the oxygen we breathe, regulates Earth's temperature and plays a vital role in the carbon and water cycles.

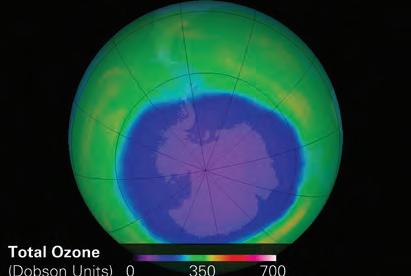
The stratosphere lies directly above the troposphere, extending from approximately 20 to 50 kilometres in altitude. It is characterised by a relatively high concentration of ozone molecules (O3), which absorb harmful ultraviolet radiation from the Sun and trap heat to create a warming effect on Earth. This stable ozone layer inhibits mixing with the troposphere below. In order to avoid turbulence, most jet aircraft fly in the lower part of the stratosphere, which is home to the jet stream, a high-altitude, fast-moving wind that influences weather patterns.
have caused damage to the ozone layer, leading to the formation of the ozone hole, which poses a threat to human health and the environment.

In 1985, scientists found that parts of the ozone layer above the continent of Antarctica had broken down. They also noticed that similar thinning of the ozone layer was happening over parts of Australia, and that this correlated with an increase in cases of skin cancer. They needed to find out why this had happened and if it could be reversed.
Conduct some research and answer the following questions.
1. Compare the atomic structures of oxygen gas (O2) and ozone gas (O3).
2. Identify the main function of the ozone layer in more detail to explain the impact of ozone thinning.
3. Identify the causes of ozone thinning.
4. Describe the purpose of the Montreal Protocol.

5. In October 2022, a UN-backed scientific panel released a report that said the ozone layer is on track for a full recovery. When do they predict this will happen by?

On 14 October 2012, Austria’s Felix Baumgartner rose nearly 39 kilometres to the stratosphere in a helium-filled balloon. He then jumped into thin air, freefalling for 4 minutes and 22 seconds before opening his parachute. The entire journey back to the ground lasted just under 10 minutes. Baumgartner reached an estimated speed of 1342 km h–1, which makes him the first man to break the speed of sound in freefall, and he broke the record for the world’s highest ever freefall. The jump nearly did not happen because a fault in the heater of Baumgartner’s visor was making it fog up when he breathed out. Early in the dive, there was concern that he could not get into the correct position for freefall (head down, arms swept back). Instead, he found himself tumbling over and over. However, due to his extensive freefalling experience, Baumgartner was able to correct his fall and get into a stable position.
1. Recall some of the roles of the stratosphere.
2. State the atmospheric layer in which weather occurs.
3. Justify which atmospheric layers are most important to humans.
The biosphere is the thin layer of Earth where life can exist. It is made up of all the living organisms on the planet, including plants, animals and microorganisms, as well as the physical environments in which they live.
The biosphere extends from the deepest parts of the ocean to the highest peaks of the mountains, and from the polar ice caps to the Equator. It is a complex and interconnected system, with organisms relying on each other for survival and functioning together to maintain the delicate balance of the planet's ecosystems.
The hydrosphere refers to all the water on Earth, including the oceans, rivers, lakes, groundwater and even the water vapour in the atmosphere. It plays a critical role in supporting life on Earth, as all living organisms require water to survive. The hydrosphere also plays a key role in regulating Earth's climate, as it absorbs and distributes heat throughout the planet. Additionally, the movement of water in the hydrosphere, such as through the water cycle, helps to shape Earth's surface and create important habitats for various organisms.
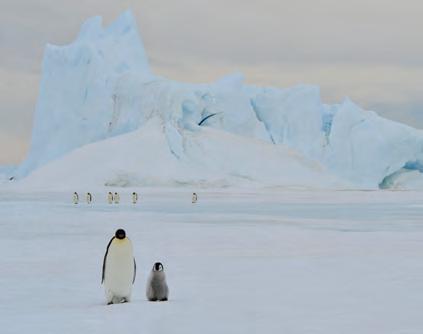
as living organisms, are part of the biosphere. The glacier they stand upon is part of the hydrosphere.
1. Describe what the hydrosphere is composed of.
2. ‘Fish are part of the hydrosphere.’ Propose whether this statement is true or false. Justify your choice.
The geosphere encompasses all of Earth's geological materials, including the solid and fluid rock that constitutes the crust, mantle and outer and inner core. It is the largest of Earth's four major spheres, and it plays a crucial role in supporting life on the planet. The geosphere is responsible for providing the foundation for Earth's surface features, including mountains, valleys and plateaus. It is also home to valuable natural resources, such as minerals and fossil fuels, essential to human societies.

biosphere all the areas on Earth and in its atmosphere that contain life
hydrosphere all of the water found on Earth (e.g. lakes and rivers)
geosphere all Earth’s geological materials, including magma, lava, rocks and minerals
The geosphere undergoes a continuous cycle: matter is constantly in motion through the various processes of the rock cycle. Volcanic eruptions expel magma, which cools and solidifies into rocks. The rocks are gradually broken down into sediment through weathering and erosion, which accumulates over time and eventually sinks deeper into Earth's crust. The sediment is then transformed into new rocks through lithification and may resurface as lava through volcanic activity, completing the cycle.
The lithosphere is often included in discussions of Earth's global systems; however, it is best conceptualised as part of the geosphere – specifically, the upper layers consisting of Earth's crust and the top rigid section of the upper mantle. The lithosphere is divided into tectonic plates, which rest and move upon the underlying softer upper mantle, known as the asthenosphere. Many seismic and volcanic events occur along the boundaries between the tectonic plates.
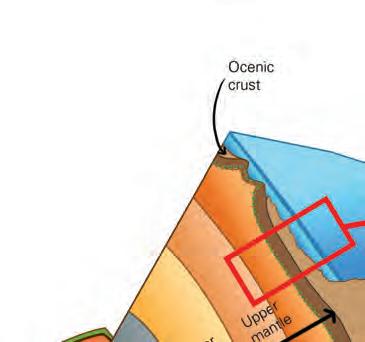
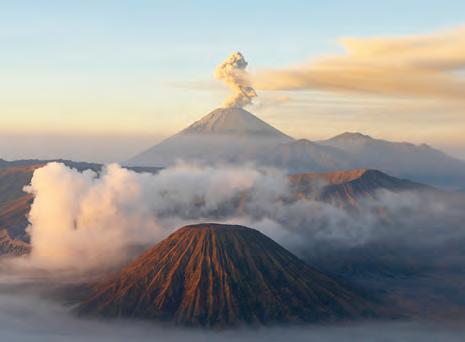
processes involved in the rock cycle.
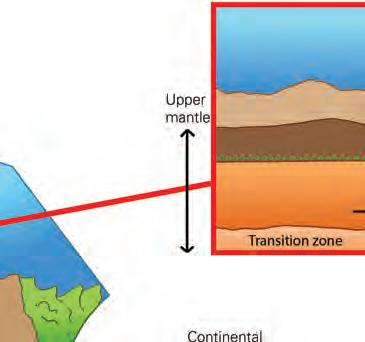


1. Describe where most volcanoes and earthquakes occur.
2. State what the lithosphere is composed of.
3. Name the cycle that results in constant movement of matter within the geosphere.
Sometimes it is not easy to exclusively classify substances into one sphere. Take soil as an example. Productive soil is primarily composed of minerals, so it could be considered part of the geosphere. However, it also contains organic matter and plenty of bacteria (from the biosphere), water from the hydrosphere, and air from the atmosphere.
Humans have been altering soil composition through their agricultural practices for thousands of years, and impacting multiple chemical spheres in the process. Pesticides that are sprayed on agricultural crops have the potential to leach into soil and waterways, disrupting the chemistry of the hydrosphere and negatively affecting other living organisms in the biosphere.
Did you know? 7.1
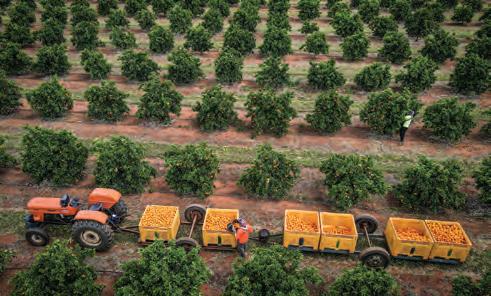
Figure 7.12 Plants are part of the biosphere, while productive soil has components of each of the chemical spheres.
Victoria’s critically endangered Burrunan dolphins, found in Port Phillip Bay and the Gippsland Lakes, have been found to contain the highest concentrations of PFAS chemicals anywhere in the world. PFAS has been widely used as a non-stick coating for cookware, in packaging and notably in fire extinguishing foam that has contaminated multiple Victorian firefighter training facilities. It presents an environmental and biological problem as it is slow to biodegrade, and can bioaccumulate in organisms. The sources of PFAS in the marine environment include runoff from urban areas and wastewater treatment plant discharge.
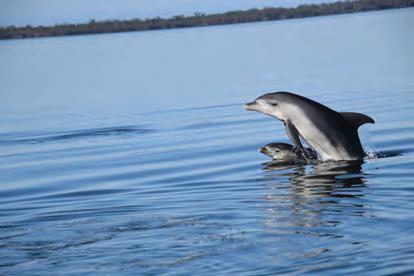
Figure 7.13 Burrunan dolphins are exclusively found in Victoria. With fewer than 200 individuals in the wild, they were classified as critically endangered in 2021.
Interactions between Earth's spheres are dynamic relationships. The atmosphere interacts with the other spheres by circulating heat, gases and energy throughout the planet. The hydrosphere interacts with the atmosphere by exchanging water vapour through the process of evaporation and precipitation. The biosphere interacts with the other spheres through the cycling of nutrients and the exchange of gases, such as carbon dioxide and oxygen. Carbon dioxide is absorbed by plants during photosynthesis, and the oxygen produced by plants is released into the atmosphere.
The geosphere interacts with the atmosphere and hydrosphere through processes such as erosion, volcanic activity and the movement of tectonic plates. Similarly, the chemical composition of rocks in the geosphere can affect the mineral content of the soil, which affects the growth of plants and the availability of nutrients in the biosphere.
bioaccumulate when the concentration of a substance increases inside a living organism, as intake exceeds excretion
Matter constantly moves between spheres in cycles. The energy driving the movement of matter comes from the Sun and from Earth's core. It is this flow of energy and the cycling of matter that produces the chemical and physical changes in Earth's materials that we will discuss in Section 7.2. Earth gains energy from radiation from the Sun (mostly infrared, visible and ultraviolet wavelengths) and radiates heat energy back into space. Similarly, Earth gains a tiny amount of mass via comets and meteorites, and loses mass through gases escaping into space.
1. Earth can be described as a closed system, meaning that its total mass does not change. Decide whether this statement is true or false.
2. List one way that Earth can gain and lose mass, and one way it can gain and lose energy.
3. Describe an example of a transfer of matter from the biosphere to the atmosphere.
4. Describe the sphere interactions happening in Figure 7.14.

parts, people, interactions: Earth’s interacting spheres
Earth is a system because it is composed of interconnected components that interact with each other to form a complex and dynamic whole.
• What are the parts of the system?
• How do people interact with the parts of the system?
• How does a change in one element of the system affect the other parts of the system?
The Parts, people, interactions thinking routine was developed by Project Zero, a research centre at the Harvard Graduate School of Education.
Aim
To demonstrate the interaction between two chemical spheres
Materials
• celery stalks with leafy tops
• food colouring
• 250 mL measuring cylinder
• paring knife
• cutting board
Method
1. Copy the results table into your science book.
2. Using the measuring cylinder, measure 25 mL of water and then add several drops of food colouring.
3. Use the paring knife and cutting board, cut along the base of the celery stalk to expose a fresh section.
4. Place the stalk into the measuring cylinder, with the cut end in the liquid.
5. Leave it in bright sunlight.
6. Every 5 minutes for 30 minutes, record the height the water has travelled up the celery stalk.
Results
Copy and complete the following table.
Table showing height of water travelling up a celery stalk over time
Discussion: Analysis
1. Explain what happened to the height of the water over the duration of the experiment.
2. Identify the sphere interactions that were demonstrated during this experiment.
3. Plants also interact with the atmosphere. Using your knowledge of the needs of living things, explain how plants do this.
Discussion: Evaluation
1. Identify a limitation in the experimental method that could be improved upon repeat testing.
Conclusion
1. Make a claim about the interactions between chemical spheres based on your observations in this experiment.
2. Support your claim by referring to your experimental data and include potential sources of error.
3. Explain how your data supports your claim.
Effect
Natural events such as earthquakes, volcanoes and cyclones influence the interactions between the spheres. Table 7.2 summarises how natural events cause sphere interactions.
Geosphere (specifically, the lithosphere)
• Fault lines move apart or together
• Land rises or subducts (sinks)
• Landslides
• Mudslides
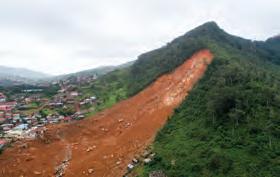
Biosphere
Atmosphere
Hydrosphere
• Volcanic lava can create islands
• Eruptions can destroy mountains and islands

• Destroys ecosystems• Lava burns plants and animals
• New islands become new habitats

• Toxic gases are emitted from the ground
• Tsunamis
• Changes the course of rivers
• Destroys dams
• Large ash clouds release many gases, including greenhouse gases and toxic gases
• Toxic gases dissolve in water and fall as acid rain
• Intense rainfall causes erosion of the land
• Uproots trees and plants, destroying ecosystems

• High wind speeds
• Produces heavy rain, causing floods
• Storm surges

Section 7.1 questions
Remembering
1. Identify the sphere that each of the following belongs to.
a) Iceberg
b) Pebble
c) Wombat
d) Air
2. Recall the layer of the atmosphere where jet streams are found.
3. Recall the most abundant gas in Earth’s atmosphere.
4. Recall the two sources of energy that drive the movement of matter on Earth.
Understanding
5. Explain the effect of earthquakes on the lithosphere.
6. Describe why Earth’s spheres can be described as overlapping.
Applying
7. Identify the spheres present in Figure 7.15.
8. Identify the sphere interactions taking place in Figure 7.16.


Analysing
9. Classify the components of a healthy river (river water, algae and other organisms, dissolved nitrogen, oxygen, carbon dioxide, minerals and rock fragments) into the chemical spheres to which they belong.
10. Discuss how a chosen natural disaster affects the chemical spheres. Try to include all spheres in your answer.
Evaluating
11. Discuss how the biosphere interacts with all other spheres.
12. Discuss how the atmosphere protects life on Earth.
At the end of this section, I will be able to:
1. Recall the seven processes of the carbon cycle.
2. Identify the impact of combustion reactions as a result of human activity on the carbon cycle.
3. Describe the role of cultural burning practices in facilitating energy and nutrient transfers.
The cycling and recycling of nutrients such as nitrogen, carbon and water in the spheres is important for sustaining life and ecosystems. A sustainable ecosystem is a biological environment that can support itself without outside assistance.
The carbon cycle describes the movement of carbon through all four spheres. Organisms require carbon as a key component of organic molecules such as carbohydrates, lipids, proteins and DNA that make up living organisms. Carbon is essential for the formation of the backbone of these molecules, and it is involved in energy transfer and storage within cells.
The carbon cycle occurs in many stages, but it is important to note that carbon can stay at one stage for thousands of years before moving on to the next stage.
Table 7.3 summarises the forms of carbon in each of the spheres.
AtmosphereCarbon dioxide (CO2), methane (CH4)
BiosphereCarbohydrates (such as glucose (C6H12O6)), fats, proteins, vitamins and DNA of all living things
HydrosphereCO2 dissolved in rivers, lakes and the ocean, forming carbonic acid (H2CO3)
Geosphere (lithosphere)
Decomposed organic matter in soils
Fossil fuels (coal, oil and gas)
Limestone (calcium carbonate (CaCO3))
Table 7.3 A summary of the carbon content in each sphere
The carbon cycle can be summarised in seven processes (see Figure 7.17), which either increase or decrease carbon dioxide in the atmosphere:
1. Photosynthesis
2. Transfer of carbon through the food chain
3. Respiration
4. Excretion, egestion, death and decomposition
5. Formation of fossil fuels
6. Combustion
7. Formation of limestone.


Photosynthesis (1)
(2)
Atmospheric
Respiration (3) Cow
Decomposition (4)
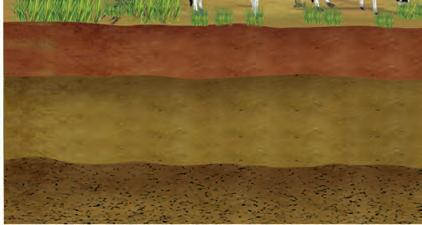
Excretion and egestion (4)
Decomposition without respiration (4)

Combustion (6)
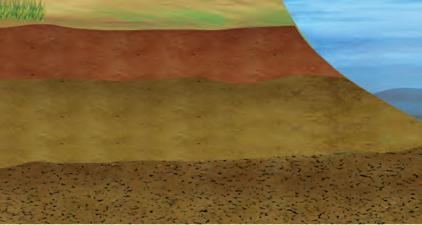


Carbon dioxide in Earth's atmosphere is absorbed by plants during photosynthesis. The carbon dioxide reacts with water taken in from the soil to make glucose, a carbon-containing compound.
The following equations summarise the process of photosynthesis for plants.
1. Define a sustainable ecosystem.
2. Explain why the cycling of carbon is important.
3. State the name of the form carbon takes in the hydrosphere.
4. State what form carbon dioxide is converted into during photosynthesis.
Animals obtain their carbon by eating plants and other animals. When animals and plants are eaten, their carbon content is transferred through the food chain.
Inside the cells of both plants and animals, oxygen is used to break down glucose in a process known as cellular respiration. Energy in the form of ATP is released, and the waste products are water and carbon dioxide. The carbon dioxide is released back into the bloodstream, and as the organism breathes out, this is added to the atmosphere. The following equation summarises respiration.
glucose + oxygen → carbon dioxide + water ATP (energy released)
C6H12O6 + 6O2 ⎯→ 6CO2 + 6H2O
Some of the carbon content of animals and plants enters the soil as waste such as urine (excretion) and faeces (egestion).
Dead animals and plants (organic matter) also contribute to the carbon content of the soil. Waste material and dead organic matter is broken down by decomposers, which respire, releasing carbon dioxide back into the atmosphere.
Try this 7.1 Modelling decomposition


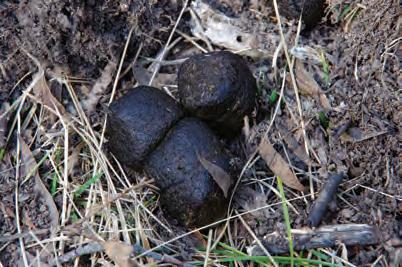
Search online for an Interactive Model of Leaf Decomposition. This will allow you to compare how different mathematical models, climates, litter types and ecosystems affect decomposition rate.
1. State how animals obtain carbon in the carbon cycle.
2. Name the two waste products produced in the breakdown of glucose during cellular respiration.
3. State one way animals can increase the carbon content of soil.
Fossil fuels such as coal, oil and gas are composed of the carbon from plants and animals that died millions of years ago. Carbon is stored as fossil fuels for millions of years before re-entering the carbon cycle.
Combustion reactions that involve the burning of fuels (such as the bushfire shown in Figure 7.23) have a significant impact on the carbon cycle because they release carbon dioxide into the atmosphere, contributing to the increase in atmospheric carbon dioxide concentrations.
Often, the fuels being burned are fossil fuels such as coal, oil and natural gas. The following equation shows the combustion of octane, a component of oil.
+ 25O2 → 16CO2 + 18H2O
The release of carbon dioxide from combustion reactions disrupts the natural balance of the carbon cycle. Normally, carbon moves between the atmosphere, ocean and land through processes such as photosynthesis, respiration and decomposition. However, burning fossil fuels releases carbon that has been stored underground for millions of years, disrupting the natural flow of carbon, and leading to an excess of carbon in the atmosphere.
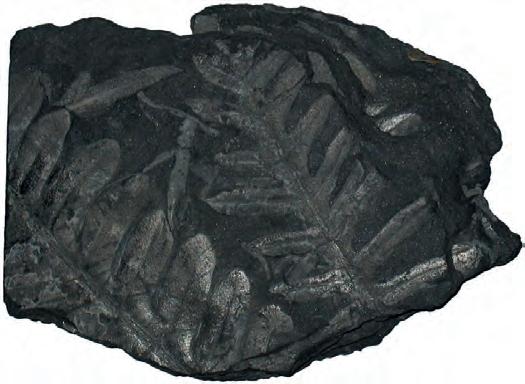
for millions of years. Sometimes, fossilised plants can be found in coal.
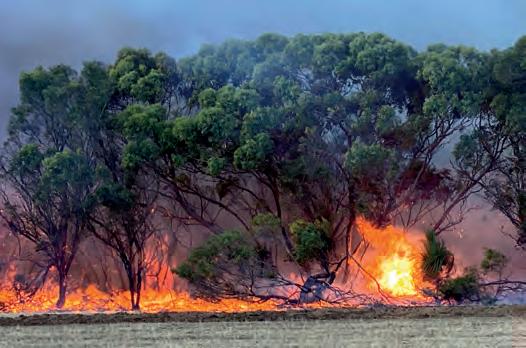
Fire has been used as a vital land management tool by Aboriginal and Torres Strait Islander Peoples for tens of thousands of years. Cultural burning is a deeply embedded practice of caring for Country, ensuring the health of landscapes, ecosystems, and communities.
Through careful and controlled use of fire, a mosaic of vegetation is maintained, supporting biodiversity and strengthening ecosystems. These fires are deliberately timed and placed, guided by deep knowledge of Country, seasonal changes and ecological relationships.
Cultural burning enhances soil health, cycling nutrients back into the land and supporting the growth of plants that sustain animals and people. It also helps manage invasive species and reduce the intensity of destructive wildfires. In some cases, burning has been used as a hunting strategy, guiding animals towards particular areas.
New research has found that the cultural burning practices of Aboriginal Peoples can help protect koalas. The research was conducted over two years in collaboration with the Quandamooka people on North Stradbroke Island in Queensland.
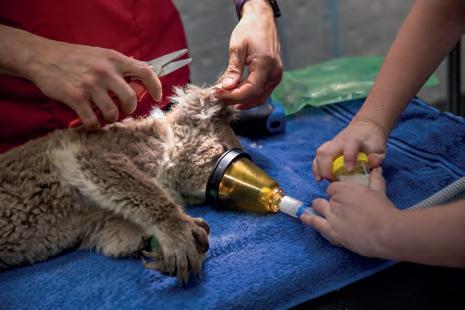
The study found that cultural burns are cooler, lower and slower than ‘hot fires’. The study also found that cultural burns can protect koalas by encouraging regeneration of native plants and controlling species such as banksias and wattle, reducing the risk of fire reaching the koalas’ canopy. The researchers used drones fitted with thermal cameras and hormone metabolite analysis to monitor koala stress during the cultural burns. The study found no negative impacts on koala population densities or their stress levels.
In small groups, investigate how Aboriginal and Torres Strait Islander Peoples’ fire management practices are informing and being adopted in contemporary fire management, including in Victoria. You may want to consider how controlled burning can stimulate the growth of fire-tolerant trees and plants that can store carbon in their biomass and in the soil, or how it reduces the fuel load of an ecosystem.
Carbon dioxide gas in the atmosphere can dissolve in the oceans, forming carbonic acid. Carbon dioxide also provides the carbon that combines with calcium ion mineral deposits to make calcium carbonate (CaCO3), which is the major component of shells. Shells from dead animals sink to the bottom of the ocean. Over millions of years, these shells are compacted and form limestone.
Limestone is a sedimentary rock and an important building material in the construction industry. The carbon stored in limestone can remain there for millions of years, but under certain conditions, such as weathering and erosion, carbon dioxide can be released from limestone back into the atmosphere. For example, when limestone is exposed to acidic water or soil, it can react with the acid to release carbon dioxide.
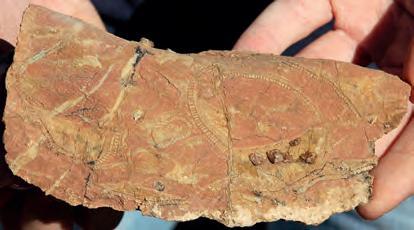
Figure 7.25 Fossils of an extinct group of calcareous (containing calcium carbonate) sponges in limestone
Table 7.4 summarises the gains and losses of atmospheric carbon in the carbon cycle.
Atmospheric carbon gains Atmospheric carbon losses
Respiration
Combustion
Excretion, death and decomposition
Photosynthesis
Formation of fossil fuels
Dissolving in the oceans and forming limestone
Table 7.4 A summary of the gains and losses of atmospheric carbon within the carbon cycle
Practical 7.2
Aim
To determine what happens when carbon dioxide dissolves in water
Materials
• bottle of universal indicator and pH scale
• water
• test tube
• test-tube rack
• drinking straw
Method
1. Copy the results table into your science book.
2. Fill the test tube with water to a depth of about 5 cm.
Be careful
Wear appropriate personal protective equipment.
Wear safety glasses. Use the correct method for blowing into the test tube.
3. Add 3 drops of universal indicator and note the colour and pH in the results table.
4. Place the straw into the test tube and blow gently into it for 10 seconds. Be careful to only blow into the straw; you might want to practise first.
5. Note the colour and pH of the solution after you have blown into it.
Results
Copy and complete the following table.
Table showing the pH of water before and after adding carbon dioxide
Colour pH
Before blowing
After blowing
Discussion: Analysis
1. Identify what is indicated by the colour and pH of the water before blowing.
2. Identify what is indicated by the colour and pH of the water after blowing.
3. Give the name and formula of the solution formed after blowing.
4. Which stage of the carbon cycle does this experiment represent? Justify your choice.
5. Discuss what happens to carbon dioxide in water after it has dissolved.
6. Determine the ability of carbon dioxide to dissolve in water, based on this experiment.
7. Discuss the global issues behind carbon dioxide dissolving in water.
Discussion: Evaluation
1. Is this experiment an appropriate model for showing how carbon dioxide dissolves in oceans? Discuss the limitations of the methodology.
Conclusion
1. Make a claim about the ability of carbon dioxide to dissolve in water based on this experiment.
2. Support your statement by using the data you gathered, and include potential sources of error.
3. Explain how the data support your claim.
Practical 7.3
limestone and carbon dioxide
Aim
To determine whether limestone is a store of carbon dioxide
Materials
• calcium carbonate chips (approximately 0.5 to 1 cm pieces)
• hydrochloric acid (1 mol L−1)
• limewater
• 10 mL measuring cylinders × 2
• test tubes × 2
• test-tube rack
• delivery tube
Method
Be careful
Wear appropriate personal protective equipment.
Wear safety glasses.
1. Using a 10 mL measuring cylinder, measure 5 mL of hydrochloric acid and pour it into one of the test tubes.
2. Using another 10 mL measuring cylinder, measure 5 mL of limewater and pour it into the other test tube.
3. Add three calcium carbonate chips to the hydrochloric acid, then quickly attach the bung of the delivery tube to this test tube, with the other end in the limewater solution.
4. Observe what happens to the limewater.
Results
Record your observations from the experiment in your science book.
Discussion: Analysis
1. Describe what happened to the limewater solution.
2. In this reaction, calcium carbonate was reacted with hydrochloric acid. Three products were formed. Two of those products were calcium chloride and water. Write a word equation for the reaction that includes the third product.
Discussion: Evaluation
1. Identify which part of the carbon cycle is modelled in this experiment.
2. Is it an appropriate model? Discuss the limitations of the methodology.
Conclusion
1. Make a claim about whether limestone is a store of carbon.
2. Support your statement by referring to your experimental observations and include potential sources of error.
3. Explain how your observations support your claim.
Quick check 7.8
1. Name one example of a fossil fuel.
2. Name the process in which fossil fuels are burned, releasing carbon dioxide back into the atmosphere.
3. State the scientific name and chemical formula for limestone.
In previous years, you would have studied both the water and rock cycle, which explain how water molecules and rock particles are cycled through various states over time. Other minerals such as nitrogen, phosphorus and sulfur, and gases such as oxygen, have their own cycles through which they flow on Earth.
Nitrogen is critical for all living things as it is an important component of nucleic acids and amino acids, the building blocks of proteins. It is the fourth most abundant element in living things after oxygen, carbon and hydrogen. Our atmosphere is composed of around 78% nitrogen gas (N2), and it can be found as nitrates (NO3 ) in the lithosphere, formed from the decomposition of organic matter and nitrification by bacteria in the soil.
Research the nitrogen cycle, and construct a table briefly outlining what happens during each of the six stages of the cycle, which are:
1. Nitrogen fixation
2. Transfer through the food chain
3. Ammonification
4. Nitrification
5. Uptake by plants
6. Denitrification
Consider where each process occurs and whether it contributes to an overall gain or loss in soil nitrates.
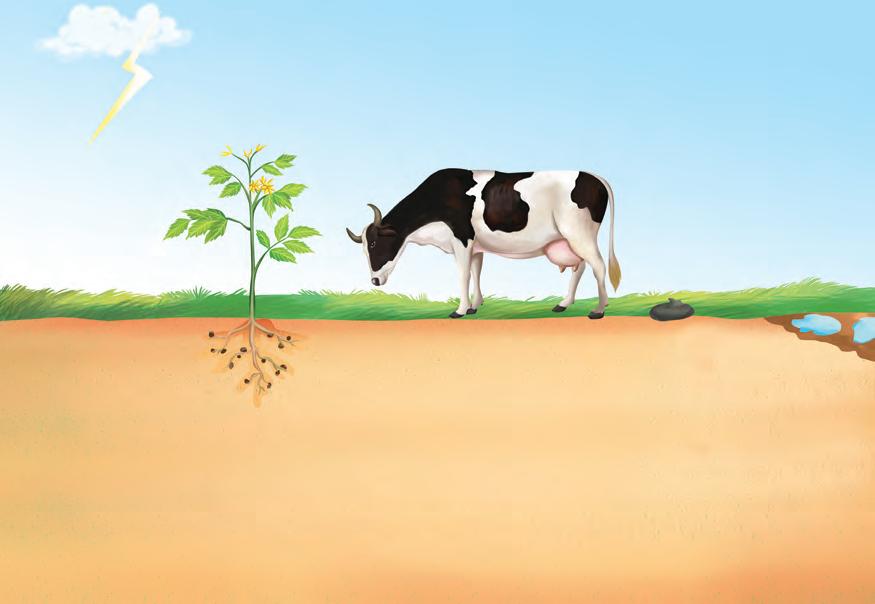
The water cycle is responsible for the recycling of water around the chemical spheres. Precipitation falls from clouds in the atmosphere. This water either joins the oceans or rivers in the hydrosphere or reaches the soil in the lithosphere. Plants take in water from the soil and then lose this water through transpiration. Thermal energy from the Sun returns water to the atmosphere as water vapour through the process of evaporation.
Condensation (2)

Precipitation (3)
Surface runoff (4)
Transpiration (1)
Percolation (5) Groundwater
Figure 7.27 The main stages in the water cycle
Section 7.2 questions
Remembering
a) Denitrification
b) Respiration
c) Decomposition
d) Transpiration
e) Combustion
3. Recall why plants and animals require carbon.


Evaporation (1)


1. Identify the cycle (carbon, nitrogen or water) that includes the following processes:
2. State the name and formula of a compound in which carbon is found in the atmosphere.
Understanding
4. Select, from the below choices, the best definition for a sustainable ecosystem and justify your choice.
a) An environment that requires intervention to continue
b) A biological environment that is self-sustaining
c) A system that consists of both biotic (living) and abiotic (non-living) factors
5. Summarise the role of decomposers in the carbon cycle.
Applying
6. Annotate a worded chemical equation to show why respiration is part of the carbon cycle.
7. Explain why the water cycle involves all four chemical spheres.
8. Explain where the carbon in coal, oil and gas originated.
Analysing
9. Infer what would happen to the carbon cycle if all human activities that emit carbon were suddenly stopped.
10. Categorise the following as either atmospheric carbon gains or atmospheric carbon losses
a) Formation of fossil fuels
b) Respiration
c) Excretion
d) Photosynthesis
e) The formation of limestone
f) Combustion
Evaluating
11. Hamish suggests that deforestation is affecting the carbon cycle in a negative way; however, his classmate Bodhi disagrees, saying the death of trees is a natural part of the cycle. State who you think is correct. Justify your answer.
12. Discuss how cultural burning practices stimulate plant growth and facilitate the transfer of energy through a food chain.

Learning goals
At the end of this section, I will be able to:
1. Recall four different greenhouse gases.
2. Compare the natural greenhouse effect and the enhanced greenhouse effect.
3. Describe how Aboriginal and Torres Strait Islander Peoples are reducing Australia’s greenhouse gas emissions through the reinstatement of traditional fire management regimes.
4. Identify how carbon dioxide is captured and stored naturally or through the use of technologies.
Earth naturally retains heat through a process similar to a man-made greenhouse (see Figure 7.28), but on a much larger scale. Most of the Sun's radiation enters Earth's atmosphere and warms the ground and oceans. Some of the radiation is reflected back into space by ice, clouds and water. However, the ground and oceans continue to emit radiant energy back towards the atmosphere in the form of infrared radiation. This infrared radiation is absorbed and reflected back towards Earth's surface by a layer of gases known as greenhouse gases. Water vapour (H2O) is the most abundant greenhouse gas, making up 95% of the total. Methane (CH4), carbon dioxide (CO2) and nitrous oxide (N2O) are three of the other most common greenhouse gases.
Did you know? 7.2
how greenhouses work
Greenhouses can be used to cultivate temperature-sensitive or out-of-season plants in colder climates. Greenhouses provide a protective shield against harsh weather conditions, and act to concentrate the heat from the Sun to meet the needs of specific plants. They are typically constructed from glass or plastic, which allows the solar radiation to pass through the walls and roof and heat the ground and air inside. The heated ground emits infrared radiation, which is reflected back into the greenhouse by the glass or plastic. The hot air rises, but cannot escape the greenhouse, increasing the temperature inside and promoting plant growth.


7.29 The Sun emits radiation, which passes through the atmosphere.
Table 7.5 compares the effectiveness in retaining heat of the three most common greenhouse gases after water vapour. Methane is more effective than carbon dioxide at trapping heat because it has a higher global warming potential, meaning it can absorb more heat per unit of mass than CO2 However, CO2 is much more abundant in the atmosphere and has a longer lifespan, so overall it has a greater impact on global climate.
Proportion of greenhouse gas once water vapour is excluded (%)
Persistence in the atmosphere 100 years 10 years 100 years
Effectiveness at trapping heat compared to carbon dioxide 30 times more effective 300 times more effective
Table 7.5 A summary of the three most common greenhouse gases, excluding water vapour
The process by which the Sun's solar energy is trapped in Earth's atmosphere is known as the greenhouse effect. The Sun's radiation, primarily in the visible light wavelength, can directly pass through the atmosphere because it is short wave. However, long-wave radiation emitted from the ground and oceans in the form of infrared radiation is absorbed by greenhouse gases, keeping the Earth warm. Without this conversion of solar radiation to infrared radiation, Earth would lose its thermal energy back into space, making the planet less habitable. The greenhouse effect maintains a consistent average temperature that is crucial for the survival of organisms on Earth. Earth's average temperature is 14°C. Without the natural greenhouse effect, this temperature would decrease to −18°C.

enhanced greenhouse effect the intensifying of the natural greenhouse effect due to human activity
global warming the long-term rise in the average temperature on Earth, primarily caused by the increase of greenhouse gases in the atmosphere
Greenhouse gases can absorb a certain amount of infrared radiation; the rest is radiated back into space. The more greenhouse gases there are in the atmosphere, the more infrared radiation is trapped and reflected back to Earth, and the hotter Earth becomes.
greenhouse effect
Some infrared radiation escapes into space
sun emits radiation
gas
Infrared radiation is absorbed and re ected by greenhouse gases
Some radiation is absorbed and heats up the ground and oceans
Enhanced greenhouse effect
LESS infrared radiation escapes into space MORE infrared radiation is re ected back to Earth
Quick check 7.9
1. State the name and formula of one common greenhouse gas.
2. Most of the radiation emitted from the Sun heats the ground and the oceans. Explain what happens to the rest of this radiation.
3. Name a source of short-wave radiation.
4. Name the radiation that is absorbed by greenhouse gases in the atmosphere.
Table 7.6 summarises the features of solar and infrared radiation.
Source Sun Sun, ground and oceans
WavelengthShort Long
Trapped or notNot trapped by atmosphereTrapped by greenhouse gases in atmosphere
Table 7.6 Features of solar and infrared radiation
The enhanced greenhouse effect (right hand side of Figure 7.30) is a phenomenon in which human activities, such as burning fossil fuels and deforestation, release large amounts of greenhouse gases, such as carbon dioxide, into the atmosphere. These gases trap more heat from the Sun, which increases the temperature of Earth's atmosphere and surface, leading to global warming.
The major cause of the enhanced greenhouse effect is increased concentrations of greenhouse gases (carbon dioxide, methane, nitrous oxide and water vapour) in the atmosphere. Table 7.7 summarises how humans have contributed to the increased levels of these greenhouse gases.
Greenhouse gasHow humans have increased its concentration in the atmosphere
Carbon dioxideBurning fossils fuels such as coal, oil and gas. Currently, 70% of Australia’s electricity is produced by burning coal.

MethaneFarming cattle (which produce methane when they digest grass) and growing rice in paddies. Increased temperatures lead to the melting of permafrost. Permafrost is frozen soil that contains trapped methane produced from the decomposition of plants and animals.
Nitrous oxideUsing fertilisers that increase the amount of nitrogen in the nitrogen cycle, which increases the production of nitrous oxide.
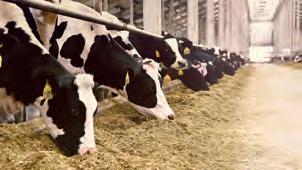

Water vapourAlthough water vapour is naturally the most abundant greenhouse gas, as the concentrations of carbon dioxide, methane and nitrous oxide increase due to human activity, more heat is trapped, which contributes to increasing water vapour concentrations (increased humidity). This has a positive feedback effect on increasing temperatures, enhancing the greenhouse effect.

Table 7.7 How humans have increased the concentration of greenhouse gases in the atmosphere
Global Greenhouse Gas Monitoring Infrastructure
In 2023, the United Nations announced that it had created a new Global Greenhouse Gas Monitoring Infrastructure. The infrastructure will integrate space and Earth surface-based observation systems, and aims to provide real-time tracking of greenhouse gases to help inform policy choices. The platform will address uncertainties about the emission of greenhouse gases and provide faster and more accurate data on the state of the planet’s atmosphere. What are the advantages to this new infrastructure?
Did you know? 7.3
A book published in 2010 popularised the idea that reducing the number of emails sent could have a significant impact on greenhouse gas emissions. The book stated that an average person’s yearly email use generates 3–40 kg of carbon dioxide and other greenhouse gases, which is comparable to driving 16–206 km.
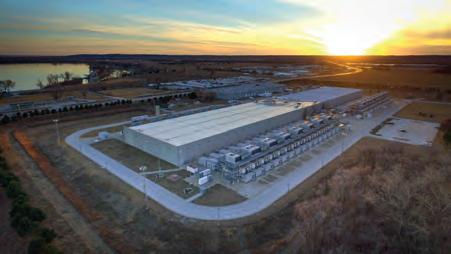
Figure 7.31 Digital data storage and transmission centres, like this Google-owned one in Iowa, United States, operate continuously. They use a constant amount of energy, regardless of whether an email is sent or not.
While deleting 1000 emails would save about 5 g of CO2, manually deleting them on a laptop for 30 minutes emits 28 g of CO2. This means that manually deleting emails can have a greater carbon impact than just storing them, because deleting them consumes more energy from using the computer.
In reality, the carbon footprint of sending emails is difficult to quantify and the numbers constantly change due to improving data transmission and storage efficiency. The carbon values for emails seem small, and reducing the number of emails sent or deleting them may not significantly reduce energy consumption as digital data storage and transmission systems operate continuously. Instead, reducing the carbon footprint of email use can be achieved by using electronic devices that consume less electricity and retaining them for as long as possible.
1. State one way humans have increased the concentration of carbon dioxide in the atmosphere.
2. State one way humans have increased the concentration of nitrous oxides in the atmosphere.
3. State one outcome that the enhanced greenhouse effect is leading to.
Investigation 7.1
Comparing the natural and enhanced greenhouse effects
Aim
To compare the impacts of the natural and enhanced greenhouse effects
Hypothesis
Read the experimental method and then construct an appropriate hypothesis regarding the contents of the beakers and the expected temperature change, using the ‘If ... then ...’ framework.
Materials
• baking soda
• water
• vinegar
• 500 mL beakers × 2
• 100 mL measuring cylinder
• cling wrap
• elastic bands × 2
• weighing boats × 2
• balance
• marker pen
Be careful
Take care when handling the lamp because it can become hot with prolonged use.
Wear heat-resistant gloves.
• sticky tape
• stopwatch
• thermometers × 2
• high-intensity lamp
• heat-resistant gloves
Method
Part 1: Prepare the results table
1. Read the rest of the steps in the method and make a prediction about what will happen.
2. Create an appropriate results table for this experiment.
Part 2: Prepare the equipment
1. With the marker pen, label one of the 500 mL beakers ‘Control’.
2. Using the sticky tape, tape one of the thermometers to the inside of this beaker. It must be about 5 cm above the bottom of the beaker.
3. With the marker pen, label the second beaker ‘CO2’.
4. Tape the thermometer to the inside of this beaker, again making sure it is 5 cm from the bottom.
5. Prepare the cling wrap and elastic bands for sealing; you will cover each beaker immediately after you have poured in the liquid.
Part 3: Collect the data
1. Using the balance, weigh 35 g of baking soda into each weighing boat and pour it into each beaker.
2. Using the 100 mL measuring cylinder, measure 65 mL of water and pour it into the control beaker. Immediately cover it with the cling wrap and elastic band.
3. Using the same 100 mL measuring cylinder, measure 65 mL of vinegar and pour it into the CO2 beaker. Immediately cover it with the cling wrap and elastic band.
4. Swirl the contents of each beaker to make sure that the baking soda has fully dissolved.
5. Place both beakers underneath the lamp.
6. Record the starting temperature of each atmosphere before the lamp is turned on.
7. Turn on the lamp and start the stopwatch.
8. Measure the temperature in each beaker every 2 minutes for 8 minutes. Record the temperatures in your results table.
9. At 8 minutes, measure the temperature and then turn off the light.
10. Record the final temperature 2 minutes later.
Discussion: Analysis
1. Calculate the increase in temperature in each container, by subtracting the initial temperature from your measurement after 8 minutes. State which container showed the greatest increase in temperature.
2. Calculate the thermal energy retention by finding the difference in temperature at the 8-minute mark compared to at 10 minutes. State which container retained the most thermal energy in the final two minutes.
Discussion: Evaluation
1. Did the results of your experiment align with your knowledge of the enhanced greenhouse effect?
2. Is this experiment an appropriate model for the enhanced greenhouse effect? Discuss the limitations of the methodology.
Conclusion
1. Make a claim about the enhanced greenhouse effect based on this experiment.
2. Support your statement by using the data you gathered, and include potential sources of error.
3. Explain how the data support your claim, and justify whether your hypothesis was supported or not.
Does land or water warm faster?
Aim
To determine whether land or water heats up faster
Hypothesis
Construct an appropriate hypothesis for this experiment using the ‘If … then …’ framework.
Materials
• thermometers × 2
• plastic containers × 2 (same size and shape)
• sand
• water
• lamp
Method
1. Copy the results table into your science book.
2. Pour sand into one container to a depth of 5 cm, and water into the other container to a depth of 5 cm. These containers will represent ‘land’ and ‘water’.
3. Using a designated thermometer for each material, record the initial temperature and record it in the table at time = 0.
4. Place the two containers 10 cm either side of the lamp and switch it on.
5. Start the stopwatch and record the temperature of each container every 2 minutes for 10 minutes. Then turn off the lamp.
6. Record the temperature of each container every 2 minutes for a further 10 minutes.
Results
Copy and complete the following table.
Table showing the temperatures of each container over time, with heating and after heating
Discussion: Analysis
1. Plot a line graph of the data, with time in minutes on the horizontal axis and temperature of the materials on the vertical axis. You will need one line for ‘land’ and one line for ‘water’.
2. Which substance heated up the fastest?
3. Which substance retained heat the best?
1. With reference to your experimental data, explain how your results support your understanding of the greenhouse effect.
2. Is this experiment an appropriate model for the greenhouse effect? Discuss the limitations of the methodology.
Conclusion
1. Make a claim about whether land or water heats up faster based on this experiment.
2. Support your statement by using the data you gathered, and include potential sources of error.
3. Explain how the data support your claim, and justify whether your hypothesis was supported or not.
A carbon footprint is the volume of greenhouse gases (including carbon dioxide) emitted into the atmosphere as a result of the actions of a specific individual, event, organisation or product.
• Search online for a reliable carbon footprint calculator. Suggested websites include the United States Environmental Protection Agency or the Global Footprint Network.
• Gather information on your daily habits such as transportation, energy usage, diet and waste management.
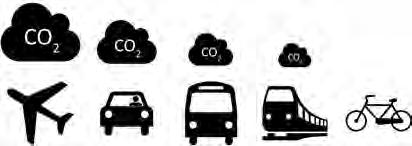
• Use the carbon footprint calculator to input your daily habits and activities. The calculator will provide you with an estimate of your carbon footprint in metric tonnes.
• Analyse your carbon footprint results and identify areas where you can reduce your carbon emissions. For example, you can consider walking or riding a bicycle instead of travelling to school in the car, reducing energy consumption at home, or reducing waste.
Try
reducing carbon footprints
Plan a social media campaign to encourage young people to reduce their carbon footprint.
• Consider the most appropriate social media platform for your audience, and the format of the campaign. For example, would a video/reel be more engaging than a post? Should the campaign be targeted from the perspective of an expert scientist or a well-known celebrity or influencer? Are you going to encourage young people to reduce their footprint in a certain area, such as transport or technology use at home?
• Ensure you access high-quality sources for your information and present it in a visually effective way. Draft a proposal for the campaign. This could include your slogan, hashtags, a mock-up of images and the scientific facts you will include.
Carbon dioxide emissions from human activity are the most significant contributor to the enhanced greenhouse effect. Since the Industrial Revolution in the 1800s, we have been burning large amounts of fossil fuels for energy. This means we have been moving stored carbon from the lithosphere into the atmosphere, directly affecting the balance of the carbon cycle.
As part of the carbon cycle, Earth has carbon sources, which are processes or areas that release carbon (such as the atmosphere), and carbon sinks, which are areas where carbon is stored (such as the oceans, forests or fossil fuels).
Burning fossils fuels and releasing their stored carbon is a problem because the carbon cycle does not have enough carbon sinks to remove the excess carbon from the atmosphere. Fossil fuels take millions of years to form, and Earth's carbon sinks cannot remove enough carbon dioxide to prevent it from building up in the atmosphere. The accumulation of carbon dioxide in the atmosphere is increasing Earth's greenhouse effect.
Bushfires and greenhouse gases
Bushfires are a significant contributor to greenhouse gas emissions, because the amount of fuel consumed in the blaze is directly proportional to the amount of carbon dioxide released into the atmosphere. Satellites such as NASA's Earth Observing System (EOS) carry equipment that detects thermal anomalies and fires, and the data collected allows scientists to track how the frequency and intensity of wildfires is changing over time. Other satellites detect atmospheric carbon dioxide concentration, and other greenhouse gases.
In Australia, the highly destructive and intensely hot fires tend to occur during the summer months when the accumulated fuel load is highest. As previously discussed, the cultural burns used by Aboriginal and Torres Strait Islander Peoples are traditionally undertaken during the cooler months. This produces less intense fires, as the night-time dew partially extinguishes the flames. The patchwork of carefully burnt areas provides natural fire breaks and reduces the fuel load, preventing the spread of future catastrophic wildfires. Frequent fires also result in plant regrowth (which sequesters [stores] carbon from the atmosphere), balancing the emissions from the fire itself.
Many state governments are now working with Traditional Owners to support the continuation of cultural fire practices that have been used to care for Country for tens of thousands of years. Aboriginal ranger groups and local land councils apply deep knowledge of landscapes, seasons and ecological relationships to fire management. Technology such as satellite vegetation and fire mapping can complement these practices, helping to monitor and document their effectiveness. Through the Emissions Reduction Fund, these efforts are recognised for their role in reducing carbon emissions, strengthening cultural governance and self-determination in land management.
Figure 7.33 Satellite data depicts the extent and frequency of fires (1988–2019). Despite their lower frequency, fires that occur in carbon-dense temperate grassland areas (outlined in red) release more carbon dioxide into the atmosphere than fires that occur in the (black outlined) savanna regions, which are adapted to frequent burns.
Uncorrected


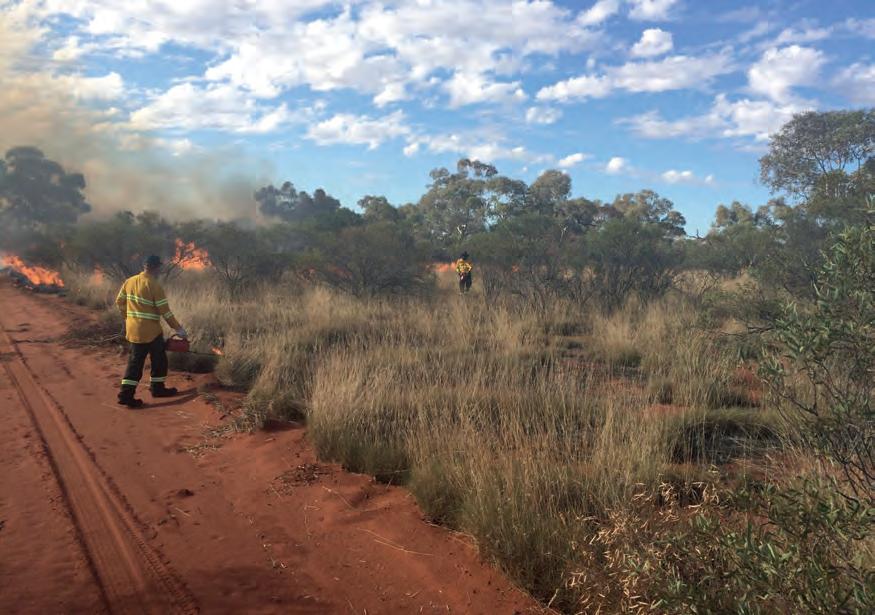
Quick check 7.11
1. Contrast a carbon source and carbon sink, giving two examples of each.
2. State the primary greenhouse gas emitted during bushfires.
3. Explain how traditional Aboriginal fire management practices can reduce greenhouse gas emissions.
Carbon sequestration refers to the process of capturing carbon dioxide from the atmosphere and storing it in long-term carbon sinks. This occurs naturally in forests and oceans, or can be accelerated through the use of technology.
Forests are one of the most significant carbon sinks on Earth. As plants grow, carbon dioxide is absorbed from the atmosphere and used to build new plant cells (a form of biomass) via photosynthesis. Trees store carbon in their trunks, branches, leaves and roots, where it remains for many years. Tropical rainforests are known for their high carbon-storage capacity due to their dense vegetation and high rates of photosynthesis.
Biomass surveys can be undertaken in the field; however, new technologies are emerging that allow scientists to estimate the carbon storage of different vegetation types (above-ground biomass versus below-ground biomass). Satellite imagery and LiDAR (light detection and ranging) data provide measurements of canopy height, and drone-based aerial photography can be used to estimate percentage vegetation cover. Algorithms allow for this data to be translated into an estimate of above-ground biomass. Below-ground biomass is typically estimated at around 50% of the aboveground estimate.
DOC
WORKSHEET
Carbon sequestration
carbon sequestration the process of storing carbon in a carbon sink biomass the material produced by the growth of plants, animals and microorganisms
Trees can sequester carbon. Scientists estimate that the average tree can sequester 25 kg of CO2 per year, to an average of 250 kg over its lifetime. However, the rate of carbon sequestration depends on factors such as species, growth characteristics, wood density, location and stage of growth. By measuring the diameter and height of a tree, you can estimate the amount of carbon stored in its biomass. You can also determine carbon sequestration by measuring deadwood, leaf litter and soil depth.
Aim
To evaluate carbon sequestration in an ecosystem, using tree biomass
Materials
• tape measure
Method
1. Select the study site. Choose a suitable ecosystem for the investigation, such as a forest or grassland. Ensure that the area has not undergone any major disturbances, such as logging or fires, that could affect the accuracy of the results.
2. Divide the study area into manageable sections and select sampling points within each section. These points should be evenly distributed and representative of the entire area.
3. Copy the following table.
Table showing the features of trees that can be used to estimate biomass
aCircumference (cm)
b Age ( circumference growth rate )
cDry rate (kg)
(see conversion table)
dCarbon stored (kg)
a) Use a tape measure to measure the circumference of a tree at a height of 1.3 m (approximately chest height) from the ground.
b) Trees grow at different rates, but on average the circumference increases by approximately 2.5 cm per year. Divide the circumference by 2.5 to calculate the tree’s age.
c) Use the following conversion table to convert the circumference of the tree into the dry weight.
d) Half of a tree’s dry weight is carbon, so divide the dry weight by 2 to determine how much carbon is stored in the tree.
Example: A tree has a circumference of 100 cm. Its dry weight is approximately 668 kg. Dividing this value by 2 tells us that the tree is storing approximately 334 kg of carbon.
A team of local scientists have approached you to provide some estimates regarding the above-ground biomass in a local temperate forest ecosystem.
1. Consider what would be an appropriate sample size for this extended investigation.
2. How might digital tools enable more efficient data collection for this extended investigation?
Figure 7.35 shows the distribution of terrestrial carbon by ecosystem type in above-ground (top) soil, subsoil, and above and below-ground plant biomass.
1. Identify the forest type that stores the most carbon in its soil.
2. Determine the ecosystem that has approximately half of the soil organic carbon of the cool temperate moist ecosystem.
3. Determine the approximate organic carbon found in the plant biomass of a tropical moist ecosystem.
4. Identify any general relationship in the data.
5. Sequence the following ecosystems in order of total carbon, from most to least: boreal moist, polar dry, tropical dry, warm temperature moist, cool temperate dry.
6. Can the data in Figure 7.35 be used to justify the following statement? ‘Tropical ecosystems sequester more carbon.’
Oceans are another natural carbon sink. When carbon dioxide dissolves in seawater, it forms carbonic acid (H2CO3) and bicarbonate ions (HCO3–), which then react with other ions in the water to form carbonate ions (CO32–). The carbonate ions can then combine with calcium ions (Ca2+) to form calcium carbonate (CaCO3), which is the main component of the shells of marine organisms. When marine organisms die, their bodies sink to the ocean floor, taking the stored carbon with them.
The ocean can also directly absorb carbon dioxide from the atmosphere, and scientists estimate that it can absorb and store about 25% of the carbon dioxide released into the atmosphere by human activities. However, the ocean's ability to act as a carbon sink is not unlimited. Colder water is more effective at dissolving and absorbing carbon dioxide than warmer water. The ocean's coldest waters contain a large amount of dissolved carbon dioxide, which can be stored for long periods when the cold water sinks to the deep sea. However, as the oceans warm up, they are becoming less efficient at absorbing carbon dioxide and may even release it back into the atmosphere more quickly. Another issue is that, as more carbon dioxide is taken up by the ocean, the water can become acidic, which is harmful to the marine organisms that rely on calcium carbonate to build their shells.
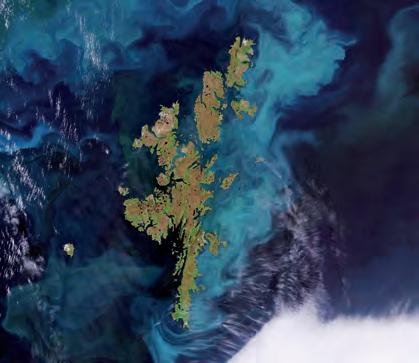
Figure 7.36 The image shows the Shetland Islands, a group of about 100 islands and islets north of Scotland. The turquoise-coloured bloom visible to the east is a coccolithophore bloom, a type of microscopic marine algae that multiplies rapidly near the surface and sheds calcium-rich coccoliths, turning the water a bright, milky-turquoise colour. These shells sink to deeper ocean depths after they die, storing carbon in the process.
Carbon sequestration can also occur in soil. When a plant dies, its stored biomass is deposited into the soil where it can be stored. Peatlands (see Figure 7.37) are a particularly important ecosystem for carbon sequestration, as they accumulate organic matter in the form of partially decomposed plant material called peat. This occurs under waterlogged conditions where oxygen is limited, resulting in a slow rate of decomposition and long-term carbon storage. If peatlands are disturbed through agriculture or development, the peat is exposed to oxygen and will decompose, releasing carbon dioxide into the atmosphere.
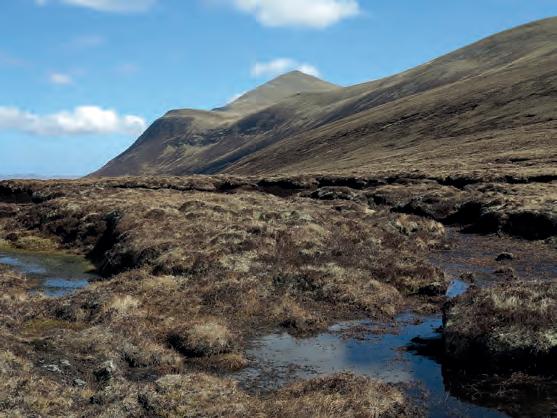
1. Explain how plants remove carbon dioxide from the atmosphere. 2. State which is more effective at storing carbon dioxide, cold water or warm water? 3. Outline how the conditions in peatlands maximise carbon storage.
Landcare is a community organisation that aims to improve the health of the land and waterways in Australia by promoting sustainable land use and management practices. Established in the late 1980s, Landcare brings together farmers, landowners, natural resource managers and community members to collaborate on local projects that address issues such as soil erosion, water quality, biodiversity loss and carbon sequestration. Landcare is supported by the Australian Government, which provides funding and other resources. Landcare has become a widely recognised and respected initiative that has made significant contributions to environmental sustainability in Australia.
Examine how government initiatives such as Landcare have supported the adoption of effective land restoration practices that improve soil quality and increase carbon sequestration in soils.
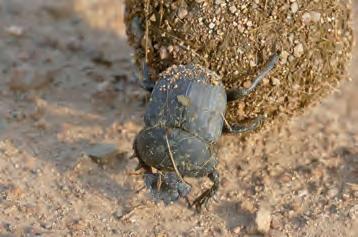
7.38 A Landcare-funded project between CSIRO and local farmers is investigating the benefits of introducing dung beetles to Far North Queensland. Researchers are studying the behaviour of dung beetles in the region (e.g. their preferred habitats and the types of dung they prefer) and examining the economic benefits of dung beetle introduction (e.g. increased farm productivity and reduced fertiliser costs).
As carbon dioxide emissions continue to rise, a variety of technologies are being developed for carbon capture. Once captured, the carbon dioxide can be compressed and transported to a storage or utilisation site where it can be used across a wide range of industries. In the oil industry, it can be injected into oil reservoirs to enhance oil recovery. In the chemical industry, it can be used as a raw material to produce chemicals and plastics. In the food industry, it can be used to carbonate beverages.
Carbon capture technologies, such as those shown in Figure 7.39, have the potential to significantly reduce carbon emissions and help slow the pace of climate change. However, there are still significant challenges that must be overcome to make large-scale carbon capture readily available.
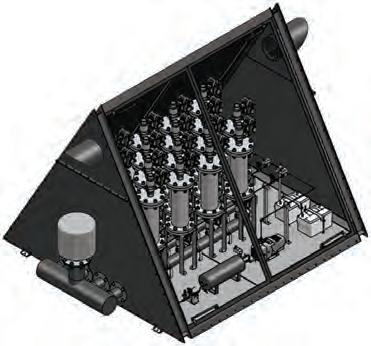
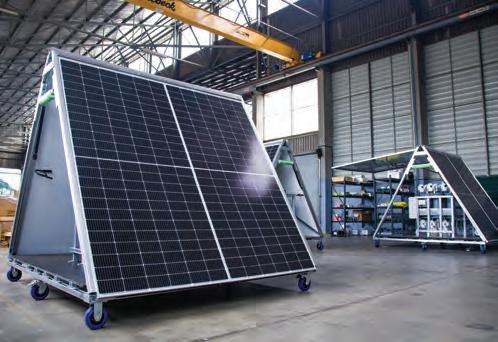
Post-combustion capture
Pre-combustion capture
CO2 from flue gases is captured after fossil fuels are burned in power plants or industrial facilities.
Fossil fuels are converted into a gas. The gas is then treated to remove CO2 before being burned.
Oxyfuel combustionFossil fuels are burned in pure oxygen instead of air. The resulting gas is almost pure CO2, which can be readily captured.
Carbon mineralisation CO2 is reacted with certain types of minerals to produce stable carbonates. The carbonates can then be stored underground or used in building materials.
Direct air captureMachines directly capture CO2
Table 7.8 Some carbon capture technologies
Storing carbon using technology
Once captured, carbon dioxide can be stored in a variety of ways.
• Geological storage. CO2 is injected into underground rock formations, such as depleted oil and gas reservoirs. In enhanced oil recovery, CO2 is injected into oil reservoirs to recover more oil. The CO2 is stored in the reservoir.
• Ocean storage. CO2 is injected into the ocean, where it can dissolve and be stored in the deep ocean.
• Mineral storage. CO2 is reacted with certain types of minerals to produce stable carbonates, which can then be stored underground.
CO2 driven enhanced oil recovery
CO2 injection into deep saline formations and depleted oil and gas reservoirs

CO2 Depleted oil or gas reservoirs

CO2


CO2
Saline reservoirs Oil reservoirs
Figure 7.40 Injecting CO2 underground can help increase oil recovery (left) or allow it to be stored underground in depleted oil and gas reservoirs (right).
1. Describe some of the ways carbon dioxide can be stored once it has been captured.
2. State which carbon capture technology recovers more carbon dioxide by burning fuels in pure oxygen.
Section 7.3 review Go
Section 7.3 questions
Remembering
1. Name three gases in the atmosphere that are responsible for the greenhouse effect.
2. Define the term ‘enhanced greenhouse effect’.
3. State the types of radiation important in the greenhouse effect emitted from the:
a) Sun
b) ground and oceans.
4. Recall the sources of methane in the atmosphere.
5. Define carbon sequestration.
6. State the main chemical component of marine organism shells.
Understanding
7. Explain the differences between the natural and enhanced greenhouse effects.
8. Explain why the following statement is incorrect: ‘The greenhouse effect is caused by humans.’
9. Explain how a greenhouse mimics the greenhouse effect.
Applying
10. The sun emits visible light, ultraviolet radiation and infrared radiation. Explain which energy type is responsible for causing sunburn, and which energy type is reflected to create the greenhouse effect.
11. Illustrate a diagram to show how the greenhouse effect keeps Earth warm.
12. Compare solar radiation and the radiation emitted by the Earth.
13. Describe the consequences of ocean warming on ocean carbon sequestration.
Analysing
14. Contrast pre-combustion and post-combustion carbon capture.
15. Contrast carbon sinks and carbon sources, giving examples.
Evaluating
16. Predict what the conditions on Earth would be like without greenhouse gases and the greenhouse effect.
17. Decide why our focus related to the enhanced greenhouse effect is on carbon dioxide and not on the other greenhouse gases.
18. Propose reasons why, even though we have known about the damaging effects of carbon emissions for a long time, Australia still produces 70% of its electricity from coal.
19. Discuss the reasons why the carbon cycle is altered by the release of carbon emissions from burning fossil fuels.
20. Discuss how forests could be managed to maximise carbon sequestration.
At the end of this section, I will be able to:
1. Recall the difference between weather and climate.
2. Identify the changes in global climate over time, and provide evidence of these changes.
3. Explain the role that deep ocean currents have on global climate.
4. Outline the human influences on climate change.
5. Describe how we can collect data and predict changes to the Earth system.
6. Identify strategies used to reduce climate change or mitigate its impacts.
The difference between weather and climate is merely the time frame. Weather describes the conditions of the atmosphere in terms of temperature, cloud, rain and wind over a short period of time (minutes to months). The climate of an area is how the area behaves over a much longer period of time, usually 30 or more years. Different areas can have different climates; for example, the climate in Victoria is very different from the climate in Queensland.
Different areas of the world have differing climates due to the:
• uneven distribution of the Sun's rays because of the curvature of the Earth
• proximity to the sea; land takes less energy to heat than water, so land temperatures rise quickly during the day and fall quickly during the night. The sea tends to remain cool during the day but retains its warmth at night
• tilt of Earth's axis, which causes seasons
• type of soil or plant life
• features on the land such as mountains. Air cools when it expands so when air passes over a mountain its temperature drops. This is why mountain tops are often covered in snow or cloud.
Did you know? 7.4
the East Coast low
Eastern Australia experiences more storms in summer because of the presence of a weather pattern called the East Coast Low (ECL). An ECL is a low-pressure system that forms along the eastern coast of Australia, particularly in summer, bringing heavy rainfall and strong winds. ECLs are a result of warm ocean temperatures, high-pressure systems and the coastal topography of eastern Australia. These conditions provide the energy and moisture needed to generate intense storms, making the region particularly vulnerable to severe weather events during the summer months.

Most of the Sun's radiation is absorbed by the ocean, particularly in tropical waters. The ocean plays a critical role in Earth's climate system as it doesn't just store heat, it also distributes it around the globe.
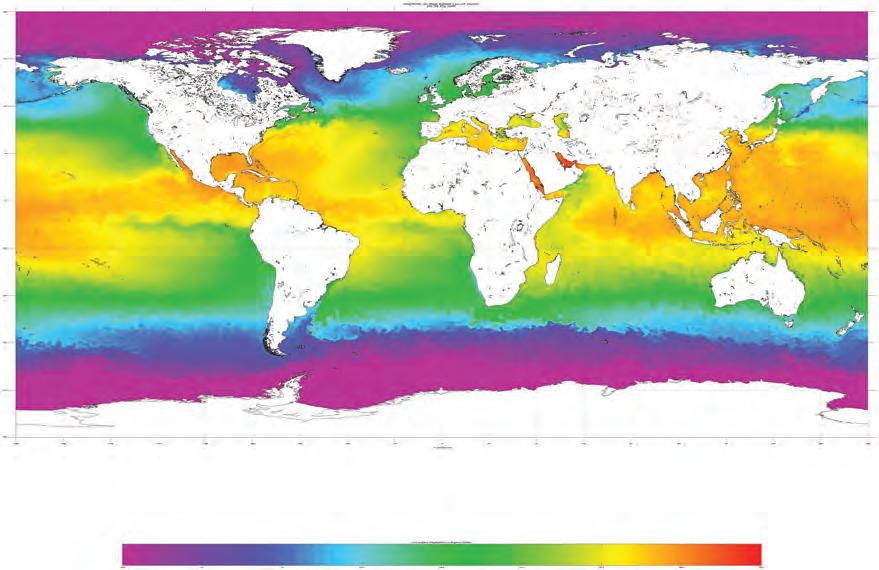
Figure 7.42 Global sea-surface temperatures taken from the National Oceanic and Atmospheric Administration (NOAA) Office of Satellite and Product Operations. The colourmap ranges from −2.0°C (purple) to 34.6°C (red).
Evaporation is a key component of this heat exchange. When ocean water absorbs the Sun's radiation, it heats up and evaporates into the atmosphere, leading to an increase in temperature and humidity. This increased humidity then condenses into clouds, which can lead to stormy weather. Storms are carried by trade winds and travel long distances, distributing heat and moisture around Earth. This exchange of heat and moisture between the ocean and the atmosphere helps to regulate the global climate.
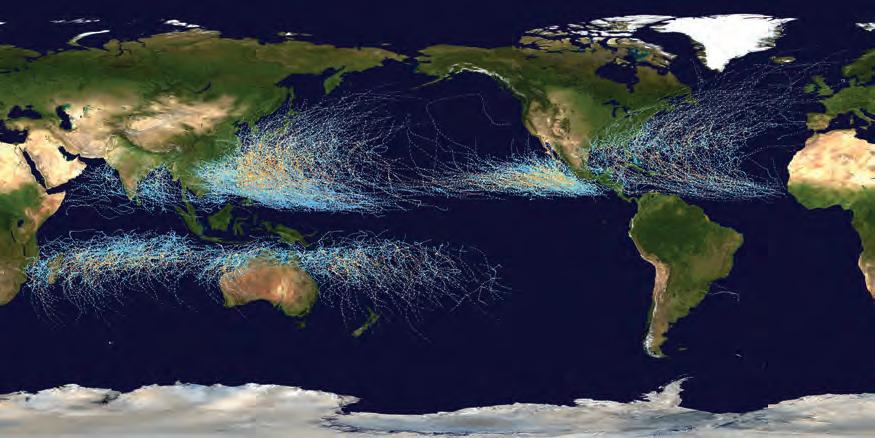
Deep ocean currents play a significant role in driving weather patterns, especially in areas away from the Equator. Ocean currents are influenced by a complex interplay of factors, including wind, temperature gradients, salinity, Earth's rotation and tides. They help regulate global temperature by transporting heat from the Equator to the poles. This transfer of heat helps distribute the warm Equatorial waters to the colder polar regions, balancing the temperature difference between the two regions. If the ocean currents were not present, the equatorial regions would experience extremely high temperatures, while the polar regions would experience extreme cold, making much of Earth inhospitable to life.
The major ocean currents typically form circular patterns, flowing clockwise in the Northern Hemisphere and anticlockwise in the Southern Hemisphere, mainly following coastlines. By distributing heat, ocean currents can affect local and regional climates, as well as playing a major role in the global climate system. Deep ocean currents also move water and nutrients from the ocean's surface to its depths, helping to improve the overall health and productivity of oceanic ecosystems.
Quick check 7.14
1. Define the term ‘weather’.
2. State one reason why climates on Earth differ.
3. Describe how deep ocean currents regulate global temperatures.
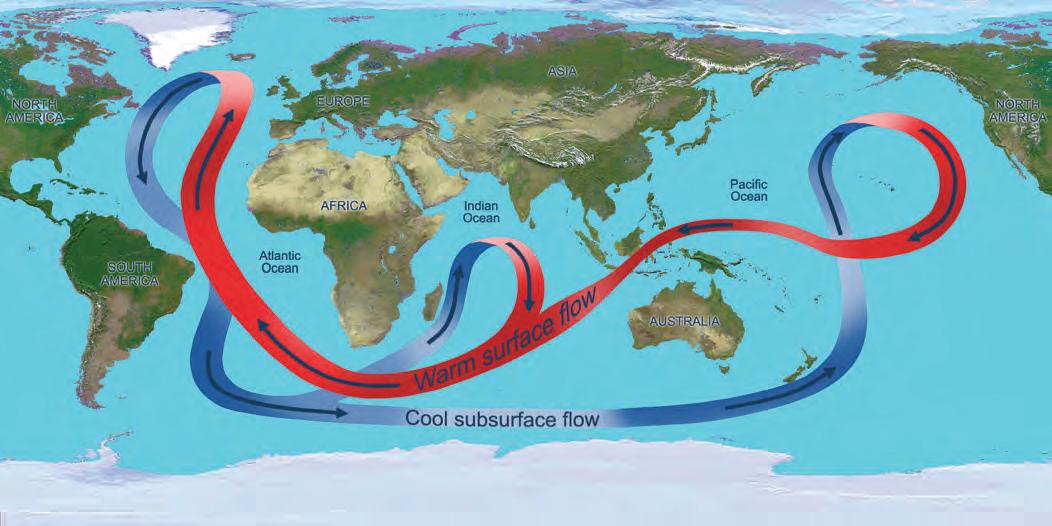
Figure 7.44 The most well-known deep ocean current is the thermohaline circulation, also known as the ‘global conveyor belt’. This current carries warm water from the tropical regions to the colder regions in the North Atlantic, releasing heat into the atmosphere, and then returns as cold, dense water to the equatorial regions to start the cycle again. This heat exchange has a significant impact on the climate of regions far from the Equator and helps to distribute heat throughout Earth’s surface, leading to a more stable global climate.
Climate change occurs when a significant change to normal weather patterns has been sustained for a long time – between tens and millions of years. Climate change can occur due to natural causes, such as changes in the Sun's intensity, volcanic eruptions and variations in ocean currents.
Earth's climate is dynamic and has undergone significant changes throughout history. In the past, Earth has experienced many ice ages, where the planet was far colder than it is today, as well as warmer periods, when temperatures were higher than they are today.
A glacial period is when a reduction in global temperatures is sustained for a long period of time. The last glacial period started around 115 000 years ago and ended around 11 700 years ago. During this period, sea levels were much lower than now due to the presence of vast ice sheets. As a result, it was possible to walk from Tasmania to mainland Australia across a land bridge. However, as sea levels rose, the land bridge was submerged, creating the Bass Strait.
We are currently experiencing an interglacial period, and Earth's climate has remained relatively stable throughout this period, with only small fluctuations. However, the current rate of global warming is much faster than the natural climate change observed in the past and is being caused by human activities. This is known as anthropogenic climate change.
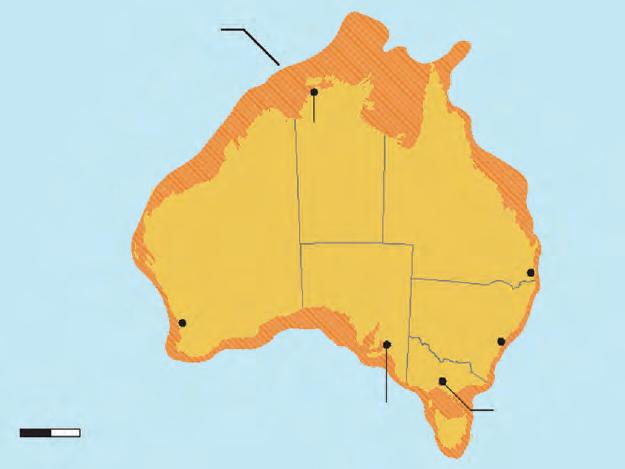
Australia’s coastline during the coldest part of the last ice age, 20000 years ago, when the sea level was about 120 metres lower than today.
500 km
Figure 7.45 In the last ice age, ice sheets locked up much of Earth’s water, making the coastline of every continent far lower than it is today.
Interglacial periods Glacial periods
7.46 Earth has undergone natural cycles of warming and cooling.
Scientific consensus about global warming
There is overwhelming evidence that human activities are the primary cause of climate change. This evidence comes from multiple sources, including observations of rising temperatures, melting ice caps and changes in weather patterns. Scientists have also developed sophisticated computer models that simulate Earth's climate and have used these models to project future climate scenarios. These projections consistently show that if greenhouse gas emissions do not stop increasing, Earth's temperature will continue to rise.
The scientific community has reached a consensus on these issues through a rigorous process of peer-reviewed research and analysis. This is based on thousands of studies conducted by scientists from around the world and is supported by professional scientific organisations such as the Intergovernmental Panel on Climate Change (IPCC).
glacial period a period in Earth’s history when a reduction in global temperatures is sustained for a long period
interglacial period a period in Earth’s history when an increase in global temperatures is sustained for a long period anthropogenic caused or influenced by people
Media headlines regarding the concentration of carbon dioxide in the atmosphere or temperature fluctuations over time can be misleading. As critical consumers, we need to evaluate the validity of the information, by considering the credibility of the authors and the methodology of their research. Anthropogenic climate change is linked to the burning of fossil fuels, deforestation and industrial processes. The release of greenhouse gases, such as carbon dioxide, methane and nitrous oxide, into the atmosphere is the primary cause of this accelerated climate change. These gases trap heat from the Sun in Earth's atmosphere, leading to a faster warming of the planet. Over the past 100 years, Earth's average temperature has risen between 0.4°C and 0.8°C; 2023 was the hottest year and 2016 and 2020 tied as the second hottest since records began. The years since 2014 have been the warmest years on record.
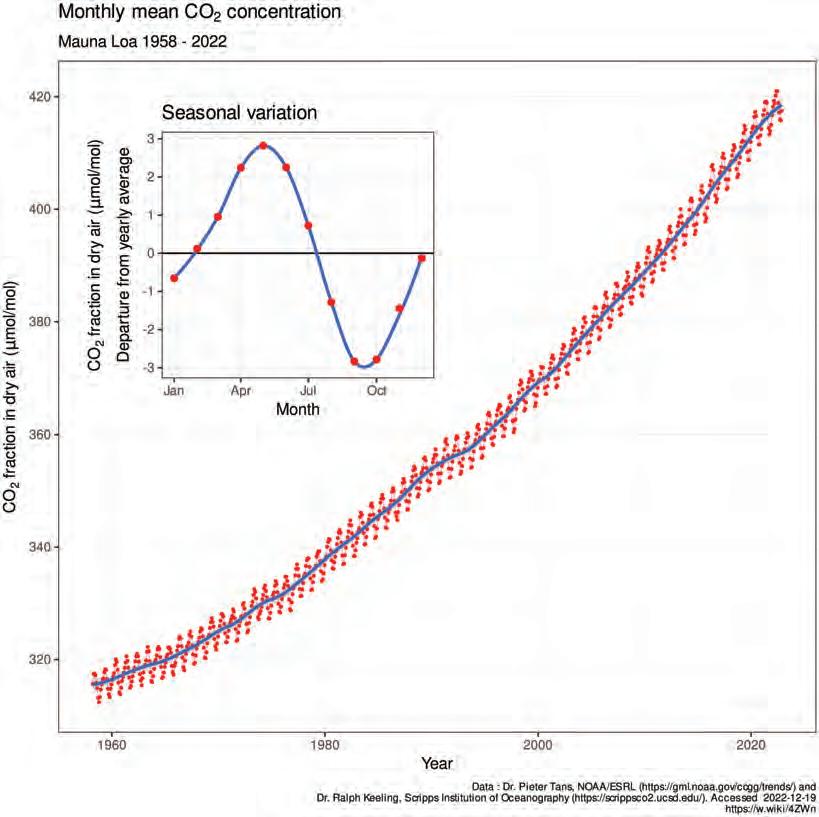
Figure 7.47 The changes in energy balances, such as the burning of more fossil fuels, have contributed significantly to global climate change. The Keeling curve shows the concentration of carbon dioxide in parts per million (ppm) from 1958 to 2022 using measurements taken from an observatory in Hawaii. The concentration of carbon dioxide in the atmosphere has increased from 280 ppm before 1800 to well over 420 ppm in 2022.
Quick check 7.15
1. Define climate change.
2. State the name of the term for when Earth is undergoing a period of cooling.
3. State the name of the term for when Earth is undergoing a period of warming.
Table 7.9 summarises the influences that humans are having on the climate and how climate change is affecting global systems.
Human influence
How the climate is affected
DeforestationFewer trees result in less carbon dioxide being taken in from the atmosphere through photosynthesis. If the wood is burned, this contributes further to the greenhouse effect. Trees release large amounts of water vapour during transpiration. Fewer trees mean less water vapour in the atmosphere and therefore less rain.
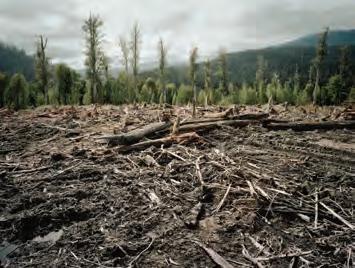
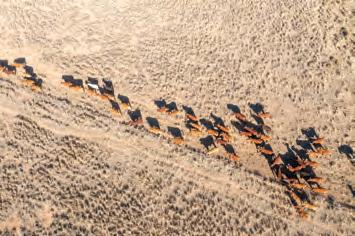
AgricultureCows and sheep produce methane when digesting grass. More cattle means more emissions.
Agriculture accounts for 11% of Australia’s greenhouse gas emissions, and 70% of that comes directly from livestock.
Burning fossil fuelsBurning fossil fuels produces carbon emissions, which alters the carbon cycle.
Nitrogen oxides are also produced when fossil fuels burn, causing smog and acid rain.
Fertilisers Adding fertilisers containing nitrates to the soil speeds up their conversion into nitrous oxide, another greenhouse gas.
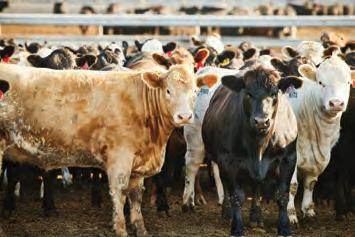
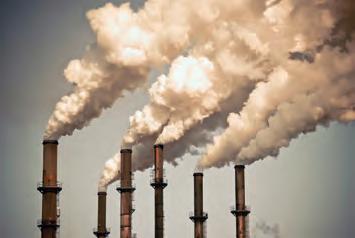

Generate, sort, connect, elaborate: Climate change
Map your understanding of climate change.
1. Create a list of ideas that come to mind when contemplating climate change.
2. Arrange your ideas in a mind map based on their importance. Place important or relevant concepts near the centre of the page and less important ones towards the outside.
3. Draw connecting lines between ideas that share similarities. Write a brief statement describing the connections between your ideas.
4. Elaborate on any of the ideas you have by introducing new concepts that extend your initial ideas. Keep adding new ideas until you feel that you have a comprehensive understanding of climate change.
The Generate, sort, connect, elaborate thinking routine was developed by Project Zero, a research centre at the Harvard Graduate School of Education.
Did you know? 7.5
The farming of beef and dairy cattle contributes to climate change through the following processes:
• Methane emissions. Cows produce methane through their digestive process, known as rumination.
• Land use. Beef and dairy farming often involves land clearing and the conversion of forests and grasslands into arable land (agricultural land using for growing feed crops and for pasture). This conversion leads to the loss of carbon-absorbing vegetation and soil, and releases carbon into the atmosphere.
• Fertiliser use. Growing crops for feeding cattle often involves the use of fertilisers that contain nitrates, which in turn produce nitrous oxide.
• Transportation emissions. Livestock and beef and dairy products are often transported over long distances between farms, saleyards, abattoirs and manufacturing facilities.
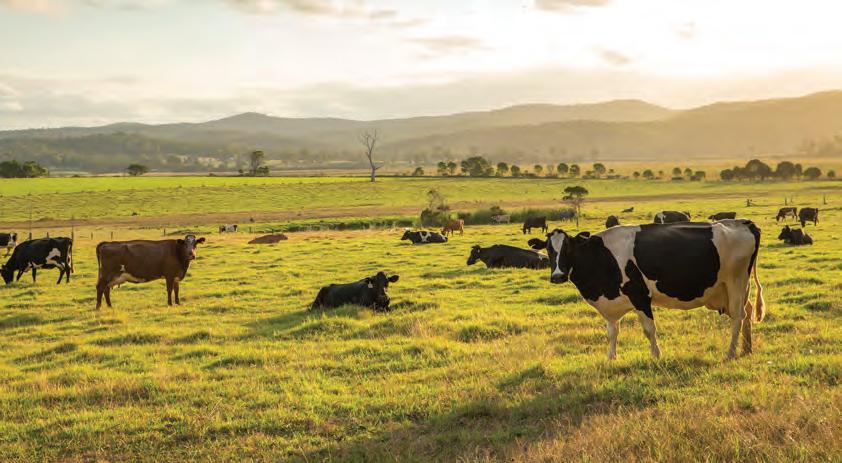
Scientists draw on various data sources to study how the climate is changing and the impact humans are having, and to track progress in mitigating the effects. Historical records provide a source of secondary data, and fieldwork allows the collection of primary data. A variety of indicators provide a picture of the state of the global climate.
Ocean and atmospheric temperatures reflect the overall temperature of the planet's surface. Any long-term increase in atmospheric and ocean temperatures will affect many aspects of Earth's system, including ocean circulation and weather patterns, leading to climate change. Rising temperatures result in increased rainfall, the melting of glaciers and ice sheets, and rising sea levels. Increased temperatures in the atmosphere also result in more energy being available to create extreme weather events such as storms and cyclones. Temperature changes are monitored by a variety of instruments, including satellite measurements, ocean buoys and weather stations, with the data providing evidence for climate change and the ongoing impact of human activities.
Scientists can track the climatic changes in temperature and carbon dioxide levels by taking cores (vertical samples) deep down into the polar ice. These cores show the layers of snow that fell and were compacted thousands of years ago, and their chemical composition gives clues about conditions at the time.
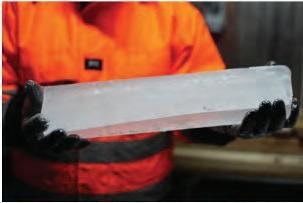
Permafrost – a permanently frozen layer of soil, gravel and sand bound together by ice – can also provide information about past climatic conditions as it melts. When permafrost melts, it releases trapped greenhouse gases, such as carbon dioxide and methane. The presence, thickness and temperature of permafrost provide scientists with valuable information about the rate of climate change.
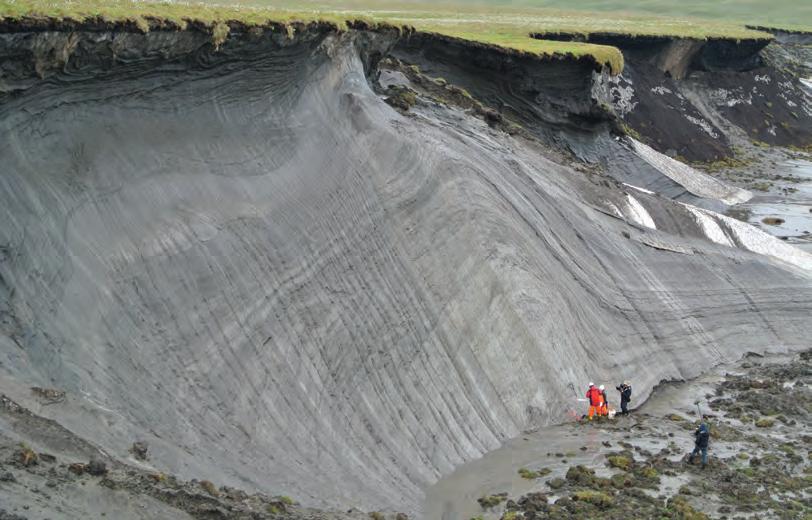
Glaciers advance during periods of cooling and retreat during periods of warming. However, the increasing trend in global oceanic and atmospheric temperatures has seen melting of the polar ice caps (themselves giant glaciers) and a subsequent rise in sea levels. Low-lying areas of land, such as some of the Pacific Islands, are most at risk. Ice acts as a barrier to prevent sunlight from reaching the ocean's surface, so with less ice cover there is a greater rise in oceanic temperatures, creating a vicious cycle. Ocean water in equatorial regions expands as it warms, further contributing to sea level rises. Rising sea levels leads to coastal flooding and erosion and affects coastal ecosystems and communities. Scientists must monitor sea levels, using equipment such as satellite altimeters and tide gauges.

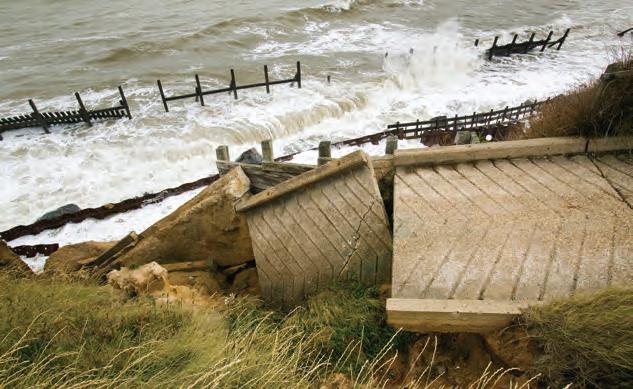
Did you know? 7.6
The location of sedimentary rocks and fossil distribution paint a picture of the world’s changing coastlines. Fossilised sea creatures have even been found in the centre of Australia, which was once a tropical inland sea! This sea drained as a result of tectonic plate movement rather than rising temperatures.

Did you know? 7.7
la niña events are getting worse
La Niña is a climatic phenomenon characterised by the cooling of the central and eastern tropical Pacific Ocean. It is the counterpart to El Niño, which is characterised by warming of the same region. La Niña events can have significant impacts on global weather patterns, causing alterations in temperature, precipitation and wind patterns.
Some of the effects of La Niña include increased rainfall in some areas, drought in others and changes in atmospheric circulation patterns that can affect tropical storms. La Niña is one of the important factors that scientists consider when making long-range weather and climate forecasts.
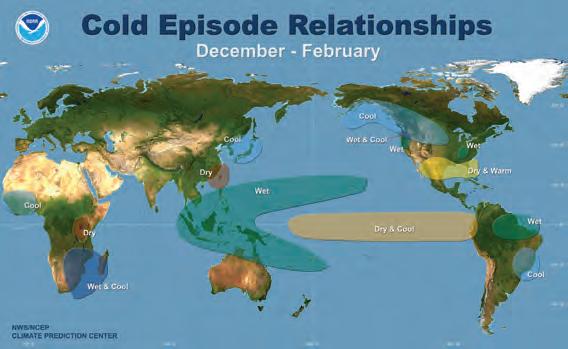
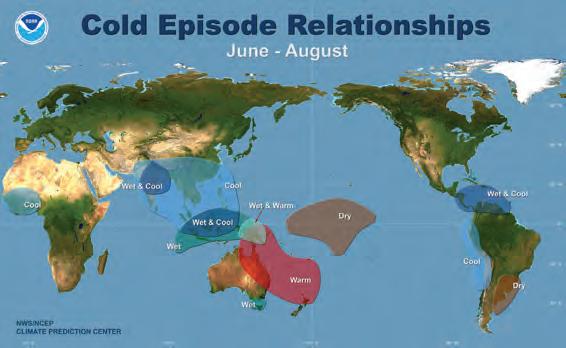
La Niña events are a natural part of Earth’s climate system, but their severity and frequency may be influenced by climate change, as rising global temperatures can disrupt the balance of ocean and atmospheric conditions that drive these events.

When seawater freezes in winter, only the water freezes – the salt is left behind in the unfrozen seawater below. Waters with higher concentrations of salt are denser and sink to the ocean floor. Different densities are the main cause of ocean currents, circulating seawater from the sea floor to the surface and all around the globe. This water carries with it thermal energy, organic matter and nutrients.
With rising temperatures, less seawater is freezing, which is reducing the density of the oceans. These global ocean currents could eventually cease all together. If seawater circulation slows, and organic matter and nutrients also stop circulating, the impact on the survival of marine life would be huge.
Aim
To determine how the concentration of salt in water (salinity) affects its density
Materials
• 10 mL measuring cylinder
• 100 mL measuring cylinder
• 100 mL beakers × 5
• pipettes × 5
• food colouring (blue, green, yellow and red)
• salt
• water
• weighing boats
• balance
Method
1. Copy the results table into your science book.
2. Using a 100 mL measuring cylinder, measure 60 mL of water and pour it into one of the 100 mL beakers. Repeat four more times so you have five beakers each with 60 mL of water. Label the beakers 1 to 5.
3. Referring to the table above, add the required drops of food colouring to each beaker.
4. Using the weighing boats and balance, measure the five different masses of salt. Pour the salt into the correct-coloured beaker.
5. Stir the solutions to make sure all the salt has dissolved.
6. Using a pipette, draw up 2 mL of solution 5 and add it to the 10 mL measuring cylinder.
7. Using a pipette, draw up 2 mL of solution 4. Position the pipette against the inside of the measuring cylinder, with the tip of the pipette close to the solution added previously. Slowly add solution 4 drop by drop, allowing the drops of solution to roll down the side of the measuring cylinder. Be careful not to knock the cylinder or let the pipette disturb the solution in the cylinder!
8. Repeat step 7 for solutions 3, 2 and 1, slowly adding each in turn to the 10 mL measuring cylinder.
9. Note the distribution of coloured solutions, taking a photo if possible.
Results
1. Sketch a coloured diagram of the appearance of the solutions in the measuring cylinder.
2. Complete the results table.
Table showing the densities of the different solutions
3. Plot a graph of mass of salt on the x-axis and density on the y-axis.
Discussion: Analysis
1. Use your graph to describe the link between amount of salt and the density of a solution.
2. Discuss how rising global temperatures affect the concentration of salt in the oceans and how this relates to climate change.
Discussion: Evaluation
1. Discuss any limitations in your methodology.
Conclusion
1. Make a claim about the effect of climate change on ocean currents.
2. Support your statement by using the data you gathered, and include potential sources of error.
3. Explain how the data support your claim.
Sea ice is highly sensitive to changes in air and water temperature. As global temperatures increase, sea ice melts, and this affects global weather patterns, ocean currents and coastal communities. The extent and thickness of sea ice in the polar regions provide scientists with information about the rate of climate change: a decrease in sea ice over time can indicate a warming trend. Sea ice also reflects a significant amount of sunlight back into space, so its decline can contribute to further warming by reducing the amount of reflected sunlight and increasing the amount of sunlight absorbed by the ocean. This is a positive feedback loop, ultimately leading to increased ice melting and sea level rise.
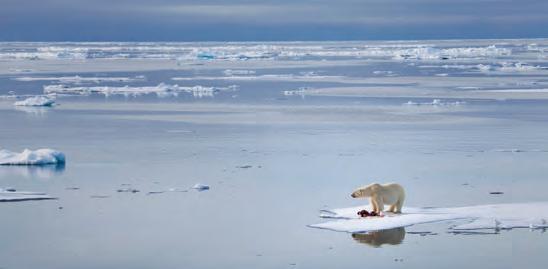
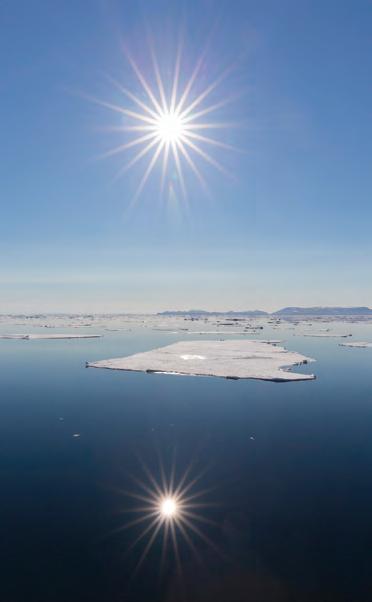
keystone species a species that has a significantly large role/impact on a particular ecosystem relative to its population
In July 2023, the Antarctic sea ice winter levels were recorded to be at their lowest since the continuous satellite record began in 1978. The sea ice follows a seasonal trend each year, shrinking during summer and then expanding again in winter. Since 2014, there has been a downwards trend in winter sea ice levels, culminating in 2023’s record low area.
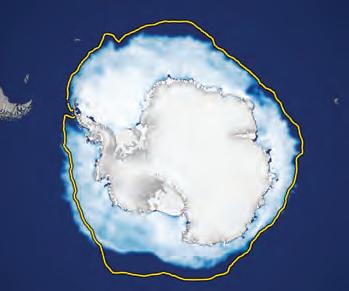
1. State one indicator that scientists can use to monitor climate conditions.
2. Identify the main problem caused by melting polar ice caps.
3. Identify the problem caused by decreased ocean density as a result of reduced freezing of ice in winter.
Climate change has a significant impact on coral reefs, which are some of the most biodiverse ecosystems on the planet. Coral is considered a keystone species, because many other species rely on it for food and shelter.
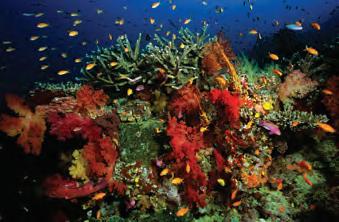
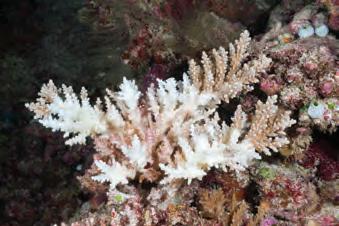
The main effects of climate change on coral reefs include:
• Ocean acidification. Increases in atmospheric carbon dioxide cause the oceans to become more acidic. This makes it difficult for corals to build and maintain their calcium carbonate skeletons, leading to the degradation of reefs.
• Coral bleaching. Corals rely on symbiotic single-celled organisms called protists to provide their nutrition. As the temperature of the ocean increases, corals become stressed and expel the protists, leading to coral bleaching.
• Changes in ocean circulation. Changes in ocean currents caused by warming of the ocean can affect the availability of food and nutrients for corals.
• Sea level rise. As sea level rises, corals are increasingly at risk of being unable to grow vertically fast enough to maintain their depth at or below the surface. Living under the lower light conditions at greater depth will reduce their growth and increase their exposure to other stressors such as pollutants and disease, threatening their survival.
The degradation and loss of coral reefs will also have consequences for the millions of people who rely on them for food, income and coastal protection.
Research some of the reasons why coral bleaching is so disastrous for the environment.
Climate change is one of the biggest threats to global biodiversity. The more biodiverse an environment, the more resistant that environment is to change. (It is more stable.) Climate change can alter the distribution and abundance of species, leading to changes in the composition and structure of ecosystems. Rising temperatures can shift the ranges of species and alter their migration patterns, disrupt the timing of seasonal events such as flowering and migration, and change the distribution of disease-causing organisms. Climate change has led to shifting climatic zones, resulting in species moving towards the poles and to cooler, higher elevations on land and deeper ocean waters for some marine species. On average, species are moving towards the poles at 17 km per decade on land and 78 km per decade in the ocean.
pollen
By dating the rock that fossilised pollen is found in, scientists can deduce the number and species of plants living in that location during that time period. This in turn provides information about the climate at that time.

Different species are responding to climate change at different rates, leading to changes in the structure of ecosystems. As species move to new locations, they interact with species they may have never encountered before, forming new ecological communities. At the same time, species that had previously relied on each other for food or shelter may be forced apart, disrupting established ecological relationships and potentially leading to ecosystems collapsing.
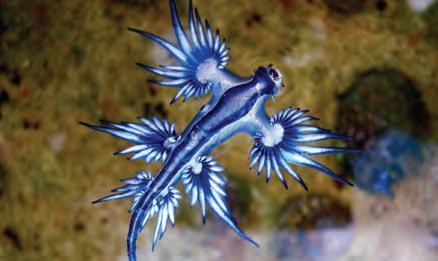
Figure 7.62 Blue dragons (Glaucus atlanticus) are small venomous sea slugs found in warm and temperate waters. As ocean temperatures continue to increase, its distribution is expanding. While some species may benefit from climate change in the short term, the long-term effects are often negative, including decreased biodiversity.
Citizen science
In citizen science, the general public participates in collecting scientific data. This can include monitoring wildlife populations, tracking the spread of invasive species or contributing observations to astronomical studies. The goal is to involve citizens in the scientific process, allowing the collection of large amounts of data that would normally be difficult to obtain.
Research the citizen science project Redmap to see how everyday Australians have documented the movement of species around Australia’s coasts over the past decade and how this is contributing to our knowledge about climate change.
Create a digital infographic to highlight the multiple lines of evidence (e.g. from polar ice caps, ocean temperatures and extreme weather) that explain how climate change is impacting Earth.
Infographics should:
• communicate information concisely
• be visually appealing, with a good use of colour and images
• be well organised so viewers can easily see the information
• contain relevant data from credible sources.

7.63 Australia’s volunteer tagging database Infofish Australia recently became the first citizen science tagging program in the world to tag one million fish. Over the past 36 years, over 17 000 taggers contributed over 198 600 days (or 544 years) of effort to reach the milestone.
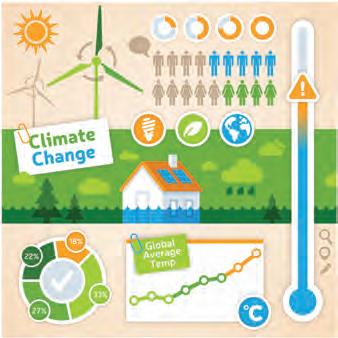
Being able to predict changes to the Earth system is important for preparing for the impacts of climate change. This involves collecting data and then using modelling and simulations to understand how Earth's climate and ecosystems are changing and will change in the future, given certain assumptions. The models consider the complex interactions between Earth's spheres and provide information about how the Earth system is likely to respond to various scenarios.
Scientists use satellites to produce global data about ocean temperatures, sea levels, and forest and ice cover. Different properties of Earth's surface and atmosphere can be measured to provide a continuous stream of data that is used to monitor global climate changes.
To measure ocean temperatures, satellites use radiometers that can detect the infrared (heat) and microwave radiation emitted by the ocean surface. This radiation is proportional to the temperature of the surface, so the data can be used to create maps of ocean temperature patterns.
Sea level data is generated by satellite altimeters, which use radar to measure the height of the ocean surface relative to a reference point, providing information on the rise or fall of sea levels over time.
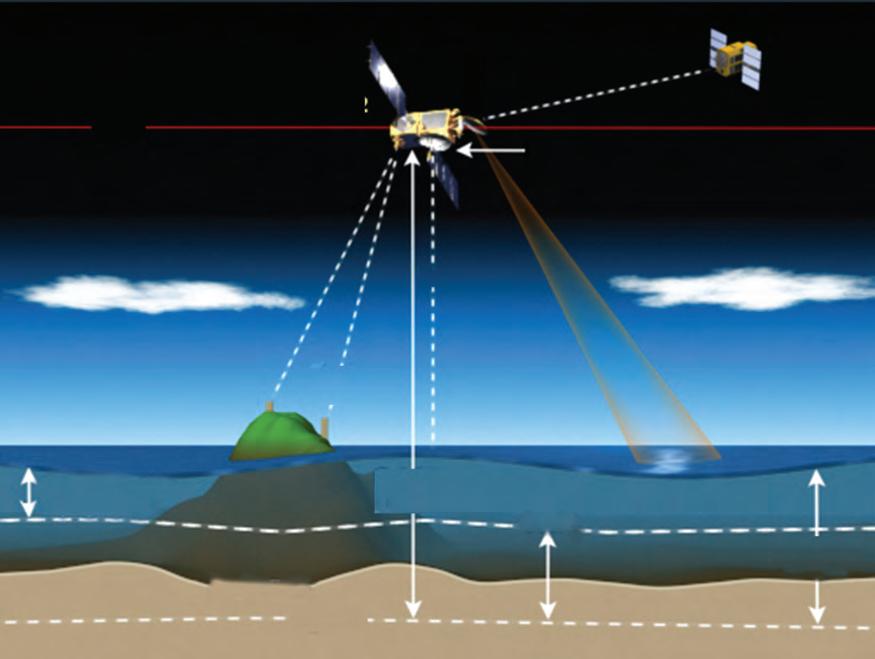
Satellites also use optical and microwave sensors to monitor changes in forest and ice cover. These instruments can detect changes in the reflection and emission of radiation from Earth's surface, which indicate the amount of vegetation or ice present. This data can be used to track deforestation and the rate of ice melting.
Satellite radar altimeters measure sea levels by measuring the time it takes a radar pulse to make a round-trip from the satellite to the sea surface and back.
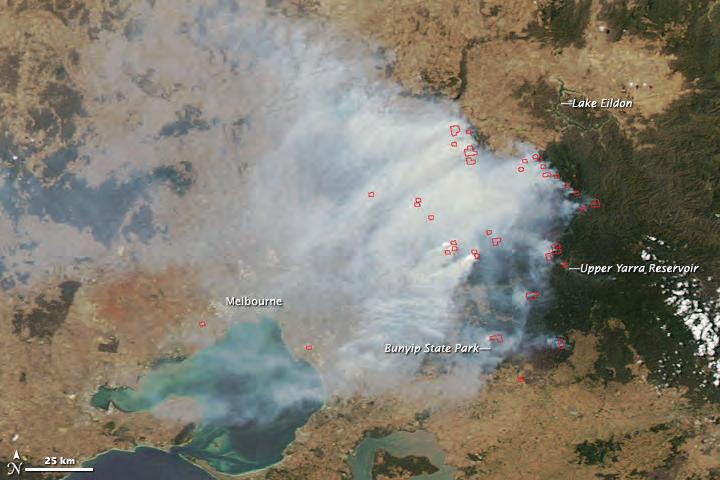
7.66 Aerial imagery showing MODIS data from NASA’s Aqua satellite, during the catastrophic 2009 bushfires. Actively burning areas are outlined in red.
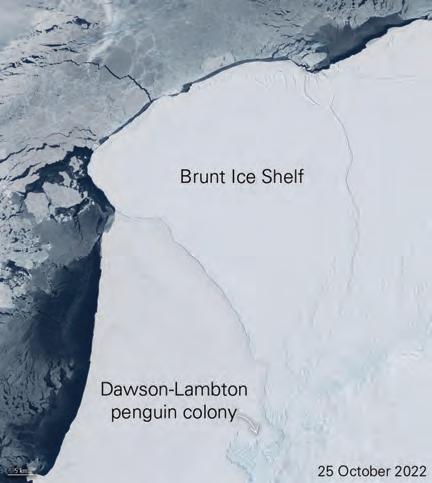
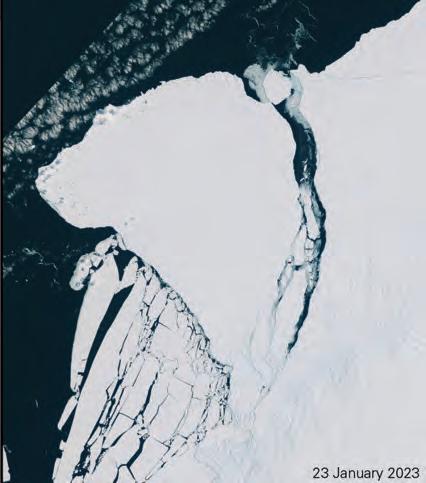
7.67 The two-satellite mission Copernicus Sentinel-2 has produced before and after photos of the ice slab that broke away from the Brunt Ice Shelf, Antarctica. The image on the left shows cracks on the ice shelf on 25 October 2022 and the image on the right shows the ice breaking away on 24 January 2023.
The data generated by satellites is used to monitor the effects of climate change by providing a record of changes over time.
Predicting changes to the Earth system is a challenging task, as it involves understanding and representing many complex processes and feedbacks that operate on a wide range of timescales.
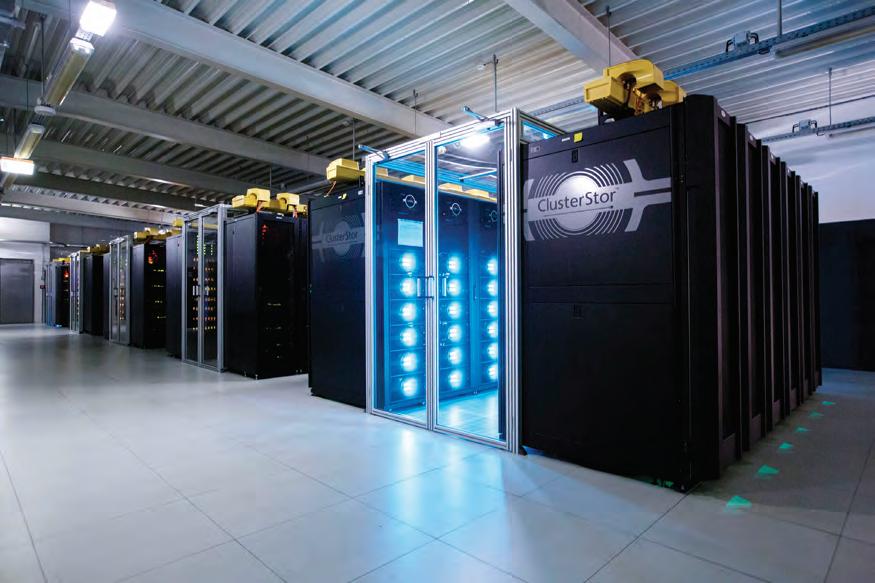
Computer modelling has improved our knowledge and ability to predict how phenomena such as climate change and atmospheric pollution will develop in the future. Computer simulations can be used to make predictions about Earth's climate thousands and millions of years into the future to see what impact actions taken now will have on the climate in the future. With their high processing power, computers can run numerous simulations repeatedly in a short period of time, something that could take a human over a lifetime to complete. By running numerous simulations, predictions made by computer modelling are much more accurate than those made manually by humans.
Table 7.10 lists some of the applications of computer modelling.
Application of computer modelling
Predicting the weather
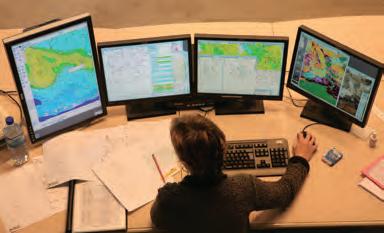
Predicting climate change
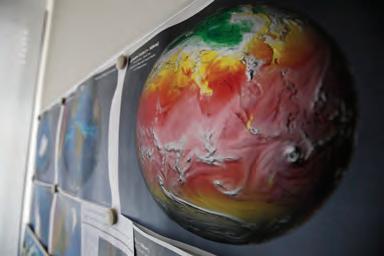
Monitoring pollution levels

Description
You will see this used every day if you watch the news. Multiple simulations are run by computers. Meteorologists (scientists who study the weather) use these simulations to predict the weather conditions for that week (and beyond).
Models predicting climate change are based on observational data and fundamental physical laws, such as Newton’s laws. Perhaps the most complex climate models are the general circulation models (GCMs). Data on climate change reported in the media is generated from numerous simulations of the GCMs.
Atmospheric dispersion modelling predicts the behaviour of pollutants in the air over a specific period of time. It is used by governments to monitor air quality as well as to make predictions of the effects of chemical spills.
Rapidly emerging quantum computers will be able to enhance the modelling of complex weather and climate systems by using quantum algorithms to perform simulations that are beyond the reach of classical computers. Unlike classical computers, which store and process information using binary bits that are only in one of two states (0 or 1), quantum computers use quantum bits (qubits) which exist in multiple states simultaneously. This allows quantum algorithms to perform certain tasks such as simulations much faster than classical algorithms.
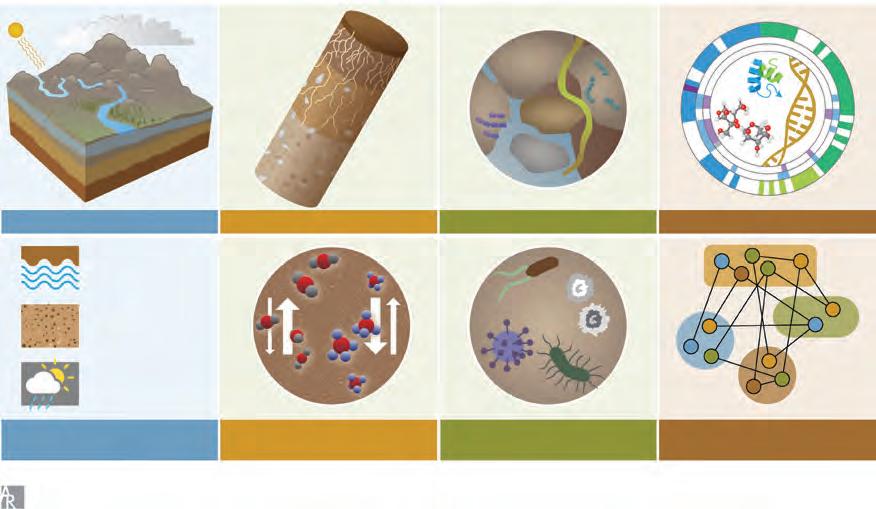
different levels: from effects on entire landscapes
Quantum computers will be able to process large amounts of data faster and more efficiently, enabling more detailed simulations. It may even be possible to process enormous amounts of data from multiple sources in real time! These simulations will help improve our understanding of how weather patterns and climate interact and change over time, allowing for more accurate forecasting and prediction of weather patterns and the impacts of climate change.
1. Explain why scientists use computer modelling to predict phenomena.
2. State one application of computer modelling.
3. Suggest how quantum computers enhance climate modelling.
Even though there is scientific consensus that climate change is real and is largely driven by human activities, there is still some uncertainty about how things will change in the future. To address this uncertainty, scientists use multiple models, each using different assumptions, with the aim of achieving a more comprehensive understanding of the potential impacts of climate change. All models, including climate models, are limited by the amount and quality of their input data, and by the fact that real-world processes are subject to complex and random events that lead to unpredictable variations. Therefore, different models and approaches are used to predict the impacts of climate change based on different scenarios, resulting in different projections of how the climate will change in the future. Further, as more data is collected and our understanding of climate change improves, new models are continually being developed and refined.
Taken together, the data generated by these models can be used to better understand the likely future impacts of climate change, which helps guide governmental decision-making about how to mitigate its effects.
Circle of viewpoints: Climate change
Climate change denial is the rejection of the scientific consensus on the reality, causes and potential impacts of global warming, despite overwhelming evidence. Climate change models are contested by some people in society for a variety of reasons, including political, economic and ideological motivations. Some people may question the validity of climate change models because they challenge their long-held beliefs or economic interests. Others may be sceptical of scientists and question the impartiality and accuracy of the data and methods used to develop climate models.
There is also a belief among some people that the models are too complex and that their predictions are unreliable. These people may also reject the idea of human-caused climate change altogether, and therefore not accept the projections produced by climate change models. Misinformation about climate change has also played a role. Some individuals deliberately spread false information to discredit the models and cause people to doubt the science of climate change.
While some contest the models, most climate scientists agree that the models provide valuable insights into the future of the climate and are an essential tool for understanding the impacts of human activities on the planet.
1. Generate a list of viewpoints that individuals belonging to different groups in society could hold regarding climate change (e.g. farmers, politicians, climate scientists).
2. Select one of the viewpoints to consider, using the following statements:
• I am considering climate change from the viewpoint of ... [insert the selected viewpoint].
• I believe ... [describe the subject matter from the chosen viewpoint; assume their character].
• A query that arises from this perspective is ... [pose a question from the chosen viewpoint]. In your class, you may then want to engage in an evidence-based debate about the role of human activity in global climate change.

1. Suggest one reason why computer models are not perfect.
2. Suggest two reasons why people contest climate change models.
It can be argued that given our contribution towards climate change, humans have a responsibility to reduce our future impact and attempt to mitigate ongoing risks to the planet. Production of greenhouse gases is ultimately linked to consumption: of food, of fuel, of natural resources. Human activities such as power generation, transport, food production and manufacturing are all significant contributors to climate change. Earlier in the chapter you had the chance to calculate your carbon footprint (see Explore! 7.5) and perhaps this enabled you to identify some personal changes you could make. However, there are larger-scale issues that corporations and government must address if we are going to alter the increasing trend in global temperatures. New technologies will require government and financial support to implement on a meaningful scale.
Rating
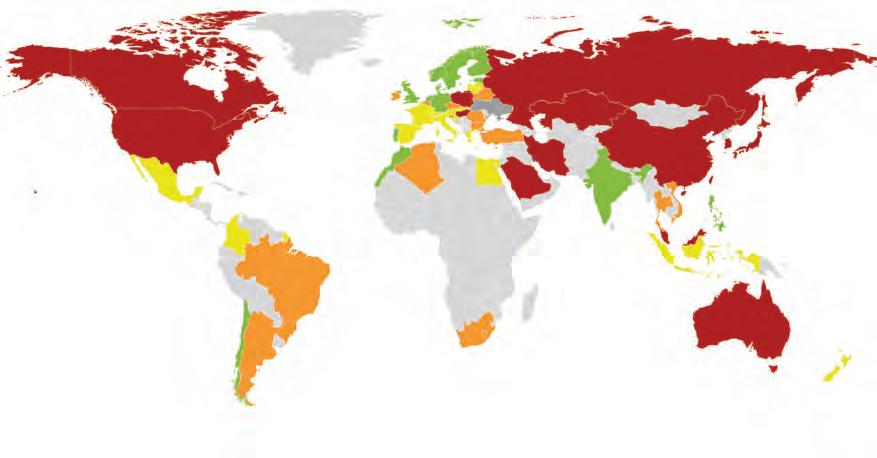
Uk raine was not rated this year because of the Russian invasion
Figure 7.71 Australia’s environmental protection efforts continue to be among the lowest in the world. Australia ranks 55th out of 63 possible places in the Climate Change Performance Index 2023.
Earlier in the chapter, Table 7.9 summarised various human influences on climate change. Below, we will expand on these categories of influence to consider some ways the effects can be addressed or mitigated.
Deforestation• Sustainable logging
• Carbon credits and planting initiatives
Agriculture• Regenerative farming seeks to minimise water and fertiliser use, and reverse soil degradation
• Methane capture technology and feed additives for cattle that reduces the amount of methane they produce
Burning fossil fuels• Move towards green energy production instead of relying on burning fossil fuels
Table 7.11 A summary of how human influences on climate change might be reduced
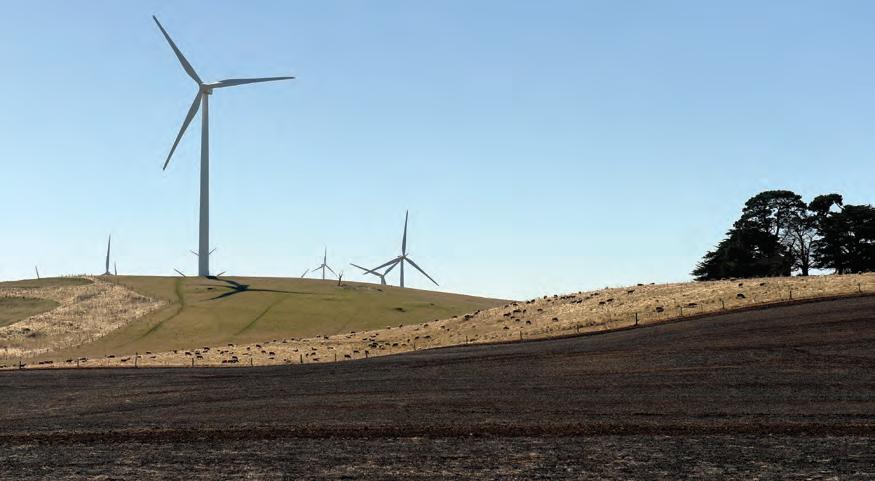
Global food demand is projected to increase by 70% to 2050. While this presents opportunities for innovation in the agricultural sector, the industry is also facing the economic challenge of climate change because it depends on natural resources. In many areas across the country, but particularly in the southern states, data from the Department of Agriculture, Fisheries and Forestry indicates that profits have decreased as a direct result of changes in seasonal conditions. To counteract this, the average farm size is increasing in an attempt to drive up productivity, and there has been a move towards more sustainable practices, such as regenerative farming techniques and the installation of green technology (e.g. wind turbines) on agricultural land.
Regenerative farming aims to improve soil health and address climate change by:
• moving away from monoculture cropping (growing one type of crop in a certain area) and towards intercropping (planting two or more species of plants together), which leads to more efficient use of resources such as water, and lower prevalence of pests
• planting cover crops to prevent erosion of arable soil, using native plants where possible
• reducing the use of chemical pesticides and herbicides
• using nitrogen-fixing crops, such as lentils, beans and lupin, to reduce the amount of nitrogen fertiliser needed
• using technology such as soil sensors for more precise application of nitrogen fertilisers. It is thought that if regenerative agriculture practices were applied at scale, they could have a significant effect on climate change by turning farms into carbon sinks.

In 2022, a design group called ZELP (Zero Emissions Livestock Project) won a competition for creating a cow mask that traps the methane emitted in cow burps and converts it into carbon dioxide and water. They are planning widespread trials of the device in 2025.
Research the technology and answer the following:
1. Restate the claim made by the company in terms of the percentage methane reduction.
2. Outline some of the additional monitoring benefits of this wearable technology.
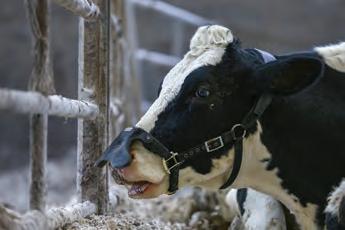
3. Carbon dioxide is still a greenhouse gas. Propose a reason why releasing carbon dioxide is favourable compared to methane.
Carbon farming refers to a set of land management practices that aim to reduce greenhouse gas emissions from agriculture and other land uses, while improving the health and productivity of ecosystems. One aim of carbon farming is to sequester carbon in soil and vegetation to reduce atmospheric carbon dioxide. To this end, Australian farmers have been encouraged to return some of their arable land into forests and wetlands. In return, they would receive carbon credits. Embracing this mixed-use of land also has other benefits, such as providing shade and windbreaks for livestock, improving soil quality and making water use more efficient.
Traditional Owners are also implementing carbon-farming practices that support the management and restoration of natural ecosystems, in addition to mitigating the effects of climate change.

Communities are using their traditional knowledge of the land to implement reforestation projects that will naturally sequester carbon. They are also using their traditional land management practices, such as controlled burning, to reduce greenhouse gas emissions and improve ecosystem health. The Aboriginal Carbon Foundation is a non-profit organisation run by First Nations Peoples that provides carbon farming services. The foundation was established in 2010 with the primary aim of reducing greenhouse gas emissions while also generating economic benefits for Indigenous communities.
Using renewable resources rather than continuing to burn fossils fuels for energy production is a key approach to tackling greenhouse gas emissions. Broadly speaking, a resource is considered renewable if it can be replaced within a human lifetime – approximately 80 years. Solar panels, wind turbines and geothermal and hydroelectric power stations all present opportunities to generate electricity from the renewable resources of sunlight, wind, heat and the energy in flowing water.
Nuclear power plants have also been proposed; however, they have proved politically problematic due to the potential health risks and environmental impacts of storing the wastes produced. While not a renewable resource, the radioactive uranium used as fuel in nuclear reactors is plentiful in Australia and does not generate greenhouse gases.
Electric vehicles (EVs), praised as a means of 'decarbonising' personal transport, offer lower greenhouse gas emissions than petrol, diesel and gas-powered vehicles. However, at present, charging them via the Australian electricity grid relies largely on fossil-fuelled power, and the production of the EV itself is not without greenhouse gas emissions.
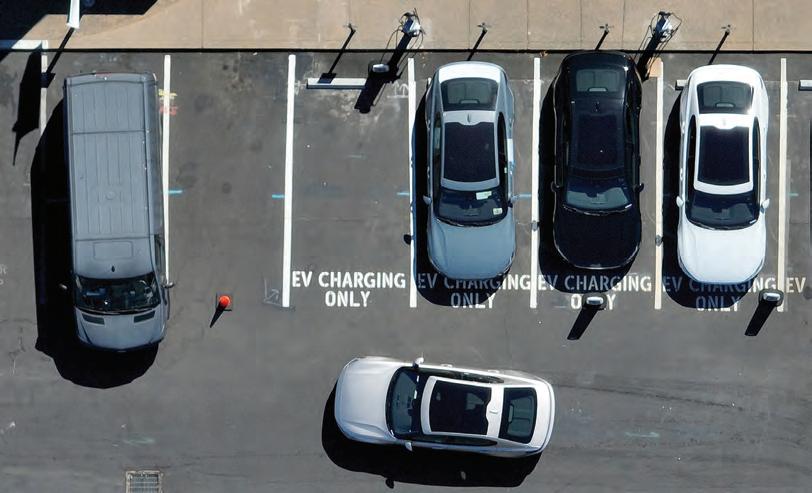
Climate change is a significant global challenge that is affecting the planet in many ways, from rising temperatures and sea levels to extreme weather events and changing ecosystems. Research how the following strategies reduce climate change or mitigate its effects:
• Reducing greenhouse gas emissions
• Reforestation and forest preservation
• Energy conservation
• Public and active transportation
• Carbon pricing.

quiz
Section 7.4 questions
Remembering
can assign tasks and track results
1. Identify the correct word to complete the sentence: Earth is currently experiencing an interglacial / a glacial period.
2. State two human activities that have influenced the climate on Earth.
3. Recall how satellites measure sea levels.
Understanding
4. Explain the difference between climate and weather.
5. Describe two effects of climate change on coral reefs.
6. Describe atmospheric dispersion modelling.
7. List three actions a farmer could take to reduce greenhouse gas emissions on their property.
Applying
8. Summarise the impact that deep ocean currents have on the global climate.
9. Name three different global indicators of climate change and state what trends they have shown.
10. Classify the following energy sources as renewable or non-renewable: fossil fuels, hydroelectric, wind, nuclear, solar, geothermal.
Analysing
11. Critique the following statement: Models of climate change allow us to know with certainty what the climatic conditions will be like in the future.
12. Classify the following as either an effect or a cause of climate change:
a) Melting polar ice
b) Reduced ocean currents
c) Increased use of fertilisers
d) Reduced biodiversity
Evaluating
13. Discuss the impact of global warming on sea levels.
14. Discuss some reasons why people might not believe that climate change is occurring.
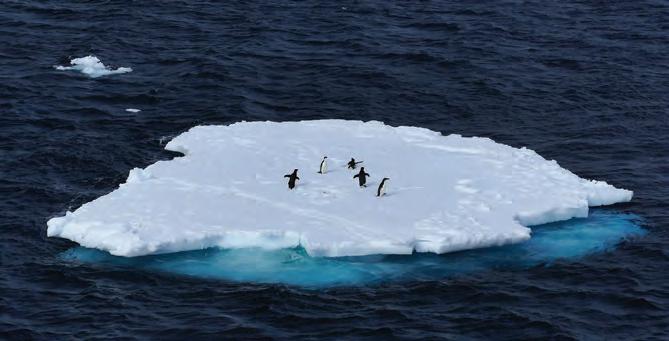
Chapter checklist
Success criteria
7.1I can distinguish between Earth’s chemical spheres: atmosphere, biosphere, geosphere and hydrosphere. 2, 20
7.1I can list the five layers of the atmosphere. 1
7.1I can describe the effect of natural events such as earthquakes, volcanos and cyclones on the chemical spheres. 9
7.2Recall the seven processes of the carbon cycle. 17
7.2Identify the impact of combustion reactions as a result of human activity on the carbon cycle 24
7.2Describe the role of cultural burning practices in facilitating energy and nutrient transfers 10
7.3I can recall four different greenhouse gases. 3, 6, 15, 19, 25
7.3I can compare the natural greenhouse effect and the enhanced greenhouse effect. 4, 11, 12, 14
7.3I can describe how Aboriginal and Torres Strait Islander Peoples are reducing Australia’s greenhouse gas emissions through the reinstatement of traditional fire management regimes 21
7.3I can identify how carbon dioxide is captured and stored naturally or through the use of technologies 18, 27
7.4I can recall the difference between weather and climate. 5
7.4I can identify the changes in global climate over time, and provide evidence of these changes. 13, 22
7.4I can explain the role that deep ocean currents have on global climate.7
7.4I can outline the human influences on climate change. 16, 23, 26
7.4I can describe how we can collect data and predict changes to the Earth system. 8
7.4I can identify strategies used to reduce climate change or mitigate its impacts. 25, 28
Remembering
1. List the five layers of the atmosphere.
2. Recall the four spheres that make up the Earth system.
3. Recall the name and formula of the form of elemental nitrogen in the atmosphere.
4. The majority of the Sun’s radiation that reaches Earth is absorbed by the ground and oceans. Recall what happens to the rest of the Sun’s radiation.
5. State one reason why different areas on Earth have different climates, defining weather and climate in your answer.
6. Identify the most abundant greenhouse gas.
7. Recall how deep oceans currents affect ocean temperatures globally.
8. State three applications of computer modelling for detecting and responding to Earth’s changing climate.
Understanding
9. Describe the effects of cyclones on each of Earth’s chemical spheres.
10. Describe how cultural burning practices facilitate energy and nutrient transfer in ecosystems.
11. Outline the journey of UV solar radiation emitted from the Sun.
12. Describe how greenhouse gases contribute to the natural and enhanced greenhouse effects.
13. Describe the effects that melting sea ice (because of climate change) is having on the planet.
Applying
14. Contrast the ozone layer and greenhouse gases by copying and completing the following table:
Composition
Most important effect
Location
15. Construct a worded equation to show how the process of respiration leads to an increase in atmospheric carbon dioxide.
16. Construct a graph to show how carbon dioxide concentrations in the atmosphere have changed over the last two decades.
17. Illustrate a diagram of the carbon cycle.
18. Outline three ways carbon dioxide can be stored using technology.
Analysing
19. Compare the effectiveness of methane and carbon dioxide at trapping heat.
20. Analyse the sphere interactions taking place in Figure 7.77.
21. Outline the beneficial impact of reintroducing traditional cultural burning regimes.
22. Examine the reasons why low-lying areas are at most risk from climate change.
Evaluating

23. Discuss the human effects on the enhanced greenhouse effect and climate change.
24. Contrast the advantages and disadvantages of using fossil fuels as a fuel source.
25. Using the summary table of greenhouse gases (see Table 7.5), justify why humans should focus on reducing nitrous oxide emissions as well as those from carbon dioxide.
26. There is debate regarding whether climate change is a significant risk to life on Earth. Decide whether you agree, based on what you have learned in this chapter. Justify your opinion with facts and evidence.
27. Evaluate the role of forests in carbon sequestration.
28. Discuss which climate-mitigation strategy (listed in Explore! 7.10) would be the most successful in your home town. Give reasons for your answer.
The Keeling curve in Figure 7.78 illustrates the change in atmospheric carbon dioxide concentration from 1960 to 2005 as measured from the atmosphere above Hawaii, USA. A media outlet is using this data as evidence to suggest that ‘climate is changing as there is increasing atmospheric carbon dioxide’.
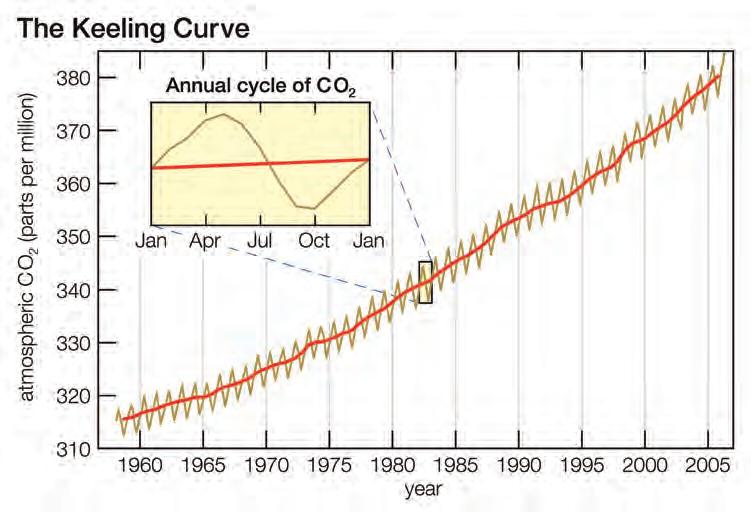
Figure 7.78 Keeling curve showing the atmospheric carbon dioxide concentration over time
Applying
1. Identify the year that had the lowest average atmospheric CO2 in the atmosphere.
2. Use the red line to determine the concentration of atmospheric CO2 in 1965.
3. Determine the annual cycles observed for the brown line.
Analysing
4. Distinguish the difference between the brown line and the red line.
5. Identify the general trend of carbon dioxide concentration as time increases.
6. Identify the causes of the pattern/patterns occurring in the brown line.
Evaluating
7. Deduce whether the data in Figure 7.78 can be used to justify the statement ‘There is increasing atmospheric carbon dioxide’.
8. Deduce whether the data in Figure 7.78 can be used to justify the statement ‘Climate is changing’?
9. Infer the atmospheric concentration of CO2 in 2030, using the trend you have observed in Question 5
Aerial photographs were pioneered by the French photographer and balloonist Gaspard-Félix Tournachon in 1858. Soon, aerial imagery was being used to gather information for military use and monitor territories. Early military aerial photographers fixed small cameras to the chests of mail pigeons and flew them over enemy positions. These days, we use high-resolution satellite imagery and highly sophisticated drones.
Aerial imagery can be used to monitor the rate of deforestation, estimate the carbon storage capacity of ecosystems, survey habitats of vulnerable flora and fauna, assess natural disasters and plan for the development of sustainable cities.


Use aerial imagery to track environmental change, and make environmental impact predictions for a proposed development in your chosen area.
You are an environmental researcher working for your local council along with a team of other professionals, including engineers, policymakers and designers. A proposal has been put to council to demolish several buildings in the area; however, these lie close to existing waterways. The Land Management Team has asked you to give a presentation outlining how the local landscape has changed over time, and how you think the proposed development will impact on local ecosystems. You will use existing aerial photographs (satellite imagery) and present them as a time-lapse video, to which you will add some visual predictions of the development’s impacts.
Suggested
• Google Earth Pro (free to download for a desktop computer/laptop)
• Video editing software, such as GIFMaker.org (recommended), iMovie or Movie Maker

1. a) Select a local area with a river or creek, and either a combination of natural and built environment, or a natural environment where a development could be proposed.
b) After viewing some satellite imagery of your chosen area, list the advantages and disadvantages of using satellite imagery to assess environmental change. Consider both the expertise (skills) needed to gather and decode these images, and the potential benefits to planning authorities in using them.
2. Identify some professionals you could engage with to gather knowledge for constructing your impact predictions. Discuss and reflect on the knowledge needed to make predictions about the possible environmental impact of a development.
3. Thinking about your chosen area, research and list all the environmental issues:
a) currently being faced at the site
b) predicted in the future.
4. As a group, discuss a future development that could be completed in the chosen area. Sketch and annotate the future development on an image of the site. List any environmental impacts the development might have.
5. Decide which technology and time scale you will use to create the time-lapse video. It should be long enough to show meaningful change, but short enough to be relevant to viewers.
6. Locate at least 10 aerial photographs from Google Earth Pro to use in your time-lapse video. To do this:
a) Download and install Google Earth Pro.
b) Look for the ‘Search’ field, and enter the area you would like to focus on (e.g. San Remo, Victoria).
c) Select View, then Historical Imagery. A time slider will appear at the top left of the map.
d) Drag the time slider to the first image available (the oldest image). Select File > Save > Save Image. Edit the legend information using the ‘Map Options’ function.
e) To save your first image, select Save Image > Save As.
f) Repeat steps 4 and 5 to collect additional images. You want the newest available image (to contrast against the oldest image) and 8–10 more images to fill in the time lapse.
7. Export the images to your chosen video editing software.
8. Edit your time-lapse video, ensuring your images are in the right order and the speed of transitions between slides is suitable. Include your future development diagram in the presentation to show the likely environmental impact of the development.
9. List five changes you have observed in the landscape of your chosen area. Outline the advantages and disadvantages of these changes for the local community.
10. Present the time-lapse video and your observations to the Land Management Team (the class).
11. Reflect on the challenges associated with anonymous aerial image gathering. What are the privacy implications of this technology? How can you address this?
12. Consider how aerial photography might be used to enhance environmental conservation in your local area.
Energy can be transferred in useful ways in the form of light, sound, heat and electricity. The many everyday applications of these forms of energy include for work and leisure activities. Light is a wave. It is part of the electromagnetic spectrum, which extends from radio waves to gamma waves. Light can also sometimes behave like a particle, called a photon. Sound energy also travels in waves but requires a particle medium, while electrical energy is carried in the movement of electrons. In this chapter, you will bring together knowledge of wave and particle theories and apply them to the movement of light, sound, heat and electrical energy.

Waves transfer energy
Transverse waves
Energy can be transferred in different ways
Mechanical waves
Electromagnetic waves
Longitudinal waves (e.g. sound waves)
Particles transfer energy
Heat transfer occurs via conduction, convection and radiation
Electrical potential energy can be carried by electrons
Electromagnetic spectrum:
• Radio waves
• Microwaves
• Infrared radiation
• Visible light
• Ultraviolet light
• X-rays
• Gamma rays
Curriculum content
wave and particle models can be used to describe energy transfer (conduction, convection and radiation) through different media; waves (electromagnetic and mechanical) have different properties, features (including amplitude, wavelength, frequency and speed) and applications (VC2S10U14)
• describing the processes underlying convection and conduction of heat in terms of the particle model
• modelling the transfer of sound energy as waves using slinky springs and relating to the medium through which the sound is transferred
• investigating the relationship between the volume of a sound wave and the amplitude of the wave, or the relationship between the pitch or tone of a sound wave and its frequency
• examining how the particle model of electricity explains static electricity and electrical current and relating this to voltage, conductors and insulators
• making prisms of different shapes using gelatine (half concentration) poured into moulds and shining a torch through them to investigate how light is bent and dispersed
• discussing the wave and particle models of energy transfer, including the concept of photons, and how these models are useful for understanding aspects of light and other forms of electromagnetic radiation
• examining how properties of electromagnetic radiation relate to the uses of this radiation, such as in radar, medicine, sanitation, mobile phone communications, remote sensing and microwave cooking
• investigating the impact of material selection on the transfer of sound energy in Aboriginal and/or Torres Strait Islander Peoples’ traditional musical, hunting and communication instruments
Glossary terms
Amplitude
Cochlea
Compression
Conduction
Conductor
Convection
Crest
Current
Cycle
Displacement
Electricity
Electromagnetic radiation
Gamma ray
Heat
Hertz
Infrared radiation
Insulator
Ionising radiation
Kinetic energy
Longitudinal wave
Mechanical wave
Medium
Microwave
Oscillating
Radio wave
Rarefaction
Seismic wave
Self-propagating
Temperature
Thermal energy
Transverse wave
Trough
Ultraviolet light
Vacuum
Visible light
Voltage
Electromagnetic wave
Electrostatic charge
Free electron
Frequency

Periodic motion
Photon
Pitch
Radiation
Wave
Wavelength X-ray
At the end of this section, I will be able to:
1. Describe the difference between thermal energy and temperature.
2. Explain heat transfer by conduction, convection and radiation.
3. Explain how sound and electrical energy are transferred.
4. Distinguish between forms of energy transfer that require a medium to travel through and those that do not.
The particle model of matter can explain the properties of solids, liquids and gases. According to the particle model:
• all matter is made up of particles
• particles are attracted to each other
• particles are always vibrating in place or moving around
• as temperature increases, particles move or vibrate faster.
Recall from Year 8 that the energy of moving particles of matter is called kinetic energy, and therefore all particles of matter have kinetic energy because they are always in constant motion. Objects at a higher temperature generally have faster moving particles, and therefore a higher average kinetic energy.
The thermal energy of an object or a system relates to the total kinetic energy of its particles. The term heat is used in science to describe the specific thermal energy that is transferred between two objects. In contrast, thermal energy is something an object possesses whether or not there is a transfer of energy (see Figure 8.1).
• High average kinetic energy of particles
• High temperature
• High thermal energy
Hot solid: particles vibrate fast
kinetic energy the energy of moving matter thermal energy the total kinetic energy of all particles in a system heat thermal energy transferred from hotter objects or regions to colder objects or regions temperature a measure of the average random kinetic energy of the particles in an object Heat only transfers this way
Cold solid: particles vibrate slow
• Low average kinetic energy of particles
• Low temperature
• Low thermal energy
Figure 8.1 The particles in hot and cold solid objects of the same mass. The relationship between average kinetic energy of particles, thermal energy, heat and temperature is shown. This diagram also applies to liquids and gases; however, in those cases, the particles are not vibrating, they are moving around.
The temperature of an object is a measure of the average random kinetic energy of all its particles. It tells us what the level of thermal energy is, but not how much thermal energy or heat is present. You can imagine it like the level of water in a dam: that tells us how high it is, but it doesn't tell us how much water there is in total. Heat generally transfers from hotter objects to colder ones, so temperature can indicate whether heat transfer will take place, and in which direction.
Using the particle model, the thermal energy of an object can be explained as the total energy of all its particles due to their movement or vibration. Note that it is the kinetic energy of an object's particles, not the motion of the object itself, that relates to thermal energy.
1. Explain the relationship between the thermal energy and the kinetic energy of an object.
2. Explain what heat is in science.
3. State what temperature measures, in terms of particle theory.
4. Determine whether the particles in a cup of water at 30°C would, on average, move faster or slower than the particles in a cup of water at 45°C.


To change an object's temperature, thermal energy needs to be added (to raise the temperature by heating) or removed (to lower it by cooling). The amount of thermal energy in an object depends on three factors:
• temperature – objects at higher temperatures have more thermal energy than identical objects at lower temperatures
• mass – heavier objects have more thermal energy than lighter ones of the same material and temperature
• material – some materials are better at storing thermal energy than others.
The total thermal energy depends on all three factors. For example, a warm bath at 35°C contains a lot more energy than a cup of hot chocolate at 75°C. The particles in the hot chocolate have greater average kinetic energy than the particles of water in the bath, and the higher temperature of the hot chocolate is a measure of that average kinetic energy. However, the mass of the bath water is much greater than the mass of hot chocolate in the cup. This means that there are many more particles of water in the bath than in the cup of hot chocolate. All those moving particles have greater total kinetic energy, even though their average kinetic energy is less. Therefore, the bath water has greater thermal energy than the hot chocolate.
The specific heat capacity of a substance is the amount of energy that is required to raise the temperature of 1 kilogram (kg) of that substance by 1°C. For example, water has a specific heat capacity of 4200 J/kg/°C, meaning it takes 4200 J to raise the temperature of 1 kg of water by 1°C.
Ensure general fire safety is followed. Use appropriate personal protective equipment when handling hot equipment.
The amount of thermal energy stored or released in a system as the temperature is changed can be calculated using the following equation: change in thermal energy = mass × specific heat capacity × change in temperature
where:
∆Q = change in thermal energy (J) m = mass (kg)
Note: ∆ means ‘change in’. c = specific heat capacity (J/kg/°C) ∆T = change in temperature (°C)
Aim
To investigate the heating of different volumes of water when provided with the same amount of energy
Materials
• Bunsen burner
• heatproof mat
• tripod
• gauze
Method
1. Write a rationale about thermal energy.
• matches
• 600 mL glass beakers × 4
• thermometer
• stopwatch
2. Write a specific and relevant research question for your investigation.
3. Identify the independent, dependent and controlled variables.
4. Write a hypothesis for your investigation.
5. Write a risk assessment for your investigation.
6. Copy the results table below.
7. Put 200 mL of water in a beaker and measure the temperature. Record this in your results table.
8. Remove the thermometer and heat the water over the Bunsen burner for 2 minutes.
9. Stir the water and measure the final temperature after it has been heated. Record this in your results table.
10. Repeat steps 7–9 with 300 mL, 400 mL and 500 mL of water, using a new beaker each time. Make sure the initial temperature of the water is the same.
Results
Copy and complete the following table.
Table showing change in temperature and thermal energy for different volumes of water
1. Calculate the change in thermal energy (∆Q) by using the equation given previously. Remember, 1 L of water weighs 1 kg, so 200 mL of water weighs 0.2 kg.
2. Plot a graph of volume against change in thermal energy.
Discussion: Analysis
1. Identify any trends or patterns in your results.
2. Predict what you think would happen if the following substances were used. You may need to conduct some research on specific heats of different substances. Explain the reasoning behind your predictions.
a) Liquid mercury
b) Sunflower oil
c) Ethyl alcohol
Conclusion
1. Make a claim about the heating of different volumes of water with the same amount of energy.
2. Support your claim by referring to your experimental data, and include potential sources of error.
3. Explain how the data supports your claim.
Try this 8.1 testing water temperature
Take three large containers and fill one with room-temperature water, one with warm water (be careful that it is not too hot) and one with cold refrigerated water. Place one hand in the cold water and the other in the warm water for two minutes. Take your hands out and then place both of them in the room-temperature water. How does the water feel?
Something to think about:
1. Why did you leave your hands in the warm and cold water for two minutes?
2. Why did your hands detect different temperatures when you put them into the room temperature water?
Quick check 8.2
1. Define ‘thermal energy’ of an object.
2. State three factors that the total thermal energy of any object depends on.
3. Explain why a bath of warm water contains more thermal energy than a burning match.
Heat transfer is the movement of thermal energy from an object at a higher temperature to an object at a lower temperature. Heat transfer is generally faster when there is a larger temperature difference between the two objects. As thermal energy is transferred to an object with a lower temperature, the particles within that object will begin to vibrate or move more quickly, which is indicated by an increase in the object's temperature.

Figure 8.3 Keeping warm around a camp fire is an example of a transfer of heat energy.
In Figure 8.3, three types of heat transfer are occurring simultaneously. As you roast your marshmallow over the flames, you notice that heat is travelling along the metal skewer, which is starting to feel warm in your hands – conduction. You might also notice that the air above the fire is hotter than beside the fire and will burn the marshmallows – convection. Finally, as you sit around the camp fire, you feel an intense warmth on your skin – radiation.
When energy is transferred between particles of matter by contact, the process is referred to as conduction. A particle, an object or a region with a higher temperature naturally transfers thermal energy to a particle, an object or a region with a lower temperature. When substances gain energy, their particles start to vibrate faster. If a faster vibrating particle bumps into a slower vibrating one, it transfers some energy to it (see Figure 8.4). This causes the slower vibrating particle to vibrate faster, increasing its kinetic energy. This increases the kinetic energy in the material as a whole, and therefore its temperature.
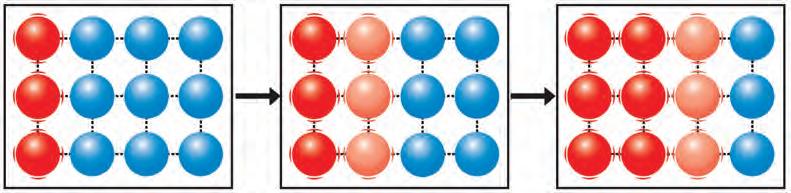
Figure 8.4 A time sequence showing heat flowing through the particles of a solid by conduction. The heat source (not shown) is on the left of the particles. At first, only the particles next to the heat source become hot and vibrate. They bump into particles next to them, which warm up, and so on.
Note that conduction does not only happen in the solid state. A solid surface with a high temperature transfers thermal energy to particles of a cooler gas or liquid that are in contact with it by conduction too.

Conduction occurs when you warm up your hands when holding a hot drink. Your hands warm up because thermal energy is being transferred from the mug to your hand. How would holding the hot drink feel different if it was a polystyrene cup? Or a metal cup? Some substances, such as metals, are good conductors of heat. This is because the electrons in metals can leave their atoms and move around as free electrons. These free electrons move quickly, allowing vibrations (and the associated kinetic energy) to pass more quickly between particles in a metal. This means that thermal energy in metals spreads quickly from areas of higher temperature to areas of lower temperature (see Figure 8.6). Other materials, such as polystyrene, do not conduct heat well; these materials are called insulators
Figure 8.6 Free electrons can travel through metals and help thermal energy spread quickly from hot to
Convection is the flow of thermal energy through a liquid or a gas caused by movement of the liquid or gas itself. Heating water in a pot and warming up a room with a heater are both examples of heating by convection.
Have you ever heard the saying, 'Hot air rises'? In a building with two or more floors connected by an open stairwell, the top floor will be warmer if there are no doors to block the flow of air. When a liquid or a gas is heated, the particles vibrate faster and the space between them increases, causing the liquid or gas to expand. This means that the warmer regions become less dense than the colder regions, and so the colder regions sink and force the warmer regions to rise. Figure 8.7 shows water in a pot being heated from the bottom, causing the hot water to rise. Away from the heat source, at the top of the pan, the water cools again. The water becomes more dense and sinks back down to the bottom where it will be heated again. This cycle is called a convection current.
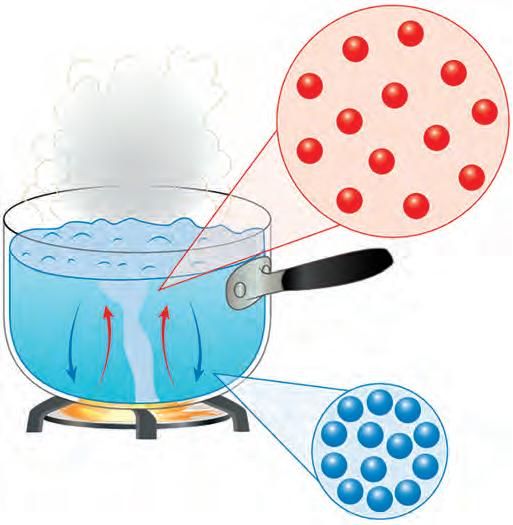
•Particles move faster
•Particles spread out
•Hot fluid is less dense and rises
•Particles move slower
•Particles come together
•Cold fluid is more dense and sinks
Figure 8.7 When water is heated, the hotter, less dense water at the bottom rises and the colder, more dense water sinks to take its place. Note that this drawing is not to scale. In reality, the particles are only slightly further apart.
Convection is a major factor driving weather patterns. The Sun heats Earth's surface, warming the air, which then rises, creating an upward current in the atmosphere. As the warmer air rises, cooler air from elsewhere flows in to replace it and we feel this air movement as wind. As the convection current continues, the air cools as it gets higher, potentially causing any water vapour within it to condense and form a cumulus cloud. Within Earth, convection currents move layers of magma. In the oceans, convection creates currents.
Any object with thermal energy can radiate heat, which doesn't depend on particles to transfer the energy. This type of heat transfer occurs when you stand in direct sunlight or in front of a fire. Thermal radiation, or radiant heat, is a form of electromagnetic radiation (like light and radio waves) and travels in waves. This differs from convection and conduction, as it does not rely on particles and can travel through a vacuum.

Conduction, convection and radiation all play an essential role in nature. All warm-blooded animals can generate their own body heat, and they radiate heat energy. In contrast, cold-blooded animals do not generate their own body heat all the time, so they need to lie in the sunshine to get warm.
Conduct some research on how animals living in cold environments reduce heat loss from conduction, convection and radiation.

Did you know? 8.1
Clothing technology
Australia has a large variety of climatic regions, and various First Nations Peoples have developed different technologies that enable them to live and thrive in even the most extreme climates. For warmth, traditional animal skin cloaks can be worn with the fur lining facing inwards, next to the body. This traps a layer of air and provides valuable insulation. However, during rainy seasons, the cloak is worn with the fur on the outside, because the hairs have water-repellent properties. Fat can be rubbed onto the outside of the fur to further increase insulation. These heat-conserving cloaks reduce thermal conduction, convection and radiation.
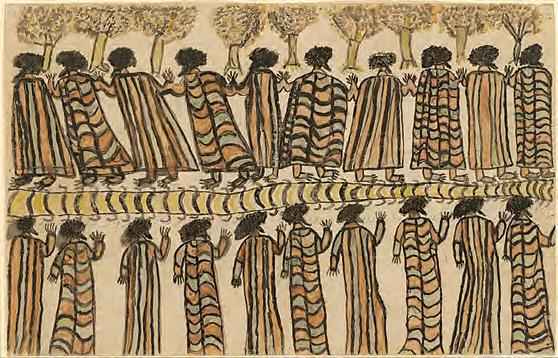
1. State the type of heat transfer that occurs when you burn your hand on a hot plate.
2. Use the particle model to describe thermal conduction in a solid.
3. Describe how thermal energy travels within a liquid or a gas.
Aim
To design your own experiment that tests the effectiveness of different insulating materials
Materials
• soft drink cans
• hot water
• thermometer
Ensure general fire safety is followed.
Use appropriate personal protective equipment when handling hot equipment.
• different materials such as wool, cotton, paper and bubble wrap
• stop watch
Method
1. Conduct some research into insulating materials. Find out some common materials and methods of insulation.
2. Identify the independent variable.
3. Identify the dependent variable.
4. Identify the controlled variables and describe how they will be managed.
5. Develop a hypothesis based on your research.
6. Design an experiment that measures the effectiveness of a range of insulating materials. In a group, discuss ways in which you could do this. Choose the best method and plan the experiments. You must include information on variables, a risk assessment and a step-bystep method for carrying out the experiment.
Results
Record your observations for each of the experiments in an appropriate manner.
Discussion: Analysis
1. Explain whether the results you gathered support your research on insulation.
Conclusion
1. Make a claim regarding your experimental findings, about the effectiveness of different insulating materials.
2. Support your claim by referring to the data you gathered, and include potential sources of error.
3. Explain how the data supports your claim. Justify whether your hypothesis was supported or not.
The particle model can be used to explain conduction and convection, as they both involve the transfer of thermal energy through particles. Although radiation also involves the transfer of thermal energy, it does not require the presence of particles. Thermal radiation is an electromagnetic wave that can travel through empty space where there are relatively few particles. This is why we can feel the warmth of the Sun despite it being about 150 million kilometres away. Therefore, radiation is explained by the wave model.
Conduction
Transfer of thermal energy by direct physical contact between particles
Convection
Transfer of thermal energy by molecular motion in a fluid (liquids and gases)
Mechanism Example
Atoms are always vibrating or moving, but when heat is applied to an object, the atoms closest to the heat source vibrate or move more, so their kinetic energy increases. They ‘bump’ neighbouring atoms, passing on this kinetic energy, thereby allowing heat energy to move through the object or substance.
When a liquid or a gas is heated, the particles vibrate and move faster and the liquid or gas expands. This means that the colder regions are more dense than the warmer regions, and so the colder liquid or gas sinks to the bottom. As it is heated in turn, the material rises to the top, creating a convection current.
Your hands warm up when holding a hot drink. This is because thermal energy is being transferred from the mug to your hand.
Radiation
Transfer of thermal energy without the presence of particles
Radiant heat travels in waves because it is a form of electromagnetic radiation.
Heating water in a pot from the bottom causes the hot water to rise. The cold water sinks and replaces the hot water at the bottom, and is then also heated.
When making toast, the bread does not touch the source of heat. Rather, toasting relies on the transfer of thermal energy through space via radiation.
Sound energy requires a medium to travel through and can be explained using the particle model of matter. However, when particles transfer sound energy, they move in a very different way compared to when they are transferring heat energy. While heat energy relies on the random movement or vibration of particles, the particles that transfer sound energy move in a repeated motion back and forth. The movement of each particle knocks the next one, creating waves that can carry sound energy over long distances. Sound can travel at about 343 metres per second (m/s) in air, but the speed of sound depends on both the temperature and the medium it travels through.

electricity a form of energy that results from the accumulation or the flow of charge
electrostatic charge a charge that stays on an object
insulator
(electricity) a substance or material that does not allow current to flow through it easily
Sound travels faster through solids because the particles are closer together and the energy can be transferred from one particle to the next quicker. Due to the distance between particles in a gas, sound travels slowest in air. The properties of sound waves will be considered in more detail in the next section.


Figure 8.12 The particles in a solid are close together, so sound energy can be transferred quickly. In a gas, the particles are further apart, so sound energy moves more slowly.
Electrical energy can also be explained using the particle model of matter. Recall from Year 8 that electricity is a form of energy that results from either the accumulation of charge or the flow of electrons. The accumulation of charge is called electrostatic charge and can be seen in the example of lightning. In a storm cloud, collisions between ice crystals, rain and dust cause electrons to be transferred between them. This results in the top of the cloud becoming positively charged while the bottom becomes negatively charged. The huge accumulation of negative charge at the bottom of the cloud causes electrons on the Earth's surface to be repelled, leading to a positively charged area beneath the cloud. Air acts as an insulator and prevents the electrons from flowing down to the ground, but as the electrostatic charge increases, it eventually overpowers the insulating effect of the air. A lightning strike occurs when the electrons from the cloud find a path to the ground and meet up with the positive charges on Earth.¸

Try this 8.2 electrostatic charge
Rub a plastic rod with a woollen cloth for 60 seconds. Hold the rod close to a thin stream of water and observe what happens. Can you explain what you observed?
Current electricity involves the movement of electrons, usually through a conductive material, over a period of time. Recall that metals are good conductors of heat because of their free electrons. Metals are also good conductors of electricity for the same reason. The free electrons can flow easily between atoms in the metal, which is why electrical wiring is usually made of metals such as copper.
How do we get electrical current to flow through a wire? The answer is the creation of a difference in electrical potential energy (known as voltage). Voltage pushes electrons in one direction around a circuit. Without voltage, the electrons would move randomly, and there would not be a useful electrical current. Voltage can be supplied by a chemical source such as a battery. The chemical reactions in the battery cause electrons to build up on one side of the battery (the negative terminal), creating a positive charge on the other side (the positive terminal). When a wire is used to connect the terminals, the excess electrons are pushed away from the negative terminal and are pulled towards the positive terminal, creating a flow of electrical current with direction. Free electrons in the metal wire carry electrical potential energy that can be transformed into useful forms of energy if devices are connected in the circuit.

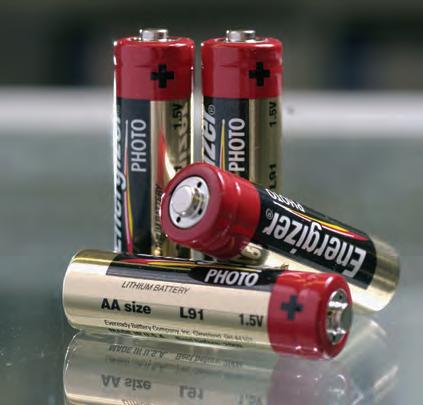
Section 8.1 review Go
Online quiz
Section 8.1 questions
Remembering
1. Define ‘thermal energy’.
Teachers can assign tasks and track results Section questions
2. State the conditions required for conduction to occur.
3. Recall the three factors that determine how much thermal energy is present in an object.
Understanding
4. Explain how an object that has a higher temperature can have less thermal energy than an object that has a lower temperature.
5. Explain why energy is received from the Sun by radiation and not by convection or conduction.
6. Convection occurs in liquids and gases. Explain why convection does not (as a general rule) occur in solids.
Applying
7. An electric oven has a heating element underneath its bottom surface, and two wire racks (shelves), a top and a bottom. It does not have a fan to circulate the air inside. A recipe calls for the baking dish to be placed in the hottest part of the oven. Explain whether you should place it on the top rack or the bottom rack.
Analysing

8. Classify the following as heat transfer by either conduction, convection or radiation.
a) Heat escaping from the bottom of a cup of a hot coffee
b) Heat from a stove plate transferring to a frying pan placed on it
c) An ice cube melting in your hand
9. Differentiate between heat conductors and insulators in terms of their ability to transfer heat quickly.
10. Aria says insulation keeps out the cold. Critique this statement.
Evaluating
11. Decide at what point thermal energy transferring between two substances in contact will stop being transferred.
12. 1 L of gas in a cylinder is rapidly compressed by a piston until it occupies 0.1 L. As a result, the particles of gas have less space to move and they undergo many more collisions, which causes them to speed up. Predict what happens to the temperature of the gas.
13. The temperatures of two cups of water are measured. One is 20°C and the other is 30°C. Using your understanding of temperature and particles, discuss how the movement of the particles in these two cups of water will differ.
At the end of this section, I will be able to:
1. Distinguish between mechanical and electromagnetic waves.
2. Identify different parts of a wave, including the wavelength, amplitude, trough and crest.
3. List the different types of electromagnetic radiation.
4. Label the compressions and rarefactions in longitudinal waves.
During a lightning storm, both light and sound energy are transferred by waves. When you see the lightning, your eyes detect light waves, and when you hear thunder, your ears detect sound waves. We see the lightning before we hear the thunder because light waves travel faster than sound waves.
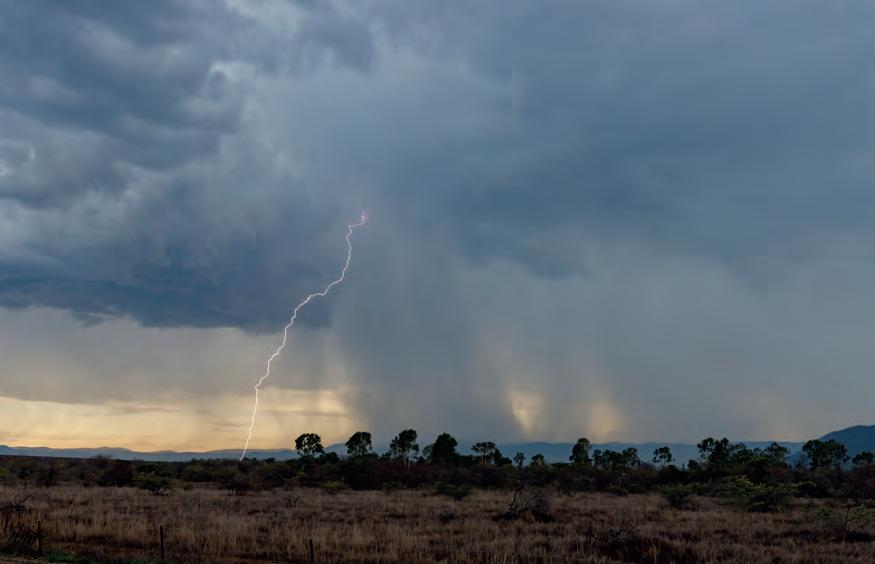
A wave is a carrier of energy that travels through space or matter without the movement of matter. Some waves require matter, known as the medium, to move through. These are called mechanical waves. Sound and water waves are examples of mechanical waves. They create a disturbance in the medium that transfers the energy without the matter moving as a whole.
Another kind of wave, called an electromagnetic wave, can travel through matter but can also travel without a medium, or through a vacuum. Visible light and radiant heat are examples of electromagnetic waves.
Mechanical waves transfer energy from the source of the wave (the origin of the disturbance in the medium). The disturbance results in the transfer of energy by the vibration, or periodic motion, of particles.
wave
a carrier of energy that travels through space or matter without the movement of matter as a whole medium the matter through which a mechanical wave travels
mechanical wave a disturbance in a medium that transfers energy through that medium
electromagnetic
wave a wave with electric and magnetic components that can travel through matter or a vacuum
vacuum a space completely devoid of matter
periodic motion movement of a particle or an object that returns to its starting position and repeats in the same time interval, like a swing
WORKSHEET
Wavelength, frequency and amplitude
transverse wave a wave in which the particles vibrate or move at right angles (perpendicular) to the direction of energy transfer
crest the maximum displacement of a particle at the top of the wave
trough the maximum displacement of a particle at the bottom of the wave
displacement the position of a particle when it has moved away from its rest position on the centre line of the wave
Mechanical waves require a medium, because there have to be particles for the energy to travel through matter. The medium can be in any state – solid, liquid or gas – as long as there are particles present. These particles do not move along the wave; they only transfer the energy of the disturbance to the particles next to them. For example, a fishing float will bob up and down in the water as a ripple passes, revealing the periodic motion of the water particles, but it returns to its original position – it does not travel with the wave (see Figure 8.18).
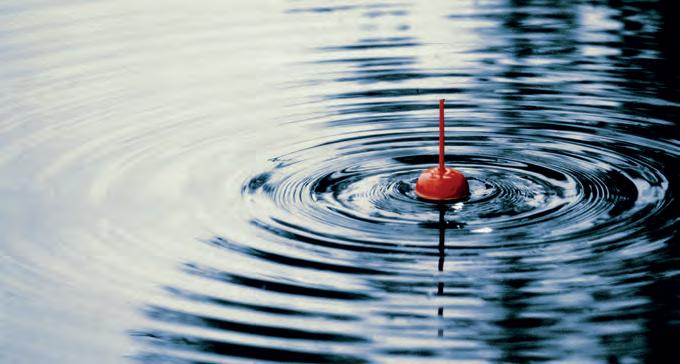
Figure 8.18 As a ripple passes through the medium (water), the fishing float is temporarily displaced, bobbing up and down before returning to its original position.
Depending on how the particles of the medium move relative to the direction of energy transfer, a mechanical wave can be classified as a transverse, longitudinal or surface wave.
Quick check 8.4
1. Define ‘mechanical wave’.
2. Identify the medium of a mechanical wave.
3. List three types of mechanical waves.
A transverse wave is a wave in which the disturbance of the medium is at right angles to the direction of energy transfer (see Figure 8.19).
In mechanical transverse waves, the particles vibrate up and down, about their rest position, creating a series of crests and troughs. Crests and troughs represent the maximum displacement of a particle in the medium at the top and bottom of the wave, respectively.
Transverse wave in a rope
The up-and-down motion of the rope is perpendicular to the direction of the wave.
Direction
Figure 8.19 In a transverse wave, the particles move perpendicular (at right angles) to the direction of the energy transfer.
The number of cycles of a wave per second is called the frequency and is measured in hertz (Hz). The distance measured in metres between two consecutive crests on a wave is called the wavelength. The amplitude of a wave is how far the wave displaces from its middle position (centre line) (see Figure 8.20).
Note that there are three measurements that describe the dimensions of a wave: frequency, wavelength and amplitude. The speed of a wave can be calculated by multiplying the wavelength by the frequency.
(one cycle)
Axis or centre line, the undisturbed or rest position of the particles
Figure 8.20 Describing a transverse wave
Try this 8.3 looking at wavelength and amplitude
Copy the diagram in Figure 8.21, using a ruler to make the sides of the grid squares exactly one centimetre long. On your copy, label the wavelength and amplitude of the waves. Use a ruler to measure these features.
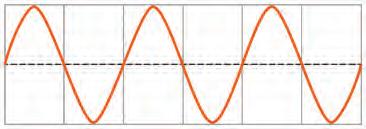
cycle one complete vibration or periodic movement of a particle through the crest and trough of a wave and back to its starting position; the length of a cycle is the wavelength frequency the number of cycles of a wave per second; measured in hertz (Hz) hertz a unit for measuring the number of cycles that happen every second (frequency); abbreviation Hz
wavelength the distance from one wave crest to the next; measured in metres (m)
amplitude the distance (height) of a wave crest or the depth of a wave trough from the centre line of the wave
seismic wave a wave that travels through Earth and over its surface; caused by earthquakes
Quick check 8.5
1. Explain what ‘transverse’ means in relation to waves.
2. Recall the three measurements that describe waves.
The vibrating strings in musical instruments, deep ocean waves and secondary seismic waves are examples of transverse mechanical waves.

oscillating moving back and forth with periodic motion, somewhat like vibration electromagnetic radiation the transfer of energy by electromagnetic waves
self-propagating refers to a wave that (unlike mechanical waves) once started, keeps going at a constant speed forever without needing the input of more energy
photon an electromagnetic wave carrying a specific amount of energy related to its frequency or wavelength
Electromagnetic waves are another example of transverse waves. They consist of oscillating electric and magnetic fields, rather than disturbances in matter. Electromagnetic radiation is the transfer of energy by electromagnetic waves. The waves can transfer energy through a vacuum or through matter, such as when light from the Sun travels all the way to your skin through space, Earth's atmosphere and a glass window.
An electromagnetic wave can be emitted from an atom when an electron jumps from one energy level to a lower one. This creates a changing electric field, which also creates a changing magnetic field. The two vibrating fields combine to create a self-propagating electromagnetic wave. An electromagnetic wave carries energy in specific quantities (related to the frequency or wavelength). These packets of energy are called photons (of light).
8.23 A vibrating charged particle generates vibrating electric and magnetic fields. These fields are perpendicular to each other and to the direction of the wave.


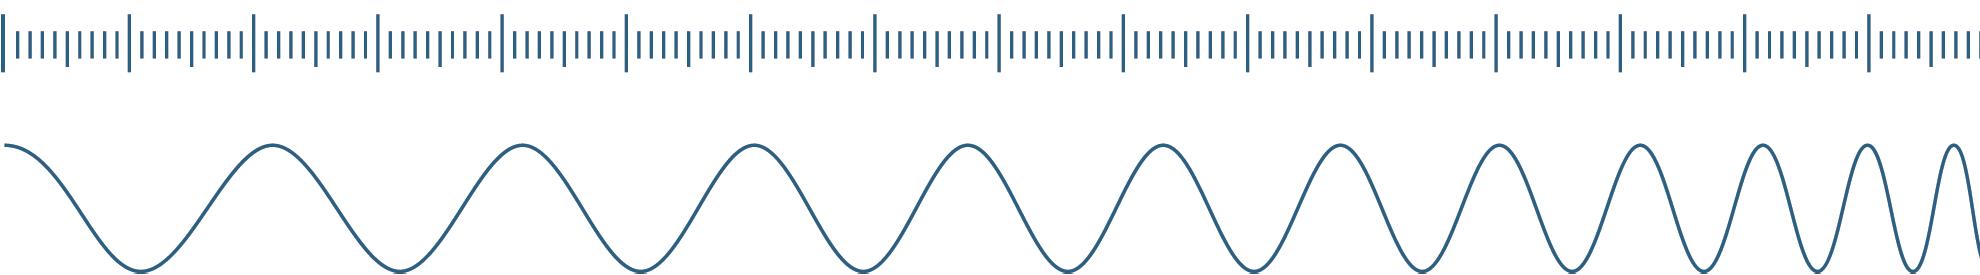
The directions that the electric and magnetic field oscillate in are perpendicular to the direction of the wave, so an electromagnetic wave is a transverse wave.
Unlike mechanical waves, electromagnetic waves all travel at the same speed through a vacuum –the speed of light, c = 3 × 10⁸ metres per second (m/s). The higher the frequency and the shorter the wavelength of an electromagnetic wave, the greater the energy carried by each photon. The relationship between frequency (f ) and wavelength (λ) is described by the wave equation:
λ (m) = c (m/s) f (Hz)
The different types of electromagnetic waves, from lowest to highest energy, and their uses are listed below and illustrated in Figure 8.24.
• Radio waves are useful for communications and signals over long distances (including for radar). Radio waves were originally used for communication with ships at sea, then broadcasts by radio and television stations. They are now also used to send communications around the world via satellites. Radio waves have very long wavelengths (some are several kilometres long), but their energy and frequency are very low.
• Microwaves are used for cooking, Wi-Fi communications and mobile phone technology. In a microwave oven, any water molecules present in food will vibrate at the same frequency as the microwaves and convert this energy into heat, cooking the food quickly. Much longer microwaves are used in mobile phone networks. When a mobile phone is switched on, it produces microwave signals (that you might know as 3G, 4G or 5G) that are picked up by receivers in mobile phone towers. The towers then transmit signals back to the phone for incoming calls, to connect to the internet and to download files, images and video.
• Infrared radiation is the radiation you feel immediately when you stand near a fire or when you feel warmed by the Sun. It is also used in TV remote controls. Objects at a higher temperature release more infrared radiation than similar objects at a lower temperature. Infrared cameras can be used to detect infrared waves being emitted by an object. The signals are then processed to produce a false-colour image showing the relative temperatures of different parts of the object. Similarly, higher-frequency infrared waves can be detected by night-vision technologies to produce false green coloured images.
• Visible light is the section of the electromagnetic spectrum that is visible to the human eye.
• Ultraviolet light is invisible radiation that can cause sunburn and skin cancer. Not all ultraviolet is bad though: skin cells use low-frequency ultraviolet light to make vitamin D.
• X-rays are high-energy electromagnetic waves. They can be used to create images of bones. X-rays pass through soft tissue, such as fat and muscle, but are absorbed by bone. This results in bones appearing white, soft tissue appearing grey and air appearing black in X-ray images. The development of imaging technologies has contributed greatly to our understanding of the functions and interactions of body systems. X-rays can cause cancer, although the radiation dose from medical scans is small.
• Gamma rays are high-energy, high-frequency waves with a short wavelength. They are released when atomic nuclei decay. Although they can cause cancer, they can also be used in its treatment. Gamma rays are also used to sanitise medical equipment or food products by killing any microorganisms that might be present.
radio wave the type of electromagnetic radiation; has the longest wavelength microwave the type of electromagnetic radiation used for cooking, communications and Wi-Fi; lies between radio waves and infrared radiation infrared radiation the type of electromagnetic radiation that lies between microwaves and visible light; also known as heat radiation visible light the part of the electromagnetic spectrum that we can see ultraviolet light a type of electromagnetic radiation that lies between visible light and X-rays; is needed by our bodies to make vitamin D; short-wavelength ultraviolet light can cause sunburn and cancer
X-ray a type of electromagnetic radiation; has short wavelengths and can pass through flesh to give images of bones; hazardous and can cause cancer
gamma ray a type of electromagnetic radiation; has high energy and a very short wavelength; produced when certain radioactive atoms decay
ionising radiation
higher-frequency ultraviolet rays, X-rays and gamma rays, which can turn atoms and molecules into ions, and which can potentially damage living cells
The higher the frequency and the shorter the wavelength of an electromagnetic wave, the more energy its photons carry. Higher-frequency ultraviolet rays, X-rays and gamma rays have enough energy to knock electrons off atoms, to form ions. This is referred to as ionising radiation, and it damages living cells.


8.25 (a) Communication towers send and receive microwaves to mobile phones. (b) TV remote controls use infrared radiation to transmit signals to a TV. The remote must be pointed at the TV to work, because obstructions will block the infrared radiation from reaching the TV.
Prepare a sachet of gelatine according to the packet instructions, except add only half of the indicated volume of water. Pour the gelatine into a square container or mould, ensuring that the container is small enough to make a thick gelatine shape. Leave it in the fridge to set overnight.
Carefully remove the gelatine from the container. If any edges get damaged, trim them with a knife so the faces of the block are smooth. Use a lightbox or a laser pointer to shine a beam of light through the gelatine. Record your observations about how the light is bent when it travels through the gelatine.
Repeat the experiment with different shapes of gelatine. Explore! 8.2
We are all exposed to small amounts of ionising radiation in daily life. This is commonly referred to as background radiation. Its effect on the body is negligible because the exposure is so low. Under controlled conditions, the use of X-rays on living tissue is safe. In fact, the radiation dose from an X-ray is not much greater than that of background radiation. For example, a chest X-ray is equivalent to 2.4 days of exposure to natural background radiation, while a CT (computed tomography) scan, which also uses X-rays, of the abdomen is equivalent to 2.7 years of natural background radiation. X-ray imaging has different effects on different tissues.
Conduct some research to find out the different X-ray procedures and their associated natural background radiation equivalents and discuss why they have different values.
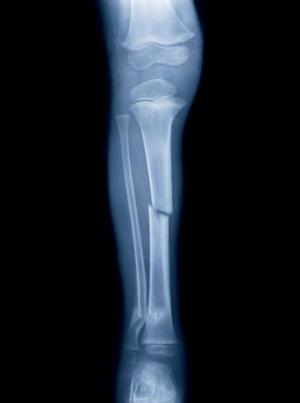
8.26 X-rays are used as a diagnostic tool in medicine.
see, think, wonder: the night sky
See: Observe the night sky as seen from a town in Victoria in Figure 8.27.
Think: Where does the light in the night sky come from? How long does it take for the light to reach your eyes from distant space?
Wonder: What could the light from the night sky tell scientists about the age of the universe? What questions do you have after thinking about the lights in the night sky?

The See, think, wonder thinking routine was developed by Project Zero, a research centre at the Harvard Graduate School of Education.
Did you know that an Australian invented Wi-Fi? This physicist and engineer was actually studying radio waves emitted from black holes and built a machine to detect these weak signals. This machine allowed computers to communicate wirelessly.
Conduct some research to answer the following questions.
1. Who is credited with inventing Wi-Fi?
2. When was Wi-Fi patented?
3. How does Wi-Fi work and what type of waves does it use?
4. What are some applications of Wi-Fi?
The Monash Vision Group at Monash University in Melbourne has been developing their Gennaris bionic vision system, also called the ‘bionic eye’. Functioning eyes detect visible light waves, and then nerve impulses are sent to the brain to construct an image. For many people who are blind, their optic nerves do not work and so nerve impulses are not sent to the brain when the eyes detect visible light waves.
The bionic eye consists of wearable glasses and a headset. The glasses contain a camera that detects visible light waves. The headset contains a vision processing unit, which wirelessly interacts with an implanted tile in the user’s head. The implanted tile then sends nerve impulses into the brain in the same way that a functioning optic nerve would. It is predicted that users will gain enough sensory information to be aware of their surroundings in both indoor and outdoor environments!


Did you know? 8.2
As wireless companies roll out their next-generation 5G networks around the world, people are both excited for the faster download speed and reduced delays and, in some cases, worried about possible impacts.
In Victoria, 4G networks work at frequencies between 700 megahertz and a few gigahertz. In contrast, 5G uses two bands: one below six gigahertz and another above 24 gigahertz. Waves above one gigahertz are classified as microwaves; waves below one gigahertz are classified as radio waves.
Some people fear that 5G may behave like ionising radiation, which has been linked to cancer. Any wave that has a higher frequency than violet light is ionising radiation. So, for 5G these fears are unfounded. The frequency of 5G is so low that it cannot ionise any atoms.
A more realistic concern, raised by meteorologists, is that 5G networks could disrupt weather forecasts from satellites because the frequencies used for 5G are extremely close to the frequency at which water molecules vibrate (23.8 gigahertz).
Weather satellites use this frequency to track the water vapour in the atmosphere to give accurate weather forecasts. As the frequencies are so close, 5G networks may interfere with weather satellites, reducing the reliability of the models that predict dangerous storms. One implication of this is that early evacuation warning systems may be affected.
wave summary

Table 8.2 summarises information about transverse waves.
Type of wave
How energy is transferred
Mechanical waveAs vibrations in particles between adjacent particles in a medium
Electromagnetic waveCarried as oscillating electric and magnetic fields
Table 8.2 The two types of transverse waves
Is a medium required for propagation?
Yes
No
Examples
The strings in musical instruments, deep ocean waves, seismic waves
Radio waves, microwaves, infrared light, visible light, ultraviolet light, X-rays, gamma rays
1. State which forms of radiation can be harmful to humans.
2. State two uses of radio waves.
3. State the wavelength range of microwaves.
4. Compare radio waves and microwaves.
5. State what property an object should have in order to emit a large amount of infrared radiation.
A longitudinal wave is a wave in which the particles of the medium oscillate (that is, vibrate) parallel to (in the same direction as) the energy transfer. The particles vibrate back and forth. As can be seen in Figure 8.30, longitudinal waves have areas where the particles (coils of a spring in this case) are close together and areas where they are spread apart. The places where the particles in a medium are closer together are called compressions, and the places where the particles in the medium are further apart from each other are called rarefactions. If a wave has more energy, then the particles in compressions are closer together and the particles in rarefactions are further from each other.
Longitudinal wave in a spring
The back-and-forth motion of the coils of the spring is in the same direction as the wave travels.
Sound is a longitudinal wave because the air particles vibrate backwards and forwards in the same direction as the travelling sound wave. The motion of sound through the air is similar to when you move the end of a slinky forwards and backwards quickly to send a series of pulses through the spring (Figure 8.31). When a sound wave passes through air, the movement of the particles is in a pattern that consists of regions of high pressure (compression) and regions of low pressure (rarefaction). Sound is a mechanical wave and therefore needs a medium to travel through, but the medium does not have to be air – it can also be a solid or a liquid. Sound travels faster through solids and liquids, where the particles are close together, than it does through air. It cannot travel at all through a vacuum (where there are no particles).
longitudinal wave a wave with vibrations that move in the direction of travel instead of transversely; e.g. sound waves compression the part of a longitudinal wave where the particles are squashed together rarefaction the part of a longitudinal wave where the particles are spread out
CompressionRarefaction
Direction of travel
Direction of travel
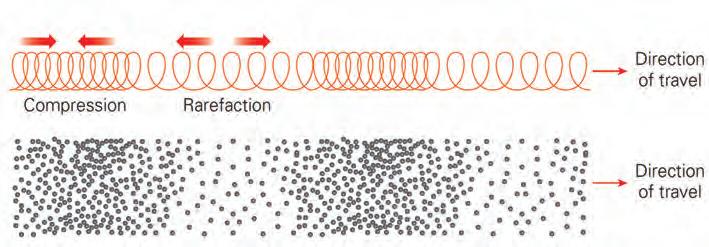
Stretch out a slinky along the floor until it is a couple of metres in length. Create vibrations in the slinky by moving the coils back and forth. Observe the areas of compression and rarefaction that move along the length of the slinky.
Aboriginal and Torres Strait Islander Peoples have developed various technologies and processes involving the transfer of sound. Some instruments are used for playing music; others are used for communicating or hunting. One example of a musical instrument is the didjeridu. The name didjeridu is believed to have come from a Western, non-Indigenous interpretation of the instrument's sound rather than from an Aboriginal language. The term is thought to have been created by British colonists or anthropologists in the early twentieth century, as an attempt to mimic the rhythmic drone produced when the instrument is played.
First Nations Peoples of northern Australia, where the instrument originates, have their own names for it in their respective languages. Some of these include:
• Yidaki from Yolngu Matha languages in Arnhem Land in the Northern Territory
• Mago from Western Arnhem Land in the Northern Territory
• Mandapul, which is used by some Yolngu groups instead of Yidaki.
Conduct some research on the didjeridu to answer the following questions.
1. How old is the didjeridu thought to be?
2. Describe the materials used for the construction of a didjeridu.
3. How does the length and flare end of a didjeridu affect the sound it makes?
4. Outline how a didjeridu produces its unique sound, including all components that play a role.

Figure 8.32 The didjeridu is traditionally made from a tree trunk or branch, most commonly eucalyptus, that has been naturally hollowed out by termites. In some regions, bamboo has also been used. The selection and preparation of the instrument require deep cultural knowledge, as the right piece must be carefully chosen, shaped and sometimes further refined to create the desired sound.
Quick check 8.7
1. Define ‘sound’.
2. Define: a) compression b) rarefaction.
3. Explain why sound travels faster in solids.
4. Explain how sound is an example of a longitudinal wave.
In the same way that we can describe the properties of the transverse waves of the electromagnetic spectrum, we can also describe the properties of the longitudinal waves of sound. First, let's review the terms 'wavelength', 'frequency' and 'amplitude'.
• Wavelength (unit = metre) is the distance between two compressions or rarefactions of a wave. The greater the distance between two points of maximum compression, the longer the wavelength.
• Frequency (unit = hertz) is the number of cycles (complete waves or vibrations) that pass a point each second. The more cycles or wavelengths that pass in a second, the higher the frequency.
• Amplitude (unit = metre) is the maximum displacement of particles from their undisturbed position. This is the displacement amplitude. In a sound wave, which has regions of high and low pressure, the pressure amplitude is the difference between the maximum pressure in a compression and atmospheric pressure.
Figure 8.33 A sound wave represented as a graph of change in air pressure over distance or time. The air pressure change with no sound is 0, and + and – represent an increase or decrease in pressure. The diagram above the graph shows the space between the air particles and the regions of compression and rarefaction. Amplitude and wavelength now appear as they do for a transverse wave. Note that the graph is the same shape whether air pressure or the change in air pressure is plotted, and whether time or distance is on the horizontal axis.
The pitch of a sound is how high or low on a music scale (not sound volume) it seems to our ears. The pitch of a sound wave is determined by its wavelength and therefore its frequency. Decreasing the wavelength increases how many wavelengths pass each second (frequency), and this increases the pitch of the sound. Low-pitched sounds have a long wavelength, whereas high-pitched sounds have a short wavelength.
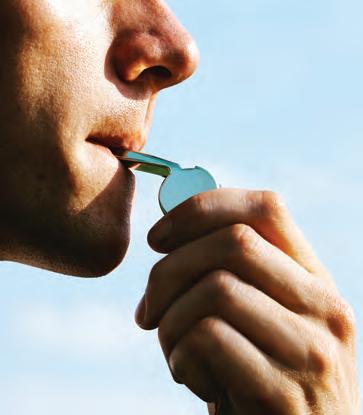

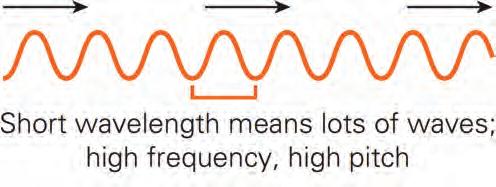
Short wavelength means lots of wavelengths per second; high frequency, high pitch

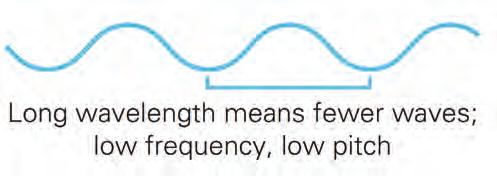
Long wavelength means fewer waves; low frequency, low pitch

Figure 8.35 Which of the two waves do you think would be a whistle and which would be a bass guitar?
The energy of a wave depends on its amplitude as well as its frequency. You might notice that not all water waves look the same: some waves are bigger than others. Amplitude is the maximum height of a wave from its resting position. If you were able to see sound waves, you would notice that loud sounds have a higher amplitude than soft sounds. When a drum is hit harder with more energy, it sounds louder – the loudness of the sound is a measure of the amount of sound energy. The unit of measurement for loudness of sound is the decibel (dB). The loudness of a normal conversation is usually about 60 dB. A rock concert is about 105 dB. Humans can hear sounds as low as 0 dB – this limit is called the threshold of hearing. Anything at around 85 dB can start to damage your hearing. Sounds louder than 120 dB can quickly cause irreversible damage.
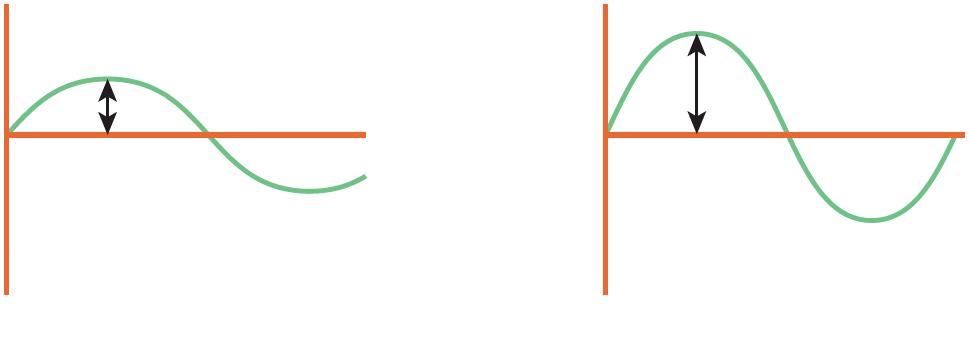
Figure 8.36 The amplitude of a sound wave indicates the loudness of the sound.

Aim
To hear and observe vibrations in the air
Materials
• tuning fork
• rubber stopper
• 100 mL beaker containing water
Method
1. Strike the tuning fork on a soft surface, such as the rubber stopper.
2. Place the tuning fork stem on the sounding board. Can you hear the sound clearly?
3. Repeat step 1 and lightly touch the vibrating ends of the tuning fork to the surface of the water.
4. Observe what happens to the water.
Results
Record your observations.
Discussion: Analysis
1. Explain what you heard when you held the tuning fork to the sounding board. How does it work? Note that pianos also have a sounding board to make the sound of their vibrating strings louder.
2. Describe what happened when you touched the ends of the tuning fork to the surface of the water. Explain why this happened.
3. Could you identify areas of compression and rarefaction in the water?
Conclusion
1. State whether the aim was achieved.
2. Support your statement by summarising your observations.
Quick check 8.8
1. Define the following terms and include the units.
a) Frequency
b) Wavelength
c) Amplitude
2. Consider the sound waves A–D, shown as pressure against time. A C B D
Identify which wave:
a) has the highest frequency
b) has the longest wavelength
c) would have the highest pitch
d) is the loudest.
Lightning speeds
determining the distance to a lightning strike
During a storm, it usually takes a few seconds for the sound to travel from the lightning flash to your ears. This is because light travels about 1 000 000 times faster than sound, which travels at about 340 m/s.
Figure 8.37 shows the relationship between the distance to the flash of lightning and the time delay before hearing the sound. Do you see any pattern in the graph?
Look carefully and you will see that the line of the graph runs close to the points (3, 1000), (6, 2000) and (9, 3000).
This gives a simple rule for calculating the distance to a lightning strike: every 3 seconds is about 1000 m or 1 km.
Earphone technology has now progressed to ‘active’ noise cancellation, in which a microphone on the earphone detects nearby sound waves and actively cancels them. This type of earphone technology can cancel sound waves up to about 75 dB, which provides users with a very immersive listening experience.
Conduct some research on how active noise cancellation works. Discuss the science with a partner.

Science as a human endeavour 8.2
Some people who experience mild hearing loss wear a hearing aid. Hearing aids make sounds louder so people with hearing loss can participate in everyday life more effectively. However, some people have severely impaired hearing and cannot hear any sounds at all. This kind of impairment can sometimes be solved with a cochlear implant, pioneered in Australia by Professor Graeme Clark.
Unlike a hearing aid, which is worn outside the ear, a cochlear implant is surgically placed inside the ear. It consists of a microphone worn outside the ear to detect sounds and a processor that can be worn in a pocket that converts the sound into electrical signals. These signals are sent to the implant in the cochlea, which stimulates the auditory nerve and allows the patient to hear.
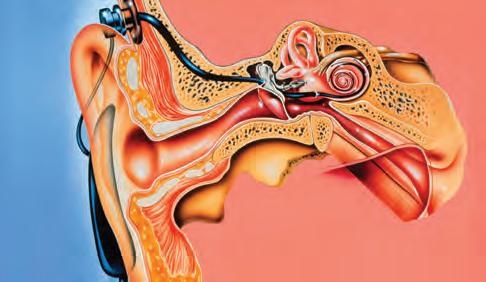

8.3
Excessive noise can damage the delicate hearing cells in the inner ear. People who work with noisy machinery can be exposed to sounds above 85 dB, which can damage their hearing with prolonged exposure. If the delicate cells that detect sound in the inner ear are damaged, they cannot be replaced. This can cause hearing loss, or a disorder called tinnitus, in which a person hears a permanent ringing noise in their ears. To prevent this from occurring, people who are constantly exposed to loud sounds wear ear defenders to protect their hearing.
8.41 People who work with aircraft can be exposed to sounds above 140 dB, so they wear ear defenders.

Try this 8.6 sound insulation
Some students at a Victorian school were comparing the published sound insulation data of some materials found at school with data they obtained by experimenting in science class. Their results are as follows.
1. Construct a column graph to present this data.
2. Describe any trends in the data.
3. Explain a reason for any observed trends in the data obtained by the students in comparison to the published data.
surface waves
Surface waves travel along the interface between two different surfaces. For example, water waves travel along the interface between water and air. Some surface waves are neither completely transverse nor completely longitudinal. For example, in a wave on the surface of a body of water, the individual particles move in a circle before returning to their original positions.
Making thinking visible 8.2
Connect, extend, challenge: the speed of light and sound waves
The speed of light and sound changes in different media, as shown in the table.
of wave
1. What prior knowledge do you have that could help to describe the trends in the data?
2. Explain the trends in the table of data. Why is it that sound waves cannot travel in a vacuum?
3. Are there trends in the data that are difficult for you to explain? What are they?
The Connect, extend, challenge thinking routine was developed by Project Zero, a research centre at the Harvard Graduate School of Education.
In the previous section, you learned how energy can be transferred according to the particle model through conduction and convection. In this section, you have seen how energy can also be transferred in transverse or longitudinal waves. Table 8.3 compares the wave and particle models of energy transfer.
Feature
Carries/transfers
energy
Has a measurable speed
Has a frequency, wavelength and amplitude
Carries matter from one place to another
Yes
Wave model
Mechanical waves are carriers of energy through a medium, and electromagnetic waves can transfer energy as radiation.
Yes
The frequency, wavelength and speed are all related.
Yes
Frequency, wavelength and amplitude are properties of waves.
No
Electromagnetic fields do not need matter as they are oscillations in electric and magnetic fields. In mechanical waves, the particles vibrate or move with periodic motion, returning to their original position once the wave has passed.
Particle model
Yes
Particles can transfer energy through conduction and convection. They also play a role in mechanical waves.
Yes
The speed of a particle may relate to its thermal energy.
No
Frequency, wavelength and amplitude are not properties of particles.
Yes
Particle collisions due to kinetic energy result in the movement of matter from one place to another.
tasks and track results
Section 8.2 questions
Remembering
1. State the types of electromagnetic radiation that are beyond the visible spectrum.
2. Identify the wavelength range of radio waves.
3. Recall the terms for the high-pressure and low-pressure areas of a sound wave. Understanding
4. Explain how microwaves heat up food.
5. Explain what is meant by the term ‘longitudinal wave’.
6. Explain why sound cannot travel through the vacuum of space.
7. Explain why you see the flash of lightning before you hear the thunder.
Applying
8. Identify the correct words to complete the following sentences.
a) Pitch is determined by the ____________________ of a sound wave.
b) Loudness is determined by the ____________________ of a sound wave.
9. The speed of light in air is 299 704 645 m/s. Calculate how long it would take for light to reach the following destinations from Melbourne. Hints: Convert the distances to metres. Divide each distance by the speed of light.
a) Adelaide (726 km)
b) Brisbane (1781 km)
c) Canberra (662 km)
d) Perth (3406 km)
10. You see a flash of lightning and 20 seconds later hear the thunder. Calculate how far away the storm is.
11. A wave has a frequency of 5 Hz and a wavelength of 3 m. Interpret what this means.
12. Compare microwaves and gamma rays.
13. Use the image below to determine why the loudness of a sound decreases as you move away from the source of the sound.

Chapter checklist
Success criteria
Linked questions
8.1I can describe the difference between thermal energy and temperature4
8.1I can explain heat transfer by conduction, convection and radiation11, 12
8.1I can explain how sound and electrical energy are transferred 9, 10, 17, 18
8.1I can distinguish between forms of energy transfer that require a medium to travel through and those that do not 3, 6, 7, 18
8.2I can distinguish between mechanical and electromagnetic waves2
8.2I can identify different parts of a wave, including the wavelength, amplitude, trough and crest 1, 5, 13, 14, 15
8.2I can list the different types of electromagnetic radiation 16
8.2I can label the compressions and rarefactions in longitudinal waves8
Review questions
Remembering
1. State the unit of frequency of waves and describe what it measures.
2. Identify the correct words related to the direction of wave travel to complete the following sentence.
Sound waves are ______________ waves, whereas electromagnetic radiation is made up of ______________ waves.
3. Recall which types of energy need a medium to travel through.
4. State the difference between temperature and thermal energy.
5. Define: a) wavelength c) amplitude b) frequency d) pitch.
Understanding
6. Explain what is necessary for a sound wave to travel from one place to another.
7. Two astronauts are completing a space walk outside the International Space Station. a) Explain why radios are necessary for communication between the two astronauts. b) Imagine that the radios were broken. Describe some other ways the astronauts could communicate.
8. Describe the difference between compression and rarefaction.
9. Explain what a good electrical insulator is and give an example of where it may be used.
10. Propose a reason why electrical wires are made from copper, rather than gold or silver, when sending power from power stations into households.
11. Contrast convection and radiation in terms of thermal energy transfer.
12. Radiant heaters work by emitting infrared radiation. Explain how these heaters can directly heat objects in front of it, rather than heating the air in the room like convection heaters.
Analysing
13. Identify whether altering the frequency or altering the amplitude would be required in the following situations.
a) Singing a higher pitched note
b) Going from a high note to a low note on the guitar
c) Changing from talking to whispering
14. Analyse the graph and determine the:
a) amplitude
b) wavelength
c) frequency.
15. Determine which of the waves below has the:
a) highest pitch and loudest sound
b) quietest sound
c) lowest frequency and loudest sound.
16. Identify some examples of objects that are similar in size to the wavelengths of the following types of radiation. One has been completed for you.
Type of radiation
Radio waves
Microwaves
Infrared
Visible light
Wavelength Object
1 metre to a few kilometresBuildings
1 millimetre (mm) to 1 m
1 mm to 0.7 micrometres (μm)
700 nanometres (nm) to 400 nm
Ultraviolet 400 nm to 10 nm
X-rays shorter than 10 nm
Gamma rays
Evaluating
10 picometres (pm)
17. Propose why household wires are coated in plastic.
18. A person standing 1 km away shoots a gun. You see the flash of light to indicate that the gun has been fired but you do not hear anything immediately.
a) State why this is the case.
b) If it takes 3 seconds from seeing the gun fire to hearing the gunshot, calculate the speed of the sound.
c) Discuss how close this value is to the actual speed of sound.
d) Propose some reasons why your calculated speed of sound may be different from the actual speed of sound.
A 20-year-old took their 80-year-old grandparent for a hearing loss evaluation and decided to take the auditory test as well. An audiogram shows the lowest volume at which a person can hear a sound at a particular frequency. (Note that the values on the vertical axis are in decreasing order.)
The audiogram results for the 20-year-old and the 80-year-old are illustrated in Figure 8.42. Hearing is considered normal if you can hear sound volumes over 30 dB at a particular frequency. Hearing loss is considered moderate if you require volumes of 30–60 dB, and severe if you can only hear sound volumes over 60 dB.
Figure 8.42 An audiogram for a 20-year-old and an 80-year-old
Applying
1. Identify which person required a louder sound to hear at a sound wave frequency of 2000 Hz.
2. Determine the lowest volume of the 1000 Hz sound wave that can be heard by the 20-year-old based on the test.
3. Recognise which person displays hearing loss.
Analysing
4. Identify a trend in volume and frequency for both the 20-year-old and the 80-year-old.
5. Analyse the plot for the 80-year-old and find any frequencies where the person experiences severe hearing loss.
6. Contrast the two data sets between the frequencies of 1000 Hz and 2000 Hz.
Evaluating
7. Following the trend in the data, deduce the lowest volume at which the 20-year-old can hear a frequency of 9000 Hz.
8. Predict whether the 80-year-old would more easily hear a person talking or a higher pitch bird whistle of the same volume.
9. The outcome of the test was that the 80-year-old is living with ‘moderate low-pitch hearing loss and severe high-pitch hearing loss’. Justify whether this statement is accurate.
For most of us, music is part of our lives – whether you listen to music, play an instrument or even create your own music. Music can be defined as sounds that are organised in time and that vary in pitch (the frequency of the sound), dynamics (loudness and softness) and timbre (the tone of the sound).
All musical instruments have three main components:
• a primary vibrator that produces the sound (for example, a violin string when you draw a bow across it, or a flute mouthpiece when you blow across it)
• a primary resonator that amplifies the sound (for example, the space inside a violin or a flute)
• an opening for the sound to effuse (flow out) from (for example, the f-holes of a violin or the open end of a flute).
Pitch is varied in different ways depending on the type of instrument. In a wind instrument, the pitch is varied by changing the length of the tube (usually by opening and closing holes). In a stringed instrument, the pitch can be varied by changing the tension in the string, the length of the string or the mass (thickness) of the string.
Musical instruments have been developed by every human culture in history – making music is a universal human trait. Studies have shown that listening to music can reduce anxiety, depression and even pain, and it can improve memory, mood and sleep. Learning to play an instrument has positive effects on the brain, which translate to other areas of learning. Because music strengthens neural pathways, it can also help to delay ageing of the brain.


Historically, people with some types of disabilities have been limited in the ways they can engage with music, because of the fine motor skills usually associated with learning to play an instrument. Engineers have been able to modify existing instruments or design new ones to help people with disabilities engage with music.
DESIGN BRIEF
Design and build an accessible musical instrument from recycled materials.
In small groups your task is to design and build a musical instrument that is accessible to people with a disability or elderly people. The first step will be to decide the needs you would like to cater for. You may have to do some research to better understand the potential problems that elderly people or people with a particular disability may encounter in using traditional instruments.
• plastic containers
• elastic bands
• bottles
• icy-pole sticks
• scissors
• cardboard
1. Discuss in your group which condition you will cater for, and research how this condition affects the ability to play a musical instrument.
2. Discuss in your group which type of instrument you will focus on. Will you build a woodwind, string or percussion instrument? (It might be difficult to find the resources to build a brass instrument.)
3. Research all the components required for the instrument you are going to build, and list all the ways you can change pitch and/or volume of sound.
4. As a group, make multiple sketches each and work out which design would be most effective.
5. Design your prototype and focus on how it can be made from sustainable materials.
6. Build your prototype and test the sound quality produced by your instrument.
7. Discuss the challenges you experienced when designing and building your musical instrument and list the methods you used to overcome these.
8. Describe the method by which your instrument produces sound and changes pitch.
9. Evaluate how easy or difficult it is to use or learn your instrument.
10. Suggest some improvements to your instrument that could make it easier to use.
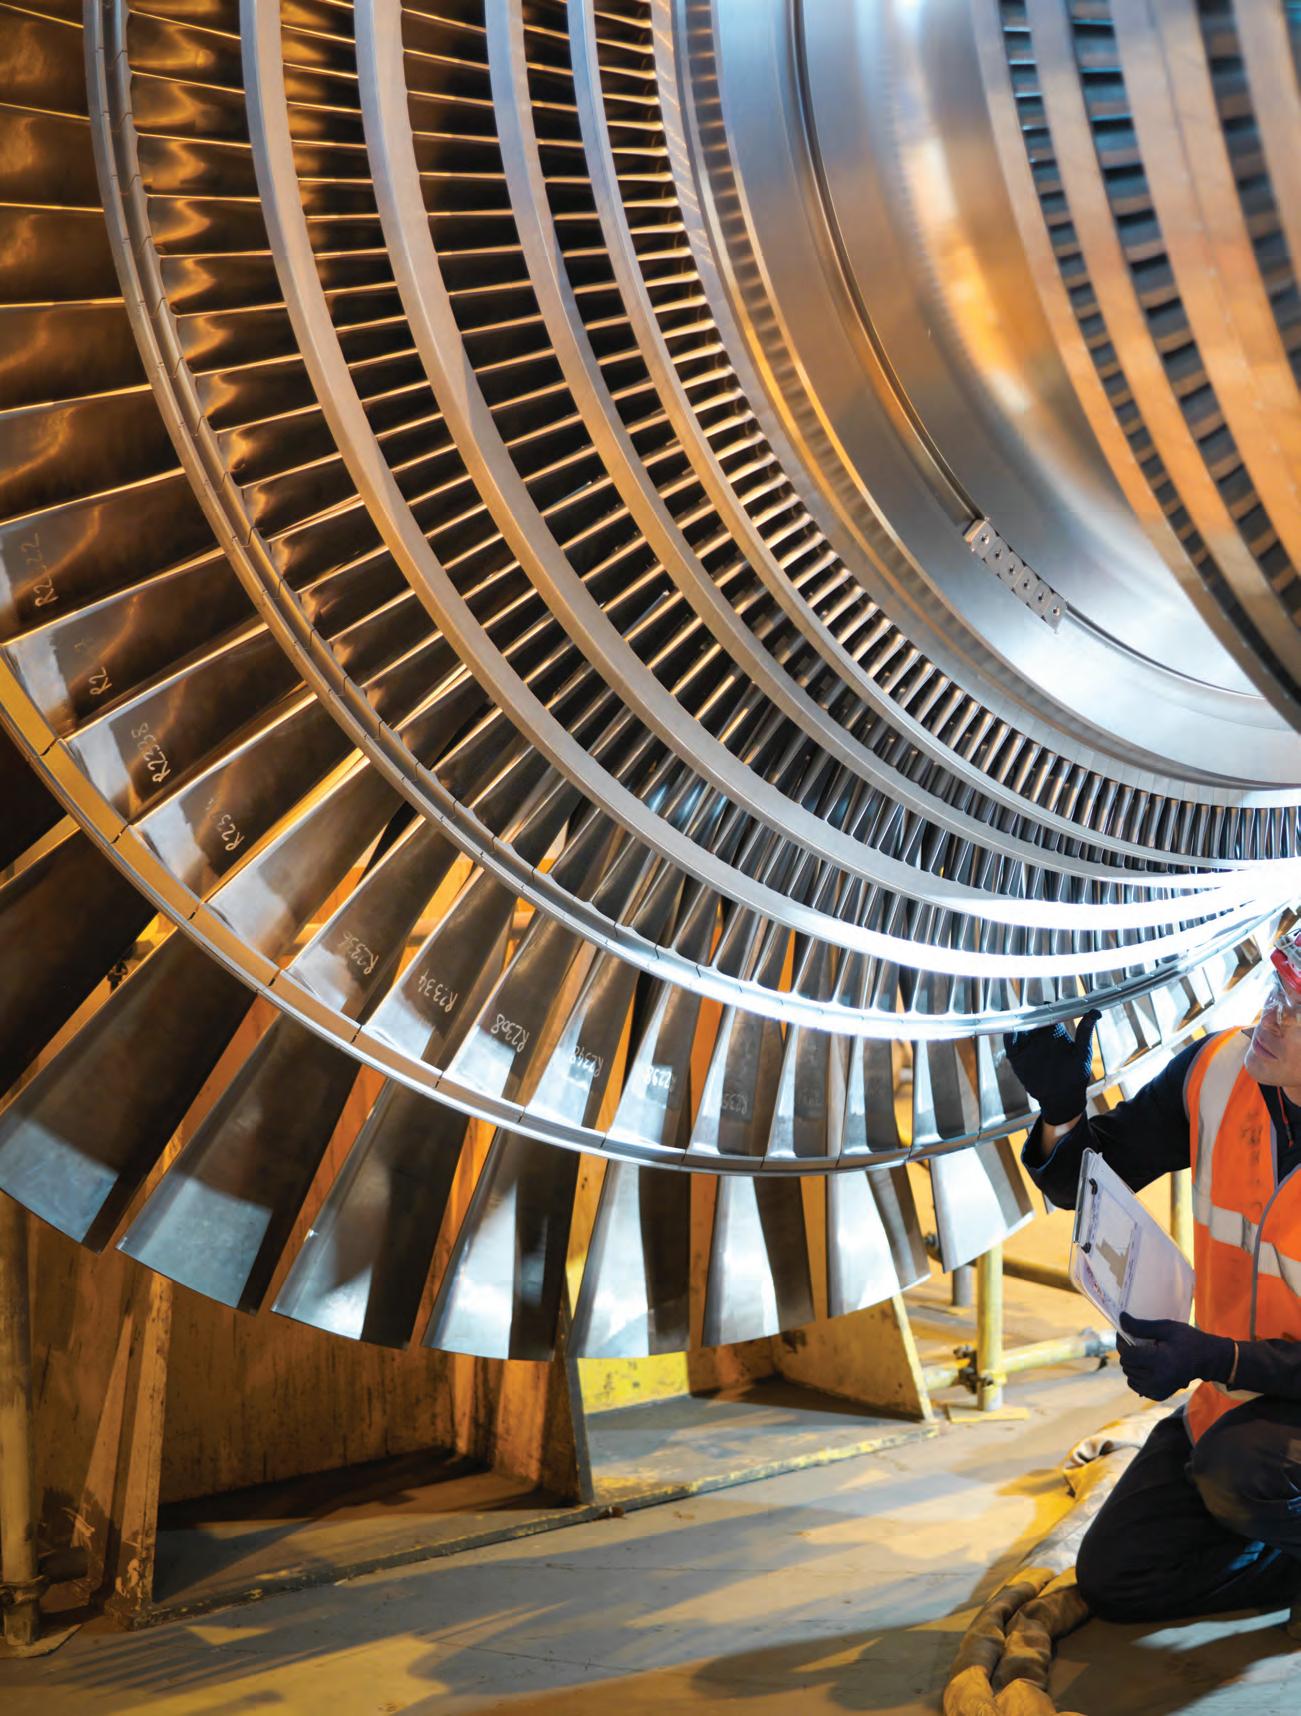
This chapter is all about the generation of electricity. You will revise magnetism and learn how electromagnetism enables motion to be converted into electricity. You will look at how to build a simple alternating current generator and learn what sources of energy can be used to provide the motion to turn it. You will also learn how batteries and photovoltaic cells can be used to generate direct current. Alongside this, you will learn how scientists and electrical engineers contributed to our current understanding of how to generate electricity.
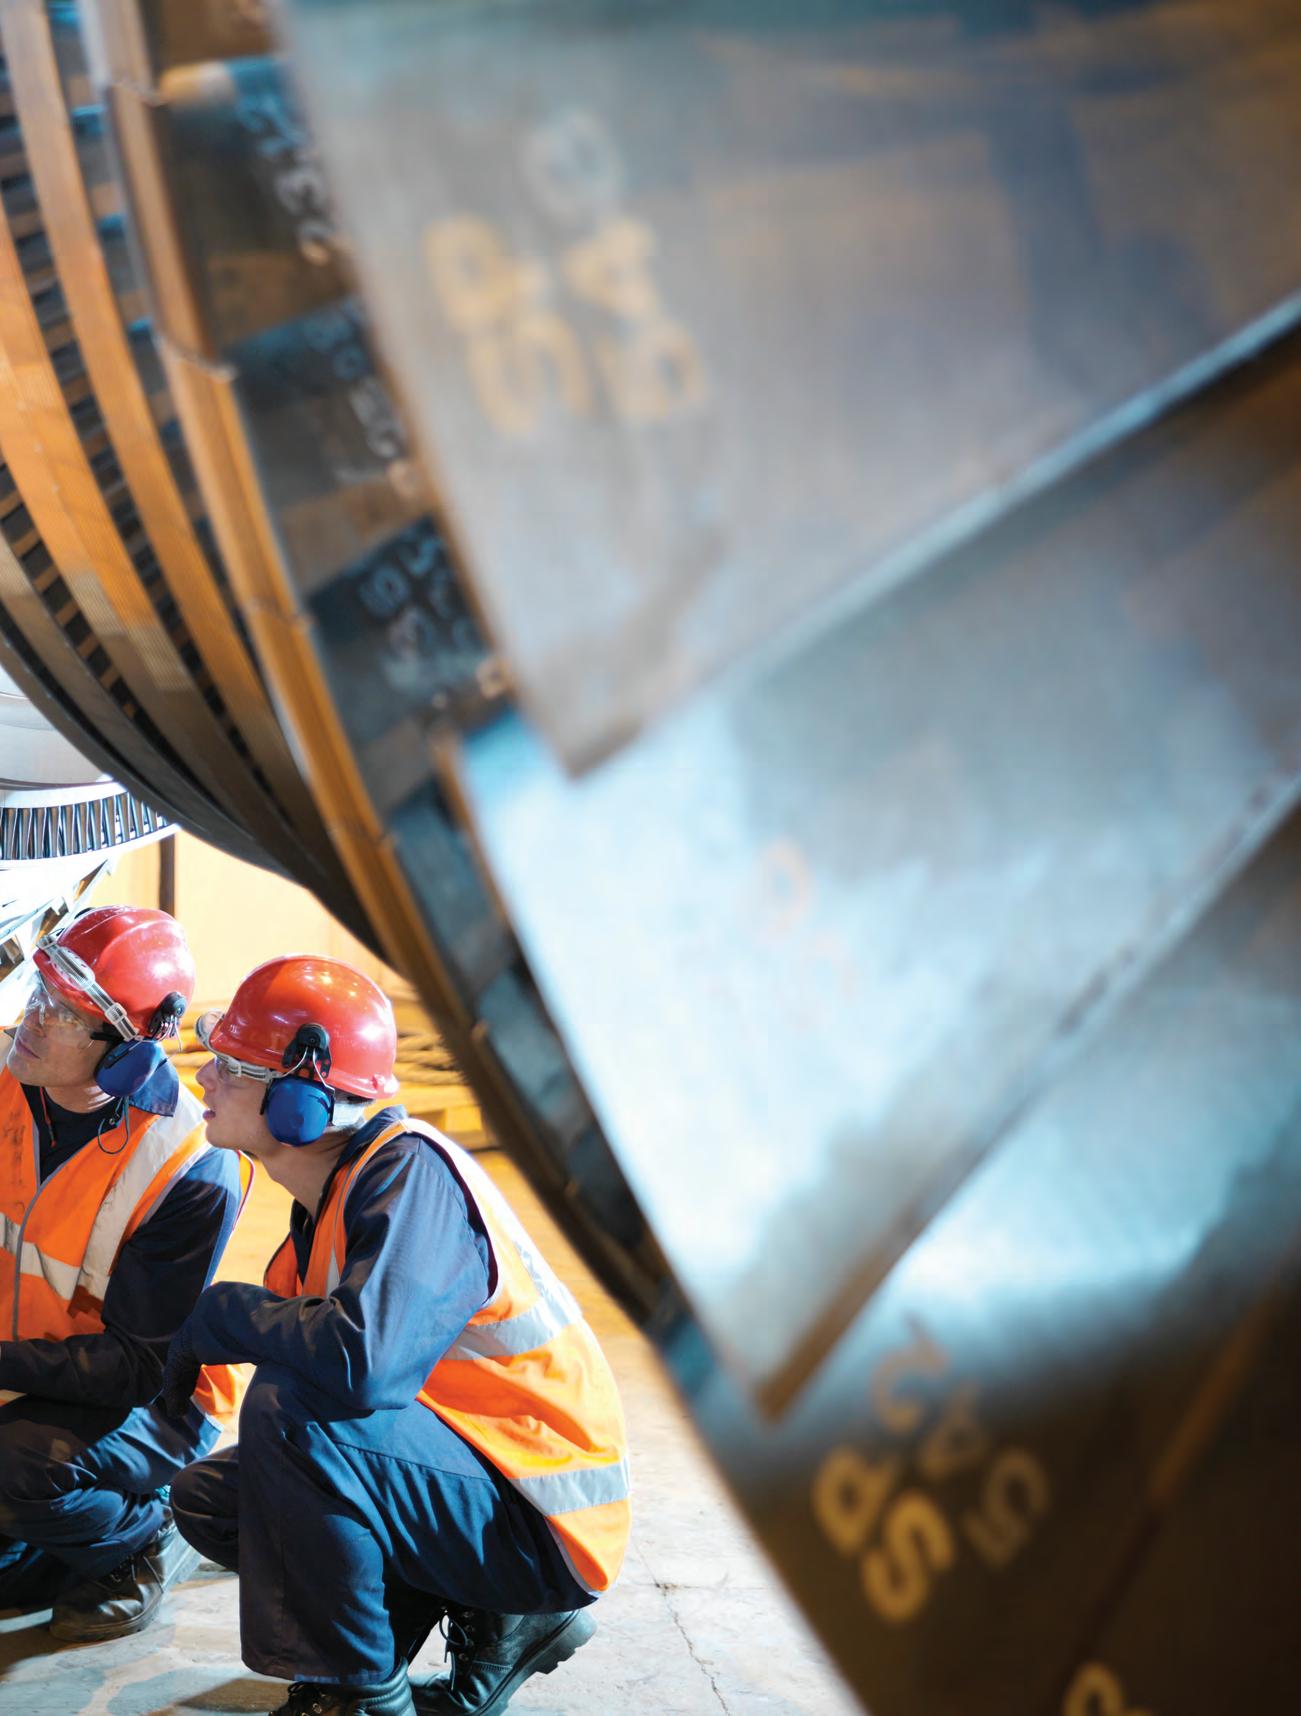
Electromagnetism
Curriculum content
electricity can be generated as alternating current (AC) using magnets (via turbines turned by wind, water, tides or steam that is generated by the combustion of oil, gas or coal or by nuclear energy) or as direct current (DC) using photovoltaic cells or batteries (VC2S10U16)
Glossary terms
Alternating current (AC)
Armature
Battery
Brush
Chemical reaction
Commutator
Conductor
Current
Direct current (DC)
Electric motor
Electricity
Electrode
Electrolyte
Electromagnet
Electromagnetic induction
Electromagnetism
Generator
Inverter
Kinetic energy
Magnet
Magnetic field
Magnetic field line
Magnetic induction
Magnetism
Nuclear fission reaction
Permanent magnet
Photovoltaic (PV) panel
Pole
Reactant
Right-hand grip rule
Slipring
Solenoid
Temporary magnet
Turbine
At the end of this section, I will be able to:
1. Define electromagnetism.
2. Use the right-hand grip rule.
3. Explain the role of electromagnets in simple electronic devices.
Before we explore the generation of electricity, we will review the basic concepts of magnetism and electricity behind the supply of mains electricity.
The discovery of magnetism begins, it is believed, with the ancient civilisations in Asia
Minor around 600 BC. In a region known as Magnesia, stones were found that could attract each other. These stones were named magnets after their place of discovery. The word 'magnet' comes from the Greek language, magnetis lithos, literally meaning 'the stones of Magnesia'.
The most magnetic of all the naturally occurring minerals on Earth is magnetite, an oxide of iron. Naturally magnetised chunks of magnetite are called lodestone – literally meaning 'the stone that leads'. The magnetic properties of lodestone were known to humans since the sixth century BCE at least, with the Greek philosopher Thales of Miletus (you might remember him or his student, Pythagoras, from your Mathematics course) making one of the earliest known references to it.
young albert einstein’s surprise present
In 1884 when Albert Einstein was five years old, his father Hermann Einstein bought him a magnetic compass. As Albert was sick in bed at the time, he fiddled around with it, but no matter how hard he tried to trick it to point elsewhere, the compass needle would always point to the same direction (magnetic north). He later wrote there was ‘something behind things, something deeply hidden’. This was the beginning of Albert Einstein’s lifelong scientific exploration. He was quoted saying, ‘I have no special gift, I am only passionately curious’.
Figure 9.2 Albert Einstein – arguably the greatest physicist ever – was inspired by a compass.
magnetic field the region in which a magnet can exert a force on other magnets
magnetic induction the process by which an object is magnetised by an external magnetic field
temporary magnet a magnet that does not retain its magnetism outside an external magnetic field
permanent magnet a magnet that retains its magnetic properties outside a magnetic field
pole the end point of a magnet
Other civilisations (the Chinese and the Anglo-Saxons, for example) noticed that these magnetic stones always pointed in the same direction when suspended from a fine piece of silk or cotton thread. These people had accidently discovered the compass and, inadvertently, evidence of the fact that Earth has a magnetic field. They created the first land compasses and they later used these lodestones to create compasses to navigate in ocean exploration.
An even more useful property of lodestones was that they could, simply by stroking, turn an iron needle or steel needle into a magnet. This process is called magnetic induction. These magnetised needles were then placed in non-magnetic containers and were used by mariners to navigate and explore the world.
Of course, as the name suggests, temporary magnets are temporary; that is, they only stay magnetic while they are in the presence of a magnetic field. You will be familiar with the fact that a permanent magnet attracts paperclips, steel nails and other objects made of iron. Magnets can also attract nickel and cobalt, which have magnetic properties. Shape does not matter, and all magnets have two ends, which are called the north (N) and south (S) poles by convention.
The forces between magnets can be attractive (when unlike poles are placed near each other) or repulsive (when like poles are placed near each other).
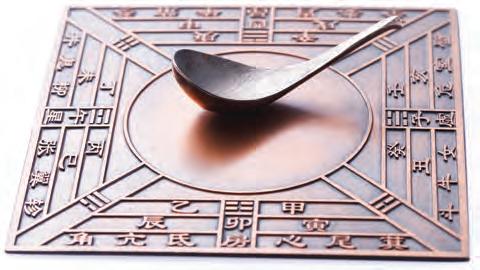
9.3 A working model of the first instrument known to be a compass. The spoon is carved from magnetic lodestone, and the plate it sits on is bronze, a non-magnetic metal. It is believed that the Chinese used such compasses as Earth-based direction pointers over 2400 years ago.


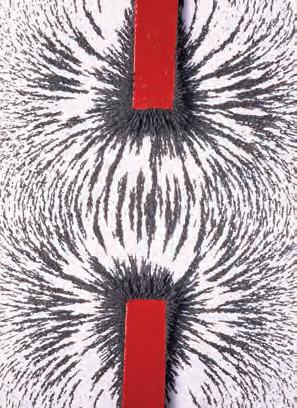
These magnetic forces can be put to good effect; for example, they keep the door seal on the fridge closed (attractive) or raise and propel maglev trains (repulsive).
Try
Making a compass
Fill a 250 mL beaker with water and place a cork or rubber stopper in it, making sure it floats. Take a sewing needle and stroke it 20 times with a bar magnet. You must stroke in one direction only and with one end of the magnet only. Place the needle on top of the cork or rubber stopper. Notice in which direction the needle points. Turn the beaker 90° and observe what the needle does. Use a compass to determine how accurate your needle is.
1. Describe what is meant by the term ‘magnetic field’.
2. Explain magnetic induction.
3. Explain how magnetism could be used to produce movement between objects that are not in contact, towards each other and away from each other.
In 1846, to understand how magnets could attract and repel each other, the English physicist Michael Faraday (1791–1867) introduced the concept of magnetic field lines. Faraday referred to the region around a magnet where magnetic effects are experienced as the magnetic field. Using Faraday's ideas, the magnetic field surrounding a bar magnet can be represented using a diagram such as shown in Figure 9.6b. The arrows on the field lines indicate the direction of the magnetic field.
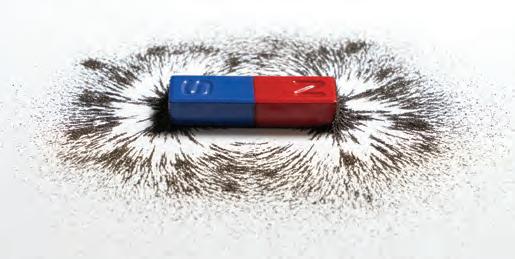
In reality, the magnetic field exists in three dimensions. Figure 9.7 is a closeup photograph of the iron filings pattern between the north and south poles of a magnet; it shows the three-dimensional nature of the magnetic field.

Faraday's rules for magnetic field lines are listed below.
1. Each magnetic field line is a continuous loop that leaves the north end of the magnet, enters at the south end and passes through the magnet back to the north end.
2. Field lines do not intersect.
3. The closeness of the magnetic field lines represents the strength of the magnetic field.
Magnetic field diagrams can be used to explain why magnets attract and repel each other. When magnets attract each other the magnetic field lines join the two magnets, as shown in Figure 9.8a. When magnets repel each other the magnetic field lines push each other away, as shown in Figure 9.8b.
9.8 Magnetic field diagrams for (a) attraction: north–south magnets and (b) repulsion: north–north magnets
1. Get two bar magnets, a horseshoe magnet, some iron filings and a sheet of A4 paper.
2. Place one of the bar magnets under the middle of the sheet of paper and sprinkle the iron filings on the paper. Try not to get filings on the magnets – they are difficult to remove. (Wrapping the magnets in cling wrap can reduce the removal problem.)
3. Observe how the filings position themselves around the magnet.
4. Repeat the experience with the horseshoe magnet. Do you notice any differences in the way the iron filings position themselves? Can you explain why the filings assume these distributions?
5. To go further, place the two bar magnets face-to-face and 2–3 cm away from each other, then sprinkle the filings. Observe the distribution of the filings.
6. Now turn one of the magnets over. How does the distribution of iron filings change? Can you guess, from the filings distribution, when two unlike poles face each other and when two like poles face each other?
1. Explain what happens when you place the north poles of two magnets next to each other.
2. Describe the magnetic lines inside and outside a magnet.
3. Explain whether the magnetic field experienced by a paperclip becomes stronger or weaker as you approach it to one of the poles of a permanent magnet.
Recall from Year 8 that electricity is a form of energy that results from either the accumulation or the flow of charge. This chapter is concerned with the flow of charge, called electric current, in the form of negatively charged electrons flowing in a conductor. For an electric current to flow in an electric circuit, wires need to be connected to a source of energy. In the circuits you studied in Year 8, this source of energy was a battery or power pack (which gets its electrical energy from the mains supply).
Here, we focus on two types of electric current:
• alternating current (AC) (from mains electricity or an AC power pack): reverses the direction of the current about 50 times every second. This is the power supply most used for appliances.
• direct current (DC) (from batteries and solar cells): flows in one direction only. Most of the electric circuits you studied in Year 8 used a DC power supply.
1. State the definition of an electric current.
2. List the differences between direct current and alternating current.
3. A simple electric circuit is powered by a battery. Identify whether the current in the circuit is AC or DC.
In 1820, the Danish physicist Hans Christian Øersted noticed that the needle of a compass, placed next to an electrical wire carrying a current, turned so that the needle was perpendicular to the wire. Øersted had discovered a connection between electricity and magnetism – electromagnetism. He found that a wire carrying a current created a magnetic field, as shown in Figure 9.9.
The direction of the magnetic field produced by the wire can be remembered with the right-hand grip, as Figure 9.10 demonstrates. If your thumb represents the direction of the current, then your right-hand fingers curl in the direction of the magnetic field generated.

electricity a form of energy that results from the accumulation or the flow of charge current the flow of electric charge, which may continue in a steady manner for a period of time
conductor (electricity) a substance or material that allows electrons to pass through it easily alternating current (AC) a form of electricity in which the current reverses direction in regular cycles (though the electrical energy associated with the current flows in one direction)


Figure 9.9 Øersted discovered the existence of a magnetic field, B (red lines), around a wire carrying an electric current (I).
direct current (DC) a form of electricity in which the current flows in one direction magnetism the ability to attract or repel objects that are magnetic electromagnetism the interaction between magnetic fields and electric currents right-hand grip rule shows the direction of the magnetic field of a currentcarrying wire
As you will recall, electrons carry electrical potential energy from the negative to the positive terminal. However, current is often depicted as moving in the opposite direction – from the positive to the negative terminal. This is called 'conventional current' and reflects the fact that scientists in the 1700s thought it was the positive charges that carried electrical energy. When using the right-hand grip rule, we are using the direction of conventional current.


Amazingly, if you already know the direction of the magnetic field, and your current-carrying wire is in a coil, you can do the opposite of this rule to figure out the direction of the current in the wire. In this case, you would point your thumb in the direction of the magnetic field and then curl your fingers around to determine the current's direction.
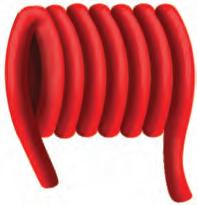


Figure 9.11 Diagram showing the right-hand grip rule where I is the current-carrying wire (fingers) and B is the magnetic field (thumb)
The arrow convention is often used to indicate the direction of the current if the wires go into or come out of the page. A cross represents the tail feather of an arrow, while the dot represents the tip of an arrow. Applying the right-hand grip rule creates magnetic fields surrounding the currents, as shown in Figure 9.12.
Figure 9.12 Diagrams showing the magnetic fields for current-carrying wires with the (a) current going into the page or (b) current coming out of the page
The arrow convention is also used for the magnetic field going into or coming out of the page, as shown in Figure 9.13. B out of page B into page I
Figure 9.13 Diagram showing the direction of the magnetic field for a current-carrying wire where I is the current and B is the magnetic field
Try this 9.3
1. Determine the direction of the magnetic field for each of the following wires. a) I b) I c) I (into the page) d) I (out of the page)
2. Determine the direction of the magnetic field for each of the following coils. a) I I b) I I c)
3. Determine the direction of the current in each of the following coils. a) b)
1. Describe electromagnetism.
2. Explain why a compass needle moves when placed next to a current-carrying wire.
3. Determine the direction of the magnetic field in the wire shown here.
VIDEO How do electromagnets work?
WIDGET
Electromagnet properties
solenoid a wire coil wrapped in the shape of a tube or cylinder; in engineering, a coil that moves an iron core in its centre for a mechanical purpose electromagnet a magnet consisting of a current-carrying coil surrounding a piece of iron
The magnetic field generated by a currentcarrying wire can be made stronger by forming a loop, as shown in Figure 9.14. The magnetic field is especially strong in the centre. When the wire is wound up many more times to form a coil, the magnetic field through the centre is even larger and more powerful (see Figure 9.15). A coil of wire with lots of loops in it is called a solenoid. A solenoid connected to a power supply or battery creates the simplest form of electromagnet, as one end of the solenoid forms the north pole and the other the south pole.
By adding an iron core (e.g. an iron nail) to the solenoid, the strength of the magnetic field is increased even further. One end of the iron core becomes the north pole and the other end becomes the south pole (see Figure 9.16). As you might expect, if you reverse the direction of the current, the poles of the electromagnet swap.
field lines
Try this 9.4
A simple electromagnet can be made using a coil of wire, an iron nail and a battery.
See if your nail is magnetised by holding it near some paperclips.
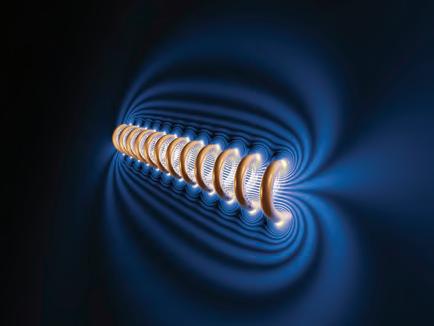

One advantage of using electromagnets rather than permanent magnets is that the magnetic properties can be switched on or off. The magnetic field strength can also be altered by changing the number of turns in the coil: more coils creates a stronger field. Changing the strength of the current is an even more convenient way to change the strength of the magnetic field.
Electromagnetism has a wide variety of applications in everyday life. Electromagnetic coils are found in many electronic devices, such as computers, mobile phones and their charging devices; while electromagnets are used in electric motors, doorbells, safety switches and, most importantly, the generation of electricity.
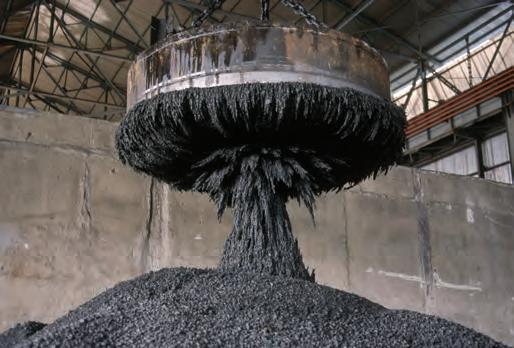


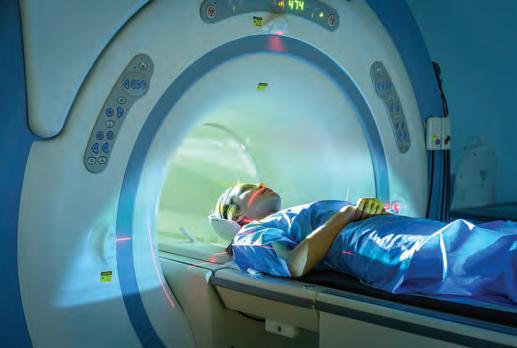
check 9.5
Describe a solenoid.
2. Explain the purpose of using an iron core in an electromagnet or wire coil.
3. List two advantages an electromagnet has over a permanent magnet.
Aim
To investigate the magnetic fields produced by an electromagnet.
Materials
• 1 m of PVC-covered copper wire with the ends stripped and bare
• large iron nail
• iron filings
• paperclips
• wire stripper
Method
• low-voltage DC power supply
• A4-size plastic sheet
• plastic compass
1. Wind the insulated copper wire around an iron nail as shown in Figure 9.19.
2. Connect the ends of the wire to the low-voltage DC power supply while it is switched off. Once the ends are connected, switch the power supply on.
3. Using the compass, create a magnetic field diagram for the nail. To do this, position the compass at different points around the nail and record the direction and orientation of the field line based on the compass needle.
4. Place an A4 plastic sheet over the electromagnet. Sprinkle iron filings over the sheet. Turn on power to the electromagnet and note what happens to the iron filings. Draw the pattern created in your science book. Discuss what happens to the pattern of iron filings if you turn off the current.
Be careful
Hot wires can burn if there are short circuits.
Ensure voltage output is not exceeded.
Turn off power supply when changing the circuit.
5. Collect and recycle the iron filings and remove the plastic sheet from the electromagnet.
6. Use your electromagnet to pick up the paper clips. How many can you pick up? Record this number.
7. Investigate two factors affecting the strength of the electromagnet: the number of coils and the current flowing in the wire. Use the number of paper clips that the electromagnet can pick up to indicate the strength of the electromagnet.
Results
1. Draw a diagram of the pattern of iron filings created by the electromagnet.
2. Create a table showing how many paperclips your electromagnet could pick up with different numbers of coils and amounts of current.
Discussion: Analysis
1. State the purpose of the iron nail in your electromagnet.
2. Explain why your electromagnet gets warm when you turn it on.
3. From your field diagram, work out which end of the electromagnet is north. Draw this on your field diagram.
4. Explain the pattern of iron filings created by the electromagnet.
5. Explain what happens to the pattern when you turn the electromagnet off.
6. Explain how the electromagnet can pick up paperclips.
Discussion: Evaluation
1. What sources of error might there be for this experiment and how could they be resolved?
Conclusion
1. Make a claim from this experiment regarding the magnetic field of electromagnets.
2. Support your claim by referring to your experimental observations.
3. Explain how your observations support your claim.
operating an electric doorbell
Use the following terms to write a description of how the electric doorbell shown in Figure 9.20 operates. Note that the switch in this circuit is a tap switch; when the switch is released, it goes to the off position.
• current
• electromagnet
• magnetic field
• tap switch
• circuit
• iron armature
• hammer
• bell Electromagnet
In 1821, Michael Faraday used his understanding of magnets to create the world's first electric motor
Faraday used a wire, a permanent magnet, a battery and a dish of mercury (a liquid metal at room temperature and a good electrical conductor, but also highly toxic including its vapour). One end of the wire hung free in the mercury. When current was applied to the circuit, a circular magnetic field was generated around the wire. The wire's magnetic field interacted with the magnetic field of the permanent magnet. This caused the wire to rotate around the magnet. Faraday had converted electrical energy into rotational kinetic energy (movement).
What Faraday had found was that, when a current-carrying wire (with its own magnetic field) is placed in an external magnetic field that exists around a magnet, both magnetic fields will interact and this results in a force being exerted on the wire. This force is what makes things move, and this is the basis of how electric motors, like the ones in a hair dryer or hand held drill, work.
WORKSHEET
Comparing permanent magnets and electromagnets

Practical 9.2
a simple electric motor
Aim
To build your own motor
Materials
• D-cell battery
Be careful
Electrical shocks may occur. Ensure voltage output is not exceeded. Turn off power supply when changing the circuit.
• copper wire with a thin coat of insulation (‘magnet wire’ or enamelled wire)
• long sewing needles × 2 (with the eyes large enough to fit the copper wire through) or big paperclips × 2
• sandpaper or emery board
• modelling clay or Blu-Tack
• electrical (duct) tape
• small circular magnet
• marker pen
Method
1. Make a loop by wrapping the insulated copper wire several times (start with 5 or 10 times) around your D-cell battery. Then, remove the loop and wrap the ends of the wire around the loop, leaving them sticking out, as shown in Figure 9.22.
removed from one side at this end
2. Using the sandpaper or an emery board, remove the insulation from:
• one side of the last 2 cm of one end of the wire
• both sides of the last 2 cm of the other end of the wire.
3. Lay the D-cell battery sideways on a flat surface and stick it in place with the modelling clay.
4. Make two small balls of modelling clay and impale them on the sharp end of each needle.
5. Place the needles upright near each of the terminals of the battery so that each needle touches one terminal of the battery, and fix them in place with the electrical tape.
6. Thread each end of the wire loop through the eye of a needle. Make sure the end of the wire where the insulation has been removed is in contact with the needle.
7. Your coil should be hanging above the battery. Place the small magnet on the battery, underneath the coil.
8. Give your coil a spin. If it does not keep spinning, try to spin it in the other direction.
9. Redo your coil with more loops. What changes when you spin the coil? Record your observations.
Results
Insert a picture or diagram of your construction and record your observations regarding how your motor operates.
Discussion: Analysis
1. Explain why the insulation is removed from only one side of the wire at one of the ends. Why does this make it a DC motor?
2. Deduce what might happen if you used a smaller or larger battery.
3. Deduce what might happen if you used a larger magnet.
4. Explain how the number of loops or the intensity of the current delivered by the battery affects your motor.
Discussion: Evaluation
1. Identify any faults with this experiment and suggest how they could be resolved.
Conclusion
1. Make a claim from this experiment regarding the requirements for a functioning motor.
2. Support your claim by referring to your experimental observations.
3. Explain how your observations support your claim.
Quick check 9.6
1. Describe Faraday’s 1821 electric motor experiment.
2. Explain how a permanent magnet can cause a current-carrying wire loop to move.
Today, electric motors are everywhere. Electric fans, electric drills, washing machines, hairdryers, trains, electric cars and many more, all use electric motors.

armature the rotating coil that forms part of an electric motor
brush the part of a motor that conducts current between stationary and moving parts
commutator a split ring that reverses current at a point in a motor
The simplified diagram in Figure 9.24 shows the magnetic forces (F) acting on the coil of wire in a simple direct current (DC) motor. Recall that DC current means the current flows in one direction around the circuit.
Direction of rotation (energy output)
Split ring of commutator
(energy input)
Figure 9.24 A simple DC motor, consisting of a single loop of wire in a magnetic field, produced by a set of permanent magnets. The battery supplies DC in one direction.
To create a large and useful force, the wire in the motor is looped into coils similar to a solenoid. This coil of wire is called an armature. Figure 9.24 shows this as a single wire for simplicity. When electric current (I) flows through the armature, a magnetic field is produced. This magnetic field interacts with the magnetic field produced by the permanent magnets on either side of the armature. The magnetic forces in opposite directions on the two sides of the loop cause a turning force, making the armature rotate.
The brushes connected to the power source lightly touch the split ring of the commutator, which is fixed to the armature and axle, turning with them. This allows current to continue being supplied to the armature as it rotates. Consider the situation where the armature in Figure 9.24 has made a half turn (180°). The two halves of the commutator have swapped position, so the direction of the current around the loop is reversed. However, since the loop has turned, the flow of current relative to the magnetic field is the same as before, and therefore the forces on the loop act in the same direction. This allows the armature to continue rotating in the same direction rather than oscillating back and forth between the two magnets.
Quick check 9.7
1. State what DC stands for.
2. State which parts of a simple DC electric motor are moving and which parts are stationary.
3. Write down a list of five electric motors that you have around your home. Explain what each electric motor does and what the general purpose is of the motor.
4. Explain the role of the brushes and commutator in a simple DC motor.
One disadvantage of the simple motor shown in Figure 9.24 is that it can stick at the point where there is a gap between the split rings. In this case, no current flows through the coil and it does not turn.
In an attempt to overcome this disadvantage, there are many different designs for simple DC motors. One common design used in some schools for practical work is shown in Figure 9.25. Note that the motor has three sets of armature coil windings and a triple segmented commutator (a commutator with three splits rather than two). This means that at any point in the rotation, two of the three commutator segments are in contact with the brushes. This design ensures that the DC motor does not have a 'dead spot', where the motor does not turn and which could cause the coils to overheat.
Try this 9.6
Simple DC motor
Look at a permanent magnet DC electric motor set up for you.
Using only 2 V DC for the DC electric motor, turn it on and answer the following.
1. Which way is your motor turning – clockwise or anticlockwise? What effect would reversing the current through the coils have on this DC motor? Try it.

Hot wires can burn if there are short circuits. Ensure voltage output is not exceeded. Turn off power supply when changing the circuit.
2. The current is put back to its original direction. What effect would swapping the permanent magnets have on this DC motor? Try it.
3. You may have noticed some electrical sparking where the brushes made contact with the commutator. What causes this?
4. If the DC current was replaced with an AC current, the motor would vibrate rather than rotate. Explain, in detail, why this happens.
Section 9.1 review
Go online to access the interactive section review and more!
Section 9.1 questions
Remembering
1. Recall what material makes magnetic rocks magnetic.
2. Describe magnetic induction.
3. Recall Faraday’s three rules for magnetic field lines.
4. Describe the arrow convention for current and magnetic fields.
5. Recall what energy changes are associated with an electric motor.
6. Recall what forces Michael Faraday used to create the world’s first electric motor.
Understanding
7. Describe the concept that is used to explain magnetic attraction and repulsion between magnetic poles.
8. Explain why iron cores are added at the centre of coils to create electromagnets.
9. Explain how a DC motor works.
Applying
10. Draw the magnetic field lines for the following two configurations. Use arrows to indicate the direction of the magnetic field.
a) SS
b) SN
11. Draw the magnetic field generated by the following wires. a)
b)
12. Describe what happens to both magnetic fields when a current – carrying wire is placed in an external magnetic field.
Analysing
13. Determine the direction of the current and draw the magnetic field lines for the following solenoid. Identify the north pole.
14. Analyse the energy conversions occurring in a DC motor.
Evaluating
15. Imagine a world where electromagnets have not yet been discovered. Propose what this would be like. Suggest some appliances that would not be available and explain why.
16. Deduce why increasing the number of coils in a solenoid increases the intensity of the magnetic field generated.
At the end of this section, I will be able to:
1. Define electromagnetic induction.
2. Explain the generation of alternating current using magnets.
3. Explain the function of turbines in the generation of electricity.
4. List and describe sources of energy and energy transformations to use to generate electricity.
5. Describe the parts and functions of a simple AC generator.
6. Describe the difference between fission and fusion as energy sources.
7. Build a wind vane and use it to investigate the power generated by wind.
Ten years after Michael Faraday created the electric motor, he returned to his electrical research and discovered how to create electricity using a magnet and a coil of wire. Faraday connected his apparatus to a galvanometer (an instrument that detects electric current), in a set-up similar to that shown in Figure 9.26. He discovered that when he moved the magnet back and forth through the coil of wire, which remained stationary, a current was created. Moving the magnet to the left into the coil created a current in one direction and moving the magnet right out of the coil created a current in the opposite direction. The magnetic field of the magnet exerted a force on the electrons in the wire, causing them to move, generating current. The production of a current in a wire by changing the magnetic field is called electromagnetic induction
Faraday's induction coil was the world's first alternating current (AC) generator, although it did not have practical applications. A current is generated if there is movement between the coil and the magnetic field in relation to each other. The movement could be from just the magnet, just the coil or both. Therefore, it could be the magnet that is fixed and the coil that moves.
To generate sufficient electrical energy to run domestic appliances, tram and train networks, street lighting, hospitals, factories and so on, electrical energy must be produced on a massive scale. This could be done using the back-and-forth motion of a magnet in a coil, but producing this motion would require a mechanism that would also produce significant vibration and noise, and that would lose energy through friction. Fortunately, there is a much simpler form of motion that can be harnessed without these disadvantages.
1. Explain the term ‘electromagnetic induction’.
2. Describe the first AC generator.
3. Explain the outcome of moving a magnet in one direction then the other through a wire coil.
Practical 9.3
Magnets can generate current
Aim
To generate current with a magnet.
Materials
• bar magnet
• copper wire with a thin coat of insulation (‘magnet wire’ or enamelled wire)
• galvanometer
• cardboard tube
• wire stripper
Method
1. Make your own solenoid by neatly wrapping the insulated copper wire around the cardboard tube, as shown in Figure 9.27.
2. Using the wire stripper, remove around 2 cm of insulation from each of the free ends of the wire.
3. Connect the free ends of the wire to the positive and negative terminals of the galvanometer.
4. Predict what you think will happen when you put the magnet bar inside your coil. Do it and observe the galvanometer needle.
5. Move the magnet back and forth inside the coil. What happens to the galvanometer’s needle? Move the bar magnet faster or slower. Does it have an effect?
6. Now move the magnet bar back and forth outside the coil. How does this affect the galvanometer’s needle?
7. Add more turns to your solenoid. What happens?
Results
Insert a picture or diagram of your construction and record your observations regarding how your current generator works.
Discussion: Analysis
1. Explain whether it was possible to predict how the galvanometer’s needle would move, based on the movement of the bar magnet.
2. Explain how and why the speed of movement of the bar magnet affected the intensity of the current generated.
3. Describe what happened to the current generated when more coils were added.
Conclusion
1. Make a claim from this experiment regarding generators, current and magnets.
2. Support your statement by explaining how the data you gathered supports your claim.
Remember how the simplest type of electric AC generator, or alternator, consists of a coil of wire and a bar magnet being moved through the centre of the coil. The current flows in one direction as the magnet enters the coil and reverses direction as the magnet is pulled out, creating an alternating current. Another way of generating current is to rotate a magnet within the coil or rotate the coil around a magnet.
Let us have a look at a simple AC generator, as shown in Figure 9.28. In an AC generator, there are two brushes and each brush makes contact with a slipring. The slipring passes the current from the rotating coil to the stationary circuit. These sliprings are electrically insulated from each other to complete the electric circuit around the coil. The circuit includes a load such as a lamp, a resistor or a motor.
The coil is rotated in the magnetic field
flows through a load in an external circuit
9.28 A simple AC generator (alternator) – a single coil rotating in the magnetic field of permanent magnets, inducing a current
The load for an AC generator could also be:
• a transformer that changes an AC input to a different voltage in a separate circuit
• a rectifier that contains an electronic circuit to convert AC to DC, to power DC devices.

therefore contains electronic transformer and rectifier circuitry.
The current produced by an AC generator is alternating as a natural consequence of the rotation of the coil in the magnetic field. The energy conversions of this process are that mechanical (kinetic energy) is transformed into electrical energy in the coil (see Figure 9.30). The electrical energy flows to the load, where it is transformed into some other kind of energy (e.g. kinetic, light, heat), depending on the device, to serve a useful purpose.
For transmission and distribution of AC mains electricity, step-up transformers are used to increase the voltage for transmission over long distances (which reduces energy loss), then a step-down transformer is used to decrease the voltage for use by customers (see Figure 9.31).
Build a simple aC generator
Aim
To build a simple AC generator
Materials
• thick copper wire with a thin coat of insulation (‘magnet wire’ or enamelled wire)
• long sewing needles × 2 (with the eyes large enough to fit the copper wire through) or big metal paperclips × 2
• sandpaper or emery board
• modelling clay or Blu-Tack
• electrical (duct) tape
• strong bar magnets × 2 or strong U-shaped magnet × 1
• grain-of-wheat bulb with thin electrical wires to connect in a circuit
• a sensitive multimeter or galvanometer able to detect AC and DC
Method
1. Make a wire coil by wrapping the insulated copper wire 20 times around a cylindrical object of at least 2 cm diameter, leaving at least 5 cm of straight wire at each end of the coil. Slip the coil off and wrap the ends of the wire around the coil once to hold it together, leaving the ends sticking out, as shown in Figure 9.32. The same coil can be used as in Practical 9.2, but it should have at least 20 loops.
2. Remove all the insulation from 2–3 cm of both ends of the wire, all around, with the sandpaper.
3. Make two small balls of modelling clay and impale them on the sharp end of each needle.
4. Place the needles upright in a position to support each end of the coil as shown in Figure 9.32, ensuring that bare copper wire makes contact with the metal eyes of the needles.
5. Hold each end of the coil between thumb and forefinger and rotate the coil by sliding thumb and forefinger in opposite directions. Make sure it rotates freely and contacts the needles all the time. Practise doing the motion alternately with each hand so that the coil rotates continuously in the same direction.
6. Connect the bulb between the needles by winding the ends of the wires around each one and fixing in place with electrical tape.
7. Place a magnet on each side of the coil, with opposite poles facing each other. You may need to use modelling clay to keep the magnets in place. If using a U-shaped magnet, it should be held by a clamp so the coil is between the ends of the magnet.
8. Rotate the coil, making sure the wire contacts the needles all the time by applying light downwards pressure against the needles.
9. Observe if the bulb lights. If it does not, check the connections in the circuit, and check that the coil is between opposite poles of the magnets and close enough to them.
10. When you have observed that the bulb lights, connect the multimeter across the needles, following its instructions for the detection of AC current. Rotate the coil constantly in one direction and record if AC is detected.
Results
In your science book, draw a picture or diagram of your construction and record your observations regarding how your motor operates.
Discussion: Analysis
1. Deduce what might happen if you used a coil with more loops.
2. Deduce what might happen if you use a stronger magnetic field.
3. Explain how the number of loops or the intensity of the magnetic field affects your generator.
4. Explain how the generator produces AC current.
Discussion: Evaluation
1. What faults might there be for this experiment and how could they be resolved?
Conclusion
1. Make a claim about the requirements for a functioning AC generator based on this experiment.
2. Support your claim by referring to your experimental observations.
3. Explain how your observations support your claim.
nikola tesla and an invention inspired by poetry In Budapest, Hungary in 1882, Serbian electrical engineer Nikola Tesla was walking in a park reciting to a friend some verses from the great German writer Goethe’s play Faust. This included the lines, translated here:
The glow retreats, done is the day of toil; It yonder hastes, new fields of life exploring; Ah, that no wing can lift me from the soil Upon its track to follow, follow soaring!
Source: Johann Wolfgang von Goethe, Faust: A Tragedy, Part I, Translated by Bayard Taylor, Oxford University Press, 1988.
In his work, Tesla had been trying to improve the electric motors of the time, which were DC powered and so needed commutators to reverse the current direction in the coil. He had been wondering if AC, which reverses direction, could be used instead.
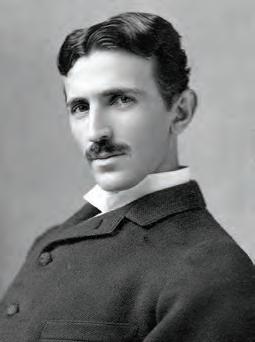
In the park that day, somehow, the poetic lines he was reciting made him think of rotating magnetic fields – perhaps it was the words about new fields of life exploring, coupled with the notion of soaring. He realised a motor using AC current without a commutator could exploit rotating magnetic fields to keep it turning. He excitedly drew a diagram with a stick in the dirt to explain the idea to his friend. This became one of his greatest inventions – the AC induction motor, which was both more energy efficient and more reliable than DC motors. But of course, for widespread use, it needed an AC generation and transmission system.
In 1884, Tesla emigrated to the United States to work for the famous inventor Thomas Edison in New York. Edison had developed the world’s first commercial power station in 1882, using DC, supplying users up to a kilometre away. While working for Edison, Tesla tried to persuade him that AC would be more efficient as there were lower energy losses during transmission, meaning that electricity could be transmitted much further. AC generators had been recently developed in Europe, but Edison thought AC was unnecessarily complex and more dangerous, since AC generators produced higher voltages. Having failed to persuade Edison, in 1885 Tesla left to start his own company. So began the ‘War of the Currents’, the more than decadelong rivalry between the two inventors. This rivalry has been featured in several documentaries and movies.
Tesla spent the next few years perfecting a complete generation → transmission → usage system. Our mains electric power system today is descended from Tesla’s system, which itself was inspired by poetry. Science as a human endeavour 9.1
Quick check 9.9
1. Explain how a simple AC generator produces alternating current.
2. List the energy transformations that occur with an AC generator.
Table 9.1 shows the main energy sources that are used to drive AC generators.
SourceSustainability Energy transformations
Water at a height
Tides
Waves
Wind
Geothermal
Biomass fuel (plants or organic waste)
Coal (fossil fuel)
Oil (fossil fuel)
Gas (fossil fuel)
Nuclear (uranium)
RenewableGravitational potential energy → kinetic
RenewableGravitational potential energy → kinetic
RenewableGravitational potential energy → kinetic
RenewableKinetic
RenewableHeat → Steam (kinetic)
RenewableChemical → Heat → Steam (kinetic)
Non-renewableChemical → Heat → Steam (kinetic)
Non-renewableChemical → Heat → Steam (kinetic)
Non-renewableChemical → Heat → Steam (kinetic)
Non-renewableNuclear → Heat → Steam (kinetic)
Table 9.1 Energy sources to drive AC generators.
Conversion devices
Type of power station
Water turbineHydroelectric power stations (dams and ‘diversion’ plants)
Water turbineNone currently operational in Australia
Water turbine (and other devices)
Some in Western Australia
Wind turbineWind farms
Steam turbineNone in Australia, some in New Zealand
Furnace, boiler, steam turbine
Small scale only
Furnace, boiler, steam turbine The oldest type of industrial power station
Furnace, boiler, steam turbine More modern industrial power stations
Furnace, boiler, steam turbine
Reactor, steam turbine
Newest type of industrial power station
None in Australia
You may notice in Table 9.1 that most large-scale production of electric power uses turbines to turn the generators. These turbines can be turned by steam (similar to the turbine in Figure 9.34), by falling water (hydroelectricity) or by wind (wind farms).
Electromagnets rotated by the turbine


The turbine blades turn due to the expanding steam's considerable force on them. They, in turn, rotate the large electromagnets in the centre of the generator. The rotation of the magnetic field induces a large electric current and a high voltage in the static coils arranged around the rotating electromagnets.
For steam turbines, the steam can be generated using various methods, such as burning coal, burning gas and harnessing nuclear energy.
In Australia, as at 2023, about 46% of our electrical energy is generated by coal-fired power stations. Coal-fired power stations transform the chemical energy stored in coal into electrical energy. Burning the coal produces intense heat, which is used to boil water to create very high temperature (500°C) and high-pressure steam. The superhot steam applies force on the turbine blades, which then rotate electromagnets at 3000 revolutions per minute (3000 rpm) inside a static array of coils, inducing current in the latter. A typical modern coal-fired steam generator can generate 500–1000 million watts (500–1000 MW) of electric power, with advanced generator types capable of producing 1000–1500 MW per unit. The average power generated by the coal-fired power stations in Australia is around 1000 MW.
In nuclear power stations, the energy required to boil water to produce the steam that turns the turbine blades is released in nuclear fission reactions. Australia does not have any nuclear power stations.
1. In power stations that generate alternating current, identify the form of energy that is the direct input into the generators.
2. Determine whether the following statements are true or false.
a) Some electric generators transform heat energy directly into electrical energy.
b) The use of gravitational potential energy in electricity generation involves the use of water.
c) Turbines in power stations are driven by AC electric motors.
d) All AC power generation involves heat energy as an essential intermediate step.
e) The output of AC power stations is kinetic energy.
Harnessing nuclear energy involves either splitting atoms (fission) or combining atoms (fusion). Nuclear power stations use fission to generate large amounts of energy, which is used to heat water and generate steam to turn a turbine. Use the internet to research the difference between fission and fusion as sources of energy. Find out why fusion is not yet used to generate power.
Figure 9.35 A cutaway model of a nuclear reactor, in which uranium fuel rods fit into a graphite core and produce heat by nuclear fission reactions. Gas circulates to extract the heat and heat water in a boiler (not shown) to produce steam to drive turbine generators.
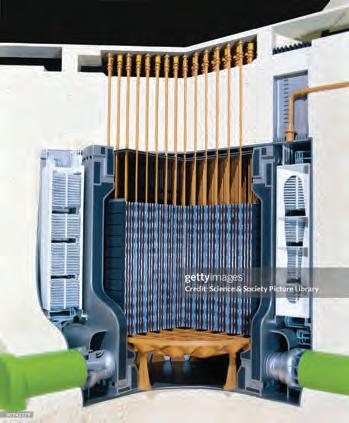
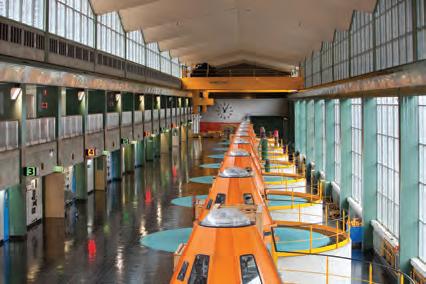
In hydroelectric power stations, the energy used to turn the turbines is obtained from gravitational potential energy. Water falling from a great height turns the turbines directly with no need for high-pressure steam. This is how Australia's Snowy Mountains hydroelectric scheme generates approximately 7.5% (in 2018) of Australia's total electricity demands. Similarly, tidal energy is a reliable source of energy. Huge amounts of water move around the Earth as tides go in and out. The movement of this water can be used to turn turbines (see Figure 9.37). Since tides are caused by the interaction of gravitational forces between the Earth, Moon and Sun, as long as the Moon continues to orbit Earth and Earth orbits the Sun, there will be tides to generate electricity.
Figure 9.36 Turbines in Murray 1 power station. Murray 1 is the second-largest power station in the Snowy Mountains hydroelectric scheme. It has 10 turbine generators, each producing 95 megawatts of power (95 MW). Each turbine generates enough electricity to power 95 000 homes. Incoming
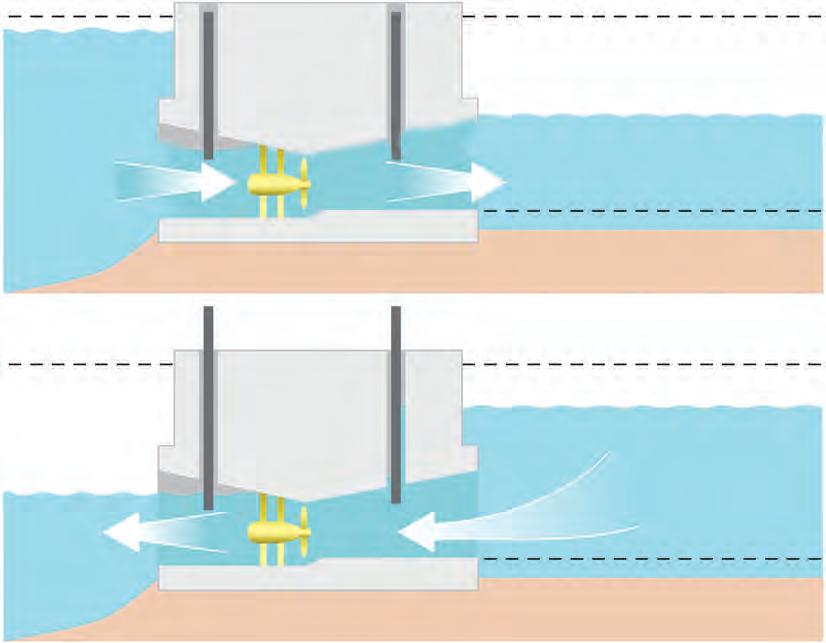
Figure 9.37 The movement of the water during incoming and outgoing tides is driven by gravitational potential energy due to the height difference of the water. This turns the turbines to generate electricity. The energy of waves can also be harnessed. Waves are caused mainly by wind and wind is ultimately caused by differential heating of the Earth by the Sun, and so originates as solar energy, which is transformed to kinetic energy. In some places on Earth, there are consistent winds that produce continuous waves. As they rise and fall, waves contain a tremendous amount of energy and various structures have been devised, some containing turbines, to convert this up and down motion into electric power.
Wind energy is gaining popularity around the world. Australia is perfectly placed to construct and use wind farms to create electricity as there are extensive areas where wind harvesting is a viable option. Currently, Australia relies heavily on coal-fired power stations for a large portion of its electricity and this comes at a significant environmental cost. Australians produce massive amounts of greenhouse gases per head of population and are contributing to climate change. Figure 9.38 shows a modern wind turbine used to generate electricity. As of 2024, the cost to produce and install one of these turbines is estimated at between $2.6 and $4 million. Each turbine can produce around 2 MW of electricity.
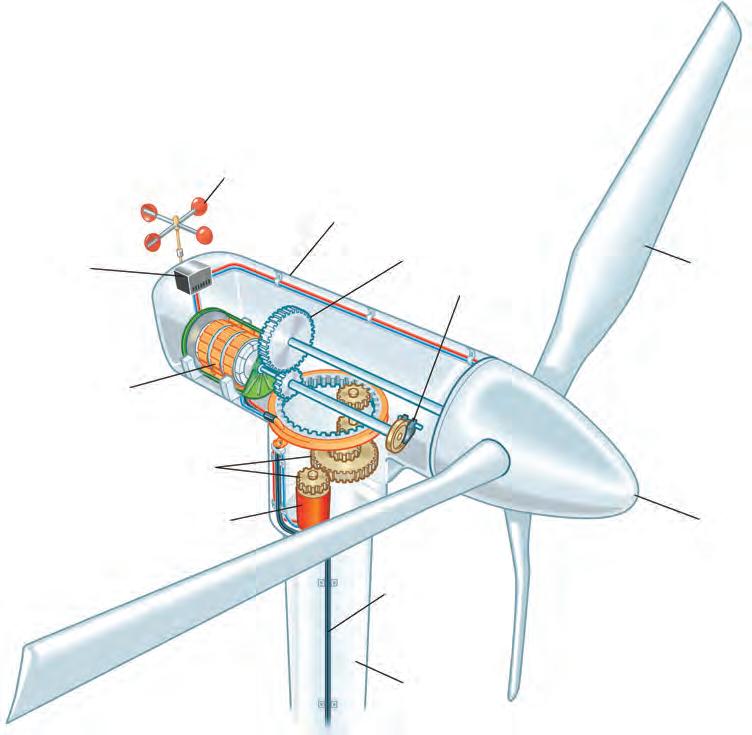
Figure 9.38 A modern wind turbine used to generate electricity. The wind power turbinehousing box sits 70 metres above the ground, and each of the three blades is 35 metres long. Each aerodynamically constructed blade has a mass of about 20 tonnes.
Although the blades on a wind turbine appear to rotate fairly slowly (about 20 revolutions per minute, 20 rpm), gearing inside the housing box increases this speed to 1800 rpm, as required by the electrical generator.
Kinetic energy of the wind, caused by the thermal energy from the Sun The wind pushes the blades of the wind turbine
Aim
To investigate the factors that affect power generated by a wind turbine
Materials
• small DC toy motor to be used as a dynamo
• pieces of insulated copper wire × 2 with alligator clips, each about 50 cm long
• rubber band
• 30 cm ruler
• cylindrical-shaped cork or Styrofoam ball
Method
• paperclips × 4
• sticky tape
• cardboard
• hairdryer or fan
• DC voltmeter
1. Use the rubber band to attach the DC motor to the end of the ruler.
2. Use the wires to connect the DC motor to the voltmeter.
3. Straighten the end of the paper clips and stick them into the cork so that they are equally spaced around it.
4. Cut four pieces of cardboard to act as the wind turbine’s blades. Ensure that the pieces of cardboard are all the same size. Measure and record the length and width of the blades.
5. Use sticky tape to attach each blade to a paper clip.
6. Attach the cork to the shaft of the motor, ensuring that the shaft is in the centre of the cork.
7. Rotate the blades so that they are on a 45° angle, as shown in Figure 9.40.
8. Use the fan or hairdryer as a wind source to spin the wind turbine and record the voltage produced.
9. Repeat step 8 with the wind source at four different distances from the turbine.
Note that the motor does not spin the blades like a fan, the blades spin the motor, which acts as a dynamo. However, since it is not designed to be a dynamo, the voltage it produces will be small.
Results

Copy and complete the following in your science book.
Blade measurements:
Width: _________ Length: _________ Area: ____________
Voltage generated:
Table showing the voltage generated at different distances from the wind source
Distance from wind source
Voltage generated
Discussion: Analysis
1. Explain the relationship between the distance of the turbine from the wind source and the voltage generated.
2. Compare your results with those of another group with different-sized blades.
3. Summarise what factors affect the amount of voltage generated by a wind turbine.
Discussion: Evaluation
1. Describe the limitations of this investigation.
2. Explain how this investigation could be improved.
Conclusion
1. Make a claim about the factors that affect power generation by a wind turbine based on this experiment.
2. Support your claim by referring to your experimental data.
3. Explain how the data supports your claim.
Section 1: Energy sources – coal, solar, nuclear
For each energy source, investigate and report on the following.
1. How is electricity generated?
2. What are the advantages and disadvantages of each method of electricity generation?
3. What are the environmental issues (good and bad) associated with each method of electricity generation?
Section 2: Australian states
1. Research the electricity production methods and their percentages for each state. Compare this with the percentages of electricity generated by each of these methods nationally. Present the data in a table or graph.
2. Which state in Australia is the biggest consumer of electricity? What percentage of the nation’s electricity production does it consume, and what sector contributes most to that state’s consumption?
Section 3: Australia and the world
1. Make a table to compare the methods of electricity generation and their percentage of total generation for each of the following countries: Australia, the United States, India, China and France.
2. Comment on the pie chart of Global electricity generation by source (see Figure 9.41) with regard to the world’s dependence on fossil fuels and the implications for climate change.
Figure 9.41 Global electricity generation in 2023 by source. (Note: A watt is 1 joule of energy per second, so is a rate of energy; a watt-hour (Wh) is a unit of energy equal to 3600 J; the prefix ‘tera-’ means 1012.)
Compass points: new electricity generators
Life on Earth is mainly dependent on the renewable energy of the Sun, yet humans have been relying heavily on fossil fuels since the Industrial Revolution. Since the beginning of this century, however, due to growing environmental awareness, renewable energies have started to gain traction. The production of electricity using wind power-driven turbines, for example, has dramatically increased over the last two decades. Such technologies, however, are not practical for personal use by the average person.
Fortunately, work is being done to develop microgeneration technologies, such as small-scale wind turbines, micro hydro and solar PV systems, to enable small businesses and communities to meet their energy needs. This search for new ways to produce energy is a continuous endeavour; and researchers sometimes draw their inspiration from nature. For example, one area of research interest is on developing biomimetic trees (i.e. structures that mimic nature) that produce electricity as their artificial leaves bent in the wind. Prototypes of these trees are already undergoing field tests in urban environments, for small-scale applications such as powering power sensors and streetlights.
Another interesting area of research for small-scale energy production involves wearable thermoelectric generators, where the temperature difference between the body and the outside environment creates a thermal gradient, which can be converted into electricity. South Korea currently leads the way in the design of wearable thermoelectric generators, making improvements in the stretch, durability and efficiency of this technology to the point that, in the near future, it might be possible to self-power small electronic devices using only our body heat.
In your book, draw a compass with North (N), South (S), East (E) and West (W) directions.
Thinking about the information above, next to each compass direction, answer the following questions.
1. E = Excited: What excites you about these ideas or propositions? What’s the upside?
2. W = Worrisome: What do you find worrisome about these ideas or propositions? What’s the downside?
3. N = Need to Know: What else do you need to know or find out about these ideas or propositions? What additional information would help you to evaluate things?
4. S = Stance or Suggestion for Moving Forward: What is your current stance or opinion on these ideas or propositions? How might you move forward in your evaluation of this idea or proposition?
The Compass points thinking routing was developed by Project Zero, a research centre at the Harvard Graduate School of Education.
Quick check 9.11
1. Explain the various ways in which electricity is currently generated.
2. Explain the new ways in which scientists and engineers are trying to generate electricity.
Wireless charging can transmit power without cables through electromagnetic induction. Nikola Tesla discovered this effect, and his early work is the basis of modern wireless charging. When AC flows through the coils in the wireless charging device, it creates an oscillating magnetic field. When a smartphone is placed on the charger, the magnetic field causes electrons to oscillate in a receiver coil inside the phone, creating an alternating current. This current is converted by a rectifier to DC to recharge the device’s battery. However, wireless charging is not as efficient as corded charging; the current generated is lower, meaning it takes longer to recharge your device fully. In addition, if the coils in the device and the wireless charging pad are misaligned, more energy is wasted as heat instead.

A different approach to transmitting power uses electromagnetic waves, such as radio waves or light. Tesla himself tried unsuccessfully to transmit power by low-frequency radio waves. In 2022, researchers transmitted power to a device over 30 metres away using lasers. Instead of using electromagnetic induction, this form of wireless charging converted light energy from the lasers into electricity using miniature solar panels (covered in the next section) as receivers. While this technology has a long way to go, it is likely that corded charging will eventually be a thing of the past.
Try this 9.7
simple dC motor and aC generator: Venn diagram of parts
List the names of the parts of a simple DC electric motor and an AC generator, each in its own column, side by side on a sheet of paper. Add the names of the form of energy inputs and outputs for each one. Use different colours to highlight or circle the parts, inputs and outputs that are the same. Use this to create a Venn diagram showing the parts that are the same and the parts that are different for each one. Finally, write a one-sentence statement for each one that summarises what its distinguishing parts or inputs/outputs are.
Section 9.2 questions
Remembering
1. State the energy changes associated with an electric generator.
2. Consider if it is possible to have a device that is both an electric motor and an electric generator. Give an example.
Understanding
3. Faraday passed a magnet through a coil to generate electricity. Explain whether it is possible to keep the magnet stationary and have the coil move to make electricity.
4. Explain how a turbine can be made to rotate.
5. Explain how the rotation of a turbine can be used to produce electricity.
Applying
6. Explain why an AC generator does not need a commutator to produce AC current. Outline what it uses to transfer electric current from moving coils to a static circuit.
7. In the science laboratory you see a circuit set up with a switch and a battery labelled as rechargeable, connected to an enclosed, cylindrical device (which you can’t see inside) on a stand. The cylindrical device has a drive shaft connected to a fan wheel with blades, which can turn. Without operating the circuit, analyse what the cylindrical device might be, and what function the circuit has. Justify your answer.
Analysing
8. Discuss how the energy of waves can be harnessed.
9. In Australia about 46% of our electrical energy is generated by coal-fired power stations. Describe how coal-fired power stations transform the chemical energy stored in coal into electrical energy.
Evaluating
10. Evaluate the level of take up of solar and wind power generation given Australia’s considerable solar and wind power potential.
11. Evaluate whether hydroelectric power is renewable and list the advantages and disadvantages of creating and using hydroelectric power.

At the end of this section, I will be able to:
1. Describe the function and energy transformations of batteries.
2. Describe the function and energy transformations of photovoltaic panels.
3. Explain why batteries and photovoltaic panels produce direct current.
4. Compare the production of AC and DC power.
A bicycle headlight is an example of a DC generator called a dynamo. As the bicycle moves, the rotating wheels turn a magnet inside a stationary coil. This induces a current in the wire that generates enough electricity to power the headlight.

As we learned in the last section, generators (alternators) can be used to produce electricity as AC power. Generators can also produce electricity as DC power (dynamos), although their large-scale use is not common today, except in some industrial applications. Modern DC generation is chiefly carried out by solar panels and batteries.
It was noted at the beginning of this chapter that to produce an electric current, electrons need to be moved. Besides using magnets, another way to move electrons is through chemical reactions. Chemical reactions occur when reactants interact and change into products. Some chemical reactions involve the movement of electrons and this can create a steady electric current. This is the basis of batteries (electrical cells), which transform chemical energy in a reaction to electrical energy. When the reactants are used up, the current stops. In so-called primary batteries, the electricity originates with the reactants, meaning that the battery has not previously been charged up with electricity. Batteries that can't be recharged are discarded (which has safety and environmental issues) or recycled.
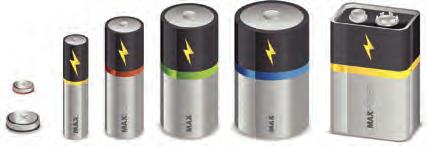
The reaction that produces the electricity in a battery may be reversible, in that electrical energy can be supplied to the 'dead' battery to regenerate the reactants, thus recharging the battery. It may be possible to recharge a battery hundreds of times, but eventually most stop working effectively, and should then be recycled.
The first batteries were 'wet cell' batteries (see Figure 9.45). In this kind of battery, the reactants are placed in the container (the cell), one of which is liquid – an acid or alkaline solution, called the electrolyte. The electrolyte reacts with the two solid electrodes in the battery (i.e. the negative anode and the positive cathode), causing ions to pass between them through the electrolyte, and electrons to flow through a conductor placed between the electrodes. The resulting electric current can drive a load, such as a light or small motor. The current produced is direct current (DC) because the reaction is steady and proceeds in one direction, from reactant to products.

electrolyte a liquid or paste in a battery through which ions travel to take part in the chemical reactions that power the battery electrode a structure, usually solid, that makes contact with the electrolyte in a battery and takes part in the chemical reactions that power the battery; serves as a terminal, where a load can be connected; one is positive (the anode) and the other is negative (the cathode)
at the anode
Electrolyte Positive charges


Negative charges collecting at the cathode Ions in the electrolyte move between electrodes
Figure 9.45 A wet cell battery, also called a galvanic or voltaic cell. Chemical reactions between the electrolyte and electrodes cause electrons to flow in the wire from the negative electrode (the cathode) to the positive electrode (the anode). Remember, when electrons flow, electricity is being produced.
Lead-acid batteries, based on reactions between lead and lead oxide electrodes and sulphuric acid electrolyte, are the most common wet cells today. You may have seen one connected to your car engine. They are used to start internal combustion engines, so they are found in many vehicles. These batteries are rechargeable.
Wet cells have a major disadvantage: the electrolyte can leak out, making them susceptible to damage. Further, the electrolyte is usually hazardous – corrosive or toxic. However, there is another kind of battery, a 'dry cell', in which the electrolyte is a paste, gel or other semi-solid, making it spill-resistant (see Figure 9.46). Despite their name, however, dry cell batteries are not completely dry or solid.
Metal cap
Zinc case (negative electrode, anode)
Electrolyte
Manganese dioxide paste
Carbon rod (positive electrode, cathode)
Figure 9.46 A modern ‘dry cell’ battery. Chemical reactions between the manganese dioxide electrolyte (in paste form) and zinc and carbon electrodes cause an electric current to flow when a circuit is connected.
rechargeable battery types
Research types of rechargeable batteries used in electronic devices as well as smartphones, laptops and electric vehicles. Search for advances in battery technology. Write a brief report that:
1. analyses how these battery types compare to the zinc-carbon-manganese dioxide dry cell shown in Figure 9.46
2. lists the advantages and disadvantages of each type
3. evaluates three future improvements being developed in battery technology.
Did you know? 9.3
Experimentation with electricity was inspired by curiosity about static electricity and lightning. In the case of lightning, electrostatic charge builds up in thunderclouds and discharges via lightning due to the voltage difference between the Earth’s surface and the cloud base. Certain organisms, such as the electric eel, can also separate and store charges using capacitor-like structures in their bodies. These charges can then be released as a devastating shock for defence or to stun prey. These early experiments led to the invention of the Leyden jar (see Figure 9.47), which could store a significant electrical charge and discharge it when connected to a conductor.
However, capacitors are poor storage devices compared to batteries, storing less energy and releasing it faster, with less control. Nevertheless, capacitors remain a critical part of modern electrics and electrical systems, where they are used to smooth out fluctuations in electrical current by filtering and stabilising voltage. In circuits, they can block unwanted signals, store energy for quick bursts (like in camera flashes) and help manage power for devices like smartphones and computers.
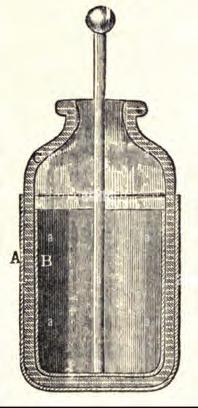
Figure 9.47 The Leyden jar was one of the first capacitors. The jar could store a significant electrical charge and discharge it when connected to a conductor.

1. a) Describe the main components of batteries, including their role in an operational battery. b) Draw a flow chart showing the energy transformation that occurs in a battery when it is powering a circuit.
2. Explain why batteries produce direct current rather than alternating current.
3. Explain why the electric current produced by a battery eventually stops.
You have probably seen solar panels or photovoltaic (PV) panels on top of houses, powering garden lights or on a calculator. These panels contain an array of photovoltaic (PV) cells, which capture the Sun's energy and convert it into useable electricity. As in the case of batteries, electricity is produced by PV cells without any mechanical parts. The functional part of the PV cell is made of two types of silicon material. When photons of light (with sufficient energy) are absorbed by the top silicon material, the electrons become excited and dislodge from their atoms. The top material's surface is treated during manufacturing to make it more attractive to free electrons, causing them to move there. This creates a charge imbalance between the front and back surfaces of the cell, much like the positive and negative terminals of a battery. When connected in a circuit, the free electrons can flow (i.e. electricity is produced). The current in the circuit is DC because the electrons can move in only one direction.
Where solar panels are used to feed power into the main electricity grid, a building's mains supply or AC appliances, a device called an inverter is needed to convert DC to AC.


inverter an electronic device that converts DC to AC
Try this 9.8 solar panels
Write a simple practical report for each of the following investigations:
1. Investigate, under the same lighting conditions, how different numbers of cells, different ways of connecting the cells and different orientations of the cells change the electric output the cells produce.
2. Using the set-up from (1) that gave the highest electric output, investigate what electric output can be obtained under different lighting conditions, such as full sunlight, shade from clouds, shade from trees or buildings, and indoor lighting.
For this activity, you will need:
• a solar panel kit with several solar cells that can be connected in different ways
• a load (e.g. light or spinning fan)
• a bright light source or access to sunlight
• a multimeter (optional).
A single domestic PV panel with a size of 1 m by 1.6 m typically produces about 400 W of power (400 joules of energy per second) with a voltage of 15–30 V. Panels can be connected in series to increase the total power and voltage produced. In 2024, commercial domestic panels had an efficiency of about 20%, meaning that to produce 400 W of power, around 2 kW of sunlight must have fallen on the panel. Increasing the efficiency of solar panels would be beneficial in terms of the number of panels required, their power output and the energy captured.
Using reliable and trustworthy websites, research the following:
1. Commercial domestic panels in Australia: compare the efficiency of three different types or brands.
2. Advances in photovoltaic panel efficiency: compare three different approaches or technologies, stating the efficiencies reached.
1. Describe how a PV panel generates electricity.
2. Explain why a PV panel produces DC, and what is needed to enable an AC appliance to be powered by a solar panel.
3. Justify why research should be carried out to improve the efficiency of PV panels.
Unlike hydroelectric, fossil fuel and nuclear power generation, solar power uses an intermittent energy source. That is, there is not a constant supply of sunlight for solar panels to capture. Wind has a similar problem.
The solution is to integrate solar and wind power with battery technology into a complete system. Excess power in sunny and windy conditions can then be stored in batteries for use at night or on calm days. Figure 9.51 shows a domestic battery installed on the wall of a house.
Households with solar panels but no domestic battery, or not enough storage capacity, can feed electricity from their solar panels into the mains grid, often receiving a credit against their electricity bill.
Interacts with the solar panel to make electrical energy
In addition to domestic batteries, there are larger batteries that can be used by a whole community, and even grid-scale battery installations the size of warehouses.
Try this 9.9
Venn diagram aC and dC power
Reflect on what you have learned about the generation of electricity. Create a Venn diagram that compares the production of AC and DC power. Think about their characteristics, how they are produced, their applications, and their advantages and disadvantages.
You may wonder why Venn diagrams are a teacher’s best friend. The benefit of using one is that you, the student, have to organise your thoughts and make decisions, while your teacher can see what you are thinking and help you with any tricky ideas. You end up with a lovely diagram summarising key similarities and differences, and a much better understanding of the concepts.
Section 9.3 questions
Remembering
1. Describe the energy changes associated with a battery.
2. Describe the energy changes associated with a photovoltaic panel. Understanding
3. Explain whether the process by which a battery generates an electric current is reversible. Provide an example of the ‘normal’ and ‘reverse’ operation for a battery.
4. Explain what ‘efficiency’ means with regard to photovoltaic panels. State the typical efficiency of a domestic solar panel.
Applying
5. A photovoltaic panel is going to be used to provide the electrical energy for an emergency AC radio for hikers. This emergency radio will be fixed to an information point in a wilderness area. Identify and justify two other devices that need to be placed in the circuit to ensure the radio works, at any time of the day or night.
6. A toy company wants to design an electrically powered model plane. Analyse what characteristics the battery should have. Suggest the best type of battery to use in this plane.
7. Analyse the issues that need to be addressed for the following situation: A populated island, with no external connections to a power source, wants to use 100% renewable energy sources to generate a reliable electricity supply, 24 hours a day.
8. Identify and justify the benefits for the environment in adopting solar panels for large-scale electricity generations in the country and in urban areas.
9. A family uses 5200 kWh of electricity per year (kWh = kilowatt-hours, a measure of electrical energy used by power companies). They pay 35 cents per kilowatt-hour for their electricity. They install a 6 kW solar panel system for $6250, which saves them 4000 kWh per year. They start the system at the beginning of the year. To the nearest month, evaluate how long it will take for their savings on the electricity bill to pay for the cost of the installation.
10. Evaluate the hazards posed by batteries and suggest measures to reduce these hazards.
Chapter checklist
Success criteria
9.1I can define electromagnetism 1
9.1I can use the right-hand grip rule 6
9.1I can explain the role of electromagnets in simple electronic devices7
9.2 I can define electromagnetic induction 2
9.2 I can explain the generation of alternating current using magnets9
9.2 I can explain the function of turbines in the generation of electricity10
9.2 I can list and describe sources of energy and energy transformations to use to generate electricity 3
9.2 I can describe the parts and functions of a simple AC generator9, 11
9.2 I can describe the difference between fission and fusion as energy sources 4, 14
9.2 I can build a wind vane and use it to investigate the power generated by wind 10
9.3 I can describe the function and energy transformations of batteries 5
9.3 I can describe the function and energy transformations of photovoltaic panels 18
9.3 I can explain why batteries and photovoltaic panels produce direct current 8, 12
9.3 I can compare the production of AC and DC power 9, 10, 11, 12, 13, 19
Review questions
Remembering
1. Define electromagnetism.
2. Define ‘electromagnetic induction’ and provide an example of what happens when magnet is moved inside a wire coil.
3. List three sources of renewable energy and three sources of non-renewable energy that can be used to generate electricity.
4. State the two types of nuclear energy and describe two differences between them.
5. List three essential components of a battery.
6. Recall what the right-hand grip rule tells you.
Understanding
7. Explain how an electromagnet works.
8. Explain what devices are needed, and why, in a charger to charge the battery in an electronic device from the mains supply.
9. A device with rotating coils and permanent magnets has a metal ring split into segments that contact carbon brushes attached to a circuit. Explain, with reasons, whether this is an AC or DC device.
10. Explain how the blades of a turbine function to rotate the turbine, and contrast a turbogenerator with an electric fan.
Applying
11. Use Figure 9.53 to answer the following questions.
a) If the coil is kept rotating in the same direction, identify whether the current through the load will be AC or DC.
b) Justify your answer to (a) with reference to the alternator.

12. This simplified flow diagram of the electricity supply for a house shows three inputs (supplies), four outputs (powered devices) and a house battery.
State whether the following supplies and devices are likely to be AC, DC or either.
a) Mains supply
b) Wind turbogenerator
c) Solar panels
d) Appliances (e.g. for heating, cooking, washing)
e) Mains voltage power sockets
f) Lighting
g) House battery
h) Electric vehicle charging outlet
13. The boxes labelled i, j and k represent the devices other than transformers that need to be integrated into the circuit. Suggest what each of these devices are, giving reasons.
14. Copy and complete the following table to compare the advantages and disadvantages of AC and DC power generation and distribution.
Advantages
Disadvantages
15. Discuss the extent to which nuclear fission and fusion energy could be considered renewable or non-renewable sources of energy. In your discussion, compare these with non-renewable sources such as coal and gas.
16. Discuss the extent to which electromagnetism, discovered by Øersted in 1820, and electromagnetic induction, discovered by Faraday in 1831, are opposite effects.
17. In the simple AC generator studied in this chapter, the magnetic field was supplied by permanent magnets. Explain whether the magnetic field could be supplied by electromagnets.
18. A single solar panel produces 400 W of power in full midday sun with an efficiency of 20%.
a) Convert the power output of the panel to joules of energy per second.
b) If the panel is upgraded to one with an efficiency of 30%, calculate how much power it will produce in watts when the same level of solar energy falls on it.
c) The average power output for the panel for a 12-hour day is 200 W. Calculate how much energy in kilojoules it produces in a 12-hour day.
d) If the mains electricity company charges 40 cents per kilowatt-hour for mains electricity, calculate how much the owner saves per day on their electricity bill by using the solar panel. Use the conversion 1 kWh = 3.6 MJ.
19. Evaluate what source of energy, type of generator and extra connected devices would be best for the following situations, giving reasons.
a) A remote holiday cabin to provide basic lighting and sockets for charging phones and laptops; no electric appliances or heating.
b) A holiday home that is off the main grid but needs to be fully equipped with domestic appliances.
c) A community of homes, shops and rural industries in a valley in a hilly area with plenty of rain.
A family living in rural Victoria is considering installing solar panels on the roof of their house. They are trying to rely less on fossil fuel energy sources and move towards more sustainable sources of energy.
The average solar panel energy generation over a two-week period in summer and winter is illustrated in Figure 9.54. The average daily energy usage for a family of their size is around 20 kW/h.
Solar power energy generation comparison: Summer vs. winter
Day2Day3 Day4 Day5Day6 Day7Day8Day9Day10Day11Day12Day13Day14Day15
Figure 9.54 Solar panel energy generation over a two-week period in summer and winter
Applying
1. Identify in which season the solar panels produced the most energy.
2. Determine which day had the lowest energy production in summer and explain why this may have happened.
3. Using data from the graph, calculate the average amount of electricity generated over days 1–7 in both summer and winter and explain the difference.
Analysing
4. Identify which day in summer and in winter shows the highest energy production.
5. Determine the difference in energy production in summer and winter on day 9.
6. If an energy supply company pays 10 c per kWh of power that is fed back into the grid, and assuming an average use of 20 kWh per day, calculate how much money this family could earn over the summer months.
7. Discuss whether this family would be able to rely solely on solar panels for their energy needs. Use data from the graph to justify your response.
8. Suggest whether or not this data is sufficient for the family to make a decision about whether it is worth the cost of installing solar panels.
9. Propose a question about how the data in Figure 9.54 was collected that would help to determine whether it is useful to the family or not.
In today’s world, much of the electricity we use is generated by burning fossil fuels such as coal, oil and natural gas. While these resources have powered the world for decades, they come with significant environmental costs, including air pollution and the release of large amounts of carbon dioxide, which contributes to climate change. As we become more aware of these impacts, there is a growing need to reduce our reliance on fossil fuels and shift towards renewable energy sources.
One promising alternative is solar energy. The Sun provides an abundant and renewable source of energy in the form of light and heat. One common method of harnessing this energy is through solar panels, which convert sunlight into electricity using photovoltaic (PV) cells. These cells capture sunlight and transform it into usable electrical power. Solar panels are increasingly being used in homes, schools and businesses to reduce dependence on fossil fuels and lower energy costs.
In addition to solar panels, there are other ways to capture and use the Sun’s thermal energy directly. For this activity, you will design a method to capture thermal energy from the Sun and explore how this energy could be used in your school. Your solution could involve anything from heating water, to using thermal energy in the school’s tuckshop. The goal is to reduce the school’s reliance on fossil fuels and make it more environmentally friendly.
Design a method of capturing thermal (heat) energy from the Sun and propose a method of using this energy in your school.
In this activity, you and your colleagues will collaborate and build a prototype that uses the heat energy from the Sun and transforms this into a usable form.

• clear beaker that holds at least 200 mL of water
• thermometer that reads between 0°C and 100°C
• black or blue water-soluble ink
• stopwatch
• scales accurate to at least 1 gram
• mirrors
• cardboard
• rubber/plastic tubing
• black paint
Suggested
School oval or soccer pitch on a sunny day
1. Research solar thermal energy and how technology is used to capture heat energy.
2. Research the number of sunny days in your area and sunlight hours available for energy capture.
3. List all the ways heat energy is captured and how the energy is used.
(e.g. heating pool)
Water in pool
(e.g. heating pool)
Black plastic tubing on house roof
Pool water will increase in temperature.
Water is pumped through the black tubing, which absorbs the heat energy from the Sun and pumps this into the pool.
4. Decide how you and your group plan to use the heat energy and discuss the sustainability aspects of your prototype creation. For example, will the energy captured from the Sun be greater than the energy required to build the device?
5. Design a prototype that will use heat energy from the Sun and be usable in your school.
6. Annotate your design and list all the heat transfers and transformations.
7. Build your prototype and test your design using a thermometer.
8. Extension: Create a business logo that matches your prototype idea.
9. Present your prototype to the class with your measured energy capture.
10. Discuss the suitability of your design for a school and whether it could be used in other locations.
accurate measures closely match the ‘true’ or accepted values
action potential the electrical impulse (message) that is transmitted along a neuron
alpha particle a positively charged particle that is emitted from the nucleus of some radioactive elements during radioactive decay (or disintegration) of an unstable atom
alternating current (AC) a form of electricity in which the current reverses direction in regular cycles (though the electrical energy associated with the current flows in one direction)
amplitude the distance (height) of a wave crest or the depth of a wave trough from the centre line of the wave
anthropogenic caused or influenced by people
antibiotic a type of medication used to treat bacterial infections
antibody a Y-shaped molecule that binds to specific antigens
antifungal a type of medication used to treat fungal infections
antigen a substance that induces an immune response in the body
antiseptic a substance that stops or slows down the growth of microorganisms; used externally on skin
antiviral a type of medication used to treat viral infections
armature the rotating coil that forms part of an electric motor
asexual reproduction a method of reproduction in which a single parent produces offspring genetically identical to itself
atmosphere the mixture of gases above the surface of the Earth
atom the building blocks of matter
atomic number the number of protons in an atom of an element
autonomic nervous system the part of the peripheral nervous system involved in involuntary physiological processes such as heart rate and digestion
bacteria (singular: bacterium) microscopic, unicellular (single-celled) organisms
beta particle a negatively charged particle (electron) that is emitted from the nucleus of some radioactive elements during radioactive decay (or disintegration) of an unstable atom
balanced when a chemical equation has an equal number of atoms of each element on both the reactant and product side of the equation
battery an electrical energy storage device that produces a direct electric current (DC) by means of chemical reactions
binary fission a type of asexual reproduction in which the cell divides, creating two identical cells; the most common form of reproduction in prokaryotes, such as bacteria
bioaccumulate when the concentration of a substance increases inside a living organism, as intake exceeds excretion
biodiversity the variety of species, ecosystems and genes that exist in a particular area
biomass the material produced by the growth of plants, animals and microorganisms
bioplastic a type of plastic made from renewable resources, such as plants
biosphere all the areas on Earth and in its atmosphere that contain life
brush the part of a motor that conducts current between stationary and moving parts
budding a type of asexual reproduction, used by organisms such as yeast and hydra; involves the daughter offspring growing off the side of the parent and then dropping off
carbon sequestration the process of storing carbon in a carbon sink
carbon sink an area where carbon is stored (e.g. ocean, forests or fossil fuels)
carbon source a process or an area that releases carbon
catalyst a chemical that speeds up a chemical reaction; it is not a reactant and is not used up during the reaction
causation one event is caused by another event occurring
cellular respiration the chemical process through which cells release energy, by converting glucose and oxygen into carbon dioxide and water
chemical change a rearrangement of atoms that is often irreversible
chemical reaction a process or chemical change that transforms one set of substances (the reactants) into another set of substances (the products)
cilia (singular: cilium) hair-like structures that line the respiratory tract and sweep microbes and debris out of the airways
climate the average or prevailing weather conditions of an area over a long period
cloaca a hole used for defecating, urinating and reproduction that is present in some amphibians, reptiles, birds, fish and monotremes closed system an environment from which matter cannot escape cochlea the part of the inner ear that produces nerve impulses in response to sound waves coefficient a number placed in front of a chemical symbol to balance a chemical equation commutator a split ring that reverses current at a point in a motor compound a substance formed by the chemical combination of two or more different elements in a fixed ratio
compression the part of a longitudinal wave where the particles are squashed together conduction the transfer of thermal energy through collisions between particles conductor (electricity) a substance or material that allows electrons to pass through it easily conductor (heat) a substance or material that allows heat to pass through it easily
contagious an infectious disease that can be passed from one human to another continuous data quantitative (numerical) data points that have a value within a range; this type of data is usually measured against a scale that may include decimals or fractions
control centre often the brain or spinal cord, which receives signals from receptors and sends out signals to effectors to produce a response to a stimulus control group a group that is not subjected to the independent variable in an experiment, and therefore provides a baseline for comparison controlled variable a variable that is kept constant so as not to affect the dependent variable in an experiment
convection the transfer of thermal energy due to the movement of particles in a liquid or gas correlation a statistical measurement of the extent to which two variables change in relation to one another
crest the maximum displacement of a particle at the top of the wave
cross-pollination pollination that occurs when pollen is transferred from a flower on one plant to a flower on another plant
current the flow of electric charge, which may continue in a steady manner for a period of time cycle one complete vibration or periodic movement of a particle through the crest and trough of a wave and back to its starting position; the length of a cycle is the wavelength
culturally responsive learning from and connecting respectfully with Aboriginal and Torres Strait Islander people from different language groups and communities; building strong, meaningful and collaborative relationships that value their knowledge and cultures
decomposer a living organism, such as bacteria and fungi, that breaks down dead organic matter
dependent variable the variable that is measured in response to the independent variable
descriptive statistics mathematical tools used to summarise and describe datasets (e.g. measures of centre and spread)
differentiation the process by which cells become specialised
direct current (DC) a form of electricity in which the current flows in one direction
discrete data quantitative (numerical) data points that tend to have whole numbers; this type of data is usually counted
disease an illness that causes specific symptoms
displacement the position of a particle when it has moved away from its rest position on the centre line of the wave
effector a muscle, gland or organ that carries out a response or action in response to a stimulus
electric motor a device that converts electrical energy to kinetic (movement) energy
electricity a form of energy that results from the accumulation or the flow of charge
electrode a structure, usually solid, that makes contact with the electrolyte in a battery and takes part in the chemical reactions that power the battery; serves as a terminal, where a load can be connected; one is positive (the anode) and the other is negative (the cathode)
electrolysis a process in which an electric current is used to decompose a chemical compound
electrolyte a liquid or paste in a battery through which ions travel to take part in the chemical reactions that power the battery
electromagnet a magnet consisting of a currentcarrying coil surrounding a piece of iron
electromagnetic induction the production of current in a wire due to a moving magnetic field
electromagnetic radiation the transfer of energy by electromagnetic waves
electromagnetic wave a wave with electric and magnetic components that can travel through matter or a vacuum
electromagnetism the interaction between magnetic fields and electric currents
electron a subatomic particle with a negative charge, found outside the nucleus of an atom; has a relative mass of 1 1836 of a proton or neutron
electrostatic charge a charge that stays on an object embryo a fertilised egg cell in the early stages of growth and differentiation; in humans, 2–8 weeks after fertilisation
embryo sac the female gamete in flowering plants
endocrine system the system of glands that controls hormones in the body enhanced greenhouse effect the intensifying of the natural greenhouse effect due to human activity
epidemic an outbreak of an infectious disease that has spread to the wider community excretion the process of eliminating waste products, excess water and other unnecessary substances from the body
exponential a growth or decline that becomes increasingly rapid with time (or relative to another variable)
external fertilisation a method of fertilisation in which gametes are released into the environment and fertilisation occurs outside the body extraneous variable a variable other than the independent variable that may affect the dependent variable; if not controlled, can influence experimental results and lead to false conclusions
extrapolation extending a trend, pattern or relationship observed in a limited range of data to estimate values beyond that range; predictions can lack reliability
fermentation a chemical process by which energy is produced in the absence of oxygen fertilisation the fusion of the male and female gametes (sperm and egg)
fragmentation a type of asexual reproduction in which a parent organism splits into multiple fragments, each of which can potentially develop into an independent individual free electron an electron that is not attached to an atom frequency the number of cycles of a wave per second; measured in hertz (Hz)
fungi (singular: fungus) single-celled or multicellular organisms that contain a nucleus and a cell wall made of chitin
gamete a sex cell (egg or sperm); contains half the genetic material required to make an organism
gestation the pregnancy period, when offspring are developing inside the mother
glacial period a period in Earth’s history when a reduction in global temperatures is sustained for a long period
global warming the long-term rise in the average temperature on Earth, primarily caused by the increase of greenhouse gases in the atmosphere
gamma ray a type of electromagnetic radiation; has high energy and a very short wavelength; produced when certain radioactive atoms decay generator a device that converts kinetic (movement) energy into electricity
geosphere all Earth’s geological materials, including magma, lava, rocks and minerals
glucagon a hormone secreted by the pancreas that triggers the liver and muscle cells to convert glycogen into glucose, raising blood glucose levels gonad the reproductive organ where gametes are produced; testis in males and ovary in females
green (environmental) something that has a reduced impact on the environment
greenhouse effect the trapping of the Sun’s warmth by a layer of gases in the lower atmosphere
greenhouse gas a gas that contributes to the greenhouse effect
half-life the time taken for half of the atoms in a sample of radioactive material to decay
heat thermal energy transferred from hotter objects or regions to colder objects or regions
hertz a unit for measuring the number of cycles that happen every second (frequency); abbreviation Hz
homeostasis the process by which an organism maintains a stable internal environment despite changes in the external environment
hormone a chemical messenger secreted by endocrine glands that controls and regulates different processes in the body
hydrosphere all of the water found on Earth (e.g. lakes and rivers)
hypothesis a proposed explanation or an educated guess that can be tested through further investigation or experimentation
immune system the system of cells, tissues and organs that enables the body to protect itself against disease
independent variable the variable that is systematically manipulated or changed in order to investigate its effect on the dependent variable infection the growth of a pathogen inside the body
infectious disease a disease caused by a pathogen inferential statistics mathematical tools that allow scientists to make claims regarding cause-and-effect relationships between variables by analysing the changes in datasets
infrared radiation the type of electromagnetic radiation that lies between microwaves and visible light; also known as heat radiation
insulator (electricity) a substance or material that does not allow current to flow through it easily
insulator (heat) a substance or material that does not allow heat to pass through it easily
insulin a hormone secreted by the pancreas that triggers cells to take up glucose from the bloodstream and the liver, which is then stored as glycogen, lowering blood glucose levels
interglacial period a period in Earth’s history when an increase in global temperatures is sustained for a long period
internal fertilisation a method of fertilisation in which male gametes are delivered into the female reproductive system and fertilisation takes place inside the female
interneuron a nerve cell that transmits information within the brain and spinal cord (central nervous system)
interpolation using a line of best fit to make predictions within an existing dataset; predictions tend to be reliable
inverter an electronic device that converts DC to AC investigable able to be tested through research or experimentation
ion a charged version of an atom that has either gained electrons (and become negatively charged) or lost electrons (and become positively charged)
ionic compound a type of compound generally made up of both metal and non-metal atoms
ionising radiation higher-frequency ultraviolet rays, X-rays and gamma rays, which can turn atoms and molecules into ions, and which can potentially damage living cells
isotopes atoms of the same element, with the same number of protons but a different number of neutrons
keystone species a species that has a significantly large role/impact on a particular ecosystem relative to its population
kinetic energy the energy an object or particle has due to its motion
Law of Conservation of Mass a scientific law that states that matter can be neither created nor destroyed
linear a straight line plotted on a graph
lithosphere the geological parts of Earth’s crust and upper mantle only
longitudinal wave a wave with vibrations that move in the direction of travel instead of transversely; e.g. sound waves
magnetic field the region in which a magnet can exert a force on other magnets
magnetic field line a visual tool to represent the direction of magnetic fields
magnetic induction the process by which an object is magnetised by an external magnetic field
lymphocyte a white blood cell that is involved in fighting disease; some produce antibodies
lysis breakdown of a cell due to the disruption of its membrane
magnet a material containing iron and other elements that attracts similar materials or objects; aligns with an external magnetic field
magnetism the ability to attract or repel objects that are magnetic
mass number the sum of the protons and neutrons in the nucleus of an atom
mean the total of a set of values divided by the number of values in that set
mechanical wave a disturbance in a medium that transfers energy through that medium
median the middle value of the dataset after all the values have been ranked (sorted in ascending order); there should be as many values below the median as above it
medium the matter through which a mechanical wave travels
memory cell a lymphocyte formed after exposure to a pathogen; can produce a faster and stronger immune response upon re-infection
menstrual cycle a cycle controlled by hormones to prepare a female body for fertilisation of an egg; if fertilisation does not occur, menstruation will follow menstruation the cyclical shedding of the uterine lining; also known as the menstrual period
microbe an organism that is too small to see with the naked eye
microwave the type of electromagnetic radiation used for cooking, communications and Wi-Fi; lies between radio waves and infrared radiation
mitosis a process in which a single eukaryotic cell divides into two identical daughter cells
mode the most frequently occurring value or values in a dataset
molecule a chemical species made up of two or more atoms; can be elemental or a compound
motor neuron a nerve cell that transmits messages from the central nervous system to effectors
native metal a metal that exists in its elemental form in the environment
nectar a sweet liquid produced by flowers to attract pollinators
negative feedback a regulatory process that reduces the output of a system in response to a deviation from a set point
nervous system the body system consisting of the brain, spinal cord and peripheral nerves and receptors that communicate messages quickly within the body
neuron a nerve cell neurotransmitter the chemical messenger that is released from one neuron and travels across the synapse to bind to the next neuron
neutron a subatomic particle with a neutral charge found in the nucleus of an atom; has a relative mass of 1
nominal data qualitative (categorical) data where the categories have no clear order non-infectious disease a disease that is not caused by a pathogen
non-linear a plot on a graph that is not a straight line normal flora a population of microbes that permanently inhabit the human body and that do not usually cause disease
nuclear fission reaction the process by which an atom splits into two parts
nucleus (plural: nuclei) the central part of the atom containing its protons and neutrons
nuclide notation a symbol notation in which the mass number is shown at the top left of an element symbol and the atomic number is shown at the bottom left
open system an environment from which matter can escape
ordinal data qualitative (categorical) data where the categories have an order origin the point on a graph where the x-axis and y-axis intersect (0, 0)
oscillating moving back and forth with periodic motion, somewhat like vibration
osmoregulation the regulation of water levels in the blood/body
outbreak a sudden increase in the incidence of an infectious disease within a certain area
outlier an extreme data point – a number that is very different from the rest of the data collected
ovulation the release of an ovum (egg) from the ovary into the fallopian tube
ovule a structure in a flowering plant where the female gamete is produced and where seeds develop ovum egg, or female gamete
pandemic an outbreak of an infectious disease that has spread across multiple continents
periodic motion movement of a particle or an object that returns to its starting position and repeats in the same time interval, like a swing permanent magnet a magnet that retains its magnetic properties outside a magnetic field personal error a type of random error that arises from mistakes and miscalculations by the person conducting the experiment
parasite an organism that lives on or in a host that causes harm by extracting nutrients from the host parthenogenesis a type of asexual reproduction in which an egg develops into an embryo without being fertilised by a male gamete
pathogen any organism that can cause disease, such as bacteria, viruses or fungi
phagocytosis a cellular process in which a white blood cell wraps around and ingests a cell or large particle to break it down using enzymes
photon an electromagnetic wave carrying a specific amount of energy related to its frequency or wavelength
photovoltaic (PV) panel a thin flat structure made of two materials (usually silicon-based) that, when photons of light are absorbed, have the property of separating electric charges; creates a flow of electrons that produce a direct current pitch how high or low a sound seems to our ears on a music scale
pole the end point of a magnet
pollen the male gamete in flowering plants pollination the process by which pollen, containing the male reproductive cells of a plant, is transferred from the male part of a flower to the female part of a flower
positive feedback a mechanism that maintains the direction of a stimulus and accelerates its effect
prediction a statement that describes what is expected to happen if the hypothesis is true product a substance that is formed in a chemical reaction
prokaryote a cell that lacks membrane-bound organelles (such as a nucleus)
proton a subatomic particle with a positive charge found in the nucleus of an atom; has a relative mass of 1
puberty the time of transition from juvenile form to adult form
p-value determines the statistical significance of results by gauging the level of probability that the difference between two group’s results is due to chance
radiation the transfer of energy without the presence of particles radio wave a type of electromagnetic radiation; has the longest wavelength radioactive decay when an unstable nucleus emits radiation (alpha and beta particles or gamma rays) and breaks down to form another element radioisotopes the radioactive isotopes of an element
random error an error caused by limitations of the measurement device or the observer, that does not follow a regular pattern
rarefaction the part of a longitudinal wave where the particles are spread out reactant a substance that is reacting in a chemical reaction
reaction conditions the conditions required for a chemical reaction to proceed rearrange move things into a different order
receptor a specialised structure that allows the body to detect and respond to stimuli
reflex action a fast, involuntary motor action that protects the body from harm
relative atomic mass the average mass of an atom when considering all natural isotope masses and their abundances
repeatability how consistent the results are when the same scientist repeats the experiment under the same conditions as the original experiment
response the reaction to a stimulus
right-hand grip rule shows the direction of the magnetic field of a current-carrying wire
safety data sheet a document that provides information regarding hazardous chemicals and substances
scrotum a sac that encloses the testes
secondary sexual characteristic any physical characteristic developing at puberty that helps distinguish different reproductive systems but is not directly involved in reproduction
seed a plant embryo enclosed in a protective coating
seed dispersal the spread of seeds away from the parent plant
seismic wave a wave that travels through Earth and over its surface; caused by earthquakes
self-pollination pollination that occurs when pollen is transferred from the same flower or from another flower on the same plant
self-propagating refers to a wave that (unlike mechanical waves) once started, keeps going at a constant speed forever without needing the input of more energy
sensory neuron a nerve cell that transmits messages from the sensory receptors to the central nervous system
slipring a copper ring at the end of the armature of an AC electric motor or generator that rotates in contact with the brushes
solenoid a wire coil wrapped in the shape of a tube or cylinder; in engineering, a coil that moves an iron core in its centre for a mechanical purpose
septic tissue infected with bacteria
sexual reproduction a method of reproduction that involves two parent organisms and results in genetic variation in the offspring
somatic nervous system the part of the peripheral nervous system involved with the voluntary control of body movements
sperm the male gamete
spore a reproductive body, produced by fungi and some plants, that develops into a new individual stimulus (plural: stimuli) a change in the environment that is detected by the human body stratosphere the layer of Earth’s atmosphere above the troposphere; contains the ozone layer
subatomic particle one of the particles that make up an atom
subscript a number, letter or symbol written below the line of text (e.g. the 2 in O2)
sustainable a way of using natural resources responsibly so they are available for future generations
sustainable ecosystem a biological environment that can support itself without outside assistance
symbol equation a chemical reaction written using the symbols and formulas of the reactants and products involved
synapse the junction between two neurons
systematic error an error that causes measurements to differ from the true result by a consistent amount, often due to faulty or uncalibrated equipment
target cell a cell affected by a specific hormone
temperature a measure of the average random kinetic energy of the particles in an object temporary magnet a magnet that does not retain its magnetism outside an external magnetic field
testes the male reproductive glands that produce sperm
thermal energy the total kinetic energy of all particles in a system
trait a characteristic belonging to an individual; under genetic control (although the environment may have an influence)
transmission the passing of a pathogen from one organism to another transverse wave a wave in which the particles vibrate or move at right angles (perpendicular) to the direction of energy transfer
troposphere the layer of Earth’s atmosphere that is closest to Earth’s surface and where most of the weather occurs
trough the maximum displacement of a particle at the bottom of the wave
turbine a type of machine that turns a wheel with blades to produce power
ultraviolet light the type of electromagnetic radiation that lies between visible light and X-rays; is needed by our bodies to make vitamin D; short-wavelength ultraviolet light can cause sunburn and cancer
vaccine a chemical substance composed of a dead or weakened version of a pathogen that is injected into the body to make a person immune against that pathogen
vacuum a space completely devoid of matter
validity the extent to which a study accurately measures or tests what it was intended to measure or test vegetative propagation a form of asexual reproduction in which only one plant is involved virus an extremely small non-cellular pathogen comprised of infectious particles that are inactive outside a living host cell
visible light the part of the electromagnetic spectrum that we can see
voltage the difference in electrical potential energy between two points in an electric circuit; measured in volts (V)
wave a carrier of energy that travels through space or matter without the movement of matter as a whole
wavelength the distance from one wave crest to the next; measured in metres (m)
weather the atmospheric conditions (such as temperature, cloud, rain or wind) at a particular time over a particular area
word equation a chemical reaction written using the names of the reactants and products involved
X-ray a type of electromagnetic radiation; has short wavelengths and can pass through flesh to give images of bones; hazardous and can cause cancer zygote a fertilised egg cell