Cambridge University Press & Assessment is a department of the University of Cambridge.
We share the University's mission to contribute to society through the pursuit of education, learning and research at the highest international levels of excellence. www.cambridge.org
This publication is in copyright. Subject to statutory exception and to the provisions of relevant collective licensing agreements, no reproduction of any part may take place without the written permission of Cambridge University Press & Assessment.
First published 2019
Second Edition 2025
Cover designed by Loupe Studio
Text designed by Shaun Jury
Typeset by QBS Learning
Printed in Singapore
A catalogue record for this book is available from the National Library of Australia at www.nla.gov.au
ISBN 978-1-009-60320-1
Additional resources for this publication at www.cambridge.edu.au/GO
Reproduction and Communication for educational purposes
The Australian Copyright Act 1968 (the Act) allows a maximum of one chapter or 10% of the pages of this publication, whichever is the greater, to be reproduced and/or communicated by any educational institution for its educational purposes provided that the educational institution (or the body that administers it) has given a remuneration notice to Copyright Agency Limited (CAL) under the Act.
For details of the CAL licence for educational institutions contact:
Copyright Agency Limited Level 12, 66 Goulburn Street
Sydney NSW 2000
Telephone: (02) 9394 7600
Facsimile: (02) 9394 7601
Email: memberservices@copyright.com.au
Reproduction and Communication for other purposes
Except as permitted under the Act (for example a fair dealing for the purposes of study, research, criticism or review) no part of this publication may be reproduced, stored in a retrieval system, communicated or transmitted in any form or by any means without prior written permission. All inquiries should be made to the publisher at the address above.
Cambridge University Press & Assessment has no responsibility for the persistence or accuracy of URLs for external or third-party internet websites referred to in this publication and does not guarantee that any content on such websites is, or will remain, accurate or appropriate. Information regarding prices, travel timetables and other factual information given in this work is correct at the time of first printing but Cambridge University Press & Assessment does not guarantee the accuracy of such information thereafter.
Please be aware that this publication may contain images of Aboriginal and Torres Strait Islander people who are now deceased. Several variations of Aboriginal and Torres Strait Islander terms and spellings may also appear; no disrespect is intended. Please note that the terms 'Indigenous Australians' and 'Aboriginal and Torres Strait Islander Peoples' may be used interchangeably in this publication.
Cambridge University Press & Assessment acknowledges the Aboriginal and Torres Strait Islander Peoples of this nation. We acknowledge the traditional custodians of the lands on which our company is located and where we conduct our business. We pay our respects to ancestors and Elders, past and present. Cambridge University Press & Assessment is committed to honouring Aboriginal and Torres Strait Islander Peoples' unique cultural and spiritual relationships to the land, waters and seas and their rich contribution to society.
About the authors
Tori Shaw Lead author
Tori Shaw has been committed to sharing her love for science with Year 7–12 students for over 20 years. She has worked in both government and independent schools, has been an assessor for the VCAA and IBO, and co-authored Cambridge's VCE Biology series. Her greatest joy comes from making science accessible, exciting and fun for all students. She is currently the Head of Science at Kingswood College in Melbourne.
Erin Checkley
Erin Checkley has taught Science and Mathematics across Years 7–12 for the past 12 years. Transferring from a career in physiotherapy, she discovered a passion for curriculum development through studying her Master of Education at the University of Melbourne and a strong desire to build students' critical thinking skills. Erin is currently teaching as a science specialist in Years Prep–4 at Ballarat Clarendon College.
Sarah Chuck
Sarah Chuck has taught 7–10 Science and VCE Biology for eight years. Having taught in an all-girls context for most of her career, she is passionate about increasing female engagement in STEM and fostering a sense of confidence and belonging among her students. Sarah has been a VCAA assessor and STAV council member, and is currently Head of Science at a Catholic secondary college in Melbourne.
The publisher would like to thank Dr Brodie Reid, Dr Gary Turner, Dr Gemma Dale, Jeremy Walker, Naomi Sutanto, Paris Beasy, Rebecca Leibhardt, Samuel Parsons and Stephanie McDougall for reviewing and contributing to this resource.
Special thanks to Sharon Davis and Julie Bover of Goorlil Consulting and to Kingswood College.
About the cover
SAMPLEPAGES
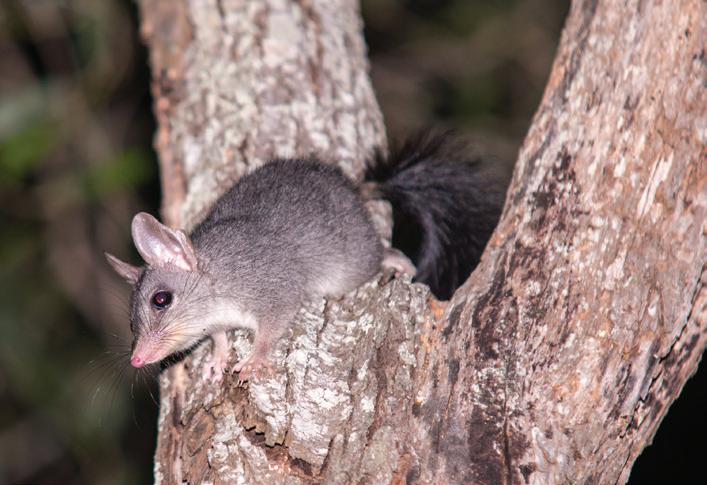
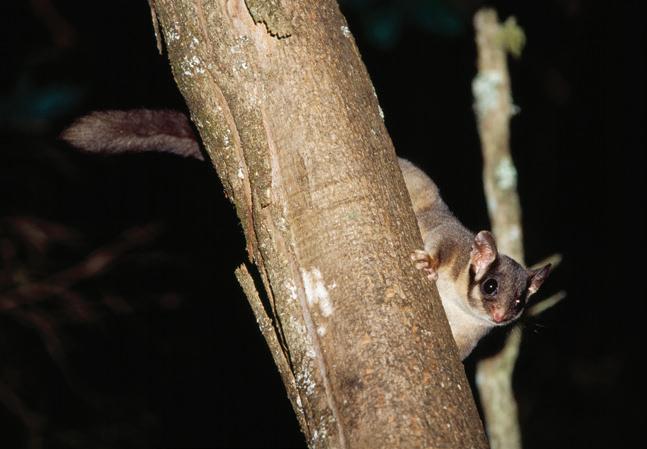
Leadbeater's possum (Gymnobelideus leadbeateri) is Victoria's faunal emblem and is mostly restricted to small areas in the Central Highlands of Victoria. Its habitat consists primarily of mountain ash trees (Eucalyptus regnans), which are also featured on the cover of this publication. Habitat loss due to logging and climate change continuously threaten Leadbeater's possum populations. It is listed as Critically Endangered on Victoria's Flora and Fauna Guarantee Act 1988 Threatened List.
SAMPLEPAGES
How to use this resource
Elements in the print book
Glossary
Definitions of key terms are provided next to where the key term first appears in the chapter.
Explore!
Students are encouraged to conduct research online to find and interpret information.
Quick check
These provide quick checks for recalling facts and understanding content. Cognitive verbs appear in bold. These questions are also available as Word document downloads in the Interactive Textbook.
Learning goals
These are descriptions of what the student will learn throughout the section.
SAMPLEPAGES
Did you know?
These are short facts that contain interesting information.
Science as a human endeavour
These are recent developments in the particular area of science being covered. They may also show how ideas in science have changed over the years through human discovery and inventions.
Section questions
Question sets at the ends of sections are categorised under five headings: Remembering, Understanding, Applying, Analysing and Evaluating. Cognitive verbs appear in bold. These questions are also available as Word document downloads in the Interactive Textbook.
Hands-on activities
Try this
Classroom activities help explore concepts that are currently being covered.
Making thinking visible
Visible-thinking-style classroom activities help consolidate the concepts currently being covered.
Practical/Investigation
These activities focus on developing science inquiry skills, including using laboratory equipment. Practicals can be conducted within one lesson, while Investigations are longer and cover more areas of the experimental design. These activities are also available as Word document downloads in the Interactive Textbook.
Worked example
Worked examples are provided for topics that require calculations, or to reinforce important skills.
End-of-chapter features
Chapter review
Chapter checklist
Success criteria
1.1I can explain the choice of independent, dependent and controlled variables in a scientific investigation.
14b
1.1I can refine a research question to target specific information or data collection techniques. 11, 14a
1.1I can assess the validity of an investigation by defining the terms repeatability, replicability, reproducibility, accuracy and precision.
1.1I can describe the difference between random and systematic errors, and calculate both absolute and relative uncertainty.
1.2I can assess and minimise experimental risk.
1.2I can apply skills in the use of specialised laboratory equipment, such as titration equipment. 11
1.2I can explain the use of data loggers, models and simulations for gathering reliable data. 5
1.2I can describe the ethical considerations of using animal and human participants in research. 7, 14d
1.2I can outline research design features that might be employed in trials involving human participants that will increase the reliability and validity of the findings. 13, 14c
1.3I can evaluate the validity of claims in primary and secondary data.4, 9, 12
1.3I can communicate research findings clearly and effectively through the use of structured practical reports and scientific posters. 14e
Data questions
Applying
1. The table below shows the effect of changing the pH of a pond on the number of tadpoles in the pond.
Table showing the number of tadpoles according to the pH of pond water
Review questions
Remembering
1. Recall what a scientist should do if they discover an Aboriginal or Torres Strait Islander artefact during fieldwork.
2. Define the following terms. a) independent variable b) dependent variable c) extraneous variables d) controlled variables
a) Identify the independent and dependent variables in this study.
b) Identify the optimum pH for tadpole survival.
3. Recall the reason a safety data sheet (SDS) should be understood before conducting an experiment.
c) Identify an outlier in the data.
d) Identify at which pH value the data were most precise.
4. List the research design features of a randomised controlled trial that make it the 'gold standard' in scientific research.
Analysing
2. High school students were analysing the amount of ethanoic acid in a commercial vinegar sample and had made up a dilute solution of 0.1 mol L–1 ethanoic acid based on the concentration of ethanoic acid given on the bottle of vinegar. The students set up a titration with 20.00 mL of their ethanoic acid in a conical flask (via pipette) and filled a burette with 0.1 mol L–1 NaOH. If the ethanoic acid content quoted on the vinegar bottle was correct, the students hypothesised that 'If 20 mL of 0.1 mol L–1 ethanoic acid is present, then 20 mL of 0.1 mol L–1 NaOH will be required to reach an end point'. The titration data from the two students attempting six repeated trials are tabulated in the table below.
Table showing the titres required to reach the end point
Chapter checklists help students check that they have understood the main concepts and learning goals of the chapter.
Chapter review question sets are categorised under five headings: Remembering, Understanding, Applying, Analysing and Evaluating. These questions can be completed in the Interactive Textbook or downloaded as Word documents.
SAMPLEPAGES
a) Identify and circle any outliers in each student's trials.
b) Calculate the mean volume of NaOH required to reach the titration end point, after removing outliers for each student.
c) The 'true' value for the titration, given the actual concentration of ethanoic acid, should have been 20.00 mL of 0.1 mol L–1 NaOH. Recognise the validity of this experiment for identifying the concentration of ethanoic acid.
d) Contrast the data tabulated. Was each student accurate?
Data questions help students apply their understanding, as well as analyse and interpret different forms of data linked to the chapter content. These questions can be completed in the Interactive Textbook or downloaded as Word documents.
e) Analyse the data tabulated. Were the students precise?
f) Justify whether the data presented by students 1 and 2 provide evidence to support the hypothesis.
g) Based on the data presented, infer whether the experiment was repeatable and reproducible.
STEM activities encourage students to collaboratively come up with designs and build solutions to real-world problems and challenges.
Links to the Interactive Textbook (ITB)
VIDEO
These icons indicate that there is a video in the Interactive Textbook.
WIDGET
These icons indicate that there is an interactive widget in the Interactive Textbook.
These icons indicate worksheets, activities or question sets can be downloaded from the Interactive Textbook. DOC
Overview of the Interactive Textbook
QUIZ
Automarked quizzes can be found in the Interactive Textbook for every section.
SCORCHER
Competitive questions can be found in the Interactive Textbook for every chapter review.
These icons indicate questions can be completed in workspaces in the Interactive Textbook.
SAMPLEPAGES
The Interactive Textbook (ITB) is an online HTML version of the print textbook, powered by the Edjin platform. It is included with the print book or available as a separate digital-only product.
Definitions pop up for key terms in the text.
Videos summarise, clarify or extend student knowledge.
Widgets are accompanied by questions that encourage independent learning and observations.
Quizzes contain automarked questions that enable students to quickly check their understanding.
Practicals are available as Word document downloads, with sample answers and guides for teachers in the Online Teaching Suite.
Worksheets are provided as downloadable Word documents.
Workspaces enable students to enter working and answers online and to save them. Input is by typing, handwriting and drawing, or by uploading images of writing or drawing.
Self-assessment tools enable students to check answers, mark their own work and rate their confidence level in their work. Student accounts can be linked to the learning management system used by the teacher in the Online Teaching Suite.
SAMPLEPAGES
Overview of the Online Teaching Suite (OTS)
The Online Teaching Suite (OTS) is automatically enabled with a teacher account and is integrated with the teacher's copy of the Interactive Textbook. All the assets and resources are in one place for easy access. The features include:
• the Edjin learning management system with class and student analytics and reports, and communication tools
• teacher's view of students' working and self-assessment
• chapter tests and worksheets as PDFs and as editable Word documents with answers
• editable curriculum grids and teaching programs
• teacher notes (including suggested responses if relevant) for Practicals, Try this, Making thinking visible, Explore! and STEM activities
• adaptive tools, including ready made pre- and post-tests and intuitive reporting.
Chapter 1 Science skills
SAMPLEPAGES
Introduction
Every time you have been curious or observed something in our world or universe, you have started using the scientific method. Science is a field of study that involves asking questions about the world around you and seeking answers in a systematic way. Scientists have to work safely, collaboratively and in a manner that ensures their findings are valid and useful. In this chapter, you will learn more about what a scientist does, and consider the ways in which they work and communicate their findings. Your journey as a scientist is just beginning!
Concept map
SAMPLEPAGES
Science as a modern discipline
Fields of science include:
• Chemistry
• Biology
• Physics
• Earth and space science
• Psychology
Scientists work individually or in teams, in different locations
Science is the systematic collection and generation of knowledge of the world around us
There are many ways of knowing
• Aboriginal and Torres Strait Islander people as scientists
Section 1.1
Section 1.2
Section 1.3
Section 1.4
Scientists investigate
The science laboratory
• Safety
• Hazards
• Equipment
• Minimising errors
The scientific method
• Observations, inferences and investigable questions
• Constructing a hypothesis
• Experimental variables
• Writing a method
• Types of data
Scientists communicate
Reporting the findings in a structured practical report
Curriculum content
Questioning and predicting investigable questions, reasoned predictions and hypotheses can be developed in guiding investigations to identify patterns, test relationships and analyse and evaluate scientific models (VC2S8I01)
Planning and conducting reproducible investigations to answer questions and test hypotheses can be planned and conducted, including identifying independent, dependent and controlled variables where applicable, stating assumptions, recognising and managing risks, considering ethical issues and following protocols when accessing cultural sites and artefacts on Country and Place (VC2S8I02)
equipment can be selected and used to generate and record data with attention to precision, using digital tools as appropriate (VC2S8I03)
Communicating communicating ideas, findings and arguments for specific purposes and audiences involves the selection and use of appropriate presentation formats, scientific vocabulary, models and other representations, and may include the use of digital tools (VC2S8I08)
Glossary terms
Accuracy
Analyse
Biased
Biologist
Biology
Calibrate
Chemist
Chemistry
Claim
Concave
Controlled variables
Convex
Cultural Lore
Data
Dependent variable
SAMPLEPAGES
DNA
Earth and space science
Experiment
Fair test
Hazard
Holistic
Hypothesis
Independent variable
Inference
Investigable question
Knowledge
Meniscus
Observation
Observe
Oral tradition
Parallax error
Peer-review
Physicist
Physics
Precision
Prediction
Qualitative
Quantitative
Random error
Reliable
Systematic error
The Dreaming
Totem
Variable
1.1 The nature of science
Learning goals
At the end of this section, I will be able to:
1. Recognise the different ways of making and recording knowledge, including that of Aboriginal and Torres Strait Islander Peoples.
2. List some different fields a scientist might work in.
3. Define the roles of group members in a team of scientists.
Ways of knowing
Science is not only a collection of knowledge that we have already gathered over time, but also the process of gaining new knowledge and creating shared understanding. Scientists are, and always have been, curious about the world around them. From the first scientists through to scientists working in research institutions today, they are asking and answering questions about the universe, how and why things work, and what happens if you change things.
In many indigenous cultures around the world, oral traditions such as storytelling are the means by which knowledge is passed from one generation to the next. This method has been used for thousands of years, starting long before knowledge was written down, and continues today.
Did you know? 1.1
oral histories
Research published in the Journal of Archaeological Science in 2023 indicates that Palawa (Tasmanian First Nations) stories are some of the oldest recorded oral traditions in the world. They accurately recount geological and astronomical events from around 12 000 years ago (such as seas flooding the land bridge connecting Lutruwita/Tasmania and the mainland) and have been reproduced and passed down through more than 400 successive generations, while maintaining their historical accuracy.
DOC
SAMPLEPAGES
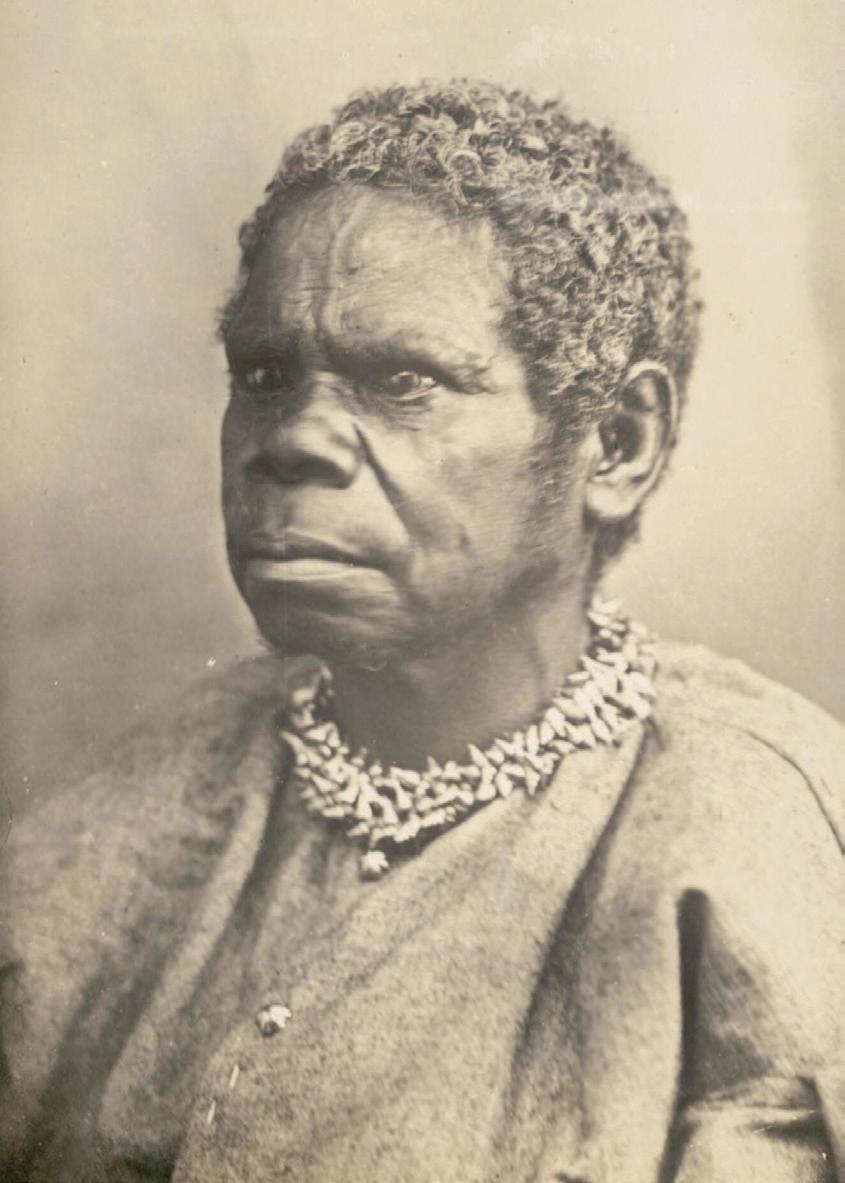
Figure 1.1 Truganini, a Nuennone woman and one of the last speakers of the original Tasmanian languages, survived the initial invasion and colonisation of Lutruwita/Tasmania. The Indigenous population was decimated by introduced diseases, and by genocide committed by the British.
WORKSHEET
Knowledge in science
knowledge the understanding of information
oral tradition a system for preserving cultural beliefs, knowledge and traditions, passed down verbally or by example from one generation to the next, without written instruction
holistic considering the whole thing rather than just the parts individually
Cultural Lore the stories, customs, beliefs and spirituality of Aboriginal and Torres Strait Islander people, which are passed down through generations and act as a guide for everyday life
totem a natural object, such as a plant or animal, that is inherited by members of a clan or family as their spiritual emblem the Dreaming the spiritual framework of Aboriginal and Torres Strait Islander cultures that explains the creation and interconnectedness of all things, existing beyond time and guiding relationships with land, community and culture
Did you know? 1.2
Written histories
In 2012, a student discovered a document that appeared to contain the earliest known written documentation of the position of the stars. Thought to date from 129 ce, it details the observations of Greek mathematician and astronomer Hipparchus, who defined the location of stars in the night sky using two coordinates, despite the telescope not having been invented yet.
SAMPLEPAGES
The oldest known book still in existence is thought to be the Diamond Sutra. This Buddhist text was produced using wooden block printing in the Chinese Tang dynasty (around 868 ce).
Aboriginal and Torres Strait Islander knowledge and science
Aboriginal and Torres Strait Islander Peoples have a deep connection to Country, and a holistic world view in which humans are part of an interdependent ecosystem. Caring for Country is both a responsibility and an honour for Aboriginal and Torres Strait Islander Peoples, and they draw upon their ancestral knowledge, Cultural Lores and customs in maintaining ecosystems and utilising resources sustainably. Traditionally, and still today, members of a group or family adopt totems, such as plants or animals, which serve as spiritual emblems and come with caretaking responsibilities, though this practice has been significantly impacted by colonisation. Stories from the Dreaming describe how Creator Spirits emerged, shaped the landscapes and established the laws of existence through their actions and ceremonies. These stories are passed down through generations as part of oral traditions, preserving cultural knowledge and spiritual connections to Country. There is a huge diversity of Indigenous languages across the nation, yet many stories across these languages share common themes and serve as powerful tools for recording and communicating knowledge.
NOTE
Students should approach terms such as the Dreaming with reverence, recognising them as living knowledge systems and cultural truths, rather than mythological or historical concepts.
Figure 1.2 A page from the Diamond Sutra (868 ce)
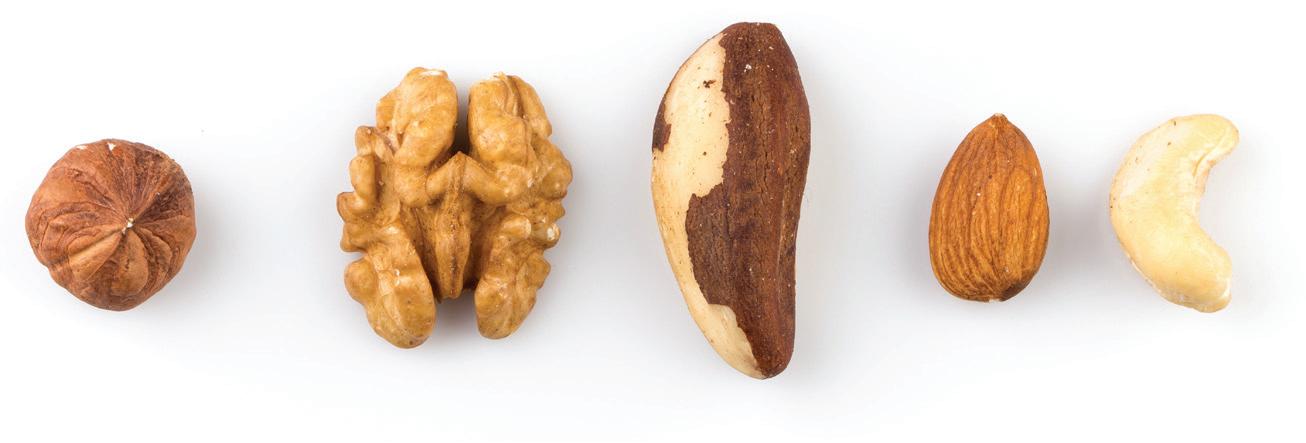
Aboriginal and Torres Strait Islander people have been asking scientific questions and making observations on the Australian continent for thousands of years, demonstrating a profound and enduring understanding of Country and Place.
Aboriginal and Torres Strait Islander Peoples have deep understandings of:
• the unique seasonal cycles that occur in many parts of Australia, including Victoria
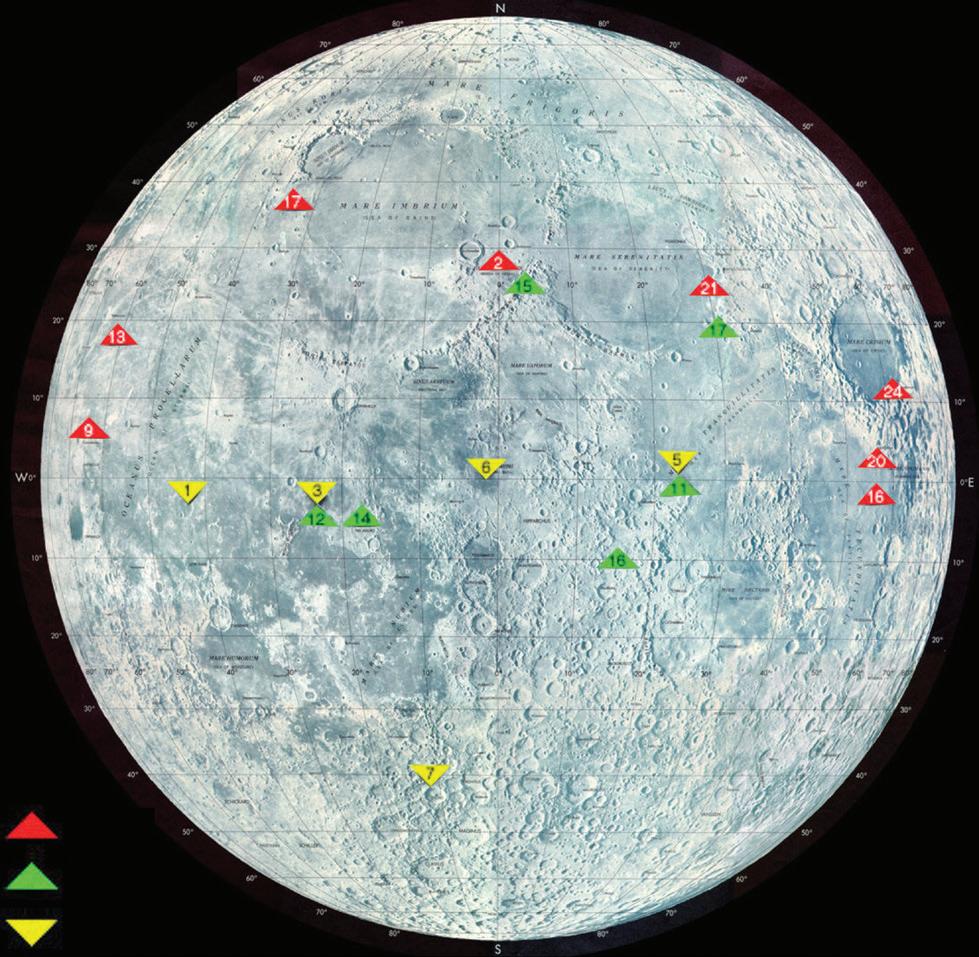
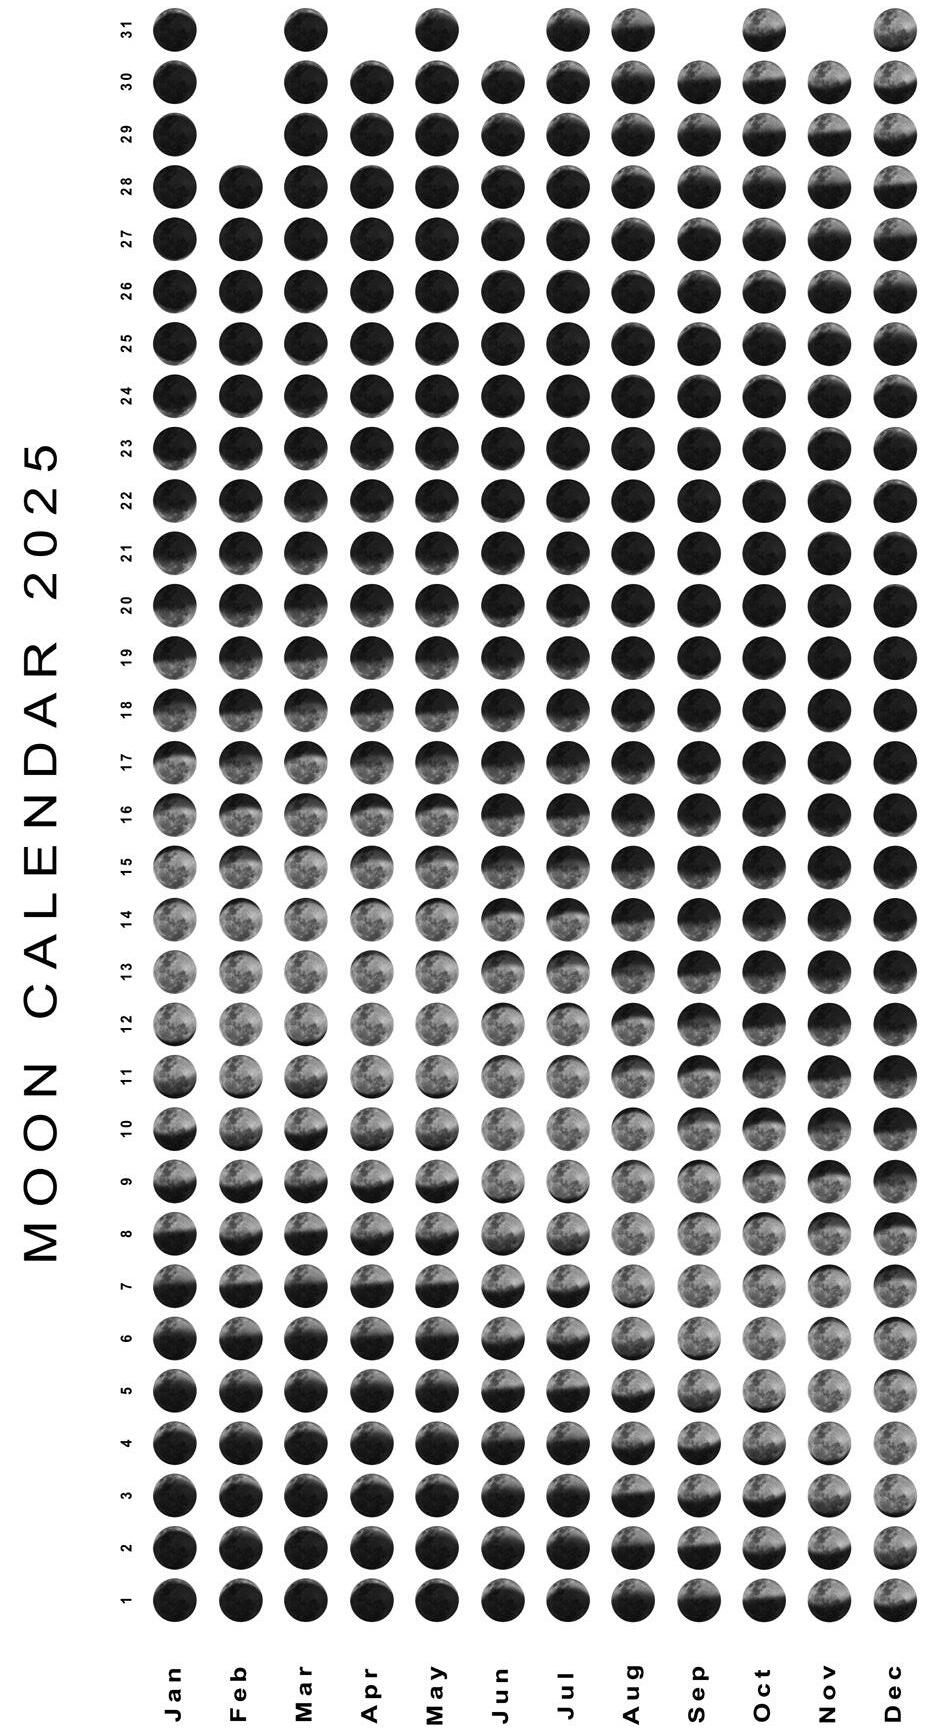
• moon phases, and the effect of the moon on the tides
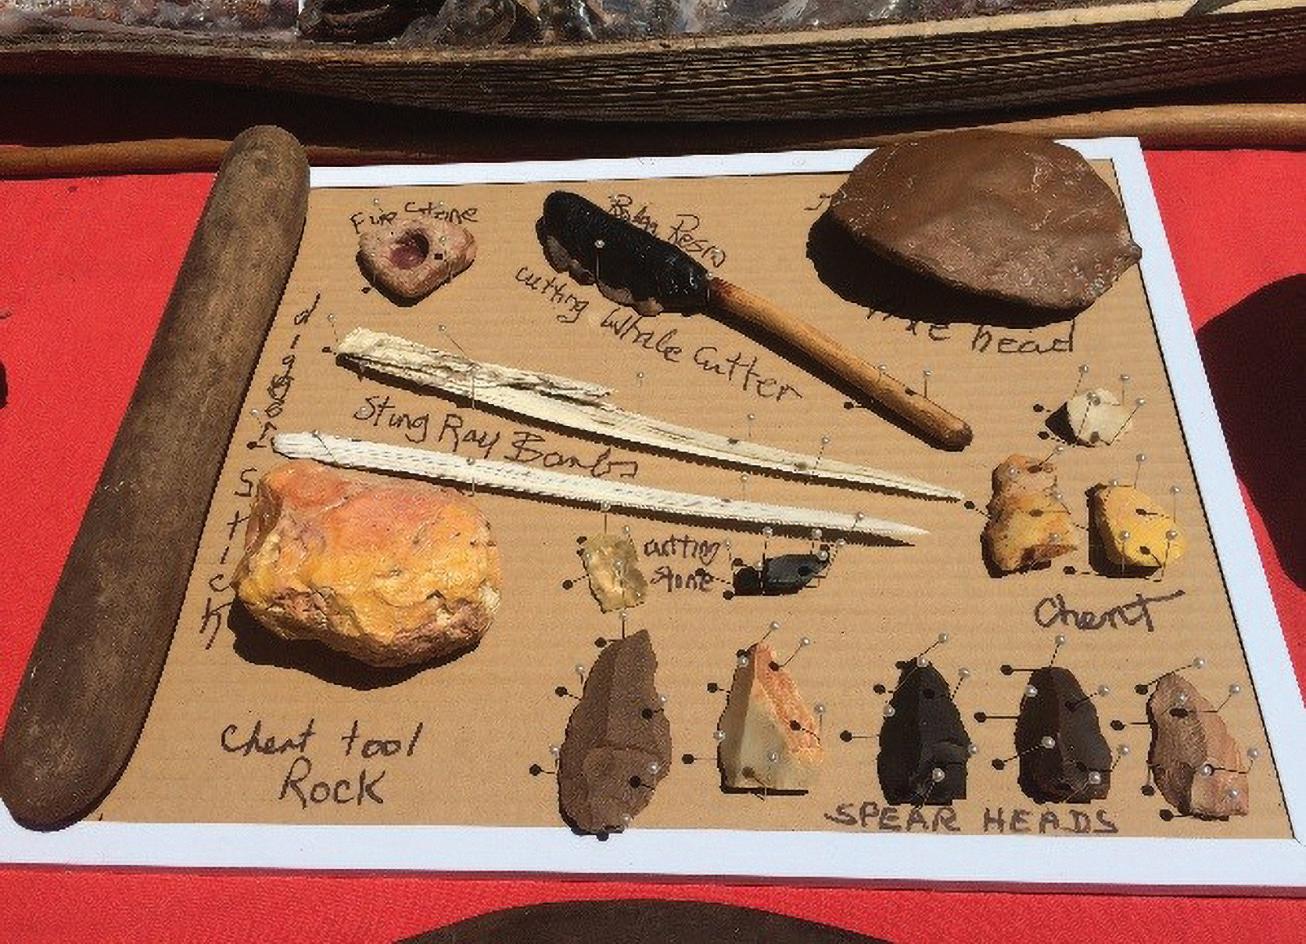
• the use and preparation of native Australian plants for food and medicine
SAMPLEPAGES
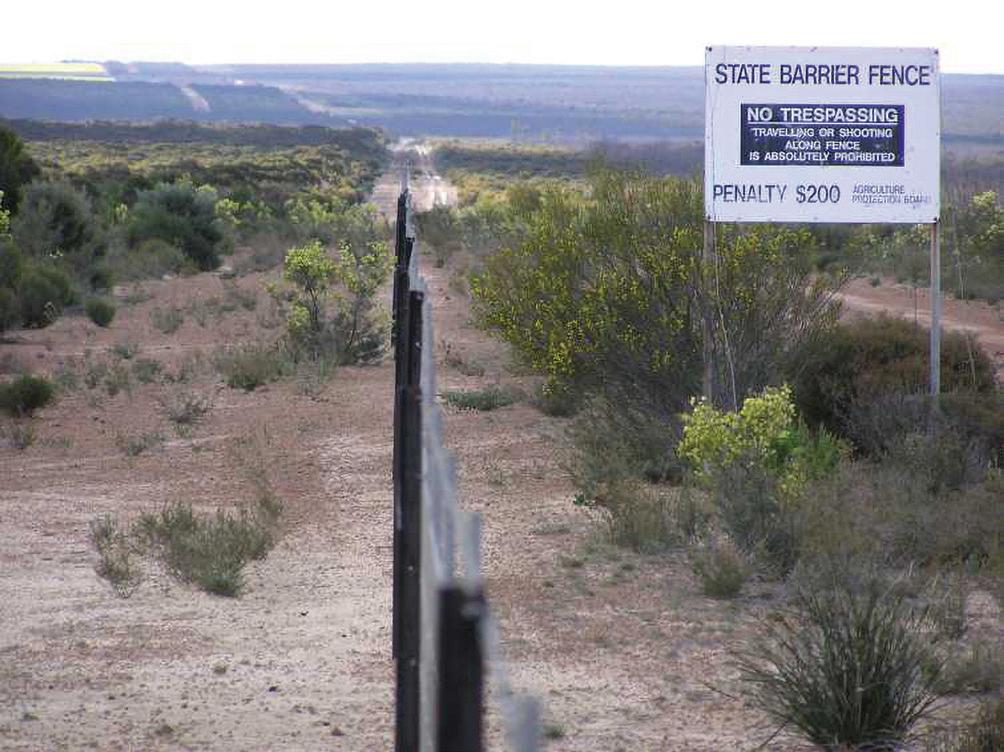
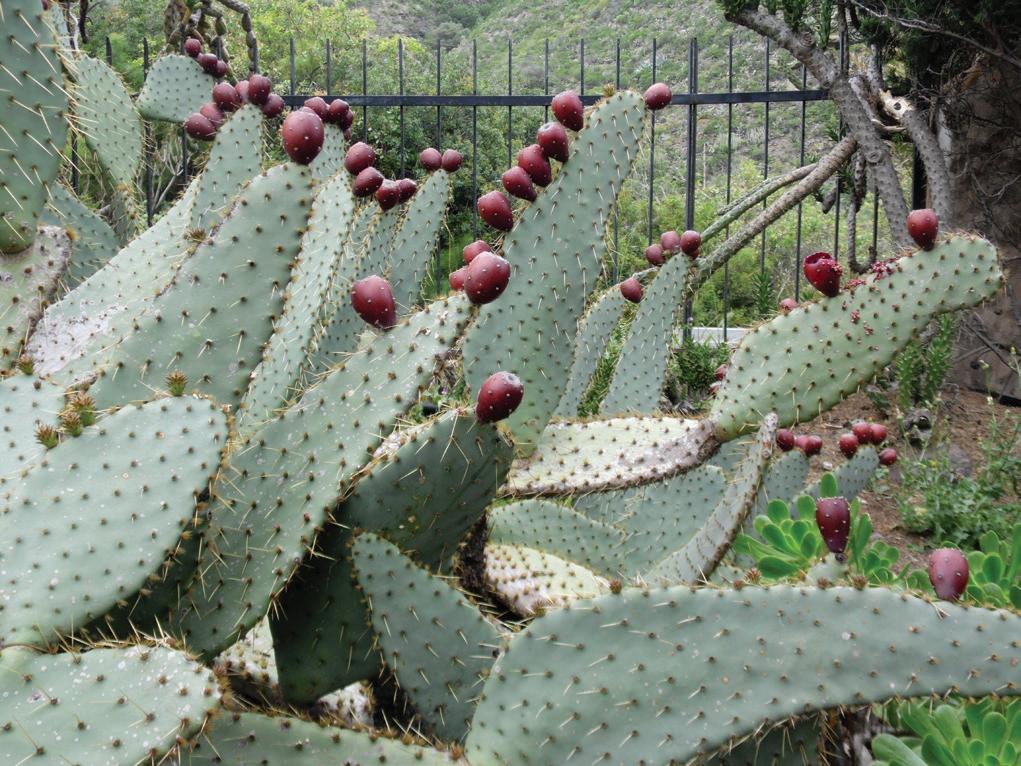
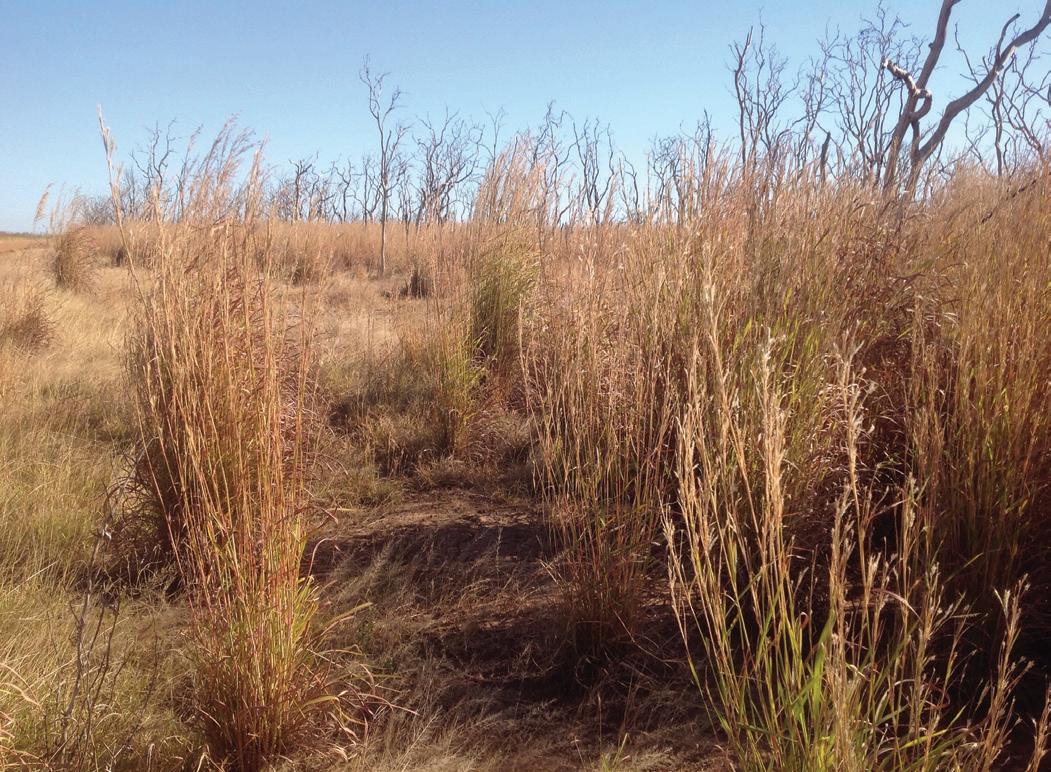
• local ecosystems and how they are affected by invasive species
• land and water resource management to protect biodiversity
• the cultural significance of Country/Place, which informs protocols used by scientists to respectfully conduct experiments on traditional lands.
Some of these examples will be discussed in more detail in later chapters.
Science as a modern discipline
The word 'science' comes from the Latin word for knowledge, scientia, and was originally used in Europe Sir Isaac Newton is arguably one of the most influential scientists of all time. He has been credited with:
• formulating the Laws of Motion and defining gravity
• developing calculus
• building the first reflecting telescope
• making the first theoretical calculation of the speed of sound
• studying fluids and electricity.
Newton also advocated for a systematic approach to scientific inquiry. His methodology aimed to answer scientific questions by collecting accurate measurements from phenomena, rather than making predictions based on theories alone.
Newton's methods built upon the work of the Muslim scholar Ibn al-Haytham, who was an early proponent of the idea that scientific hypotheses should be confirmed by repeatable experiments. This underpinned Francis Bacon's model of scientific inquiry, which focused on making observations, performing controlled experiments and then analysing data to draw more general conclusions (a process known as inductive reasoning). It is difficult to credit just one person as the 'inventor' of the modern scientific method. Instead, it is more correct to imagine it as something that was developed by many people and evolved over time.
Science is used every day to answer questions, solve problems and create new technologies. In all areas of study, modern scientists have common tasks they conduct and procedures they follow. The process of asking research questions, predicting outcomes, planning and conducting experiments, analysing data, drawing conclusions and communicating findings is known as the scientific method. Analysing the data from well-controlled experiments allows scientists to draw conclusions, make recommendations and create models that explain the world around us. You will learn how to use the scientific method later in this chapter.
prediction an estimate about a possible future event or outcome experiment a controlled situation where data is gathered to answer a research question analyse examine something in order to find meaning, what it is made of, or its relationship to other things
in the form of facts or statistics gathered to answer a question or for further analysis
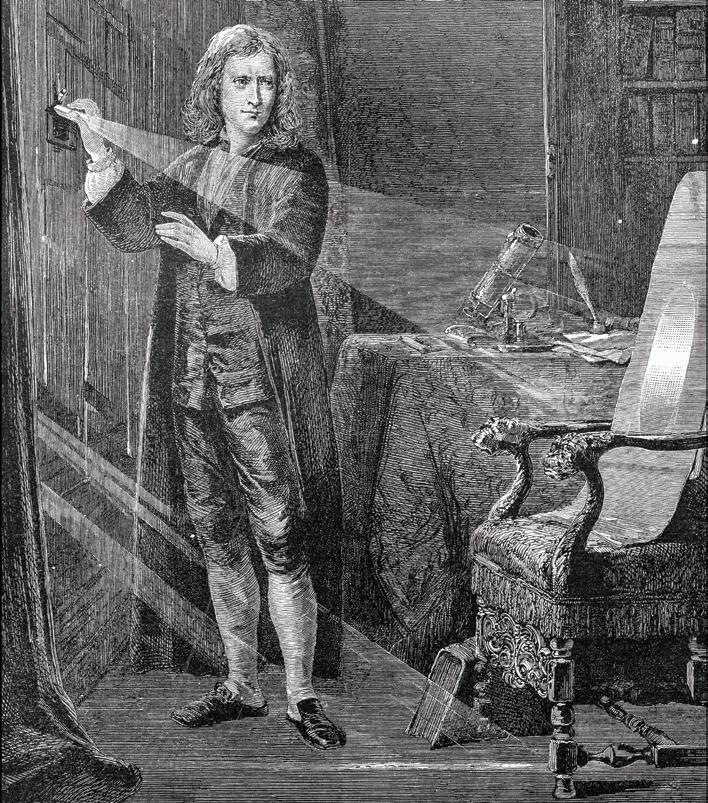
Figure 1.3 An illustration of Isaac Newton experimenting with a beam of light
inference a reason or explanation applied to an observation, based on past experience or known facts
DNA deoxyribonucleic acid, a chemical in the cells of living things that carries genetic information
Science as a human endeavour 1.1
Making discoveries
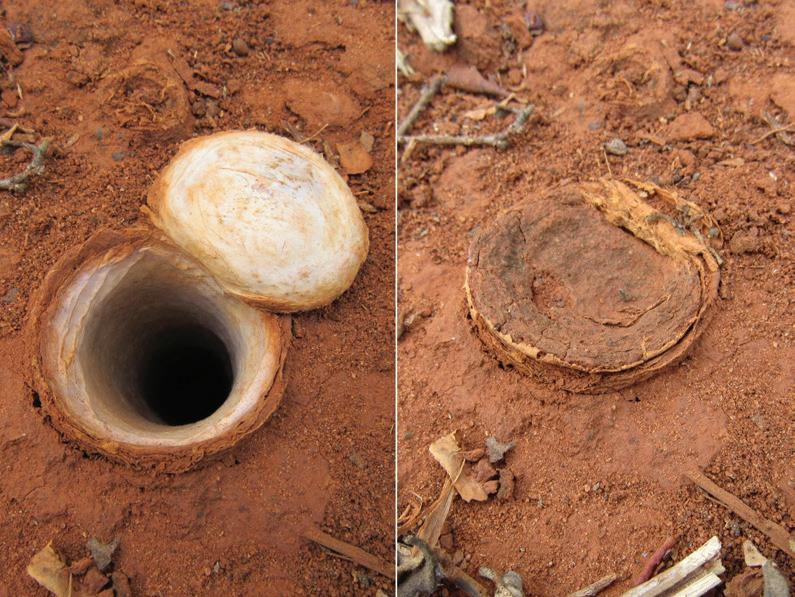
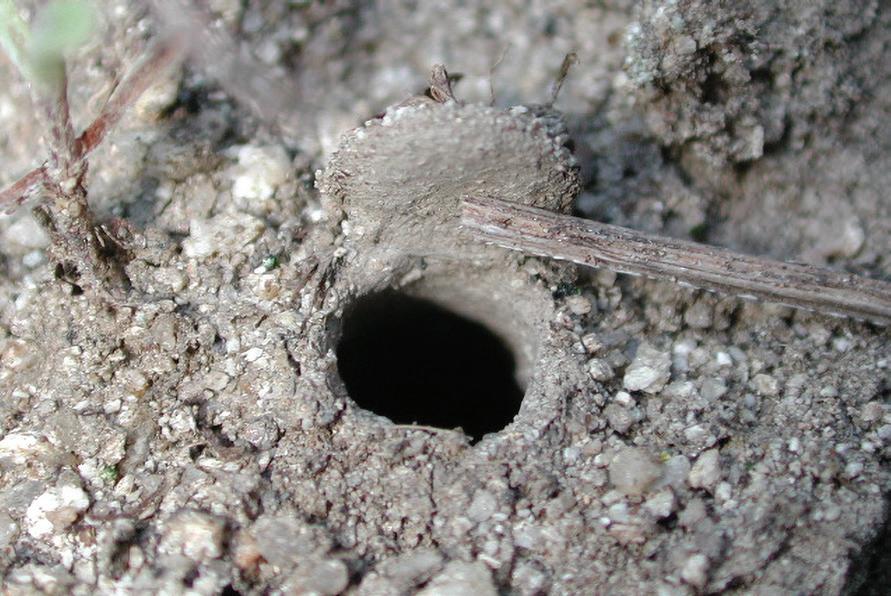
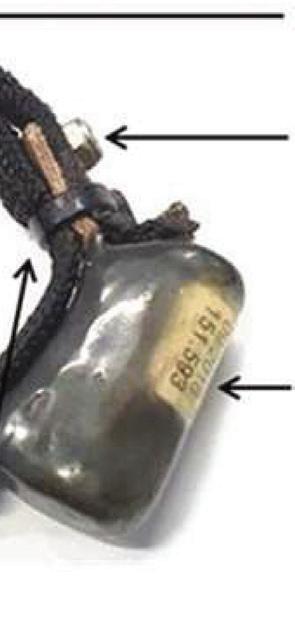
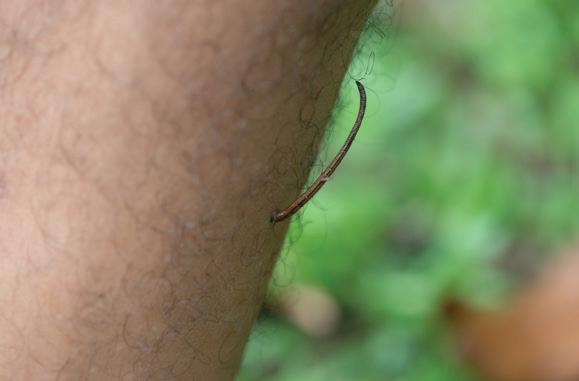
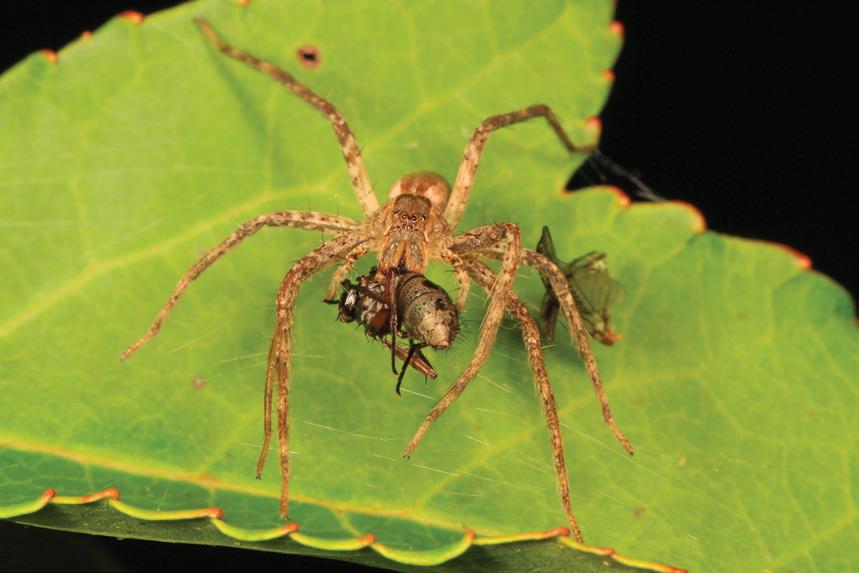
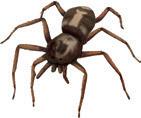
Working in science may involve working collaboratively with others, recording observations in the field, drawing inferences and proposing action plans and projects. One of the most exciting parts of a career in science is making a new discovery! This is what happened when scientists from Griffith University and the Queensland Museum joined forces to identify a new species of trapdoor spider. Trapdoor spiders are located throughout eastern Australia, especially in coastal and highland regions.
SAMPLEPAGES
The team discovered four new species in 2019, and predicted that there were more to be discovered. In 2023, the same team discovered a new species of trapdoor spider in the Brigalow Belt of central Queensland. It's likely that Aboriginal communities in the regions where trapdoor spiders were discovered were already aware of these or similar species, as traditional ecological knowledge often encompasses details about the behaviour, habitat and characteristics of native species.
The team spent time in the laboratory, working with specialised equipment to analyse the DNA (genetic components) of the different spiders to establish that they were, in fact, related. They also spent a lot of time out in the field, exploring new areas to locate the elaborate burrows that the spiders build.
The most recently discovered spider was named Europlos dignitas, where 'dignitas' means 'dignity' or 'greatness', because the females of the species are quite large, almost 5 cm long. The life of a scientist can be varied and exciting!
Quick check 1.1
1. Recall the origin of the word 'science'.
2. State one way that Aboriginal and Torres Strait Islander traditional knowledge is passed from one generation to the next.
3. Name the controlled situation used in science to test variables.
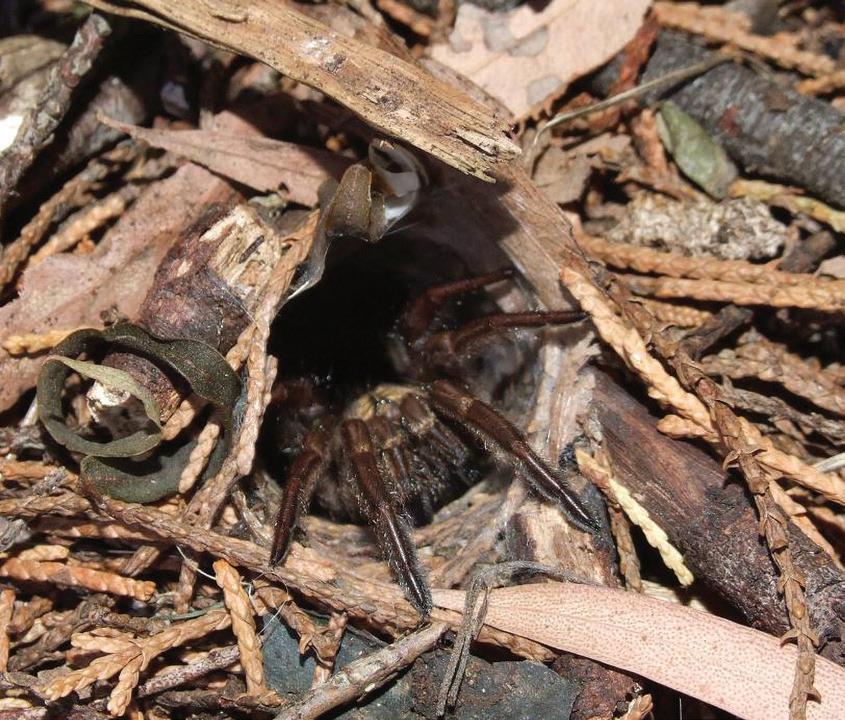
Figure 1.5 Different species of trapdoor spiders are found all around the world, and they can build burrows from a wide range of materials.
Figure 1.4 The Sydney brown trapdoor spider
Fields of science
Just as there are many types of questions we might ask, there are many fields of science. We group different areas of science together depending on what is being studied.
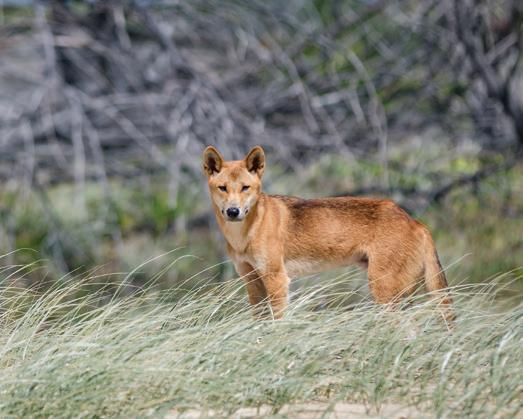
Biology is the study of living organisms, and their interactions with each other and the environment. A person who studies biology is known as a biologist. Within the field of biology there are many specialities in which to study or work, such as physiology (how living things function), zoology (study of animals), botany (study of plants) and ecology (study of ecosystems).
Some questions a biologist may ask are:
• How do plant roots work?
• How can we protect an endangered species in this area?
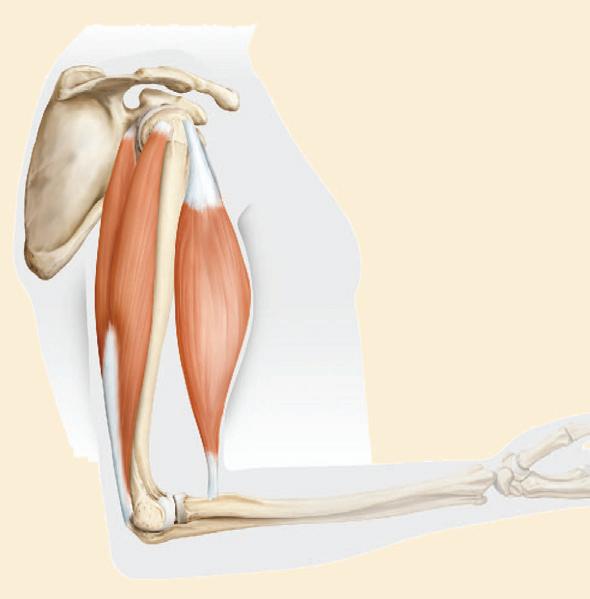
• What effect does exercise have on muscle strength?
Chemistry is the study of the composition, properties and behaviour of matter. It involves the study of atoms (the building blocks of matter), molecules and their interactions with one another in chemical and physical reactions. A person who studies chemistry is known as a chemist. Branches of chemistry include organic chemistry (chemicals found in living things) and nuclear chemistry (study of radioactivity).
Some questions a chemist might ask are:
• Why is this metal stronger than another metal?
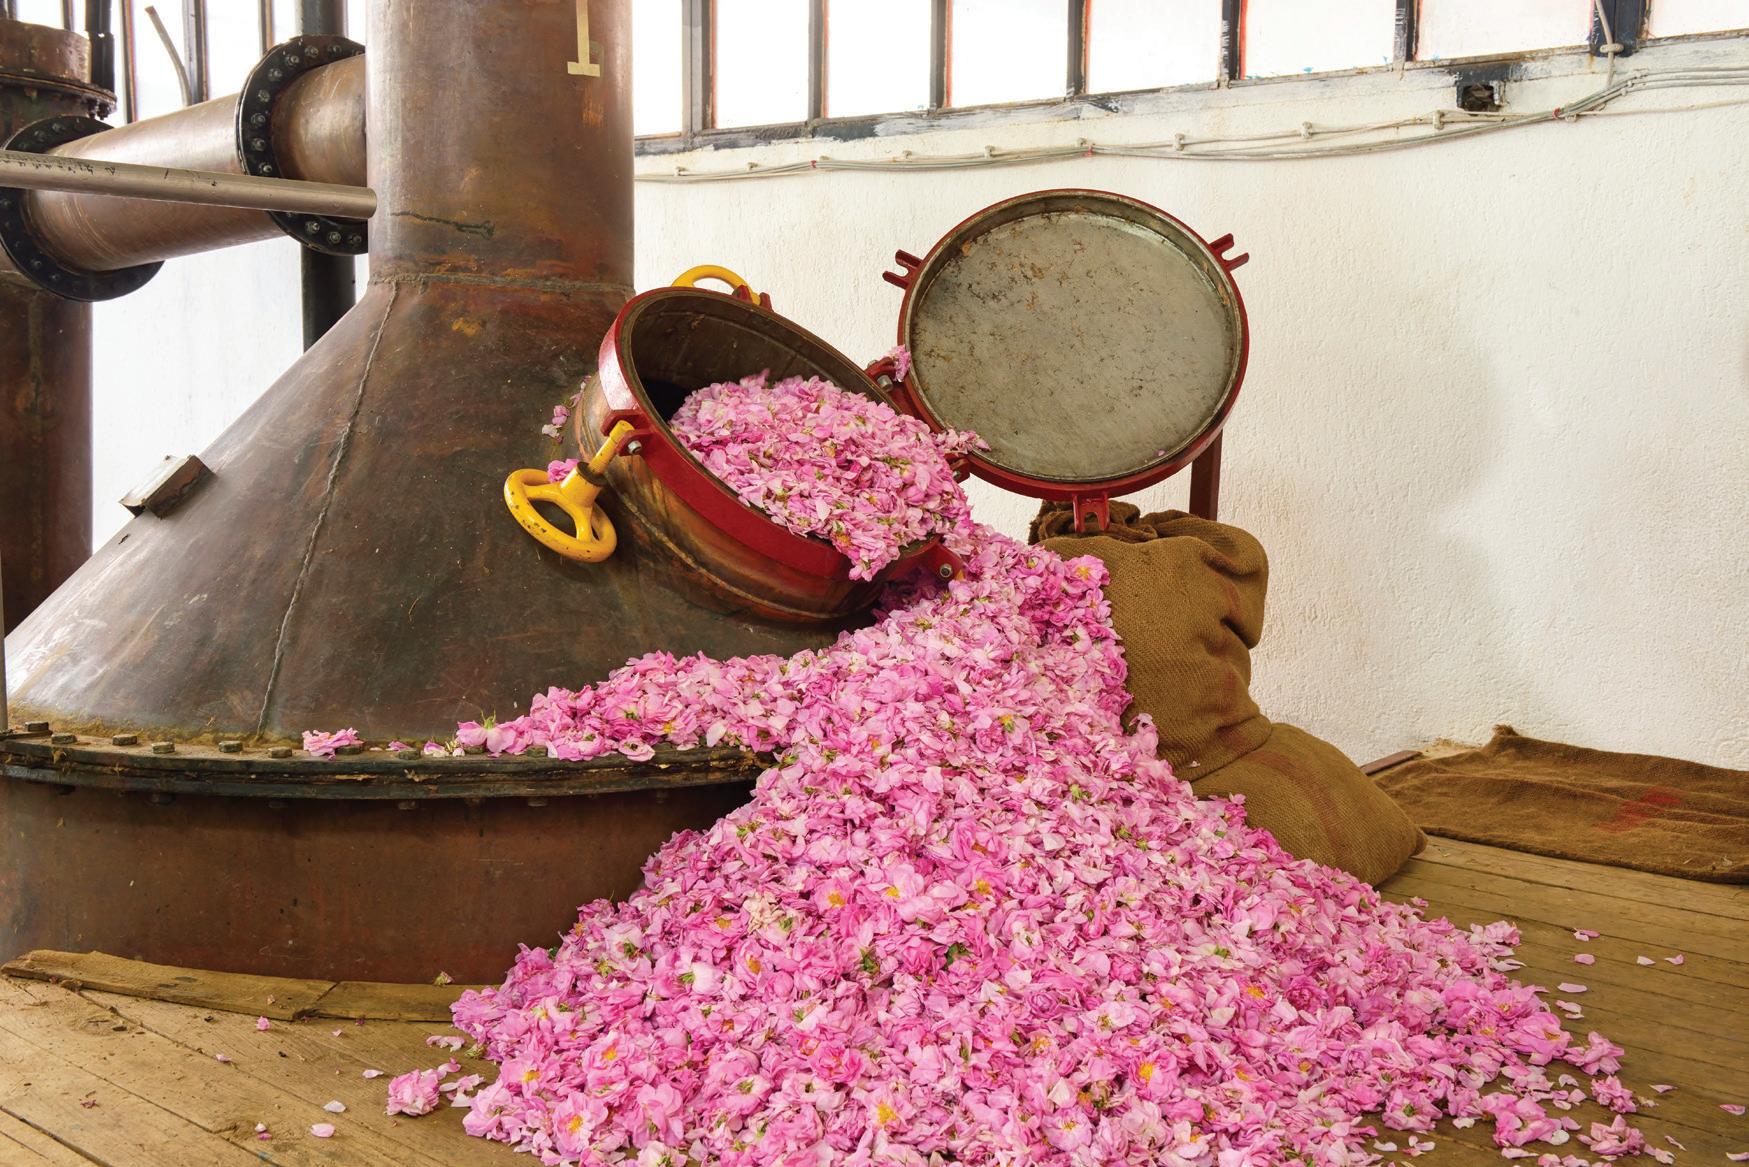
• How can this chemical be safely disposed of without harming people or the environment?
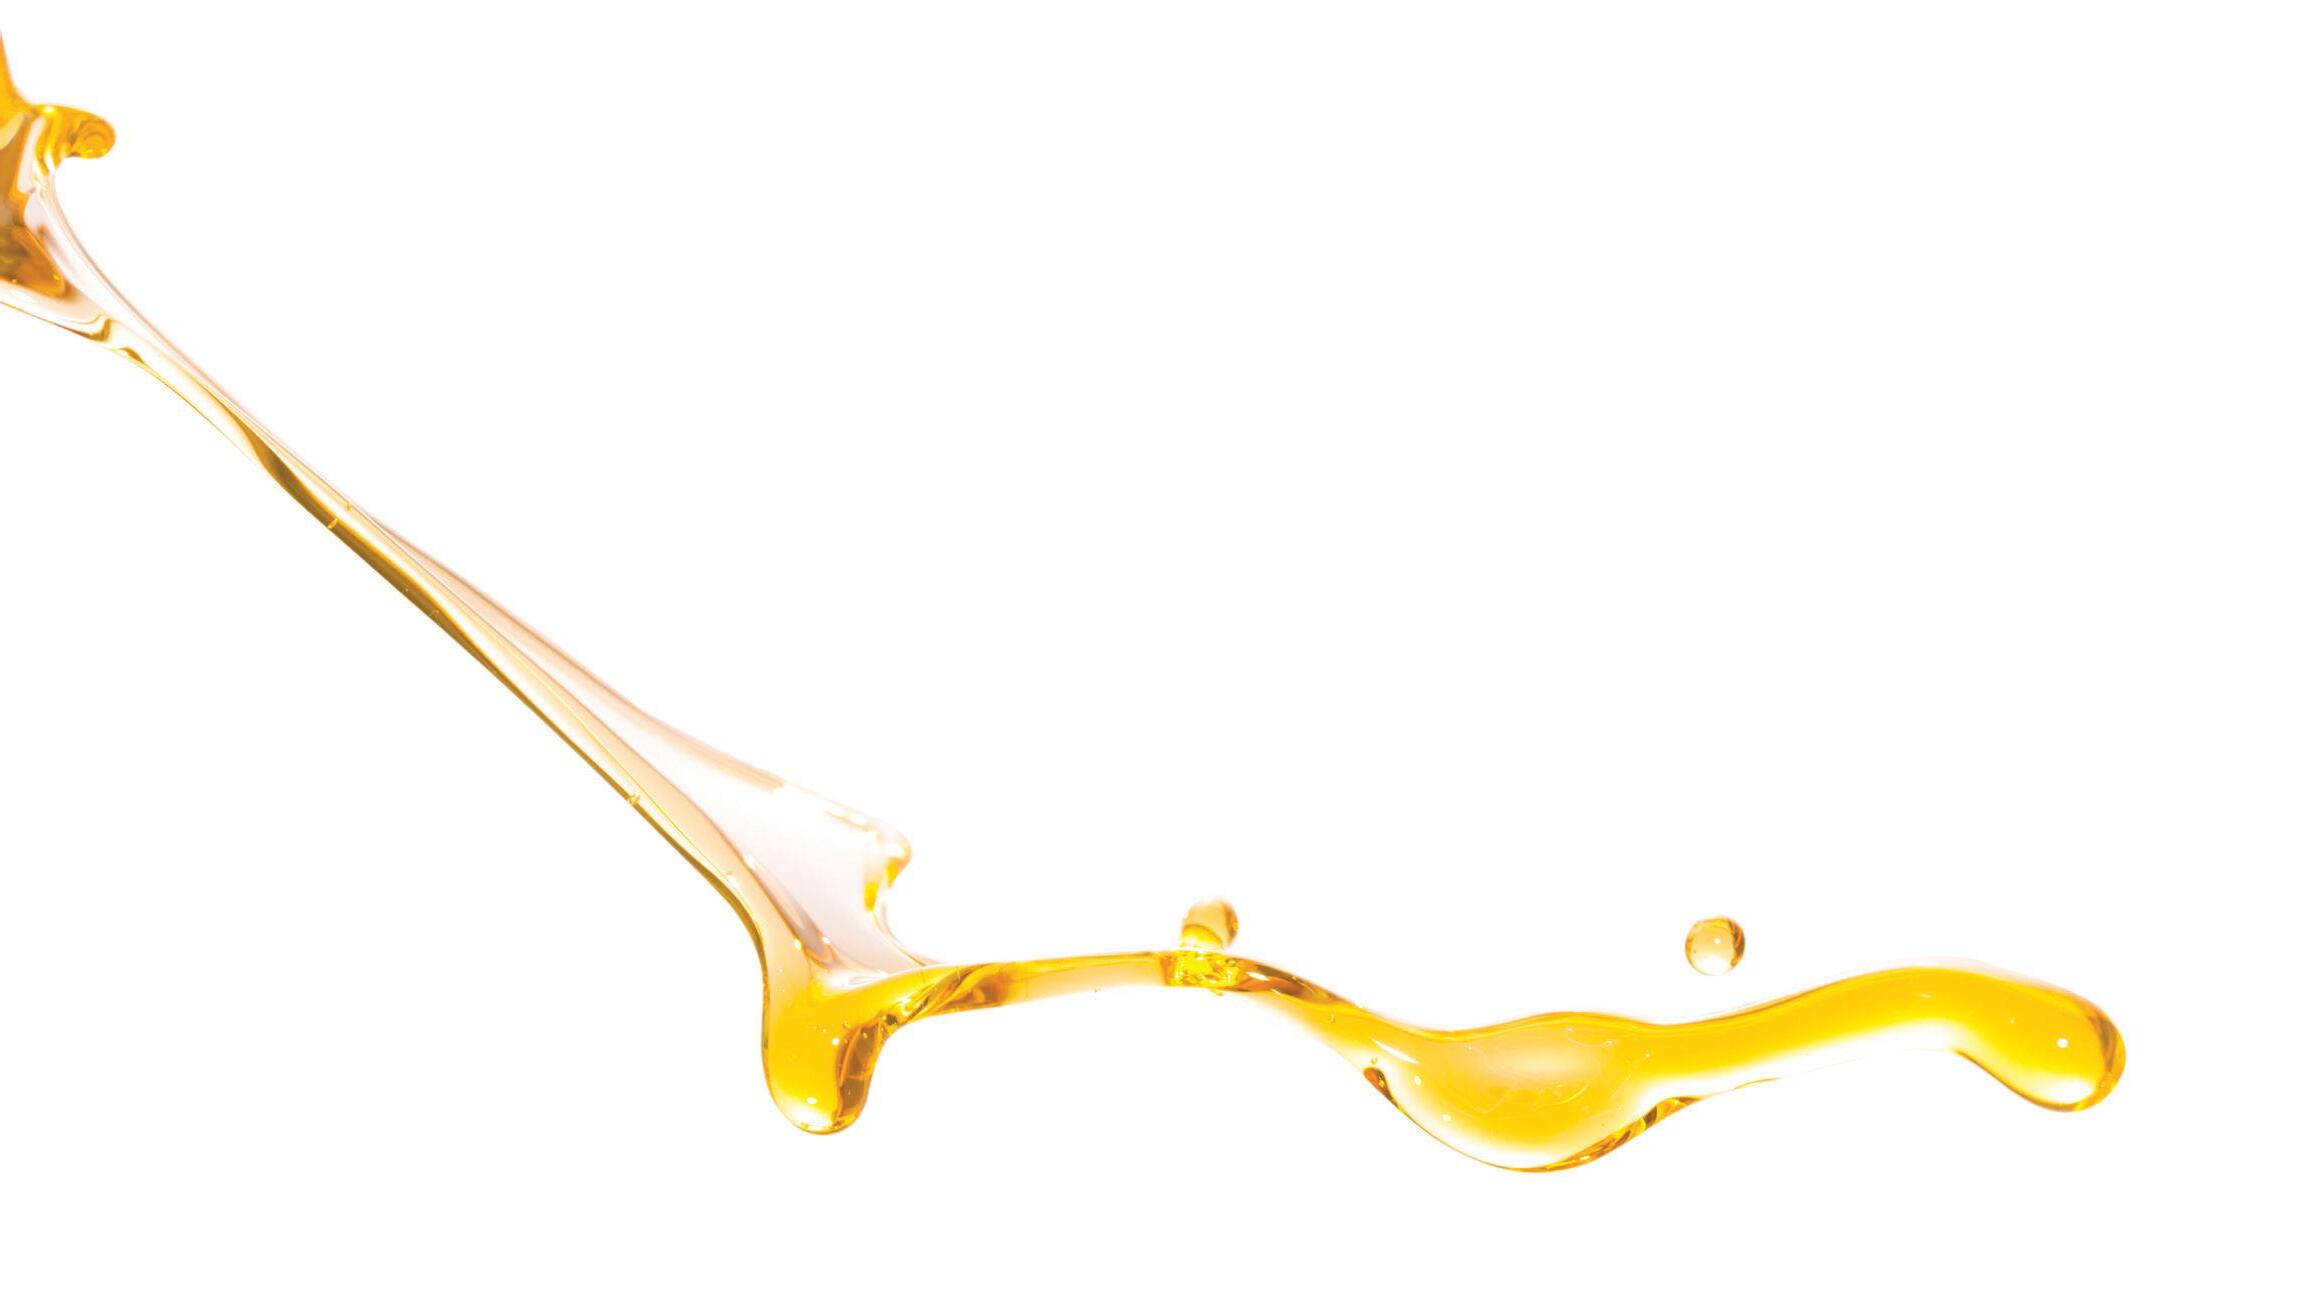
• What are the components of this liquid?
DOC
WORKSHEET
Fields of study in science
SAMPLEPAGES
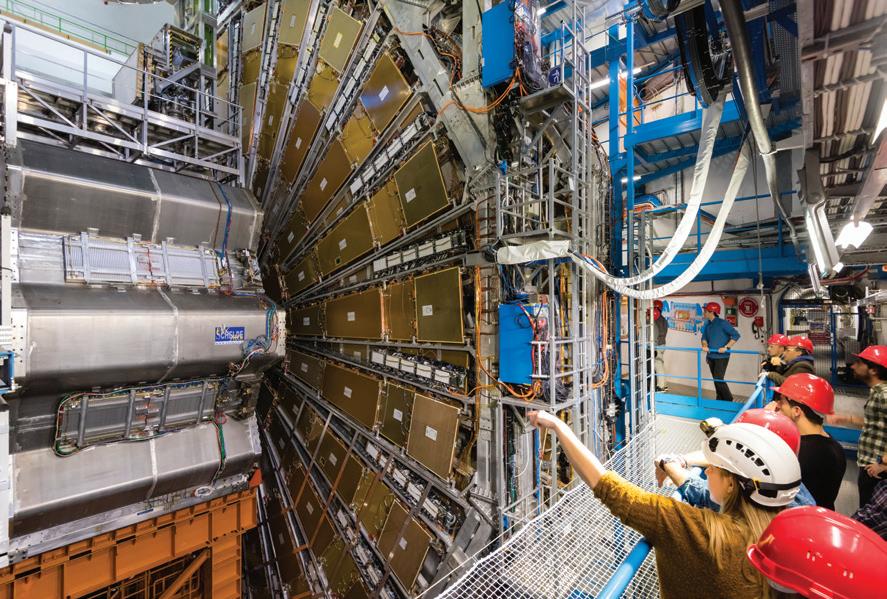
Physics is the study of matter, energy and forces. A physicist, who works in this field, seeks to understand the fundamental laws of the universe and to explain the behaviour of the natural world, from the smallest particles to the largest structures in the universe. They might specialise in fields such as nuclear physics (study of atoms and elements) or astrophysics (study of space).
Some questions a physicist might ask are:
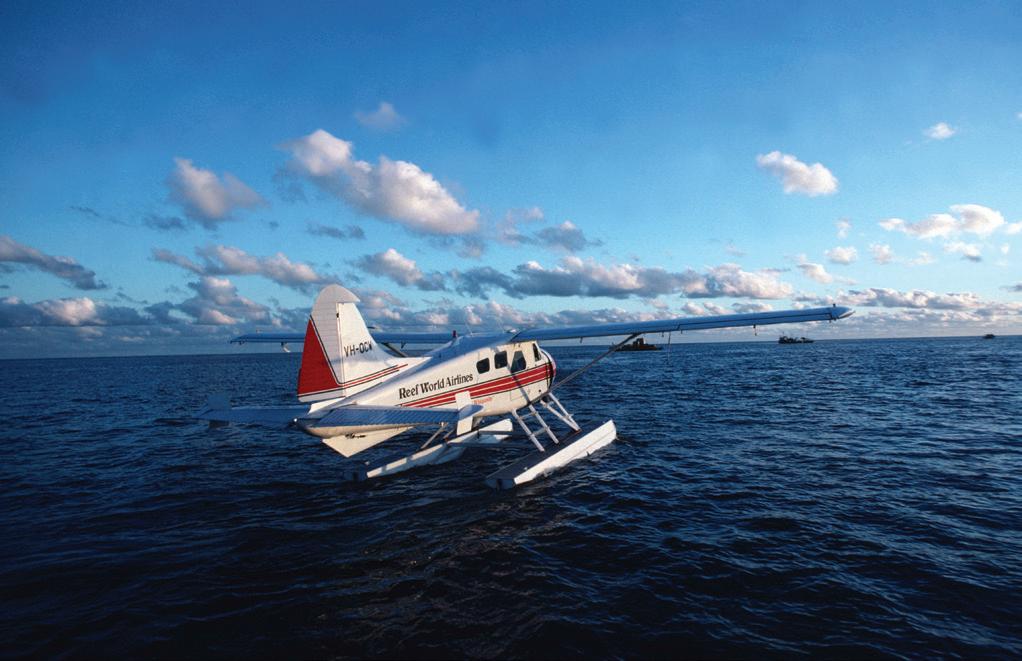
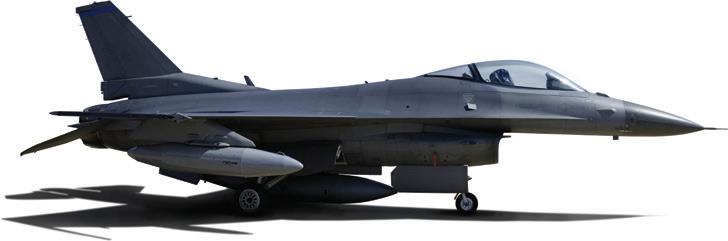
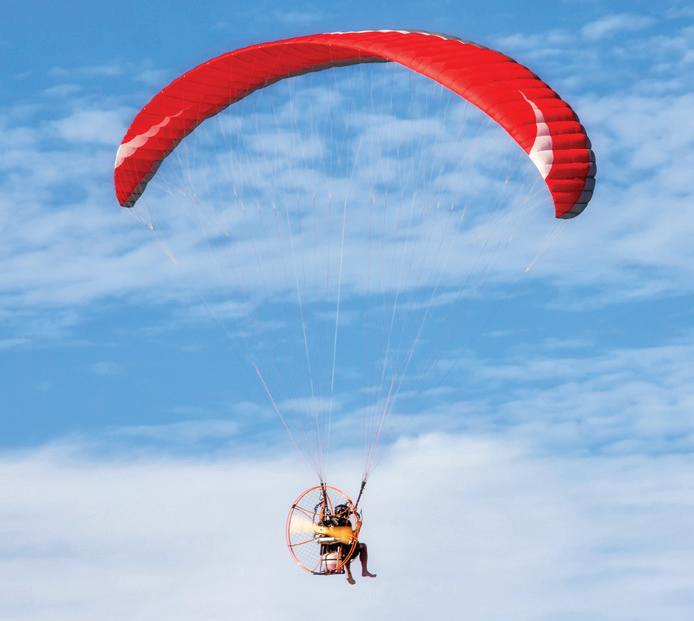
• What forces are acting on a plane?
• Does light travel at a constant speed?
• What types of energy are safe to use?
biology the study of living organisms and their interactions with each other and the environment
biologist a person who works in the scientific field of biology
chemistry the study of matter and its composition and properties, and the interactions between substances
chemist a person who works in the scientific field of chemistry
physics the study of matter, energy and forces, and their interactions with each other and the universe physicist a person who works in the scientific field of physics
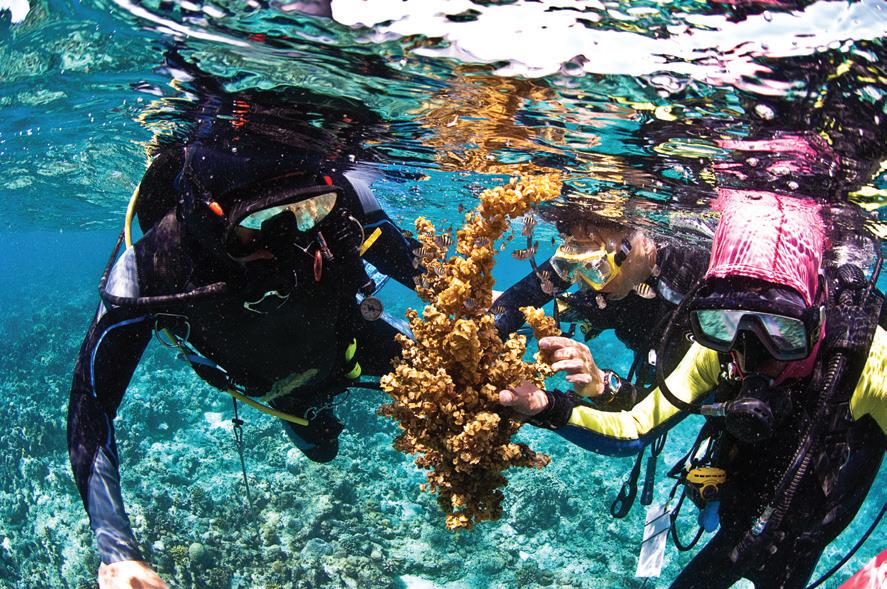
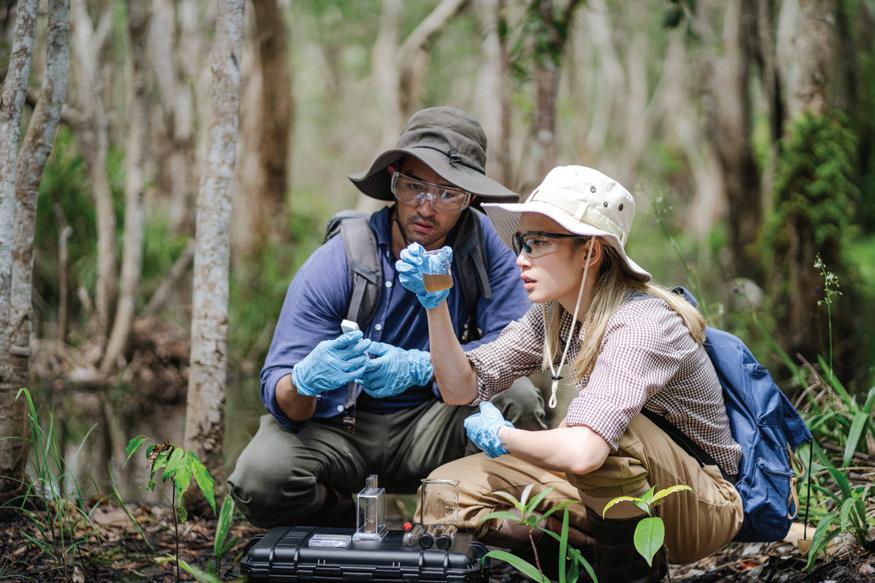
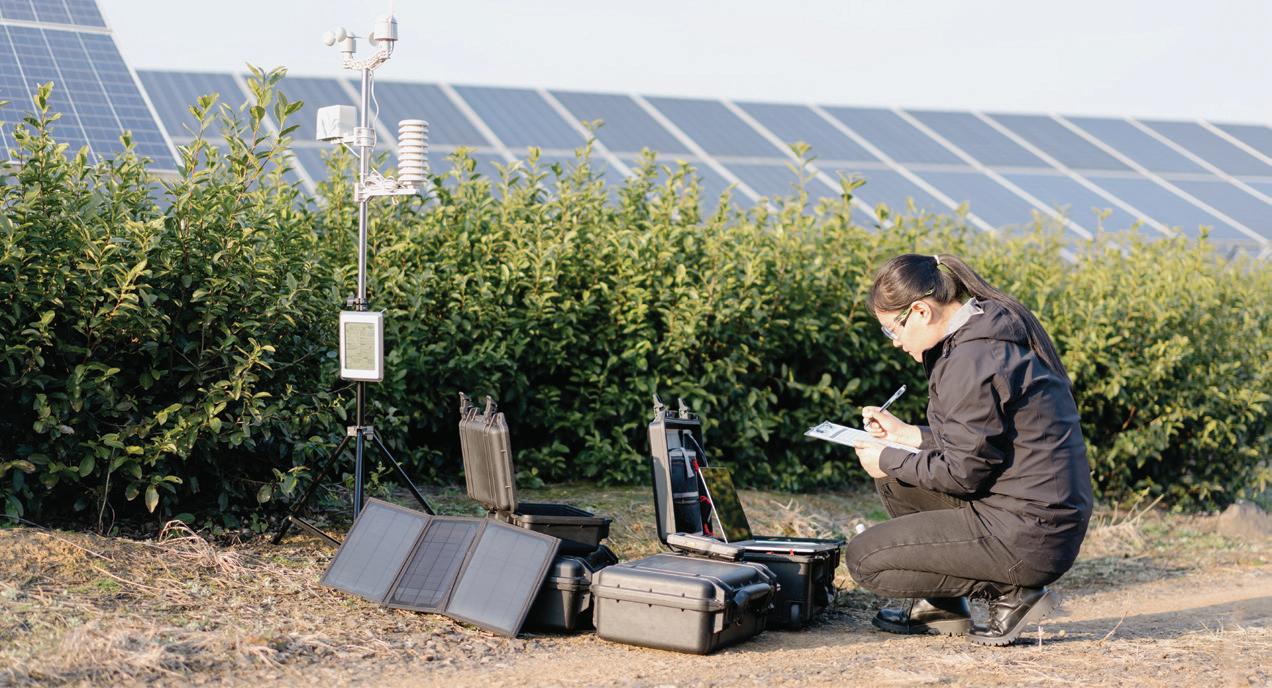
Figure 1.6 Biologists taking samples
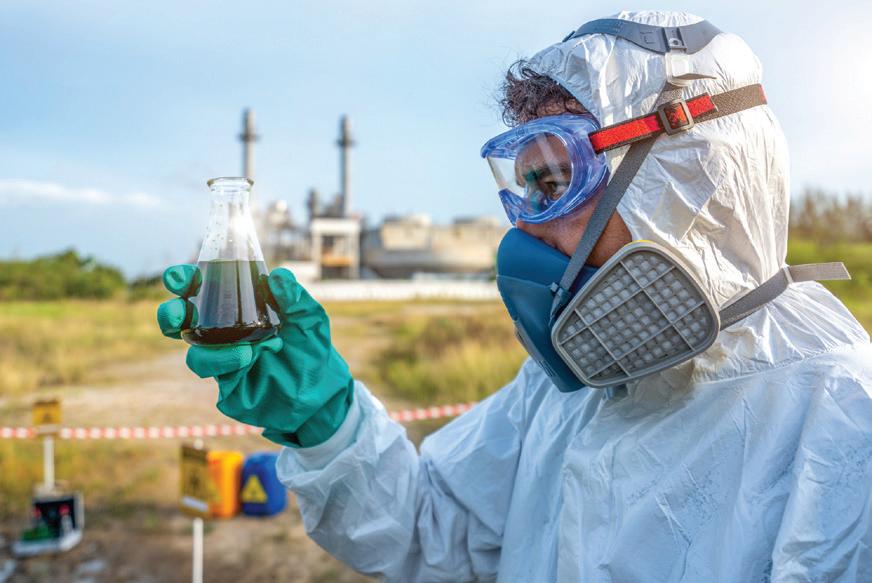
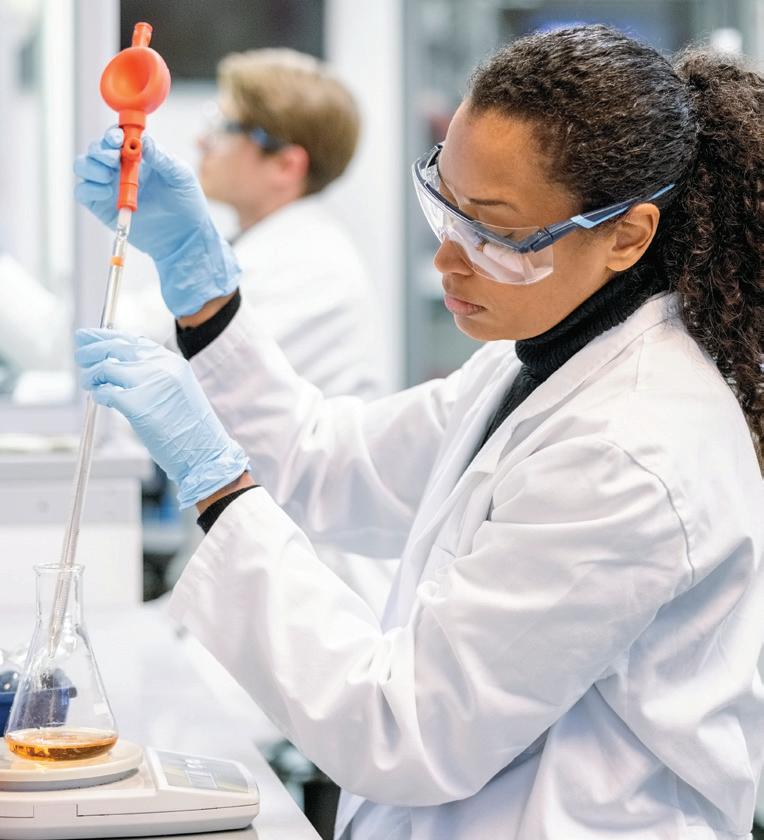
Figure 1.7 A chemist working in a laboratory
Figure 1.8 Physicists working on the Large Hadron Collider in Geneva
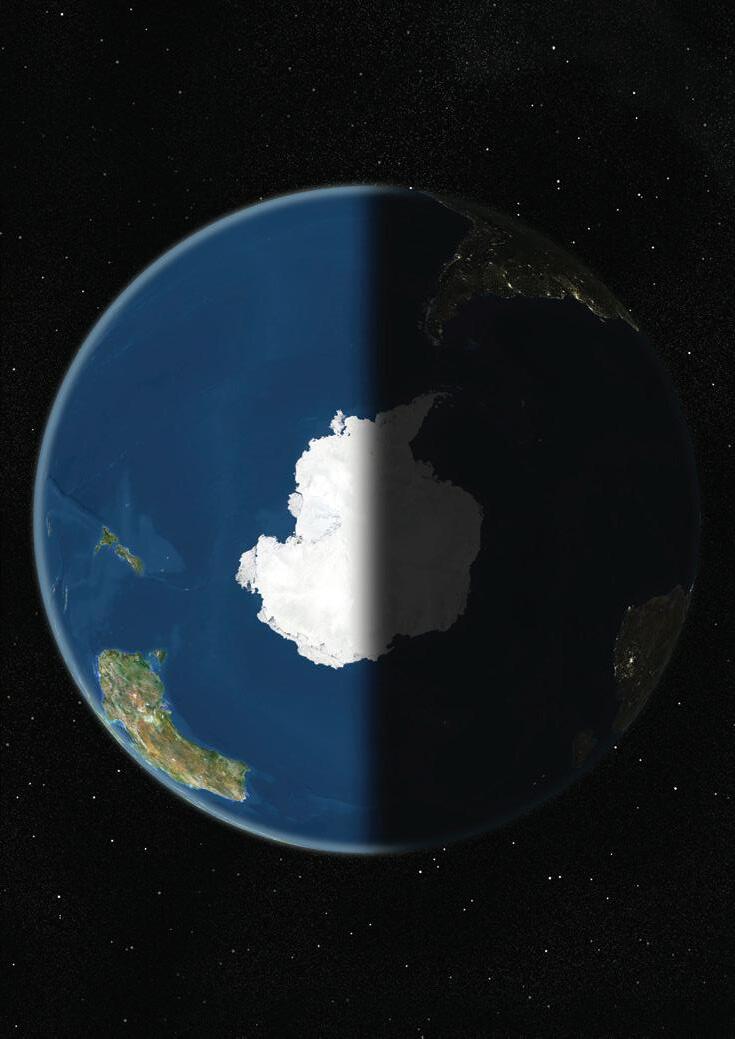
Earth and space science is the study of the natural processes that shape Earth, as well as the physical and chemical properties of the universe beyond Earth. This field includes geology (the study of rocks) and meteorology (the study of the atmosphere and weather).
Earth and space scientists might ask:
• How can we predict the impact of climate change?
• What are asteroids made of?
• Where are we likely to find gold?
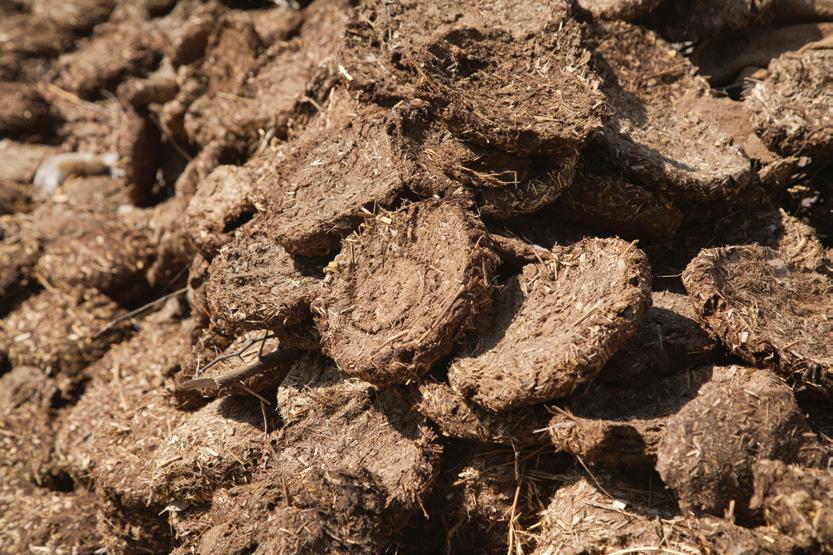
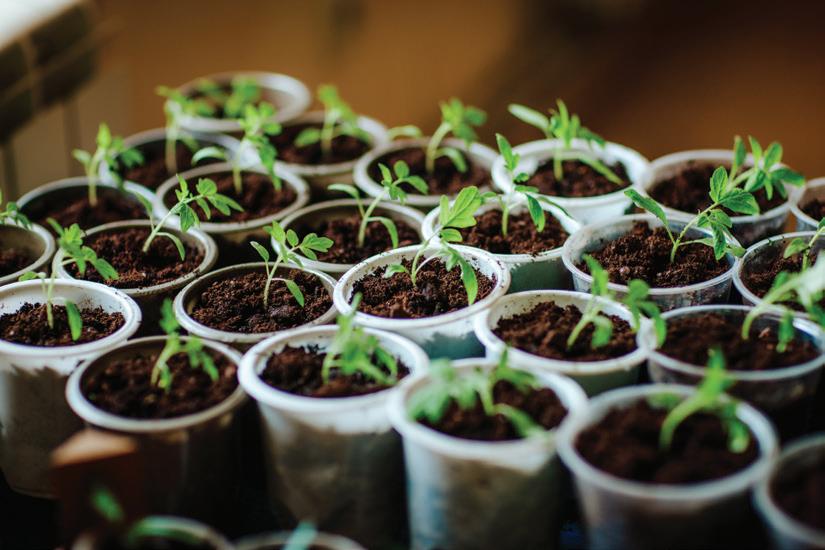
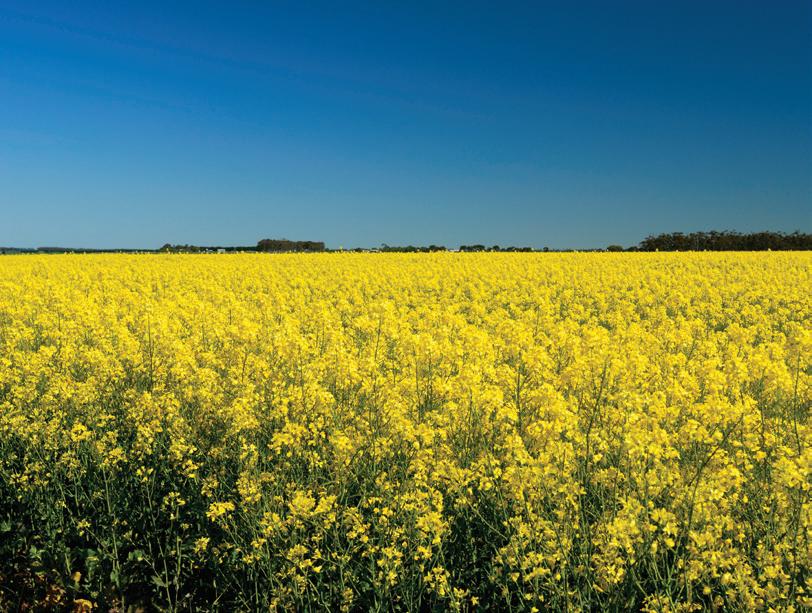
There is often an overlap between the different fields of science. For example, both biologists and chemists would have a role to play in research investigating how food is broken down for energy in the human body. Food needs to be grown, and agricultural science involves ecology, agronomy (soil and plant sciences) and meteorology. Imagine the variety of scientists involved in a project like a space mission!
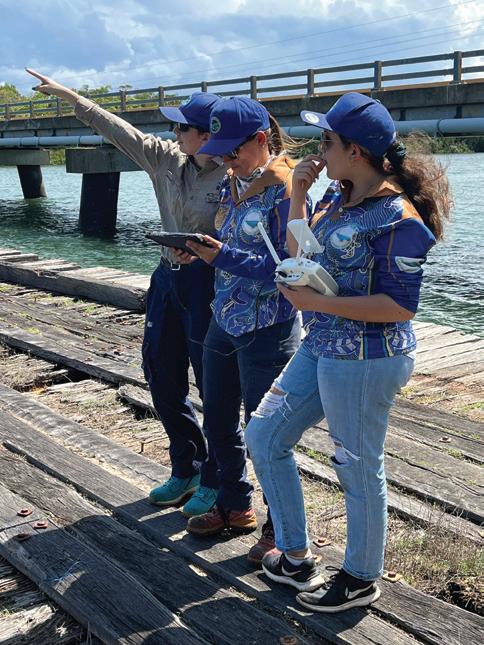
Collaboration is essential in all fields of science. In Australia, scientists need to work with Aboriginal and Torres Strait Islander Traditional Custodians because their knowledge of Country, built over tens of thousands of years, is essential for understanding ecosystems and conducting research that respects cultural values, protects the environment, and supports sustainable outcomes.
Explore! 1.1
Careers in science
The main fields of science that you will study in high school are biology, chemistry, physics, and earth and space science. But there is a branch of science for whatever you are interested in, as long as you are curious and ask questions in that field. Psychology is a field of science that you can choose to study during Years 11 and 12.
SAMPLEPAGES
Psychology deals with the brain and investigates things such as emotions, behaviours and mental health conditions.
What other fields of study in science are there? What jobs can these fields of study lead to?
Conduct some research and list five other scientific specialist areas or careers.
Where do scientists work?
Later in this chapter, you will explore the science laboratory, but not all science is conducted indoors. For example:
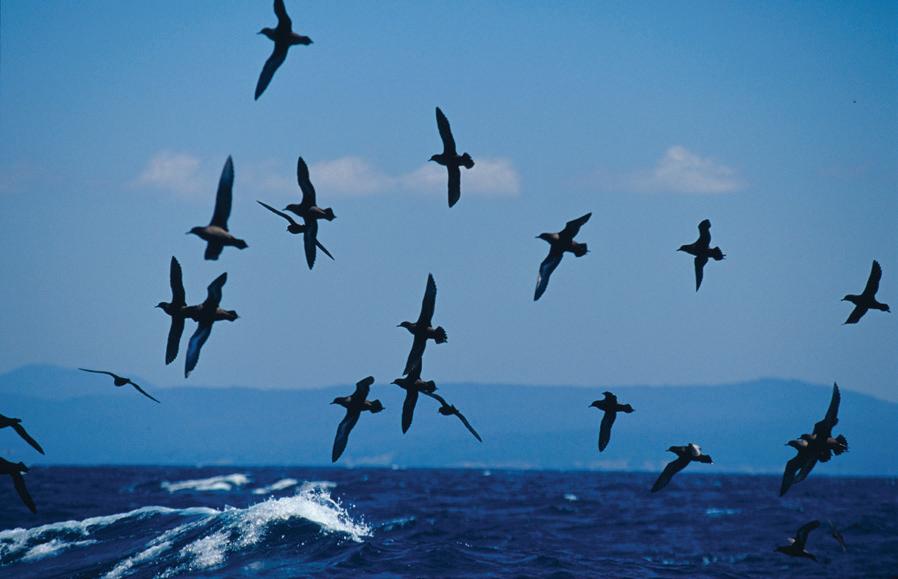
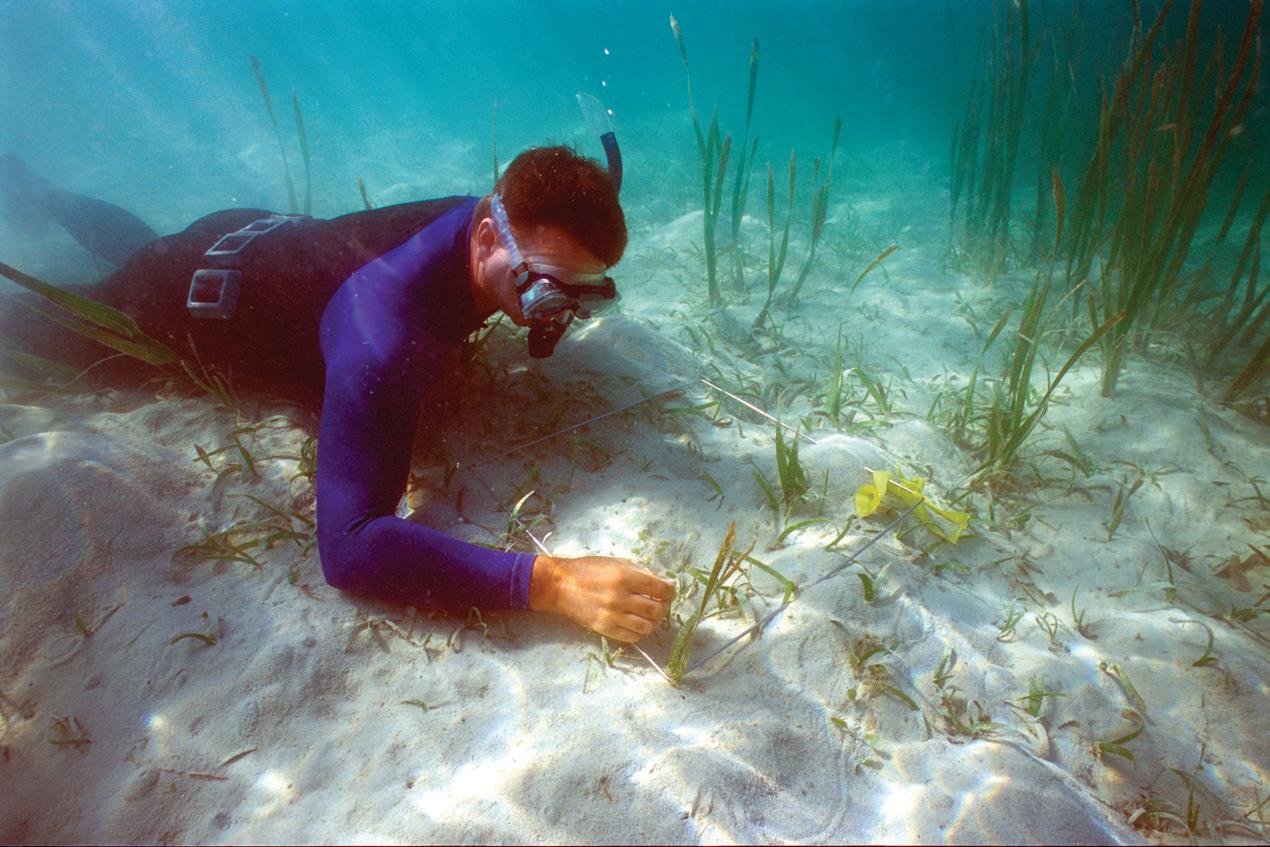
• Biologists might work in the field, observing organisms in their natural environment.
• Chemists might collect water samples from a lake for analysis using specific technology.
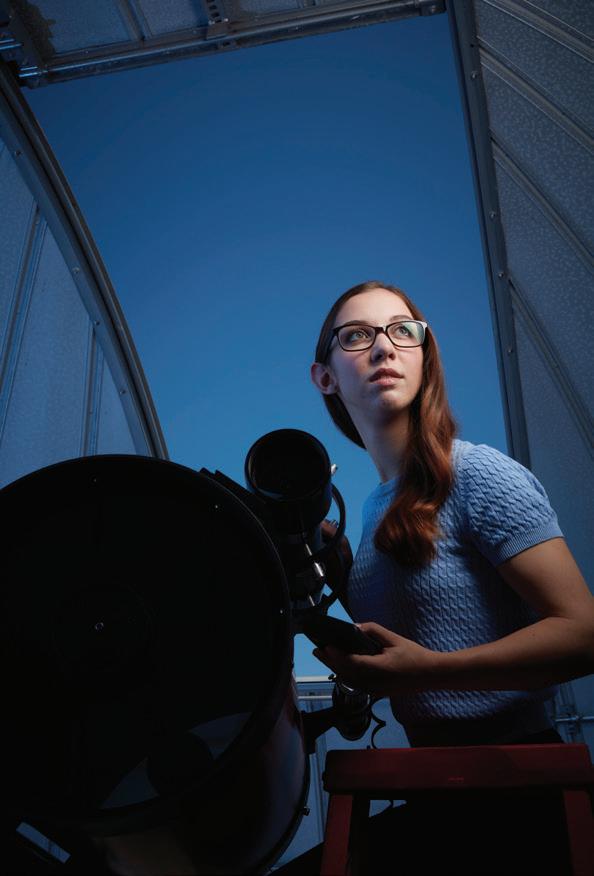
• Physicists might observe the night sky through a telescope.
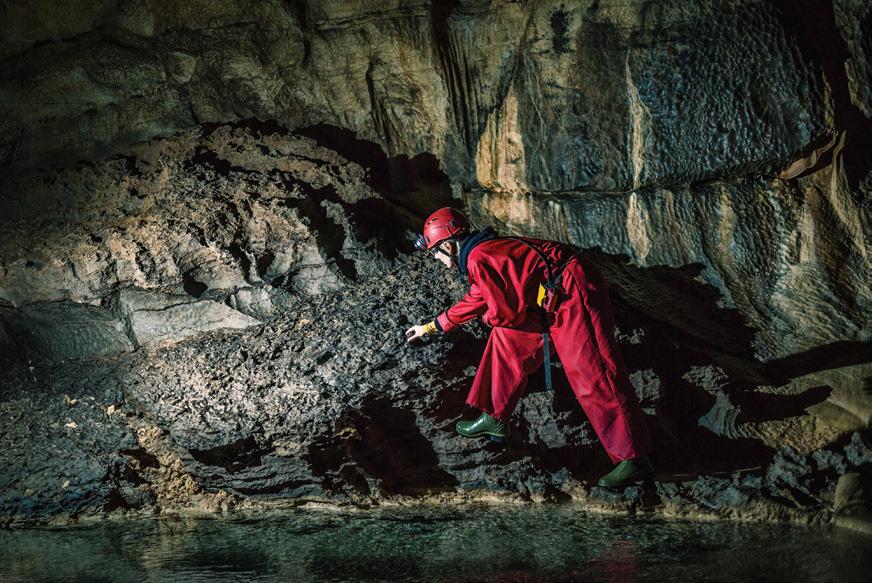
• Geologists might observe rock formations or take core samples.
Figure 1.9 Geologists mapping a potential mining site
earth and space science the study of natural processes and phenomena occurring on Earth and in the universe beyond
Scientists might be employed in research facilities, in organisations such as zoos, in private companies or in government roles advising on policy.
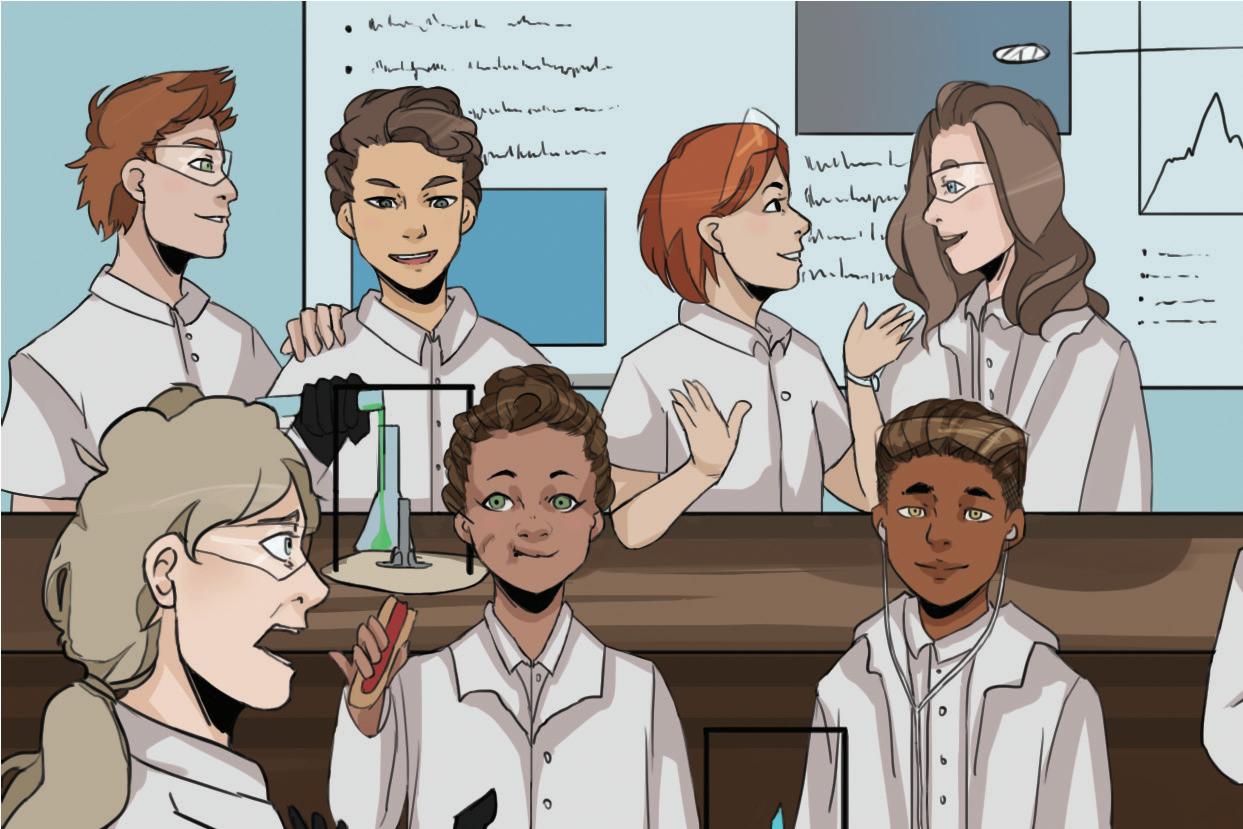
Working as part of a team
Scientists can work individually or in groups. They may work for themselves or for large companies. For most of the experiments you conduct in science class, you will be working in groups. In the real world, these groups are made up of experts from many different fields who share their expertise. These teams of scientists must work collaboratively and have a systematic approach.
Working in groups is an important part of life. It requires:
• cooperation between team members
• sharing of ideas and resources
• group members to understand their role in finding a solution to the problem being investigated.
A good group has the following qualities:
• There is a clear understanding of everyone's roles.
• All members share responsibilities and participate equally.
• Members talk to each other and resolve any problems they have.
SAMPLEPAGES
• Members complete the tasks given to them in a timely manner.
• Each member listens to the others.
Roles in groups
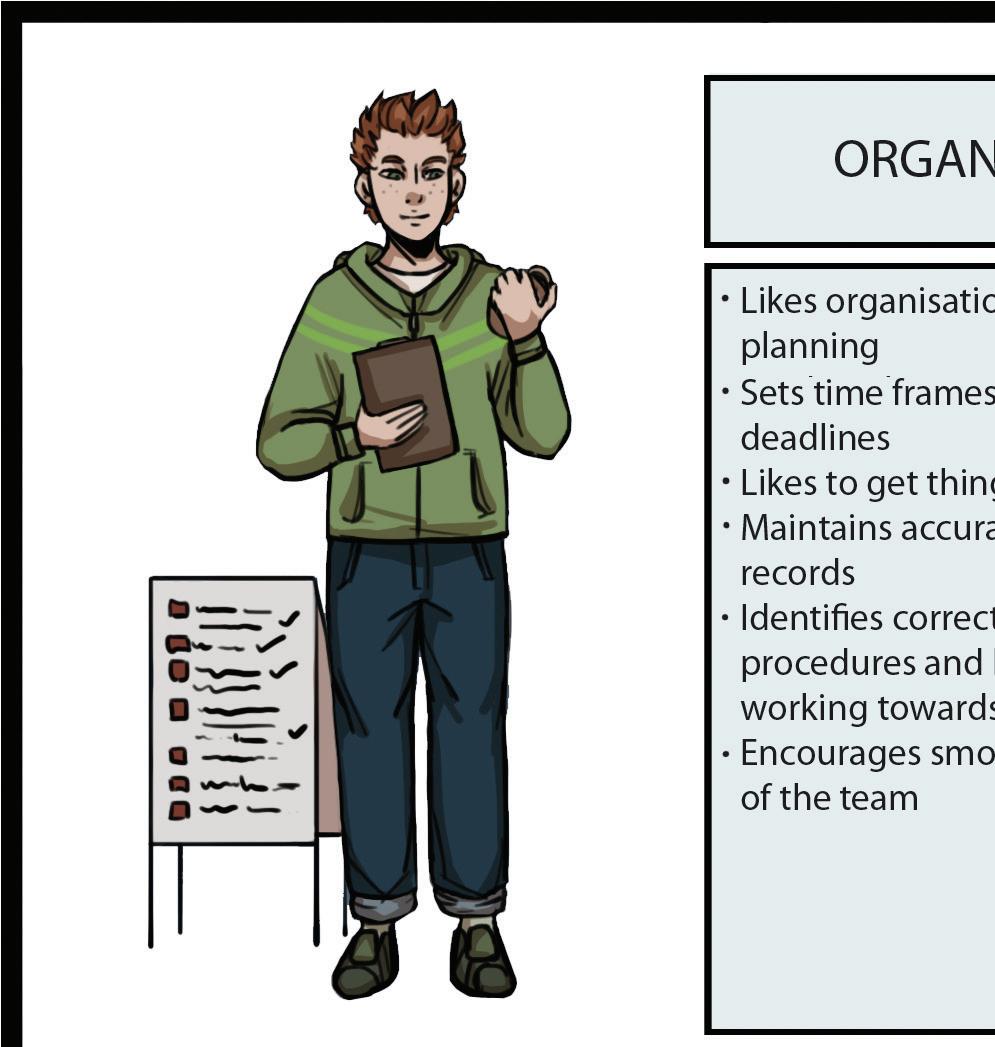
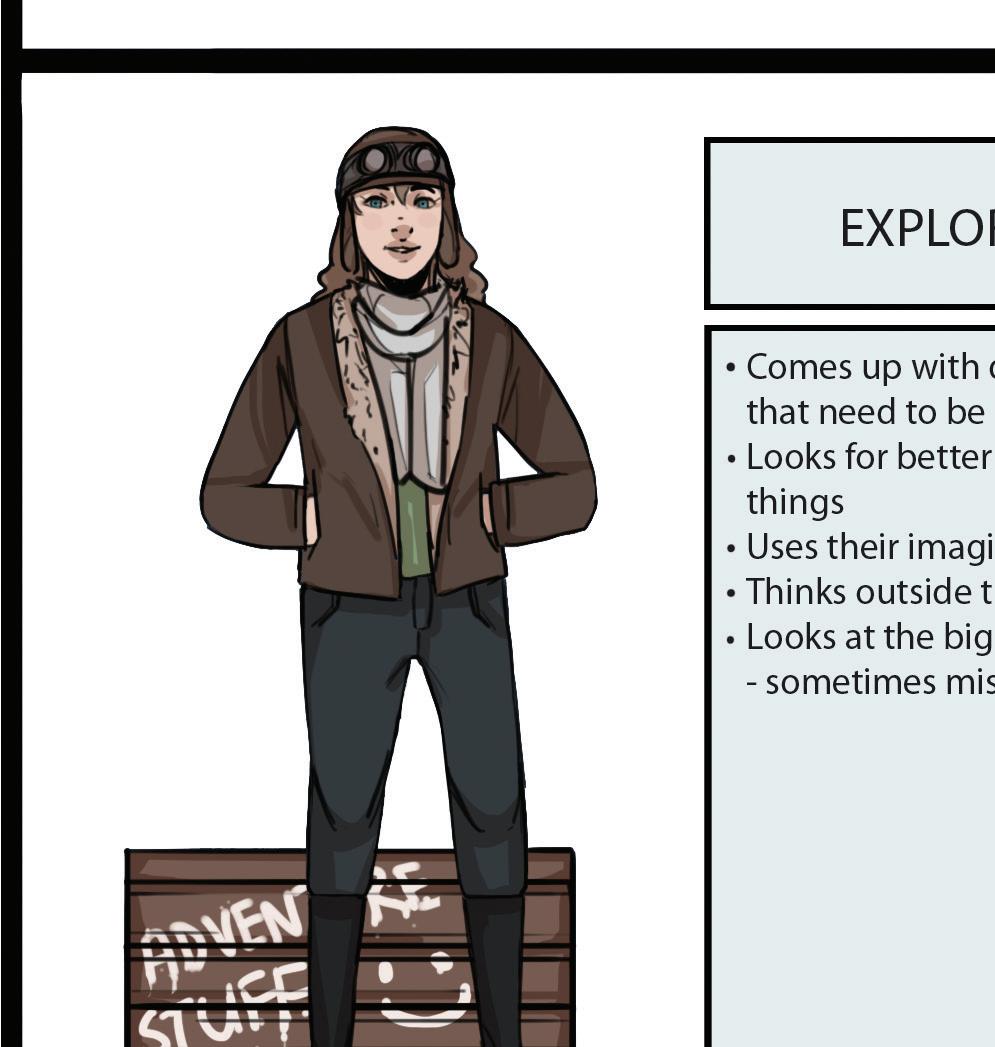
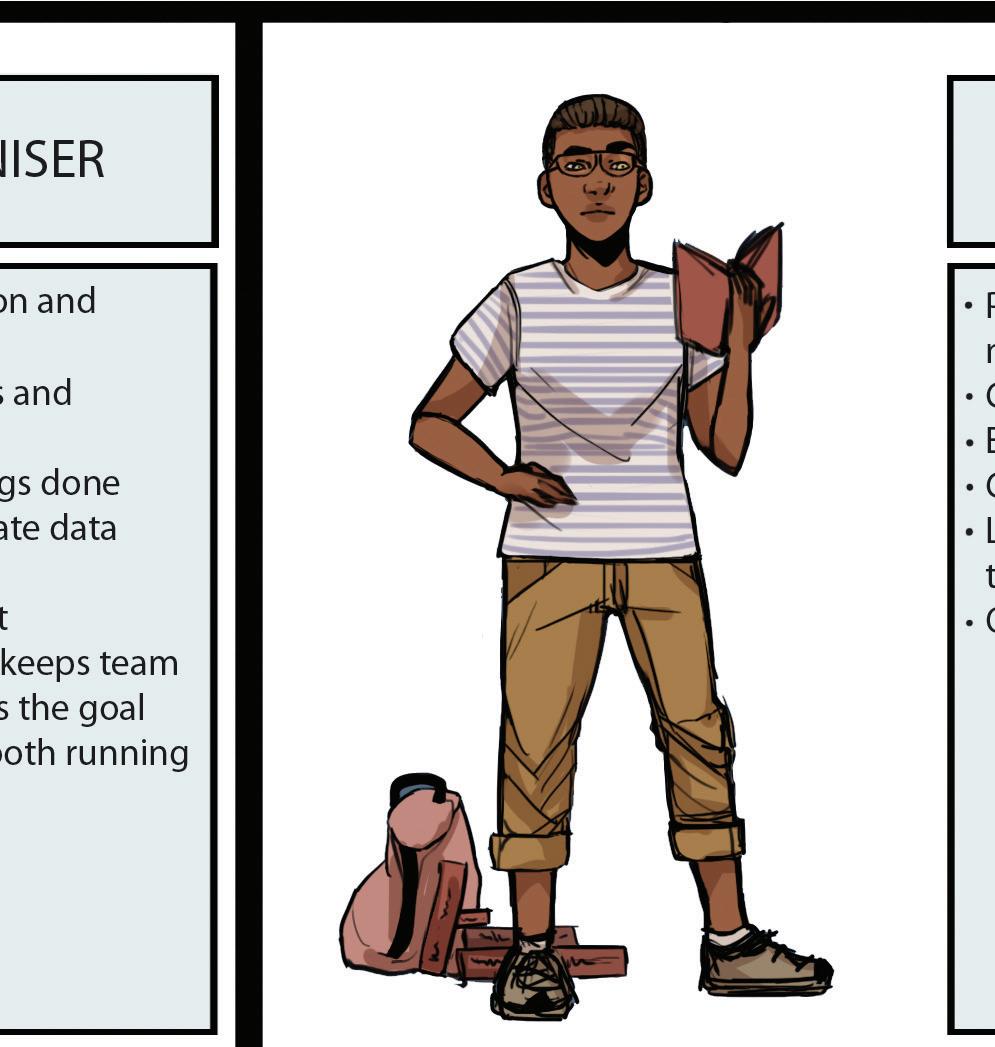
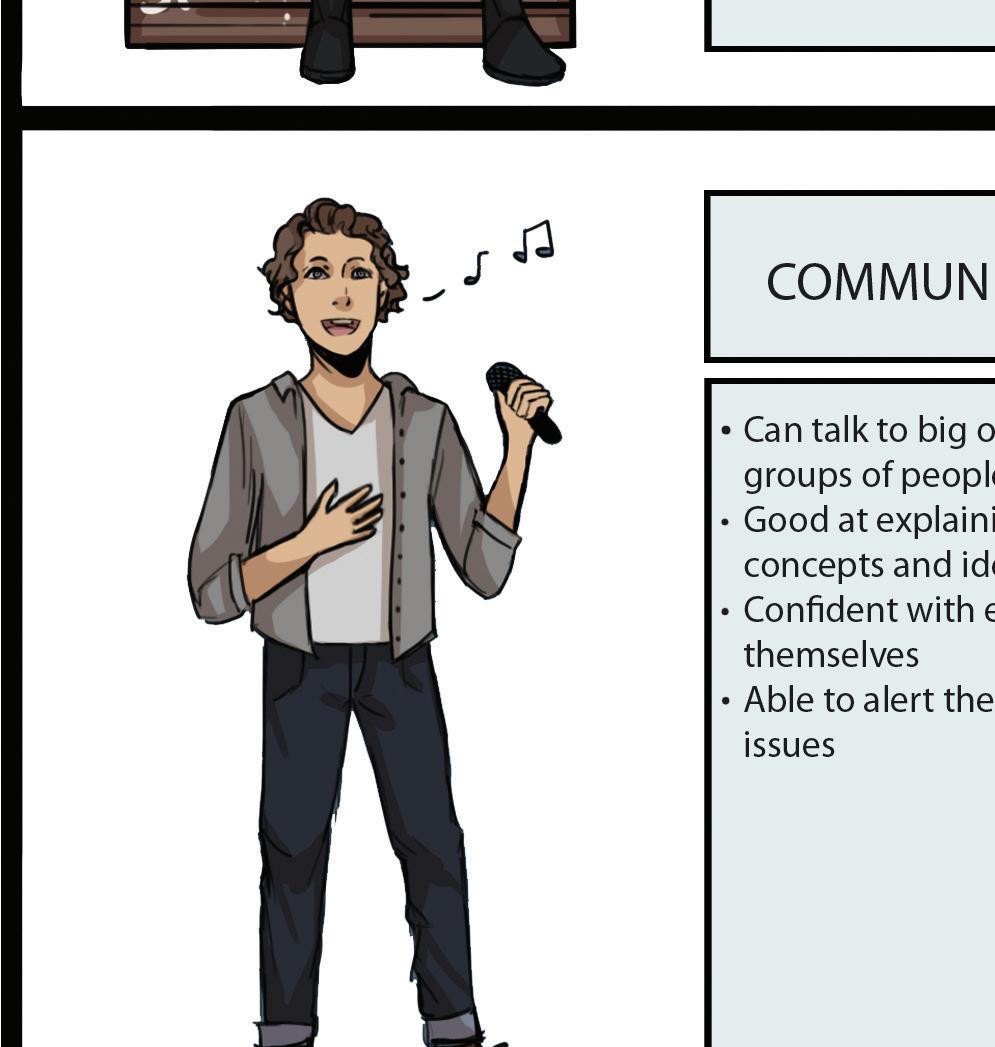
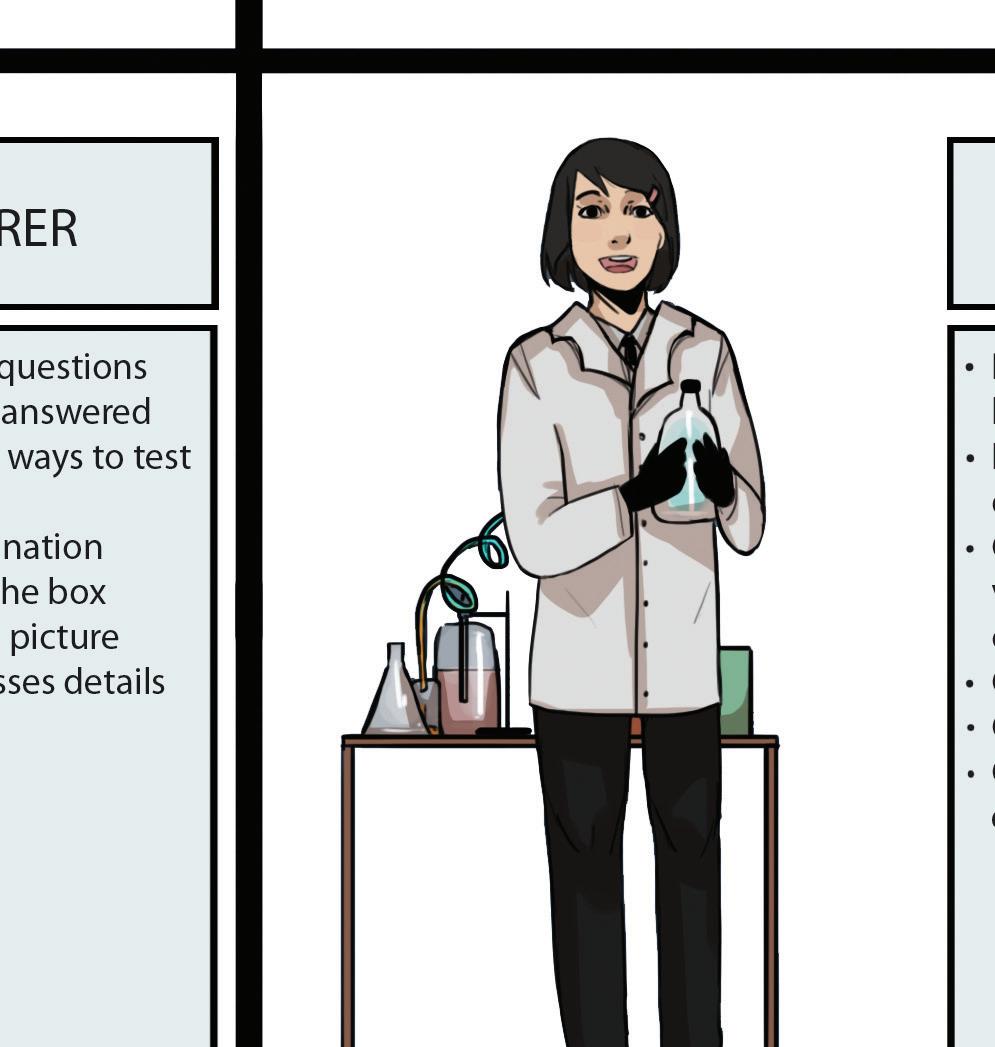
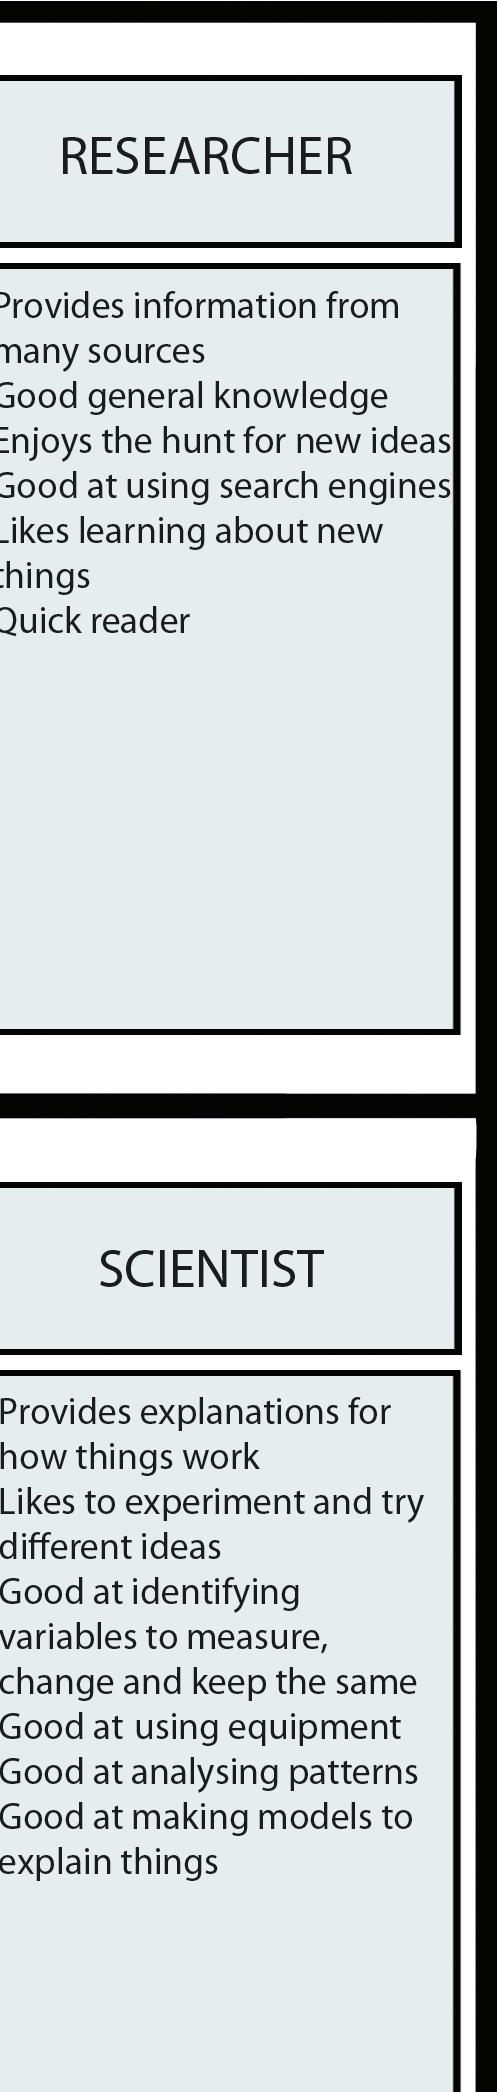
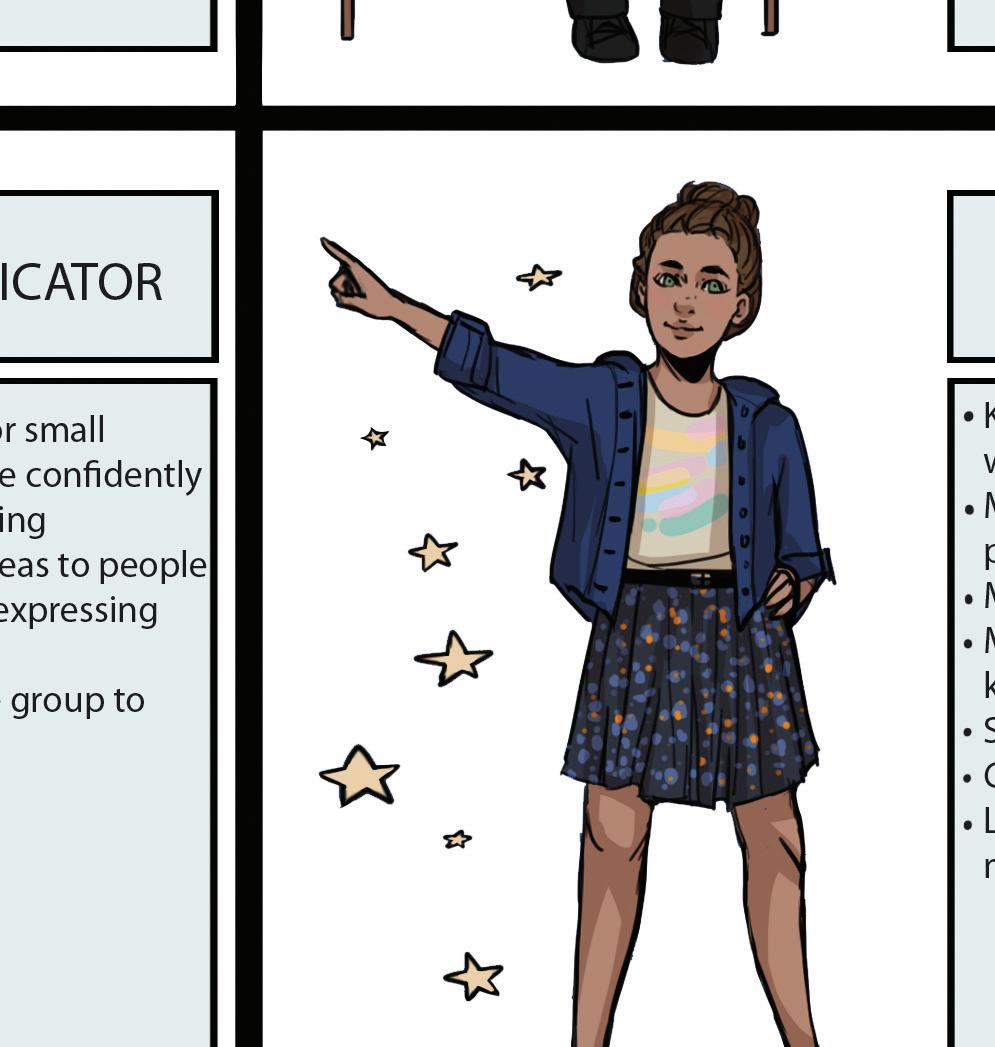
Figure 1.11 shows some descriptions of possible roles within a group. Often people take on multiple roles in groups, but it is important that everyone knows their role, focuses their effort on the things they are good at and contributes equally. It is also a good idea to rotate roles between group members to enable them to gain experience and skills.
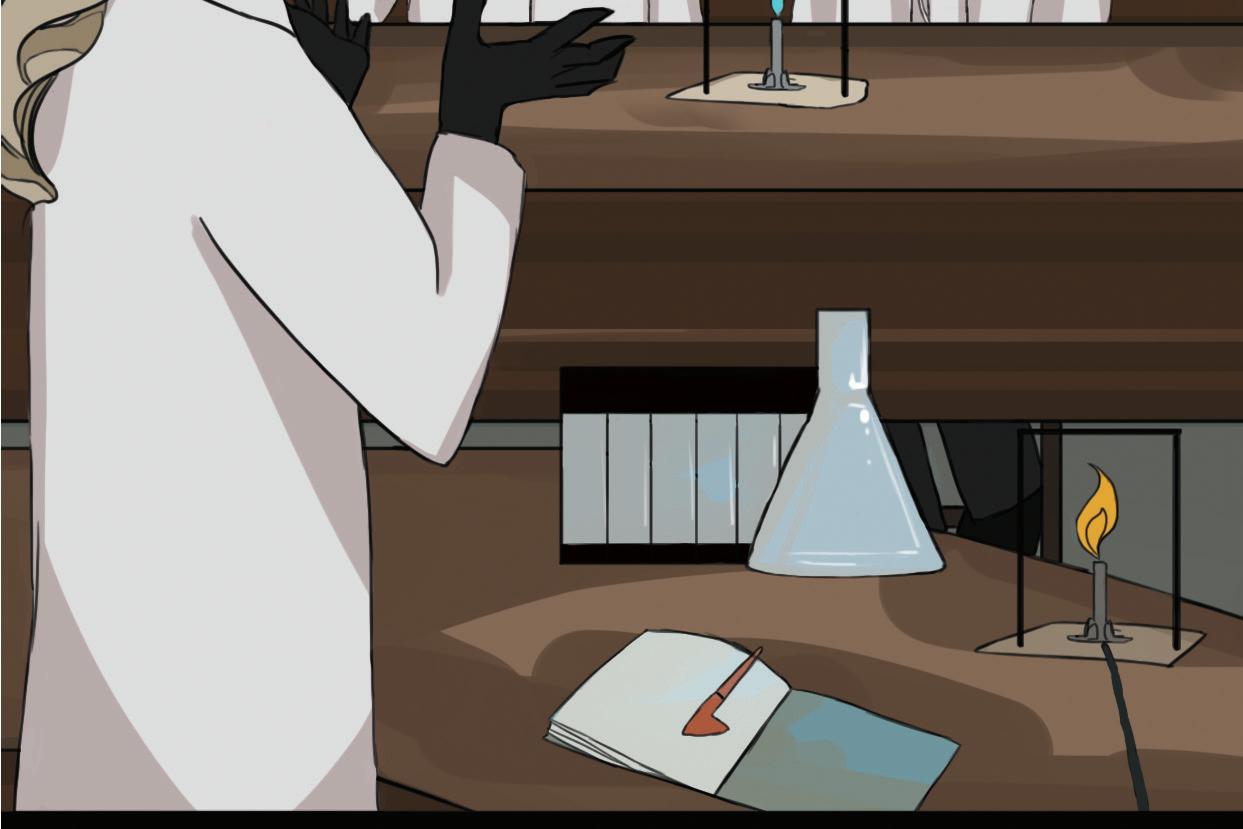
Figure 1.10 Scientists at work in the field
ORGANISER
• Likes organisation and planning
• Sets time frames and deadlines
• Likes to get things done
• Maintains accurate data records
• Identifies correct procedures and keeps team working towards the goal
• Encourages smooth running of the team
EXPLORER
• Comes up with questions that need to be answered
• Looks for better ways to test things
• Uses their imagination
• Thinks outside the box
• Looks at the big picture – sometimes misses details
RESEARCHER
• Provides information from many sources
• Has good general knowledge
• Enjoys the hunt for new ideas
• Is good at using search engines
• Likes learning about new things
• Is a quick reader
SCIENTIST
• Provides explanations for how things work
• Likes to experiment and try different ideas
• Is good at identifying variables to measure, change and keep the same
• Is good at using equipment
• Is good at analysing patterns
• Is good at making models to explain things
SAMPLEPAGES
COMMUNICATOR
• Can talk to big or small groups of people confidently
• Is good at explaining concepts and ideas to people
• Is confident with expressing themselves
• Is able to alert the group to issues
LEADER
• Keeps the team together and working
• Makes sure the team is productive and cooperative
• Matches tasks to people
• Monitors progress and keeps track of time lines
• Sets clear goals
• Is a good listener
• Looks after their team members
Figure 1.11 Roles in groups
Quick check 1.2
1. Suggest the field of science that would study the following:
a) an endangered animal
b) minerals found in rocks
c) the composition of a new drug.
2. Identify which fields of science might be involved in studying animal behaviour.
SAMPLEPAGES
3. Explain why scientists from different countries need to work together.
4. List some of your skills that are useful during group work, and identify the role you would feel most comfortable in.
5. Identify a role that you do not consider yourself good at. Explain why, and give three ways you could improve in this area.
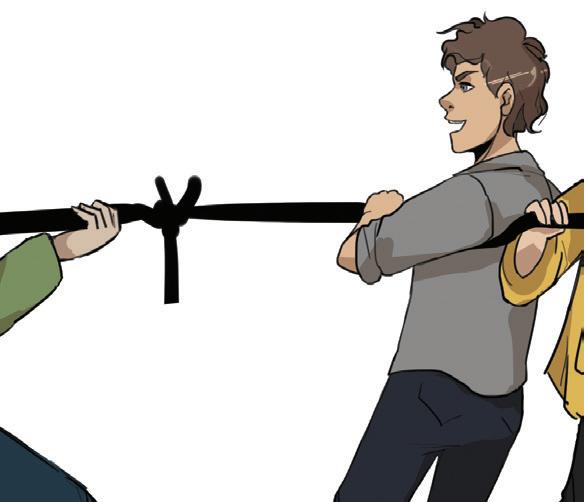
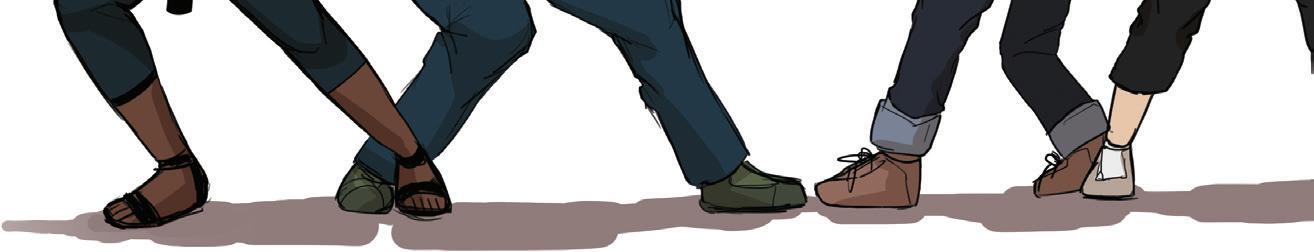
Try this 1.1
Produce
a paper tower
You will work in groups for this task. Each person should choose at least one role from Figure 1.11. Your group will act as a team of consultant engineers, working towards finding a solution to a challenge. First, you will need to brainstorm solutions together. Remember these rules for brainstorming:
• Focus on quantity: come up with as many ideas as you can.
• Encourage wild ideas: don't criticise ideas that are 'outside the box'. These sometimes lead to innovative solutions.
• Record all ideas: one student should be the scribe and record everything.
• Combine and build ideas: discuss and elaborate on the ideas of other students.
• Focus: stay on topic.
Challenge
You are to design and create a newspaper tower that can support this textbook at least 20 cm above a table.
Criteria
1. The tower must not be taped to the table and cannot be supported by any other item.
2. Your teacher will set a time limit for this task.
3. You can only use the following materials:
• two pieces of newspaper
• scissors
• 50 cm sticky tape.
Process
1. Allocate group roles.
2. Brainstorm all possible solutions to the problem, including drawings of your design.
3. Create and test a prototype.
4. Improve your prototype.
5. Discuss the process you followed.
Evaluation
Present your design to the rest of the class.
1. Explain how you came up with your design.
2. Identify the roles each group member played.
3. Discuss how you would approach the research and design process the next time you conduct a similar task.
Section 1.1 review
Go online to access the interactive section review and more!
Section 1.1 questions
Remembering
1. State a research question that a biologist might ask.
2. State what a physicist would study.
3. Recall how scientists collect data.
4. List three scientists who contributed to the development of the scientific method.
Understanding
5. Explain how science has affected your day so far.
6. Suggest four places a scientist might be employed.
Applying
7. A scientist studies an asteroid in space. Explain how this study would fit into the fields of chemistry or physics.
Analysing
8. Compare the work of a biologist to that of a physicist. You may use a Venn diagram like the one shown here.
BiologistPhysicist
SAMPLEPAGES
Evaluating
9. Some fields of science can overlap. Explore the fields of science a biochemical engineer might study.
10. Justify the importance of acknowledging Aboriginal and Torres Strait Islander Peoples' knowledge in modern science.
1.2 Planning an investigation
Learning goals
At the end of this section, I will be able to:
1. Describe the steps of the scientific method.
2. Identify the different types of variables in a scientific experiment.
3. Recognise the difference between quantitative and qualitative data.
SAMPLEPAGES
Science is a systematic process that involves several steps. However, an individual scientist might not be involved in every step of the process. For example, the government might collect some health data about the population and task a scientific organisation with finding a solution to the problem. An epidemiologist (a person who tracks diseases) might come up with a hypothesis about the cause of the problem. A public health advisor might design a program to test the hypothesis, and a team of health professionals, such as doctors and exercise physiologists, might conduct the experiment (e.g. an exercise program). Biomedical research scientists might observe the experiment, collect the data and analyse it, while a pathologist might collect blood samples from the patients and test these. In the end, a nominated person would gather all the findings and publish the results in a scientific journal. Science is a team effort!
The scientific method
To conduct a scientific investigation, the team of scientists needs to follow a common framework or approach. This is known as the scientific method. This systematic approach to answering scientific questions has evolved over time, and a version of what is currently used can be summarised in eight steps, which are outlined in Figure 1.12.
Let's delve a little deeper into some of the steps of the scientific method. In this section, we will focus on steps 1–5 to start thinking and planning an investigation like a scientist. Steps 6–8 will be covered in more detail in the Year 8 textbook.
hypothesis a proposed explanation of, or educated guess about, the outcome of an event (e.g. an experiment) based on research and current knowledge; can be tested observe use senses and tools to notice something or to gather data/ information
else you might want to find out?
what
Your conclusion may lead you to ask more questions. Can you think of
peer-review to read, check and give an opinion about something that has been written by another scientist or expert working in the same subject area observation a statement based on information gathered via your senses claim a statement made without evidence; it can be investigated and found to be supported or not supported
Step 1. Observe and ask questions
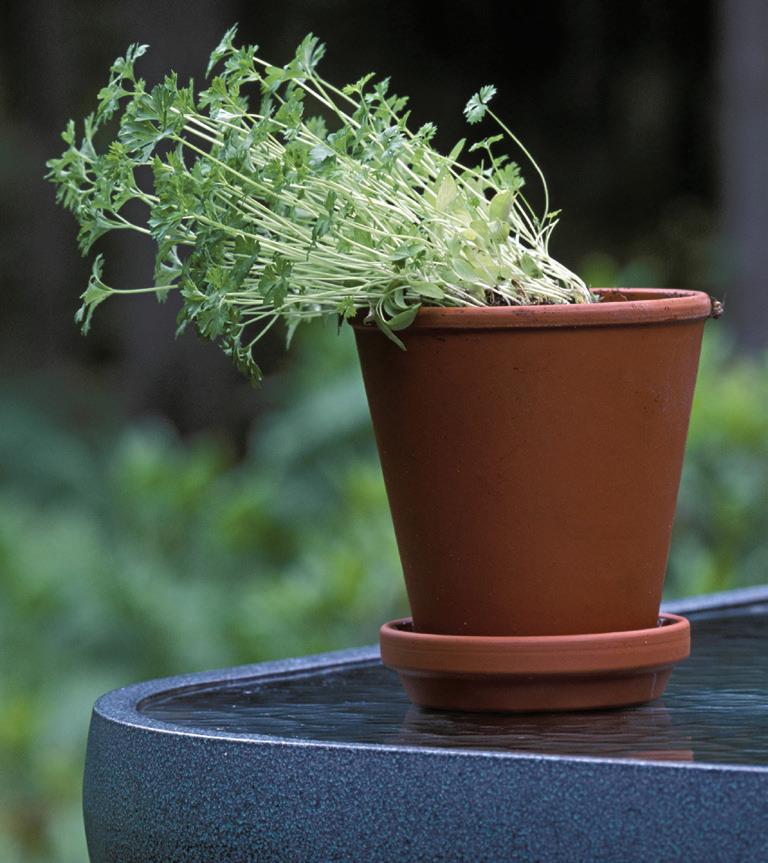
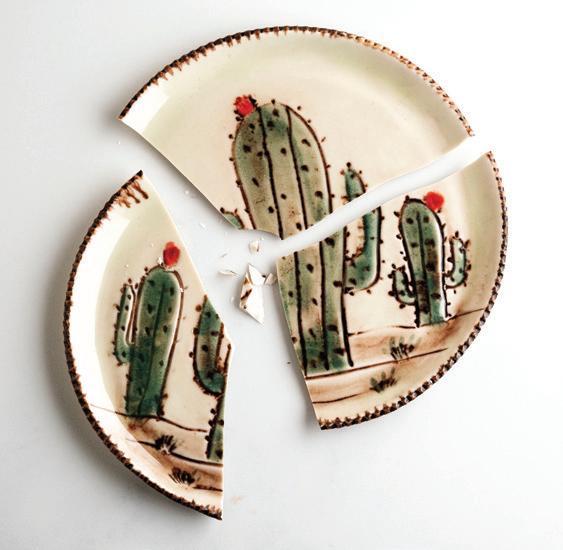
This is something you can do every day! You might notice the cactus on the windowsill is looking unwell. You might ask yourself some questions based on the observation; for example, 'How much water does a cactus need to survive?' This would be your research question.
Step 2. Do background research
You might head to the internet to try to find suggestions to answer your questions. Professional scientists generally use peer-reviewed journal articles to see what other scientists in the past have found out and which experiments have already been done. You may find out that cacti (plural for cactus) can die from too much water!
SAMPLEPAGES
Step 3. Define variables and state a hypothesis
You define the variables you will change, measure and keep the same, and then come up with a prediction that can be tested. For example, 'Cacti that are watered daily will not grow as tall.'
Step 4. Test hypothesis with an experiment
This involves developing a series of steps in an experiment that can test the hypothesis. You need to formulate experimental methods that are safe, allow the collection of sufficient data and are carried out in such a way that there is no other explanation possible for the outcome except the one you are interested in. You may need to use 10 cactus plants of the same variety, placed on the same windowsill, and continue the experiment for one month. You may find a method that you need to modify to suit your own experiment.
Step 5. Collect and record the data
You then record and present the results. For example, you may keep track of how the cacti are doing every day. You might want to record the colour and shape of the cacti or measure how much the cacti grow each week. The results can be presented in tables and graphs.
Step 6. Analyse the data
You then analyse the data that you have gathered to find any trends, patterns or relationships, and then summarise what you have found, including any problems with your data. For example, three of the overwatered cacti looked pale and shrunken, while all the cacti that were watered correctly produced smaller cacti.
Step 7. Evaluate the data
You then evaluate your experiment. You may talk about how reliable your data is, listing any unanswered questions, and suggest improvements if you found there were any problems.
Step 8. Form a conclusion
Finally, you can ask yourself what the data means and use it to answer your original research question. You can also ask yourself whether the hypothesis has been accepted or not. Your hypothesis about overwatering cacti has been accepted.
Figure 1.12 The scientific method
Step 1. Observe and ask questions
The first step in the process is often based on an observation or a claim that has been made. Scientists continually observe the world around them, gathering information using their senses of sight, hearing, smell, taste and touch. An observation is a statement about the information gathered by your senses, and should not include an opinion, explanation or prediction about why the observation has been made. Examples of observations are:
• The grass is green.
• The fire is hot.
• The plant grows well in the shade.
Once an observation has been made, scientists can draw an inference that explains the observation. This may be a possible explanation that is drawn from their prior experience or knowledge. In the following examples, the observation is followed by an inference.
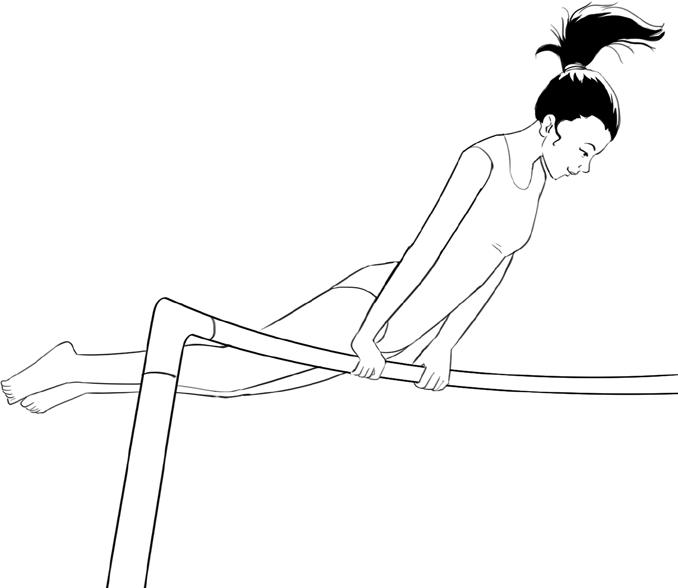
• Chloe has a longer long jump than Aria, because Chloe is taller than Aria.
• Ahn is feeling sick; he must have eaten some 'off ' food.
These inferences offer a possible explanation, but it does not necessarily mean they are true. For example, Chloe may train harder than Aria or have a different technique. But an inference allows a scientist to start to formulate a research question that can be investigated. For example, 'Does height affect the distance someone can jump in long jump?'
Not all questions make good research questions. They need to be investigable questions that can lead to a scientific experiment. An investigable question should be practical (i.e. you have the time and materials necessary to test it), and not simply an idea or opinion (e.g. 'What is your favourite colour?'). Non-investigable questions are often open-ended and encourage discussion or exploration of various perspectives, but they cannot be tested. Practise determining the investigable questions and non-investigable questions in the following activity.
Try this 1.2
Identifying investigable questions
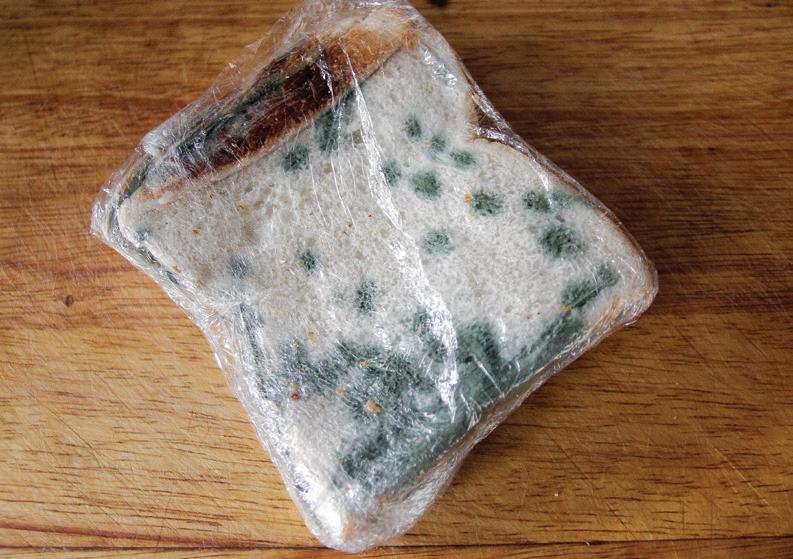
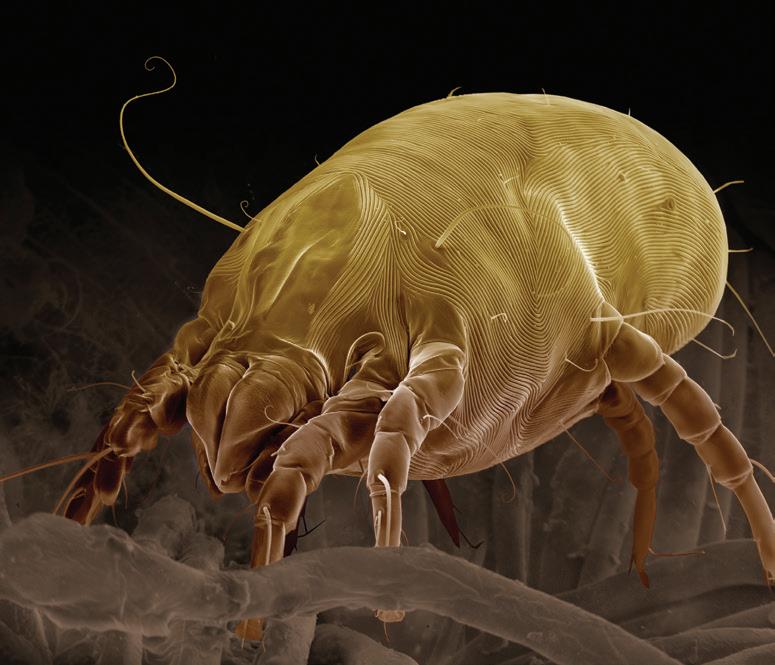
A student observed that food left out on the bench went 'off' after a few days. They inferred that some sort of microbe must have spoiled the food and that they shouldn't eat it. Consider the questions in blue in Figure 1.13. Which are investigable questions that could be tested with an experiment?
What are bacteria?
What is mould?
Which bacteria causes the worst food poisoning?
Why can my dog eat ‘off’ meat?
Quick check 1.3
1. Define the term 'inference'.
2. State three observations you might make at the beach.
Why does food go ‘off’?
What makes food go ‘off’ faster?
Why does ‘off’ food make you sick?
Which fruit stays the freshest after passing its use-by date?
Does refrigerating food make it stay fresh longer?
SAMPLEPAGES
3. a) Decide whether the following are investigable or non-investigable.
i) How do plants grow?
ii) Do sugary drinks cause tooth decay?
iii) What stops ice from melting?
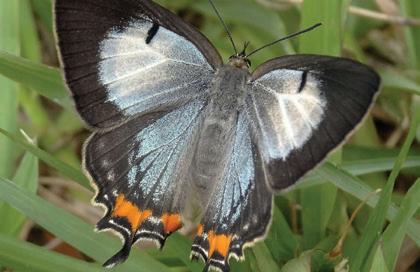
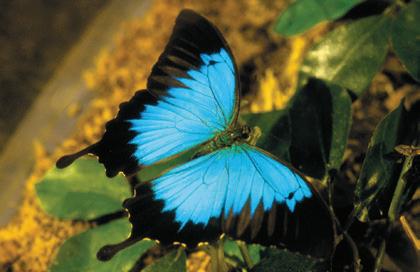
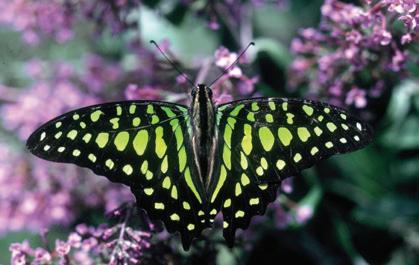
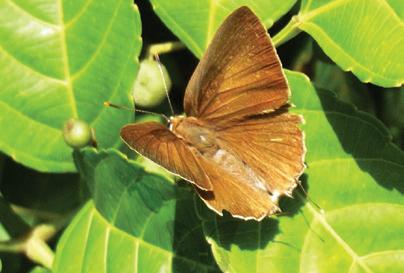
iv) Do butterflies prefer yellow flowers?
v) Sleep helps students.
b) Write the non-investigable questions as investigable questions. Compare with other students in your class: are they the same?
investigable question a research question that can be answered by conducting a scientific experiment
Figure 1.13 Which of these questions can be tested?
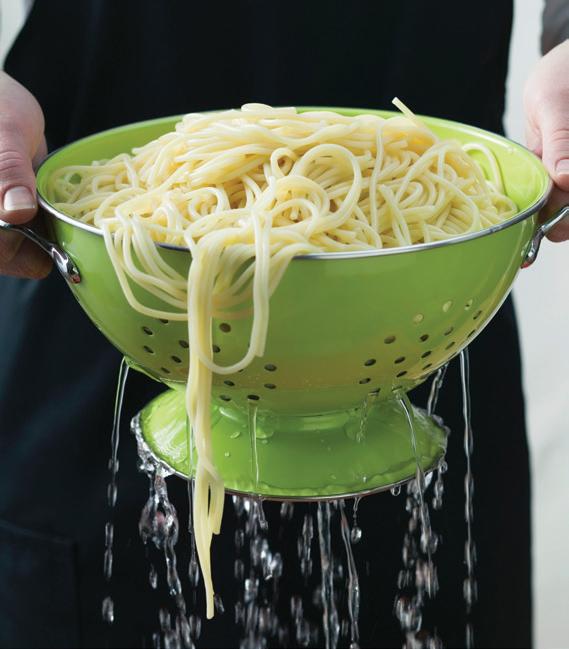
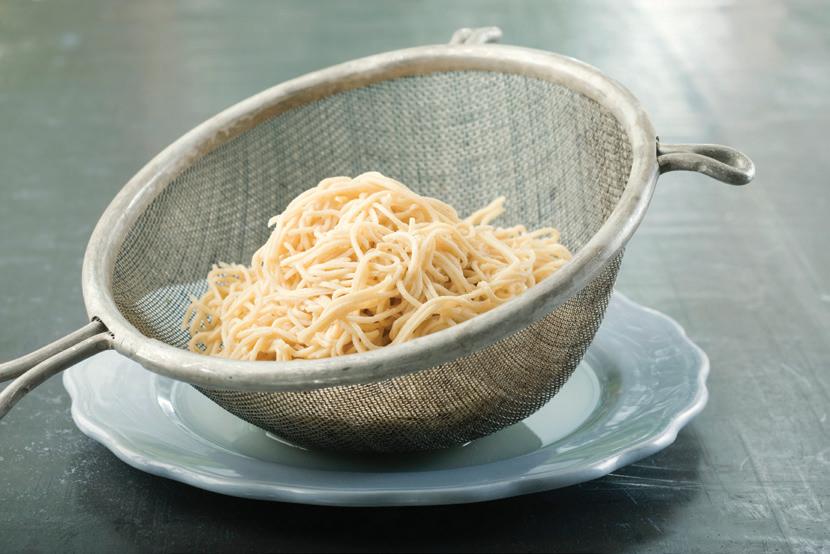
Practical 1.1
observing pasta
Aim
To develop observations and inferences based on a simple task.
Materials
• pasta (penne or similar)
• 500 mL beaker
• hotplate
• water
Method
• sieve
• heatproof gloves/ oven mitts
Be careful
Ensure you follow safety directions regarding the hotplate. Do not leave it unsupervised. Allow it to cool down before putting it away.
SAMPLEPAGES
1. Observe the pasta before heating and record at least three observations in the results table.
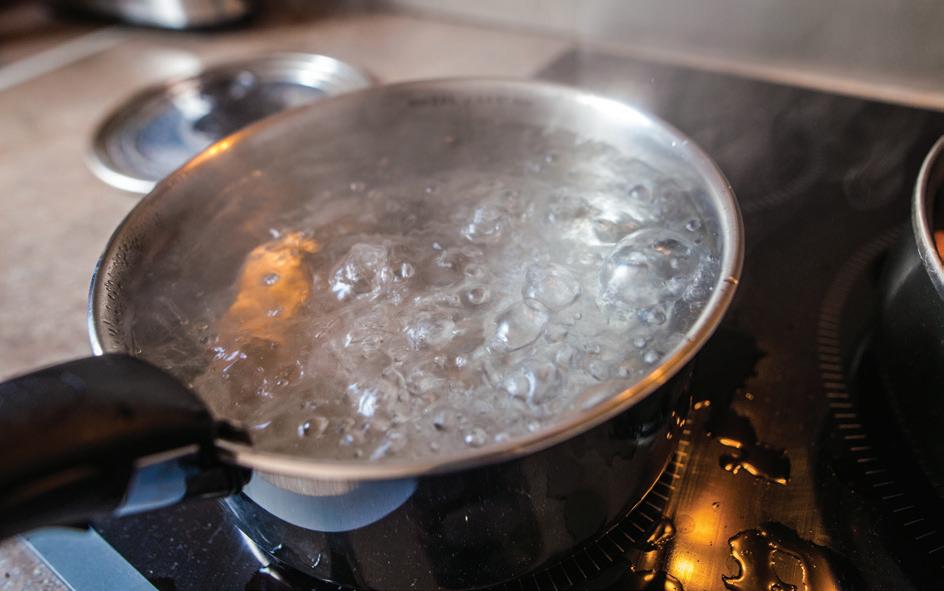
2. Turn on the hotplate. Bring 300 mL of water to boiling point in a beaker on the hotplate.
3. Add 5–10 pieces of pasta.
4. Boil for 12 minutes.
5. Turn off the hotplate and use heatproof gloves to pour the water and pasta into a sieve over a sink.
6. Observe the pasta after heating and record at least three observations in the results table.
7. Draw inferences to explain each of your observations based on your prior knowledge or experiences.
Results
Table showing observations of pasta, before and after boiling
Step 2. Do background research
Many of the research questions you come up with might have already been answered by other scientists. It is important to conduct background research to refine your research question and inform your predictions and method. The internet is a useful resource, but the volume of information can be overwhelming, and it isn't always accurate or relevant. In Year 8, you will learn more about specific search techniques and ways to evaluate the information you find.
Step 3. Define variables and state a hypothesis
Defining
the variables
Once an observation has been made and a research question generated, the next step is often to conduct an experiment. A scientist conducts an experiment in a controlled situation designed to test only one thing. This allows the scientist to measure the effect that changing this one thing will have. The things that will be changed are called variables variable a component of an experiment that changes or can be deliberately changed
For example, an experimenter wants to see if changing where a towel is placed after a shower affects the time it takes the towel to dry. Will lying it on the ground or hanging it on a rack decrease the drying time?
In this example, the experimenter is:
• changing the place where the towel is left. This is the independent variable.
• measuring the time it takes for the towel to dry. This is the dependent variable.
SAMPLEPAGES
In an experiment, we want to know if a change in the independent variable causes a change in the dependent variable. This is also what we base our prediction on. To show that the position of the towel changes the time it takes to dry, all other factors must be kept the same, such as the temperature of the room, the amount of water on the towel and the towel used. These are the controlled variables. They are controlled to ensure that the experiment is a fair test, and that the experimenter can confidently say that the rate at which the towel dried was definitely due to the place it was left, rather than some other factor that has interfered with the dependent variable. In a poorly controlled experiment, we won't know if the temperature of the room or how wet the towel was changed how long it took the towel to dry. That is why scientists only change one variable at a time.
Try this 1.3 Is this a fair test?
A student wants to investigate whether the amount of light affects the growth of a plant. They place one pot plant on the windowsill in direct sunlight, and one in a dark corner. Both plants are in the same type of soil. Plant A is a cactus and Plant B is a flowering plant, and they are similar sizes at the beginning of the experiment. Both plants are watered daily and after a month the change in their height (in centimetres) is measured with a ruler.
1. State the independent variable.
2. State the dependent variable.
3. Identify one variable that was well controlled.
4. Identify one variable the student forgot to control.
5. Explain whether this was a fair test.
Stating a hypothesis
independent variable the variable that is deliberately changed during an experiment dependent variable the variable that is tested or measured during an experiment (to see how it responds to changes in the independent variable) controlled variables variables that are kept the same during an experiment to ensure they don't affect the dependent variable fair test a well-designed experiment where only the independent variable is changed, and all the other variables that might have an impact are controlled
A hypothesis is an educated guess or prediction of the outcome of an experiment. It is written before conducting the experiment and is based on your prior knowledge and background research. A good hypothesis is able to be supported or not supported by the data from the experiment, and this will lead you to accept or reject the prediction in your conclusion. Your hypothesis doesn't have to be accepted (proved right) in order for your experiment to be useful. There is value in finding things that don't work or aren't true in science. Everything contributes to our knowledge on a topic.
Figure 1.14 Towels on a clothesline dry quickly on a warm, windy day.
Plant B
Plant A
WORKSHEET
Qualitative vs quantitative
When constructing a hypothesis, try to make a statement about how the independent variable will affect the dependent variable. Do not use the words 'I think …' to begin the hypothesis. Instead, use an 'If … then …' framework. For example, for the towel drying experiment, a good hypothesis might look like this:
If the towel is placed to dry in a location with more air flow, then it will dry faster.
Step 4. Test hypothesis with an experiment
Once you have established your research question, variables and hypothesis, you need to design and document the experimental method. You should detail the materials required and then show exactly how to complete the experiment, using numbered steps. The goal is to write a method that is so clear and exact that another person could reproduce it in exactly the same way, getting the same results as you. You will learn more about conducting experiments in a safe and valid way later in this chapter.
Step 5. Collect and record the data
Now to collect the data. The better your experimental design, the more reliable your data and conclusions will be. Thorough background research, a good investigable research question and well-controlled variables mean the data you collect is going to be helpful when deciding whether to accept or reject your hypothesis.
Types of data
Data that is collected during an experiment can be broadly split into two categories: qualitative observations and quantitative observations, as illustrated in Table 1.1.
Qualitative data
DefinitionQualitative observations are descriptive and usually come from our senses. They are often used to describe the physical properties of something being tested.
Quantitative data
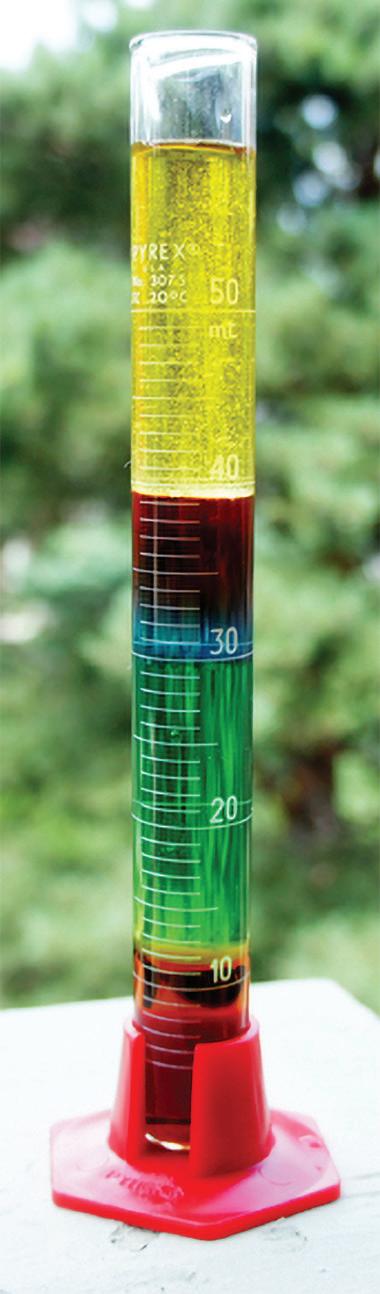
Quantitative observations are numerical values or counts expressed as numbers. They are often measured with tools such as a thermometer, a measuring cylinder or a stopwatch.
For example, for a swimming race, think about how you could collect data to answer the research question: 'Who is the best swimmer?'
ExampleAsk their coaches who they think is the best swimmer, or ask spectators to rate their swimming style on a scale of Poor/Fair/Excellent.
AccuracyThis description could be very detailed, but each person who watched the race might give a slightly different description, and so qualitative descriptions are hard to compare. They are subjective (open to interpretation or opinion).
SAMPLEPAGES
Record each swimmer's time in seconds using a stopwatch.
This measurement may be a more reliable piece of data, because a number is objective (not open to interpretation or opinion). It can be easily compared to other observations (e.g. the next time they race each other), even if a different person is collecting the data.
Table 1.1 A summary of qualitative versus quantitative observations in a swimming race
Measurement tools, such as those discussed later in this chapter, help us to gather quantitative data. For example, a thermometer allows for quantitative observations of the temperature of water, such as 36.5°C, whereas a qualitative observation of the water might be something like 'warm' or 'room temperature'. Quantitative data can be more precise and objective, but qualitative data has value too,
because it can provide a detailed description of what was observed. You should plan what type of data you hope to collect during your experiment before you begin, and how you will minimise the potential errors in your data.
Displaying data
The type of data you collect influences the way it is displayed and analysed.
In a table, data can be organised and summarised. Setting up the table of results prior to conducting your experiment means that you can record data easily as you go. When analysing and communicating your findings, graphs are a way to identify trends (patterns) in the data and present it effectively. Certain graphs are more appropriate for qualitative data (such as bar and column graphs), while quantitative data can be displayed in scatterplots and line graphs. Spreadsheets are a useful tool for collating, analysing and displaying your data. The Year 8 resource will cover this in more detail.
Making thinking visible 1.1
Think, pair, share: Qualitative
and quantitative data
1. Pair up with someone in the class and think about how you could collect both qualitative and quantitative data regarding their:
a) height
c) pets
e) siblings.
SAMPLEPAGES
b) age
d) favourite colour
2 Collect your data and record it in the table below.
Feature
Height
Age
Pets
Favourite colour
Siblings
3. Discuss with your partner:
Qualitative data
Quantitative data
a) Which research questions were easy to answer qualitatively?
b) Which research questions were easy to answer quantitatively?
c) Why would a scientist collect qualitative data for certain research questions?
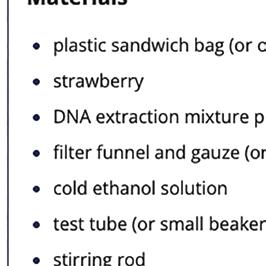
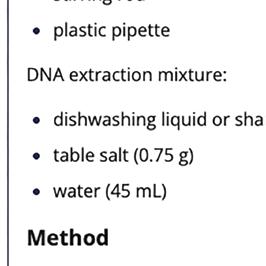
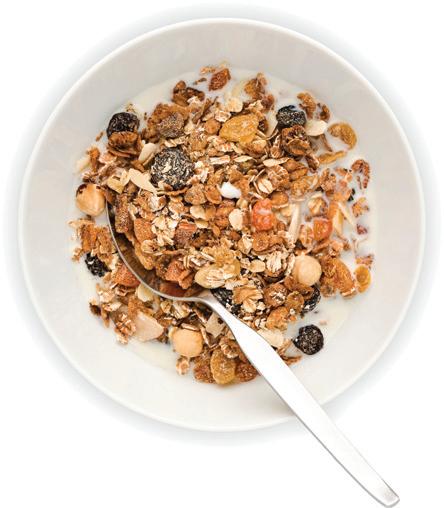
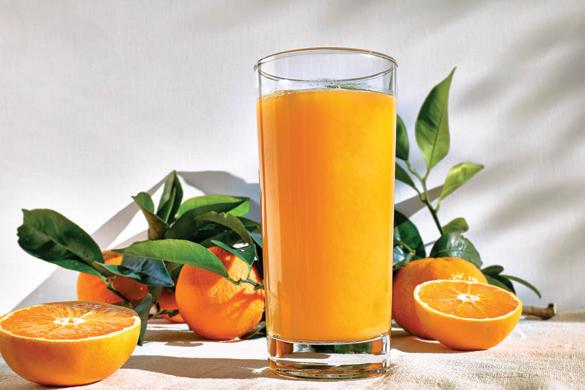
Aim
To use the scientific method to plan and conduct an experiment investigating the vitamin C content of different fruit juices.
Background research
Complete some research to determine the role of vitamin C in a balanced diet, and compare the amount of vitamin C in different fruits. Write this up as a short paragraph. This will help you in addressing the research question, 'Do citrus fruit juices contain more vitamin C than non-citrus fruit juices?
Be careful
Ensure you follow safety directions regarding the hotplate. Do not leave it unsupervised. Allow it to cool down before putting it away. Do not taste or drink any of the fruit juices.
The Think, pair, share thinking routine was developed by Project Zero, a research centre at the Harvard Graduate School of Education.
using the scientific method: vitamin C in fruit juices
Define variables and state hypothesis
With reference to the Materials and Method sections shown below, identify the independent variable, dependent variable and two controlled variables. State your hypothesis using the 'If … then …' framework.
• about 80 mL each of various fruit juices (at least two citrus and two non-citrus)
2. Measure out 100 mL of water and add a small amount to the starch, enough to make a paste-like consistency.
3. Add the remaining water to a 250 mL beaker and bring to the boil on the hotplate. Add the starch paste, stir well and turn off the hotplate. This is your starch solution.
4. Add 75 mL of distilled water and 10 drops of starch solution to another beaker.
5. Add a few drops of iodine to this solution until it turns a dark blue-black. This is your vitamin C indicator.
6. Add 5 mL of the indicator solution to a test tube and label it with the juice being tested and the trial number.
7. Add the first sample of fruit juice, drop by drop, to the indicator solution. Make sure the drops fall directly into the solution, instead of running down the side of the test tube. The more vitamin C in the juice, the fewer the number of drops will be needed to turn the indicator solution colourless. Count and record the number of drops it takes to remove the blue colour. Keep the test tube in the rack.
8. Repeat steps 6 and 7 with a new test tube for the next juice or trial. Continue until all juices have been tested.
9. If time permits, carry out three trials for each type of juice. Record your results in the table.
Results
Table showing how many fruit juice drops were required to cause a colour change
Juice
Trial 1
Number of drops taken to cause a colour change
Trial 2
Trial 3
Trial 4
Discussion: Analysis
1. Was the data you collected quantitative or qualitative?
2. Describe any patterns in your results. For example, is there a pattern between the type of fruit (e.g. citrus versus non-citrus) and the number of drops needed for a colour change? Or is there another pattern present, such as the colour of the fruit?
3. Another variation is to add the same volume of juice to each test tube and compare. Using your results from the drop-wise experiment, predict what you think the results of that experiment would be.
Discussion: Evaluation
1. Consider your method and suggest any improvements you could make if you were to do it again.
Conclusion
1. Draw a conclusion from this experiment about the vitamin C content of different fruit juices, by copying and completing this statement in your science book. From this activity it can be claimed that __________. This is supported by the observations that _____________. Therefore, the hypothesis is/isnot supported by these findings.
SAMPLEPAGES
Section 1.2 review
Section 1.2 questions
Remembering
1. Recall the difference between an observation and an inference.
2. Define qualitative data and quantitative data.
Understanding
3. Classify the data in the following scenarios as qualitative or quantitative.
a) In a survey, people were asked to rate their shopping experience as poor, fair, good or excellent.
b) In three trials of a chemical reaction, the volume of acid required was: 3 mL, 4 mL and 3.8 mL.
4. List the steps in the scientific method that must be completed prior to conducting an experiment.
Applying
5. For the following hypotheses, identify the independent variable and the dependent variable.
a) If you spend more time studying, then your results on a Science exam will be higher.
b) If you increase the weight of a model car, then the force at which it hits the wall will be greater.
Analysing
6. A tennis ball is dropped from various heights and a student measures the time taken for the ball to hit the ground. State an appropriate hypothesis for this experiment, using the 'If … then…' framework.
7. A scientist undertook the following experiment.
Step 1. Observed that a pot plant seems to grow better when it is closer to a window.
Step 2. Conducted an experiment where a flowering plant was placed on the windowsill and a cactus was placed in a dark room. The flowering plant was watered, and the cactus was not. The flowering plant was also given fertiliser, but the cactus was not.
Step 3. Collected the data and concluded that plants grow better when they are exposed to more sunlight.
a) Identify a mistake in the scientist's method.
b) Describe whether this was a fair test.
Evaluating
8. Evaluate the method used by the scientist in the pot plant experiment in Question 7. What changes could you make to ensure it was a fair test?
1.3 The laboratory
Learning goals
At the end of this section, I will be able to:
1. Identify hazards and symbols in a science laboratory.
SAMPLEPAGES
2. Identify and draw common laboratory equipment.
3. Describe how to safely light a Bunsen burner.
4. Describe how to minimise errors when using scientific equipment and measuring tools.
Many types of scientists work in scientific laboratories (or 'labs' as they are sometimes called). In this section we will explore the hazards, equipment and rules of the laboratory and ensure you are ready to start conducting experiments.
laboratory safety basics
The laboratory can be a dangerous place if you do not follow the safety rules, or if you misuse the equipment. In your science classes in school, you could get burned, be exposed to dangerous chemicals or cut yourself on broken equipment. Therefore, it is important to know the rules and ensure you are using the correct personal protective equipment (PPE), such as lab coat, safety glasses and gloves.
Figure 1.15 A scientist wearing PPE (lab coat, safety glasses and gloves)
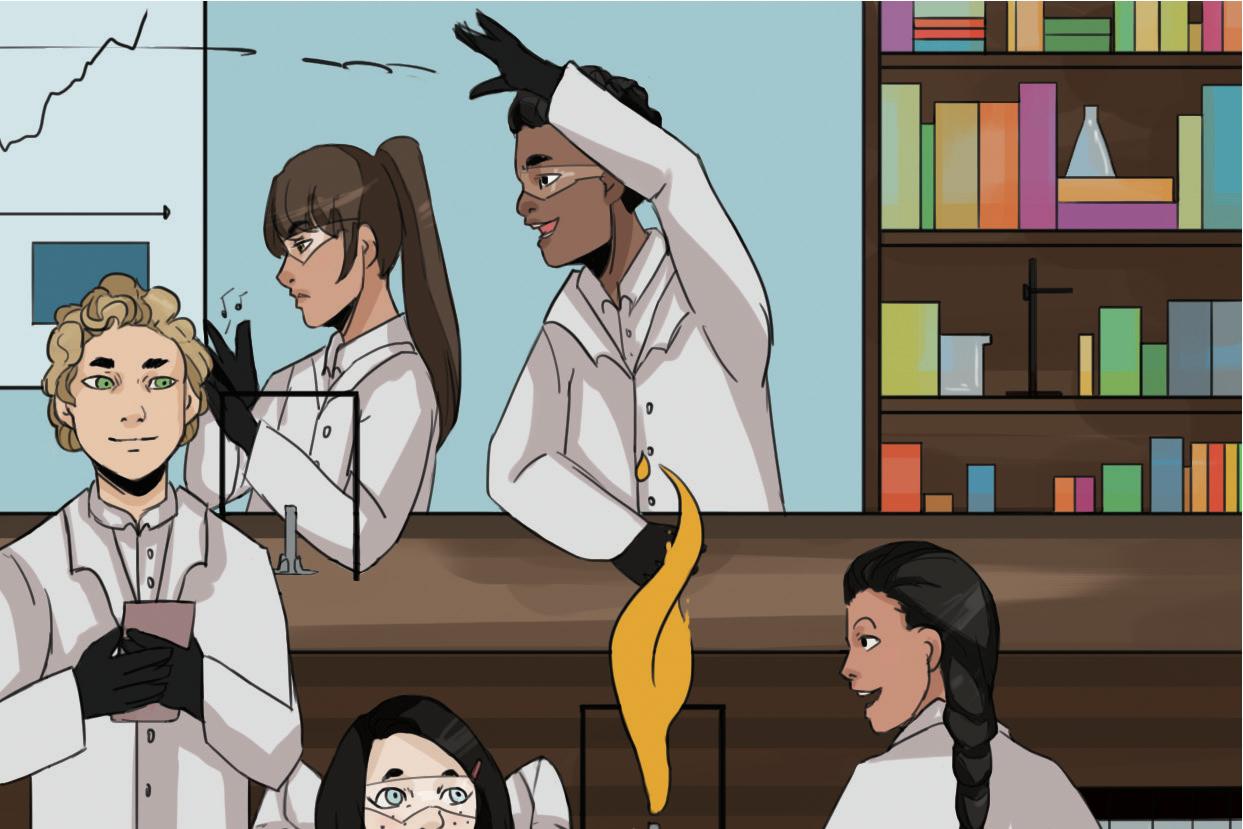
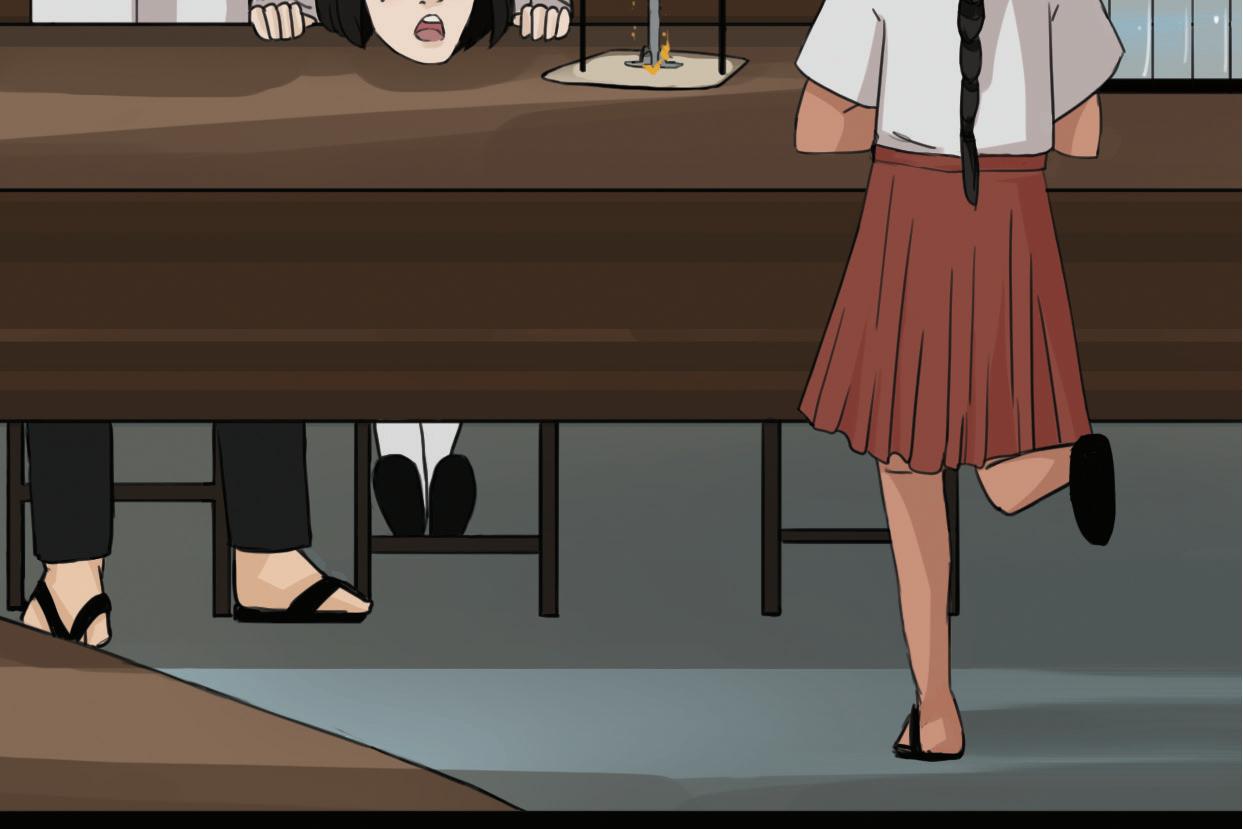
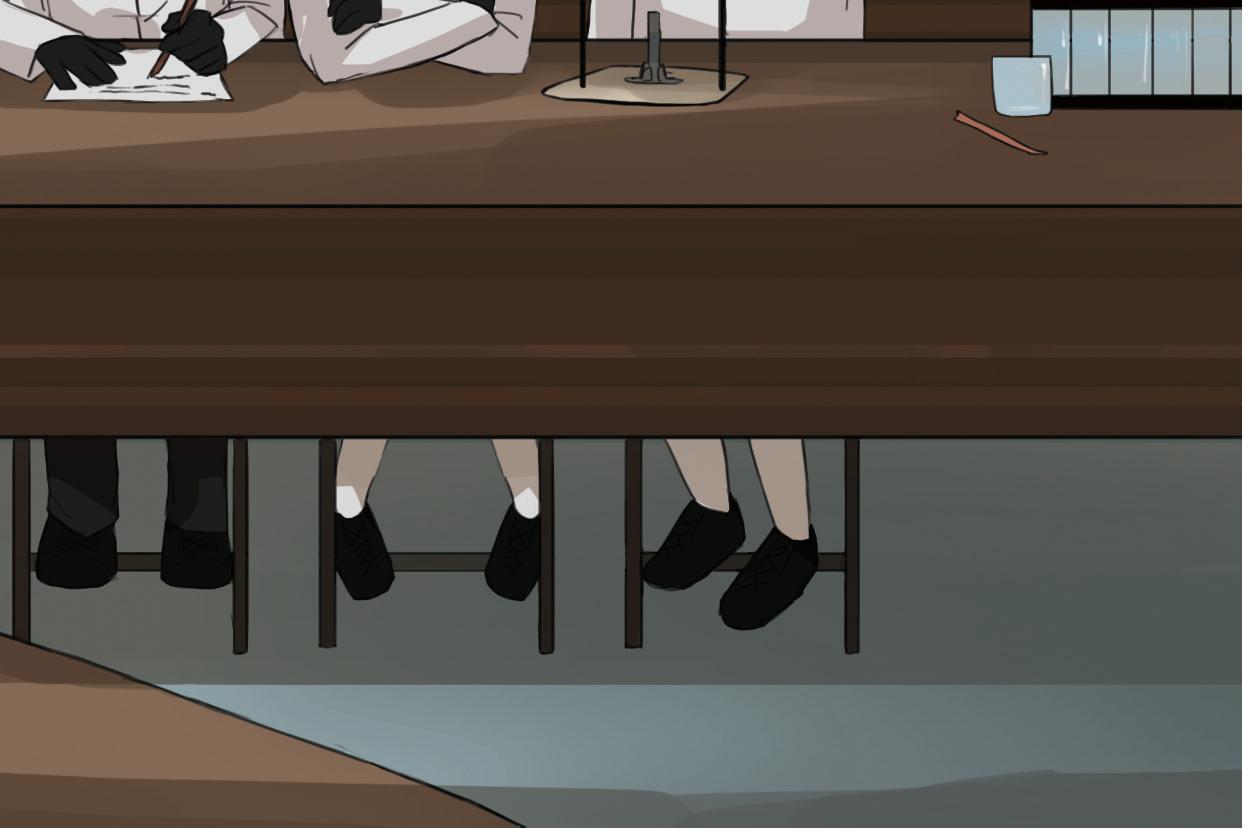
In Figure 1.16, spot the differences between the students who are ignoring the rules (top image) and those following the rules (bottom image). The class in the top image is making seven dangerous mistakes. Suggest what they might be. (The answers are on page 26.)
SAMPLEPAGES
Figure 1.16 Good lab safety is essential. Spot the differences between these images.
hazard a piece of equipment or situation that could cause harm
Did you find all the lab safety issues in Figure 1.16? The lab safety rules are as follows:
• When you are handling chemicals or glassware, always wear safety glasses over your eyes (not on top of your head). Chemicals and broken glass can damage your eyes.
• Always wear a lab coat, which can protect your school uniform from stains and your skin from harmful chemicals.
• If you are given rubber gloves by your teacher, wear them at all times. These will protect your hands from harmful substances. Always wash your hands after you have removed your gloves, to be extra safe.
• Always wear enclosed footwear to ensure that nothing can fall onto your feet and hurt you.
• Whenever you are using a Bunsen burner, use a safety mat/heatproof mat to prevent damage to the bench and other equipment. Always turn off the Bunsen burner when not in use.
• Always follow your teacher's instructions.
• Never eat or drink in a lab.
When you are in the lab, it is important to be observant and on the lookout for any potential hazards. Common hazards in the lab are something that you could trip or slip on, or cut or burn yourself with. If you see a hazard, it is important to make your teacher aware of it as soon as possible to prevent anyone from getting hurt.
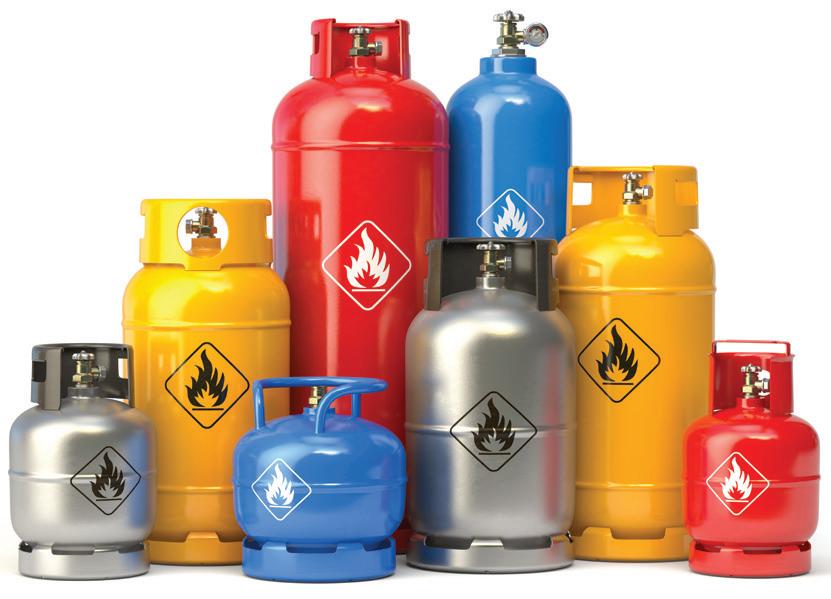
hazard symbols
If you are using a hazardous chemical in the lab, it will have a hazard symbol on the container. The hazard symbol provides details on what type of risk the exposure to the chemical may cause to humans. These risks range from irritating the skin to exploding! Common hazard symbols are detailed in Table 1.2.
Name of hazard
Corrosive
Symbol: Corrosion Symbol: Corrosion This chemical causes skin corrosion/burns or eye damage on contact, or is corrosive to metals.
Sodium hydroxide Hydrochloric acid
Health hazard
Also used to show substances that are hazardous to the ozone layer
SAMPLEPAGES
Flammable
Table 1.2 Chemical hazard symbols
Symbol: Exclamation mark Symbol: Exclamation mark This chemical will cause immediate skin, eye or respiratory tract irritations. Many acids and alkalis
Symbol: Flame Symbol: Flame This chemical will catch fire easily. Ethanol Hexane
Name of hazard
Hazardous to the environment
Symbol: Dead tree and fish Symbol: Dead tree and fish
Explosive
Symbol: Exploding bomb Symbol: Exploding bomb
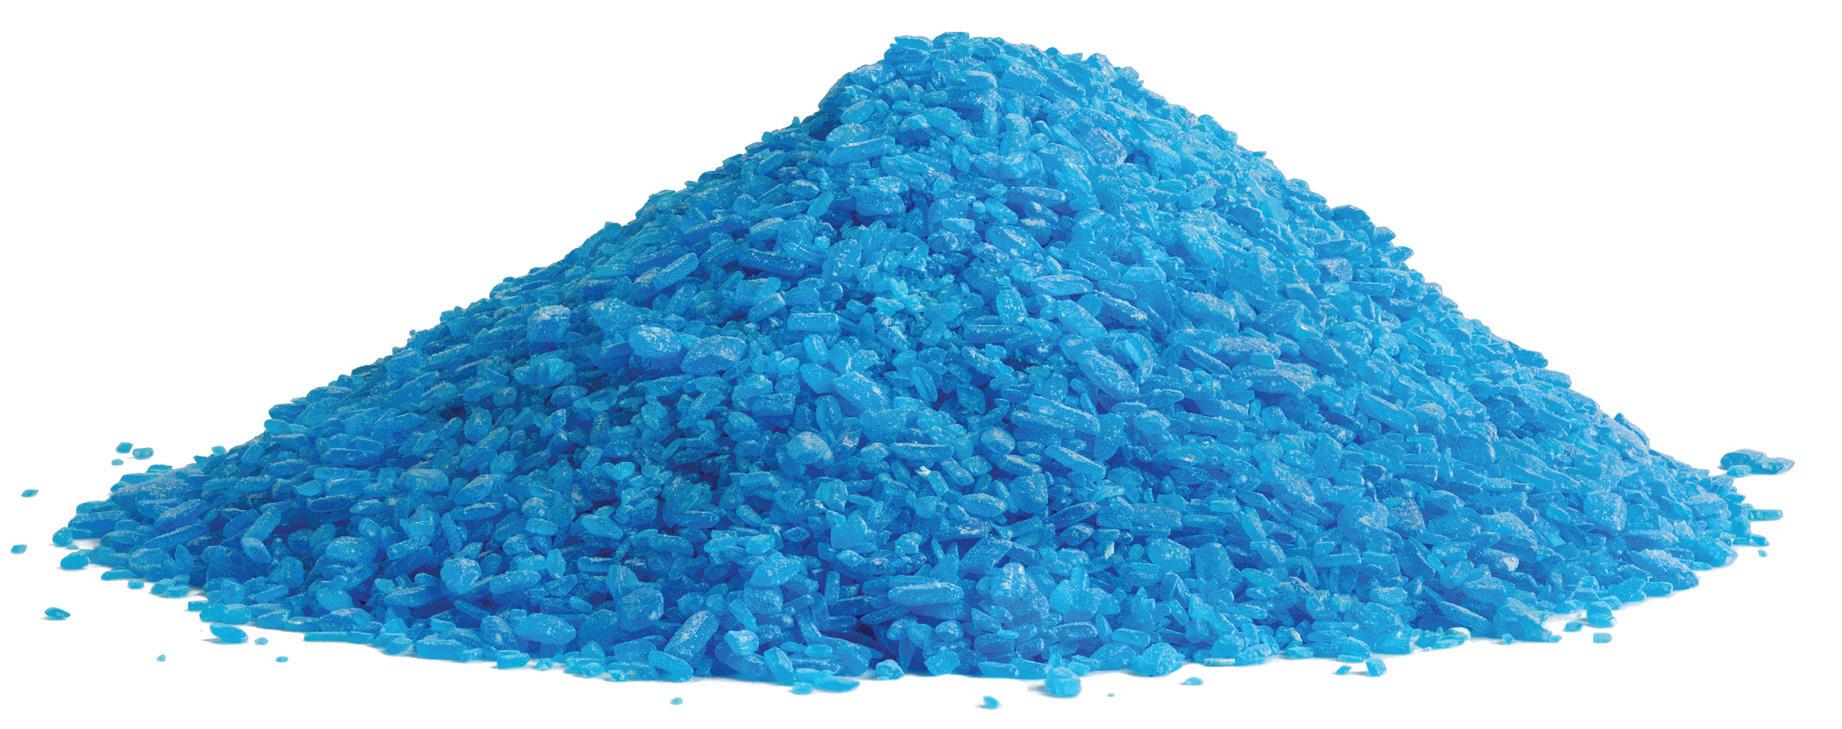
The chemical will cause damage to living things in the environment, especially in soil, waterways or the atmosphere. Copper sulfate
SAMPLEPAGES
Oxidising
Symbol: Flame over circle
Symbol: Flame over circle
This chemical is an explosive at risk of exploding, even without exposure to air. Potassium Lithium
Acute toxicity
Symbol: Skull and crossbones Symbol: Skull and crossbones
Serious health hazard
Symbol: Health hazard Symbol: Health hazard
These chemicals contain or act like oxygen, which causes other substances to burn or react more.
Potassium permanganate Nitric acid
This substance will cause severe illness or death if it enters the body. Mercury Lead
Gas under pressure
Table 1.2 (continued)
Symbol: Gas cylinder Symbol: Gas cylinder
This chemical can cause serious long-term health hazards such as damage to organs, cancer or genetic defects if it is swallowed or enters airways. Turpentine Petrol
These gases are stored under pressure and may leak, causing fire, poisoning, corrosion, suffocation or 'ice burns'.
Scientists use the information that hazard symbols provide when they are carrying out a risk assessment before conducting their experiment. Risk assessments show the hazard, the risk that the hazard poses and a way of managing those hazards. Examples are shown in Table 1.3.
Type of hazard
Glass
Biological
Chemical
Risk Assess Control
There are many pieces of glass equipment in the lab. Glass can get hot, form sharp edges that can cut if broken, and can also be heavy.
Biological material, such as organs for dissection, bacterial cultures, microbes or plants, are studied in the lab.
Any living or dead specimen could contain microorganisms that can make you sick.
You will use many chemicals for experiments. Some chemicals can be toxic, corrosive or irritate your skin.
• Always place glassware in the centre of the bench on a flat surface.
• Allow to cool before handling.
• Inform your teacher of any breakages and avoid any broken glass.
SAMPLEPAGES
• Wash your hands thoroughly.
• Wear gloves when your teacher tells you to.
• Dispose of all biological material as outlined by your teacher. Sometimes this material must not go into normal rubbish bins.
• Always wear gloves and safety glasses, and wash your hands.
• Keep chemicals away from your mouth and eyes.
• Dispose of chemicals as outlined by your teacher. There may be a special bin to put these in, as some must not go down the drain.
Quick check 1.4
1. State the first thing you should do if you see a hazard in the science lab.
2. Recall the name of the safety equipment that will protect your eyes.
3. Sketch a hazard symbol that would be found on a bottle of highly flammable propanone.
laboratory equipment
Experiments should be safe, fair and precise. One of the ways we can achieve this is by selecting and using the correct equipment. For example, some laboratory glassware is used for simply holding liquids (a beaker), and some is used to accurately measure volumes of liquid (a measuring cylinder). Table 1.4 shows some common pieces of laboratory equipment, as well as how to draw them in two dimensions (2D). We draw equipment in 2D (length and width, not depth) in order to simply show the experimental set-up so that other scientists can replicate it. This is called a scientific drawing, and we use them in practical reports.
Table 1.3 Risk assessment table
There are several rules to follow when creating a scientific drawing:
• Use a sharp grey lead pencil.
• Use a ruler to draw straight lines (no freehand).
• Only draw in 2D.
• No shading or colouring in.
Equipment
What it is used for
BeakerA common piece of equipment in most labs. It comes in many sizes and is generally used for holding, mixing and heating liquids.
Conical flaskThis is similar to a beaker but its shape is different to reduce the likelihood of liquid spilling. It can be used to swirl liquids and prevent hot liquids from boiling over.
Test tubesThese are used for holding small amounts of substances. As they do not have a flat bottom, a test-tube rack is used to hold them.
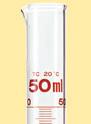
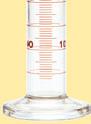
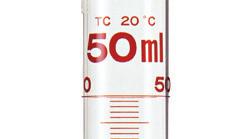
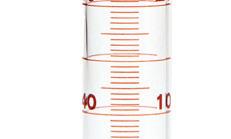
Measuring cylinder This is used to accurately measure volumes of liquids. It must not be used to mix or heat liquids.
How it looks How it is drawn
SAMPLEPAGES
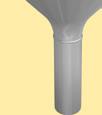
burnerThis is a common device used to add a controlled amount of heat to an object.
Tripod This is used to hold an object above a Bunsen burner flame while it is being heated. A wire gauze mat usually sits on top of the tripod.
Bosshead clamp and stand A retort stand and bosshead clamp are used to hold objects in place while testing.
Table 1.4 Common laboratory equipment
Bunsen
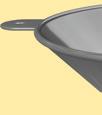
Funnel This can be used to make it easier to transfer liquids into containers with narrow openings, or to separate substances in filtration.
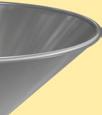
Evaporating dish This is used to heat up and evaporate small amounts of liquid. It sometimes has a small spout on one side.
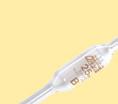
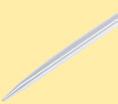
PipetteThis is used for accurately measuring very small volumes of liquid. It is often used with a pipette bulb for producing suction.
Fire and flame
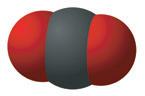
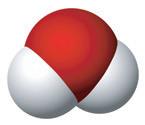
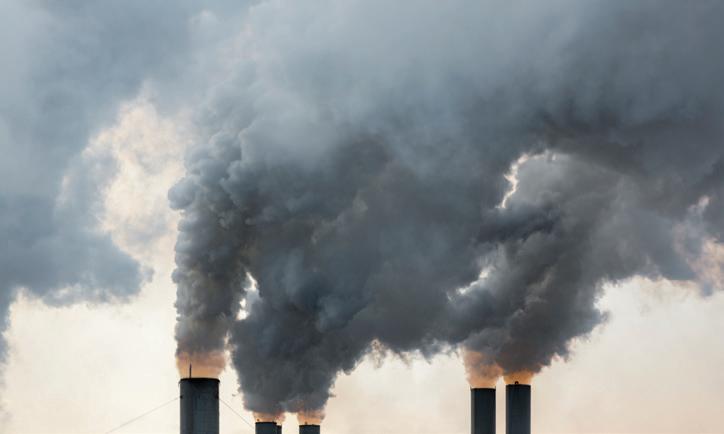
Fire is a chemical reaction, known as a combustion reaction. It occurs when a flammable material is ignited, and it produces carbon dioxide and water and releases heat. There are three necessary 'ingredients' for a fire: oxygen, heat and fuel. This can be represented by the fire triangle (see Figure 1.17). A fire will continue to burn as long as the three ingredients are present.
Fire and flames are a common hazard in the laboratory. An understanding of the fire triangle can help you manage the risk, because each side of the triangle represents a way the fire can be interrupted to extinguish it.
SAMPLEPAGES
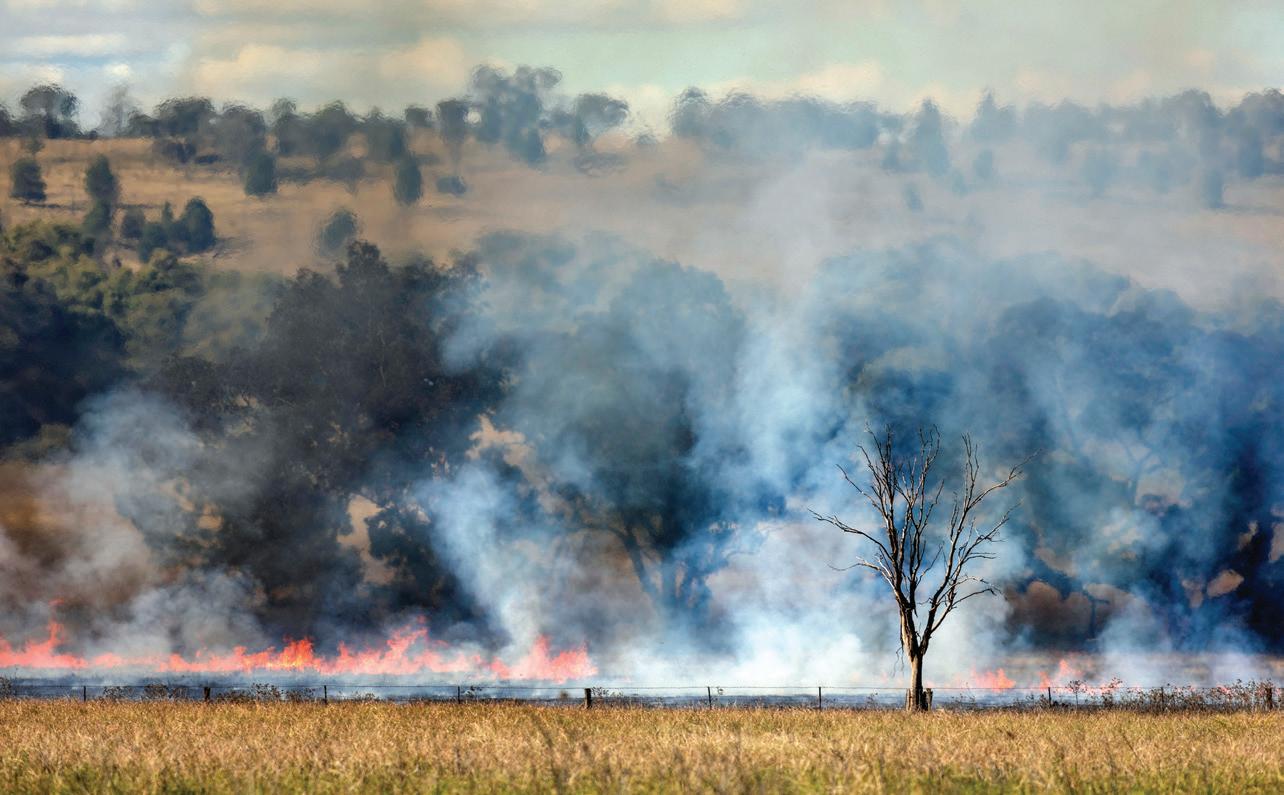
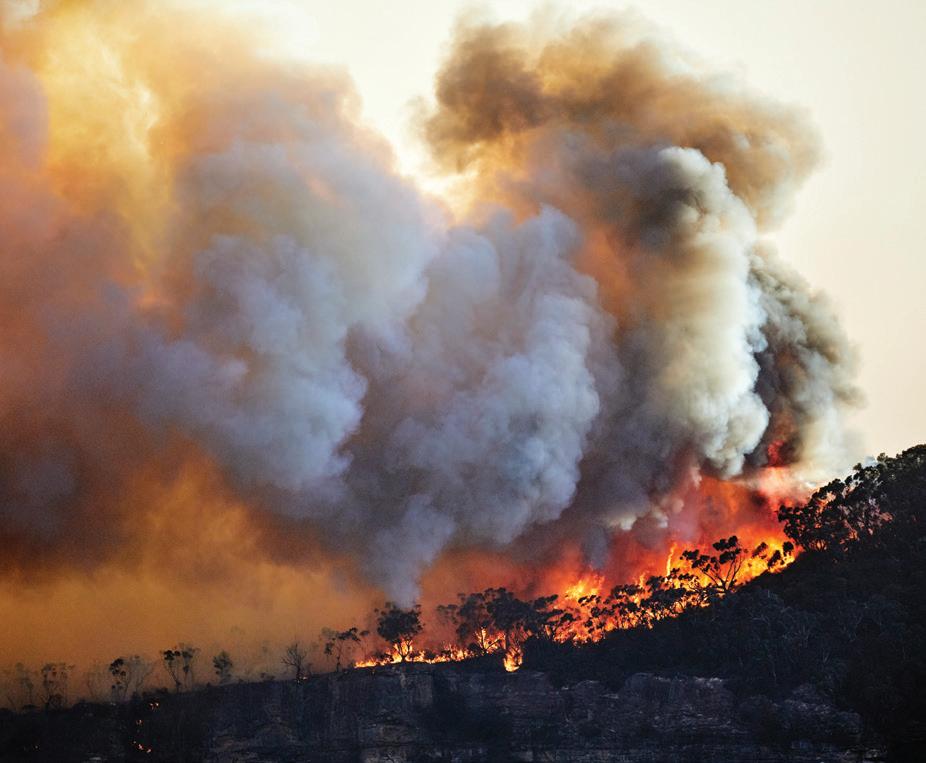
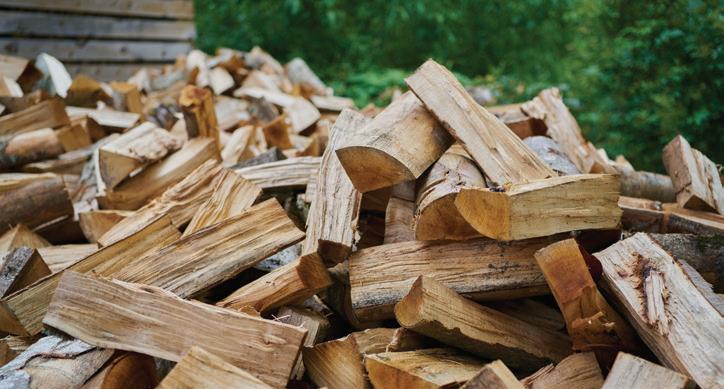
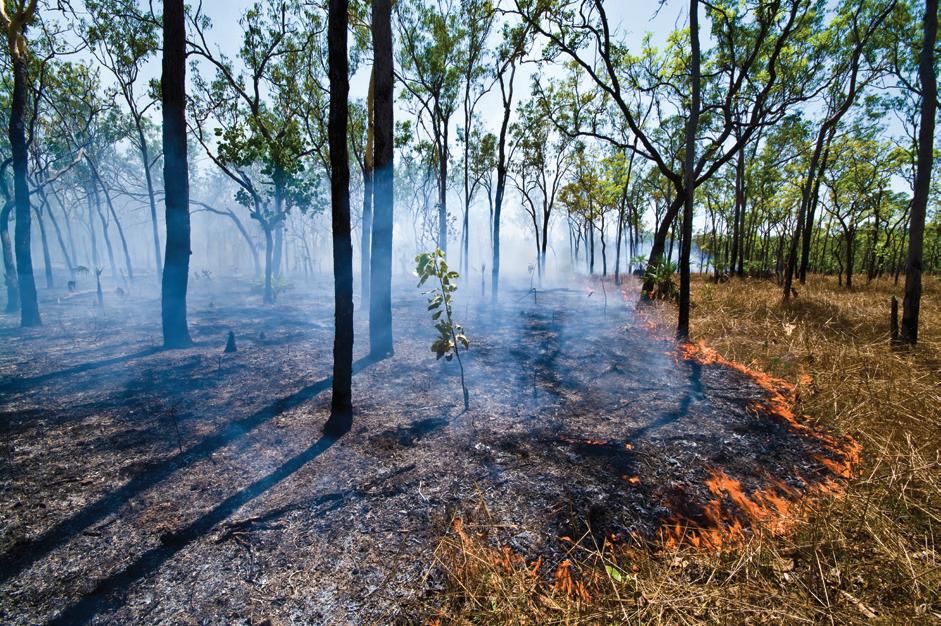
Fuel: When a fire runs out of fuel, it will naturally extinguish. Bushfires are dangerous when a high fuel load (leaf litter and shrubs) is allowed to accumulate. In the laboratory, turning off the gas at the tap reduces the fuel.
Heat: Spraying water on a fire reduces the heat. Water fire extinguishers should never be used on electrical fires or flammable gases.
Oxygen: Smothering a fire with a fire blanket limits the oxygen it receives. Specialised extinguishers such as foam, CO2 and dry powder extinguishers displace the oxygen and smother the flames.
Try this 1.4 Candle flames
Materials: Candle, matches/lighter, glass that is several centimetres taller than the candle
Method: Light the candle with the matches/lighter. Place a glass over the lit candle and observe what happens to the flame.
1. Which side of the fire triangle have you interrupted?
Repeat the experiment, but this time remove the glass just before the flame is extinguished.
2. Explain your observations with reference to the fire triangle.
3. List two ways you could smother a flame in the laboratory setting.
Table 1.4 (continued)
Fuel O2Oxygen Heat
Figure 1.17 The fire triangle shows the three necessary ingredients of a fire.
The Bunsen burner
Often in the laboratory, you will be required to heat materials in glassware such as a beaker. There are different types of heating equipment, but a Bunsen burner is normally used in secondary school classrooms. Although Bunsen burners do not all look the same, they all have the same parts, as shown in Figure 1.18.
Flame (outer cone)
Flame (inner cone)
Airhole (sometimes called a vent): when the airhole is open, more oxygen enters the barrel and so the flame grows hotter
Base: a circular piece of metal that stabilises the Bunsen burner
Heatproof mat: protects the bench
Figure 1.18 The parts of a Bunsen burner
Using a Bunsen burner
SAMPLEPAGES
Barrel (sometimes called a chimney): tube-like structure where the gas and air mix
Collar: a metal covering that can be adjusted to either cover or open the airhole
Rubber tubing: a tube that attaches the Bunsen burner to the gas tap
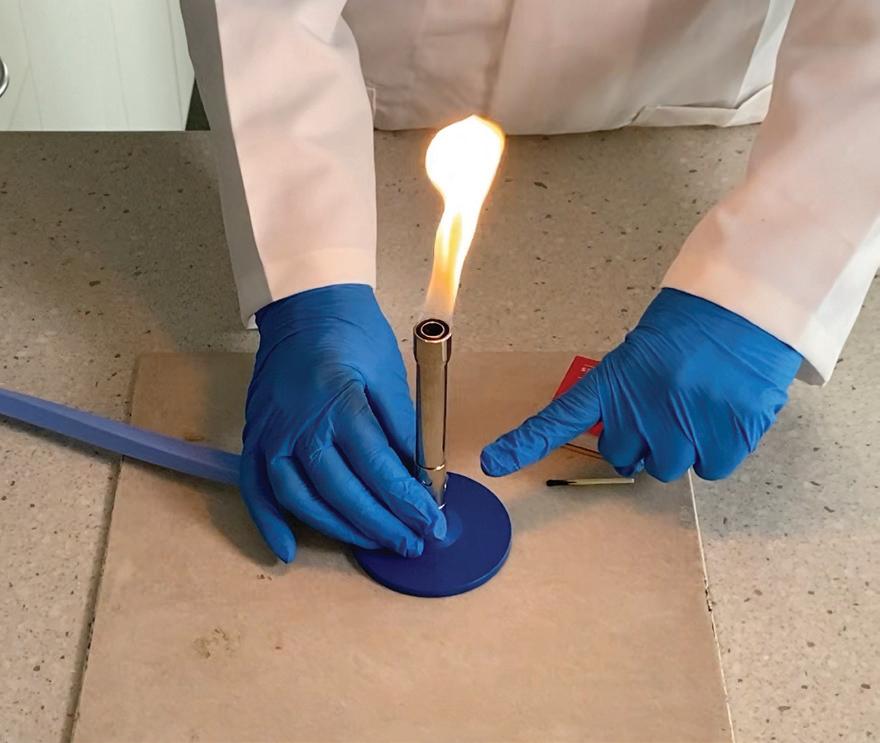
The temperature and intensity of the Bunsen burner flame can be controlled by changing the size of the airhole near the base. This is adjusted by turning the collar. Before lighting a Bunsen burner with a match, you should always ensure the airhole is closed. This limits the amount of oxygen that can mix with the gas and produces a less hot, yellow-coloured 'safety flame' (see Figure 1.19b). The flame is easier to see than the hotter blue flame, which is used for heating purposes. When you are ready to begin heating, open the airhole to allow more oxygen in, producing the hotter blue flame.
Be careful
Remember these important safety points when using a Bunsen burner.
• Tie long hair back and secure loose clothing such as ties.
• Roll up sleeves if they are too long.
• Place the Bunsen burner on a heatproof mat.
• Ensure the airhole is closed prior to lighting.
• Always check the gas hose for damage prior to use.
• Never leave the Bunsen burner unattended. Use the yellow safety flame when not heating.
• Wait for all equipment to cool down before handling it or putting it away.
Practical 1.3
using a bunsen burner
Aim
To practise the safe procedure for lighting a Bunsen burner.
Materials
• Bunsen burner
• heatproof mat
• matches
Method
SAMPLEPAGES
Be careful
Ensure general fire safety measures are observed. Ensure appropriate personal protective equipment is used when handling hot equipment.
1. Check that the rubber tubing is intact, with no damage.
2. Attach the Bunsen burner rubber tubing to a gas tap.
3. Ensure the Bunsen burner hole is closed to give a safety flame.
4. Strike a match away from your body.
5. Turn on the gas.
6. Bring the match up towards the tip of the barrel mouth to light the flame.
7. Shake out the match and place on the heatproof mat.
8. When heating anything, twist the collar to open the airhole and produce a blue flame.
9. When the Bunsen burner is not being used for heating, twist the collar to close the airhole and produce a yellow safety flame.
10. At the end of any Bunsen burner practical, ensure the gas is turned off. Allow the Bunsen burner to cool down before packing it away.
Discussion: Evaluation
1. Explain why the airhole is closed before you turn on the Bunsen burner.
2. Explain why a match is struck away from the body.
3. Explain why the blue flame is used when heating an object.
VIDEO
Practical 1.3
Using a Bunsen burner
Figure 1.19 (a) The Bunsen burner's blue flame is produced when the airhole is fully open, allowing more oxygen to mix with the gas. The hottest part of the flame is the lighter blue inner cone. (b) When the airhole is closed, less oxygen is available and a less hot, yellow 'safety flame' is produced.
Practical 1.4
heating water
Aim
To identify and use the appropriate equipment for pouring and heating water.
Materials
• 250 mL beaker
• boiling tube (large test tube)
• evaporating dish
• pipeclay triangle
• stopwatch
• Bunsen burner
Method
Be careful
Ensure general fire safety measures are observed. Ensure appropriate personal protective equipment is used when handling hot equipment.
• tripod
• gauze mat
• heatproof mat
• test tube tongs
• 250 mL measuring cylinder
The diagrams in Figure 1.20 show how to set up your equipment for each test.
SAMPLEPAGES
Beaker Gauze mat
Tripod Bunsen burner
Heatproof mat
Set-up 1
Pipeclay triangle
Figure 1.20 Experimental set-ups
1. Add 50 mL of water to a 250 mL beaker.
Test tube
Set-up 2
Evaporating dish
Test tube tongs
2. Place the beaker on the gauze mat over the tripod.
3. Light the Bunsen burner and measure the time taken for the water to reach boiling point.
4. Fill the evaporating dish with water to just below the brim, and then pour into the measuring cylinder. Record the volume of water it can hold.
5. Return the water to the evaporating dish and then repeat Steps 2 and 3, balancing the evaporating dish on the pipeclay triangle on top of the gauze mat and recording the time taken for the water in the evaporating dish to reach boiling point.
Set-up 3
6. Half-fill a boiling tube (large test tube). Pour the water into a measuring cylinder. Record the volume of water it can hold.
7. Return the water to the boiling tube and then hold the test tube over a blue flame using wooden tongs. Point the test tube opening away from yourself and anyone else, and move it in a circular motion above the flame until the water boils.
8. Record the time it takes for the water to boil.
continued …
WORKSHEET
Results
Table showing how long it takes water in different containers to reach boiling point
Container
Beaker
Test tube
Evaporating dish
Discussion: Analysis
Volume of water held
Time taken to reach boiling point
Risks when heating?
SAMPLEPAGES
1. Describe any trends in your results.
2. Identify the best piece of equipment for holding and heating a small amount of liquid.
3. Identify the piece of equipment that is easiest to remove some liquid from (pour from).
Discussion: Evaluation
1. Identify any challenges you faced, and state how you overcame them.
Measuring tools
In addition to using specialised laboratory equipment, scientists use measuring tools to collect data during their experiments. Can you recall the measuring tool you have used in practicals so far?
When scientists use tools to collect data, they must first select equipment that is appropriate to the investigation and likely to give accurate readings. Accuracy refers to the closeness of a measurement to the true value. Taking repeated measurements is helpful, because it allows you to calculate the average. This reduces the impact of experimental errors and means the data is more reliable.
Length
You can use a ruler to measure the length of a straight object. You can use measuring tape for a non-straight object, or even a trundle wheel for large distances. It is important to use the most precise tool and unit when measuring. For example, if you were measuring the size of a snail, you would use a ruler and measure in millimetres. If you were measuring the size of a person, you would use a measuring tape and measure in centimetres. If you were measuring the length of the school grounds, you would use a trundle wheel and measure in metres. The ruler has smaller markings and greater precision than the trundle wheel. Some professions use a laser distance measuring tool, which makes even more precise distance measurements. Digital tools tend to generate more precise data.
Figure 1.21 Measuring length: (a) a 20 cm ruler, (b) a trundle wheel and (c) a laser distance measure for precise measurements. Generally, to measure the length of an object, use the metric units millimetre (mm), centimetre (cm), metre (m) or kilometre (km).
Volume and capacity
In mathematics, volume is commonly measured in units of cubic centimetres (cm3) or cubic metres (m3). However, in a laboratory we are usually interested in the volume of liquid that needs to be measured, so we instead use units of capacity, such as millilitres (mL) and litres (L). Volumes can be measured using a measuring cylinder, but if precise measurements need to be made, a special piece of equipment called a pipette can be used.
Temperature
Temperature in a laboratory is usually measured using a thermometer (see Figure 1.24) in units of degrees Celsius (°C). For more precise measurements, a digital thermometer probe can be used. Sometimes, scientists may use digital tools such as sensors that can record environmental data periodically. The sensor can be programmed or attached to software that triggers it to record a measurement every minute, hour or day. This means the scientists do not have to go to the site and do it manually.
SAMPLEPAGES
Time
Scientists use stopwatches for precisely recording time values. Stopwatches are great for measuring time in seconds (s), minutes (min) or hours (h), but they can also be used for experiments lasting days.
Mass
Electronic scales precisely measure mass in the laboratory. The units of milligrams (mg), grams (g) and kilograms (kg) are used to measure mass. Larger masses can be measured in tonnes (1 tonne = 1000 kg). Force meters may also have a reading available for mass.
Figure 1.23 Many weather monitoring stations use data loggers and sensors.
Figure 1.24 The glass thermometer uses 'degrees Celsius' (°C) as the unit. The thermometer with the red liquid is a modern one filled with alcohol, while the thermometer with the grey liquid contains mercury. Why might mercury thermometers have been phased out of production?
Figure 1.22 Measuring volume: (a) a 50 mL measuring cylinder, and (b) a scientist using a pipette to dispense a precise volume of liquid
Practical 1.5
reading equipment
Aim
To practise taking readings using specific pieces of equipment.
Materials
SAMPLEPAGES
Station 1
• spring balances: 100 g, 500 g, 1 kg, 5 kg
• different masses
Station 2
• electronic balance
• sugar cubes × 3
Station 3
• ice cubes × 2
• 50 mL water
• beaker
• thermometer
Station 4
• stopwatch
Station 5
• ruler
• A4 sheet of paper
Method
Station 1
1. Place the mass onto each spring balance and measure the weight of the mass in grams.
2. Record your results in your results table.
Station 2
1. Using the electronic balance, measure the weight of one sugar cube.
2. Keep the sugar cube on the electronic balance and press 'tare' to zero the balance.
3. Add two more sugar cubes and record the weight.
Station 3
1. Place 50 mL of water into a 250 mL beaker.
2. Use the thermometer to measure the initial temperature.
3. Add two cubes of ice, wait for 30 seconds and then measure the temperature.
4. Record your results in the results table.
Station 4
1. Attempt to stop the stopwatch at exactly 2 seconds.
2. Record the results from each attempt.
Station 5
1. Measure the diagonal length of the A4 sheet of paper.
2. Measure the width of the A4 sheet of paper.
3. Measure the length of the A4 sheet of paper.
4. Record your results in mm.
…
Results
Record your results in the table below. The fourth column, headed 'Mean', is for the average of the readings from the three people. To calculate the average, add the three values together and divide by 3.
1. Station 1: Decide when each of the spring balances would need to be used in an experiment.
2. Station 2: Explain why it is important to zero the electronic balance before each use.
3. Station 3: Propose a reason why it is important to think about time when measuring temperature.
4. Station 4: Explain why it is important to do multiple trials and average the results.
5. Station 5: Discuss why millimetres were used for units to measure the paper, rather than metres.
6. If there were differences in the temperatures recorded by different people at station 3, suggest possible reasons for the differences.
Minimising error in the laboratory
Errors are differences between the values we observe and what is true. Errors can cause results that are inaccurate or even false. Random errors are unpredictable and include personal errors (such as the experimenter mistiming something or recording it incorrectly) and limitations in the equipment (such as a beaker with too large a scale). Systematic errors are consistent and may be caused by faulty equipment or problematic methodology. For example, a digital set of scales that is faulty might consistently give a reading that is 1 gram below the actual mass.
Figure 1.25 Using an old, stretched measuring tape will result in measurements that are consistently lower than the true value. This is an example of systematic error.
random error an error that does not follow a regular pattern, and is caused by factors that cannot be easily controlled by the experimenter systematic error an error that causes measurements to differ from the true result by a consistent amount, often due to faulty or uncalibrated equipment
calibrate to check the reading given by a measurement tool against a known standard in order to check the instrument's accuracy
meniscus
the curved surface of a liquid in a container
concave
a surface that curves inwards
convex a surface that curves outwards
parallax error an error caused by not reading a liquid measurement at eye level, which leads to the measurement being too high or too low
Scientists must minimise both random and systematic errors. There are several ways they can do this:
• Maintain equipment to a high standard.
• Calibrate measurement tools by checking them against a known standard.
• Take repeated measurements (preferably by the same person to reduce the impact of their opinion/eyesight/technique).
• Have a large sample size or repeat the measurements/experiment many times. This means that even if there are some random errors, they will be minimised if you calculate the average of the measurements.
Meniscus and parallax error
When measuring liquid volumes in measuring cylinders or pipettes, it is common for the liquid to curve at the top, where the volume is being read. This curve is called the meniscus and it happens when the liquid interacts with the sides of the glassware to make either a concave or a convex shape (see Figure 1.26). Water and water-based fluids, such as milk, produce a concave meniscus. This is because the particles of fluid are more attracted to the container than they are to themselves. A convex meniscus is formed when fluid particles are more attracted to themselves than the container they are in. This happens to mercury when placed in glass.
In your experiments, you will come across both types of meniscus. It is important to know where to take a reading of volume to ensure your measurements are accurate and precise. For a concave meniscus, take the reading from the bottom of the meniscus. For a convex meniscus, take the reading from the top.
ConcaveConvex
SAMPLEPAGES
Take reading from bottom
Take reading from top
Figure 1.26 A concave and convex meniscus
When making a measurement from the meniscus of a liquid, you can also encounter an error known as parallax error. This occurs when you are reading the volume from a meniscus, when the meniscus is not at your eye level. Your eyeline should be parallel with the position that you are taking the reading from (see Figure 1.27). Not doing so can result in inaccurate data being recorded.
Figure 1.27 How parallax error can occur
Quick check 1.5
1. Define the term 'meniscus'.
2. Explain why measurements are taken from either the top or the bottom of the meniscus.
3. Explain how a concave meniscus forms.
4. Describe how you would minimise parallax error.
5. Categorise the following as either a random or systematic error:
a) A thermometer consistently gives a reading 0.4°C above the actual temperature. b) An experimenter rushes and forgets to zero the scale before recording the mass of an object.
Section 1.3 review
SAMPLEPAGES
Go online to access the interactive section review and more!
Section 1.3 questions
Remembering
1. Recall what PPE stands for, and list three pieces of laboratory PPE.
2. State the definition of a hazard in a science laboratory.
3. Identify the hazard depicted in the following symbols: a) Symbol: Corrosion b)
Symbol: Flame
Understanding
4. Explain the steps involved in safely lighting a Bunsen burner.
Applying
5. Explain how calibrating measurement tools can reduce systematic errors during an experiment.
Analysing
6. Categorise the lab equipment listed below according to use. Categories could include 'Heating', 'Measurement tool', 'Container' and 'Other'.
• beaker
• conical flask
• test tubes
• measuring cylinder
• Bunsen burner
Evaluating
• tripod
• bosshead clamp and stand
• funnel
• evaporating dish
• pipette
7. Suggest what a meniscus would look like if the molecules of a liquid inside a test tube were equally attracted to themselves and the glass.
1.4 Communicating your results
Learning goals
At the end of this section, I will be able to:
1. Recognise the links between the steps of the scientific method and the components of a scientific practical report.
2. Appreciate that scientific data can be used to miscommunicate as well as communicate.
effective science communication
Why conduct research? An important part of building scientific knowledge is being able to share it. Scientists must communicate with a wide range of people, from specialists in other scientific areas to members of the public with little knowledge of the topic. Unfortunately, some of the information you find on the internet can be biased, inaccurate or deliberately misused to support a certain opinion or claim. This is why scientists need to carefully select the language they use and the visual representations (such as graphs, tables and images) that they publish.
When sharing data about Aboriginal and Torres Strait Islander people, it's important to explain the impact of colonisation and the history behind the numbers. This ensures the data is understood correctly and prevents it from being misused or taken out of context. When you are researching information about Aboriginal and Torres Strait Islander people, it is recommended that you refer to the AIATSIS website for guidance. This website contains information that can assist you to check that a resource is culturally safe and contains reliable information.
Explore! 1.2
one-in-100-year events
SAMPLEPAGES
The 2022 floods in New South Wales and northern Victoria were labelled a 'one-in100-year' event, but what does that label actually mean? You would be forgiven for thinking that, if you live in the flood-affected region, it means you will now be safe for the next 99 years. But this is not the case. The term actually means that there is a 1 in 100 (1 per cent) chance of the event happening in a given year. While these statistics make sense to mathematicians and scientists, the language can be easily misinterpreted by the public: some people in flood-affected areas have taken to social media to ask why they have suffered multiple one-in-100 year events in their own lifetimes.
There has been a push for governments and planning agencies to recognise the increasing frequency of these extreme weather events, and to update both their models and their ways of reporting risk to the public. Do you think people would have a better understanding of the risk if they were told there was a 1 per cent chance that their house would be flooded each year?
Research the changes that occurred in 2022 to the Victorian fire danger rating scale. Do you think the new categories are clearer in the way they communicate risk to the general public?
Figure 1.28 An aerial view of the flooding in Rochester, northern Victoria, 2022
Scientific practical reports
A structured practical report is a common way to present your findings from an experiment. You will complete these reports throughout your time at secondary school, and you might notice that many of the practical activities in this textbook are set out the same way. A practical report (sometimes known as a scientific report or lab report) should clearly outline the research question or aim, the variables, your hypothesis, materials, method, results, analysis, evaluation and conclusions. In fact, the sections of the practical report closely match the steps of the scientific method.
Scientific methodSections of a practical report
Step 1. Observe and ask questions
Step 2. Do background research
Step 3. Define variables and state a hypothesis
Step 4. Test hypothesis with an experiment
Step 5. Collect and record data
Aim or research question
SAMPLEPAGES
Step 6. Analyse the data
Introduction
Method (includes materials)
Results
Discussion
Step 7. Evaluate the data
Step 8. Form a conclusion
Conclusion
Figure 1.29 Steps of the scientific method matched to sections of a practical report
An example of a practical report follows. It has been annotated to guide you through the process of writing one.
AIM/RESEARCH QUESTION
The research question should be an investigable question. Often it mentions the independent and dependent variables. Sometimes the question (e.g. 'Does drop height influence bounce height?') can be written as an aim (e.g. 'To test the bounce height of a ball being dropped from different heights').
INTRODUCTION
The introduction gives background information, based on your research and prior knowledge. Use reputable sources and provide references. The sentences shown here are an example of what could be included. You should also define the independent, dependent and controlled variables and state your hypothesis.
MATERIALS
List the materials and equipment required (usually as dot points).
METHOD
The method is a numbered step-by-step procedure that would enable someone else to reproduce the experiment. It should detail how the independent variable is being changed and how the dependent variable is being measured. Short, sharp, objective statements are best. You don't need to include steps like, 'Collect your equipment and set up the workspace.' Sometimes the method section includes diagrams to show the experimental set-up (2D drawings; see Section 1.3).
Practical report
Title
Bouncing ball investigation
Aim/research question
To investigate whether balls bounce differently according to the height they are dropped from.
Introduction
Balls have been observed to vary in the height that they bounce back to after being dropped. Research indicates that the drop height may be one factor that affects the bounciness of the ball, along with other factors such as the size of the ball and the materials it is made from. The variables for this investigation are as follows:
Independent variable: drop height (cm above ground)
Dependent variable: height of first bounce (cm above ground)
Controlled variables: ball type, floor surface, room temperature and data collector
Hypothesis: If the drop height is increased, then the bounce height will also increase.
Materials
• tennis ball
Method
SAMPLEPAGES
• 1 metre ruler
1. Hold the ruler at a right angle to the floor.
2. Drop the ball from the first drop height and have a partner visually measure the height of the first bounce.
3. Record results in the table and repeat two more times at this height.
4. Repeat steps 2 and 3 for the second and third drop heights, and then average the results for each height.
Results
Table showing height of first bounce when a ball is dropped from different heights
RESULTS
Present your results in tables and graphs where appropriate.
Discussion: Analysis
The data shows a negative relationship (trend) between drop height and bounce height − as drop height decreases, bounce height also decreases. When dropped from 100 cm above the ground, the average bounce height is 65 cm. This reduces to an average bounce height of 20 cm when the ball is dropped from 30 cm.
Discussion:
Evaluation
The observer taking the measurements was standing in front of the ruler and visually estimating the height the ball bounced back to. This method could be improved by filming the drop, and pausing the video to more accurately determine the bounce height.
Conclusion
From this experiment, it can be claimed that if drop height increases, then bounce height also increases. This was supported by the observations that when dropped from a height of 50 cm, the tennis ball bounced to an average height of 33 cm, whereas when dropped from a height of 100 cm it bounced back to an average height of 65 cm. Therefore the hypothesis is supported by these findings.
CONCLUSION
The conclusion is where you answer your research question, justifying it with some key data that you collected. This will allow you to state whether the hypothesis was supported (it is accepted) or not supported (it is rejected).
References are sometimes included after the conclusion. This is where you record sources of information you accessed, such as articles, books or websites (not yourself, your teacher or your group members).
Section 1.4 review
Section 1.4 questions
Remembering
1. Name the section of a scientific practical report that states whether the hypothesis was supported or not.
DISCUSSION
The discussion includes an analysis of the data and evaluation of the method.
Looking at your data, identify any trends or patterns or relationships. Refer to the data (e.g. the averages) to support any statements you make.
SAMPLEPAGES
Consider your method and any potential errors in your results. Were there any issues with the way you conducted the experiment that could be improved for future investigations? If the data is inconclusive, then perhaps there were more variables that needed to be controlled. The evaluation is not the place to offer your assessment of the activity (e.g. 'I had fun and the experiment was successful.').
2. Name the section of a scientific practical report where you might mention problems you faced and how they could be avoided in the future.
Understanding
3. Explain the meaning of a 'reproducible' method.
Evaluating
4. Justify why you need to be careful when reading scientific information you have found on the internet.
Go online to access the interactive chapter review!
Chapter review
Chapter checklist
Success criteria
SAMPLEPAGES
1.1I can recognise how Aboriginal and Torres Strait Islander Peoples make and record knowledge. 5
1.1I can list different fields of science and state what they study. 4
1.1I can define the roles of group members in a team of scientists. 6
1.2I can describe the steps of the scientific method. 11c, 13
1.2I can identify the different types of variables in a scientific experiment.11a, 11b
1.2I can recognise the difference between quantitative and qualitative data.11d
1.3I can identify hazard symbols and hazards in a laboratory. 1,12
1.3I can identify and draw common laboratory equipment. 3
1.3I can describe how to safely light a Bunsen burner. 9
1.3I can describe different measurement tools and what they are used for.2, 8, 10a
1.3I can describe how to minimise random and systematic errors when using scientific equipment and measuring tools. 7, 10b
1.4I can recognise the links between the scientific method and the sections of a scientific practical report. 11e
Review questions
Remembering
1. Recall three science safety rules and three pieces of personal protective equipment (PPE).
2. List two pieces of equipment that can be used to measure length.
3. Draw the following laboratory equipment: beaker, measuring cylinder, Bunsen burner.
4. State four fields of study in science.
5. State one natural phenomenon that Aboriginal and Torres Strait Islander Peoples have developed a deep understanding of over tens of thousands of years.
6. List three attributes of a good group leader.
Understanding
7. Describe how a convex meniscus is formed.
8. Identify a piece of equipment and an appropriate unit of measurement, that could measure:
a) the length of an ant
b) the weight of a Bunsen burner
c) the volume of liquid in a coffee cup.
9. Outline the steps involved in safely lighting a Bunsen burner.
Applying
10. Part of a measuring cylinder is shown in Figure 1.30.
a) Identify the amount of liquid in the measuring cylinder, and explain your answer with reference to the meniscus. The scale is in mL.
b) A student measured 20 mL of water from a measuring cylinder 10 times. When weighed, the samples of water fluctuated − some were a little above the expected 20 g and some were a little below. Describe whether this is a random error or a systematic error in the measurement, and include a definition of both types of error in your answer.
SAMPLEPAGES
Analysing
11. A student set out to test paper plane wing size and the distance the plane travels.
a) Identify the independent variable.
b) Identify the dependent variable.
c) The student noticed that planes with larger wings appeared to fly higher. She said to her lab partner, 'They must capture more wind.' Categorise this as an observation, an inference or both.
d) The student measured the distance flown in metres using a tape measure, and recorded this. Categorise this measurement as qualitative or quantitative data.
e) The student's lab partner remarked that the experiment was not fair, because they took it in turns to fly the planes and she is a better thrower. Identify which section of the practical report they should discuss this problem with their method.
Evaluating
12. A bottle of arsenic acid requires hazard symbols to warn scientists of the risk of using the substance. Arsenic acid is corrosive, acutely toxic, a health hazard and an environmental hazard. Sketch the hazard symbols that are required on a bottle of arsenic acid. You may want to refer to Table 1.2 in Section 1.3 to aid your response.
13. Create a flowchart showing the steps of the scientific method, using your own words.
Data questions
You can measure 100 mL of water in a measuring cylinder by filling the glassware to the 100 mL line and making sure you read the water level correctly from the bottom of the meniscus. Some Year 7 students measured out 100 mL of water in a measuring cylinder and weighed the amount of water on an electronic balance. They repeated this experiment 10 times. The results are shown in Table 1.5.
Applying
1. The experiment was conducted at a temperature at which 1 mL of water has a mass of 1 g. Use this information to determine what the accurate value for the mass of 100 mL of water should be.
2. Identify two results that would be considered furthest from the accurate value.
Analysing
3. Use the data in Table 1.5 to describe the differences in the collected results.
Evaluating
4. Justify whether the differences in the results identified in Question 3 could be from the measuring cylinder, the electronic balance or both.
5. Infer why there might be considerable differences in the collected data.
6. If the students were to repeat this experiment 10 more times, predict whether the results would change.
1.30
Measuring cylinder with liquid
10104.2
Table 1.5 Mass of 100 mL of water measured in a measuring cylinder and weighed on an electronic balance
Figure
Chapter 2 Classification
SAMPLEPAGES
Introduction
When you fold your laundry, rearrange your locker or organise the files on your computer, you are grouping things based on their similarities and differences in a process known as classification. When we consider the massive diversity of life on Earth, classification systems represent an attempt to group organisms based on their appearance, form, function or genetic similarities. The way we do this differs between cultures and over time, and has evolved with changing technologies. A shared classification system allows scientists all over the world to identify and communicate about organisms efficiently.
Creating and using dichotomous keys
Concept map
SAMPLEPAGES
Classification
Classifying living things
• Systems of classification
• Naming conventions (binomial nomenclature)
Section 2.1
Section 2.2
Section 2.3
Section 2.4
Non-animal kingdoms
Prokaryotes
• Bacteria
• Archaea
Eukaryotes
• Protists
• Plants
• Fungi
Animal kingdom
• Nine key phyla
• Seven key classes
Curriculum content
there are similarities and differences within and between groups of organisms living on Earth; the development and use of classification tools, including dichotomous keys, help order and organise human understanding of the diversity of life (VC2S8U01)
• considering the reasons for classifying organisms, such as for identification and communication
SAMPLEPAGES
• identifying the differences in ways that selected organisms achieve the common requirements for life: movement, respiration, sensitivity, growth, reproduction, excretion and nutrition
• using provided dichotomous keys to identify organisms surveyed on a field trip
• creating and modifying a dichotomous key to classify organisms into groups, and groups within groups
• naming and classifying species using scientific conventions from the Linnaean hierarchical classification system, such as the levels of kingdom, phylum, class, order, family, genus and species
• investigating Aboriginal and/or Torres Strait Islander Peoples' systems of classifying organisms and how these systems differ from the Linnaean system of classification
• researching how biological classification has changed over time through improvements in microscopy
scientific knowledge, including models and theories, can change because of new evidence (VC2S8H01)
• exploring how scientists are re-examining the relationships between organisms to refine the classification of species as they discover new information or interpret evidence in new ways
proposed scientific responses to socio-scientific issues impact on society and may involve ethical, environmental, social and economic considerations (VC2S8H03)
• investigating the contributions of Aboriginal and/or Torres Strait Islander Peoples' knowledges in the identification of medicinal properties of endemic plants, and the ethical, environmental, social and economic implications of others using these knowledges
• investigating the ethical, environmental, social and economic implications of proposed scientific responses that involve cross-cultural partnerships and build on Aboriginal and/or Torres Strait Islander Peoples' land management techniques
data and information can be organised and processed by selecting and constructing representations including tables, graphs, keys, models and mathematical relationships (VC2S8I04)
• constructing dichotomous keys to classify and identify an object from a collection of different objects, for example an assortment of leaves collected in the school grounds, or pooled keys or stationery
Glossary terms
Anomalous
Bilateral symmetry
Eukaryote
Extremophile
Binomial nomenclatureFamily
Biomimicry
Botanist
Cell
Characteristic
Genre
Genus
Hierarchical
Invertebrate
Class Kingdom
Classification
Dichotomous key
DNA
Domain
Ectothermic
Metamorphosis
Microbiologist
Misnomer
Morphology
Non-vascular
Endothermic Order
Organism
Parasite
Phylum
Prokaryote
Qualitative
SAMPLEPAGES
Quantitative
Radial symmetry
Sessile
Species
Taxonomy
Unicellular
Vascular
Vertebrate
classification the grouping of similar objects or organisms together genre a category used to group media such
2.1 Classification
Learning goals
At the end of this section, I will be able to:
1. Explain how classification involves grouping living organisms based on their similarities and differences.
2. Interpret, use and construct dichotomous keys to identify organisms.
SAMPLEPAGES
Classification is the process of organising things into groups based on similar characteristics. You do this every day without even thinking about it.
Imagine visiting a library where all the books were placed randomly on shelves in no order. It would be almost impossible to find what you were looking for! This is why classification is necessary. Libraries split books into fiction and non-fiction and arrange the books by the author's surname from A to Z. They may further separate books into genre
People can also be classified into groups in many ways, based on their personal features. Some are observable, such as age or hair colour, while others are not, such as year level, house group or date of birth.
Making thinking visible 2.1
Think, pair, share: Classification
Look at the shapes in Figure 2.2.
1 Think about and decide how many groups are in the picture.
2 Pair with someone else in your class and share your answer.
3 Compare your answer with others in your class.
4. Discuss why different people may have different answers.
2.2 How would you group these shapes?
The Think, pair, share thinking routine was developed by Project Zero, a research centre at the Harvard Graduate School of Education.
Figure 2.1 Libraries are a place where classification is important; otherwise, how would you be able to easily find the book you need?
Figure
as music, art or books
How to classify
When classifying, you should observe the things being classified and consider their characteristics. This will allow you to then group the things with the most similarities together.
Observable characteristics are things you can see or measure. Consider the toys in Figure 2.3. How might you group them based on their similarities and differences? Which toys share characteristics and are the most alike?
characteristic a feature or quality of something misnomer a wrong or inaccurate name
SAMPLEPAGES
Try this 2.1
observing characteristics
Practise observing the different characteristics or features of living things. Describe the features of each animal shown here and compare your observations with your classmates. Did you observe the same features?
Did you know? 2.1
not actually a bear … or a cat!
Some common names given to animals can be confusing because they suggest something that is not the case. The binturong (Arctictis binturong), commonly known as the bearcat, is neither a bear nor a cat, despite sharing many similarities with both animals. Instead, its closest relative is the genet (Genetta genetta). Some other animal misnomers include the flying fox, honey badger and electric eel. Can you think of any more?
Figure 2.3 Even toys can be classified based on their observable characteristics.
Figure 2.4 A binturong (Arctictis binturong) taking a rest
Figure 2.5 A common genet (Genetta genetta) on a branch
dichotomous key a tool used to identify organisms, where there are a series of questions with only two alternatives organism a living thing
Unlocking classification
Before you explore some of the different ways you can classify in Section 2.2, it is important to understand how to use a tool used by scientists called a dichotomous key. These keys rely on a series of yes/no questions based on observable features and can be used to identify living organisms. The term 'dichotomous' refers to the branching into two that occurs with each question, leading the user to the correct organism name. As users move through the key, each subsequent question becomes more specific, building upon general characteristics.
Figure 2.6 shows six species of snakes found in Victoria. Both the branching dichotomous key in Figure 2.7 and the dichotomous key in Table 2.1 can be used to classify the snakes and determine their names. Imagine you are a scientist researching the eastern bandy-bandy. You have been sent a photo of Organism 3, but you are not sure if it is the eastern bandy-bandy. Begin by using the branching key in Figure 2.7 to classify the snake. Start at the top and, at each step, make a yes/no decision. The key gives you two options at each step, and you should refer to the picture of the snake (Organism 3) that you are attempting to classify. Follow the flowchart, moving on to the next question until you have the name of the snake.
A key can also be drawn as a table. Test whether you get the same answer using Table 2.1. The table shows a step as a question number with two options (e.g. 1a and 1b).
Organism 1
Organism 2
SAMPLEPAGES
Organism 3
Organism 4
Organism 5
Organism 6
Figure 2.6 Some snake species found in Victoria. Use the key in Figure 2.7 to identify them.
Does it have a solid black top?
Yes
Does it have a red belly?
No Yes
Red-bellied black snake Pseudechis porphyriacus
Eastern small-eyed snake Cryptophis nigrescens
No
Does it have white stripes?
Does it have a striped body?
No Yes NoYes
Eastern bandy-bandy Vermicella annulata
SAMPLEPAGES
Question number and answer
1aSolid black top
1bNo solid black top
2aRed belly
2bNo red belly
3aStriped body
3bNo striped body
4aWhite stripes
4bNo white stripes
5aCopper-coloured head
5bNo copper-coloured head
Tiger snake Notechis scutatus
Does it have a copper-coloured head?
Highlands copperhead Austrelaps ramsayi
Eastern brown snake Pseudonaja textilis NoYes
Go to Question 2
Go to Question 3
Red-bellied black snake
Eastern small-eyed snake
Go to Question 4
Go to Question 5
Eastern bandy-bandy
Tiger snake
Highlands copperhead
Eastern brown snake
1. Define the term 'classification'.
2. Explain how a 'dichotomous key' works.
3. Use the dichotomous key of Victorian snakes in Table 2.1 and Figure 2.7 to answer the following questions.
a) List the characteristics of the red-bellied black snake.
b) Identify snakes 1 to 6 in Figure 2.6.
4. Discuss why it is particularly important to classify animals such as snakes.
Figure 2.7 A branching dichotomous key for classifying the Victorian snake species in Figure 2.6
Table 2.1 A dichotomous key in table format to identify the Victorian snake species in Figure 2.6
Quick check 2.1
Creating a key
Here are some things to think about when creating a key.
Characteristics can change over time
Grouping organisms based on their morphology is a common way to classify them; however, this can be problematic. Some physical characteristics, such as hair colour, can vary over an organism's lifetime or even from season to season. Consider your own hair. Is it the same colour now as when you were born? Will it be the same colour when you are 80? You might be classified differently depending on the age you are when someone does the grouping! An example from the animal world is the Arctic fox. In Figure 2.8 you can see the white winter coat that allows the fox to camouflage against the snow and then changes to a grey-brown colour in summer.
SAMPLEPAGES
Making a branching dichotomous key
As a class, discuss some ways to group animals by listing different characteristics. Based on these characteristics, create groups of similar animals, using everyone's favourite animal. Are there different ways you could classify or group the animals? Challenge a classmate to find a certain animal using one of the grouping methods you come up with. Now try to make a branching dichotomous key based on one of the ways you chose to group your animals. Test it on a classmate to see if it works.
Choosing specific characteristics
The Victorian snake key in Figure 2.7 is focused on a specific characteristic of the snakes at each stage. This is important to remember when constructing a key; otherwise scientists may get different answers when they use the same key. Characteristics can be described in a qualitative way, using words or judgements. Quantitative descriptions measure characteristics using numbers, and are more objective. If you designed a key based on the individuals shown in Figure 2.9, you could qualitatively describe their age as young or old. This would not be a dichotomous classification –what someone else calls young may be different from what you call young! Starting your key with 'Is the individual younger than 20?' would be better as there are only two options to choose from in this case, and the answer is clearer.
Try this 2.2
Figure 2.8 An Arctic fox with (a) its winter coat (white), (b) its summer coat (grey-brown) and (c) its coat in moult between winter and summer. It looks like three different animals!
Figure 2.9 People can be described (qualitative) or measured (quantitative). To classify, you need to make sure the characteristic is clear and measurable (i.e. quantitative) where possible. How could you classify these people?
Narrowing down the choices
The feature you use at each stage of the dichotomous key must be unique to the organism that the stage aims to separate. For instance, if you were designing a key to group the organisms shown in Figure 2.10, selecting 'spotted' as a defining characteristic would not allow you to separate them. Whether or not they have antlers would be more useful, as only one of the three does.
SAMPLEPAGES
1. Summarise the main points to remember when selecting characteristics to create a dichotomous key.
2. Define the terms 'qualitative' and 'quantitative'.
3. When making a dichotomous key, discuss why describing the characteristics quantitatively offers an advantage over using qualitative descriptions.
4. In the following table, state an example of a quantitative description that would match each qualitative description for the characteristics.
Figure 2.10 Can you name these spotted animals?
Quick check 2.2
(a) Tiger quoll (b) Chital (c) Oncilla
Try this 2.3
Classifying native fruits
Aboriginal and Torres Strait Islander Peoples use many native fruits for medicinal purposes. Some of these are shown in Figure 2.11.
2.11
1. Classify the native fruits into two groups based on a specific characteristic. Outline the features of each fruit that led you to your classification.
2. Now use the images again to classify these native fruits but this time into three groups. Outline the features of each native fruit that led you to your classification.
3. Ask to see the groups your classmates came up with and compare them with yours.
Try this 2.4
Creating a key for butterflies
Figure 2.12 shows eight different butterflies found in Australia (a–h).
SAMPLEPAGES
Figure 2.12 Eight species of butterfly
1. Observe the butterflies and describe their main differences.
2. Use the main difference between the butterflies to separate them into two groups. Create and label a tree diagram, shaped like the following example, on a piece of paper to show these divisions.
Finger lime Quandong Kutjera
Riberry
Red bush apples
Small leaf tamarind
Figure
Six native Australian fruits
3. Separate each group into two further groups, and then continue until there are eight individual butterflies on the final level of the tree diagram.
4. Use the differences you have identified to construct a dichotomous key for the butterflies.
5. Pass the key to a classmate and get them to use it, to make sure it is easy to follow. In other words, your classmate should end up with the eight butterflies in the same categories at the bottom of the diagram as you intended.
6. After you have tested the key, make any alterations that you need to for it to work. Look at the other keys students have made – did you use the same features as each other when deciding how to separate the butterflies?
7. Explain the main difficulties you faced when you constructed your key.
8. Discuss the reason for any changes you made after testing the key with a classmate.
SAMPLEPAGES
Section 2.1 questions
Remembering
1. Define the term 'classify'.
2. Recall the term given to a key that has two possible options at each stage.
Understanding
3. Explain why scientists need to classify living things.
Applying
4. Identify which three of the following features would be the best options to use when creating a dichotomous key to identify types of animals.
A. Short legs versus long legs B. Smooth scales versus spiny scales
C. Big versus little D. More than 0.65 m long versus less than 0.65 m long
E. Blue spots on wing versus no blue spots F. Dark purple colour versus light purple colour
5. Explain why the shape of an animal may not be the best defining feature to focus on when creating a key. Suggest at least three other features that would be more useful.
Analysing
6. Distinguish between qualitative characteristics and quantitative characteristics.
7. When you are older, you may be interested in buying a second-hand car. Most likely, you will begin your search online on a car sales website. The state you live in might be one of the first things you enter to narrow your search.
a) Elaborate on the other features or characteristics you may need to use to refine your search.
b) Reflect on whether other people would follow the same search pattern.
Section 2.1 review
Evaluating
8. a) Decide whether the following features are good or bad descriptors to use in a dichotomous key for humans.
A. Blue or brown eyes
C. 160–170 cm tall
E. Size 7 shoe
b) Justify your choices.
B. Short hair
D. Likes dogs
SAMPLEPAGES
9. Megafauna are large animals that roamed Earth approximately 2.5 million to 11 700 years ago. The cause of the extinction of Australian megafauna has been argued about for over 150 years, with no agreement being reached. Some researchers argue that megafauna became extinct due to the arrival of the Aboriginal and Torres Strait Islander Peoples. Other researchers suggest that it was due to environmental change.
a) Use the internet to research how large the Australian megafauna in Figure 2.13 were, then create a dichotomous key for them.
b) The following statements have been taken from scientific articles. Categorise them into those that support or those that don't support the idea that Aboriginal and Torres Strait Islander Peoples caused the extinction of Australian megafauna.
i) New methods to directly date bones and teeth of extinct species show that megafauna fossils and Aboriginal tools do not all date from the same period. (They only co-existed for a relatively short period of time.)
ii) Proteins taken from fragments of prehistoric eggshell discovered in the Australian sands confirm that the continent's earliest humans consumed the eggs of a two-metretall bird that became extinct 47 000 years ago.
iii) Extreme climate change causing a loss of water and increased drying drove the extinction of megafauna species.
iv) A diverse collection of fossils have shown that megafauna still survived 47 000 years ago, after humans had spread around the continent.
v) Rock art depicts marsupial lions, giant kangaroos and other megafauna.
vi) Evidence suggests that more than 1000 years of human occupation passed before a rapid warming event occurred, and then the megafauna were extinct within a hundred years.
vii) Drying out of vast inland lakes may have caused Australia's megafauna extinction.
viii) Megafauna had lived through several previous ice ages without any problems.
ix) Low-intensity hunting of Australian megafauna (e.g. the killing of one young mammal per person per decade) could have resulted in the extinction of a species in just a few hundred years.
x) When people arrived in Australia, they altered the landscape with fire so significantly that it drove the megafauna to extinction.
Palorchestes azael Thylacoleo carnifex Simosthenurus occidentalis
Figure 2.13 Six Australian megafauna
2.2 Classifying living things
Learning goals
At the end of this section, I will be able to:
1. Classify a living organism using a hierarchical system.
2. Recognise how biological classification has changed over time.
3. Use scientific conventions to name organisms.
4. Explore classification systems used by many Aboriginal and Torres Strait Islander Peoples.
Is it alive?
One of the most basic ways of classifying is to ask whether something is 'living' or 'non-living'. MRS GREN is an acronym for the processes performed by all living things and is used as a set of criteria to determine whether something is living or non-living. Can you work out what these processes are? The flowchart in Figure 2.14 will give you some clues. However, sometimes it is not so easy to decide whether something is living or non-living. A snake slithering through bushland is obviously living. But some non-living things may also show some of the seven processes of living things. For example, a car can move and it gets rid of waste gases, and crystals can grow when conditions are right.
SAMPLEPAGES
Can it move by itself?
Can it respire (convert food into energy)?
Can it sense and respond to its environment?
it grow?
Can it reproduce?
Does it excrete or get rid of wastes?
Does it need nutrition?
Figure 2.14 A thing can only be classified as 'living' if it shows all seven life processes.
For something to be living, it must show all the seven processes of living things. It is also important to remember that a non-living object is one that has never been alive. Something that is dead used to exhibit all the processes of living things. There are differences in the ways that organisms demonstrate the seven common requirements of life. For example, 'movement' does not simply refer to obvious and intentional movement from place to place, such as a kangaroo jumping across a paddock. It also includes movement such as a plant bending to grow towards a light source, or movements only observable under a microscope, such as a bacterial cell beating its flagella (whip-like tails) or the movement of substances inside cells
Did you know? 2.2
The eighth characteristic of living things
Although MRS GREN is commonly used, there are some issues with it. Fire is non-living, but some people may argue that it meets all seven life processes. See if you can work out how.
It is for this reason that some scientists have named an eighth characteristic: all living things have cells. Perhaps we should we change it to MRS C GREN?
DNA deoxyribonucleic acid, a chemical in the cells of living things that carries genetic information taxonomy a branch of science that groups and names organisms based on their relationships
Quick check 2.3
1. State the characteristics that all living things share and describe an example for each.
2. Explain what non-living means.
3. Distinguish between non-living and dead.
4. Copy and complete the following table.
a) Tick if the characteristic is present.
b) Classify the object as living, non-living or dead.
Object
Fire
Whale
Yeast
Scooter
Squashed
mosquito
Newspaper
Pot plant
SAMPLEPAGES
Tick if the characteristic is present Living? Non-living? Dead?
Did you know? 2.3
are you related to a strawberry?
Every living organism has evolved from a common ancestor. Scientists have discovered this by studying the similarities in Dna. DNA is in every living cell and gives the cell or organism instructions on how to grow and function.
On average, humans share about 90 per cent of our DNA with mice. This is not surprising, because we both have eyes, hearts, legs and many other similarities.
Figure 2.15 Despite similarities in DNA, humans, mice and strawberries are quite different!
This is why mice are used in laboratories for human disease research. However, we humans also share about 60 per cent of our DNA with strawberries. This does not indicate that we are closely related; rather, it shows similarities in the processes inside our cells. Can you see how classifying by DNA might not be the only answer?
Taxonomy
So far, you have learned that classification is the process of sorting things into groups. Now you are going to look at how biologists use classification to identify and name organisms. By grouping organisms based on their similarities and differences, biologists can more easily assign a name to a new species or determine the relationship between different organisms. Taxonomy is the study of relationships between organisms and formally classifying and naming them based on these relationships. Taxonomy used to simply consider the physical similarities between organisms, but now also considers genetic similarities.
Explore! 2.1
aboriginal and Torres strait Islander Peoples' classification systems
The classification systems used by different groups of Aboriginal and Torres Strait Islander Peoples differ in many respects from Linnaean taxonomy (discussed later in this section). Nothing is seen in isolation; rather, everything is interconnected. One common feature of this type of classification is the inclusion of criteria that link the organism's use, age, stage in life cycle, sex, social status and totemic association. 'Totemic' refers to a spiritual connection between a group of people or an individual and a specific animal, plant or natural object.
SAMPLEPAGES
Aboriginal and Torres Strait Islander Peoples may classify plants and animals as edible or inedible, or as totemic or non-totemic. Many living things are grouped based on their use and this can be further grouped based on whether the organism is alive or dead. For example, when the native cherry (Exocarpus cupressiformis) is alive, its sap can be used to treat snake bites, but when dead, its wood is used to make spear-throwers.
Aboriginal and Torres Strait Islander classification systems sort living things into groups based on features such as form and function. These groupings are not always based on relatedness, as they are in contemporary science. Investigate why some Aboriginal and Torres Strait Islander Peoples may classify turtles, barramundi and dugong in the same group.
Did you know? 2.4
When two species become six Australian gliders are a group of marsupials that belong to the possum family. One of the distinguishing features of Australian gliders is their specialised gliding membrane, known as a patagium. This acts as a wing-like structure, allowing gliders to effortlessly glide through the air, often over considerable distances.
In 2020, DNA analysis confirmed that the greater glider and the sugar glider actually comprise three species each, increasing the number of Australian possum species by four. The greater glider has been split into the northern greater glider (Petauroides minor), the central greater glider (Petauroides armillatus) and the southern greater glider (Petauroides volans). The sugar glider is now split into the sugar glider (Petaurus breviceps), Krefft's glider (Petaurus notatus) and the savanna glider (Petaurus ariel).
people, whose Traditional Lands are located west of Melbourne and incorporate areas such as Geelong and Ballarat
Figure 2.16 A carving of Bunjil the eagle, one of the totems of the Wadawurrung
hierarchical where smaller groups are placed within larger groups, with no overlap between groups
kingdom the highest and broadest classification on the Linnaean taxonomic rankings
phylum the taxonomic ranking below kingdom and above class
class the taxonomic ranking below phylum and above order
order the taxonomic ranking below class and above family
family the taxonomic ranking below order and above genus
genus the taxonomic ranking below family and above species
species the most specific taxonomic ranking below genus
Scientists have classified nearly 2 million species on Earth, but current estimates for the number of species that actually exist vary hugely. One widely quoted estimate is that there are 8.7 million species in existence, but other estimates range from 5 million to 1 trillion! There are also many more extinct species to classify. Of the 4 billion species that have existed on Earth, 99.9 per cent are now estimated to be extinct. That's a lot of organisms that scientists need to classify!
Linnaean taxonomy
SAMPLEPAGES
A major step in taxonomy was taken 250 years ago by the Swedish botanist Carl Linnaeus. In his twenties, Linnaeus realised that the classification system used at the time was not working. Animals were being categorised by whether they were wild or tame, or if they were big or small. One scientist classified animals by their usefulness to humans; another by whether they thought the animal was noble. Plants were given names that were overly descriptive. For example, the scientific name for the cutleaf groundcherry during this time was Physalis amno ramosissime ramis angulosis glabris foliis dentoserratis!
At the start of his research, Linnaeus intended to give each plant a name and a number, but quickly realised that this was not going to work. Instead, he sorted organisms into hierarchical groups based on their physical similarities. He called the largest group 'kingdom' and this was then divided into phyla, and so on, all the way to the smallest group, 'species'. An example of this is shown in Figure 2.19. The levels of classification that he developed were kingdom, phylum, class, order, family, genus and species. He classified over 13 000 organisms during his life, and the basis of his classification system is still used today. In fact, Linnaeus is known by many as the Father of Taxonomy.
Figure 2.18 Carl Linnaeus
wallabyquokkapossumplatypusbirdsquid
Species
Classification mnemonics
SAMPLEPAGES
Figure 2.19 Linnaeus's hierarchical classification system: as you move down the levels, the organisms become more similar and share more characteristics.
The order and names of Linnaeus' different levels of classification can be remembered by using a mnemonic device such as King Phillip Comes Over For Great Spaghetti, or Kittens Prefer Cream Or Fish Generally Speaking. Try to make up your own mnemonic to remember each level.
Robert Whittaker
Linnaeus recognised only two kingdoms in his classification system: animals and plants. In 1969, Robert Whittaker proposed a five-kingdom classification system: animals, plants, fungi, protists and monera.
Carl Woese
Carl Woese was a microbiologist who studied the genetic information (DNA) of bacteria and discovered that there were more differences between bacteria than previously known. He noticed that many microorganisms that looked and behaved like bacteria were something entirely different. He called these organisms Archaea.
In 1977, Woese suggested that all life should be classified under three major domains: Bacteria, Archaea and Eukarya. Combined with the five-kingdom model, this created a six-kingdom model, where the kingdom Monera was replaced by Bacteria and Archaea.
microbiologist a scientist who studies very small living things like bacteria domain the highest taxonomic rank above kingdom and even more broad
Arthropoda (insects, arachnids, crustaceans) Echinodermata (seastars and sea urchins)
Annelida (segmented worms) Nematoda (round worms)
Glomeromycetes (soil and plant root fungi)
Porifera (sponges)
Platyhelminthes (flatworms) Rotifera (rotifers)
Cnidaria (jellyfish and corals)
Mollusca (molluscs)
Figure 2.20 The six-kingdom classification of living organisms, with some representative groups within each. Note that there are many more groups than the ones shown, especially in the kingdoms Bacteria, Archaea, Protista and Fungi.
The classification of many species is still being argued over as scientists discover new information or interpret evidence in new ways. Scientists have suggested hierarchical groupings such as empires, superkingdoms and dominions.
Even when species are being classified, arguments can be complex. Species can have their classification changed, but only after a lot of information has been collected. One reason for re-examining species is DNA analysis. This new information can change ideas of how closely two species are related and so change their classification. By analysing DNA, we can see that even things that don't look alike can be classified together.
Research the link between the whale and hippo; the elephant, manatee and hyrax; and the horse and rhino.
Quick check 2.4
1. Define the term 'taxonomy'.
2. Explain why the classification system is constantly being updated.
3. Recall the names of the six kingdoms.
4. Discuss how Woese's proposal changed the way organisms are classified.
Ciliophora
Binomial nomenclature
Another reason for classification is to enable clear communication among scientists. Between the 15th and 17th centuries, scientists usually conducted their work in two languages. When discussing their work in conversation, they used their native language, but Latin was used when writing about their work or corresponding with scientists elsewhere. Latin did not belong to any specific country and scholars worldwide could access it. It essentially became the universal language of the time.
In Linnaeus's classification system discussed earlier in this section, all species were given a specific two-part name using a form of Latin or Ancient Greek. This replaced much longer names such as the one for the cutleaf groundcherry (see Figure 2.21) given previously. Linnaeus renamed it Physalis angulata, from the Ancient Greek phusallís, meaning bladder, and the Latin angulāre, meaning to make angled.
SAMPLEPAGES
By the 19th century, most of the scientists' communication and published work was in French, English or German. By the 20th century, only English was common. However, we still use Linnaeus' system of naming organisms, which is known as binomial nomenclature. The use of a standardised classification system allows scientists to discuss and share information about organisms across different fields and locations, ensuring that scientific knowledge is accurate and consistent.
Why are scientific names important?
Scientific names are rarely used in everyday conversation, as they are often long and difficult to pronounce. Consider the organisms shown in Figure 2.22. Would you be able to identify them by their scientific names, Phascogale tapoatafa, Dendrobium bigibbum and Petroica goodenovii?
So why can't we just use common names all the time? Well, the Cooktown orchid is also known as the mauve butterfly orchid, and the brush-tailed phascogale can be known by its traditional name of tuan, but also as the common wambenger, the black-tailed mousesack or the black-tailed phascogale!
Some common animal names are repeated all over the world but actually refer to completely different species. When European colonial settlers observed the red-capped robin (see Figure 2.22c), which is distributed through much of inland Australia, it is likely that they were reminded of the orange-breasted European robin of their homeland (Erithacus rubecula; see Figure 2.23). In fact, the two birds are not even in the same family.
binomial nomenclature a system of naming in which two names are used to identify an individual species of organism
Figure 2.21 Look at the picture and decide why Linnaeus chose to call the cutleaf groundcherry Physalis angulata
Figure 2.22 (a) Brush-tailed phascogale (Phascogale tapoatafa), (b) Cooktown orchid (Dendrobium bigibbum) and (c) red-capped robin (Petroica goodenovii)
Figure 2.23 European robin (Erithacus rubecula)
How to write scientific names
An organism's scientific name details its genus and species. The genus is written with a capital letter and the species with a lowercase letter. The whole name is in italics (or underlined if you're writing it by hand).
e.g. Eastern grey kangaroo = Macropus giganteus
Genus species
SAMPLEPAGES
Common nameFawn-footed melomys
KingdomAnimal
PhylumChordate
Class Mammal
Order Rodent
Family Muridae
Genus Melomys
Species cervinipes
Scientific name Melomys cervinipes
Table 2.2 Although this animal is known by the descriptive common name of fawn-footed melomys, Aboriginal and Torres Strait Islander Peoples may know it as corrill, recorded from Minjerribah in Queensland, or cunduoo, recorded from Richmond River in New South Wales.
As you can see in Figure 2.24, organisms in the same genus are often similar. The four frogs from the genus Limnodynastes (meaning 'Lord of the marshes') are native to Australia, southern New Guinea and some Torres Strait Islands. However, there are observable differences between the frogs, so they are classified as different species and the second part of their scientific name differs. Two animals are only considered to be the same species if they have the ability to reproduce and the offspring are viable and fertile (meaning they can also reproduce). Infertile 'hybrids' are the result of members of the same genus reproducing. Examples are ligers (see Figure 2.25) and mules. A mule is the offspring of a horse and a donkey. A mule inherits characteristics from both its parents – it is the size of a donkey but it has the strength of a horse, making it useful as a pack animal.
2.25 The hybrid liger is the largest feline, born from breeding a male lion and a female tiger.
Look up the following scientific names of some Australian mammals. Use the internet to find out their taxonomic classification (kingdom, phylum, class, order, family, genus and species). Can you determine which species are more closely related to each other? How does their classification tell you this?
• Potorous tridactylus
• Tachyglossus aculeatus
• Sminthopsis murina
• Planigale ingrami
Did you know? 2.5
assassin flies: The new Marvel avengers
• Pseudantechinus mimulus
• Notamacropus agilis
• Ornithorhynchus anatinus
• Planigale maculata
SAMPLEPAGES
Scientists are struggling to keep up with the discovery of many thousands of new bacterial species. The traditional method of naming has left a backlog of 50 000 species to be named. Scientists have designed an AI-powered computer system that was taught the grammatical rules of Latin, allowing it to generate fake Latin names for these unnamed species.
Naming in a traditional way can be fun. CSIRO scientists have named five newly discovered flies in Australia after characters from the Marvel universe. All five species are robber flies, which are assassins of the insect world. Four of the flies are shown below.
Scientific nameMarvel character Translation
Daptolestes bronteflavus
Daptolestes illusiolautus
Daptolestes feminategus
Humorolethalis sergius
Quick check 2.5
Thor Blonde thunder
Loki
Elegant deception
Black Widow
Woman wearing leather
Deadpool
Derived from the Latin for humorosus, meaning wet or moist, and lethalis meaning dead. It also sounds like 'lethal humour'.
1. Define the term 'binomial nomenclature'.
2. When looking at a list of scientific names, describe how you would know which organisms were most similar.
3. Discuss some of the difficulties scientists would experience if they only used the common names of organisms.
4. State two reasons why we classify organisms.
Try this 2.7
Taxonomy exercise
Find out the kingdom, phylum, class, order, family, genus, species and scientific name of the platypus. Then, in a table, research and list the characteristics of a mammal in one column, a bird in another column and a reptile in a third column. Complete some research into the characteristics of the platypus. Now use your table to highlight which characteristics the platypus shares with mammals, birds and reptiles.
SAMPLEPAGES
animals that do not fit the mould
Some animals are so unusual that they are difficult to fit into the taxonomic groups. One example you will be familiar with is the platypus. When scientists at the British Museum first saw a platypus that was sent to them in the late 18th century, some of them thought the specimen must be a hoax. With morphology like an otter, but with the bill of a duck, the tail of a beaver, webbed feet and the ability to lay eggs, the platypus displays features common to mammals, birds and reptiles, all in one creature. The platypus was named Ornithorhynchus anatinus, meaning 'bird-snouted flat-foot'.
The platypus was placed in the class of mammals, but in an order called Monotremata, alongside the echidnas. Monotremes are a unique group, as they differ from the mammals which give birth to live young. Instead, monotremes lay eggs. They also produce milk for their young by secreting it from pores on their stomachs.
Creating an animal
In this activity you will create a new animal. You may draw it or use an online app.
1. Obtain sketch paper and pencils or search for 'make new animals' on the internet.
2. Draw your animals or use an online animal building tool (e.g. Switch Zoo) to create a new animal with features of many different types of animals.
3. Take a photo or screenshot of your creation and then create a description of the animal. Your description should include:
• name of animal
• how it uses the features you have chosen
• habitat: aquatic, terrestrial or both
• warm blooded or cold blooded
• behaviours
• how its offspring are born
• diet
• how long it lives.
4. Classify your animal into a group (insect, bird, mammal, reptile, etc.).
5. Using your description, justify why you classified your new animal as you did.
Figure 2.26 (a) An adult echidna and (b) two baby platypuses (known as puggles) sucking from pores on a milk patch on the mother's belly
Section 2.2 review
Section 2.2 questions
Remembering
1. Name the person who is often called the 'father of taxonomy'.
2. Recall the six kingdoms.
3. State the seven characteristics of living things.
4. State the seven levels of Linnaean classification, from general to specific.
5. The scientific name for the Australian common bluetail damselfly (see Figure 2.27) is Ischnura heterosticta Identify the country or countries in which this name is used.
Understanding
6. Recall the main problems with the classification system that was used before the Linnaean system.
7. Recall what you have learned about scientific names.
Applying
Go
SAMPLEPAGES
8. Imagine you saw a platypus in the wild for the first time. Describe how you would classify it and why.
Analysing
9. Critique the way the following binomial names have been written:
• calyptorhynchus lathami
• Litoria Cooloolensis
• ornithoptera Richmondia
• Grantiella picta
Evaluating
10. Predict how closely related each fish in Figure 2.28 is to the clownfish on the left, based on physical characteristics. Give reasons for your answer.
Figure 2.28 Clownfish (at left) and other tropical fish
Figure 2.27 The common bluetail damselfly is found throughout Australia.
2.3 Non-animal kingdoms
DOC
WORKSHEET
Kingdoms
VIDEO
Kingdoms
Archaea, Bacteria and Protista
VIDEO
What are archaea?
unicellular consisting of one cell
prokaryote a unicellular organism that lacks a nucleus eukaryote an organism whose cells contain a nucleus extremophile an organism that thrives in conditions of extreme temperature, pH or chemical concentration
Learning goal
At the end of this section, I will be able to:
1. Distinguish between (or list) the six kingdoms of living organisms.
Most living organisms on Earth are unicellular, meaning they exist as single cells. Unicellular organisms are microscopic, meaning they are too small to see without a microscope. Unicellular organisms can be prokaryotes or eukaryotes (see Figure 2.29).
SAMPLEPAGES
Prokaryotes
All prokaryotes are unicellular and very simple, have no nucleus and are protected by a cell wall. Due to the work of Carl Woese, prokaryotes are divided into two kingdoms: Bacteria and Archaea (see Figure 2.29). These two kingdoms are ancient and have a lot in common, but they are genetically quite different.
Figure 2.30 Antonie van Leeuwenhoek's home-made microscope lenses facilitated his discoveries of protists (in 1674) and bacteria (in 1683).
Figure 2.29 The domains and kingdoms of life
Bacteria
• Prokaryotic
• Not as old as archaea, appearing about 2.5–3 billion years ago
• Human bodies are home to approximately 100 trillion 'good' bacteria, mostly in the gut
• Some are disease-causing
• Decompose waste material
• Can increase the productivity of soil
• Used to produce food (miso, tempeh, cheese, yoghurt) and industrial materials
• Able to reproduce rapidly and adapt quickly to threats.
Eukaryotes
Archaea
• Prokaryotic
• Oldest form of life on Earth, dating back 3.5 billion years
• Many are extremophiles, able to survive in a range of hostile environments, such as the 70°C Grand Prismatic hot Spring of Yellowstone National Park in the USA (see Figure 2.32)
• Most species are found in the oceans.
Eukaryotes all belong to the domain Eukarya (see Figure 2.29). They are a diverse group of organisms that share a fundamental characteristic: their cells contain a nucleus and other membrane-bound organelles with specialised functions. This feature makes them different from prokaryotes. Eukaryotes include a wide range of organisms, from single-celled protists to multicellular animals and plants.
Protista
• Eukaryotic
• Mostly unicellular but can be multicellular
SAMPLEPAGES
• A group of organisms that do not fit into any other kingdom: some scientists call this kingdom the junk drawer! As a result, organisms in this kingdom are very diverse.
• Many are parasites and cause disease (e.g. Plasmodium causes malaria, Giardia causes giardiasis and Trypanosoma [see Figure 2.33] causes African trypanosomiasis, otherwise known as sleeping sickness)
• Phytoplankton protists are photosynthetic and produce almost half of the oxygen on Earth.
2.33 Parasitic Trypanosoma protists, shown here among red blood cells, are transmitted to humans by the bite of a tsetse fly.
parasite an organism that lives in or on another organism and takes its food from the other organism's body
Figure 2.32 The vibrant colours are mats of flourishing extremophile archaea.
Figure
Figure 2.31 Harmful bacteria adapt, becoming resistant to common antibiotics.
VIDEO What are protists?
Did you know? 2.6
archaea and climate change
Archaea that live in the digestive tracts of many animals are known as methanogens because they produce methane gas. Methane is a greenhouse gas that has been linked to increasing global temperatures due to its ability to trap heat.
Australian scientists have found that some native animals that eat plants release less methane than livestock species when they digest food. By understanding why this happens, scientists are hoping to decrease methane production caused by agriculture and reduce the impact of climate change.
SAMPLEPAGES
Quick check 2.6
1. State a difference between a prokaryote and a eukaryote.
2. Define the term 'microscopic'.
3. Summarise the key characteristics of bacteria.
4. Name an organism in the Protista kingdom.
5. Decide whether all single-celled organisms are harmful.
Plants
Plants use energy from the Sun to convert water and carbon dioxide into substances that are the foundation of all life on Earth. As producers, they start most food chains and are a source of energy for other organisms. You will learn more about this in the next chapter.
Figure 2.35 Plant kingdom classification
Figure 2.34 Kangaroos produce less methane than cows, yet they both eat grass.
Figures 2.36 to 2.40 show how plants in the plant kingdom can be further classified based on whether they have vascular tissue and whether they produce seeds.
Vascular plants
Vascular plants have vascular tissue made of specialised cells that form vessels, to allow for the transport of water, sugar and nutrients. Ferns, non-flowering plants and flowering plants all have vascular tissue.
• Xylem is the dead, rigid vascular tissue that supports the movement of water within the plant through tubes. It is also the primary component of wood.
• Phloem is the living vascular tissue that allows for nutrients and sugars (typically produced in the leaves) to be circulated within the plant.
Flowering plants
• Produce flowers and fruits that allow them to reproduce
• Brightly coloured flowers and sweet nectar lure insects, birds and other animals that can help spread pollen to produce seeds.
Non-flowering plants
• Include cycads and conifers
• Reproduce using seeds that are exposed or in cones, not enclosed in fruit
• Male cones produce pollen that fertilises female cones. Female cones protect the seeds.
Ferns
SAMPLEPAGES
is a non-flowering conifer, only found in canyons of Wollemi National Park, west of Sydney.
• Among the earliest land plants, existing on Earth for approximately 360 million years
• Reproduce using spores
• Do not produce seeds
• Grow well in moist, humid, shaded areas.
Figure 2.36 The veins you see in this leaf are vascular tissue pathways.
Figure 2.37 Flowering plants are the dominant type of plant on Earth.
Figure 2.39 The fossil record shows that ferns existed millions of years before dinosaurs.
vascular containing veins or specialised fluid vessels
Figure 2.38 The ancient Wollemi Pine
non-vascular not containing veins or specialised fluid vessels
Non-vascular plants
Non-vascular plants do not have specialised cells to transport water and nutrients from one part of the plant to another. All plants in this division share some common characteristics.
• Cannot grow very big; tend to grow in clumps
• Often found spread across rocks or the ground in cool, moist, shaded areas
• Reproduce using spores (not seeds)
• Include mosses, liverworts and hornworts, and some algae.
Explore! 2.3
Traditional knowledge of plants
SAMPLEPAGES
It is estimated that as much as 84 per cent of the plants in Australia are endemic to the country. Aboriginal and Torres Strait Islander people have a vast knowledge of the medicinal properties of these plants, built over millennia. Through trial and error over many generations, they have come to understand which plants are dangerous to consume, which have medicinal value, and what processes are required to make toxic plants safe.
1. Why do the plants used as medicine vary in different parts of Australia?
2.41 Gumby gumby trees ( Pittosporum angustifolium) are one of many plants used by Uncle Steve Kemp to produce medicinal products.
In central Queensland in the community of Woorabinda, Uncle Steve Kemp (a Ghungalu Elder) runs a 'bush pharmacy' treating local people with traditional medicines. A CQ University Project is researching the properties of the medicines he uses, testing for antimicrobial properties.
NOTE
The term 'Aunty' or 'Uncle' is often used before a person's name as a way of showing respect in Aboriginal and Torres Strait Islander cultures.
Sometimes this traditional knowledge has commercial applications, so states and territories have introduced legislation around the collection and use of native biological materials (such as plants and insects) for uses such as medicine and pesticides. These laws are known as Biodiscovery Acts.
2. Discuss the ethical, social and economic implications of Aboriginal and Torres Strait Islander people partnering with research organisations and private companies.
3. Outline how Biodiscovery Acts ensure that intellectual property rights and potential commercial opportunities remain with the Traditional Custodians.
Explore! 2.4
Traditional land management
The rubber vine (Cryptostegia grandiflora) is a flowering plant that is listed as a Weed of National Significance. It can spread quickly, forming dense thickets that smother native vegetation and prevent native animal access to waterways.
Research how traditional land management practices have been effective in controlling major weeds such as rubber vine and parkinsonia (Parkinsonia aculeata).
Figure
Figure 2.40 Mosses are flowerless nonvascular plants that lack a root system. Instead, they absorb water and nutrients through their leaves.
Did you know? 2.7
vegetable or fruit?
Flowering plants produce fruit, and many plants that people would consider a vegetable are actually fruit.
The most famous example is probably the tomato. In 1893, the US Supreme Court had to rule whether imported tomatoes should be taxed under a rule that only applied to vegetables and not fruit. The court decided that tomatoes were vegetables, despite them being fruit!
Capsicums, coconuts, cucumbers, pumpkins, corn kernels and peas are all fruit.
SAMPLEPAGES
observing Euglena
Aim
To observe a single-celled organism under the microscope.
Hypothesis
Be careful
Ensure proper microscope handling and use is observed.
Euglena is a single-celled organism. Predict the cell features you think you will see under the microscope.
Materials
• Euglena sample
• pipette (optional)
• compound microscope
• dimple slide
Method
1. Set up the microscope on your bench.
• coverslip
• sharp pencil
• plain paper
• glycerol (optional)
2. Place a small drop of the Euglena sample into the dimple on the slide. One drop of glycerol can be added to slow the movement of the Euglena
3. Lower the coverslip on an angle over the drop to protect the sample.
4. Place the slide onto the stage of the microscope and focus, using the lowest power magnification first.
Results
1. Draw a scientific drawing of the Euglena you observe. Use a sharp pencil.
2. Use the internet to research the structure of Euglena. Label your scientific drawing.
Discussion: Analysis
1. Euglena can make sugars like plants can, but they also have a simple 'eye' spot (sensitive to light, but not a true eye). Euglena can also move, as you have observed. From your observations, justify whether you believe Euglena is more similar to animals or plants.
Conclusion
1. Write a sentence summarising what you observed under the microscope.
Figure 2.42 How many different fruits can you see?
Practical 2.1
Quick check 2.7
1. Define the terms 'vascular' and 'non-vascular'.
2. Recall whether organisms in the plant kingdom are unicellular or multicellular.
3. Recall which groups of plants produce seeds.
4. Copy and complete the following table to summarise the characteristics of different plant groups. CharacteristicsNon-vascular
Roots and stems
Maximum height
Spores or seeds
Flowers or no flowers
Examples
Fungi
Fungi are a group of organisms that include mould, mushrooms and yeast. They are not producers, so they cannot produce their own food. Instead, they digest organic material and absorb the nutrients. Fungi reproduce by spreading spores. Fungal cells are surrounded by a rigid cell wall made of chitin that provides structural support and protection, and distinguishes them from other organisms.
Fungi (like some bacteria, archaea and protists) are decomposers and grow well in warm, moist conditions. They have one of the most important roles on Earth. By decomposing waste material and dead matter, they release vital nutrients that can then be recycled back into the ecosystem. VIDEO The importance of fungi
SAMPLEPAGES
Unicellular fungi
Yeast is a unicellular fungus that undergoes fermentation to produce carbon dioxide and alcohol. It is used by humans for making bread, beer, wine and spirits.
SAMPLEPAGES
Multicellular fungi
Multicellular fungi grow as thread-like filaments called hyphae. They can be moulds made of very fine threads, or larger fungi with fruiting bodies that you would recognise as mushrooms.
Did you know? 2.8
Desert fungus: a form of paint!
The desert shaggy mane (Podaxis pistillaris) is a fungus that was used by many Aboriginal and Torres Strait Islander desert tribes for body painting and to darken the white hair in old men's beards.
Figure 2.44 Yeast feeds on the sugar in flour, forming carbon dioxide, which makes the bread rise.
Figure 2.45 Mushrooms growing on a tree
Figure 2.46 The desert shaggy mane (Podaxis pistillaris)
Science as a human endeavour 2.2
Deadly fungi
In October 2022, a researcher from James Cook University confirmed the first-ever sighting of a poison fire coral fungus in Far North Queensland. Trichoderma cornu-damae is one of the world's deadliest fungal species and the only one that can poison a human from touch. When even a small amount is touched or eaten, it can cause your skin to peel off, your hair to fall out, your brain to shrink, and many other potentially lethal symptoms.
SAMPLEPAGES
Did you know? 2.9
Cordyceps: the zombie fungus!
There are over 400 species of Cordyceps fungi, each targeting a particular species of insect. When Cordyceps spores attach to an insect, they start to grow throughout the insect's body. Sometimes the fungi take over the brain of the insect and control its movement! The fungus will then emerge from the insect and spread its spores to other insects in the area.
Try this 2.9
Classification super challenge!
To check whether you know the key characteristics of the different kingdoms, try this super challenge. Read the description in the following table, and see if you can identify the kingdom the organism belongs to, based on what you've learned in this chapter so far. Then confirm your answer by researching online, and find a picture of a possible organism that fits the description.
Description
I am a single-celled organism. I live in the large intestine of mammals like humans to help food break down. I reproduce very quickly.
I am a multicellular organism. I use sunlight to make my own food. I grow flowers to produce seeds inside fruits.
I cause dead animals to really reek when I slowly digest their tissues, producing methane. I am a single-celled organism with no nucleus in my cell.
I am a unicellular organism that can move and live in pondwater. My body is covered with little hairs to help me move and I can swim very fast. I eat bacteria.
I make my own food using the sunlight and I am multicellular. I get my nutrients from insects I catch in my folding leaves.
Figure 2.47 Poison fire coral fungus (Trichoderma cornu-damae)
Quick check 2.8
1. Recall the characteristics of fungi.
2. State the characteristics that plants and fungi have in common.
3. Do some research and identify some examples of fungi that can be both beneficial and dangerous to humans.
4. State the conditions that are best for mould or fungi to grow.
SAMPLEPAGES
Investigation 2.1
fungi are all around us
Aim
To design a method to fairly investigate how different factors affect the growth of mould on bread.
Time period
Approximately 1 week
Background information
Be careful
Make sure you do not open or puncture the bag once growth has begun. Ensure that growing conditions remain under 30°C for safety reasons.
Recall that fungi produce spores in order to reproduce. This means that fungal spores are in the air all around us every minute of the day. You inhale these spores with every breath you take, and they try to grow in your lungs. Luckily, humans have a brilliant immune system that can fight them off. The food we store at home, on the other hand, does not have an immune system, so fungi that land on it can grow very easily. Most of the fungi that grow on food are known as mould. It is important to store food in an environment that slows down mould growth as much as possible, such as a cool pantry, a fridge or a freezer. This keeps the food edible for longer.
Materials
• slices of bread, or 3+ pieces per independent variable group, which are near or past their 'best before' date and preferably with no preservatives
• zip-lock bags
• paper towels
• sticky labels
• permanent markers
• sticky tape
Method
1. Read the background information section and identify an environmental factor that affects the growth of mould on food at home.
2. Create a research question that can be easily and safely investigated.
3. Identify one independent variable to test, based on your research question. Describe the different groups that you will set up for the experiment.
4. Identify the dependent variable and how you will measure it.
5. Develop a hypothesis by predicting how a change in the independent variable will affect the resulting dependent variable.
6. Identify the controlled variables and describe how these will be managed.
anomalous an outlying result that does not fit in with the pattern of the other results
7. Leave the pieces of bread exposed to air for a few minutes to pick up some spores, then place each piece into a zip-lock bag and seal the end well.
8. Cover the seal with a layer of sticky tape to prevent anyone opening it. DO NOT OPEN AGAIN. This is a safety issue, as breathing in mould can be dangerous.
9. Label each bag with the following information:
Group number:
Description:
SAMPLEPAGES
Date:
Student/s name:
10. Set up three bags for each independent variable group that you planned in Step 3.
11. Monitor each group for 5–7 days.
12. If any part of the set-up is changed over that time, then note the reason for this.
Results
1. Collect each bag. DO NOT OPEN for safety reasons.
2. Measure the estimated percentage coverage of fungal growth for each independent variable group and record the results in a table. Your teacher may direct you to create your table on a spreadsheet.
3. Calculate the average of the three growth measurements for each independent variable group.
4. Graph the mean of each group's data on paper. Your teacher may direct you to create your graph on a spreadsheet.
Discussion: Analysis
1. Describe any trends, patterns or relationships in your results table.
2. Identify any anomalous results that you found.
3. Analyse how much variation was observed between the measurements within each group.
Discussion: Evaluation
1. Describe how the set-up or method was adjusted, if at all, once the experiment was started.
2. Critique your management of the controlled variables. Were they managed properly to ensure they did not change and affect the measurements?
3. Were there any obvious sources of error or parts of the procedure that caused the data to be less accurate than it could have been? Describe any changes that could be made to the method to improve the quality of the data in future experiments.
Conclusion
1. Answer your research question, by copying and completing this statement in your science book.
From this activity it can be claimed that __________. This is supported by the observations that _____________. Therefore, the hypothesis is/is not supported by these findings.
Section 2.3 review
Section 2.3 questions
Remembering
1. State three examples of fungi.
2. Recall what 'hyphae' are.
3. State the kingdom that Penicillium mould belongs to.
4. Identify why animals depend on bacteria and fungi.
Understanding
5. Explain the adaptations of flowering plants that help them to reproduce.
Applying
6. Describe the difference between prokaryotes and eukaryotes.
7. Distinguish between unicellular and multicellular organisms.
Analysing
8. Classify each of these species by placing them into the correct kingdom.
a) Streptococcus pneumoniae is an organism that can make you very sick. It belongs to the second-oldest kingdom and is made up of single cells.
b) Trypanosoma evansi is a single-celled organism that needs to digest other organisms to survive. Its cells have specialised structures inside them.
c) Osmunda regalis is an organism that uses the Sun to make sugars and reproduces using spores. This organism has specialised vascular tissue.
d) Tremella fuciformis is an organism that reproduces using spores and is a parasite of other organisms to gain food.
e) Haloferax volcanii is a single-celled organism that can survive in extreme environments that no other organism could survive in.
Evaluating
9. In the past, fungi were considered to be part of the plant kingdom. Propose reasons why this might have been the case.
Go online to access the interactive section review and more!
SAMPLEPAGES
10. Suzi discovered that a piece of bread left in a zip-lock bag had developed a dark green furry coating. She decided to investigate the factors affecting mould growth. She used the same brand of bread and zip-lock bags, placing the sealed bags in environments with different temperatures.
a) Determine the variable she was changing or testing (independent variable).
b) Determine the variable she was measuring (dependent variable).
c) Propose some examples of variables she kept the same or controlled.
d) Propose two other variables she could test with a similar experiment to assess what factors affect the growth of mould.
Figure 2.49 Suzi's mouldy sandwich
WORKSHEET Grouping
2.4
The animal kingdom
Learning goals
At the end of this section, I will be able to:
1. Describe the difference between invertebrates and vertebrates.
2. Recall seven classes of chordates.
The animal kingdom is the largest of the six Linnaean Kingdoms, with over a million classified species. It might surprise you to know that most of the animals on our planet are microscopic and look nothing like the animals you are more familiar with, such as birds, mammals and fish. All organisms in the animal kingdom share some defining features that set this kingdom apart from the others.
All animals:
• are eukaryotes, so have cells with a nucleus and membrane-bound organelles
• are multicellular (made up of more than one cell working together)
• eat other organisms or their products to gain energy
2.50 A dust mite is an example of a microscopic animal.
sessile
fixed in one place and not able to move
vertebrate an animal that has a backbone invertebrate an animal that does not have a backbone
SAMPLEPAGES
• can independently change their location if they are motile, or move their body parts if they are sessile
Phyla in the animal kingdom
There are currently 35 recognised phyla (plural of phylum) in the animal kingdom, but here we will focus on the nine key ones, as shown in Table 2.3 and Figure 2.51. Animals can be classified based on whether they have a backbone. A vertebrate is an animal with an internal backbone or endoskeleton, while an invertebrate is an animal with no internal backbone. Instead, invertebrates may have a hard outer casing called an exoskeleton. Despite vertebrate and invertebrate being important terms to know and understand, they are not used as an official level in the classification system.
Table 2.3 Summary of nine key phyla in the animal kingdom. Note that eight of the nine phyla (excluding chordates) contain only invertebrates.
Figure
Echinoderms
Figure 2.51 Nine of the 35 recognised phyla in the animal kingdom
Invertebrates
Poriferans
(pron. pore-if-er-ans)
• Sponges (from the Latin porus meaning pore, and fera meaning bearing)
• Simple animals with no organs
• Sessile
• Feed by filter-feeding, drawing water through their pores and straining it to capture food.
SAMPLEPAGES
Platyhelminthes
(pron. plat-ee-helm-in-thees)
• Flatworms (from the Greek platy, meaning flat, and helminth, meaning worm)
• Soft, unsegmented bodies
• Have flattened shapes to allow them to easily obtain oxygen and nutrients
• Most species will regrow a new body if they are cut in half
• Many are parasites.
Figure 2.52 The yellow tube sponge has a simple tube for filtering water.
Figure 2.53 Flatworms come in many colours.
Annelids
(pron. an-e-lids)
• Ringed worms (from the Latin anellus, meaning little ring)
• Three main groups: earthworms, leeches, and polychaetes that live in the ocean
• Soft, segmented bodies
• Need a moist environment; can survive on land.
Figure 2.54 The vibration of raindrops may be mistaken for a predator, and cause worms to surface.
SAMPLEPAGES
Cnidarians
(pron. nigh-dare-ee-ans)
• Stinging aquatic invertebrates (from the Greek knidē, meaning nettle, a stinging plant)
• Include anemones, coral and jellyfish
• Soft, hollow body
• Have stinging cells that are used for feeding and defence
• Can replace lost or damaged parts by regeneration.
Nematodes
(pron. ne-ma-toads)
• Roundworms (from the Greek nematos, meaning thread)
• The most abundant animals on Earth
• Soft, unsegmented bodies
• Many species are parasitic.
Molluscs
(pron. mol-usks)
• Soft-bodied invertebrates with a muscular foot or tentacles (from the Latin mollis, meaning soft)
• Includes squid, snails, slugs, octopuses and oysters
• Have a mantle (a cover or outer layer), and for some it forms a shell
• Have a radula, a scraping device for eating.
Figure 2.55 Green coral colonies such as these are the dominant species in Port Phillip Bay's coral reefs.
Figure 2.56 The roundworm Caenorhabditis elegans was the first multicellular organism to have its entire DNA sequenced.
Figure 2.57 The fourth recorded sighting of a blanket octopus was off Lady Elliot Island in the Great Barrier Reef (2022).
Arthropods
(pron. arr-thre-pods)
• Invertebrates that have an exoskeleton, segmented bodies and paired jointed limbs (from the Greek arthron, meaning joint, and podos, meaning foot)
• All arthropods moult (shed their exoskeleton) at least once during their lifetime
• Include insects, spiders, scorpions, millipedes and crustaceans (crabs, lobsters, prawns, etc.)
• Make up 80 per cent of all animal species
• Have complex sensory organs such as compound eyes and antennae for hunting and detecting threats.
Echinoderms
(pron. eek-ine-o-derms)
• Marine invertebrates with a hard, spiny or bumpy covering (from the Latin echino, meaning spiny, and derm, meaning skin)
• Includes sea stars, sea urchins, sea cucumbers, brittle stars and feather stars
• Have specialised organs, but no brain and no blood
• Most have radial symmetry.
vertebrates
Chordates
(pron. core-dates)
The word 'chordate' is derived from the Latin chordatus, meaning having a spinal cord, which was originally taken from chorda, meaning string.
its moulted exoskeleton, known as its exuvia.
SAMPLEPAGES
The chordate phylum contains the most complex animals. At some point in a chordate's life, it has a notochord (in most chordates, this develops into a backbone). They also possess gills on the neck and a tail. Although humans are chordates, these features are only present before birth, as in the five-week old human embryo shown in Figure 2.60.
Figure 2.60 Can you see the tail? In rare cases, human babies can be born with tails.
We do have a long nerve running up our back, called the spinal cord. The spinal cord connects the brain to the rest of the body and is protected by bones called vertebrae. Run your fingers down your back to feel your vertebrae. You may remember that animals with such bones are called vertebrates. Humans, all other mammals, reptiles, fish, amphibians and birds all belong to the chordate phylum and are further grouped into classes based on their similar characteristics.
organism's body can be divided into identical parts around a central axis
Figure 2.58 A cicada with
Figure 2.59 The northern pacific sea star is an introduced marine pest commonly found in Port Philip Bay.
radial symmetry a form of symmetry where an
Did you know? 2.10
Darwin's worm experiment
Worms may be more intelligent than you think. Charles Darwin noticed that earthworms do not choose leaves randomly to take to their burrow. He set up an experiment with different-shaped leaves, and later with paper triangles of different widths, and found that the earthworms would pull the triangles by the points to make it easier to fit them into their burrows.
Did you know? 2.11
The flora and fauna Guarantee act
Point
SAMPLEPAGES
Base
Figure 2.61 Darwin found that worms preferred to pull the paper triangles from the point to make them easier to fit into their burrows.
Victoria's Flora and Fauna Guarantee Act outlines the species of native plants, mammals, reptiles, fish, amphibians and birds that are protected by law. The Act is designed to protect species and ensure they survive into the future by listing threatened species, declaring certain areas as critical habitats and outlining activities that require special permits.
Figure 2.62 Leadbeater's possums were thought to be extinct until their rediscovery near Marysville in 1961. Bushfires and the timber industry pose significant threats to this threatened species.
Explore! 2.6
Dame Jane Goodall's behavioural studies
'Change happens by listening and then starting a dialogue with the people who are doing something you don't believe is right.' – Jane Goodall Chimpanzees are chordates in the mammal class. In her research on the species, Dame Jane Goodall made five ground-breaking discoveries about chimpanzees:
• They make and use tools.
• They hunt and eat meat.
• They show acts of compassion.
• They engage in war.
• They have strong maternal bonds.
Explore why Dame Goodall's communication of these findings changed viewpoints about what it means to be human and set the standard for how behavioural studies (especially on chordates) are conducted.
Symmetry
The symmetry of an animal (whether they have mirror image parts) is considered when classifying them into their correct phyla. Bilateral symmetry means you could draw an imaginary line down the centre of the organism and get two identical halves, as shown by the butterfly in Figure 2.63a. Radial symmetry refers to symmetry around a central point. In the case of the starfish, you could divide the organism into identical halves via many different lines, as shown.
because it can be separated into identical
in many directions.
Explore! 2.7
asymmetrical animals
bilateral symmetry a form of symmetry where an organism's body can be divided into identical halves
SAMPLEPAGES
Can you tell what type of symmetry the crinoid shows?
Most, but not all, animals have symmetrical body shapes. Investigate and find examples of animals that do not have symmetrical bodies.
Try this 2.10
Types of symmetry
Look at each of the animals in Figure 2.65 and decide whether they show radial symmetry, bilateral symmetry or no symmetry.
Figure 2.65 Which of these animals show symmetry?
Figure 2.64 The wrybill is the only species of bird with a beak that is always bent sideways to the right, and therefore is not bilaterally symmetrical.
Figure 2.63 (a) The yellow admiral butterfly shows bilateral symmetry because it can be separated into identical halves in one direction. (b) The necklace sea star shows radial symmetry
halves
(c)
Practical 2.2
Quick check 2.9
1. Recall how many recognised phyla there are in the animal kingdom.
2. State the characteristics of all animals.
3. Recall the most abundant animals on Earth.
4. Describe the difference between radial and bilateral symmetry.
Dissecting a member of the Mollusca phylum
Aim
To explore the anatomy of the squid and observe its simple organ system.
Materials
• squid × 1
• dissecting tray (plastic chopping board)
• dissecting scissors
• probe
• newspaper
• toothpicks × 11
• sticky labels × 11
SAMPLEPAGES
Be careful Wear disposable gloves and a lab coat or apron when handling the squid.
• gloves
• lab coat
• optional: dissecting microscope
• recommended: laminated copies of exter nal and internal anatomy of squid (see Figures 2.66 and 2.67) for reference during dissection.
Gonad
Heart
Brain
Radula
Gills
Ink sac
Siphon Beak
Figure 2.67 Internal anatomy of the squid
Arms and tentacles
Head
Eye
Pen
Mantle
Fins
Tail
Figure 2.66 External anatomy of the squid
Method
1. Create 11 toothpick label flags with the toothpicks and sticky labels, by folding the labels over like a flag at the top of each toothpick. Add each of the following to the labels: heart, ink sac, gills, tentacles, arms, eyes, mantle, pen, fins, siphon, gonads.
External anatomy
2. Place the squid on the dissecting tray and lay it out flat.
SAMPLEPAGES
3. Study the external anatomy diagram in Figure 2.66. Place your toothpick labels to identify all the external parts of your squid.
4. Count the number of arms the squid has. Arms are different from the tentacles, as they are shorter and have suction pads all the way along them.
5. Count the number of tentacles the squid has. Tentacles are longer than the arms and only have suction pads at the end.
6. Pick up the squid and hold the mantle like an ice-cream cone. Allow the arms to spread backwards over your hand. This will expose the mouth of the squid.
7. Locate the beak of the squid. It will be hard and brown.
Internal anatomy
8. Place the squid back on the dissecting tray and use the scissors to cut the mantle upwards from the tentacles to the top.
9. Open up the mantle of the squid, like opening a book.
10. Locate the gills, ink sac, heart and gonads and label them using your toothpicks.
11. Once you have labelled all the internal parts of the squid, try to remove each organ very carefully and place around the dissecting tray.
Optional
Be careful
Cut away from the centre of the squid so you don't damage its organs.
Be careful
Do not puncture the ink sac at this point, as it will spill all over the squid.
12. Locate and remove the pen. The pen is a hard, transparent part of the squid's internal anatomy. It is the remains of a shell and offers support for the squid when moving. It is located in the centre of the mantle. Once you locate the pen, you should be able to peel it away from the surrounding tissue using your fingers.
13. Remove the ink sac from the squid. Place it on a dish to catch any mess, and try popping it with a toothpick. Use the pen of the squid or the toothpick to write your name on a piece of paper.
14. If you have successfully located and removed the beak and radula, observe these structures under a dissecting microscope.
Results
1. Develop a table to record the following: a) main features identified (see method) b) number (how many times this feature was observed).
Discussion: Analysis
1. Squids are classified as class Cephalopoda, which comes from the Greek words for 'head' and 'foot'. Discuss how this name relates to the squid's anatomy.
2. Squids are classified as phylum Mollusca, which includes all shellfish. Discuss a probable reason that the squid is classified this way when it does not have a shell.
3. Propose a reason why it would be beneficial for a squid to be able to produce ink.
Conclusion
1. Write a sentence summarising what you observed during the squid dissection.
Classes in the phylum Chordata
Chordata (the formal name of this phylum) is the only phylum to contain vertebrate animals. Recall that the hierarchical classification system begins: kingdom, phylum, class … Within this phylum, there are seven classes (see Figure 2.68).
The easiest way to remember these classes is by using the MR FAB acronym: Mammals, Reptiles, Fish, Amphibians, Birds. Each is a class, except for the animals we refer to as 'Fish', which are made up of three classes: bony, cartilaginous and jawless fish. Figures 2.69 to 2.77 show examples from the seven classes of Phylum Chordata.
SAMPLEPAGES
Explore! 2.8
Are all chordates vertebrates?
Every animal in Phylum Chordata has a notochord at some stage of its development. The notochord is a long, rod-like structure of cells that runs down the middle of the animal's body and plays an important role in the development of the embryo.
Most, but not all, chordates are also vertebrates, meaning they have an internal vertebral column (or spine). Research on the internet to find an example of a chordate that is not a vertebrate.
Figure 2.68 The seven classes in phylum Chordata
Mammalia (mammals)
• Feed their offspring milk
• Have a covering of hair or fur
• Possess three small bones in the middle ear
• Are endothermic
• Have three subclasses based on how they produce offspring: placentals, monotremes and marsupials.
Marsupials
Marsupials give birth to live young (called joeys) at a very early stage of development. The young climb from the birth canal to the pouch, where they latch onto the mother's nipple and remain there until they are fully developed. Marsupials include kangaroos, wombats, possums and koalas. They are only found in Australasia, South America and, in smaller numbers, in Central America and North America.
Placentals
Placental mammals give birth to well-developed young. During pregnancy, nutrients and wastes are exchanged between mother and foetus through a cord attached to the mother's placenta. Most mammals, including humans, are placental.
Monotremes
Monotremes lay eggs with leathery shells, like reptiles. They have highly modified beaks or snouts, and the adults have no teeth. They feed their young with milk secreted from glands, not nipples. The only monotremes that exist today are four species of echidna (found only in Australia and New Guinea) and the platypus (Australia only).
Reptilia (reptiles)
SAMPLEPAGES
• Are ectothermic – the temperature inside their bodies is controlled by the temperature of their environment
• Have waterproof scales
• Include snakes, lizards, turtles and crocodiles
• Most lay leathery eggs
• Have lungs for breathing.
warm blooded; able to regulate its body temperature
Figure 2.70 The spectacled flying fox is a placental mammal.
Figure 2.71
Echidnas feed with a 15 cm-long tongue instead of teeth.
cold blooded; unable to regulate its internal temperature
Figure 2.72 Saltwater crocodiles can remain underwater for up to eight hours.
Figure 2.69 A kangaroo joey attached to its mother's nipple
metamorphosis the process of transformation from an immature form to an adult form
Agnatha (jawless fish)
(pron. ag-na-tha)
• Jawless, eel-like aquatic vertebrates
• Include lampreys, hagfish and many extinct species
• Oldest chordates and known as 'living fossils' as they have not changed in millions of years
• Fish with skeletons made of cartilage (which is softer and more flexible than bone)
• Include sharks, skates and rays
• Have fins on the sides of their bodies (lateral fins) and on their backs (dorsal fins).
Amphibia (amphibians)
• Are ectothermic
• Live on both land and water (from the Greek amphibios meaning 'living a double life')
• Include toads, frogs, newts and salamanders
• Require water or a moist environment and use their moist skin and lungs to breathe air
• Undergo metamorphosis (a change in form), which allows them to transition from an aquatic to a terrestrial or semi-terrestrial life.
Aves (birds) (pron. ah-vays)
• Feathers cover their body
• Lay hard-shelled eggs
• Have a beak with no teeth
• Winged, but not all birds can fly
• Are endothermic.
Figure 2.73 The lamprey's teeth help it attach to its prey.
Figure 2.74 An X-ray shows the endoskeleton of a bony fish.
Figure 2.75 In 2022, scientists tracking a great white shark found that it swam more than 10 000 km in just 150 days.
Figure 2.76 Forty-one per cent of amphibian species worldwide are threatened with extinction.
Figure 2.77 The large, flightless emu is adapted to life on the ground.
Try this 2.11
Being
a citizen scientist
Projects such as the citizen science FrogID app encourage people to upload audio recordings of frog calls to a database. The data is improving scientists' understanding of Australia's unique frog species. The use of digital tools, such as the FrogID app, has several benefits in encouraging public participation. With just a smartphone and the app, anyone can become a citizen scientist and contribute to real scientific research.
Use the internet to research how you could use similar technology to design a dichotomous key app that allows the community to classify plants and animals in their local area.
SAMPLEPAGES
The eastern barred bandicoot, a nocturnal marsupial, was declared extinct in the wild in 2013 due to predators such as cats and foxes. A Zoos Victoria captive breeding program enabled their reintroduction to the mainland and to fox-free islands such as Churchill, Phillip and French Islands. In an Australian first, they have now been reclassified as Endangered.
Did you know? 2.12
The Victorian grassland earless dragon was sighted in 2023 at an undisclosed location, after last being seen near Geelong some 54 years ago. These dragons are thought to only reproduce once in their lifetime.
Try this 2.12
Which phylum?
Use the information about each of these species to decide which phylum they belong to.
1. Asaphus kowalewskii is an extinct member of the largest phylum. All the members of this phylum had an exoskeleton, segmented body and jointed limbs.
2. Ailurus fulgens has a long tail and a nerve cord that runs down its back. This nerve cord is protected by hard bones.
3. Monanchora arbuscula is an animal that obtains food by filtering seawater through pores on its body.
4. Pseudoceros susanae is a colourful animal that is completely flat. It has bilateral symmetry and can survive if cut in half.
5. Cassiopea andromeda has a soft body and a specialised cell called a nematocyst (pronounced nee-ma-toe-sist) that fires a stinging spine at its target, like a harpoon.
6. Pisaster ochraceus has radial symmetry and cannot survive in fresh water. It pushes its stomach out of its mouth to digest its prey.
Figure 2.78 An eastern barred bandicoot
Figure 2.79 A Victorian grassland earless dragon (Tympanocryptis pinguicolla)
Making thinking visible 2.2
What can be: Interacting
with living things
Scientists often interact with living things as they conduct their research. In the laboratory, this may involve experiments with animals as subjects. In the field, biologists use technology such as electronic collars and tags to collect data on animal movement and behaviour; however, these have the potential to cause stress and injury.
Ideas around the ethics of working with animals have changed over time, and there are now regulations governing how we interact with living things.
Analyse: What factors contributed to the current state of regulation? What individuals or forces could have initiated or shaped these transformations?
Forecast: In what other ways could this evolve in the future?
Innovate: Change presents obstacles. If you could transform the challenges brought about by these changes into opportunities, what possibilities do you envision? What innovative solutions could be generated?
The What can be thinking routine was developed by Project Zero, a research centre at the Harvard Graduate School of Education.
Did you know? 2.13
Unique marsupials
SAMPLEPAGES
2.81 Australia is home to three existing species of wombat: the common wombat (shown here), the southern hairy-nosed wombat and the northern hairy-nosed wombat.
Wombats are an example of a marsupial in the mammal class. They have developed a number of adaptations that make them unique. Aside from having distinctively cube-shaped faeces, they have a sturdy rump that serves multiple purposes. It is used for defence, burrowing, bonding, mating, and potentially crushing the skulls of enemies against the burrow's roof. However, the exact functionality of this behaviour is still under debate. The wombat's rear end consists of four fused plates, surrounded by cartilage, fat, skin and fur. The animals use their backside to block their burrows, preventing predators from entering and safeguarding their more vulnerable body parts.
Wombats have also developed a backward-facing pouch (the opposite direction to other marsupials) to protect their young from dirt when the mother is digging a burrow.
Figure
Buckle
Screw Radio transmitter
Antenna
Cable ties, shortened and filed down
A1
A2
A3
Figure 2.80 Alexandra Ross created a tracking device for wallabies using a store-bought cat collar, which reduces the risk of choking.
Quick check 2.10
1. Describe two differences between amphibians and reptiles that allow reptiles to live away from water.
2. Identify the difference between birds and reptiles that allows birds to survive in more environments than reptiles.
3. Recall how an amphibian gets oxygen from the air.
4. Name two members of the Osteichthyes class.
SAMPLEPAGES
Try this 2.13
Identify the chordate class
1. Pseudonaja textilis is an ectotherm with a skin made of waterproof scales. This animal lays leathery eggs that do not need to be submerged in water.
2. Vulpes lagopus is an endotherm that is covered in fur. It gives birth to fully developed young and feeds them on milk.
3. Trichoglossus moluccanus is a colourful animal that is an endotherm. It has several adaptations including wings and feathers, which allow it to fly.
4. Litoria caerulea can survive on land but will always be found near a body of water as it needs to keep its skin moist, and can only lay its eggs in water.
5. Thunnus albacares is a marine animal that has specialised fins, a jaw with teeth and a bony skeleton.
Did you know? 2.14
The Australian lungfish is one of the oldest species on Earth. Its distinctive characteristic is the presence of a single lung that gives the fish its name. When oxygen levels are low, the lungfish can rise to the water's surface and breathe air.
Try this 2.14
Exploring the animal kingdom
Use your preferred web browser to research your choice of four living species (each from a different phylum).
Make a cue card for each one. Print out a small picture of the species, and include the following information for each one:
• common name
• scientific name
• phylum
• characteristics of the phylum
• three features of this species
• three interesting facts about it.
Now you have gathered information, it is time to play 'Two truths, one lie' with a partner.
1. Choose two facts about each of your chosen species and create one lie about the species.
2. Read the two truths and one lie out to your partner to see if they can correctly guess the lie.
3. Swap after each animal to give your partner a chance to trick you.
4. When you have played this game with your partner, swap partners and play again.
Figure 2.82 Two Australian lungfish (Neoceratodus forsteri) swimming
Section 2.4 review
Go online to access the interactive section review and more!
Section 2.4 questions
Remembering
1. Recall where you would find living sponges.
2. Name three examples of arthropods.
3. State whether each of the shapes a–d has bilateral or radial symmetry.
SAMPLEPAGES
ab cd
Understanding
4. Describe the difference between a vertebrate and an invertebrate.
5. Explain why reptiles can live in deserts, while amphibians can't.
Applying
6. Differentiate between the following animals:
a) jellyfish and earthworm b) kookaburra and koala c) frog and tuna.
7. The sea pig (Elpidiidae scotoplanes; see Figure 2.83) is an unusual animal that lives on the bottom of the ocean. It can only survive in salty water. It has feeding tentacles and five to seven pairs of feet. Its body has bilateral symmetry and is soft.
a) Identify which animal phyla the sea pig shares features with.
b) Categorise the phylum that the sea pig belongs to, and give reasons for your answer.
Analysing
8. Compare animals in the Reptilia and Aves classes.
Evaluating
9. The pangolin (Smutsia temminckii; see Figure 2.84) is one of the world's most illegally traded animals. Its body is covered in hard scales, it is nocturnal, and it gives birth to live young that feed on milk from their mother. As an adult, it eats mainly ants and termites, which it captures with a tongue that is so long it is attached to a pelvic bone. Use this information to decide what class the pangolin belongs to. Give reasons for your answer.
10. Discuss the reason why many animals that live in water are ectotherms rather than endotherms.
Figure 2.83 A sea pig, Elpidiidae scotoplanes
Figure 2.84 A ground pangolin, Smutsia temminckii
Chapter review
Chapter checklist
Success criteria Linked question
2.1I can explain how classification involves grouping living organisms based on their similarities and differences. 7, 8, 9, 12, 15, 16
2.1I can interpret, use and construct a dichotomous key to identify organisms. 11, 13
2.2I can classify a living organism using a hierarchical system. 1, 6
2.2I can recognise how biological classification has changed over time.14
2.2I can use scientific conventions to name organisms. 4, 5
2.2I can explore classification systems used by many Aboriginal and Torres Strait Islander Peoples. 17
2.3I can distinguish between (or list) the six kingdoms of living organisms.2
2.4I can describe the difference between invertebrates and vertebrates.10
2.4I can recall seven classes of chordates. 3
SAMPLEPAGES
Go online to access the interactive chapter review!
Review questions
Remembering
1. Recall the term used to describe the broadest group of living organisms in Linnaean classification.
2. Name the kingdoms in the Linnaean taxonomy.
3. Name the seven classes of chordates.
4. Identify the language that the scientific names for genus and species names are mostly taken from.
5. Recall the correct way to write the genus and species name of the domestic cat. Hint: the unformatted name is felis catus.
6. Identify the missing words marked a–e: kingdom, a, b, c, d, e, species
Understanding
7. Summarise why it is useful to classify organisms and give them a unique universal scientific name.
8. Explain the effect of using qualitative descriptions in a dichotomous key.
Applying
9. Mosses and fungi both produce spores when reproducing. Describe two differences between these organisms.
10. Explain why the soldier crab, Mictyris longicarpus, is classified as an invertebrate animal.
11. Each step of the key in Figure 2.86 can be used to describe an organism. Use it to describe: a) a Tibetan terrier b) an Italian greyhound.
SAMPLEPAGES
Analysing
12. Organise the following objects into three groups and give each group a name that best describes the objects you have placed in that group.
skateboard pen spoon scissors pencil bicycle car paint plate
Evaluating
13. Create a dichotomous key to classify the contents of your pencil case.
14. The number of kingdoms has changed over time. Propose why it is likely that the levels of classification will continue to change.
15. Euglena are single-celled organisms that can detect light, can swim and are able to photosynthesise. Discuss why it would be difficult to classify this organism.
16. Scientists used to classify all life as plants or animals. Justify in which kingdom (plants or animals) you would place fungi, based on what you have learned in this chapter.
17. Discuss how Aboriginal and Torres Strait Islander people may classify living things.
Figure 2.85 A soldier crab, Mictyris longicarpus
Long hair (more than 2 cm)
Short hair (less than 2 cm)
Sheds hair
Does not shed hair
Sheds hair
Does not shed hair
Golden retrieverTibetan terrier Basset houndItalian greyhound
Dog breeds
Figure 2.86 Classification key
Data questions
Applying
1. Use Figure 2.87 to identify the taxonomic group that is under the least threat.
Percentage of all species (%)
Conservation status of taxonomic groups
SAMPLEPAGES
PlantsInvertebrates
Taxonomic groups
ThreatenedExtinctNot threatened
Figure 2.87 The conservation status of different taxonomic groups in Australia
2. There are 828 bird species in Australia, and 6 per cent of these species are considered threatened. Calculate the number of species of birds that are considered threatened.
3. Use Figure 2.88 to calculate the average rate of mammal extinctions per year from 1800 to 1920.
Cumulative extinction of mammal species over time
Cumulative number of extinct mammal species
Figure 2.88 The cumulative number of extinctions of mammal species in Australia since 1800
Analysing
4. Organise the taxonomic groups in Figure 2.87 from most threatened to least threatened.
5. Contrast the number of extinct and threatened species in mammals with the number of extinct and threatened species in amphibians in Figure 2.87.
Evaluating
6. Use Figure 2.88 to predict the number of extinct Australian mammal species in the year 2020.
7. Use Figure 2.88 to infer the two worst decades for Australian mammal extinctions.
8. Justify your answer to Question 7.
biomimicry the design of materials and structures that are modelled on biological forms (such as animals or biological processes)
sTEM activity: Applying biomimicry to solve a human problem
Background information
SAMPLEPAGES
Engineering is a varied and exciting industry. Engineers often work with designers and architects to use the natural world as inspiration for solving engineering problems and to develop new products that improve our lives. Some examples of biologically inspired designs include Velcro® based on the prickly burrs that stick to your socks on a bushwalk, adhesives that mimic the sticky feet of geckos, air conditioning based on air flow in termite mounds and sonar navigation technology inspired by the echolocation abilities of bats.
This area of science is called 'biomimicry', which means to imitate life or to learn from nature. Because biomimicry copies nature, it offers millions of possibilities for technologies due to the diverse range of animals, plants and insects.
Consider some of the challenges that we face as humans. The natural world faces these challenges too, so engineers can study the way plants, animals and insects approach these challenges and then improve their own designs. For example, the water filters in water treatment plants are designed to act like animal cell membranes, which let certain substances pass through while others are kept out. In addition, studying a leaf and how it captures the Sun's energy allowed for the creation of more effective solar cells by engineers.
DESIGN BRIEF
Apply biomimicry to solve a human problem
activity instructions
In teams, you will become design engineers who will use the biomimicry of plants, insects or other animals to develop and design a sustainability-related invention that solves a human problem. Examples of problems you may like to look at could be food waste, transportation, building design, lighting, landscaping or water use.
Figure 2.89 At the Sydney 2000 Olympics, Speedo launched their Fastskin® suits, which were designed to mimic shark skin. They are made from a woven ribbing fabric that reduces drag while still allowing movement.
Your team will not only draw a detailed and labelled diagram of your design, but also describe your design by listing the special features and which plant, insect or other animal inspired those features. Remember to ask yourselves throughout the process: 'What would nature do here?'
Suggested materials
• A3 and A4 paper
• pens, pencils
• ruler
Research and feasibility
1. Discuss and agree on a human problem to study with your group. Start to research the issue by making a list of all the main causes of the problem and the effects they have. An example is given below for the issue of road traffic.
Major causes of trafficEffectsWhat would animals do here?
Too many cars Causes traffic jams. Ants have specialised patterns of movement as they encounter traffic. They move faster but add additional lanes.
Blockages on the roadsTraffic comes to a complete stop. If there is anything blocking an ant's path, an ant will remove it, which allows the other ants to move past without interference.
2. In a statement, explain the human problem and the cost to society (this is not just monetary, but also includes environmental, social and psychological costs, among others).
Design
3. Identify your plant, insect or other animal and its scientific name, and briefly describe why mimicking the organism could help with a prospective solution to the human problem.
4. Describe the unique features of your organism. Are these characteristics linked to its classification?
5. Describe how you mimic the material, colour and structure of the organism to design something new.
6. List the materials and their physical properties required to realise your design (remember that you do not need to build your design, so think about all possibilities).
7. Describe how each material was used and for what purpose. You may wish to use a table like this one:
Materials
Create
Physical propertiesPurpose of material
SAMPLEPAGES
8. Sketch out ideas within your group and vote on which uses biomimicry to solve the human problem the best.
9. Create a scale drawing of your invention, including a front and side view of it.
10. Describe your design by listing its features and explain which aspect of your organism inspired those features.
Evaluate and modify
11. Evaluate your design and its ability to solve the problem you identified. What improvements would you make?
Figure 2.90 A simple shell could be your inspiration for an ethically sustainable house.
Chapter 3 Interactions in ecosystems
SAMPLEPAGES
Introduction
Despite now being in secondary school, you are not as independent as you might think. You are part of a global ecosystem that is made up of several smaller ecosystems. In fact, you are an ecosystem yourself, supporting many trillions of organisms who live on or in your body! You play a small role in a larger interdependent system where organisms depend on each other and the physical aspects of their environment to provide them with what they need to survive. In this chapter, you will look at the interaction of organisms and their environment. You will also explore how any activity that disturbs this interconnectedness will affect ecosystems.
Section 3.1
Section 3.2
Section 3.3
Section 3.4
Section 3.5
Concept map
Abiotic (non-living) factors
Biotic (living) factors
Biodiversity
Threats and human
Roles and relationships between organisms and the environment
Curriculum content
matter and energy flow through ecosystems and can be represented using models, including food webs and food pyramids; populations will be affected by changing biotic and abiotic factors in an ecosystem including habitat loss, climate change, seasonal migration and introduction or removal of species (VC2S8U04)
• analysing food webs to show feeding relationships between organisms in an ecosystem and the role of microorganisms
SAMPLEPAGES
• using food pyramids to represent the difference in the amount of energy at each trophic level in a food web, with primary producers forming the first trophic level
• predicting the effects on local ecosystems when organisms such as pollinators or predators are removed from or die out in an area
• examining how events such as seasonal changes, destruction of habitat and introduction of a species impact abiotic and biotic factors and cause changes to populations
• investigating Aboriginal and/or Torres Strait Islander Peoples' responses to invasive species and their effect on food webs that many communities are a part of, and depend on, for produce and medicine, for example collaboration between the Traditional Owners (Kungarakan and Warai Peoples) of the Rum Jungle mine site near Darwin and the Australian Government to mitigate dispersal of gamba grass seeds by means of seed eradication and foliage spraying to control the spread of the gamba grass as well as reduce impacts on vulnerable ecosystems
• considering how Aboriginal and/or Torres Strait Islander Peoples' fire management practices over tens of thousands of years have changed the distribution of flora and fauna in most regions of Australia, for example researching changed Australian landscapes over time from rainforest vegetation to sclerophyll vegetation, including the impact of Aboriginal cultural burning practices, and looking at the ecological effects of disruptions to long-held Aboriginal cultural burning practices, such as the wildfires that swept through the Leadbeater's possum habitat in the Central Highlands of Victoria and caused significant population decline in an already-endangered species
scientific knowledge, including models and theories, can change because of new evidence (VC2S8H01)
• investigating how Aboriginal and/or Torres Strait Islander Peoples' traditional ecological and zoological knowledge informs sustainable harvesting practices of species such as dugongs, turtles, the short-finned eel and the Bogong moth
multidisciplinary endeavours to advance scientific knowledge make use of people's different perspectives and worldviews (VC2S8H02)
• considering why it is important to recognise that different people in society have different perspectives on the introduction of biological controls to eradicate an invasive species 3.5
proposed scientific responses to socio-scientific issues impact on society and may involve ethical, environmental, social and economic considerations (VC2S8H03)
• examining how laboratory-grown meat might reduce impacts on ecosystems, and considering any social, ethical and economic implications of developing laboratory-grown meat for wide consumption
• investigating the contributions of Aboriginal and/or Torres Strait Islander Peoples' knowledges in the identification of medicinal properties of endemic plants, and the ethical, environmental, social and economic implications of others using these knowledges
communication of scientific knowledge has a role in informing individual viewpoints, and community policies and regulations (VC2S8H04)
• examining how the inclusion of Aboriginal and/or Torres Strait Islander Peoples' scientific knowledges can enrich policies and regulations, for example cultural burning practices informing planned burning in Victoria
biome a large environment that is classified based on various abiotic factors and the organisms found there environment the physical conditions in which an organism lives ecosystem the interrelationship between living and non-living components of a specific area biotic relating to the living things in an ecosystem abiotic relating to the non-living things in an ecosystem
3.1 What is an ecosystem?
Learning goals
At the end of this section, I will be able to:
1. Recognise the difference between biotic and abiotic factors in an ecosystem.
2. State the various levels of organisation in an ecosystem.
A biome is an area of Earth that has a particular climate and certain types of living things. We classify biomes based on the physical environment and the main type of organisms that are found there.
Broadly, the five major biomes on Earth are aquatic, desert, forest, grassland and tundra.
Within biomes, there are different ecosystems. For example, within the broad forest biome, there are temperate forest ecosystems, tropical rainforest ecosystems and taiga forest ecosystems. An ecosystem can be described as an area where living organisms interact with each other and the surrounding non-living environment. While a biome is a broad classification of an area, an ecosystem considers the interactions within that biome. All parts of an ecosystem are linked and even the smallest changes can produce large effects.
Describing ecosystems
When scientists discuss ecosystems, they are referring to the interactions between the living (biotic) and non-living (abiotic) features within an area. Biotic factors consist of populations of different organisms plus the organic matter produced by them. Even though waste material such as faeces and bones is not living, it is considered biotic because it came from living things. Abiotic factors include physical things such as rocks and sand, but also things that can be measured, such as temperature, wind speed and pH.
Try this 3.1 Biomes
Using the photos in Figure 3.1, work with a partner to classify each as one of the five main biomes. Consider the climate and the types of organisms that would live there.
Figure 3.1 The five major biomes on Earth
Biomes
Tundra
Taiga
Montane grasslands and shrublands
Temperate coniferous forests
Temperate broadleaf and mixed forests
Temperate grasslands, savannas and shrublands
Tropical and subtropical coniferous forests
Tropical and subtropical moist broadleaf forests
Tropical and subtropical dry broadleaf forests
Tropical and subtropical grasslands, savannas and shrublands
Mediterranean forests, woodlands and scrub
Deserts and xeric shrublands
SAMPLEPAGES
Flooded grasslands and savannas
Mangroves
Polar
Some examples of biotic and abiotic features are listed in Table 3.1.
The MRS GREN acronym (see Figure 3.3) details seven processes common to all living things, and can help when you're trying to classify an environmental feature as biotic or abiotic.
Table 3.1 Some examples of biotic and abiotic features of ecosystems
3.3 All living things demonstrate these seven processes.
Figure 3.2 A world map showing different ecosystems
habitat the place where an organism lives adaptation a characteristic that helps an organism survive in its environment
Try this 3.2
Desert ecosystems
The desert biome includes hot and dry deserts, semi-arid deserts, coastal deserts and cold desert ecosystems. Munga-Thirri National Park, also known as the Simpson Desert, is a hot and dry desert situated near the borders of Queensland, South Australia and the Northern Territory, and covers over 170 000 square kilometres. Observe the three images in Figure 3.4, and list as many biotic (living) and abiotic (non-living) features of this ecosystem as you can. Chat with a partner and see if they had any additional ideas you could add to your lists.
SAMPLEPAGES
Habitats
Organisms, such as plants, animals and bacteria, have a specific range of conditions that allow them to survive, thrive and reproduce. The location in an ecosystem where they usually live, and which meets their needs, is known as a habitat. If you consider an ecosystem as a suburb where an organism lives, then the habitat is the organism's address in that suburb.
Requirements that an organism needs to survive and reproduce include:
• food
• water
• shelter
• space to live
• other organisms of the same species for reproduction.
3.5 (a) Habitats can range in size from a single skin pore to huge forests. After studying human skin, scientists have discovered that each pore contains a single variety of Cutibacterium acnes bacteria. (b) How many different potential habitats can you spot in this photo from Gariwerd/Grampians National Park?
Every organism has its own habitat requirements. Some animals can survive in more than one habitat. Other animals are limited to specific habitats and may have adaptations that allow them to survive there. Although dingoes prefer to live by the edges of forests next to grasslands, they can be found in every habitat in every state of Australia except Tasmania. They are only limited by their access to water. This is unlike the koala, which has adaptations that allow it to only eat eucalyptus leaves, so it is only found in habitats that support eucalyptus trees.
Figure 3.4 Three images of Munga-Thirri National Park
Figure
Adaptations can be classified into three types: structural, behavioural and physiological. Structural adaptations are physical or anatomical features of an organism that enhance its chances of survival. For example, some plants have protective thorns to reduce the risk of predation, and kangaroos have a long tail and powerful hindquarters for efficient locomotion.
SAMPLEPAGES
Behavioural adaptations are actions taken by animals to increase their success in their environment. For instance, many species exhibit nocturnal behaviour (being active at night) to decrease the risk of predation, or to survive in very hot ecosystems.
Physiological adaptations are processes that occur within an organism's body systems or cells, improving its chances of survival. For instance, desert animals have highly efficient kidneys that enable them to produce extremely concentrated urine to conserve water in their arid environments.
Quick check 3.1
1. Define these terms: ecosystem, biotic, abiotic, habitat.
2. Name four different types of ecosystems.
3. Name three examples of biotic and abiotic factors in an ecosystem.
4. Discuss what makes a habitat a home for a particular organism.
Levels in an ecosystem
When scientists discuss the biotic aspects of an ecosystem, they can be described at different levels from small to large: individual, population and community. Figure 3.7 summarises each level. Consider the mangrove swamps under the West Gate Bridge, in Melbourne. This ecosystem is composed of biotic and abiotic components, and all their interactions. The community consists of all the different species of organisms in that ecosystem. The mangrove trees provide shelter for many species of fish, as well as roosting and feeding opportunities for birds and bats. Their root network provides a habitat for crabs, snails and insects.
The population of bream represents a group of the same species living in that habitat. Their total number is referred to as their abundance. An individual is a single living organism, such as one bream fish.
population all organisms of a particular species or group who live in one area community a group of animals or plants that live or grow together abundance the number of individuals of a species within a community or ecosystem
Figure 3.6 The dingo can survive in a wider range of habitats than the koala.
Figure 3.7 The levels of organisation in an ecosystem. In this example, the population of bream lives in a mangrove swamp.
Explore! 3.1
Threatened communities in Victoria
In Victoria, there are 10 critically endangered ecological communities and seven endangered communities.
One critically endangered community is the grassy eucalypt woodland of the Victorian volcanic plain. It is home to the endangered spotted-tail quoll, the eastern-barred bandicoot and the swift parrot, among other species. Research some of the species in this community and decide why this community was included in the Environment Protection and Biodiversity Conservation Act.
SAMPLEPAGES
Figure 3.8 Threatened ecological communities in Victoria
Try this 3.3 ecosystems
In small groups, come up with five different ecosystems and write them down. Then, as a class, list them on the board, avoiding any repetition. Discuss whether some areas can be further broken down into several habitats.
SAMPLEPAGES
Try this 3.4
Demonstrating the organisation of ecosystems
Select a Victorian organism you find interesting. Some endangered examples are the mountain pygmy possum and the orange-bellied parrot. On a piece of A3 paper, put the name of this organism in a small circle in the centre of your page – this is your individual. You may like to include a picture of your organism. Now draw a larger circle around your individual. This will be your population. Continue to add examples of each level of organisation as you work all the way up to a biome.
Quick check 3.2
1. Define the terms 'environment', 'community' and 'population'.
2. Name a specific habitat and propose a community, population and individual that would be found in that habitat.
3. Draw a pyramid like the one in Figure 3.10. Sequence the following terms to demonstrate the levels of organisation, by size: individual, ecosystem, biome, population, community.
Making thinking visible 3.1
Compass points: Laboratory-grown meat
Laboratory-grown meat sounds like something from a sci-fi movie, but we are closer than you might think to being able to buy it in supermarkets. Making laboratory-grown meat is based on tissue engineering. Scientists take cell samples from animals and then identify nutrients required for the cells to grow. They are grown in a nutrient bath, and it takes about two weeks for the sample to grow to the desired size. The meat is then made into a finished product, such as a burger or steak.
Figure 3.9 Squeaky Beach at Wilsons Promontory National Park, where the bushland meets the beach. This is an example of multiple habitats in one area.
Figure 3.10 Levels of organisation in an ecosystem
Figure 3.11 Beef produced from cells and grown in a petri dish (right), compared to the real thing
greenhouse gas a gas that causes heat to be trapped in the atmosphere
Some of the proposed benefits of laboratory-grown meat are:
• an estimated reduction in greenhouse gas emissions by up to 96 per cent
• ethical benefits, such as reduced stress on livestock and less slaughtering of livestock
• reduction in land required for livestock and growing livestock feed. Agriculture is the biggest cause of land clearing in Australia. Since 1750, Victoria has lost 79 per cent of its native vegetation on private land and 12 per cent on public land.
• decreased water use. Agriculture accounts for over 70 per cent of global water use and, by 2050, the UN predicts that 6 billion people will experience water shortages, mainly due to an increasing global population. During droughts there is less feed available for livestock, which compete directly with native wildlife such as kangaroos. Kangaroos have been culled to reduce competition, and this raises further ethical questions about the prioritisation of certain species over others.
• addressing global food hunger. By 2050, the global population is expected to reach 9.8 billion, placing food production under greater stress.
Studies have shown that laboratory-grown meat will be cost-effective and ready for widespread consumption by 2030, but there are social, ethical and economic implications to consider.
Complete the Compass points activity about laboratory-grown meat:
1. E = Excited: What generates enthusiasm within you regarding this concept? What are the potential benefits?
2. W = Worries: What causes concern about this idea? What are the potential drawbacks?
3. N = Need for information: What other details or facts are necessary to evaluate this idea? What additional knowledge would aid in assessment?
SAMPLEPAGES
4. S = Suggestion for progress: What is your current viewpoint or proposal regarding this idea? How can you continue to assess this concept?
The Compass points thinking routine was developed by Project Zero, a research centre at the Harvard Graduate School of Education.
Figure 3.12 One of the biggest global drivers of deforestation is agriculture.
Section 3.1 review
Section 3.1 questions
Remembering
1. Sequence the following terms from largest to smallest: A. population B. community C. biome D. individual E. ecosystem
2. Suggest some abiotic features of the Great Barrier Reef.
3. Identify three biotic features of the Great Barrier Reef.
Understanding
4. Define the term 'habitat'.
5. Look at Figure 3.13 and identify parts of the ecosystem such as communities, abiotic and biotic factors, populations and habitats.
Applying
6. Describe how biomes are classified.
7. Describe the adaptations of a shark that make it suited to its environment.
Analysing
8. Compare the terms 'ecosystem' and 'environment'.
Go
SAMPLEPAGES
9. Using a Venn diagram, compare abiotic and biotic factors in an ecosystem. Give an example of each.
Evaluating
10. Environmental conditions are changing in ecosystems every day. Propose what changes in abiotic factors occur in a desert ecosystem over the course of a day and how these changes would affect the biotic parts of the ecosystem.
11. 'All populations living together within a community interact with one another and with their environment to survive and maintain a balanced ecosystem.' Decide whether you agree with this statement. Give reasons for your decision.
Figure 3.13 Crystal Brook Falls, Mount Buffalo, Victoria
3.2 Interactions between organisms and their environment
Learning goal
At the end of this section, I will be able to:
SAMPLEPAGES
ecological niche the role and space that an organism fills in an ecosystem, including all its interactions with the biotic and abiotic factors of its environment interdependence the dependence between different species in a community symbiosis a long-term close interaction between two organisms of different species interspecific occurring between members of different species intraspecific occurring between members of the same species
VIDEO Interspecific and intraspecific relationships
1. Describe five different species interactions in an ecosystem.
Abiotic factors affect the overall distribution and abundance of organisms within an ecosystem. Some organisms have a narrow tolerance range for a certain abiotic factor, such as temperature, and this will determine where they can live.
Seasonal changes affect populations of organisms in many ways. Between short winter days and long summer sunlight hours, abiotic factors such as the amount of light and temperature fluctuate. Different species tend to reproduce at certain times of the year, so their numbers might peak during spring, or decrease dramatically during winter if they migrate out of the ecosystem in search of warmer climates.
Global warming is having a dramatic impact on ecosystems: rising temperatures are changing food availability, and extreme weather events and natural disasters such as droughts and floods are altering abiotic factors such as the level of moisture in environments. This throws ecosystems out of balance, and affects the type of organisms that can tolerate, and thrive, there.
kingdom, from its Arctic circle breeding ground to Antarctica and back again each year, a journey of at least 40 000 kilometres. The perpetual summer improves feeding conditions for the terns, with calmer seas and more sunlight to spot fish and insects.
The role and space that an organism fills in an ecosystem, including all its interactions with the biotic and abiotic factors of its environment, is known as its ecological niche. This includes its habitat, feeding relationships and interactions with other organisms. These species interactions within the community may help, harm or have no effect on the organisms involved. In some cases, some organisms may require other organisms to survive; this is known as interdependence. Competition, predation and symbiosis are the three main types of species interactions.
Competition
Organisms occupying the same ecological niche will compete with one another for resources that are in limited supply. This occurs when different organisms require the same resources to survive, such as food, space, shelter and mates. Interspecific competition is competition for resources between members of different species. For example, kangaroos and sheep compete for grass as their major food source. In contrast, intraspecific competition occurs between members of the same species.
Figure 3.14 An arctic tern (Sterna paradisaea) undertakes the longest migration in the animal
Quick check 3.3
1. Define the terms 'interspecific competition' and 'intraspecific competition'.
2. Describe what happens when two species are competing for food, and one species is better adapted or stronger.
Predation
SAMPLEPAGES
A predator–prey relationship occurs when one organism, known as the predator, kills and eats another organism, known as the prey Herbivory is a type of predation where the prey is a plant. It is unusual for predators to depend upon one species of prey, so if one prey species reduces in supply, the predator can prey upon other species. For example, dingoes prey on rabbits, but can also eat other small mammals. The relationship between predator and prey is usually balanced, but occasionally this can change. For example, favourable conditions may lead to an increase in the prey population, which in turn can lead to an increase in the number of predators. If a period of adverse conditions reduces the prey population, predators will turn to another prey species and there may be an increase in intraspecific competition among the predators.
Try this 3.5
Predator–prey relationships
Feral rabbits have natural predators such as the feral red fox. However, the natural ability of rabbits to reproduce quickly has enabled them to thrive within Australia. Generally, if there is a shortage of prey, then fewer predators will survive in that environment.
Another predator and prey relationship occurring in the deserts of Australia is that of the red kangaroo and the dingo. The dingo is the apex predator in this biome and although dingoes do not usually prey on kangaroos, they will hunt and kill them when food is scarce.
Using Figure 3.15, answer the following questions:
1. Identify when red kangaroos were most abundant.
2. State what happens to the dingo population as red kangaroo numbers increase.
3. Examine what happens to the dingo population size when the red kangaroo population size decreases.
4. Describe the pattern of the predator–prey relationship shown in the graph.
5. Identify and discuss a factor, other than the red kangaroo population, that may influence the size of the dingo population.
6. Identify and discuss a factor, other than the dingo population, that may influence the size of the red kangaroo population.
predator an organism that obtains food by killing and consuming other organisms prey an organism hunted and killed by another organism for food herbivory the consumption of plants
Dingo and kangaroo population changes over time
Dingo
Red kangaroo
Figure 3.15 Population sizes over time for the dingo (in blue) and the red kangaroo (in red)
mutualism
a symbiotic relationship where both organisms benefit
pollinator an organism that moves pollen from one plant, or part of a plant, to another commensalism a symbiotic relationship where one organism benefits and the other organism doesn't benefit but is not harmed
symbiosis
Symbiosis is an interaction where individuals from two different species share a close and long-term relationship with each other. There are three major types of symbiosis: mutualism, commensalism and parasitism.
Mutualism
Mutualism is a symbiotic relationship between two organisms in which both benefit from the association. For example, plants have a mutualistic relationship with pollinators. Some plants, such as grasses, are pollinated by wind, but many flowering plants rely on insects, birds or small mammals to transfer pollen from one plant to another. In a plant–pollinator relationship, the pollinator benefits as it feeds on the nectar provided by the flower. In return, the plant benefits as the pollinator transferring pollen enables the plant to reproduce.
SAMPLEPAGES
Another example of mutualism is the alpheid shrimp and the goby fish. Alpheid shrimps are nearly blind, so they dig burrows to stay safe. However, when above ground, they are vulnerable to predators. When the shrimp is foraging or excavating outside its burrow, a goby fish will stand guard at the entrance to the burrow, which it shares with the shrimp. The shrimp always stays in antennal contact with the goby fish's tail, which the fish will flick whenever there is danger. Both members of the relationship benefit: the goby fish gets a burrow to live in, while the shrimp is warned of predators.
Commensalism
Commensalism is a rare type of symbiotic relationship in which one organism benefits, while the other organism is essentially unaffected (it doesn't benefit, but isn't harmed either). One example is the pearl fish (Carapus mourlani) and the sea cucumber. The pearl fish spends its day in the intestines of the sea cucumber, emerging at night to feed on small crustaceans.
3.17 Army ant raids are a coordinated hunting swarm of thousands, sometimes millions, of ants. The ants spontaneously move out of their nest, moving together across the forest floor to hunt for food.
The pearl fish is protected from predators while inside the sea cucumber, which does not appear to be harmed. Another example is birds following army ants when the ants raid the forest floor. During the raid, the birds feed on the flying insects that are stirred up.
Figure 3.16 The relationship between the goby fish and the alpheid shrimp is mutualistic.
Figure
Parasitism
Parasitism is a symbiotic relationship in which one species benefits and the other is harmed. The species that benefits is called the parasite and the one that is harmed is the host. The host is harmed but rarely killed, because the parasite would die too! Instead, the parasite survives on or in the host, taking nutrients or growing and reproducing in organ systems, causing disease.
There are two main types of parasites: ectoparasites and endoparasites. 'Ecto' means outer or external, so ectoparasites live on the surface of other organisms. An example is lice or ticks. 'Endo' means inner or internal, so endoparasites live inside other organisms. An example is worms or protozoans.
Figure 3.18 These tapeworms are endoparasites that inhabit the digestive tracts of animals (including humans). Tapeworms use their specialised hooks to anchor themselves in the intestine and absorb nutrients through their body wall. Disturbingly, they can grow to several metres in length, but they do not necessarily cause symptoms.
Explore! 3.2
Varroa mites
Varroa mites are tiny ectoparasitic mites that target European honey bees and are considered the world's most damaging bee pest. The mites lay their eggs in the bee brood (eggs and larvae) and emerge to attach onto adult bees' abdomen, feeding on the haemolymph (the equivalent of blood).
SAMPLEPAGES
Australia was one of the last remaining countries in the world to remain clear of varroa mites, but that all changed in June 2022, when they were detected in the sentinel bee hives at a sea port in Newcastle, NSW. Sentinel hives, of which there are 170 at various ports around Australia, are highly monitored hives that allow apiarists and government biosecurity staff to track the emergence of new bee diseases and pests that might arrive on board container ships. Initially, the outbreak was thought to be isolated to the Newcastle area, but in late 2023, infestations were detected near the NSW–Victorian border. The varroa mite population within a hive grows incredibly quickly, weakening the bees it infects as well as spreading viruses from bee to bee, leading to the deaths of entire colonies. Affected hives had to be immediately destroyed, and Agriculture Victoria put bans in place for the movement of hives in order to prevent the spread.
Figure 3.19 A bee affected by varroa mite
Infestations at Euston and Balranald (NSW) with pink surveillance zones extending across the border into Victoria
Figure 3.20 A map showing the status of the varroa mite emergency in August 2023. Red zones are eradication zones where hives were euthanised.
Conduct some research to answer the following questions, noting the publication dates on websites. The 'BeeAware' and Agriculture Victoria websites are a good starting place, as they are reliable sources that will provide up-to-date information on the outbreak.
1. List some horticultural and agricultural crops that rely on bees for pollination.
2. Predict the effects on a local ecosystem when a pollinator species dies out.
3. Explain what impact the loss of commercial bee hives might have on honey and food production in Australia.
4. What is the current status of varroa mite infestation in Victoria? Refer to the emergency zone maps and updates to track the spread.
5. Describe the measures that were initially put in place to control the spread and deal with affected hives. Are these measures still current?
The main types of interactions between organisms in an ecosystem are summarised in Table 3.2.
InteractionSpecies 1Species 2
SAMPLEPAGES
Example
CompetitionHarmHarmKangaroos and sheep compete for grass.
PredationBenefitHarmCrocodiles prey upon insects, fish, frogs, lizards, crustaceans and small mammals.
ParasitismBenefitHarmThe mange mite burrows into the skin of wombats where it lays its eggs and causes irritation.
MutualismBenefitBenefit The boxer crab carries a pair of small anemones in its claws. When a predator approaches, the crab waves the anemones around, deterring the predator due to the stinging tentacles. The anemones benefit as they get small particles of food from the crab during feeding.
CommensalismBenefitNo effectCattle egrets walk close to where cattle are grazing because the cattle stir up insects from the vegetation that the egrets can eat.
Table 3.2 Summary of some of the interactions that occur in an ecosystem. The bottom three interactions are symbiotic.
VIDEO Relationships between organisms
First detected at Newcastle
SAMPLEPAGES
Making thinking visible 3.2
Connect, extend, challenge: Interactions with living things
Biologists must often interact with living things in the laboratory and in the field. Ideas about ethics have changed over time, and now there are regulations governing our interactions with other living things.
Despite their large size, whale sharks are hard to track. Previously, DNA samples were taken with a harpoon, which was expensive and invasive.
But whale sharks shed their DNA directly into the ocean via skin, faeces, mucus and other biological material. This is called environmental DNA or 'eDNA' and scientists are now simply analysing seawater samples to track individual whale sharks. This is a cheaper and more ethical option to monitor species.
After reading about interacting with living things, reflect on the following:
• How do the concepts and details connect to your existing knowledge?
• Which new insights did you gain from the text that expanded your understanding or encouraged you to consider new perspectives?
• What questions arise for you after processing this information?
The Connect, extend, challenge thinking routine was developed by Project Zero, a research centre at the Harvard Graduate School of Education.
Figure 3.21 Examples of (a) parasitism, (b) mutualism and (c) commensalism
Figure 3.22 A scientist using a harpoon to collect a whale shark DNA sample
Go online to access the interactive
Quick check 3.4
1. Complete the following table, describing the types of relationships between organisms. Use a smiley face, sad face or neutral face to represent how each organism is affected, and include an example of each type of relationship.
RelationshipDefinition
Competition
Mutualism
Commensalism
Parasitism
Effect on organism 1
Effect on organism 2 Example
SAMPLEPAGES
2. Contrast an ectoparasite and an endoparasite.
Try this 3.6
What is the interaction?
Look at each of the images in Figure 3.23 and, with a little research, decide which type of interaction is being demonstrated.
3.23 Examples of different types of interactions between organisms: (a) a leech on human skin, (b) two kangaroos fighting and (c) a lemon shark with a remora fish on its back
Section 3.2 review
Section 3.2 questions
Remembering
1. Define the terms 'parasitism', 'mutualism' and 'commensalism'.
2. Using what you have learned about interactions in ecosystems, name an example of each of the following interactions in which humans are involved. a) mutualism b) parasitism c) commensalism d) predator–prey e) interspecific competition f) intraspecific competition
Understanding
3. When there is a large increase in the population size of a prey animal, recall what tends to happen to the population size of the predators.
Figure
Applying
4. Explain what is meant by an organism's 'ecological niche'.
5. A bee feeds on the nectar from a flower. Explain why this is an example of mutualism.
Analysing
6. Look at the graph in Figure 3.24.
SAMPLEPAGES
Figure 3.24 Red kangaroo and dingo populations from 1950 to 2010
a) Identify which line colour represents the population of dingoes over time.
b) Determine the population of dingoes in the year 2000.
c) Identify the year that had the largest dingo population.
d) Identify the pattern between the two populations with reference to the terms 'predator' and 'prey'.
e) Deduce the population of red kangaroos when the population of dingoes was at its peak.
f) Infer why the red kangaroo population was greatest in the mid-1990s.
g) Estimate the decrease in red kangaroo populations from the peak in 1995 to the lowest point in 1998. Suggest a possible reason for this sudden decrease in red kangaroos.
h) In the year 2015 the red kangaroo population fell to a trough of approximately 300 in this region. Predict how the dingo population might have changed in this time.
i) Predict the populations of red kangaroos and dingoes in 2030, given the data in the graph.
7. Compare an ectoparasite and an endoparasite, providing examples of each.
8. Examine the role of mutualistic relationships within ecosystems, using examples not already used in this chapter.
Evaluating
9. Justify the importance of both interspecific and intraspecific competition within an ecosystem.
10. Decide whether the following descriptions are examples of mutualism, commensalism or parasitism.
a) A man has tinea (a fungus) growing between his toes.
b) A woman notices that her cat looks bloated. She takes it to the vet and they suggest deworming the cat, as it probably has a tapeworm.
c) Small fish swim around on the back of whale sharks for protection from predators.
d) Birds stand close to wild buffalo and eat the insects that are stirred up as the buffalo graze.
11. If all the predators from an area were removed, discuss the positive and negative effects on the ecosystem.
3.3 Energy flow and feeding relationships
Learning goals
At the end of this section, I will be able to:
1. Construct and interpret food chains and webs that show feeding relationships.
2. Model how energy flows through an ecosystem using a food pyramid.
3. Predict the effects on ecosystems when living things are removed from an area.
energy
When it comes to energy, ecosystems are not closed. They need a constant input of energy, and the ultimate source of energy for most ecosystems is sunlight. Plants convert this light energy to make their own food. The chemical energy in the food can then be used by the plant. Animals cannot produce energy directly from the Sun. Instead, they must eat plants, or other animals that eat plants, to gain the chemical energy trapped in food.
Once an organism has acquired its food, it can release the energy through a process called cellular respiration. This is a chemical reaction that takes place at a cellular level.
This is the word equation for cellular respiration:
SAMPLEPAGES
The energy produced in cellular respiration is used for all the processes in each living organism. Organisms use the energy to grow and reproduce, repair and replace their structures, and respond to their environment. A common mistake is to think that plants do not perform cellular respiration because they make their own food. In fact, they must do cellular respiration; otherwise the chemical energy in the food they produce would never get released.
Figure 3.25 All the energy in an ecosystem originally comes from sunlight.
Figure 3.26 The plant can convert light energy into its own food, but the spider must hunt for food.
which
release energy from food
Figure 3.27 The process of cellular respiration
Quick check 3.5
1. Define the term 'energy' in your own words.
2. Explain what energy is needed for.
3. Explain why cellular respiration is a necessary process carried out by all living things.
4. Name the inputs and outputs of the process of cellular respiration.
Producers
Producers, such as plants, perform a chemical reaction called photosynthesis in order to make their own food. Structures in the green leaves trap sunlight, and this light energy is used to convert carbon dioxide from the air and water from the soil into sugar and oxygen, via a chemical reaction. The sugar is the plant's food and is stored to be used later. The oxygen is a waste product, and is released into the air. Note that one of the chemical reactants (carbon dioxide) in photosynthesis is the waste gas that we breathe out!
This is the word equation for photosynthesis:
SAMPLEPAGES
Plants then break down the sugars via cellular respiration, releasing energy. This energy is used by the plant to grow, reproduce and repair itself.
1. Discuss
2. Explain why photosynthesis is a process carried out by plants.
3. Name the inputs and outputs of the process of photosynthesis.
carbon dioxide + water glucose + oxygen light →
Figure 3.28 Plants will grow towards the light to increase photosynthesis.
Figure 3.29 The process of photosynthesis
Quick check 3.6
why plants are called producers.
Investigation 3.1
observing photosynthesis
Aim
To investigate the effect of changing light intensity on photosynthesis.
Time period
Approximately 2–3 days
Prior understanding
Be careful
Bromothymol blue can be harmful when inhaled. Blow into the balloon and then use the balloon to bubble carbon dioxide into the water. Do not blow directly into the solution. Ensure the room is well ventilated and wear appropriate personal protective equipment.
Photosynthesis uses carbon dioxide (CO2), water and light energy to make glucose and oxygen. Aquatic plants extract dissolved carbon dioxide from the water to photosynthesise. A way to measure the amount of dissolved carbon dioxide in the water is to add the indicator bromothymol blue. The water will then appear yellow when a high concentration of carbon dioxide is present and turn to blue as the concentration of dissolved carbon dioxide is reduced.
Hypothesis
Predict what will happen to the colour of the water over several days.
Materials
• aquatic plant
• bromothymol blue solution (acts as an indicator to show whether photosynthesis is occurring)
• small conical flasks × 4
• 500 mL beaker
Method
1. Pour 320 mL of water into a 500 mL beaker.
• large measuring cylinder
• straws
• balloons
• aluminium foil or stopper
2. Add enough drops of bromothymol blue solution to turn the water a pale blue colour.
3. Blow up a balloon and insert a straw into the end of it as shown in Figure 3.30, pinching it shut to hold in the air.
4. Dissolve carbon dioxide into the water by inserting the straw into the beaker and gently releasing the air into the solution, causing it to bubble through for approximately 1 minute until the water turns pale yellow.
5. Label each conical flask with the following information:
Group 1: Control
Description: No plant in light
Date:
SAMPLEPAGES
Student/s name:
Group 2: Light
Description: Plant in light
Date:
Student/s name:
Group 3: Control
Description: No plant in dark
Date:
Student/s name:
8. Cover each flask with aluminium foil or insert a stopper.
Group 4: Dark
Description: Plant in dark
Date:
Student/s name:
6. Measure out 80 mL of bromothymol blue + water solution from Step 4 and pour it into one of the four conical flasks. Repeat this for each of the three remaining flasks.
7. Add a 7 cm piece of the aquatic plant to the Group 2 and Group 4 flasks. Use the straw to gently push the plants into the water to make sure they are submerged.
Figure 3.30 Balloon with straw inserted
9. Copy the table shown in the results section into your science book.
• Label the independent variable and its groups in the table.
• Label the dependent variable in the table.
10. Record the initial colour of the water in each flask.
11. Position the flasks as described on the label:
• Group 1 and Group 2 flasks next to a window
• Group 3 and Group 4 flasks in a cupboard away from any light.
12. Observe the flasks after 2–3 days. Has the colour changed?
Results
Table showing water and carbon dioxide changes in different light conditions
Dependent variable
Change in dissolved carbon dioxide?
• None
SAMPLEPAGES
Independent variable
Group 1 _________________
Group 2 _________________
Group 3 _________________
Group 4 _________________
Discussion: Analysis
• Some reduction
• Substantial reduction
1. Identify any trends, patterns or relationships in your results.
2. Explain what a change of colour means in terms of whether photosynthesis is occurring in the plant. What does it mean when the solution is yellow? What does it mean when the solution is blue?
Discussion: Evaluation
1. Discuss whether there was any change in the control flasks. Explain why you think this is.
2. Explain the importance of having flasks with no aquatic plants.
3. Were there any errors during this experiment that you could have minimised? Propose any changes that could be made to the method to improve the quality of the data in future experiments.
Conclusion
1. Form a conclusion from this experiment about the relationship between light and photosynthesis in plants, by copying and completing this statement in your science book. From this activity it can be claimed that __________. This is supported by the observations that _____________. Therefore, the hypothesis is/is not supported by these findings.
consumer an organism that obtains food by consuming other organic material
herbivore an organism that eats only plants
omnivore an organism that is naturally able to eat both plants and meat
carnivore an organism that eats only meat
Consumers
Organisms that cannot create their own food from sunlight must eat plants and/or animals for energy. These organisms are called consumers. Some organisms get their energy from directly eating plants, while others eat other animals that have already eaten plants. Organisms that eat only plants are called herbivores. Organisms that eat both plants and other animals are called omnivores. Organisms that eat only other animals are called carnivores
SAMPLEPAGES
Try this 3.7
How do I get my food?
The organisms shown in Figure 3.32 are found in Victoria. Research these organisms and classify them as producers, herbivores, omnivores or carnivores.
Figure 3.31 (a) Pademelons are herbivores. (b) Brush-tailed possums are omnivores. (c) Kookaburras are carnivores.
Figure 3.32 Some Victorian organisms
Southern right whale Bush-stone curlew Rakali
Yellow-tailed black cockatoo River red gum Platypus
Did you know? 3.1
Life deep under the sea
Until around 35 years ago, scientists believed that all life relied on energy gained from photosynthesis. Research on underwater volcanic vents, far deeper than light can penetrate, uncovered some unusual bacterial species. Instead of using light, the bacteria use chemicals produced by the vents to create chemical energy. This is a process known as chemosynthesis and these species are known as chemotrophs
SAMPLEPAGES
However, chemotrophs can also be found in areas away from volcanic vents, surviving on the hydrogen sulphide produced by decomposing whale carcasses. You may know the smell of this gas if you've ever smelled rotten eggs or a stink bomb!
In 2022, 230 pilot whales became stranded at a beach near Macquarie Harbour in Tasmania. Sadly, these mass whale strandings happen regularly and scientists are unsure why. Although some of the whales were saved, many died. Males can weigh approximately 2300 kg and take a long time to decompose, so authorities had to decide what to do with the remaining carcasses.
The carcasses were towed 40 km out into the Indian Ocean, before being dropped into the deep water. At these depths, food sources are not common, so 'whale fall' is more important than you might think. Some research suggests that 43 species can be supported by just one whale carcass.
Identifying types of consumers
One way that biologists can identify whether a consumer is a carnivore, herbivore or omnivore is by looking at its teeth. Each type of consumer has similar features to others in that group. Omnivores, such as humans, have evolved to eat both plants and animals, and this is evident in the range of differently shaped teeth we have (see Figure 3.34). Incisors are at the front of the mouth, and these sharp, flat, cutting teeth are used to bite off pieces of food. These teeth are effective for nibbling at plants and so are common to all herbivores. They wear down over time, so animals such as rabbits and wombats have incisors that continue growing throughout their lives. Grazing herbivorous animals, such as cattle and sheep, have a dental pad (see Figure 3.35) instead of upper incisors, which enables them to cut grass.
Figure 3.33 Stages of whale fall
Central incisor
Lateral incisor
Incisors
First premolar
Second premolar
First molar
Second molar
Third molar (wisdom tooth)
Molars
SAMPLEPAGES
Next to the incisors are sharp pointed teeth known as canines. These teeth are specialised for holding, piercing and tearing at food. The canines are large and well-developed in carnivores, as they are useful in catching and killing their prey. Herbivores, however, tend to lack canines. At the back of the mouth are the flat premolars and molars. These teeth are specialised for chewing and grinding food, so they are typically very large in herbivores. Molars are present in omnivores and carnivores too. Carnivores have additional specialised premolars, known as carnassial teeth, which are sharper and used for shearing meat.
Elephant tusks, which are elongated incisors, are used for digging, lifting objects, stripping bark from trees and defence.
Figure 3.34 Human teeth identify us as omnivores.
Figure 3.35 The dental pad of a grazing animal
Figure 3.36
Figure 3.37 (a) Lion canines can grow up to 10 cm long. (b) The molars of kangaroos replace themselves when they wear down. They fall out and the rear molars move forward.
Try this 3.8 animal teeth
Look at the animal skulls in Figure 3.38. You may be able to identify some of the animals you see, but take on the role of a scientist and check their teeth. Do they have incisors? Canines? Molars? Can you confirm what the animal might eat and therefore have more evidence as to what the animal is? You may like to tabulate your observations and then compare with your classmates.
SAMPLEPAGES
Quick check 3.7
1. Define the term 'consumer' in your own words.
2. There are three main types of consumer.
a) Name the three types.
b) State what each group eats.
3. Examine the images in Figure 3.39 and for each determine:
i) the type of teeth
ii) the structure and function of the teeth
iii) the animal types in which those kinds of teeth are found.
Figure 3.38 Can you identify the animals from their teeth?
Figure 3.39 Different types of teeth
food chain
a sequence of living things that shows their feeding relationship and the flow of energy between them
trophic level an organism's level or position in a food web, based on its feeding habits; producers occupy the first trophic level
primary consumer an organism that eats plants secondary consumer an organism that eats primary consumers
tertiary consumer an organism that eats secondary consumers
apex predator a predator at the top of a food chain
food chains: Who eats whom?
Food chains show the feeding relationships in an ecosystem. Each organism is food for another organism – they are interdependent. The chemical energy contained in an organism will be passed on to the organism that feeds on it. The arrows show the flow of energy through the food chain. Although all producers get their energy from the Sun, we rarely draw this step at the beginning of a food chain.
An example of a simple food chain would be:
SAMPLEPAGES
Figure 3.40 A simple food chain
As you can see in Figure 3.40, there is a need to distinguish between the feeding level of consumers –that is, how far along the food chain they are. This position is known as the trophic level.
Food chains typically start with a producer. The primary consumer is a consumer that eats the producer (i.e. a herbivore, such as the termites in Figure 3.41). An organism that feeds on the primary consumer is known as the secondary consumer. This may be a carnivore such as a numbat or an omnivorous species that eats both the primary consumer and some plant matter to supplement its diet. The tertiary consumer (such as a dingo) feeds on the secondary consumer. In the case of the dingo, it has no natural predators, so it is also referred to as the apex predator – the top of the food chain.
1. Define the term
2. Recall where the Sun could be placed in a food chain and why.
3. Draw an Australian food chain of your choice and identify the producer, primary consumer, secondary consumer, tertiary consumer and apex predator.
4. Recall what sort of information you can find out from looking at a food chain.
Figure 3.41 A food chain with three levels of consumer
Quick check 3.8
'food chain'.
VIDEO Australian apex predators
Try this 3.9
What food chains can tell us
Phytoplankton Krill Fish
Figure 3.42 What does this food chain tell us?
1. State what the arrows in Figure 3.42 represent.
2. Identify where all the energy originally comes from.
SAMPLEPAGES
3. Identify the producer, first consumer, second consumer, tertiary consumer and apex predator.
4. Identify the herbivore.
5. Predict what would happen if:
a) fairy penguins moved into the area and ate all the krill before the fish could get to it
b) a local commercial fishing company over-fished the area
c) chemicals running off farmland killed all the phytoplankton.
food webs
There are many types of organisms in any habitat and most communities are not made of single food chains. A food web is made up of interconnected food chains and represents multiple pathways along which energy can flow through an ecosystem.
There are many food chains in the food web shown in Figure 3.43. Each displays a possible flow of energy through organisms.
Thorny devil
Kangaroo
Bottlebrush Eucalyptus
Termites Echidna
Dingo
Brown falcon
Rainbow lorikeet
Grass
Emu
Figure 3.43 An example of an Australian food web
food pyramid a graphical representation of the flow of energy at each trophic level in an ecosystem 10 per cent rule when energy is passed from one trophic level to another, only 10 per cent of the energy is passed on egestion the process of removing undigested waste material from the body in faeces excretion the process of removing metabolic waste from the body
Changing food webs
Because of the interconnected nature of food webs, changes in the abundance of just one species can have many flow-on effects. If an apex predator, such as the brown falcon (see Figure 3.43), is removed from an area by fishing, hunting or disease, the effects trickle down the chain as the dynamic feeding relationships are all affected. The consumer one trophic level down, whose population was once controlled by being preyed upon by the apex predator (e.g. the rainbow lorikeet), will now flourish and potentially overpopulate the area. If this consumer's food source is producers (plants, such as the bottlebrush), then the population of these plants will be severely reduced and competition for this food will increase.
SAMPLEPAGES
Removal of a species can have catastrophic effects on the biodiversity of an ecosystem (discussed later in the chapter in Section 3.5). This is especially true if plants rely on that species for pollination. Some food webs have a high level of connectivity (e.g. the predators prey upon many different species, or the plants provide nutrition for many different species of herbivorous consumers). These food webs have greater resilience and ability to withstand changes in environmental conditions and changes in the abundance of species in the ecosystem.
Did you know? 3.2
spiky snacks!
Underwater kelp forests off the coast of California provide habitats for marine mammals, fish and invertebrates, but have been decimated by kelp-eating sea urchins. Satellite images suggest a loss of 95 per cent of the kelp forest canopy. The sea urchins flourished in response to a massive reduction in a particular species of starfish (one of their few predators) due to warming ocean temperatures and disease. However, further south in Monterey Bay, the kelp forests seem to be faring better than in the north of the state. Here, sea otters have been preying upon the sea urchins and effectively controlling their population. In turn, the survival of otter pups has surged and their population has boomed.
food pyramids
Food pyramids (also known as trophic or energy pyramids) visually represent the trophic levels and flow of energy in a food chain. The layers of the pyramid represent the amount of energy present. Energy is lost from each trophic level as it passes from the producers to each consumer. Typically, only 10 per cent of the energy is passed on to the next trophic level and is therefore available to the next consumer. This is known as the 10 per cent rule. The rest of the energy is lost to the environment in the following ways:
• Energy is lost as heat when an organism performs cellular respiration.
• Not every part of the organism is eaten. Roots and tough woody parts of plants, and the bones of animals, are rarely directly consumed. This energy is then trapped or transferred into the environment through decomposition.
• Consumers cannot digest all the food they eat (e.g. cellulose in plants or the hair and fur of animals), so the chemical energy in this food is lost in egestion. Wholegrains and vegetables (sources of insoluble fibre) occasionally pass through our digestive tract whole!
• Excretion causes energy to be lost in waste products, such as urine.
Figure 3.44 Loss of an apex predator in a food web can result in overpopulation of their prey.
Figure 3.45 A sea otter feasts on the softer underbelly of a purple urchin.
This means that there can only be a limited number of animals at the top of the food chain, as there is less energy available for them. Figures 3.46 and 3.47 show these energy losses. Note that kcal (kilocalorie) is a unit of energy.
Energy lost as heat (from cellular respiration)
Energy gained from eating plant
Energy not transmitted in uneaten portion of plant 10% stored or used for body functions
Energy lost to environment during egestion (production of faeces)
SAMPLEPAGES
Energy lost to environment during excretion of waste products such as urine
Figure 3.46 Energy transmission from producer to consumer, showing approximately 90 per cent losses to the environment
3.47 A food pyramid shows the energy flow (and loss) in a food chain.
Frilled-neck lizard Termites Grasses
Wedge-tailed eagle
Figure
Worked example 3.1
Use Figure 3.47 to answer the following questions.
a) If the lizard consumes 350 kcal of energy and is eaten by the eagle, calculate how much energy would be available to the eagle.
b) Calculate how much energy was originally available to the termites from the producers.
Working
a) energy for eagle = 10% × 350 kcal
= 10 100 × 350 kcal
OR 0.1 × 350 kcal = 35 kcal
b) 350 kcal = 10 100 × energy for termites energy for termites = 100 10 × 350 kcal = 10 × 350 kcal = 3500 kcal
Did you know? 3.3
Hindgut fermentation
Explanation
By the 10% rule, only 10 per cent of 350 kcal will be available to the eagle. 10% is equivalent to 10 100 or 0.1.
If the lizard had 350 kcal available, and that was 10 per cent of what was available to the termites, then the termites would have had 3500 kcal available to them.
SAMPLEPAGES
Members of the Lagomorpha family such as rabbits and hares are herbivores, eating mostly grass. However, this cellulose-rich diet is difficult to digest and so a lot of energy is lost in their faeces. The animals can access this energy through a special type of digestion called hindgut fermentation. In short, they eat their own faeces and digest it a second time to maximise the energy they can get! If you ever spot any rabbit droppings, you may notice that there are two types: small round black ones, and bigger softer ones. The bigger ones are called cecotropes and are the ones that are eaten.
1. Explain what a food web is.
2. Construct a food chain showing the feeding relationships between a wedge-tailed eagle, a flowering gum, a lizard and an ant.
3. Recall what organisms need energy for.
4. Describe how energy is lost at each successive level of a food pyramid.
5. Summarise what you notice about the amount of energy (kcal) that is passed on from the producers to the primary consumers and from the primary consumers to the secondary consumers.
6. Challenge question: Using Figure 3.47, calculate how much energy is passed on to the tertiary consumer, as a percentage of the original amount of kcal.
Figure 3.48 Rabbits eat their own cecotropes.
Quick check 3.9
Try this 3.10
food web model
Model the flow of energy in food webs from producer to consumers using the following materials:
• photos of producers, primary consumers, secondary consumers, tertiary consumers and apex predators in the normal ratio of these types of organisms in the wild
• different-coloured balls of yarn
• scissors
Instructions
1. Each student is allocated a photo.
2. Stand in a circle as a class. A student with a photo of a producer takes the end of the piece of yarn. The piece of yarn represents the flow of energy along the food chain.
3. The producer should choose what primary consumer it wishes to be eaten by and pass that person the ball of yarn. (The producer should keep hold of the end of the yarn.)
4. The primary consumer then chooses the secondary consumer they wish to be eaten by and passes them the ball of yarn.
5. Repeat this process with the secondary consumer.
6. When the yarn reaches the apex predator, cut it, but each person in the chain should keep hold of it.
7. Take a photo each time a food chain is made, so that the development of the web can be seen.
8. Start a new chain, by starting a new piece of yarn in a different colour. Try to pick different organisms at first, but you can also reuse organisms. Repeat this process many times, starting with different producers.
9. A complex web will form between you and your classmates.
10. Discuss the complex nature of the food web you have produced as a class.
11. Ask one organism in the food web to 'die' by dropping the string. Discuss as a class the effect that the loss of that organism from the ecosystem would have on the remaining organisms.
Discussion
1. Follow one of the threads of yarn and write down a food chain.
2. Describe the effect of removing a producer from this food web.
3. Explain why an ecosystem with many types of organisms would be able to cope with the loss of one species.
4. Critique whether your model of a food web accurately depicts a real ecosystem.
5. Propose one way in which this model could be improved.
SAMPLEPAGES
How Tasmanian devils can change ecosystems
The dingo is Australia's largest carnivorous mammal, first appearing on the mainland between 5000 and 3500 years ago. During this time, the Tasmanian tiger and the Tasmanian devil, two marsupial predators, became extinct on the mainland but remained in Tasmania, somewhere the dingoes never colonised. This suggests that dingoes probably contributed to the extinction of these marsupial predators.
3.50 Tasmanian devils are ecosystem engineers that restore and rebalance ecosystems, benefiting other native wildlife.
3.51 European colonisers tried to introduce foxes to Tasmania and failed every time, possibly because Tasmanian devils were already established there.
mesopredator
a predator in a mid-ranking trophic level, which usually hunts smaller animals
rewilding the process of protecting an environment and returning it to its natural state, for example by bringing back wild animals that used to live there
SAMPLEPAGES
Dingoes are widely regarded as pests in Australia because they prey on livestock, so their populations are often managed using poisoned bait, trapping and shooting. There is some evidence that reducing dingo populations can affect other species.
A reduction in dingo numbers has been linked to increases in the abundance of invasive predators such as the red fox and the feral cat (known as mesopredators). It has also led to increases in herbivores such as kangaroos and wallabies, which consume large amounts of vegetation. This then causes a decline in small and medium-sized native mammals, due to increased mesopredator predation and reduced food supply. Research suggests that cats kill more than 2 billion wild animals in Australia each year. One study estimated that in just a single day, Australian cats kill 1.3 million birds, 1.8 million reptiles and over 3.1 million mammals.
In 2020, 26 Tasmanian devils were reintroduced to the mainland at Barrington Tops, New South Wales, and it is suggested that they can be used as an alternative apex predator and will deter or disrupt hunting mesopredators. They are not as great a threat to livestock as dingoes, but by competing directly with feral cats and foxes, they have positive effects on smaller mammals. Native mammals enrich soil, increase plant diversity and disperse seeds, helping forest regeneration. As scavengers, Tasmanian devils can also help keep ecosystems free from disease, and by burying leaf litter, they help reduce fuel loads and make bushfires less intense.
The reintroduction of Tasmanian devils to the mainland may also save this endangered species. In the past few years, the devil population has been devastated by facial tumour disease (DFTD), an infectious cancer. It is hoped that rewilding with disease-free individuals will enable the species to once again thrive on the mainland.
Research the ecosystem changes that may be brought about by the reintroduction of Tasmanian devils.
1. Name four organisms that are affected by the presence of dingoes.
2. Explain why foxes were never successfully introduced to Tasmania by European colonisers.
3. Explain why Tasmanian devils are described as 'ecosystem engineers'.
4. 'The impact of producers on an ecosystem is greater than that of apex predators.' Evaluate this statement and give your opinion.
Figure
Figure
Figure 3.49 In Queensland, the dingo is a restricted invasive animal.
Section 3.3 review
Section 3.3 questions
Remembering
1. State how the flow of energy is represented in a food chain.
2. State the process by which plants produce their own food.
3. Name the components that plants need to make food.
Understanding
4. Define these terms:
a) carnivore
b) herbivore
c) omnivore.
5. Look at the food web in Figure 3.52.
a) Identify three food chains in the food web.
b) Identify the producers and apex predators based on the diagram.
c) State the organisms that dingoes eat.
d) Identify any organisms that are secondary and tertiary consumers.
Go
SAMPLEPAGES
Sun
Dingo
Magpie
Echidna Emu Frilled lizard Wombat Kangaroos Termites Blue-faced honeyeater Gum tree Wattle tree Grasses Crickets
Wedge-tailed eagle Kookaburra
Figure 3.52 A food web
Applying
6. Explain why all food chains must contain a producer.
7. Describe the impact on the ecosystem in Figure 3.52 if a fungus killed all the grasses.
8. The blue-faced honeyeater is a pollinator. Describe the impact on the ecosystem in Figure 3.52 if the blue-faced honeyeater was removed.
Analysing
9. Compare a herbivore to an omnivore.
10. Distinguish between food chains and food webs and then determine why food webs are more useful to scientists.
Evaluating
11. Look at the ecosystems in Figure 3.53 and discuss which food web would be more likely to survive an environmental disaster.
SAMPLEPAGES
Figure 3.53 Food webs from two separate locations
12. Propose a reason that a herbivore would not be able to eat meat easily.
13. With reference to Food Web B in Figure 3.53, predict two effects of removing the apex predator (quoll) from the food web.
SnakeButcher bird
Quoll
Quoll
FOOD WEB A
FOOD WEB B
Honeyeater
Parasitic wasp
Spider
Wattle
Eucalypt
Beetle Leafhopper
Caterpillar
Robin Lizard
Tea tree
SnakeButcher bird
Parasitic wasp
Wattle
Leafhopper
Robin Lizard
3.4
Recycling in ecosystems
Learning goals
At the end of this section, I will be able to:
1. Understand the role of microorganisms in an ecosystem.
2. Classify organisms according to their position in a food chain.
You already know consumers get their energy from producers or other consumers, and that producers get their energy from the Sun. This is the basis of the green food web, which is based on energy initially gained from green plants.
Any energy that is within an organism is not trapped in it forever. The energy is passed to the next trophic level when the organism is eaten, but some parts of the organism and the organism's waste may not be eaten. This material, as well as dead organisms, becomes detritus and starts the brown or detritus food chain.
All living things within an ecosystem can therefore fall into three categories:
• organisms that make their own food (producers)
• organisms that eat other living organisms (consumers)
• organisms that contribute to recycling dead and waste material (scavengers, detritivores and decomposers).
In every ecosystem, brown food chains exist that are directly linked to the green food chains. If we include detritus in a food web or pyramid, it demonstrates the complex and cyclical nature of energy flow in an ecosystem and highlights the important role of decomposers.
SAMPLEPAGES
detritus dead organic waste or debris scavenger an organism that feeds on dead animals that it has not killed itself detritivore an organism that feeds on dead or decaying organic matter decomposer an organism such as a bacterium or fungus that breaks down organic material
Figure 3.54 Green food chains start with energy gained from plants.
Figure 3.55 Brown food chains start with energy gained from detritus.
scavengers
Scavengers start the recycling process of dead animals. They don't directly kill their prey, instead eating carrion, or animals that have been killed by other predators. Normally, they don't eat things that have been dead for a long time but do use their heightened sense of smell to locate carrion. They may also follow predators and feed on their leftovers.
SAMPLEPAGES
Did you know? 3.4
scavengers detecting gas leaks
Natural gas used for cooking and heating has no odour and is invisible. After a gas leak at a Texas school killed nearly 300 students and teachers in 1937, it became common practice to add foul-smelling gases that would allow humans to detect the presence of natural gas.
Figure 3.57 Scientists discovered that turkey vultures find their food by smell and not sight when an oil worker mentioned that the birds congregated at gas leaks along the pipeline!
One of these pungent gases is called ethanethiol and is the same gas that is released by carrion. The turkey vulture is a scavenger that finds its food by smell, so they are sometimes found gathering around leaking pipelines. With nearly five million kilometres of gas pipeline in the USA, there are now more modern ways to track pipeline leaks, but turkey vultures were once used by natural gas companies to pinpoint pipeline leaks.
Dingo
Human
Kangaroo
Grass
Grasshopper
Mushroom
Snail
Detritus
Earthworm
Mouse
Bird
Snake
Cow
Figure 3.56 Combined green and brown food webs
Scavengers are found in both terrestrial (land) and marine environments. They play a vital role in the ecosystem, as they break carrion down into smaller pieces and speed up the decomposition process. Dingoes, wedge-tailed eagles, spotted-tail quolls and monitors (carnivorous lizards) are just a few of Australia's scavengers.
SAMPLEPAGES
Detritivores
Detritivores are also involved in recycling nutrients. They have mouthpieces that help speed up decay by ingesting detritus, which they then digest and egest. These smaller pieces increase the surface area available for decomposers to break down. Detritivores include beetles, flies, slugs, snails and earthworms. Marine detritivores include crabs, lobsters, sea stars and sea cucumbers.
Figure 3.58 Meat ants are such effective scavengers that farmers in rural Australia can use them to remove animal carcasses from their land.
Figure 3.59 Examples of detritivores: (a) woodlice, (b) fiddler crabs and (c) dung beetles
Decomposer and scavengers
microorganism
an organism that can only be seen through a microscope
pathogen an organism that can cause illness
Decomposers
Decomposers gain their energy by breaking down already dead organisms. Bacteria and fungi are examples of decomposers. Often microorganisms, they secrete chemicals called enzymes that break down the dead organisms and can then absorb the products. When decomposers break down organic matter, nutrients are released back into the soil, which plants then use to grow. This then supports a new green food chain.
friendly bacteria
Aim
To investigate how different types of yoghurt affect the growth of mould.
Time period
Approximately 1.5 weeks
Prior understanding
SAMPLEPAGES
Be careful
Do not open the specimen jar once the experiment begins. Do not consume any food products in the lab. Ensure all materials are disposed of in the appropriate manner.
Pathogens, such as mould and harmful bacteria, are in the air and on all surfaces around us. Raw food, such as fruit bought at the grocery store, can be contaminated by small amounts of mould. These pathogens do not usually cause a problem: when the fruit is consumed, the mould is destroyed either by the acidic environment of the stomach or by the good bacteria that live in each person's intestine. However, if the fruit is left too long before consuming, it can grow large amounts of mould, which can make us sick. To avoid getting sick, it is recommended that fruit be washed well before consuming and eaten when fresh. However, washing soft fruit such as strawberries is not always easy. Another option has been presented and requires investigation. Could yoghurt (which contains cultures of good bacteria) be used to disinfect soft fruit before consumption?
Materials
• different brands or types of cultured yoghurt (× 3 is recommended)
• strawberry or another type of soft fruit × 1
• sealable specimen jars × 4
• small paintbrush × 1
Figure 3.60 Decomposition provides the nutrients to support new life.
Method
1. Develop a research question for this investigation.
2. Identify the dependent variable and state how it will be measured.
3. Identify the independent variable and describe the different groups that will be set up for the experiment.
4. Develop a hypothesis by predicting how a change to the independent variable will affect the dependent variable.
5. Identify the controlled variables and describe how these will be managed to prevent any controlled variables from affecting the measurements.
6. Label each specimen jar with the following information:
Group number:
Type of yoghurt:
Date:
Student/s name:
7. Cut each strawberry into four pieces vertically as shown in Figure 3.61.
8. Leave one piece of strawberry untouched to use as a control (comparison) and paint each of the three remaining pieces with a different type of yoghurt.
10. Seal the jar by screwing the lid on tightly.
9. Place each piece of strawberry in separate specimen jars labelled with the yoghurt type.
11. Monitor the experiment for 9 days, recording observations of the size, colour and surface of the strawberry, and taking photographs of each container, every 3 days.
12. If any part of the set-up is changed, note the reason for this.
Results
1. Collect each specimen jar but DO NOT OPEN for safety reasons.
2. Estimate the amount of mould growth (the percentage of the surface covered in patchy colonies) for each group and record the results. Your teacher may direct you to create a table and graph on a spreadsheet or on paper.
3. Collate the class results and identify the mean measurement for each independent variable group (including the control group).
4. Calculate the range for each independent variable group on the table.
5. Graph the mean of each group's data.
Discussion: Analysis
1. Describe any trends, patterns or relationships in your results.
Discussion: Evaluation
1. Describe how much variation was observed between the measurements within each group.
2. Discuss whether the controlled variables were managed properly to ensure they did not change and affect the measurements.
SAMPLEPAGES
3. Outline the purpose of the control group (the strawberry that was left untouched).
4. Describe changes that could be made to the method to improve the quality of the data in future experiments.
Conclusion
1. Form a conclusion from this experiment about which yoghurt could best be used to disinfect soft fruit instead of washing it. Copy and complete this statement in your science book. From this activity it can be claimed that __________. This is supported by the observations that _____________. Therefore, the hypothesis is/is not supported by these findings.
Figure 3.61 How to cut the strawberry
Did you know? 3.5
Plastic-eating bacteria
Normally, bacteria spend their time breaking down dead and decaying organic matter, but scientists collecting plastic bottles outside a recycling facility in Japan discovered a species that has developed a taste for a type of plastic called polyethylene terephthalate (PET). Named Ideonella sakaiensis after the Japanese city Sakai where it was found, the bacterium can use PET as its energy source. Scientists are now replicating and modifying the plastic-degrading enzymes in a lab so they can be used on an industrial scale to break down plastics that would otherwise remain in the environment.
SAMPLEPAGES
Quick check 3.10
1. Define the terms 'scavenger' and 'decomposer'.
2. Define the term 'detritivore'.
3. Explain why plants rely on decomposers.
4. Distinguish between detritivores and decomposers.
Figure 3.62 The enzymes produced by Ideonella sakaiensis may help address the world's growing single-use plastic problem.
Section 3.4 review
Section 3.4 questions
SAMPLEPAGES
Remembering
1. State what happens to an organism in an ecosystem after the organism dies.
2. Name three examples of decomposers.
Understanding
3. Describe why decomposers are an important part of an ecosystem.
4. Describe what could happen to the world if scavengers and decomposers did not exist.
Applying
5. A brown food chain that could be found on a coral reef is: detritus → snail → small fish → sea turtles. Classify each of the organisms in the food chain as decomposer, primary consumer or secondary consumer.
6. Summarise the role/s that scavengers can play in an ecosystem. Are they only scavengers or can they have other roles too?
7. Look at Figure 3.63 and use your knowledge of detritivores and decomposers to describe what is happening.
Analysing
8. Compare the role of a producer with the role of detritus.
9. Distinguish between a decomposer and a detritivore.
Evaluating
10. Propose a reason why decomposers can be found wherever there is life.
11. Predict how a food web would change if all the decomposers in an ecosystem died. Give reasons for your decisions.
Figure 3.63 Decomposition in action
3.5 Human impact on ecosystems
Learning goals
At the end of this section, I will be able to:
1. Define biodiversity.
2. Describe how humans, including Aboriginal and Torres Strait Islander Peoples, have impacted ecosystems over time.
Biodiversity
When scientists look at all life on Earth, they talk about biodiversity. Biodiversity refers to the variety of all living things in a specific area and is normally considered at three levels.
• Genetic diversity: the difference in the genes of one species. It is better if a species is very genetically diverse, as it improves their chance of survival.
• Species diversity: the variety and abundance of different species in an area. Places like coral reefs and rainforests are considered extremely biodiverse because of the many different species that live in those ecosystems.
• Ecosystem diversity: the variety of ecosystem types found in an area.
As you discovered in Chapter 2, all life on Earth is categorised into six kingdoms. These kingdoms indicate the species diversity on our planet, which is increasing as new species are discovered. About 76 per cent of all species have been classified into the animal kingdom, meaning this is the most diverse of all the kingdoms. Within the animal kingdom, the phylum Arthropoda is by far the most diverse, with the class Insecta making up about 75 per cent of all animal species.
Archaea (less than 0.1%)
Bacteria (0.2%)
Fungi (4.1%)
Protists (4.6%)
Plants (15.4%)
SAMPLEPAGES
Animals (75.7%)
Roundworms (1.9%)
Crustaceans (3.0%)
Vertebrates (3.9%)
Molluscs (5.3%)
Arachnids (5.7%)
Mammals (9%)
Amphibians (10%)
Other animal groups (7.5%)
Insects (72.7%)
Try this 3.11
Wildlife reserves
Special wildlife reserves, such as national parks, are created to protect areas of Victoria identified as containing exceptional natural and cultural resources and values. When building reserves for biodiversity conservation purposes, it has been suggested that larger reserves in more isolated locations may be better than multiple smaller ones. Discuss whether it is better to have a single large or several small reserves. Consider the advantages and disadvantages of both options.
SAMPLEPAGES
hectares in size, and is situated at the tip of the Mornington Peninsula, at the mouth of Port Phillip Bay. It is the former site of World War II gun batteries, and the site of Prime Minister Harold Holt's disappearance in 1967.
Explore! 3.4 sustainable harvesting practices
Populations of dugong (Dugong dugon) and green turtle (Chelonia mydas) have suffered global population declines due to threats including boat strikes, marine pollution and habitat loss. Both species are protected under the Commonwealth Environment Protection and Biodiversity Conservation Act 1999.
For many Aboriginal and Torres Strait Islander Peoples, turtle and dugong are culturally significant and are an important source of protein. Traditional Owners of certain areas of Queensland hold a cultural responsibility to manage the impacts of human activity on the environment and have sustainably hunted the species for thousands of years. Dugong and turtle are hunted at specific times in their lifecycle, using knowledge about population density and dynamics to ensure populations remain sustainable and are protected for future generations.
Investigate how the dugong bone mounds of the Western Torres Strait islands may have supported sustainable harvesting practices.
Figure 3.65 Little Desert National Park, located in the Wimmera Mallee region of Western Victoria, was declared a National Park in 1969 and covers more than 130 000 hectares.
Figure 3.66 Point Nepean National Park is just 540
Figure 3.67 The dugong is an important food source for certain Aboriginal and Torres Strait Islander Peoples.
assessing biodiversity at your school
Aim
To compare the biodiversity of two different areas in the school grounds.
Prior understanding
Be careful
Try to avoid biting and stinging insects.
Biodiversity is a measure of how many species live in an area and whether these species are equally abundant in numbers, or if one species dominates with a comparatively larger number of individuals. Healthy habitats have a higher biodiversity index. One biodiversity index that can be used is called the Menhinick index. It can be calculated using the following equation. Higher numbers indicate higher levels of biodiversity.
Menhinick biodiversity index = biodiversity index= numberofspecies in survey area total numberofindividuals
For example, if a survey records 26 individual invertebrates belonging to five species, the biodiversity would be biodiversity index = biodiversity index= 5 26 =0.98 = 0.98
Materials
• Invertebrate Identification Key
• magnifying glass
• quadrats, if available, or if they are unavailable, four tent pegs and 4.5 m of fine stringline with loops tied every metre (the tent pegs must be able to fit through the loops). A 1-metre quadrat can be created by pegging out the stringline into the shape of a square. Push the tent pegs through each loop to pin the corners to the ground, as shown in Figure 3.68.
Method
1. Choose two different survey areas to assess within the school grounds, such as a grassy area and a garden.
2. Take all equipment to the first survey area.
3. Randomly choose a spot to place your quadrat.
5. Repeat Steps 3 and 4 in another four random spots.
6. Move to the second survey area and repeat Steps 3 to 5.
Results
Figure 3.68 How to peg out the stringline
4. Take photos of any invertebrates you record. This will help you to later identify any species you cannot name.
1. Develop a table to record the data from each survey area. Include a place to record survey area, type of invertebrate and number of individuals.
2. Identify any unknown invertebrates using an Invertebrate Identification Key. Record this data in the table.
3. Count the number of each invertebrate. Record this data in the table.
4. Calculate the total number of individual invertebrates found in each survey area.
5. Calculate the Menhinick biodiversity index (how biodiverse an area is) for each survey area by using the equation at the start of this practical. Show your working for each area.
6. Record the level of biodiversity for each survey area in the table.
Discussion: Analysis
1. Contrast the Menhinick biodiversity index results for the two areas.
2. Identify the survey area that would be considered more biodiverse.
3. Discuss the reasons for any differences found when comparing the two survey areas. Practical 3.1
SAMPLEPAGES
Peer review
1. Swap your data with another group to give each other feedback on how easily the table can be used to compare the two survey areas. Your feedback should discuss the following:
• how well the table is organised to compare the two survey areas
• how clearly the biodiversity calculations have been written
• any other suggestions to improve the quality of the data presented in the table.
2. After receiving feedback, make alterations to the table to address the identified issues and write up a final copy to present to the class.
Discussion: Evaluation
1. Compare the level of biodiversity calculated by each of the other groups. Determine how much variation was found between group results.
2. Compare the types of species found in each survey area with other groups. Identify species that were not found consistently in each survey area.
3. Discuss whether the biodiversity of the two survey areas can be reliably compared, based on your response to the previous question.
4. Decide upon some changes that could be made to the method to improve the quality of the data in future experiments.
5. The equation only takes into account the number of species, instead of the number of species and their abundance. Complete some research to find a better equation that can be used to determine the level of biodiversity.
Threats to biodiversity
The 2021 State of the Environment report found that Australian biodiversity is declining. The report outlined that invasive species, ecosystem modifications (especially fires) and agricultural activity such as livestock grazing present the three largest threats to Australian species of plants and animals, in addition to the growing impact of climate change.
SAMPLEPAGES
The health of an ecosystem can be assessed by measuring the biodiversity present. The more biodiverse an area is, the more resilient the ecosystem is, meaning it has a better chance of recovering from natural and human-caused threats such as fires, climate change, introduced species and diseases. introduced species an organism that is not native to an environment
Figure 3.69 Can you work out some of the other threats to Australia's biodiversity?
aboriginal and Torres strait Islander Peoples’ land management
Bushfires are an ever-present threat in our increasingly dry climate. However, they also play an important role in maintaining biodiversity. For millennia, Aboriginal and Torres Strait Islander Peoples have managed land with fire for cultural purposes such as hunting, ceremony and Caring for Country.
Firestick farming, cultural burning or cool burning involves low-intensity burns carried out regularly to clear undergrowth. Aboriginal and Torres Strait Islander Peoples have used cool burning for tens of thousands of years to promote plant growth. The effective use of cool burns changes vegetation structure by reducing the density of plants such as casuarina. Some plant species also require burning to activate their seeds.
Firestick farming clears undergrowth, creating vast grasslands on high-quality soil, resulting in animals directly grazing in the area and being hunted for food. Before European invasion, the careful selection of where and when burning occurred also resulted in a mosaic of trees and grasslands, preventing dangerous wildfires in eucalyptus forests.
SAMPLEPAGES
The slow-burning nature of these fires allowed any animals hiding in burrows to come out into the open. With animals no longer in their burrows and less vegetation for them to hide behind, people were able to hunt easily.
With the arrival of Europeans, much traditional burning practice was restricted due to frontier wars and land dispossession. Research has shown that in areas that were not impacted by Europeans farming, shrub-rich dense woodlands developed. This caused an increase in the frequency and intensity of hot fires, worsened by climate change and population growth.
Figure 3.70 Regrowth of eucalyptus trees after a bushfire. These shoots allow the tree to continue photosynthesising while the canopy recovers.
Figure 3.71 Before European colonisation, Aboriginal and Torres Strait Islander Peoples maintained a complex system of land management, involving the creation of a mosaic of burned and regenerating areas. By using fire as a tool, they planned plant growth through careful burn patterns, creating grasslands that they used to attract animals to hunt.
firestick farming the cool burning of areas of bush in stages, by the application of firesticks, to encourage new growth
'Hot fires' are dangerous, destructive and fast moving. They can quickly burn through large areas of thick vegetation, killing wildlife and the trees that provide important habitats. Forest Fire Management Victoria and the Country Fire Authority routinely work together to undertake planned burns to reduce fuel loads and create strategic fire breaks to prevent these catastrophic blazes. Many of these modern techniques are informed by Aboriginal and Torres Strait Islander cultural burning practices, and led by Aboriginal and Torres Strait Islander people.
SAMPLEPAGES
2. Recall three main uses of firestick farming.
3. Describe how firestick farming helps to promote new plant growth.
4. Currently, we use controlled burns in winter to reduce natural bushfires in summer. Predict a problem with disrupting this natural event.
Making thinking visible 3.3
Looking five times two: aboriginal and Torres strait Islander tools Australia's state and territory governments have broad responsibilities for recognising and protecting Aboriginal and Torres Strait Islander Peoples' heritage, including archaeological sites and artefacts. In Victoria, the principal legislation is the Aboriginal Heritage Act 2006. The Victorian Aboriginal Heritage Register is a central place for recording thousands of Aboriginal objects and places that are of cultural significance. The picture shows a range of traditional tools that were used in the Yued region (a Noongar language group north of Perth) before colonisation for hunting and making food. Look at the image for 20 seconds, letting your eyes wander.
List five words or phrases about the image.
Look at the image again and try to add five more words or phrases to your list.
The Looking ten times two thinking routine was developed by Project Zero, a research centre at the Harvard Graduate School of Education.
Figure 3.72 A devastating hot fire
Figure 3.73 Traditional tools used by the Yued people
Quick check 3.11
1. Propose some causes of fire in Australia before Aboriginal and Torres Strait Islander Peoples arrived.
VIDEO Causes of bush fires
using traditional knowledge
Australia's 2021 State of the Environment report recognises Aboriginal and Torres Strait Islander Peoples' knowledge principles, including the benefits of controlled fire, and their knowledge of endemic plant use for both culinary and medicinal purposes. Management of these valuable resources is necessary, especially where biopiracy is a potential risk.
The Australian Government has extended funding for the Indigenous Ranger Program, which has created more than 2100 jobs in land and sea management around the country. The Indigenous ranger projects formally engage Aboriginal and Torres Strait Islander people to care for Country using traditional knowledge through activities such as cultural burns, feral animal and pest plant control, and monitoring of biodiversity. Ranger groups are encouraged to develop partnerships with other research, education and commercial organisations.
In 2022, the Queensland Indigenous Women Rangers Network was awarded a $1.8 million Earthshot prize for its members' work on protecting the Great Barrier Reef. The prize rewards innovative solutions to climate change and other environmental problems. The network combines 60 000 years of traditional knowledge with new technology. The women have used drones to collect data to educate people about coral bleaching and dieback, and are working with the government to implement coral sanctuaries and regrowth projects. Science as a human endeavour 3.1
Explore! 3.5
Warby-ovens national Park
SAMPLEPAGES
In 2021, the International Union for Conservation of Nature (IUCN) conducted an assessment of the Warby-Ovens National Park in north-eastern Victoria, placing it on the organisation's 'Green List'. The national park is home to threatened species such as the grey grass tree and the carpet python, and includes some of the state's most significant bushland.
Parks Victoria was praised for its management in several key areas:
• the provision of dedicated recreational spaces for visitors to learn, camp, canoe, bushwalk, etc.
• the establishment of citizen science projects to monitor key animal groups, such as threatened woodland birds
• ongoing consultation with Yorta Yorta Traditional Owners. Conduct some further research and answer the following questions.
1. List four other native species you might encounter in the Warby-Ovens National Park.
2. What is the IUCN?
3. What is the IUCN Red List?
The
Figure 3.75
Warby-Ovens National Park in late autumn
Figure 3.74 Members of the Queensland Indigenous Women Rangers Network undertaking drone training
Green Games
In 2032, Brisbane will host the Olympic Games. These games will be the first 'climate positive' Olympics, and it is understood that the next two summer games will also be climate positive. A 'climate positive' Olympics is one that absorbs or removes more carbon than it produces, to become 'carbon negative'. One way that Brisbane will be able to do this is by using pre-existing buildings to host sporting events wherever possible. In some cases, new venues will have to be built, but many venues already exist.
For example, although the Gabba will be rebuilt to host athletics and the ceremonies, and a new Brisbane Arena is proposed to be built above Roma Street underground station to host swimming and water polo (in a temporary pool), Victoria Park will be temporarily repurposed to host freestyle BMX and cross-country equestrian events, and Ballymore Stadium will be upgraded to host hockey. Many other venues located throughout South East Queensland will be used for a range of sports.
Currently, the Athlete Village has been earmarked for Northshore Hamilton. As the International Olympic Committee (IOC) now requires host cities to incorporate sustainability into the games, your task is to research the proposed site of the Athlete Village and consider how it can be made as sustainable as possible.
• Use the internet to find the location of the Athlete Village.
SAMPLEPAGES
• What are the potential environmental issues the village may cause that could affect a local ecosystem? Write a letter to a newspaper editor outlining your findings.
• Do you think the best decision has been made regarding the village's location? Why do you think this area was chosen?
• What do you like about the current design? What do you dislike about it?
• Using A3 paper, work in small groups to design an environmentally friendly version of the Athlete Village.
Think about the following factors:
• transport links to sporting venues
• provision of food and the associated waste for 10 000 athletes
• laundry services for 10 000 athletes
• how the buildings could be designed to minimise their environmental impact (Remember, these are summer games: how are the athletes going to keep cool without over-reliance on air conditioning?)
• future usage of the site.
Land clearing
Throughout the world, human-led land clearing remains one of the most significant threats to the biodiversity of ecosystems. Native vegetation is cleared for agricultural land or to support mining, infrastructure and the urban sprawl of our cities and towns. In 2017, the World Wide Fund for Nature (WWF) estimated that more than 80 per cent of the deforestation set to occur globally between 2015 and 2030 will take place on 11 key 'fronts', one of which is the eastern states of Australia. This places Australia (the only developed nation on the list) among the likes of the Amazon and Borneo in terms of our rate of land clearing. Globally, around 177 000 square kilometres of forest is lost each year, which equates to around 50 football fields every minute!
Figure 3.76 An artist's impression of the proposed rebuild of the Gabba
Source: Queensland Government
Figure 3.77 An artist's impression of the proposed Athlete Village development at Northshore Hamilton, Brisbane
Source: Queensland Government
Rainforests are sometimes referred to as 'the lungs of the Earth' due to their density of plants and the huge volume of oxygen they release through photosynthesising. They also store carbon, play a critical role in the regulation of the climate, and provide biodiverse habitats for countless threatened species of plants and animals. The beautiful rainforests of Borneo and Sumatra are home to some of the world's last remaining pygmy elephants, Sumatran tigers and orangutans. However, the global demand for cheap palm oil is so high that this rainforest is being rapidly cleared for make way for palm oil plantations. Palm oil farming forms a crucial part of the economy and provides job opportunities for local people but comes at a cost: native animals are treated like pest species, pesticides are polluting local waterways and the soil is being degraded of nutrients. Much of the clearing that occurs is done using fire, posing another risk to native wildlife and contributing to global warming.
Try this 3.12
uses of palm oil
You may not realise it, but you've probably eaten or used palm oil today. It is found in many common household products such as shampoo, soap, detergent, chocolate, ice cream and biscuits.
You might be wondering what you can do to help. Start by selecting ethical brands that advertise their products as 'palm oil free', or at least selecting brands that use sustainable palm oil. This comes from palms that have been grown by companies who claim to protect the environment. Look for the RSPO logo (see Figure 3.79).
Figure 3.80 Palm oil derivatives
Be aware that palm oil can be listed in the ingredients of many things.
Conduct an audit of some of the products in your bathroom and pantry. How many contain one of the palm oil derivatives listed in Figure 3.80?
Figure 3.78 (a) A palm oil plantation borders rainforest in Sabah, Borneo. (b) A female orangutan and her baby. These animals are treated as pests by the palm oil farmers in Borneo and are rapidly losing their habitat.
Explore! 3.7
Deforestation in Victoria
Logging has led to the clearing of Victorian old-growth forests for over 150 years, putting Melbourne's clean water supply at risk. Land clearing, in combination with the Black Saturday bushfires of 2009, has decimated the central highlands' population of the Leadbeater's possum. The disruption of Aboriginal and Torres Strait Islander Peoples' traditional fire management regimes has led to ecological changes in this region, such as the accumulation of high fuel loads and a reduction in the availability of suitable mammal habitats.
Professor David Lindenmayer is a landscape ecologist and conservation biologist. He has campaigned for a new 'Great Forest National Park' in the central highlands of Victoria to protect the remaining mountain ash forests there. However, establishing a new national park is no easy task: job losses from the logging industry need to be balanced against the potential gains in tourism and environmental benefit.
Your task is to research the benefits and limitations of creating this new national park, and present your findings to the Minister for the Environment and Water. Your report should:
• explain how the national park will increase biodiversity
• list some plants and animals that will benefit from the park being established
• present a map of the area
• summarise the pros and cons for local (human) residents, and how any problems can be addressed
• state your final opinion.
SAMPLEPAGES
Did you know? 3.6
Bogong moths
Bogong moths are a native species, named after the Bogong High Plains region in Victoria, where they congregate in huge numbers in summer. Before colonisation, these moths were used by many Aboriginal groups. They were considered an excellent source of fat and nutrients. Their population has been declining since the 1980s due to habitat destruction and pesticide use, and they suffered further steep losses when the droughts of 2017 and 2019 left them with dwindling food sources. This led to the Bogong moth being classified as endangered in 2021. In turn, critically endangered mountain pygmy possums are going hungry, as the moths were previously prey for the possums. Researchers have had to supplement the possums' diet with human-made 'Bogong bickies'.
invasive species an organism that is not native to an environment and causes harm to native organisms
biological control the practice of introducing an organism into an ecosystem with the intention of limiting the spread of another organism
Invasive species
An invasive species is an introduced non-native organism that overpopulates and harms its new environment. The introduction of the species is usually done accidentally, but sometimes it is done on purpose. Australia has many invasive species, such as foxes, camels, rabbits, goats, and feral cats and pigs. All these species were introduced by European colonists for hunting, for farming or to make Australia feel more like Europe. Invasive species are one of the largest threats to Australian ecosystems as they can disrupt both biotic components (by competing with native species for resources such as food) and abiotic components (e.g. digging burrows, which leads to erosion).
SAMPLEPAGES
Sometimes, another species can be introduced to help control the invasive species population. This is known as biological control. Biological control uses the natural enemies of the invasive species. They can be bacteria, fungi, viruses or even parasites or predators.
Disastrous control
The cane toad originally comes from Puerto Rico but was brought to Australia in an attempt to manage beetles that were eating sugar cane crops. The cane toad had earlier been introduced to Hawaii for the same purpose, with no obvious negative effects. However, after the toads were released in the sugar cane plantations of northern Queensland in 1935, their population exploded, and they quickly became a huge pest. Cane toads have many ecological impacts, such as competing with native species for food and space. They are also poisonous and so kill any native predators that eat them, such as quolls, snakes and crocodiles, in addition to domestic animals, such as dogs, that accidentally consume them.
Making thinking visible 3.4
Circle of viewpoints: sea spurge
Parks Victoria is collaborating with CSIRO on a nationwide trial using the Venturia paralias fungus to manage the invasive coastal weed known as sea spurge. Infestations in Victoria and Tasmania release their seeds into the ocean and the weed is infiltrating sand dune ecosystems in New South Wales.
1. Brainstorm a list of perspectives that different people in society might have on the introduction of biological controls (e.g. farmers, conservationists, and Aboriginal and Torres Strait Islander Peoples).
2. Choose one perspective to explore, using these sentences:
pest.
3.85 A severe infestation of sea spurge on a beach in Wilsons Promontory, Victoria. There are fears that New South Wales beaches might also suffer from the infestation unless a new method of control is discovered.
Credit: CSIRO, Australia's national science agency
• I am thinking of biological control from the perspective of …
• I think … (describe the topic from your perspective).
• A question I want to ask from this perspective is …
The Circle of viewpoints thinking routine was developed by Project Zero, a research centre at the Harvard Graduate School of Education.
Figure
Figure 3.84 The cane toad was originally introduced as a biological control, but is now considered a
Explore! 3.8
rabbit-proof fences
Rabbits were introduced to Australia in 1859 by a grazier in Victoria, but are now considered a major ecological pest. In 1996, the calicivirus was introduced as a biological control to reduce the massive rabbit population. However, some rabbits were immune to the virus, and foxes (another pest) lost a food source and so were eating native wildlife instead. Go online to investigate the following.
1. Find out about the rabbit-proof fences built in Western Australia in the 1900s, as shown in Figure 3.86. Report on how they were used to try to limit the spread of plagues of rabbits.
Figure 3.86 Rabbit-proof fences were built to try to limit the devastation caused by rabbits. When completed, the rabbitproof fences stretched 3256 km.
2. Find out about the myxoma virus and its release in Australia in 1950 in an attempt to control the rabbit population. Summarise your findings.
Effective control
Not all examples of biological control in Australia have gone wrong. In 1840, European settlers brought a cactus known as the 'prickly pear' (see Figure 3.87) to Australia to use as a food source for a beetle that produced a red dye for the production of soldiers' uniforms. The cactus thrived in Australia and soon covered an area larger than Victoria.
Research was undertaken to find an insect that could feed on the prickly pear, and after a global search, the cactus moth (Cactoblastis cactorum) was introduced as a biological control. In less than 10 years, it is estimated that the larvae of the moth consumed 1.5 trillion kg of cactus! Another benefit of the moth is that when there is no cactus left, it dies off because the cactus is its only food source. Several years after the introduction of the moth, the cactus population was under control. It is still around today, but in smaller numbers.
Another example of effective control is the use of cool fires to control the growth of invasive plant species such as African lovegrass (Eragrostis spp.) and lantana (Lantana camara) by Aboriginal and Torres Strait Islander people.
SAMPLEPAGES
But not all invasive plants are responsive to biological and natural control techniques. Traditional Owners (the Kungarakan and Warai Peoples) of the abandoned Rum Jungle mine site in the Northern Territory have been working collaboratively with the Australian Government to control the spread of gamba grass (see Figure 3.88). Originally introduced as a pasture grass, it outgrows the native varieties because it uses sunlight more efficiently. It now accounts for more than 50 per cent of weed coverage in the area, and has created a huge ground-level fuel load, which can create bushfires of higher intensity. The joint venture aims to reduce the spread of seeds through public education, and involves applying herbicides to mature plants and treating the soil where dormant seeds lie. Traditional fire management practices are also in use.
calicivirus a virus that damages a rabbit's internal organs and can cause bleeding
SAMPLEPAGES
Did you know? 3.7
stress, wash and eat
Citizen scientists have reported that the Australian white ibis uses a 'stress and wash' technique to eat toxic cane toads.
Normally, when toads are stressed or attacked, their defence response is to release a toxin called bufotoxin. This thick, milky toxin easily sticks to the inside of a predator's mouth and is absorbed into the predator's body, where it can lead to serious complications or even death.
However, ibis have learned how to avoid the toxin. First, the ibis picks up a toad up by the neck and throws it about, stressing the toad and causing it to release its toxin. The ibis then washes the toad in a creek, before swallowing it whole.
Figure 3.89 The Australian white ibis may be the answer to the cane toad crisis.
citizen scientist a member of the public who assists professional scientists by voluntarily collecting data relating to the natural world
Figure 3.87 Prickly pear plant
Figure 3.88 Gamba grass growing in the Northern Territory, Australia
Section 3.5 review
Section 3.5 questions
SAMPLEPAGES
Remembering
1. Name the three types of biodiversity.
2. State four examples of an invasive species.
Understanding
3. Define the following terms:
a) species diversity
b) genetic diversity
c) ecosystem diversity.
4. Identify which phylum in the animal kingdom is most diverse.
Applying
5. Describe the use of 'firestick' farming by Aboriginal and Torres Strait Islander Peoples.
6. Explain why some introduced species are classified as pests.
7. Explain why the cactus moth is referred to as an effective biological control.
8. Suggest some of the impacts that humans are having on oceanic ecosystems. You may want to research a specific example.
Analysing
9. Analyse the use of cool burning techniques by Aboriginal and Torres Strait Islander Peoples.
10. Research the work being done to counteract the impact humans are having on biodiversity loss. Try to choose an action group that you find interesting. Summarise their aim, methods and progress in one or two paragraphs.
Evaluating
11. Bushfires occur naturally in Australia and many organisms have adapted to cope with this. Natural bushfires may occur every 5–10 years. However, humans in many areas start controlled burns yearly to prevent larger bushfires. Propose how this might damage the ecosystem.
12. Create a list of pros and cons about the role of invasive species.
Chapter review
Chapter checklist
Success criteria Linked question
3.1I can recognise the difference between biotic and abiotic factors in an ecosystem. 4, 13
3.1I can state the various levels of organisation in an ecosystem. 5
3.2I can describe five different species interactions in an ecosystem.8
3.3I can analyse food webs to describe feeding relationships. 12a
3.3I can model how energy flows through an ecosystem using a food pyramid. 6, 12b
3.3I can predict the effect on an ecosystem when living things are removed from an area. 14
3.4I can understand the role of microorganisms in an ecosystem. 11
3.4I can classify organisms according to their position in a food chain.2, 3, 9, 10
3.5I can define 'biodiversity'. 7, 15
3.5I can describe how humans, including Aboriginal and Torres Strait Islander Peoples, have impacted ecosystems over time. 1
SAMPLEPAGES
Review questions
Remembering
1. Identify two natural and two human threats to an ecosystem.
2. Name the type of teeth that most herbivores are missing.
3. State what incisors are used for.
4. Recall the characteristics of all living things.
Understanding
5. Define 'community' in an ecosystem.
6. Describe how energy is lost from a food pyramid.
7. Explain how high biodiversity could be a sign of a healthy ecosystem.
Applying
8. Summarise the five key interactions between species in an ecosystem. For each interaction, provide an example that was not mentioned in the text.
9. A producer is always part of a food chain. Explain how a producer fits into the brown food chain.
Analysing
10. Use the following list of organisms to answer the questions below: koala, grass, dingo, beetle, eucalyptus, possum, kangaroo, earthworm.
a) Illustrate the interactions between the organisms by connecting them with arrows.
b) Classify each organism as producer, consumer or decomposer. Each organism may have more than one label.
c) Classify (if any) the herbivores, carnivores, omnivores or detritivores.
SAMPLEPAGES
11. Compare the roles of decomposers and consumers.
Evaluating
12. a) Using the pictures of organisms in Figure 3.90, construct a food web.
b) Select one food chain present within your food web, and construct it as a food pyramid.
13. A grassland ecosystem changes dramatically throughout the year. Propose several abiotic and biotic changes that may occur in a grassland ecosystem during summer and winter.
Figure 3.90 Various parts of a food web
14. Look at the food web in Figure 3.91. Predict what would happen if the mouse were removed from the food web.
SAMPLEPAGES
Figure 3.91 Various parts of a food web
15. A population of platypus in Lake Elizabeth in the Great Otway National Park is more genetically diverse than a population in the Loddon river in Central Victoria. Predict which population is more likely to survive if the environment changes.
Kestrel
Tawny owl
Blue tit
Short-tailed field vole
Rabbit
Fox
Ladybird
Caterpillar
Blackberry
Mouse
Aphid
Nettle
Grass
Data questions
SAMPLEPAGES
Figure 3.92 Energy transfer in an Australian food chain. All values are in kJ. Blue arrows (C1–3) represent energy transferred through the food chain; green arrows (R1–4) represent energy lost as heat and through respiration; and red arrows (L1–4) represent energy lost as detritus (dead organic matter and waste).
Applying
1. Identify the secondary consumer in Figure 3.92.
2. Calculate the R2 value.
3. Calculate the efficiency of the energy transfer through the termite in Figure 3.92.
Analysing
4. Organise the efficiency of energy transfers (C1, C2 and C3) from highest to lowest in Figure 3.92.
Evaluating
5. Deduce why the food chain does not extend further than the dingo.
6. Geckos will also eat termites. They are far smaller than a bandicoot. Predict whether the gecko's L3 value would be higher or lower than the bandicoot's L3 value in Figure 3.92.
7. Justify your answer to Question 6.
sTem activity: Designing a wildlife crossing
Background information
We could not live without roads and train lines. They have become incredibly important to the way humans live. However, every time a new road is built, it fragments (splits up) ecosystems, and the animals living within those ecosystems are adversely affected in a number of ways. These effects can include loss of habitat from the construction of the road, animals being killed by cars and trucks, and animal populations being separated from one another. Wildlife–vehicle collisions also pose a serious threat to motorists and often involve damage to cars as well as drivers and passengers.
In recent years, wildlife crossings have been developed to conserve habitats and allow animals to safely cross human-made barriers. Wildlife crossings (sometimes called animal bridges or eco-passages) can be tunnels, overpasses, canopy bridges or even fish ladders. Engineers have designed the bridges to suit the animals (or groups of animals) that need to use them.
Engineers need to consider many factors when designing a tunnel, overpass or bridge. The biggest consideration is how it will be supported. The best way to build a sturdy bridge is to use triangles. The design of a truss bridge demonstrates this principle. Another common bridge design is the suspension bridge, where cables or ropes support the bridge.
DESIGN BRIEF
Design, construct and test a model wildlife crossing.
activity instructions
SAMPLEPAGES
In small groups, choose an animal or group of animals to focus on. Some suggested animals are:
• Christmas Island crab
• pygmy possum
• long-nosed bandicoot
• kangaroo and wallaby
• hairy-nosed wombat
• eastern long-necked turtle
• your own choice (needs to be approved by your teacher).
Figure 3.93 (a) A wildlife overpass in the Netherlands. Wildlife overpasses attempt to reduce wildlife mortality on roads. (b) A fish ladder in Germany. Fish ladders allow fish to travel upstream when a dam or weir would otherwise prevent them from doing so.
You will need to think about how your animal moves and decide on the most appropriate type of wildlife crossing. These are some questions to think about.
• What is the size of your animal?
• Can your animal climb?
• Will only one animal be crossing at a time or will it be more of a migration (many animals at a time)?
• How will the animals be 'herded' toward your crossing?
SAMPLEPAGES
• Is your animal a predator or prey (escaping from predators)?
• Will you need to cater for other animal populations?
Draw a diagram of your suggested bridge/tunnel/ overpass and label the features. Ask your teacher to approve your design before you begin construction.
Suggested materials
• cardboard
• scissors
• string
• glue
• icy-pole sticks
• straws
• sticky tape
• masses
Evaluate and modify
1. Find out what other animals live in the same ecosystem as your chosen animal.
a) Predict which other animals may also benefit from the wildlife crossing you have designed.
b) Predict which animals could not use your design, and their possible futures as a result of not having a safe crossing.
2. Test your wildlife crossing for structural integrity by placing several masses on top of it. The masses will represent the mass of the animals (on a canopy bridge), the mass of the soil, plant life and animals (on an overpass) or the mass of cars and trucks (on top of a tunnel). Film the test so that it can be watched in slow motion to determine where and why it failed (destructive testing).
3. Discuss any problems you encountered while constructing your crossing and describe how you overcame them. This may include problems with tools, materials and working as part of a team.
4. Evaluate the potential effectiveness of your wildlife crossing and suggest some improvements to your design.
Truss
Suspension
Beam
Figure 3.94 Truss, suspension and beam bridges are three of many types of bridges. The red parts of the bridge undergo tension (stretching), and the parts in green experience compression (pressing together).
migration the process of animals travelling to a different place, usually when the season changes and often in large numbers
Chapter 4 States of matter
SAMPLEPAGES
Introduction
This chapter will introduce you to the amazingly minute world of particles and the idea that everything in our universe is made up of them – yes, everything! You will focus on the three states of matter (solids, liquids and gases) and investigate how the particle model can explain not only their changes in state, but also the properties they exhibit.
Concept map
SAMPLEPAGES
Contraction
All matter is made of particles
Matter exists in different states
Liquid
Section 4.1
Section 4.2
Section 4.3
Add heat energy
Remove heat energy
Expansion
Condensation
Melting
Freezing
Evaporation/ boiling
Deposition
Sublimation
Solid Gas
Curriculum content
the particle and kinetic theories of matter can be used to describe the arrangement and motion of particles in a substance, including the attraction between particles, and to explain the properties and behaviour of substances, including melting point, boiling point, density, compressibility, gas pressure, viscosity, diffusion, and expansion and contraction (VC2S8U05)
• using and constructing virtual simulations such as claymation videos, models or diagrams to represent changes in particle arrangement and properties as substances change state
• comparing attractive forces in the solid, liquid and gaseous states of the same substance and relating this to relative position and movement of particles
• examining how the changing motion and energy of particles are affected by the amount of heat energy absorbed or released
• comparing the properties of different substances and explaining differences using particle theory
• comparing the viscosity of different substances such as honey, treacle and oil, and developing representations to suggest an explanation for their different viscosities
• constructing a density column using liquids of different densities
proposed scientific responses to socio-scientific issues impact on society and may involve ethical, environmental, social and economic considerations (VC2S8H03)
• researching how properties of gases were used in relation to gas warfare in World War I, and the subsequent development of the Geneva Protocol and later adoption of the Chemical Weapons Convention international arms control treaty
investigable questions, reasoned predictions and hypotheses can be developed in guiding investigations to identify patterns, test relationships and analyse and evaluate scientific models (VC2S8I01)
• developing investigable questions to analyse and evaluate scientific models, such as ‘How does particle theory explain the properties of substances?’
Glossary terms
SAMPLEPAGES
Concentration
Condensation
Contraction
Density
Deposition
Diffusion Particle
4.1 Particle model and states of matter
Learning goals
At the end of this section, I will be able to:
SAMPLEPAGES
1. Describe the particle model of matter.
2. Distinguish between the arrangement of particles in solids, liquids and gases.
3. Explain the contraction and expansion of substances in response to heat.
4. Define 'diffusion'.
Everything in the universe is made up of matter, whether it be a desk, the ocean, a meteorite or the air you breathe. The term 'matter' refers to anything that takes up space and has mass and volume Remember that mass is the amount of matter in a substance or object, and volume is the amount of space the substance or object takes up. On Earth, the most common states of matter that exist are solids, liquids and gases (see Did you know? 4.1 for an example of another). Figure 4.1 shows some examples of matter. Use your current knowledge of the world around you to identify which are the solids, liquids and gases. What is similar and what is different between the three states of matter?
Figure 4.1 States of matter: solids, liquids and gases. What are the similarities and differences between the three states of matter illustrated here?
particle model all matter is made of particles that behave differently depending on whether they are solid, liquid or gas
kinetic energy the energy of moving matter vibrate move to and fro
Brownian motion the random movement of particles in liquids and gases
Did you know? 4.1
Plasma: a fourth state of matter?
Solids, liquid and gases are the three states of matter that make up almost all matter that you will find on Earth. However, there are rare examples of other states of matter that exist, particularly throughout the universe in stars such as the Sun.
Plasma is a fourth state of matter that can be created on Earth in high-energy circumstances such as lightning strikes. The high amount of energy can create a build-up of charged particles that behave differently from a solid, liquid or gas.
SAMPLEPAGES
It can even be created inside a microwave using a grape, which has been filmed by many YouTubers. In 2019, a team of scientists published a study about what makes grapes produce plasma in the microwave but they did the experiment in very safe conditions, so please don't try this at home!
the particle model
A philospher in ancient Greece, named Democritus, wondered what would happen if an object was split repeatedly until it could not be split any further. His idea was that all matter was made up of tiny indivisible particles. And thus the particle model was born. In science, models are used to represent different aspects of real-world objects (like models of trains and cars) and phenomena (like Earth orbiting the Sun). Sometimes though, scientists make models to test ideas, or to represent what they cannot see to try to explain how it might work. This is the case with the particle model.
To better understand what makes up all solids, liquids and gases, we can start by looking at the particle model. This model states that all matter is made up of extremely small spherical particles that are invisible to the naked eye. These particles are not only different sizes in different substances, but are also arranged differently in solids, liquids and gases. The closer the particles are to one another, the stronger is the attraction between them. This helps us to understand why each state of matter has different properties. The particles that make up matter are always moving because of their energy. The energy that a moving particle possesses is called kinetic energy. The more kinetic energy a particle has, the faster it moves. Adding heat adds energy to particles and therefore makes them move faster. Particles always have some energy and so they always move, even if it is just a little bit. In solids, the particles vibrate in fixed positions, but in liquids and gases, the particles move in random straight lines. This type of movement is called Brownian motion after the scientist who first observed it, Robert Brown, in 1827.
Figure 4.2 Plasma, a fourth state of matter, produced from grapes
Figure 4.3 A model solar system represents the orbit of planets around the Sun, which we cannot see visually ourselves.
Explore! 4.1
Brownian motion
Robert Brown and Albert Einstein both contributed to the understanding of Brownian motion. Research the following questions using the internet.
1. Explain how Robert Brown first observed particles moving in random straight line motion.
2. Describe Albert Einstein's contribution to knowledge about Brownian motion.
SAMPLEPAGES
Figure 4.4 A representation of particles moving in random straight lines
Quick check 4.1
1. Define 'matter'.
2. State the three common states of matter.
3. Summarise the key points of the particle model by completing the following sentences.
a) All matter is made up of __________.
b) Particles are __________ moving.
c) Particles move faster if the substance is __________.
Practical 4.1
States of chocolate
Aim
To demonstrate the states of chocolate.
Materials
• chocolate buttons
• small beaker
• large beaker
• boiling water
Method
Be careful
Do not consume chocolate in a laboratory classroom.
Heat the chocolate in a small beaker that has been suspended in a large beaker of boiling water, as shown in Figure 4.5.
Discussion: Analysis
1. After a few minutes, some of the chocolate will be partially melted. How many states of matter can you see?
2. What do you think is happening to the particles as they are heated up?
3. How does particle theory help explain your observations about the properties of the chocolate before and after melting?
Large beaker
Small beaker
4.5 Experimental set-up
Chocolate buttons
Boiling water
Heatproof mat
Figure
Solids
In a solid, the particles are packed tightly together. Due to their close proximity, the forces of attraction between particles are very strong. Because of this, the particles in solids cannot move freely, so they hold a fixed shape. The particles themselves do still move, but just by vibrating on the spot (low kinetic energy). As you can imagine, with the particles held together so tightly, solids cannot be easily compressed.
liquids
In liquids, the particles are still held together by forces of attraction, but these are weaker than the attraction in a solid. So particles in a liquid are not vibrating in fixed positions, but instead they 'slide' over each other in free movement, often described as 'flowing'. The particles have some kinetic energy. Gravity is also acting on the particles and pulls them down, so they take on the shape of the bottom of the container.
Did you know? 4.2
toothpaste: Solid or liquid?
SAMPLEPAGES
4.6 Diagram showing the arrangement of particles in a solid
4.7 Diagram showing the arrangement of particles in a liquid
Sir Isaac Newton was a mathematician and physicist born in 1643. He described the behaviour of fluids (i.e. liquids and gases) as having constant viscosity, which means a constant resistance to flow unless temperature or pressure changes. For example, if you were to stir a cup of water, its viscosity would stay the same with each stir. Most fluids behave in this way and they are called Newtonian fluids, after Newton's observations.
However, not all fluids behave in a Newtonian way. Toothpaste is a fluid that flows out of its container with a small amount of force. But what happens when a large force is applied to the toothpaste against your teeth? The behaviour of toothpaste changes; it becomes less viscous (thick) and it flows much more easily.
Toothpaste is an example of a non-Newtonian fluid that changes its viscosity when a force is applied.
The behaviour of non-Newtonian fluids can be described by particle theory just as Newtonian fluids can be. In this case, the force moves the particles further away from each other.
Figure
Figure
Figure 4.8 Toothpaste is a non-Newtonian fluid. (a) Solid toothpaste on a toothbrush. (b) Liquid toothpaste after brushing.
viscosity the resistance of fluid to flow
VIDEO Animation of water particles
Gases
The particles in a gas are in constant Brownian motion as they have much more kinetic energy than the particles in solids or liquids. The attraction between the particles in a gas is weak because the particles are so far apart, so the particles spread out to take up any space that is available. This means that gases can also be compressed or squeezed into a smaller space.
When a gas is added to a space, the particles will quickly move to spread out evenly and throughout the entire space. This process of the movement of particles from an area of high concentration of particles to low concentration of particles is called diffusion
Try this 4.1 role-playing states of matter
Copy and complete the following table.
Describe the strength of attraction between particles
SAMPLEPAGES
Figure 4.9 Diagram showing the arrangement of particles in a gas
Working with your classmates, role-play what a solid, liquid and gas look like. Make sure you can explain what the particles are doing in each state of matter.
Describe the movement of particles Diagram of particle arrangement
Blow up a balloon slowly until it is about half full with air. Inside the balloon there are gas particles moving in straight random lines (Brownian motion). Sometimes those particles collide with each other and sometimes they collide with the walls of the balloon. Each collision with the wall of the balloon exerts a force, which we call pressure. The more gas particles in the balloon, the more force there is on the walls and the more pressure. If there is too much pressure, the balloon will pop. What happens when you let go of the inflated balloon? Try to use the words 'gas particles' and 'pressure' in your explanation.
Investigation 4.1: Self-design
diffusion
Aim
To investigate diffusion: the movement of liquid and gas particles as they spread out in another liquid or gas.
Be careful
Make sure that no one suffers from any respiratory issues before using the aerosol deodorant/perfume.
To design an investigation into how quickly particles can diffuse through water at different temperatures.
Materials
• aerosol deodorant/perfume
• food colouring
• eye dropper
• 250 mL beakers × 4
Method
SAMPLEPAGES
• iced water, cold tap water and hot tap water
• thermometer
• stopwatch
1. Spray some aerosol deodorant/perfume in one corner of the room. Move to the opposite corner of the room and record the time it takes for the scent to reach you.
2. Put one drop of food colouring into a beaker of tap water. Observe how the colour spreads, and record the time it takes for the colour to spread evenly in the water.
3. Design an experiment to determine whether the diffusion of food colouring occurs faster in warm or cold water. In science experiments, every variable is kept the same except for the one being investigated. What are the dependent, independent and controlled variables in this experiment? Consider what you will need to record and how you can do it. Write a hypothesis about what you think might happen.
4. After checking your design with your teacher, carry out your experiment and record your results.
Results
1. Draw a diagram showing how the deodorant/perfume particles moved through the air.
2. Draw a diagram showing how the food colouring particles moved through the water.
3. Draw up a table that summarises the results of your self-designed experiment.
Discussion: Analysis
1. How does particle theory explain your observations of spreading by the deodorant and food colouring in this experiment? Use the terms you have learned in class about the particle model and diffusion.
2. Explain why changing the temperature affected how fast diffusion occurred.
3. Many industries use diffusion to dispose of their waste products either as gases into the air or as liquids into rivers and the sea. Explain whether you think this is a suitable method in the long term.
Discussion: Evaluation
1. Identify any sources of error and how you might prevent these from occurring again.
Conclusion
1. Draw a conclusion from this experiment about how quickly particles can diffuse through water at different temperatures. Copy and complete this statement in your science book. From this activity it can be claimed that __________. This is supported by the observations that _____________. Therefore, the hypothesis is/is not supported by these findings.
Did you know? 4.3
microwave ovens
Microwave ovens heat food by using radiation. Radiation is energy in the form of light or heat. In a microwave oven, the radiation released is called 'microwaves'. The microwaves are absorbed by the water in food and cause those particles to vibrate with higher energy and so they have more heat. This heat cooks the food by heating the surrounding particles.
Heating and cooling
SAMPLEPAGES
radiation the emission of energy in the form of light or heat expansion the process of a substance getting larger: particles move further apart as they heat up contraction the process of a substance getting smaller: particles move closer together as they cool
The particle model suggests that if a substance is heated, the particles will gain more energy and so they will begin to move more rapidly. As the particles start to move more rapidly, the distance between the particles increases and they begin to take up more space. Because the particles are further apart, the attraction between them decreases. This process of getting larger is called expansion. When heat is applied, gases can usually expand more than solids and liquids because the particles are not held together by strong attractive forces and so they are free to spread out.
When a substance is cooled, the particles lose energy, their movements slow down, and the distance between the particles gets smaller. Because the particles are closer, they become more strongly attracted to one another, except in a gas, in which they are still relatively far apart. This process of the material (not the particles themselves) getting smaller is called contraction.
Figure 4.10 Microwave ovens work by causing the water particles in food to vibrate and heat up.
Figure 4.11 In a hot air balloon, the heated air expands and becomes lighter than the air outside the balloon, so the balloon rises.
Figure 4.12 Diagram showing the changes in movement experienced by particles with heating and cooling. You will learn about a substance that doesn't behave in this way in Section 4.3.
Try this 4.3
Using the change in size of a balloon to develop a virtual simulation
Blow up a balloon to a size that will fit inside your fridge or freezer and tie a knot to close it. The research question that you will investigate here is how the size of a balloon will change when heated and cooled. Take a tape measure and measure around the widest part of the balloon.
Place the balloon in the fridge or freezer for 10 minutes. Retrieve the balloon and measure as you did previously. What was the result? Can you explain the result using the particle model?
SAMPLEPAGES
Now for a super challenge: use an app or online program to represent the changes in the particles' energy levels as they are heated and cooled. You may like to create an animated gif, a stop-motion film, a coded program or a claymation video.
Graphene
Graphene is a two-dimensional arrangement of carbon particles that was discovered in 2004. It has the physical properties of being extremely strong and an excellent conductor of electricity. Since then, scientists have found a way to turn this amazing material into three-dimensional structures. This may not seem very exciting, but these 3D structures are 10 times stronger than steel yet only 5 per cent as dense! Graphene can therefore help reduce the amount of steel used for infrastructure (buildings), but also excites scientists because of its applications in space programs.
Explore! 4.2
Skyscrapers
Modern skyscrapers are built using a variety of materials, but metal and concrete continue to be very common when constructing the foundations of towers. Particles in these materials will expand and contract with the changing temperature of the surroundings. Engineers must consider the expansion and contraction of materials in their design and construction of towers.
1. Explain what is done to allow for the expansion and contraction of materials in skyscrapers.
2. Discuss why it is important for engineers to carefully select the materials they use for building skyscrapers.
Science as a human endeavour 4.1
Figure 4.13 Model of the hexagonal lattice of a graphene layer
Figure 4.14 Skyscrapers in Melbourne CBD
Practical 4.2
expansion and contraction
Aim
To observe and explain the expansion and contraction of solids and gases.
Hypothesis
Predict what you expect to observe when solids and gases are heated and cooled. State your hypothesis using the 'If … then …' framework.
Materials
• ball and ring apparatus
• tongs
• Bunsen burner
• bimetallic strip
• balloon × 1
SAMPLEPAGES
• felt-tip pen
• ruler or tape measure
• bucket of iced water
• bucket of warm water
Method
1. Examine the ball and ring apparatus. Does the ball fit through the ring when it is cold? What do you predict will happen when you heat the ball? Heat the ball using the Bunsen burner and see if it still fits through the ring. What happens if you heat the ring and not the ball?
2. Look at the bimetallic strip. Predict or hypothesise what will happen when you heat it. Now, heat the bimetallic strip. Describe what happens.
3. Inflate a balloon. Draw two felt-tip pen lines exactly 10 cm apart on the balloon. Place the balloon in the bucket of iced water. What happens to the lines? Place the balloon in the bucket of warm water. What happens to the lines?
Results
Record all observations and descriptions from each step of the method.
Discussion: Analysis
1. Write a sentence explaining your observations from each step of the method, referring to the particles, their energy, their movement and the strength of their attraction.
2. Do you think a balloon can be used as a thermometer to measure temperature? Complete some research to investigate how gas thermometers are made and used.
Conclusion
1. Copy and complete this statement in your science book. From this activity it can be claimed that ______. This is supported by the observations that _____________. Therefore, the hypothesis is/is not supported by these findings.
Figure 4.15 A ball and ring apparatus
Quick check 4.3
1. Compare the distances between particles in a gas, a liquid and a solid.
2. Use the particle model to explain what happens when a substance gains heat energy.
3. The particles of a substance in a sealed container are investigated at two temperatures.
• At temperature A, the particles are very close together but move freely at moderate speed in the bottom of the container.
• At temperature B, the particles are distant from one another and move freely at high speeds in all parts of the container.
What is the state of the substance at temperature A and at temperature B? List the evidence that allowed you to work this out.
SAMPLEPAGES
Section 4.1 questions
Remembering
1. Recall four key points that you have learnt about the particle model.
2. Recall the state of matter where particles are only able to vibrate in a fixed position.
3. Identify which state is shown in the diagram.
4. Name the state that cannot flow from place to place.
5. Name the state where particles have the weakest forces of attraction between them.
6. Define 'diffusion'.
7. Recall the word that describes the change you expect to see when a metal is heated.
Understanding
8. Describe what happens when you heat up particles.
Applying
9. Use the particle model to explain why food colouring and water mix together but food colouring and ice do not.
Analysing
10. Compare the closeness of the particles and the speed at which they move at different states, and list some examples of each state.
Evaluating
11. Discuss how a mercury thermometer can provide a reading of temperature.
Section 4.1 review
4.2 Properties of solids, liquids and gases
Learning goals
At the end of this section, I will be able to:
1. List the properties of solids, liquids and gases.
2. Use the particle theory to explain the properties and behaviour of substances.
3. Define the terms 'density' and 'viscosity'.
When scientists talk about the different states of matter, they are referring to two types of properties: physical properties and chemical properties (see Table 4.1).
SAMPLEPAGES
Definition A characteristic of a substance that can be observed and/or measured without changing it chemically
Examples Colour, size, solubility, melting point, hardness, boiling point, conductivity, shape and density
The behaviour of a substance when it reacts with another substance
Burns or explodes in oxygen, rusts or corrodes, acidity, biodegradability
designing materials with super properties
4.16 The properties of substances are used by scientists to design new materials with specific purposes.
Superhydrophobic substances have a remarkable ability to repel water. Developed by Australian researchers, they are useful for a number of purposes, such as coating fabrics for raincoats or car windshields in order to improve driving visibility. They also have the potential to be used to waterproof mobile phones, to prevent ice from forming on aircraft and to protect boat hulls from corroding. They are highly antimicrobial, so they also could be used to protect surgical instruments and medical equipment. Unfortunately, these coatings are very delicate and easily damaged by cleaning or any minor wear, leading to the loss of superhydrophobic properties. However, in 2020, scientists developed a new armour-plated coating that can withstand wear and still repel water effectively.
physical property the way a substance looks and acts; a characteristic of a substance that can be observed and/or measured without changing it chemically chemical property the behaviour of a substance when it reacts with another substance
Table 4.1 The two types of properties investigated when looking at matter
Picture
Science as a human endeavour 4.2
Figure
WORKSHEET
Density
compress squeeze to make smaller density how much matter (mass) is contained in a certain volume of a substance
While working through the last section, you might have identified a number of the key properties of solids, liquids and gases. Here we will discuss these properties, using the particle model.
Solids
The particle model describes solid particles as being packed very tightly with strong forces of attraction. These particles vibrate in their fixed positions. This is why solids usually have a fixed shape and a volume that cannot be changed. This also explains why solids cannot easily be compressed (squashed) or poured.
SAMPLEPAGES
Density
Table 4.1 mentioned the property of density. Density describes how heavy or light something is for its size, but this is not the same as its weight or mass. For example, 1 kg of bricks will always weigh the same as 1 kg of feathers (they are both 1 kg), but the space they take up is very different. Density is defined as the measurement of how much matter (or mass) fits in a certain amount of space (or volume). A denser substance (e.g. a brick) has more mass in a particular volume than a less dense substance (e.g. feathers). The relationship between density, mass and volume is written in this way:
Figure 4.17 Consider these rocks and the arrangement of their particles shown in the diagram. Are the shapes of the rocks fixed? Can the rocks be compressed or poured?
Investigation 4.2: Self-design
Calculating density
Aim
To design and conduct an investigation to measure the mass and volume of different objects. Then to use this information to calculate the density of the objects and determine whether they would float or sink in water.
Hypothesis
SAMPLEPAGES
Look at the random objects you have been provided with. Predict which items you expect to float and which to sink. State your hypothesis using the 'If … then …' framework.
Materials
• ruler
• large measuring cylinder
Method
• small random objects × 8
• electronic balance
When you design your experiment, consider the following questions:
• What measurements do you need to be able to work out the density of an object?
• How will you measure the mass of the random objects?
• How will you measure the volume of the random objects? What will you do with objects of regular and irregular shape? Your teacher will show you how to determine volume using the water displacement method.
• How will you calculate density?
• What is your prediction for the results? Which items do you expect will float and which will sink?
Write up your intended method step by step, as though it were going to be published in a textbook. Remember to include the steps for determining volume using the water displacement method, and the steps for calculating density. Then check with your teacher that you can begin your investigation.
Results
1. Record your measurements in a table using these headings.
Object
Mass (g)Volume (cm3)Density (g/cm3)Float or sink?
2. Using the equation for density, calculate the density of the objects. Record the densities in your table.
3. In the table, record whether you expect the objects to float or sink.
Discussion: Analysis
1. The density of water is 1.00 g/mL. If an object has a density of less than 1.00 g/mL, it should float in water. If an object has a density of greater than 1.00 g/mL, then the object should sink when placed in water. Did your results show these statements to be true?
2. Were your predictions supported by your results? Explain your answer by referring to the data you collected.
Discussion: Evaluation
1. Identify the advantages and disadvantages of using the water displacement method for determining volume.
2. Would your results be different if you used a different liquid than water? Explain your reasoning.
3. Were there any steps of the investigation that you would do differently if you were to repeat the task? How would you improve the experiment next time?
Conclusion
1. Copy and complete this statement in your science book. From this activity it can be claimed that _____________. This is supported by the observations that _____________. Therefore, the hypothesis is/is not supported by these findings.
Quick check 4.4
1. Define the term 'density'.
2. Copy and complete the following table.
Properties of a solid according to the particle model
Particles are packed tightly together.
Particles cannot move freely; they vibrate in one spot, called a fixed position.
Behaviour of a solid as a result of the property
Hard to break apart
SAMPLEPAGES
3. A substance such as sand can be poured and does not have a fixed shape. Explain whether it is a solid.
4.a) Explain the relationship between mass and density. b) Explain the relationship between volume and density.
Did you know? 4.4
meteorite diamonds!
A pure diamond is the hardest material known on Earth. This is because diamonds are able to scratch all other materials but not be scratched themselves. However, in 1967, a strange new form of diamond was discovered on a meteorite that had hit Earth. It was called lonsdaleite.
In 2020, researchers at the Australian National University provided evidence that they had created lonsdaleite at room temperature on Earth as a result of an experiment that they were conducting.
In 2021, researchers at Washington State University were able to record the stiffness of pure lonsdaleite, and it was greater than that recorded for pure diamonds! Does this mean lonsdaleite is the hardest material in the universe?
liquids
Liquids are held together by the forces of attraction between particles, but these forces are not as strong as those in solids. The particles of a liquid can move more freely and flow (be poured) and therefore take on the shape of the container they are inside. Because of gravity, a liquid always sits at the bottom of the container. Although their shape can change, liquids have a fixed volume and mass. Like solids, they cannot easily be compressed into much smaller spaces. The particles can actually be pushed a tiny bit closer together, but it takes a massive effort, and so we generally say that the particles in a liquid are so closely packed that they cannot be compressed.
Figure 4.19 Consider water and the arrangement of its particles, as shown in the diagram. Is the shape of water fixed? Can water be compressed or poured?
Figure 4.18 (a) A diamond. (b) Lonsdaleite is a type of diamond formed when meteorites hit Earth.
Density is also a physical property of liquids. Unlike solids, the density of liquids changes when the liquids are heated. The particles of a liquid are able to move more rapidly when heated and thus they take up more space. Therefore, the density of a liquid decreases as heat increases. The same occurs in gases, as the particles are moving freely.
Try this 4.4 making a density column
To make a density column, you will need a tall glass or large measuring cylinder, a plastic pipette and approximately 30 mL of each of the following liquids:
• honey
• maple syrup
• whole milk
• liquid handwash/dish detergent
• water (with some food colouring added)
• vegetable oil
• rubbing alcohol (with some food colouring added)
• baby oil.
Carefully pour the first liquid, honey, into the bottom of the container. Try not to let any liquid touch the side of the glass – take your time, pouring slowly and carefully. It's important to let each layer settle before adding the next one. Then add the next liquid, maple syrup, taking care to slowly deliver the liquid to the top of the first layer, not on the glass edge. Continue working your way through the list of ingredients in the order shown. You may find it easier to use a plastic pipette for some liquids.
Use the internet to research the density of each of the liquids online. Did any of your liquids behave unexpectedly when you considered their density? Did any mix?
How does the particle theory explain the density of substances?
Viscosity
Figure 4.20 An example of a density column. A density column demonstrates density, one of the physical properties of liquids.
SAMPLEPAGES
When you pour honey from a jar, it flows slowly and seems very thick. This resistance to flow, or 'thickness', is called viscosity. Honey has a high viscosity compared to other liquids such as water. Honey has higher viscosity than water because the particles in honey have stronger attraction to each other, which makes it more difficult for the liquid to flow. Increasing the temperature of honey decreases the viscosity, because heat gives the particles enough energy to move further apart, therefore reducing the attraction between the particles.
Viscosity is an important property of liquids. Doctors and surgeons need to know all about it because blood needs to be kept within a narrow range of viscosity so it doesn't block vessels. Engineers need to understand viscosity when designing ways to transport crude oil from offshore rigs to storage on land. Viscosity is even important when making food, as runny or low-viscosity tomato sauce just wouldn't be the same! Viscosity is a property most commonly associated with liquids. However, it is important to note that gases also have viscosity.
Investigating viscosity
Aim
To compare the viscosity of common substances by measuring how fast marbles move through the liquids.
Hypothesis
Read through the common substances you will be testing. Write a prediction about which substance/s the marble will move fastest through and which the marble will move slowest through. Link your hypothesis to the term 'viscosity'. State your hypothesis using the 'If … then …' framework.
Materials
• 250 mL measuring cylinders (or beakers) × 7
• permanent marker
• glass marbles of the same size × 7
• digital stopwatch
• seven different liquids; for example, golden syrup, honey, olive oil, whole milk, water, shampoo (clear), handwash or dish detergent (clear)
Method
1. Mark a line with a permanent marker about 2 cm from the top of a beaker and fill the beaker up to the 2 cm line with a test liquid.
2. Hold one marble level with the top of the beaker.
3. Drop the marble into the test liquid and time how long it takes to reach the bottom. Record the time under Trial 1 in the results table below. Repeat with the same liquid for Trial 2 and Trial 3.
4. Repeat steps 1–3 using a different test liquid.
5. Calculate the average time taken for the marble to reach the bottom of the beaker in each test liquid and draw a bar graph of your findings.
Results
Table showing time taken for a marble to sink through a range of viscous liquids
Test liquid
Trial 1
Time to reach the bottom (seconds)
Trial 2
Trial 3
Average
Discussion: Analysis
1. Explain why it is a good idea to conduct each test three times and work out an average.
2. Looking at your graph, order your test liquids from least viscous to most viscous.
SAMPLEPAGES
3. How does the particle theory explain the viscosity of substances?
Discussion: Evaluation
1. Consider your findings. Do they agree with, or support, your prediction? Discuss.
2. Why do you think viscosity would be important to an engine oil company?
3. How could you investigate the impact of temperature on the viscosity of honey?
Conclusion
1. Copy and complete this statement in your science book. From this activity it can be claimed that _____________. This is supported by the observations that _____________. Therefore, the hypothesis is/is not supported by these findings.
Figure 4.21 Experimental set-up
Making thinking visible 4.1
the 3 whys: the importance of viscosity
Scientists in Hawaii have been investigating how the viscosity of magma inside a volcano can help predict how hazardous an eruption could be for local communities. They know that the more viscous the magma, the more powerful the eruption will be. Usually, the viscosity of molten rock can only be measured well after an eruption, but the team of researchers identified an indicator that will allow them to monitor this property so successfully that lives may be saved.
Meanwhile, in France, scientists have demonstrated that the viscosity of fluids in the fault lines of the Earth's crust has a direct effect on the intensity of earthquakes!
Consider the following questions:
• Why might this information matter to me?
• Why might it matter to people around me?
• Why might it matter to the world?
SAMPLEPAGES
The 3 whys thinking routine was developed by Project Zero, a research centre at the Harvard Graduate School of Education.
Gases
The force of attraction between gas particles is weak and therefore the particles freely move to take up as much space as possible. Gas particles have no fixed shape or volume, and can diffuse into new unoccupied spaces. Due to the large spaces between gas particles, there is plenty of space for the particles of a gas to be squashed together or compressed.
Explore! 4.3
Compressed gas
Gases are compressible due to the large spaces between the particles. This property is important when transporting gases for a variety of uses. For example, deodorant cans and fire extinguishers carry compressed gases in containers that can be carried easily and stored safely. Butane gas is carried in a canister and is commonly used as a source of fuel for barbecues or outdoor stoves.
1. Why is carbon dioxide a good choice for extinguishing fires?
2. Use the particle model to explain why the gases in a can of deodorant can be compressed.
3. Explain why butane in a canister is under a lot of pressure.
Figure 4.22 The 2018 eruption of Kilauea volcano on the island of Hawaii provided scientists with an opportunity to investigate the viscosity of molten rock.
Figure 4.23 Consider the air in the first 3 cm of this syringe and the arrangement of the air particles shown in the diagram. Is the shape of air fixed? Can air be compressed or poured?
Figure 4.24 Gases can be compressed and stored in canisters.
VIDEO Aerosol cans and heat packs
Making thinking visible 4.2
Compass points: dangerous science
The scientific knowledge of particles and states of matter has grown over the past 300 years. It has provided a foundation for much of the fantastic chemical technology we have in the modern world, which includes smartphones, solar panels and computers. However, this knowledge has also provided the opportunity for less ethical and even dangerous technology to be developed.
For example, in World War I, knowledge of how gases can be compressed for easy transport gave rise to a boom in poison gas warfare. This is often referred to as 'chemical warfare'. In 1925, the Geneva Protocol was signed to prevent the use of poisonous gases in war. In 1993, the Chemical Weapons Convention international arms control treaty was signed. This treaty banned the creation of chemical weapons and required their destruction within certain periods of time. Complete the Compass points activity about chemical warfare.
SAMPLEPAGES
1. E = Excited: What excites you about future developments in chemical technology?
2. W = Worrisome: What do you find worrisome about future developments in chemical technology?
3. N = Need to know: What else do you need to know or find out in order to evaluate this idea?
4. S = Stance: What is your current stance or proposal on the idea? How can you continue to assess this concept?
The Compass points thinking routine was developed by Project Zero, a research centre at the Harvard Graduate School of Education.
Quick check 4.5
1. Define the terms 'viscosity', 'density', 'volume' and 'mass'.
2. Contrast the shape and volume of solids, liquids and gases.
3. Copy and complete the following table to describe the particle structure and properties of solids, liquids and gases.
Section 4.2 review Go online to access the interactive section review and more!
Section 4.2 questions
remembering
1. Recall how a liquid behaves in a container and what happens if it is put in a different container.
2. Recall how a gas behaves in a container and what happens if it is put in a different container.
3. Recall how particles in a solid behave. Use these terms in your answer: fixed, vibrate, shape, compressed, attraction.
Figure 4.25 Chemical warfare was a dangerous consequence of advances in particle theory.
Understanding
4. Summarise the properties of a gas.
5. Explain why steam can be compressed but ice cannot.
6. Describe two ways you could identify whether a material is a solid.
Applying
7. The metal lid of a glass jar is stuck and cannot be undone. Kim runs the lid under hot water, and now the lid can be unscrewed. Using your understanding of the particle model and the properties of matter, explain why Kim used the hot tap.
8. Explain why viscosity would be important when manufacturing a shampoo.
Analysing
9. Copy the Venn diagram and organise the following statements into the correct place to describe solids, liquids and gases.
i) Strong attraction between particles that are not as close ii) Particles are free to move, no strong attraction iii) Strong attraction between close particles
iv) Easy to compress v) Definite shape vi) Can be poured vii) Expand to fill a container viii) Particles in a fixed position ix) Difficult to compress x) Fixed volume xi) Not a fixed shape xii) Particles vibrate in a fixed position
SolidLiquidGas
SAMPLEPAGES
10. A plastic toy animal floats in liquid X but sinks in liquid Y. Infer what this tells us about the densities of the toy animal, liquid X and liquid Y.
Evaluating
11. The following table lists the densities of several materials. Determine which material will float in water, which has a density of 1.00 g/mL. Explain your answer, referring to the materials in the table as evidence.
12. Discuss how and why the properties of a liquid are different from the properties of a gas.
13. Office chairs, like the one in Figure 4.26, usually have a lever on the side for adjusting their height. The stand contains a cylinder and a piston that can move up and down inside it, so the chairs often feel quite springy when you sit on them. Decide whether the cylinder contains a solid, a liquid or a gas. Give reasons for your answer.
Figure 4.26 What gives an office chair its spring?
Lever
Cylinder
Piston
melting when heat causes a solid to become a liquid melting point the temperature at which a specific solid becomes a liquid evaporation when heat causes liquid to become gas; also known as vaporisation
4.3 Changing states
Learning goals
At the end off this section, I will be able to:
1. Describe the changes in particle arrangement and properties during heating, including melting, boiling, evaporation and sublimation.
SAMPLEPAGES
2. Describe the changes in particle arrangement and properties during cooling, including freezing, condensation and deposition.
All states of matter can change from one to another under certain temperature and pressure conditions. These conditions could be naturally occurring or caused by human intervention.
adding heat
Heating a substance causes an increase in temperature. If enough heat is added, the substance can change its state.
Melting occurs when heat causes a solid to become a liquid. When solid particles are heated, they gain energy and vibrate more rapidly. When enough heat is added to the particles, the edge of the solid will eventually vibrate so quickly that the forces of attraction between the solid particles will be reduced and some of them will move into the liquid state (see Figure 4.28). The temperature at which this occurs is called the melting point of the substance. Different substances respond to heat differently and therefore have different melting points. When a substance changes from a solid to a liquid, its properties also change; however, the actual substance remains the same. For example, when ice melts, this solid form of water becomes liquid and has different properties (hardness, ability to be poured, shape) but it is still water.
4.27 Changes in the state of water
4.28 Melting butter on toast involves a solid forming a liquid. The properties may change but it is still butter.
Evaporation (or vaporisation) occurs when heat causes a liquid to become a gas. Heating a liquid gives its particles more energy to move more rapidly. These particles then spread out more. When a particle at the surface of a liquid has enough energy, it will overcome the attraction to other liquid particles and move into the gas state (see Figure 4.29). For example, at a natural hot spring, water changes state from liquid to gas, and some of it changes back to liquid droplets, forming clouds.
Figure
Figure
Evaporation can, however, occur at a range of temperatures. Consider the clothes you hang on the line to dry. They will dry by the water evaporating from the surface of the clothes. Drying is faster when it is sunny and hot, but they still do dry on cooler cloudy days.
Boiling is the rapid vaporisation of a liquid that occurs when it is heated to a temperature called the boiling point Vaporisation starts at various points throughout the liquid, where bubbles of vapour form. For example, when water boils at 100°C in a saucepan, you can see bubbles containing water vapour begin to form low down in the water. The bubbles expand, rise and break at the surface (see Figure 4.30).
Sublimation is when a solid changes state to become a gas without becoming a liquid first. Most solid substances go through the processes of melting to become a liquid, and boiling or evaporating to become a gas. However, some solid substances can skip the liquid state altogether and change from a solid directly to a gas. Dry ice (solid carbon dioxide) is an example of a substance that sublimes.
SAMPLEPAGES
without passing through the liquid state
Different substances have different boiling and melting points.
1. Find out the melting and boiling points of some different substances.
2. Draw up a table to record the melting point and boiling point of each of the substances you researched.
Melting and boiling points depend not only on temperature, but also on pressure. Atmospheric pressure changes depending on the altitude above sea level. Mount Bogong, in Victoria's east, has an elevation of 1996 m above sea level, and the boiling point of water there is around 93.5°C. Can you explain why this is the case?
boiling the rapid vaporisation of a liquid when it is heated to a certain temperature
boiling point the temperature at which a specific liquid becomes a gas
sublimation when heat causes a solid to become a gas
Figure 4.29 When heated, particles gain energy and spread out, allowing them to break free from the liquid and form a gas.
Figure 4.30 The bubbles in boiling in water form low down in the liquid, then expand and rise to the surface.
freezing when a liquid loses heat and becomes a solid condensation when a gas loses heat and becomes a liquid deposition when a gas loses heat and becomes a solid without passing through the liquid state
removing heat
Cooling a substance causes a decrease in temperature. If enough heat is lost, the substance can change its state.
Freezing (or solidification) occurs when heat is lost, causing a liquid to become a solid. The process of freezing is the opposite of melting. As a liquid cools, the particles lose energy and move or vibrate more slowly. When enough energy has been removed, the particles will vibrate in fixed positions in close proximity to other particles and form very strong attractions. And so the solid state will be formed. The point at which this occurs is called the freezing point, and different substances have different freezing points. For example, the freezing (and melting) point of water is 0°C, while the freezing (and melting) point of oxygen is –218.8°C.
Did you know? 4.6
Ice, the exception!
Solids usually take up a smaller volume than liquids because the particles are held more closely together. However, solid water (ice) is an exception to this rule as it actually takes up more space! That is why icebergs float on the ocean, rather than sink to the bottom.
SAMPLEPAGES
Water in a bottle that is put into the freezer will expand and sometimes break the bottle, because the frozen ice takes up more space than the water. This is because particles occupy different positions in solid ice and liquid water.
Condensation is when heat is lost, causing a gas to become a liquid. As a gas cools, the particles of gas lose energy and slow down. When they have slowed down enough, the particles become close enough that they begin to attract one another, and consequently form a liquid. An example you may see every day is when steam from your shower condenses on the mirror of your bathroom as the water vapour (gas) hits the cool mirror and forms a liquid.
Deposition is also known as reverse sublimation or desublimation. Deposition occurs when cooling causes a gas to become a solid, without passing through the liquid state. It is the opposite of sublimation. An example occurs in sub-freezing air, when water vapour changes directly to ice without first becoming a liquid. WORKSHEET
4.33 Condensation forms on iced drinks because the cold drink cools down the glass, causing water vapour in the surrounding air to condense on the outside of the glass.
Figure 4.31 Snowflakes form when liquid water turns into solid ice.
Liquid
Frozen
Figure 4.32 When water is frozen, its volume increases.
Figure
Try this 4.5
Simulating particle theory
Using your preferred software (e.g. Microsoft PowerPoint, Scratch or stop-motion), create an animation or simulation that shows how particle arrangements change in the following:
a) a solid melting to form a liquid
b) a liquid evaporating to form a gas
c) a gas condensing to form a liquid
d) a liquid freezing to form a solid.
When your animation or simulation is complete, present it to one of your peers in the class.
Quick check 4.6
1. Identify examples of changes of state in your everyday life.
2. In your own words, define the processes of melting, evaporation, boiling, sublimation, freezing, condensation and deposition. Add these terms to your glossary.
3. Solids, liquids and gases can change their state. In Figure 4.34, each arrow represents a change in state. Use the information the diagram to answer the questions.
SAMPLEPAGES
Figure 4.34 Changes in state
a) Identify the letter that represents melting.
b) Name process B.
c) Identify the letter that represents condensation.
d) Name process C.
4. Use particle theory to answer these questions.
a) Describe what happens when you increase the temperature of a cube of frozen juice.
b) Describe what happens when you increase the temperature of liquid water.
Changing the world through changes in state
By understanding the arrangement of particles and their behaviour in changing states of matter, scientists are learning how to improve our world. For example, in 2021, researchers in Germany developed technology that can harvest water from the atmosphere, 24 hours a day, without using any energy. They designed a specially coated glass pane that reflects light and radiates away heat, keeping itself cool enough for water to condense on the underside of the glass. This could significantly improve the lives of people who live in areas with limited access to fresh water.
Science as a human endeavour 4.3
Figure 4.35 Making water using this new technology is the same process that can be observed when water condenses on the inside of windows in winter.
Practical 4.4
Heating and cooling curves
Aim
To investigate and construct the heating and cooling curves for stearic acid.
Materials
• boiling tube
• 250 mL beaker
• Bunsen burner
Be careful
Take care when using the Bunsen burner, heatproof mat, tripod and glass thermometer. Be aware of the boiling water.
SAMPLEPAGES
• stearic acid (octadecanoic acid), enough to fill approximately a quarter of a boiling tube. Solidified stearic acid can be stored in the boiling tubes and reused.
• tripod
• gauze mat
• heatproof mat
• thermometer/temperature probe
• retort stand
• clamps × 2
• stopwatch
• matches
• safety glasses
Method
1. Consider the risks in this experiment. Make a list of any risks and what you can do to protect yourself and those around you.
2. Wearing your safety glasses, set up the equipment as shown in Figure 4.36.
3. Fill the beaker with 150 mL of water.
4. Heat the beaker on a tripod and gauze until the water just starts to boil. Maintain this at a gentle boil, pulling the Bunsen burner aside if it becomes too vigorous.
Clamp
Thermometer
Boiling tube
Stearic acid
Beaker
Warm water
Figure 4.36 Experimental set-up
5. Record the temperature of the stearic acid every 30 seconds until it reaches 70°C. In your results table, note when it starts to melt.
6. Carefully remove the boiling tube from the beaker using the clamp and record the temperature of the stearic acid every 30 seconds as it starts to cool.
7. Continue until it reaches 30°C. Make a note in your results table when the stearic acid starts to solidify.
Results
1. Draw suitable results tables for this practical. Remember, you are recording the temperature of the stearic acid every 30 seconds in step 4 and step 5, as well as when it melts and becomes a solid again.
2. Draw a line graph to show how the temperature of the stearic acid changed (vertical axis) over the total time (horizontal axis) you took measurements. You should plot both sets of results on the one graph. Use a blue pencil to plot your cooling data and a red pencil to plot your heating data.
continued …
Dicussion: Analysis
1. Analyse your graph to determine the freezing point of stearic acid.
2. Compare this temperature with the melting point temperature indicated on the graph.
3. Explain what is happening to the particles in the solid stearic acid as it is melting.
4. Explain why parts of the graph are horizontal lines. Think about what is happening. Shouldn't the temperature be increasing if the Bunsen burner is still on? Where is the energy going?
Discussion: Evaluation
1. Identify any potential sources of error in this experiment.
2. Suggest any changes that could be made to the method to improve the accuracy of the data in future experiments. Include how each change will improve the data accuracy.
Conclusion
1. Draw a conclusion from this practical regarding particle theory and energy. Copy and complete this statement in your science book. From this activity it can be claimed that _____________. This is supported by the observations that _____________. Therefore, the hypothesis is/is not supported by these findings.
Section 4.3 review
SAMPLEPAGES
Section 4.3 questions
Remembering
1. Recall what happens to the closeness and energy of particles when you heat a substance. What happens when you cool a substance?
2. Copy the diagram in Figure 4.37, and complete it by answering the following questions.
a) Recall the name of the process in each yellow box (e.g. melting, evaporation).
b) Indicate whether you add heat or take away heat to achieve each change of state. Use different colours for the arrows depending on whether heat is added or taken away.
Understanding
4.37 Changes of state caused by adding or taking away heat
3. For each of the following processes, state whether energy is added or removed. a) sublimation b) evaporation c) freezing d) condensation e) deposition f) melting
Applying
4. Use the terms listed below to describe the processes of: a) ice melting b) water boiling boil boiling point decrease evaporate gas heat increase liquid melt melting point particle solid space speed temperature
Figure
Analysing
5. Use the information in Figure 4.38 to answer the questions below.
SAMPLEPAGES
Figure 4.38 The heating curve of a substance that is a solid at time 0 minutes
a) Identify the process that is occuring between 2 and 4 minutes.
b) Identify the state of matter that is present at U.
c) Identify the temperature of the boiling point.
d) Identify the time period when the substance is all in liquid form.
6. Use the information in the table to answer the following questions.
a) Identify the substance that has the highest melting point.
b) Identify the substance that has the lowest melting point.
c) Sequence the substances from lowest boiling point to highest boiling point.
d) Identify one substance that is a gas at 20°C.
e) Identify one substance that is a liquid at 20°C.
f) Identify one substance that is a solid at 20°C.
Evaluating
7. In cold countries, rock faces can sometimes have pockets of water trapped inside cracks after it rains. Decide what might happen if the trapped water freezes when the temperature drops.
Chapter review
Chapter checklist
Success criteria Linked questions
4.1I can describe the particle model. 10, 11
4.1I can distinguish between the arrangement of particles in the three states of matter. 4, 12, 18, 19
4.1 I can explain how heat influences contraction or expansion of particles. 1, 21
4.1I can define the term 'diffusion'. 6, 14, 15
4.2I can list the properties of solids, liquids and gases. 2, 4
4.2I can use the particle theory to explain the properties and behaviour of substances. 5, 7, 11
4.2I can define the terms 'density' and 'viscosity'. 1, 3, 16, 17
4.3I can describe how the arrangement of particles and their properties can change during heating or cooling.
1, 4, 8, 9, 10, 13, 20, 22
SAMPLEPAGES
Review questions
Remembering
1. Identify the correct words or terms to answer the questions or fill in the blanks below.
a) Something you can do if you want a metal to contract.
b) Hot air _____________ because it expands and gets less dense.
c) This metal is a liquid at room temperature and, because of the way it contracts and expands, can be used to measure temperature.
d) A word that means the same as evaporation.
e) The process of turning a solid into a liquid by heating it.
f) When the water vapour in the air cools down overnight, it will often _____________ and form dew.
g) Golden syrup is more ____________ than water because of its higher resistance to flow.
2. Recall the correct properties of solids, liquids and gases to complete the following table.
Solids Liquids Gases
Shape
Volume
Density
Ability to flow
Ability to be compressed
Closeness of particles
3. Recall the two measurements that you need to make to calculate the density of an object.
Understanding
4. State whether each of the following statements is true or false. Rewrite the false statements so that they are true.
a) Toothpaste behaves only like a solid.
b) Oxygen can be compressed.
c) A wooden toy has a fixed shape.
d) Melting points are different depending on the substance.
e) Steam changes back to a liquid at the boiling point.
f) Liquid particles have the highest speed of movement.
g) The particles in water are closer together than the particles in steam.
h) Solids and liquids have a fixed mass, while gases do not.
5. Select the property (A–D) that matches the correct behaviour of the particles (1–4).
Property
SAMPLEPAGES
Behaviour of particles
A. Takes the shape of the container 1. Because the particles are very close already
B. Very difficult to compress 2. Because the particles are not held together at all
C. Cannot be poured 3. Because the particles are free to move
D. Can spread out in all directions 4. Because the particles are not free to move
6. Define 'diffusion' with respect to particle theory.
7. Explain why a solid is very difficult to compress when force is applied.
8. Explain why temperature influences the state of a substance.
9. Describe the likely outcome of heat being absorbed by particles.
Applying
10. Use your knowledge of the particle model to explain what happens in the following situations.
a) The temperature of steam (gas) is decreased.
b) The temperature of liquid water is decreased.
11. Describe the gas pressure in a full balloon in terms of particle theory.
12. A single grain of sand is hard and has a definite shape. If you scoop up a handful of dry sand, you can pour it out of your hand, which sounds like the behaviour of a liquid, not a solid. It is very difficult to build a sand castle with dry sand. However, if you wet the sand, you can shape it into a sand castle. Explain why you might classify sand as a solid.
Figure 4.39 Sand seems to have different properties when it is wet and when it is dry.
13. A can of soft drink is taken out of the fridge and left on the bench. After a few minutes the can has beads of water on the outside. Explain where the water came from and what change of state occurred.
14. Describe how one gas diffuses through another.
15. Figure 4.40 shows the process of diffusion occurring; that is, the movement of gases or liquids spreading out in another gas or liquid.
SAMPLEPAGES
Before diffusion
After diffusion
Figure 4.40 The process of diffusion illustrated as particle diagrams. The particles are constantly moving and, over time, will spread out.
a) Explain what is happening to the red particles as they diffuse through the orange particles.
b) Factors like heat can affect how fast diffusion occurs. Would the red particles diffuse more quickly or more slowly if moved from a room temperature beaker into warm water? Explain, making mention of the particle model.
c) The state of the substances diffusing can also affect how fast diffusion occurs. Decide which one you think would diffuse faster – particles of perfume in the air or ink in water – giving reasons for your answer.
d) An effervescent tablet put into water bubbles away until it dissolves – this is an example of diffusion. Decide whether this is an example of a solid moving through a liquid, a liquid moving through a liquid, or a gas moving through a liquid. Give reasons for your answer.
Analysing
16. In Figure 4.41, Block A and Block B are made of different materials. Each block is in a beaker with baby oil, as shown.
A
baby oil
B
Figure 4.41 Why does Block A sink and Block B float?
a) Explain why Block A sinks and Block B floats. The density of baby oil is 0.82 g/mL.
b) Decide whether warming up the baby oil in the beaker containing Block B would give the same or different results.
Block
Block
17. Explain how particle theory helps us understand why honey is more viscous than water. Include the role of particle attraction and temperature in your answer.
18. Classify the substances in the following diagrams as a solid, liquid or gas. What it is about substance B that enabled you to identify it?
Evaluating
SAMPLEPAGES
19. The particle theory of matter states that there are attractive forces and spaces between particles. Decide whether the forces of attraction are greater or lesser for particles that are further apart from one another.
20. Burning a fuel produces a lot of heat and the particles formed are usually in the gaseous state. Discuss why, when solid or liquid fuels burn, the product is usually a gas.
21. When you are walking home from school, have a look at the concrete footpath. You may notice that it is not one long path but rather a series of large sections all in a row. Propose why you think concrete paths are constructed this way.
22. Dry ice is used in film-making to set the mood for scenes (e.g. in horror, fantasy and mystery films) (see Figure 4.42). Determine how dry ice is useful in this case.
Figure 4.42 What process involving dry ice enables it to create this effect?
Data questions
Water exists naturally on Earth in three states: solid (ice), liquid (water) and gas (water vapour).
Figure 4.43 shows the point at which water changes between these states at different temperatures and pressures.
SAMPLEPAGES
Figure 4.43 State changes of water at different temperatures and pressures. The yellow line illustrates sublimation, the red line melting and the dashed line evaporation.
Applying
1. Identify the state of water at 50°C and 100 kPa.
2. Identify the temperature at which water will freeze at 1000 kPa.
Analysing
3. Contrast the boiling point of liquid water at 10 kPa pressure and 100 kPa pressure.
Evaluating
4. Infer what is meant by the 'triple point'.
5. Given that atmospheric pressure (the pressure at sea level) is approximately 101 kPa, explain why we tend to encounter water in its liquid state in our daily lives (puddles, rain, rivers, lakes, coming out of taps, etc.).
6. Predict at what temperature liquid water will freeze at 20 000 kPa pressure.
7. Justify why, at atmospheric pressure (101 kPa), snow should melt and not sublime.
8. Starting at atmospheric pressure (101 kPa), deduce whether the pressure needs to be increased or decreased at 0°C for ice to sublime.
9. Deduce whether it is possible for water to exist as a liquid above 100°C.
Stem activity: Responding to an oil spill
Background information
Environmental engineers use the principles of engineering, soil science, biology and chemistry to help solve a number of environmental problems. For example, one environmental problem they are called upon to assist with is cleaning up oil spills and other environmental hazards.
SAMPLEPAGES
Oil is a liquid that has a lower density than water and so it floats on the surface of ocean water during an oil spill. This is a useful property, because an oil spill can then be contained on the surface water. Unfortunately, oil sticks readily to marine life such as birds, turtles and fish, as well as land, such as sand on beaches. Due to their serious impact on the environment, oil spills need to be responded to very quickly. Common clean-up methods employed by engineers include:
• using booms (inflatable containment barriers)
• skimming (vacuuming the oil spill from the surface water)
• absorbing (using sponge-like material to absorb and collect the oil)
• dispersing (breaking up the oil into smaller particles).
In 1999, an oil tanker called the Sylvan Arrow was found guilty of discharging an oily mixture into the sea west of Wilson's Promontory. The oil slicked on the surface water and although there was a rapid response to disperse the oil, some of the oil washed up on the beaches nearby.
DESIGN BRIEF
Determine the most effective response to an oil spill off the Victorian coastline.
activity instructions
In this task you will play the role of environmental engineer and work in your group to determine the most effective way to respond to an oil spill off the coast of Wilson's Promontory. You will carry out a simulation of an oil spill and direct how it can be cleaned up. You will collect data about the oil removal and consider the effectiveness and cost of each method.
You will present your findings of the effectiveness and cost of cleaning methods in either a report or a presentation for the local government as a representative environmental engineer.
Research and feasibility
1. Complete the following table by listing all the possible ways of cleaning up an oil spill and what materials you have access to that could do the job. For each material, consider whether it is a skimmer, absorber or dispersant. Then record how expensive you think each method might be.
Figure 4.45 A boom is an inflatable barrier used to contain an oil spill.
Figure 4.44 Oil slick from an oil spill on the surface of the water
Material Effect on oil spill
Detergent
Cotton balls
Plastic spoon
Small sponge
Paper towel
Skimmer, absorber or dispersant (and cost)
SAMPLEPAGES
2. Consider how you will record your data on the effectiveness of oil removal and the cost.
3. Write a hypothesis for the experiment, including a prediction of which material will be most effective at removing oil from water.
Design
4. Design a method in your group for the three techniques of oil spill clean-up: a) using a skimmer b) using an absorber c) using a dispersant.
Note: You may want to pour your oil from a beaker into the tray and then, as you collect the oil, place it back into the beaker. This will help you measure before and after amounts, so you can compare the effectiveness of the three methods. You should try to collect all the oil before it reaches the coastline.
Create
5. Using your set-up reef, place the ship in an agreed location (group consensus), and pour the oil mixture onto the water slowly. Try to completely remove the oil mixture using the skimmer technique. Spill the oil back into the water, then repeat for the absorber, and then the dispersant. Record your results in the table you designed in step 2.
Evaluate and modify
6. Construct a bar graph showing the effectiveness of each clean-up method and another showing the cost of each clean-up method.
7. Discuss with your colleagues whether the experimental data supports your hypothesis. Describe any sources of error in your experiment and how to prevent these errors in the future.
8. Consider the impact that ocean waves might have on the effectiveness of the skimming method for clean-up. Would it be cost-effective to have boats with specialised equipment for the task?
9. Consider the disposal method for absorbers that have soaked up the oil after the clean-up. Discuss with your colleagues how effective the absorber was as a clean-up technique, and where these absorbers should be disposed of after use.
10. Discuss with your colleagues three possible impacts on the marine ecosystem of adding chemical dispersants to clean an oil spill.
11. Compare the measured volume of crude oil spilt into your ocean with the volume of crude oil you removed. What percentage of crude oil did you successfully remove from the ocean? Did one technique prove to be more effective? Explain the possible causes of any differences between the two volumes.
12. Using the information gained from your evaluation of the experiment, prepare a report for the local government that summarises your simulation findings. Include: a) the different methods, their effectiveness and their costs b) which method(s) you think should be used by environmental engineers in the future when cleaning up an oil spill in a local waterway.
Chapter 5 Mixtures
SAMPLEPAGES
Introduction
Water, seawater and freshly squeezed orange juice are all made of matter and are all considered liquids. However, they also have some differences. Water is always water, even if it is frozen or boiled. It is a pure substance. But if you boil seawater, the water evaporates and leaves salt behind. If you strain orange juice, you will be left with bits of orange pulp. The seawater and the orange juice are mixtures. In this chapter, you will explore how to separate mixtures using a variety of separation techniques. This includes techniques you might already use at home, as well as industrial applications.
Substances
Concept map
SAMPLEPAGES
Pure substances (e.g. elements and compounds)
Heterogeneous mixture
• Suspension
• Colloid
• Emulsion
Separation techniques
Magnetic Gravity and decantation
Flocculation
Flotation
Filtration
Centrifuging
Impure substances (e.g. mixtures)
Homogeneous mixture
• Solution (solute and solvent)
Section
Separation techniques
Chromatography
Evaporation and crystallisation
Distillation
Curriculum content
matter can be classified as pure substances such as elements and compounds or impure substances such as mixtures (including solutions), and can be modelled using the particle model; mixtures may have a uniform (homogeneous) or non-uniform (heterogeneous) composition and can be separated based on the properties of their components using techniques including filtration, decantation, evaporation, crystallisation, magnetic separation, distillation and chromatography (VC2S8U06)
SAMPLEPAGES
• using representations of particles to show the difference between samples of pure substances and mixtures, and identifying examples of each
• using coloured beads or buttons to represent different substances, and then mixing these 'particles' in different containers to demonstrate both uniform (homogeneous) and nonuniform (heterogeneous) mixtures, and to demonstrate the difference between dilute, concentrated, saturated and supersaturated solutions
• investigating solubility by observing which common substances dissolve in water, for example sand, salt, sugar, oil, metals and plastic
• analysing how the physical properties of substances in mixtures, such as particle size, density and volatility, determine the separation technique used
• using paper chromatography to separate the components of different coloured inks or food dyes
• investigating separation techniques used by Aboriginal and/or Torres Strait Islander Peoples, such as hand-picking, sieving, winnowing, yandying, filtering, cold-pressing and steam distilling, for example in the extraction of oils from plants
• designing, making, testing and refining a 'separating machine' to separate the components of a mixture
• exploring and comparing separation methods used in a variety of situations such as in homes, recycling industries and for purifying water, or viewing simulations or videos showing the separation of crude oil into its components, including the isolation of contaminants
Glossary terms
Aqueous solution
Buoyancy
Centrifuge
Chemical substance
Chromatography
Colloid
Compound
Concentrated
Crystallisation
Decantation
Dilute
Dissolve
Distillate
Distillation
Element
Emulsion
Evaporation
Filtrate
Filtration
Flocculant
Flotation
Heterogeneous mixture
Homogeneous mixture
Insoluble
Koolamon
Mixture
Physical property
Pure substance
Residue
Saturated
Sieving
Smog
Soluble
Solute
Solution
Solvent
Supersaturated
Suspension
Volatility
5.1 Pure substances and mixtures
Learning goals
At the end of this section, I will be able to:
1. Identify the difference between pure substances and mixtures.
2. Classify mixtures into one of the four types based on their observable properties.
3. Distinguish between homogeneous and heterogeneous mixtures based on their properties.
Everything in the world around you, whether you can see it or not, is made up of matter. In the last chapter, you may recall that matter was described as anything that has mass and occupies space.
Matter can be made up of:
• a pure substance – one type of chemical substance
• a mixture – a mixture of different chemical substances.
Pure substances
A pure substance is made up of only one type of chemical substance and has constant chemical properties. This chemical substance may be what we call an element or a compound. You will cover these types of chemical substances in greater detail in Year 8, but simply, an element is a chemical substance made up of only one type of particle or atom. Examples are pure gold (just gold atoms) and pure oxygen (just oxygen atoms). A compound is a chemical substance made up of two or more different types of atoms bonded together. An example is water, H2O, which is made of hydrogen and oxygen atoms bonded together. Every pure substance has a unique set of physical properties, such as density, size, magnetism, colour, mass, melting point and texture. Understanding the unique physical properties of a pure substance allows scientists to distinguish it from a mixture.
Mixtures
SAMPLEPAGES
chemical substance matter that contains only one type of particle
A mixture is a material made from two or more chemical substances that are mixed together and can be physically separated. Mixtures can be separated because they are not combined chemically in a chemical reaction. Some examples of mixtures that you may be familiar with are soft drinks (a mixture of sugar, water, carbon dioxide, flavours and colouring), tap water (a mixture of water, fluoride salts, salts dissolved from ground water and chlorine) and fruit salad (a mixture of kiwi fruit, apples, bananas and raspberries, for example).
pure substance material that is made up of just one type of chemical substance element a chemical substance made up of only one type of atom compound a chemical substance made up of two or more types of atoms physical property the way a substance looks and acts; a characteristic of a substance that can be observed and/or measured without changing it chemically
mixture material that is made up of two or more types of chemical substances that are not chemically bonded together dissolve to become mixed in a substance so that it cannot be seen
Figure 5.1 Pumpkin soup is a tasty mixture.
SAMPLEPAGES
Making thinking visible 5.1 thinking with images: Pure or mixture?
The four images show two pure substances and two mixtures of substances.
1. How is image a like image d?
2. How is image b like image c?
3. How is image a not like image b?
4. How is image c not like image d?
5. Predict which two substances could be classified as pure and which two images could be classified as mixtures.
The Thinking with images thinking routine was developed by Project Zero, a research centre at the Harvard Graduate School of Education.
Mixture
Figure 5.2 A mixture is made of two or more chemical substances.
Quick check 5.1
1. Define the terms 'pure substance' and 'mixture'.
2. Draw up a table with the headings 'Pure substances' and 'Mixtures' and classify the following substances by writing them in the correct column.
smoke pen ink iron
soft drink aluminium foilcough medicine
trail mix margarine filtered water
hand cream chocolate milkjelly
salt water ice cream cheese
oxygen carbon dioxideblood
Types of mixtures
Mixtures can be divided into four types based on their observable physical properties.
Table 5.1 introduces these four types of mixtures: solutions, suspensions, colloids and emulsions
Type of mixture
Solution
SAMPLEPAGES
Suspension
Definition
• Formed when one chemical substance (solute) dissolves uniformly in another chemical substance (solvent).
• Typically transparent or translucent
• Typically small particles
• Formed when a chemical substance does not dissolve in a liquid
• Separates and settles to the bottom if left to stand, forming a sediment
• Usually opaque (cloudy) only after mixing
• Typically larger particles than those in solution
Examples
Lemonade Seawater
Vinegar (a mixture of water and ethanoic acid)
Muddy water
Orange juice with pulp Dust in the air
Colloid
• Formed when larger particles of one chemical substance stay distributed through the other chemical substance
• Does not form sediment if left to stand
• Typically opaque
Emulsion
Whipped cream (gaseous air is distributed throughout liquid cream)
Wet paint (a solid pigment distributed in liquid)
• Formed when a colloid of two or more liquids spread evenly through one another
Table 5.1 Types of mixtures
Toothpaste (solid particles distributed in a viscous liquid)
Salad dressing when shaken together (liquid oil spreads out throughout liquid vinegar)
Milk (an emulsion of fat droplets and oils in water)
solution a mixture where one chemical substance is evenly dissolved in another suspension a mixture where one chemical substance will eventually settle out of the solvent colloid a mixture where particles of one chemical substance do not dissolve but remain distributed through another chemical substance emulsion a colloid of two or more liquids solute the component of a solution that has dissolved into another substance solvent the component of a solution that another substance has dissolved into
Try this 5.1
Observing mixtures
Take a sample of tap water, muddy water, cornflour and water, and milk. Place in four beakers. Make a list of key physical properties that distinguish these four mixtures, and identify which type of mixture each represents. For example, tap water is a solution and is the only mixture that is transparent.
Now stir each of the mixtures. Then, using a strong thin beam of light, shine the light through each of the mixtures. What do you notice? Wait two minutes, then shine the light through again. Do you see any changes?
Quick check 5.2
Copy and complete the following table and select the correct mixtures from Figure 5.3 for the 'Examples' column.
Type of mixtureTransparent or cloudy?Separates/settles when left to stand?Examples
Solution
Suspension
Colloid
Emulsion
Figure 5.3 Can you identify the type of mixture in each image?
SAMPLEPAGES
Classifying mixtures
Mixtures can be more broadly classified into two categories: homogeneous mixtures and heterogeneous mixtures. These categories are important because they indicate the type of properties the mixture will have.
Homogeneous mixtures have the following qualities:
• You cannot tell that two or more substances have been mixed.
• They don't settle or separate out.
• No sediment forms when they are left to stand.
• The components are all evenly distributed.
• Wherever you take a sample from, the properties of every sample will be the same.
• They are usually a uniform colour.
• A solution is a homogeneous mixture.
• Examples are air, tap water and soft drinks.
Heterogeneous mixtures have the following qualities:
• They are mixtures where the components are not evenly or uniformly distributed.
• They do not have consistent physical properties throughout.
• They can be more easily separated into parts that retain their original properties.
• They have different colours and are not transparent.
• Suspensions, colloids and emulsions are generally considered to be heterogeneous mixtures (although some may appear to have some of the qualities of homogeneous mixtures).
• Examples are trail mix, fruit salad, pizza, chocolate chip cookies, smog and salad dressing.
SAMPLEPAGES
Figure 5.4 Particles in matter may be arranged in a pure form or as a homogeneous or heterogeneous mixture.
Try this 5.2
Homogeneous mixtures
Many mixtures look like they might be a pure substance, because they have a homogeneous colour or transparency or relatively consistent properties throughout. List 10 household substances that, when observed, might be considered pure substances but are actually homogeneous mixtures.
homogeneous mixture a mixture in which the components are evenly distributed heterogeneous mixture a mixture in which the components are not evenly distributed smog a mixture of smoke, gases and chemicals, especially in cities
Practical 5.1
sherbet!
Aim
To investigate how changing the proportions of the components in a mixture can change the properties of the mixture.
Materials
• samples of ingredients × 4 (labelled A–D)
• icy-pole sticks
• small zip-lock snack bags
Method
1. Wash your hands.
Be careful
An alternative room and equipment should be used for this activity so there are no chemical or biological materials that could potentially contaminate the activity.
SAMPLEPAGES
2. Go to your teacher and receive a small scoop of sample ingredient A in the palm of your hand. Using the tip of an icy-pole stick, taste ingredient A, and record the taste. Then return to your teacher to get another ingredient to sample (B, C, D).
3. Using a small snack bag, make a mixture of 1 teaspoon of each of the four sample ingredients. Taste your mixture, and record the taste.
4. You now have three opportunities to change the taste of your mixture by changing one ingredient at a time. Record which of the ingredients you are going to change and how. Then collect a new snack bag and make your new mixture. Repeat until you have the best tasting mixture!
Results
1. Record the taste of ingredients A, B, C and D on their own.
2. Draw up a table that shows how much of each ingredient was added to your four recipes and each recipe's taste. Record your data in this table.
Discussion: Analysis
1. Describe which ingredients tasted good on their own and which did not taste good.
2. Explain why an ingredient that tastes bad on its own would be in your sherbet mixture.
3. Compare your recipes and the taste that you ended up with. Even though the ingredients were the same in each mixture, you would have noticed different taste sensations.
4. Would you expect the taste of a homogeneous or heterogeneous mixture to be consistent throughout? Explain.
Conclusion
1. Copy and complete this statement in your science book. From this activity it can be claimed that the taste property of a mixture ______________. This is supported by observations that ______________.
Quick check 5.3
1. Define the term 'heterogeneous'.
2. Recall the characteristics that allow you to identify whether a mixture is heterogeneous.
3. Define the term 'homogeneous'.
4. Recall the characteristics that allow you to identify whether a mixture is homogeneous.
5. Classify the following substances as either a homogeneous mixture, a heterogeneous mixture or pure substance: pure water, cola, iron nails, green paint, chunky salsa, silver ring, chocolate chip cookies, concrete, orange juice with pulp, table salt.
Try this 5.3
Modelling pure substances and mixtures
Use coloured beads or counters to represent different particles or atoms. How could you arrange the beads to show a pure substance? And how could you arrange them to show a mixture?
Can you show the difference between an element and a compound? What about the difference between a homogeneous mixture and a heterogeneous mixture?
SAMPLEPAGES
Draw diagrams of the way the different particles are arranged, taking care to label whether it is a pure substance or a mixture.
As a super challenge, you may like to use an online program or app to do your modelling.
Separating mixtures
Because the chemical substances in mixtures are not chemically combined, it is possible to separate a mixture back into its pure components. This is typically done by taking advantage of the unique physical properties of the pure substances in the mixture. Physical properties such as density, size, colour, magnetism and boiling point can be used to separate components of mixtures. We will explore the separation of heterogeneous and homogeneous mixtures in sections 5.3 and 5.4.
Recycling sorting
To use a real-world example of separating a mixture, consider your weekly household recycling. Once the recycling truck delivers recycling to the collection centre, a range of separation techniques are applied to separate plastics, paper, glass and metal cans. This can be done using manual sorting, sieves, magnets and machines that sort by size or weight. The separated elements are then taken to their respective recycling companies.
Figure 5.5 The different properties of recycling materials such as size and type of material allows sorting of your weekly recycling.
Section 5.1 review
Go online to access the interactive section review and more!
Section 5.1 questions
Remembering
1. Identify which of the following would not be described as a colloid: smoke, foam, salt water, hair gel.
Understanding
2. Summarise the differences between pure substances and mixtures, and provide two examples of each.
3. Outline the differences between heterogeneous mixtures and homogeneous mixtures, and provide two examples of each.
Applying
4. Is 100 per cent pure carrot juice a pure substance? Explain, using the definitions you have learned.
5. You are looking at a beaker with a substance in it. Describe how you can tell whether it is a solution, suspension, colloid or emulsion. Show your knowledge of the characteristics of the four types of mixtures in your answer.
Analysing
6. Categorise the particle diagrams below, using the following terms: pure substance, heterogeneous mixture, homogeneous mixture.
SAMPLEPAGES
Evaluating
7. Justify the claim that all solutions are mixtures, but not all mixtures are solutions.
5.2 Homogeneous mixtures
Learning goals
At the end of this section, I will be able to:
1. Define an aqueous solution, including the terms 'solution', 'solute' and 'solvent'.
2. Distinguish between soluble and insoluble substances.
3. Compare a dilute, concentrated and saturated solution.
SAMPLEPAGES
Solutions are a type of homogeneous mixture in which a solute is dissolved and evenly distributed in a solvent. In this section, you will learn about everyday solutions as well as their concentrations and saturation.
solutions
A solution is a type of mixture that is formed when the particles of one substance move apart and spread out evenly into another substance; that is, dissolve. Typically, solutions appear transparent due to the even distribution of the dissolved particles. Recall that 'solute' is the name given to the substance that dissolves and 'solvent' is the name given to the substance it dissolves into. A solution is therefore the name given to a mixture of a solute dissolved in a solvent.
Try this 5.4 Particle theory
Figure 5.7 shows a solute being added to a solvent. The solute is made up of salt particles and the solvent is made up of water particles.
1. Describe what is occurring in the sequence of images.
2. What type of mixture is present at the end?
Figure 5.7 Particle diagram of a solute being added to a solvent
Figure 5.6 Fresh drinking water is a solution as various trace elements from ground water are dissolved evenly in pure water.
aqueous solution a solution in which the solvent is water soluble able to be dissolved in a particular solvent insoluble not able to be dissolved in a particular solvent dilute having a relatively small amount of solute concentrated having a relatively large amount of solute
Examples of solutions
An everyday example of a solution is oxygen dissolved in fish tank water, where the oxygen is the solute and the water is the solvent. Other examples are cordial (solute) dissolved in a glass of water (solvent) and carbon dioxide (solute) dissolved in fizzy drink (solvent). Notice that many of the solutions mentioned so far are made of solutes dissolved in the solvent water. Water is sometimes called the 'universal solvent' due to its versatility in dissolving a wide variety of solutes. Solutions in which water is the solvent are called aqueous solutions
Chemical substances that can dissolve in a particular solvent are called soluble and those that cannot dissolve in a particular solvent are called insoluble. For a substance to be soluble, the forces of attraction between the solute particles need to be broken by the solvent. Chemical substances that are insoluble have very strong forces of attraction between their particles and like to stay together. The solvent cannot break them apart to help them dissolve. For example, metals and plastics are insoluble in water and it is this property that makes them useful in the kitchen.
Solution concentrations
WORKSHEET
Dissolving solutes
WORKSHEET
Solutions, solutes and solvents
SAMPLEPAGES
Solutes can dissolve in solvents to different extents depending on how much is added to the solvent.
• Dilute: a solution that has a relatively small amount of solute dissolved in the solvent is said to be dilute. It is also described as a solution with a low concentration of solute. For example, a friend might ask you to make a 'weak' glass of cordial. You would add only a small amount of cordial (solute) and a lot of water (solvent) to make a weak or dilute solution.
• Concentrated: a solution that has a relatively large amount of solute dissolved in a solvent is called concentrated. It is also described as a solution with a high concentration of solute. How would you make your friend's cordial drink in this case?
Dilute solution (less solute)
Solute Figure 5.9 A solution becomes more concentrated as more solute is dissolved in the solvent.
Concentrated solution (more solute)
Figure 5.8 The weedy seadragon in Westernport Bay breathes oxygen, which is a solute dissolved in the ocean water.
Quick check 5.4
1. Identify the solute and solvent in the following solutions: ocean water, vinegar, tap water, lemonade.
2. Define these terms: soluble, solution, solvent, solute, aqueous solution.
3. Imagine you have been using marbles and a tray to model the difference between dilute, concentrated, saturated and supersaturated solutions. Draw what each of your models would look like.
SAMPLEPAGES
Explore! 5.1
safe drinking water
Melbourne Water manages and protects Melbourne's major water resources on behalf of the community. It supplies drinking water, catches and stores water, recycles water, protects the waterways and maintains drainage systems. Research and find out the processes involved in cleaning water ready for us to drink. Investigate what is added to our drinking water to make sure it is safe. What is the role of each of the additives? Are they soluble or insoluble?
Saturation
While some chemical substances are soluble in a solvent, there will always be a limit to the solubility. For example, when salt is added to a beaker of water, it readily dissolves to form a solution. But if too much salt is added to water, eventually there will be no more space left for the salt to dissolve in the water. The solution is said to be saturated. This is like having a towel saturated with water after you drop it in the pool – the towel cannot take in any more water.
Because a saturated solution is so concentrated that no more solute will dissolve into the solvent, you will find that if you keep adding salt you will just end up with undissolved salt on the bottom of the beaker. However, if you heat your saturated solution, add more solute and then cool it gently, more solute will dissolve, making a supersaturated solution.
Try this 5.5
Investigating solubility
Investigate the solubility of household substances in water.
1. Collect five containers of the same size.
2. Add a teaspoon of one of five common household substances to each container and label the container. Typical substances are sugar, salt, flour, oil and sand.
3. Add two tablespoons of cold tap water and mix the substances together using a spoon or by carefully swirling the container.
4. Record your observations of each substance using the words 'soluble', 'partly soluble' or 'insoluble'.
5. Add another teaspoon of each solute to each container and stir. Did all the solute dissolve? Is it a saturated solution?
6. Add yet another teaspoon of each solute to each container. Did all the solute dissolve this time? Is it a saturated solution? Or even a supersaturated solution?
saturated containing the maximum amount of solute dissolved in the solvent supersaturated containing more solute than a saturated solution
Investigation 5.1: Self-design
does the surface area of a solute change the time it takes to dissolve?
Aim
To investigate the effect of surface area on how quickly an effervescent tablet dissolves into water, forming an aqueous solution.
Materials
• test tubes and stoppers of the same size × 2
• effervescent tablets × 2
• test-tube rack
• access to tap water
Method
• metal spoon
• mortar and pestle
• stopwatch or equivalent
1. Design a simple experiment using two test tubes, a crushed effervescent tablet (high surface area exposed to the water) and an uncrushed tablet (low surface area exposed to the water).
2. Consider what you are investigating in this experiment, and list:
• what you will change between the test tubes – the independent variable
• what you will measure and record – the dependent variable
• what you will keep the same – the controlled variables.
3. Write your method in numbered steps, in enough detail for someone in another Year 7 class to use to repeat your experiment just as you did. Remember to include specifics, such as the amount of water you will add to the test tubes.
4. Show your teacher your method and ensure that you discuss any risks and how they can be prevented. This is called a risk assessment.
5. Write a hypothesis for your experiment: in which situation do you think the effervescent tablet will dissolve faster?
6. Carry out your experiment safely and record your results, using minutes and seconds.
Results
Design a table that will allow you to record how quickly the effervescent tablet dissolves in each situation. Remember to include a title and any relevant units.
Discussion: Analysis
1. Which test tube contained the effervescent tablet that dissolved more quickly?
Discussion: Evaluation
1. Sometimes in experiments things may happen by accident (e.g. pouring too much water into the test tube) or are beyond your control (e.g. it is a really hot day on the day of the experiment), and these may affect the outcome of your investigation. Were there any sources of error in your experiment? How could you prevent them from occurring in the future?
SAMPLEPAGES
2. Speak to your classmates about what they discovered about how surface area affects the time taken for an effervescent tablet to dissolve. Is there a benefit to collating or combining your data and calculating an average?
3. What would be more useful: a tablet that helps you rehydrate after playing sport, or a powder that helps you rehydrate after playing sport? Explain your decision.
Conclusion
1. Copy and complete this statement in your science book. From this activity it can be claimed that _____________. This is supported by the observations that _____________. Therefore, the hypothesis is/is not supported by these findings.
Figure 5.10 Effervescent tablet dissolving in water
Section 5.2 review
Go online to access the interactive section review and more!
SAMPLEPAGES
Section 5.2 questions
Remembering
1. Define the following terms: saturated solution, aqueous solution, dilute solution, concentrated solution.
Understanding
2. Each of the following statements is incorrect. Rewrite each statement and select the appropriate word(s) to make the statement correct.
a) Soluble is when a substance cannot be dissolved in a solvent.
b) A solvent dissolves in a solute to form a solution.
c) A mixture is when different substances are chemically combined.
d) A saturated solution is a solution in which the minimum amount of solute has been dissolved.
e) In a solution, the solute is unable to dissolve into the solvent.
f) Concentrated solutions have a lot of solvent compared to the amount of solute.
g) A suspension is a mixture in which a solute is dissolved in a solvent to form a transparent liquid.
3. Identify whether each of the following is a solvent, a solute or a solution.
a) fizzy water
b) vinegar
c) syrup
Applying
4. Explain why it is possible to see solid salt crystals in water but not possible to see dissolved salt particles.
5. You have been given a mug of dilute cordial and a mug of concentrated cordial. You have then been asked to work out which was which without tasting it. Describe how you could do this and what results you would expect.
Analysing
6. Compare solutions and mixtures. You may choose to use a Venn diagram.
7. Distinguish between a concentrated solution and a supersaturated solution.
Evaluating
8. The test tube shown here contains a liquid and a soluble solid. Create as many new diagrams as needed to show the following key terms. You may be able to include several terms on one diagram.
1. Describe how magnetism can be used to separate a mixture.
2. Distinguish between techniques that use density to separate mixtures, such as decantation, flotation and centrifugation.
3. Describe how filtration can be used to separate mixtures based on particle size and solubility.
4. Outline the different separation techniques used by Aboriginal and Torres Strait Islander Peoples.
The chemical substances in mixtures can be separated into their pure parts by using the unique physical properties of the components, such as magnetism, density and size. This is easier in heterogeneous mixtures because the components are not well mixed and can usually be easily observed with the naked eye. For example, a separation technique called hand-picking involves picking out the different components by hand. Imagine a bowl of red and green lollies that could be sorted by picking out the red lollies by hand. This is not always the most effective separation technique, though. This section will explore other techniques commonly used to separate heterogeneous mixtures.
separation based on magnetism
Magnetic separation is a type of hand-picking where the components picked are magnetic and the hand is a magnet! Imagine you are building a shelf in a woodwork class and you drop some iron nails on the sawdust-covered floor. A magnet would pick up only the magnetic nails and leave all the sawdust remaining on the floor. Not all metals are magnetic, so magnetic separation can only be used to separate some metals. This is how steel and aluminium cans are separated in a recycling facility. It is also used in the mining industry to separate valuable materials from unwanted materials.
Figure 5.11 A magnet can be used to separate magnetic substances from non-magnetic substances.
SAMPLEPAGES
Try this 5.6
separating the iron from your cereal
Using a mortar and pestle, crush a handful of flakes from an iron-fortified cereal into a very fine powder. Cover a strong magnet in some cling wrap and move the covered magnet through the powdered cereal. Take your time – the longer you move the magnet around in the powder, the more iron you will pick up. After several minutes, remove the cling wrap from the magnet, holding it over some white paper as you do this. Now, hold a magnet under the paper and move it around slowly. With careful manoeuvring, you should be able to separate out little grey specks of iron from the rest of the cereal powder. Crazy!
separation based on density
Decantation
Decantation is a technique where you carefully pour the liquid off the top of a solid–liquid or a liquid–liquid mixture to separate the two components. Imagine that you have accidentally dropped a Smartie in your drink at a birthday party. The Smartie will sink to the bottom of your glass. Luckily, the process of decantation can help you separate your drink from the Smartie using the different densities of the components of the mixture. Because the Smartie has a higher density and your drink has a lower density, you can pour the liquid off the top of this solid–liquid mixture, thus decanting or separating the two components. You may have done this at home when pouring water off the top of your vegetables or eggs once they have been boiled for dinner.
decantation the process of separating substances by using density
flocculant a chemical substance that causes particles to clump together
SAMPLEPAGES
Supernatant
Figure 5.12 Decantation is a separation technique based on the components of the mixture having different densities. You can see here, with muddy water, that the denser mud sinks to the bottom (forming sediment), while the less dense water (called supernatant) can be poured off.
Decantation can be tricky if the solid particles in the liquid are very small or fine and are taking a long time to sink to the bottom. A flocculant is a chemical substance that is added to a solid–liquid mixture to help the solid particles clump together. Once the solid has clumped together, it is more likely to sink and then the mixture can easily be decanted. Flocculants are used in swimming pools to aid in the cleaning of small solid particles.
But what happens if you have two liquids mixed together? If they have differing densities, then they can be separated using decantation. Or if you are in a laboratory, you could use a separating funnel, as shown in Figure 5.13.
Figure 5.13 A separating funnel is a tool scientists use to accurately separate two liquids of different densities. In this example, the oil is less dense than the water.
Glass rod
Supernatant
Beaker
Beaker
Separating funnel
VIDEO Oil spills
flotation separating a mixture based on the capacity to float buoyancy the upward force experienced by an object that is partially or fully submerged in a liquid or a gas koolamon also spelled coolamon, a carrying vessel, widely used by Aboriginal and Torres Strait Islander Peoples across Australia
centrifuge a device that uses speed and rotation to separate substances based on their density
Flotation
Flotation is another separation technique that uses the different densities of the components of the mixture to separate them. It is the lower density, or buoyancy, of a mixture's components that makes this separation technique effective. For example, oil floats on water as it has a lower density, so this allows for the clean-up of ocean oil spills. First, booms (floating barriers) are placed around the oil to help contain it. Skimmers (boats with vacuum machines, sponges or oil-absorbent ropes) then soak up the spilled oil from the surface within the booms.
Winnowing
Winnowing is a separation technique that is designed to remove lighter or less dense particles while keeping the heavier or more dense ones. This technique has been used for thousands of years by many Aboriginal and Torres Strait Islander Peoples. It is most commonly used to separate seeds from their outer shells or husks. The mixture of seeds and husks is placed in a koolamon and then the mixture is thrown lightly into the air, allowing the wind to blow the lighter husk particles away while the heavier seeds fall back into the container.
Centrifuging
5.14 The soap froth on this bathtub could be separated from the underlying water due to its buoyancy.
Figure 5.15 A koolamon is used to separate seeds from their outer husk using the technique of winnowing. The word 'koolamon' comes from the language of the Kamilaroi people of northern New South Wales and southern Queensland.
A centrifuge is a device that can separate chemical substances based on their density by spinning them very quickly. During spinning, the most dense chemical substances move towards the outside of the centrifuge. An example of this is a blood sample that can be separated into its components of red blood cells, white blood cells, platelets and plasma. After centrifugation, the most dense component (red blood cells) is at the bottom of the vial, white blood cells and platelets are in the middle of the separated sample and the least dense component (plasma) is at the top of the vial (see Figure 5.16b).
SAMPLEPAGES
Figure
Figure 5.16 (a) Blood samples spinning in a centrifuge. (b) Test tube containing a blood sample that has been separated into its components based on density.
VIDEO Centrifuging blood
Did you know? 5.1
skimming milk
Full-cream milk is a mixture of milk and cream. At the supermarket, you might have recognised milk with a pink or red cap, commonly called 'skim milk'. This type of milk is one that has had the milk content separated from the cream and fat globules using a centrifuge. The full-cream milk enters the spinning centrifuge and the more dense milk component moves towards the edge of the centrifuge while the lighter cream remains in the middle. The separated milk is then collected as 'skim milk' with a lower fat content for consumption.
Explore! 5.2
traditional separation techniques
Aboriginal and Torres Strait Islander Peoples have been separating heterogeneous mixtures for centuries. Separation techniques such as winnowing, which you read about earlier, are essential to purify food and water sources. Research how each of the following methods might be used by different groups of Aboriginal and Torres Strait Islander Peoples to prepare a meal:
1. hand-picking
2. yandying
3. cold-pressing.
SAMPLEPAGES
Figure 5.18 Hand-picking is a separation technique where desired substances, such as food, are selected by hand and removed from a mixture containing undesired substances. These berries are called Kooralkar in Bardi language or Goowal/Guwal in Yawuru. While the fruit is eaten, the bark from the same plant has medicinal properties and can be used in firemaking.
Quick check 5.5
1. Identify what you should use to separate a mixture of sand and iron.
2. Explain what might prevent a magnet from being useful for separating the components of a mixture.
3. Identify a situation when hand-picking would be the most appropriate way to separate a mixture.
4. Explain the separation technique of decantation.
5. Explain the relationship between density and the separation technique of flotation.
Figure 5.17 Centrifugation of full-cream milk results in 'skim milk'.
sieving separating solids based on the size of their particles
filtration separating a mixture with different states of matter by passing it through a filter residue
the substance that is left in a filter filtrate the substance that passes through a filter
separation based on particle size
Sieving
Sieving is a type of filtration where a sieve separates solids based on their size. You might have seen sieving in action with the use of flour sifters or salt and pepper shakers. These sieves have particular-sized holes that allow similarly sized particles to move through.
Filtration
Filtration is a technique used to separate the components of a mixture based on not only their particle size, but also on their state of matter or their solubility. Filters are used for many applications including coffee makers, vacuum cleaners and pool filters. The holes in the filter are sized according to what is being filtered. For example, a filter basket in a pool has holes that you can see, because the leaves it is trying to filter out are not microscopic. The holes in a coffee filter are much smaller, because coffee granules are smaller.
SAMPLEPAGES
Water purification is based on filtering. Traditionally the Gunditjmara people of southwest Victoria used flowering honeysuckle cones (banksias) to filter water from muddy pools. When clean drinking water was scarce, they would place the cone in their mouths and use it like a filtration straw to separate impurities from unclean drinking water. Contemporary water purification can involve nano-filtration, where particles as small as bacteria and viruses can be separated from water.
Explore! 5.3
budj bim: aboriginal and torres strait Islander filtering
The Gunditjmara people of south-western Victoria have demonstrated an advanced knowledge of engineering, physics and aquaculture through the creation of intricate stone fish traps – these are some of the oldest examples of human-made structures in the world! The Budj Bim eel traps feature an elaborate system of canals and ponds constructed from river stones. See if you can find an image of the eel traps, find out how old they are, how scientists dated the structures, how they were used for farming, how computer modelling has helped scientists understand the cultural landscape of Budj Bim, and whether Budj Bim has World Heritage status.
5.20 Short-finned eels were trapped by placing long, funnel-shaped woven baskets in the channels of Budj Bim.
After any type of filtration, there will be a substance remaining on the filter that was too large to pass through and another substance in the underlying container that has passed through the filter. The substance on the filter is called the residue, while the substance that has passed through the filter is called the filtrate. In a laboratory, you would most often use filter paper in a funnel and a beaker to separate the components of a heterogeneous mixture. Figure 5.21 shows the steps that you might take in carrying out filtration at school.
Figure
Figure 5.19 Pasta and water are separated by sieving with a colander.
Filter paper
Heterogeneous mixture Filter funnel
SAMPLEPAGES
Figure 5.21 Separating a heterogeneous mixture using a filter funnel and filter paper
Did you know? 5.2
the filter-feeding system
Toothless whales, such as the humpback whale (Megaptera novaeangliae), contain a very fine filter in their mouth, called baleen. Baleen allows the whales to take a large mouthful of ocean water and filter out small animals such as fish and krill to be consumed. This is called the filter-feeding system.
Did you know? 5.3
filters in the human body
After eating and drinking, your body does a very good job of absorbing all the nutrients it needs to continue to live and grow. But there are always some waste products left over that your body doesn't need. This is where the kidneys' job starts! The kidneys are made up of thousands of microscopic filters, called nephrons. The nephrons filter all waste products out of the blood and send them to the bladder. These waste products are then excreted from the body as urine.
Filtrate
Residue
Figure 5.22 The mouth of a humpback whale (Megaptera novaeangliae) contains baleen, which allows them to filter the ocean water for krill.
Figure 5.23 Kidneys filter waste products from your blood to produce urine.
Practical 5.2
separating heterogeneous mixtures
Aim
To compare the effectiveness of different separation techniques for cleaning contaminated water.
Prior understanding
Be careful
Do not test water by consuming it.
Separation of heterogeneous mixtures relies on each different substance having a unique set of physical or chemical properties. Each difference in property (e.g. one substance is magnetic and the others are not) is used to simultaneously remove one substance from a mixture while the other substances are left behind. So you may start with four items in a mixture, but after carrying out three different separation techniques, you will have four separate substances.
An excellent application of this can be seen by researching the winner of the 2019 Google Science Fair, a school student who discovered a way to remove microplastics from seawater safely using a ferrofluid.
Hypothesis
Predict which separation technique – decanting, flocculation or filtration – will be the most effective at cleaning contaminated creek water.
Materials
• alum (potassium aluminium sulfate) or equivalent
• contaminated creek water (simulated) – water from a fish tank (water left over from cleaning the filter is ideal), sand, clay, mud
• glass beakers × 3
• metal spoon
• glass cylinders × 2
Method
• stirring rod or spoon
• funnel
• filter paper
• retort stand and clamp
• optional: microscope with dropper, slide and coverslip to observe water
Use each of the following methods separately to identify which substances are removed by the process and the physical or chemical property that was used to isolate one substance from another.
1. Draw up the table shown in the results section in your science book.
2. Test each of the following methods and record the results in the table for comparison.
Decantation
3. Measure 100 mL of creek water into a cylinder.
4. Stir the water until it appears cloudy.
5. Leave the mixture undisturbed for 5–10 minutes so that solid substances can settle on the bottom.
6. Very carefully pour the liquid off the top of the solid substances into a beaker so that they remain in the cylinder.
7. Record your observations in the table.
Flocculation
SAMPLEPAGES
8. Measure 100 mL of creek water into a cylinder.
9. Transfer into a beaker.
10. Stir the water until it appears cloudy.
11. Measure 3 mL of alum solution and stir the mixture for 2 minutes.
12. Leave the mixture undisturbed for 15 minutes.
13. Record your observations in the table.
Filtration
14. Fold the filter paper as shown in Figure 5.24.
15. Set up your equipment as shown in Figure 5.25.
16. Measure 100 mL of creek water into a cylinder.
17. Stir the water until it appears cloudy.
18. Pour the mixture through the funnel and let it filter through the paper.
19. Record your observations in the table.
Results
Table showing effectiveness of different separation techniques in improving water quality
Independent variable: Separation technique
Decantation
Flocculation
Filtration
Discussion: Analysis
SAMPLEPAGES
Dependent variable: Water quality
Describe the initial condition of the water Number of contaminants removed Issues that may have affected the results (e.g. speed, incomplete removal of substance)
1. Critique the effectiveness of each method by considering the number of contaminants removed and any issues you encountered when testing it.
2. Describe how you could use these three methods in combination to remove contaminants from water.
Discussion: Evaluation
1. Compare the results with other groups in your class. Determine how much variation was found in the results.
2. Identify the method that was the most reliable for separating out a contaminant based on the response in the previous question.
3. Discuss whether these three methods clean the water enough for it to be consumed by humans.
4. Propose any changes that could be made to the method to improve the quality of the data in future experiments.
5. Optional: place a drop of the contaminated water under a microscope and observe. Review the answer to Question 3.
Conclusion
1. Copy and complete this statement in your science book. From this activity it can be claimed that _____________. This is supported by the observations that _____________. Therefore, the hypothesis is/is not supported by these findings.
Figure 5.24 How to fold the filter paper
Retort stand
Bosshead clamp
Clamp
Filter funnel
Filter paper
Beaker
Figure 5.25 Experimental set-up
Quick check 5.6
1. Identify the correct words from the following sentences to answer questions a) and b). Copy and complete the sentences in questions c), d) and e) by selecting the correct term for each. A small amount of sand was mixed with ocean water. This heterogeneous mixture was passed through a filter paper and the filtrate and residue were collected.
a) What will remain in the filter paper?
SAMPLEPAGES
Go online to access the interactive section review and more!
b) What will pass through the filter paper?
c) The filtrate is the ___________.
d) The residue is the ___________.
e) The residue is found in the ___________.
2. Copy and complete the following sentence.
A filter funnel can separate two substances in a mixture when those two substances have different ___________ and ____________.
the Victorian desalination Plant
In 2012, the Victorian Desalination Project in Wonthaggi was completed by a company called Aquasure. The desalination plant took three years to build and involves several filtration steps. The plant provides a source of water that is unaffected by times of drought or flooding and has been filtered over several steps of purification. After seawater has been drawn in through an underground pipe, the water is first filtered to remove any sand and other solid substances. The second filtration technique, called reverse osmosis, then starts. This is where the filtered seawater is forced through an ultra-fine membrane that contains extremely small pores, which only let water particles through. The salt particles are too large to pass through and so are returned to the ocean as a concentrate, and fresh water continues in the process to be treated and then distributed.
Unfortunately, the salt concentrate (brine) from desalination plants that is released into the ocean can cause serious environmental consequences for marine ecosystems, because it reduces the oxygen content of the returned water. In addition, the process has high energy costs and marine organisms can get trapped in the pump systems that draw in the water.
We will explore desalination plants in more detail in Chapter 6.
Section 5.3 review
Section 5.3 questions
Remembering
1. Identify which of the following cannot be separated using a centrifuge: components of blood, water on lettuce leaves, cream from milk, salt from seawater.
Science as a human endeavour 5.1
Water outlet for seawater concentrate Seawater intake
Figure 5.26 The desalination process
Understanding
2. Describe how centrifugation separates the substances in a mixture.
3. Explain why filtering does not always separate a mixture.
Applying
4. Explain why dissolved sugar cannot be filtered from water. Use the terms you have learned earlier in this chapter in your response.
5. Distinguish between the different ways of separating mixtures by density.
SAMPLEPAGES
Analysing
6. Describe the separation technique of hand-picking used by Aboriginal and Torres Strait Islander Peoples to sort various food items. Comment on whether this technique could be used to separate a bin full of recycling material.
7. Explain why filtering water does not guarantee that the water is pure.
Evaluating
8. Wearing a face mask became more common in the community after the COVID-19 pandemic. Suggest why an N95 mask (like the one shown in Figure 5.27) is preferred over cloth masks for protecting against viruses.
9. The filters in Figure 5.28 are used in the home or in everyday situations.
a) For each, determine the:
• components of the mixture
• residue
• filtrate.
b) Each of the filters has a different mixture to separate. Discuss how the different-sized and different-shaped holes of the filters can affect the separation of the mixtures.
Figure 5.27 An N95 face mask
Figure 5.28 Filters used for a variety of purposes. Can you think of any other common filters used in your daily life?
chromatography a technique to separate substances based on their different solubilities in a solvent
5.4 Separation of homogeneous mixtures
Learning goals
At the end of this section, I will be able to:
SAMPLEPAGES
1. Describe the use of chromatography for separating mixtures based on their solubility.
2. Distinguish between the use of evaporation, crystallisation and distillation when separating mixtures based on their boiling point and volatility.
Homogeneous mixtures are generally more challenging to separate than heterogeneous mixtures because they contain particles that are too small to be seen with the naked eye. The physical properties of a homogeneous mixture appear uniform, and so the separation of the components of the mixture relies on each substance having unique properties, such as solubility, boiling point and volatility. Separation methods such as chromatography, evaporation, crystallisation and distillation can separate the components of some homogeneous mixtures.
separation based on solubility
Chromatography
Chromatography is a technique used to separate the substances in a mixture based on their solubility, which is their ability to dissolve in a solvent (and also their attraction to a solid material such as paper). Figure 5.29 shows the common set-up for carrying out paper chromatography. In this example, the coloured components that make up a vegetable stock are being separated. The mixture (vegetable stock) is made to move by a solvent (in this case water) through another substance that stays still (in this case paper), until the components separate. The more soluble the components of the vegetable stock are in the solvent, the more quickly they will move up the filter paper with the solvent. The 'mobile phase' is the name given to the solvent moving with the soluble parts of the mixture in it.
The substance that stays still is called the 'stationary phase'.
Chromatography is often used in industry, and is probably not something you commonly hear about. These are some examples of its use.
• In forensics, chromatography allows you to analyse and separate the components of ink in pens to catch the forger or the writer of a ransom note.
• In toxicology, gas chromatography is used to separate the components of a poison so that it can be identified and neutralised.
• In pharmacology, chromatography allows the testing of the purity of medicines and drugs.
• In fashion, chromatography helps break down the different components of the dyes in clothing.
• In sport, gas chromatography is used to check whether the sportsperson has been using prohibited substances.
Figure 5.29 Paper chromatography can be used to separate vegetable pigments. The yellow component is most soluble in the solvent, and the orange is the least soluble.
VIDEO Paper chromatography of inks
VIDEO Paper chromatography of food colourings
separating the pigments in water-soluble colour marker pens
Aim
To separate the pigments in water-soluble marker pen ink using chromatography.
Materials
• water
• large beaker
• long strips of filter paper
• wooden skewer
• stapler and staples
• ruler
• water-soluble colour marker pens × 3
Method
1. Use a pencil to draw a line across each filter paper strip 1.5 cm from the bottom. Label the wooden skewer A, B and C – one position for each of three strips of filter paper.
2. Add enough water to the beaker so that the filter paper will be able to touch the water but the pencil lines will remain above the water line.
3. Using the water-soluble colour marker pen, draw a small dot on the filter paper in the middle of your pencil line.
4. Fold the paper strip over the wooden skewer, as shown, and staple it on.
5. Repeat steps 3–4, this time using different coloured marker pens.
SAMPLEPAGES
6. Lower the three samples into the water in the beaker, making sure the ink spot is above the water and the end of the paper stays in the water.
7. Leave the strips for about 10 to 20 minutes after placing them into the water.
8. Remove the paper strips (called chromatograms) from the beaker when the water has reached approximately 2 cm from the top of the paper and leave them somewhere safe to dry.
Results
Stick your dried chromatograms into your science book (or take a photo and upload it to your practical report file).
Discussion: Analysis
1. The chromatogram formed is unique for each type of pigment. Discuss what you found out about the different pigments in the ink of the different coloured pens.
Discussion: Evaluation
1. Identify possible sources of error when using this separation technique.
2. Discuss how you could minimise the impact of these sources of error in the future.
Conclusion
1. Copy and complete this statement in your science book. From this activity it can be claimed that pen ink ___________. This is supported through observations that ___________. Therefore, it can be concluded that ___________.
Water (mobile phase)
Filter paper strips with ink sample (stationary phase)
Wooden skewer
AB C
Figure 5.30 Experimental set-up
volatility how easily a liquid evaporates; a volatile liquid has a low boiling point evaporation when heat causes liquid to become gas; also known as vaporisation
Making thinking visible 5.2
Connect, extend, challenge: High performance liquid chromatography (HPLC)
The pharmaceutical industry is responsible for creating and producing novel (new) medicines to combat disease. When new chemical substances are created, impurities are common, and HPLC is commonly used to separate the unwanted materials from those that are needed. This method uses the same principle of separation based on solubility of components as is used in paper chromatography. However, instead of paper, the stationary phase is a densely packed column under a high pressure of liquid. HPLC allows pharmaceutical scientists to purify important chemical substances so they can be used in new medicines.
Consider what you have just read and then ask yourself:
• How are the ideas and information connected to what you already know about chromatography?
• What new ideas did you learn that broadened your thinking or extended it in different directions?
• What challenges or puzzles emerge for you now?
SAMPLEPAGES
The Connect, extend, challenge thinking routine was developed by Project Zero, a research centre at the Harvard Graduate School of Education.
separation based on boiling point and volatility
You probably already know that boiling point is the temperature at which a liquid vaporises into a gas. Volatility is how easily a liquid evaporates. The more volatile a liquid is, the lower its boiling point. An example you may be familiar with is perfumes – they are quite volatile substances because they evaporate at room temperature.
Evaporation
Recall from the previous chapter that evaporation is a change in state from a liquid to a gas, but it can also be used as a separation technique. Evaporation can be used to separate a dissolved substance (solute) from its solvent in a solution by heating the mixture up so the liquid part turns into gas. For example, the water in salt water will evaporate when heated, leaving behind salt crystals – the water and the salt have been separated by evaporation. Another example is drying wet washing in the sun on the clothesline.
Figure 5.31 A densely packed HPLC column
Gauze
Tripod
Bunsen burner
Heatproof mat
Beaker containing salt water
Figure 5.32 In a laboratory, a Bunsen burner can be used to heat a solution of salt water to separate the water from the salt.
Did you know? 5.4
Watercolour painting
You might remember using watercolour paints during art class at some stage in your schooling. These paints are mixtures containing a watersoluble colour pigment and binding agent as well as a water-based solvent. When you paint with watercolour paints, the artwork can become quite wet with water. However, the water is soon separated from the painting mixture by evaporation, leaving behind a dried piece of art.
Crystallisation
SAMPLEPAGES
When evaporation of a solvent occurs slowly, the solute can often form a crystalline solid in the evaporating solution. This is called crystallisation Once formed, the solid crystals can be filtered or hand-picked from the remaining solvent. The crystal begins to form as the concentration of solute increases while the solvent is slowly evaporating. Eventually the solution becomes saturated and, as the solvent continues to evaporate, the solute can no longer remain dissolved. Every chemical substance has a unique shape, colour and size, and these can be stunning to look at!
1. Select the correct term from the list to copy and complete the sentences: filter, pigments, solvent, water.
Chromatography is a technique for separating the components of a mixture, such as different ___________ in ink or in a leaf. Samples of different mixtures are put on a piece of ___________ paper, and the paper is put into a solvent. If the mixture dissolves in water, then ___________ can be used for the solvent. If the mixture does not dissolve in water, then a different ___________, such as methylated spirits, must be used.
2. Organise the following statements by numbering them to indicate the order in which they occur in the process of paper chromatography. Place your sample in the centre of the pencil line. Place a small volume of water into a beaker (about 1 cm deep). Make sure the sample dot does not go below the surface of the liquid in your beaker.
Leave for 20 minutes until the solvent reaches the top of the filter paper. Draw a line using a pencil across a filter strip 1 cm from the bottom. Fold the paper strips over the icy-pole stick, clip them and lower them into the water in the beaker.
3. Define the key terms 'evaporation' and 'crystallisation'.
4. Develop a method that would allow you to separate salty water and ground pepper (which can float) when they are mixed up together. Include the concepts of 'evaporation' and 'crystallisation' in your explanation.
Figure 5.33 A watercolour painting
crystallisation the process through which certain solutes form a crystalline solid when a solvent evaporates slowly
Figure 5.34 Salt crystals can form by the slow evaporation of water from a crystallisation pond.
Quick check 5.7
Investigation 5.2
using evaporation to separate mixtures
Aim
To determine the mass of salt contained in 100 ml of a concentrated salt solution.
Materials
• concentrated salt water
• 100 mL measuring cylinder
• 250 mL beaker
• Bunsen burner
• tripod
• matches
• heatproof mat
• gauze
• electronic balance
Method
1. Copy the results table into your science book.
Be careful
Observe general fire safety.
Wear personal protective equipment (PPE).
SAMPLEPAGES
2. Weigh the beaker using the balance. Record the mass in the table.
3. Measure 100 mL of concentrated salt water into the beaker.
4. Set up the tripod and gauze over the Bunsen burner.
5. Place the beaker on the gauze.
6. Light the Bunsen burner following the method in Practical 1.3 in Chapter 1.
7. Allow the mixture to boil until there is 25 mL of water left in the beaker.
8. Turn off the gas.
9. Leave the beaker on the tripod to cool.
10. When cool, pack up the equipment and leave the beaker in a warm place to allow the remainder of the liquid to evaporate for a few days.
Next lesson
11. Weigh the beaker and record the mass.
12. Calculate the change in mass.
Figure 5.35 Experimental set up with salt solution boiling.
Results
Table showing mass in grams at different stages of the experiment
Mass (grams)
Group result
Empty beaker
Beaker + salt
Salt
Discussion: Analysis
Class mean
SAMPLEPAGES
1. Draw a labelled diagram that clearly shows how to set up the equipment for this separation method.
• Follow the rules for drawing scientifically (see Chapter 1 for a reminder).
• Use a sharp pencil.
Peer review
1. Swap experimental diagrams with another group and give each other feedback on how clearly the diagram communicates how to set up the separation method. Your feedback should discuss the following:
• how well the diagram follows the rules for scientific drawing
• any other suggestions to improve the quality of communication.
2. After receiving feedback, make alterations to the diagram to address the identified issues and write up a final copy to present to the class.
Discussion: Evaluation
1. Compare your result with the actual mass of salt that was dissolved in the water (your teacher has this information).
2. Compare your result with those of other groups. How much variation was observed between the final results for the mass of the salt?
3. Calculate a class mean for the mass of salt that was dissolved in 100 mL of water.
4. Determine whether a reliable conclusion could have been drawn about the mass of salt per 100 mL based on the mean class results.
5. Most natural water sources contain a variety of dissolved salts. Discuss how this would affect the validity of the conclusion drawn about the mass of salt that was dissolved into the water to make the test solution.
6. Propose changes to the method to improve the quality of the data in future experiments.
Conclusion
1. Copy and complete this statement in your science book. From this activity it can be claimed that _____________. This is supported by the observations that _____________.
distillation a technique to separate substances in a liquid using evaporation through boiling and condensation distillate the condensed liquid product from distillation
Distillation
During the evaporation method of separation, the solvent is evaporated and disappears. But what if you want to collect the evaporating solvent? This can be done through distillation. This technique uses the difference in boiling points of the substances in the mixture to separate them based on their volatility. To begin, a solution of two soluble liquids or a solution containing a solid solute is heated in a flask (see Figure 5.36). As the mixture is heated, the most volatile component vaporises first, becoming a gas. The gas is then collected in a Liebig condenser, which is cooled by surrounding cold water, and the gas condenses back to the liquid state. The solute remains in the flask, while the solvent has evaporated and been caught in a beaker as it condenses at the end. This is called the distillate. All components of the mixture have been separated and retained.
SAMPLEPAGES
Figure 5.37 Essential oils can be distilled from plant matter, such as rose oil from rose petals.
Thermometer
Tap water out
Cool tap water in Distillate
Beaker
Liebig condenser
Tripod Flame
Salt solution Flask
Water jacket Gauze
Heatproof mat
Figure 5.36 A Liebig condenser is used for the process of simple distillation. VIDEO Distillation
Practical 5.4: Teacher demonstration
distillation
Aim
To observe the process of distillation.
Materials
• water
• copper sulfate (or table salt)
• 250 mL beakers × 2
• Bunsen burner
• distillation apparatus
• spatula
• tripod
• safety glasses
Method
Be careful
Apparatus can become extremely hot during the experiment. Ensure water pressure is slowly increased so that internal stress is not introduced to the condenser.
SAMPLEPAGES
1. Set up the equipment for distillation as shown in Figure 5.36.
2. Wear safety glasses.
3. Put 100 mL of water into one of the beakers. (The other one will collect the distilled water.)
4. Use the spatula to add copper sulfate and stir.
5. Continue adding copper sulfate until the solution is very concentrated but not saturated. Pour the concentrated copper sulfate solution into the round-bottomed flask of the distillation apparatus.
6. Turn on the water that circulates in the condenser.
7. Heat the copper sulfate solution.
Results
Describe your observations of this process. How did the original solution look? What substance was left behind in the round-bottomed flask?
Discussion: Analysis
1. Why was it necessary to heat the copper sulfate solution?
2. Explain how the condenser works.
3. Which part is the distillate?
Discussion: Evaluation
1. What were possible sources of error when using this separation technique?
2. How could you minimise the impact of these sources of error in the future?
Purifying mixtures without using heat
Scientists and engineers are trying to find ways of purifying mixtures without using heat. If they could achieve this, it would reduce energy use around the world and, consequently, lower dangerous emissions and pollution. Distillation and other separation techniques that use heat account for 10–15 per cent of the world's energy consumption. Alternatives such as the separation techniques covered in this chapter are very expensive to do on such a large scale. Currently, crude oil is removed from the ground and its components are separated by fractional distillation. When crude oil is heated, petrol is one of the first gases that forms, because it is more volatile due to its low boiling point when compared to other liquids in the mixture. Engineers in industry are developing other ways to separate the components of crude oil when there are many groups of particles in the mixture.
SAMPLEPAGES
Heated
Bottled
Petrol
Figure 5.38 Fractional distillation of crude oil
Explore! 5.4
essential oils
The formation of essential oils and perfume relies on the separation technique of distillation.
1. Describe the process of distillation with reference to the creation of essential oils and perfume.
2. Compare the distillation process used to make essential oils and perfume to the one used in your classroom.
SAMPLEPAGES
3. Summarise how and why three other industries use distillation.
4. Explore the differences between contemporary distillation and the steam distillation process used by Aboriginal and Torres Strait Islander Peoples for medicinal purposes.
think about your future
Whichever career you may be interested in, separation techniques will be a part of your world! Consider some of the industries and careers that you have come across in this chapter alone.
Fashion industryGeology Water treatmentEngineering
Pathology Refineries Agriculture Culinary industry
Archaeology Mining Beverage industrySports industry
Recycling Desalination plantsCrude oil processingEnvironmental work
Dairy industryDentistry Perfume industryBotany
Figure 5.39 To bottle lavender essential oil, it must first be distilled from the lavender plant.
Investigation 5.3: Self-design
Creating the ultimate separation
Aim
To separate a mixture of sand, salt, iron filings and sawdust.
Materials
• mixture: 1 tablespoon of salt, 1 tablespoon of sand, 1 teaspoon of iron filings, handful of sawdust
• other materials: you will have access to standard laboratory equipment; however, as part of your planning you will need to book your materials with your teacher.
Method
1. Design a method for separating a mixture of sand, salt, sawdust and iron filings. At the end of this task, you should have each of the four components separate from each other.
2. Consider each component of your mixture by answering the following questions. Draw up a table to record your responses.
• Can it be hand-picked?
• Is it magnetic?
• Is it large enough to be captured by a sieve?
• Will it fit through the holes in filter paper?
• Does it float?
• Does it have a high density and so will sink?
• Is it soluble in water?
3. Write up your method in numbered steps showing enough detail for someone in another Year 7 class to repeat it with ease. You must include instructions for each of the separation techniques you use. Tips:
• It may help to plan your method using a flowchart.
• Remember to include the specifics, such as the amount of water you will add.
• Think about which technique will need to be carried out first, second, etc.
• Include diagrams for each separation technique you use.
4. Make a list of the materials you require and show your teacher your method. If your method is approved, book in your equipment. Please ensure that you discuss any risks with your teacher and how they can be prevented. This is called a risk assessment.
5. Carry out your separation safely and record your observations of each step.
Results
Design a table that will allow you to record your observations each time you complete one separation. Remember to include a title for your table.
Discussion: Analysis
1. Explain how each component was separated from the mixture. Use words you have learned in Science, such as density, solubility, solution, flotation, magnetism, filtering, residue, filtrate, decanting, dissolve, evaporate.
2. Describe how your method for separating the mixture is like a machine.
Discussion: Evaluation
SAMPLEPAGES
1. Speak to your classmates about how they separated the mixture. Did you all do the same thing? Is it okay that you all did something different? Consider your aim when you answer these questions.
2. What modifications would you make to your design/method if you were to repeat this task?
3. Suggest why it is important to understand the different separation techniques and how they can be used in the real world.
Conclusion
1. Copy and complete this statement in your science book. From this activity it can be claimed that ____________. This is supported by the observations that ___________.
Section 5.4 review
Section 5.4 questions
Remembering
1. Label the parts (A–G) of the Liebig condenser and other equipment indicated in Figure 5.40.
2. Define the terms 'distillation' and 'evaporation'.
Understanding
3. Describe the similarities and differences between distillation and evaporation.
Applying
4. Explain what happens to particles during the process of evaporation and the process of condensation. Draw pictures of the particles to help in your explanation.
Analysing
5. Compare the separation techniques of evaporation and crystallisation.
Evaluating
6. a) Label the diagram in Figure 5.41 (A–C).
b) Explain what is meant by 'mobile phase' and 'stationary phase'.
c) List the colours in order from least to most soluble in the solvent.
d) Describe why the bottom line should be drawn in pencil and not in pen.
7. Substances X, Y, Z, W and sugar have been mixed in water. The properties of each substance are listed in the table.
SAMPLEPAGES
Determine the steps you would use to separate the mixture.
Figure 5.41 Chromatograph
Figure 5.40 Liebig condenser and other equipment
Go online to access the interactive chapter review!
Chapter review
Chapter checklist
Success criteria Linked questions
5.1I can identify the difference between pure substances and mixtures.9
5.1I can classify a mixture as one of the four types based on their observable properties. 13, 15, 16
5.1I can distinguish between homogeneous and heterogeneous mixtures based on their properties. 2, 19, 20
5.2I can define solutions, solvents and solutes. 1, 8
5.2I can distinguish between soluble and insoluble substances. 17, 21, 23
5.2I can compare a dilute, concentrated and saturated solution. 18
5.3I can describe how magnetism can be used to separate a mixture.7, 10, 14
5.3I can distinguish between techniques that use density to separate mixtures, such as decantation, flotation and centrifugation. 6, 10, 14, 22, 26
5.3I can describe how filtration can be used to separate mixtures based on particle size and solubility. 5, 7, 10, 14, 26
5.3I can outline different separation techniques used by Aboriginal and Torres Strait Islander Peoples. 12, 24
5.4I can describe the use of chromatography for separating mixtures based on their solubility. 3, 7, 10, 14, 23
5.4I can distinguish between the use of evaporation, crystallisation and distillation when separating mixtures based on their boiling point and volatility. 4, 6, 7, 10, 11, 14, 18, 22, 25
SAMPLEPAGES
Review questions
Remembering
1. Define the following key words. a) Solvent b) Solute c) Solution
2. Recall a real-world example of a homogeneous mixture and a heterogeneous mixture.
3. Recall the name of the piece of paper at the end of a chromatography experiment.
4. Select words from this list to complete the following paragraph. boiling points
Distillation is a method used to separate _______ according to their ______. The liquid is ______ at a certain temperature, the vapour collected and then _______ to form a liquid again. The liquid collected during this process is called the ________. The residue is the mixture that remains in the original container.
5. Select words from this list to complete the following paragraph (some words may be used more than once). filter
filtrate
funnel
large
residue
small
The apparatus used to separate sand from a salt solution consists of ______ paper inserted in a glass ______. The mixture of the salt solution and sand is poured into the ______. The _______ paper acts as a sieve, separating the particles by size. ______ particles flow through the tiny holes of the filter paper and go into the beaker. These particles are called the ______. The ______ particles become trapped in the filter paper and are called the _______.
Understanding
6. Identify industries that use the following separation techniques:
a) distillation
b) filtration
c) centrifugation
d) evaporation.
7. Identify which method of separation (A–E) you would use to perform the separations (1–5).
A. Evaporation
B. Filtration
C. Chromatography
D. Distillation
E. Magnetism
SAMPLEPAGES
1. Separation based on magnetic properties
2. Separation based on heating liquid
3. Separation based on evaporation and condensation
4. Separation based on size
5. Separation based on solubility
8. a) You decide to make toffee by dissolving sugar in water. State which would be faster: using big sugar cubes or using regular sugar crystals.
b) Recall what else you can do to make the sugar dissolve faster.
9. Identify which of the following substances is a mixture: smog, distilled water, oxygen gas, pure gold.
Applying
10. Describe how each of the following separation techniques works. Give an example of each technique from your home where possible.
Method of separationDescription of how it worksExample from home
Decanting
Flocculation
Evaporation
Filtration
Crystallisation
Distillation
Magnetism
Centrifugation
Chromatography
11. Provide an example of a mixture you would separate using evaporation. Explain why no other method would work better.
12. Describe three techniques used by Aboriginal and Torres Strait Islander Peoples to separate mixtures.
13. Distinguish between:
a) a colloid and a suspension
b) a suspension and a solution.
14. Describe how the following mixtures could be separated into their components.
a) copper sulfate from copper sulfate solution?
b) water from clothes?
c) peas out of a mixture of peas and water?
d) oil out of a mixture of water and oil?
e) sand from a mixture of sand and keys?
f ) red dye from blue dye?
15. a) An emulsion is a type of mixture that is formed when two or more liquids in a colloid are spread evenly through one another. Provide an example of an emulsion and explain how it is different from a suspension.
b) Peanut butter and satay sauce often contain similar ingredients. However, satay sauce needs to be stirred before use, while peanut butter remains uniform in texture. Provide an inference about these two mixtures, based on this observation.
Analysing
16. Organise the colloid names (A–E) so that each colloid is correctly matched to the states of matter that make it up (1–5).
A. Hair gel 1. A gas in a liquid
B. Mist 2. A liquid in a solid
C. Smoke 3. A liquid in a gas
D. Foam 4. A solid in a gas
E. Emulsion 5. A liquid in a liquid
17. Lottie was testing the solubility of some household substances. Some details of what she found out are shown in the table.
Substance Quantity (grams) that dissolved in a 100 mL glass of water
SAMPLEPAGES
a) Determine which substance Lottie found to be the most soluble.
b) Identify which substance was the least soluble.
18. Lottie then looked at two glasses of salt solution she had on the bench at home. She thought one was a saturated solution and one was not, but could not remember which was which. She put a crystal of salt in each glass and left them overnight. What she saw in the morning is shown in Figure 5.42.
a) Determine which glass contained the saturated solution.
b) Justify your response to part a.
Figure 5.42 The crystal in glass A has disappeared, while the crystal in glass B has grown.
19. Some liquid antibiotics should be shaken in the bottle before you use them. Explain why this may be required, using terms you have learned in this chapter.
Evaluating
20. a) Draw and label a diagram of a heterogeneous mixture, showing how the particles are distributed.
b) Draw and label a diagram of a homogeneous mixture, showing how the particles are distributed.
21. Explain why soluble nutrients can be absorbed by the roots of plants through microscopic holes, but insoluble nutrients cannot.
22. Explore how you could separate:
a) a liquid from a liquid
b) a solid from a liquid
c) a solid from a solid.
23. You have been doing a graphic design course and have created an awesome poster. However, you have forgotten which ink pen you used to create the main heading.
Figure 5.43 shows the results of a chromatography experiment you carried out to identify the ink. Five inks were compared: A, B, C, D and E.
AB CD E
Figure 5.43 Chromatogram of your results
a) You know your ink is just one colour. Identify which ink sample is a mixture of colours.
b) Determine which two inks are the same.
c) Given that your ink is not soluble in water, identify which ink sample is yours.
24. Sieving is a useful separation technique for varying-sized solid particles. Describe how sieving could be used in a recycling centre, as well as how Aboriginal and Torres Strait Islander Peoples use sieving to purify food sources.
25. A mixture of pure water and ethanol was accidentally mixed with an unknown substance, X. Substance X is highly soluble in water and is very difficult to separate. Describe how the mixture can be separated to give pure water, ethanol and substance X. Below are the boiling points of the three liquids.
Substance dissolved in the mixtureBoiling point (°C)
SAMPLEPAGES
26. Propose the separation processes you would use to separate a mixture of pebbles, sand, salt and water. You may do so in a flow chart. Clearly show what was separated at each step.
Data questions
Recycling centres in Victoria separate mixtures of recyclable material on a very large scale. The relative mass of materials collected to be recycled in Victoria between July 2021 and April 2022 is shown in Figure 5.44.
SAMPLEPAGES
Applying Questions 1–4 refer to Figure 5.44.
1. At a Victorian recycling plant, a mixture containing each of the materials listed is sorted using separation techniques such as hand-picking and magnetic separation. Identify whether the mixture of recyclable materials is a homogeneous or heterogeneous mixture.
2. Determine which component of the materials collected for recycling accounts for the smallest mass.
3. Calculate the percentage of mass that is made up of glass.
Analysing
4. Sequence the components of the materials collected for recycling in order of decreasing relative mass.
Figure 5.44 Relative mass of materials collected to be recycled in Victoria between July 2021 and April 2022
The mass of glass materials collected for recycling in Victoria from 2009 to 2019 is shown in Figure 5.45.
Figure 5.45 Approximate mass of glass collected (solid orange) for recycling in Victoria from 2009 to 2019 (trendline dotted black)
Questions 5–9 refer to Figure 5.45.
5. Identify the trend in the mass of glass collected for recycling over the period 2009–2019.
6. Distinguish between the information provided by the orange line and the information provided by the black dotted line.
Evaluating
7. Predict how the trend in mass of glass collected for recycling will progress over the next 10 years.
8. Justify why the trend would progress in the way you have predicted in question 7.
9. Extrapolate the trendline to the year 2023. What mass of glass do you estimate was collected for recycling in that year?
steM activity: Diseases in water
background information
Waterborne diseases (diseases that spread through water) are caused by a variety of microorganisms and can lead to devastating illnesses. Outbreaks of waterborne diseases often occur after severe weather events such as droughts, floods and tsunamis. Because climate change increases the severity and frequency of some of these major weather events, communities –especially in the developing world –could be faced with more widespread outbreaks of diseases. The drinking of polluted water, poor sanitation and overcrowding in temporary settlements are all contributing factors to the spread of disease.
SAMPLEPAGES
can reproduce very quickly and so they must be removed immediately from water sources to prevent their spread.
Many types of engineers (e.g. civil, material, mechanical, environmental and chemical engineers) have roles in improving our existing water treatment systems and designing new ones to meet the ever-changing nature of our world. This will become more important as the need to build more greywater and blackwater recycling plants grows. The purification of water is not a straightforward or easy process, with so many different possible pollutants and diseases. Therefore, full water treatment generally includes multiple steps to cover as many bases as possible. These steps include sedimentation (a process in which small pieces of a solid material fall to the bottom of a liquid and form a layer), filtration and disinfection.
DESIGN BRIEF
Build a water filtration device using commonly available materials.
activity instructions
In this activity, you will be challenged to design and build a water filtration device using commonly available materials. To meet this challenge, you will take on the role of an engineer from the Super Dooper Clean Water Company and work through the engineering design model, which includes designing, building, testing and evaluating the performance of the filtration device. You will then use this information to work towards an improved water filtration design.
Figure 5.46 Outbreaks of waterborne diseases often occur after severe weather events.
Figure 5.47 Bacteria
You will need to begin by looking at:
• different types of common materials that can be used to filter polluted water
• the constraints that need to be considered before you design and build your prototype
• how you will determine whether your design is successful.
Suggested materials
• 'polluted' muddy water (supplied by your teacher)
SAMPLEPAGES
• 2 L plastic bottles with the bottoms cut off
• scissors
• paper towel
• squares of textiles, such as fine nylon or calico
• elastic bands
• spoons for stirring
• filtering materials; for example, coffee filters, filter paper, soil/sand/pebbles, activated charcoal, cotton wool balls
• measuring cups
• beakers or jars
Research and feasibility
1. Research and identify some common materials that can be used to filter polluted water.
2. List the constraints you will need to consider before you design and build your prototype for the polluted water to be filtered (size of the particles in the polluted water, sterilisation of microorganisms, testing the cleanliness of the water, etc.).
Design
3. List and describe the important design features required to filter polluted water.
4. Design your prototype filtration system, including labels for all key components.
Create
5. Construct your prototype filtration system.
6. Use your filtration system to filter the polluted water your teacher has given you.
7. Measure the volume of polluted water poured into your filtration system and the volume of cleaned water produced. What was the change? Calculate it as a percentage of the original volume.
Evaluate and modify
8. Explain the possible causes of any differences between the volume of water before and after filtration.
9. Evaluate the effectiveness of your prototype filtration system. Did your filter work as you expected it to? Did the different materials remove what you thought they would? Explain why or why not.
10. Consider the quality of your water. Do you think the filtered water is clean enough to drink? Is it clean enough to put into a river? Explain why or why not.
11. Reflect upon your design. What improvements would you make to your prototype filtration system? List some ideas for ways you might get the 'polluted' water even cleaner. Are there other materials you would like to use that could improve your design?
12. Draw your new and improved design.
13. What design constraints or limitations might be different for engineers developing real water filtration systems?
Chapter 6 Earth's resources
SAMPLEPAGES
Introduction
This chapter will help you understand the amazing resources that our Earth provides. Renewable and non-renewable resources will be investigated as well as how long they will last. You will learn about how the processes we use for resource extraction and energy production have wonderful benefits, but can also come with risks to sustainability.
Concept map
SAMPLEPAGES
AirWind power
Living
Hydroelectricity
Ocean waves and tidal energy
Towards a sustainable future
• Water management
• Mining
• Transport
Section 6.1
Section 6.2
Section 6.3
Curriculum content
the sustainable use of Earth's resources is influenced by whether the resources are renewable or non-renewable; the processes involved in resource extraction and energy production come with both benefits and risks to sustainability (VC2S8U09)
• considering what is meant by the term 'renewable' in relation to the Earth's resources6.1, 6.2
• considering timescales for regeneration of resources
• creating an infographic to illustrate the risks and benefits of different forms of energy production
• preparing a case study for the regeneration of an old mine
• examining how the use of desalination plants to produce fresh water has impacted marine ecosystems at desalination plant sites
• examining how the development of hybrid and solar, electric and hydrogen-powered vehicles are applications of contemporary science responses to the depletion of fossil fuels and the exploration of environmental considerations
scientific knowledge, including models and theories, can change because of new evidence (VC2S8H01)
• investigating how advances in deep Earth imaging techniques have enabled identification of mineral, energy and water resources beneath surface sedimentary rock
Geothermal
6.1 Renewable resources
Learning goals
At the end of this section, I will be able to:
1. Define the terms 'renewable' and 'non-renewable' resources.
2. Describe some examples of renewable sources of energy, including their advantages and disadvantages.
3. List the timescales for the regeneration of Earth's renewable resources.
Introduction to Earth's resources
Every year, you start school by bringing certain resources to your classes; for example, textbooks, laptop, sports gear, stationery and other things that will support your learning. So, when the word 'resources' is used, it means something that is useful. Now consider the major resources of Earth. We have six natural resources. They are water, air, living things, rocks (containing minerals and fossil fuels), soil, heat from the earth and energy from the Sun.
We call some of Earth's resources renewable. This means that the resource is replenished by natural processes within a human lifetime. There are variations in our planet's ability to replenish resources and the speed of their replenishment. Therefore, we must all keep a close eye on how much and how quickly all of our resources are used. For example, wood is used for building, for heating and for cooking. Trees can be replaced by planting and can reach maturity within 30 to 40 years, and so are called renewable. A non-renewable resource is a resource that cannot be replaced or takes a very long time to be replaced (i.e. much longer than a human lifetime). For example, some of the minerals buried deep in the earth have taken millions of years to form and so are called non-renewable.
SAMPLEPAGES
Figure 6.1 Identify the types of energy sources shown in the image. Are they renewable or non-renewable?
natural resource
a substance or energy source found on Earth that is used by people and has economic value
mineral the building blocks of rocks; each has a specific chemical structure that is the same throughout the entire mineral fossil fuel fuels, such as gas, coal and oil, that were formed underground from plant and animal remains millions of years ago renewable replenished by natural processes within a human lifetime non-renewable a resource that cannot be replaced or takes a very long time to be replaced (i.e. much longer than a human lifetime)
Left to right, top to bottom: coal (non-renewable), hydroelectricity from water (renewable), nuclear (non-renewable), wind (renewable), oil (non-renewable), solar or sun (renewable).
geothermal energy
heat energy from inside the Earth
biomass plant and animal material suitable for using as fuel
solar energy energy from the Sun used to produce electric power or to heat water
ocean energy energy harnessed from the movement of the ocean, such as waves and tides
hydroelectricity electricity produced by the force of fastmoving water
greenhouse gas a gas that causes heat to be trapped in the atmosphere
groundwater water that collects beneath Earth's surface
water cycle the way that water is taken up from the sea, rivers, lakes and soil, and then comes back down as rain, snow or hail
Quick check 6.1
1. Name six major natural resources on Earth.
2. Define the terms 'renewable' and 'non-renewable'.
3. For each of the following, decide whether the resource is renewable or non-renewable, and identify which of the major resources categories it fits into.
a) coal
d) solar energy
g) timber
j) natural gas
Renewable resources
b) wind energy
e) water
h) nuclear energy
k) minerals
Water, air, living things and energy from the Sun are all examples of renewable resources that we have plenty of in Australia. This means that these resources can also provide ongoing supplies of energy; for example, to power homes. Renewable forms of energy are geothermal energy (heat from Earth), fuel from biomass (living things), solar energy (energy from the Sun), ocean energy (energy from tides and waves), hydroelectricity (energy from the movement of stored water) and wind energy (see Figure 6.2). These forms of energy are termed 'cleaner' than non-renewable forms, as they usually do not produce as much greenhouse gas. You will find, as you move through this section, that the burning of biomass to create energy is the exception to this.
water
c) rice
f) sand
i) oil
SAMPLEPAGES
Water is a renewable resource, because it cycles through the environment many times within a human lifetime. Fresh water is an extremely important resource that living things (other than marine life) need for their survival. However, only about 3 per cent of all water on Earth is fresh water, and only one-third of this is available for land-based plants, animals, manufacturing, agriculture and the ecosystems in which we all live! The rest of the fresh water (2 per cent of all water) has a massively important role in regulating the temperature of our planet and is locked away in ice caps and glaciers (see Figure 6.3).
You probably know that Australia is one of the driest continents on Earth. So how do we get fresh water? Where does it keep coming from?
The answer is the water cycle.
Only about 1 per cent (33% of 3%) of the world's water is accessible
Figure 6.2 There are many types of renewable energy sources.
Figure 6.3
Did you know? 6.1
brimbank leading the way with renewable energy
Brimbank Council has won the energy efficiency achievement award in the 2023 Climate Awards for its new zero-emissions renewable energy aquatic centre. The Brimbank Aquatic and Wellness Centre contains the first all-solar, all-electric aquatic centre in Australia, cutting energy use by up to 80 per cent! Shifting away from traditional gas boilers used to adjust the temperature of the water and air at other aquatic centres, this centre uses rooftop solar panels, a renewable energy source, to make electricity. The solar panels generate power for the heat pump system to heat and cool the centre.
Energy from water: Hydroelectricity
Hydro (water) electricity is a clean source of energy, producing no greenhouse gases (apart from those used in construction of dams and power stations). You can see how a hydroelectric dam works in Figure 6.4. First, rivers are dammed to capture huge amounts of water. The dam holds water at a great height, increasing the pressure of the water due to the pull of gravity. The water trapped in the dam is then allowed to run through pipes at great speed (and force) to a power station lower down. This is where the water turns turbines that drive the generators to produce hydroelectricity.
Unlike other renewable sources, the water can be stored, which means electricity can be produced whenever it is needed. However, producing electricity in this way is limited to areas with large river systems and enough land space to build dams.
SAMPLEPAGES
Figure 6.4 Cross-section of a hydroelectric dam
Dam wall
Generators
Turbines
Figure 6.5 The spillway of the hydroelectric power station at Lake Eildon, Victoria
Energy from water: Ocean waves and tidal energy
There is so much coastline around Australia, it makes sense to harness the energy provided by the marine environment. There are several sources of ocean energy, including:
• wave energy – energy from waves (swells) converted into electricity
• tidal energy – movement of tides converted into electricity. One method of converting tidal energy into electricity is through tidal barrages (see Figure 6.6). Water enters a basin next to the barrage and builds up as the tide rises. The water is then released through gates (called sluice gates) after high tide, so that the water can flow through turbines, and this is what generates electricity.
SAMPLEPAGES
Making thinking visible 6.1
the Explanation game: oscillating water columns
In 2021, the UniWave200, a wave energy converter made by Melbourne company Wave Swell Energy, began generating power for Tasmania's King Island. It sat off the King Island coast and used an oscillating water column (OWC). This is much like an artificial blowhole, where air is sucked in and pushed out, turning a turbine, which produces electricity. The UniWave200 was funded for a year and was decommissioned late in 2022, but the project was highly successful even in just a short time, inspiring more research.
1. When you look at the image of a cross-section of the OWC, what do you notice? There are no right or wrong answers.
2. Why do you think it is designed that way?
The Explanation game thinking routine was developed by Project Zero, a research centre at the Harvard Graduate School of Education.
barrage a dam to generate electricity from tidal power
Figure 6.6 A tidal barrage, a kind of dam built across an estuary or coastal inlet to generate electricity by tidal power
Front wall
Water column
Sea bed
Incident waves
Air column Turbine
Back wall
Generator
Figure 6.7 A cross-section of an oscillating water column
Generating power from the ocean
Named after a Greek sea goddess, the CETO wave energy technology was invented by Australian businessman Alan Burns. CETO generates electricity from a large untapped renewable energy resource: ocean waves. The CETO technology incorporates a submerged buoy that sits a few metres below the surface of the ocean and moves with the ocean's waves. This orbital motion drives a rotary power take-off (PTO) system that converts this motion into electricity. This electricity is exported onshore by cables that can connect to the grid, microgrids or other energy-demand applications. The CETO technology is set to be deployed in Spain in 2025 incorporating new innovations, such as advanced control, and building on learnings from past deployments of CETO prototypes in Australia.
heat from the Earth
Energy from the Earth: Geothermal
SAMPLEPAGES
Geothermal energy is clean, reliable and renewable. It is naturally occurring heat from deep within the Earth. The deeper you go below the surface, the hotter it gets, and so you can find geothermal energy in granite rocks (often called 'hot rocks') or trapped in water (hydrothermal sources), 3–5 kilometres below the surface! The most common source of geothermal energy around the world is hot springs associated with volcanic activity.
Figure 6.8 The CETO 6 harnessing ocean energy
Turbine & generator
Cooling tower
Steam
Injection well
Hot water
Figure 6.9 In geothermal power stations, heat from the Earth's crust is used to heat water, which turns to steam, and this is then used to turn a turbine. The water is cooled and returned to the heat source.
In Victoria, geothermal energy exploration is at an early stage. Sufficiently high temperatures for geothermal electricity (around 150°C) have been detected in southern Victoria, but the cost of drill testing for flowing geothermal water is too high for investigations to continue at the moment. However, Victoria has numerous shallow, warm aquifers, which are used by tourists who like bathing in hot springs and for agricultural purposes that require warm water (e.g. barramundi farming).
SAMPLEPAGES
1. Recall why water is so important as a resource for all living things.
2. Explain why water is considered to be renewable.
3. Draw a flow chart to illustrate the steps involved in making electricity from the storage and flow of water.
4. Read the following statements and decide whether each is true or false.
a) Ocean energy from waves is used to make electricity.
b) Ocean energy depends on the gravitational pull of the Moon and the Sun, and Earth's rotation.
5. Recall the term that would complete each statement below about geothermal energy.
a) The energy is harnessed from ______________.
b) The process involves _________________.
The air is mostly made up of particles of nitrogen (78%) and oxygen (21%) with small amounts of other gases, including carbon dioxide. You may already know that plants and animals need oxygen to produce energy (this process is called cellular respiration), and carbon dioxide is used by plants in the special process of making sugars (this process is called photosynthesis). Nitrogen is also needed for survival, because it is an important component of proteins – living things need proteins to function and grow.
Figure 6.10 A geothermal power station
Quick check 6.2
Energy from air: Wind
Winds are caused by the uneven heating of Earth and the atmosphere by the Sun. This means that as long as there is a Sun, there will be wind. Like old-fashioned windmills, today's wind turbines harness the free energy of the wind to produce electrical energy. The wind pushes against the blades on top of the tower, making them spin. The blades are attached to a rotor and the rotor spins a generator to produce electricity. It might surprise you to know that Victoria's wind farms generated around 20 per cent of Victoria's electricity in 2022–23!
Large-scale wind farms are an amazing sight, and when connected to the electricity grid they can supplement the electricity supply of large towns and cities without producing any greenhouse gases. In fact, Australia's largest wind farm will soon be under construction in the Golden Plains Shire, just 60 kilometres north-west of Geelong. In December 2022, the Australian Government declared an area of the Bass Strait off Gippsland to be Australia's first offshore wind zone.
living things
SAMPLEPAGES
Living things are considered a renewable resource because they can reproduce, meaning they are continually being replaced. For example, timber is considered a renewable resource, because a tree chopped down can be replaced by another in about 30–40 years.
Energy from living things: Biomass
Biomass is the name given to any material derived from recently living plant and animal matter, as well as their waste. Plants convert the Sun's energy into a stored form of energy that can be used later, and if animals eat the plants they essentially consume the stored energy. There are several other ways in which the energy can be used:
• The breakdown of manure and food scraps produces methane gas, which releases energy when burned.
• Burning biomass, such as wood, releases energy that can be used for heating and cooking.
• The processing of biomass produces biofuels such as biodiesel, biogas and bioethanol, which can be used instead of traditional fossil fuels.
Figure 6.11 Wind farm in Portland, western Victoria. What do you think may be the downside of wind farms?
Figure 6.12 Wood pellets (a) and dry dung (b) are examples of biomass – fuel developed from organic materials.
Investigation 6.1
which plant produces more biomass?
Aim
To determine which type of plant produces the most biomass in 16 days.
Materials
Day 1
• wheat or rye seeds × 15
• corn seeds × 15
• oat seeds × 15
• potting mix
Be careful
Wear a dust mask and gloves when using potting mix.
SAMPLEPAGES
• milk containers or small seedling pots × 9 (3 per independent variable group)
• well-lit area to place seedlings or a natural light source to set up inside
• recommended: camera
• spray bottle with water
Day 16
• (new) milk containers or small seedling pots × 9
• bucket or sink with water
• paper towel
Day 20
• electronic scales
• identical takeaway containers (or similar) × 9
Method
Preparation
1. Identify the independent variable in this investigation.
2. Identify the dependent variable in this investigation.
3. Identify the controlled variables in this investigation.
4. Create a risk assessment table for this investigation.
Day 1
Group number:
Description:
Date:
Student name:
1. Prepare three containers to plant seeds. Label each container to identify the independent variable group number, description (the type of plant you will plant in it), date and student name.
2. Place moist soil in each container.
3. Carefully count out 15 seeds of one species of plant. Spread five seeds evenly across the soil in each of the three containers.
4. Plant the seeds at the depth specified on the seed packet.
5. Repeat steps 1–4 with 15 seeds of the two other species of plant, each in their own three containers (bringing the total number of containers used to nine).
6. Spray the soil to moisten it thoroughly, at least to the depth of the seeds.
7. Place all nine containers in similar conditions in an undisturbed area to grow. Set the containers up so they all receive similar temperature and air flow, and even amounts of light.
8. Continue to spray the soil daily to keep it moist.
9. Monitor each group for 14–16 days. Taking photographs of each container, including the label, is recommended.
10. If any part of the set-up is changed, then note the reason for this.
Day 16
11. Label three new takeaway containers for drying each species of plant (nine in total).
12. Remove the plants from the first container and carefully wash the roots in a bucket of water to remove any soil.
13. Dry the plants with a paper towel.
14. Repeat steps 11–13 with the other containers.
15. Place the takeway containers in the sun to dry out the plants.
Day 20
16. Copy the results table for collecting the raw data.
17. Identify and label the different types of variables in the table.
18. Weigh an empty takeaway container to subtract from each mass of dried plants plus container.
19. Weigh each of the nine takeaway containers of dried plants.
20. Record the mass in the table minus the mass of the takeway container.
Results
Table showing which type of plant produces the most biomass in 16 days
Independent variable
SAMPLEPAGES
Dependent variable
Group 1 ____________
Group 2 ____________
Group 3 ____________
1. Calculate the mean measurement for each independent variable group.
2. Calculate the range for each independent variable group on the table.
3. What type of graph would be best to represent the mean of each of the three groups to compare them? Make that type of graph and discuss your observations.
Discussion: Analysis
1. Decide which plant produced the greatest biomass.
2. Describe how much variation was observed between the measurements within each group.
Discussion: Evaluation
1. Describe how much the set-up or method was adjusted once the experiment was started.
2. Explain whether the controlled variables were managed properly to ensure they did not change and affect the measurements.
3. Discuss any other changes that could be made to the method to improve the quality of the data in future experiments.
4. Evaluate the method and write an improved version based on the answers to Question 2.
Conclusion
1. Copy and complete this statement in your science book. From this activity it can be claimed that _____________. This is supported by the observations that _____________.
Figure 6.13 Which plant produces the most biomass?
1. Recall what makes air a resource.
2. List some advantages and disadvantages of wind farms.
3. Explain why biomass is considered renewable.
4. Identify four examples of biomass that could be found at a garbage dump.
SAMPLEPAGES
the sun
The Sun is one of more than a billion stars in the Milky Way. Its energy is considered renewable, because it has enough nuclear fuel to keep shining for another 4.6 billion years! This is certainly good news because plants need sunlight to make sugars by photosynthesis, and we (and other organisms) need to eat the plants to sustain our bodies. Our planet also needs the Sun's energy to keep warm.
Energy from the Sun: Solar
You are probably very familiar with photovoltaic or solar cells, as there are many solar-powered toys, calculators and outdoor lights on the market. These all use solar cells to convert the Sun's energy into electricity. Solar cells are made up of silicon, the same substance that makes up sand, and have no mechanical parts to wear out. As of 2024, there are eight operational large-scale solar farms in Victoria, with another six given the green light to begin construction. There are not many large photovoltaic power plants around, due to their expense, and the limitation that they cannot produce electricity at night! Thankfully, solar power plants are becoming cheaper to construct and the Australian Government is investing in large-scale batteries so that we can store the energy produced during the day for use at night.
Energy from the Sun: Heat (solar thermal)
Solar thermal panels on rooftops (see Figure 6.14) are becoming more common for heating domestic water and swimming pools. These circulate water in flat panels or tubes where it is warmed by absorbing radiant heat (also known as infrared 'light'). The warmed water is then fed into the pool or stored in insulated tanks in or on the roof. There is also something called a solar thermal power plant. Unlike traditional solar, it uses an array of movable mirrors that reflect the Sun's energy
6.14 Photovoltaic solar panels and solar thermal panels on a rooftop. It is becoming increasingly common for houses to have both types of solar panels, to generate electricity and heat water, respectively.
Figure 6.15 This solar and thermal power plant in Carwarp, north-western Victoria, uses solar energy trapped by more than 1000 rotating mirrors to generate electricity.
photovoltaic able to produce electricity from light
Figure
Solar thermal panels
Photovoltaic solar panels
onto the top of a tower. The light heats up solar modules that can turn approximately a third of the sunlight into electricity (see Figure 6.15). It can do this because there is so much heat hitting the top of the tower that the modules need constant cooling. The steam produced from the heated water powers a generator that produces electricity. Although this form of energy generation is still in its infancy in Australia, it may become more important as the relative cost falls.
Quick check 6.4
1. Explain why we call the Sun's energy a resource.
2. Decide whether solar power is a reliable source of energy.
3. Outline how using solar energy affects the environment.
Explore! 6.1
Engineering as a career
Engineering is a career that helps make people's lives easier and safer by solving problems. Engineers are applied mathematicians, scientists, inventors, designers and builders. Depending on their area of engineering, they can construct tools, create vehicles, run simulations, manufacture chemical compounds and more.
1. Investigate and then summarise the role of a renewable energy engineer.
2. Make a list of some of the skills a renewable energy engineer would have.
SAMPLEPAGES
To investigate how different colours affect the absorption of heat on a solar shower.
Hypothesis
Copy and complete this sentence in your science book.
It is predicted that if the balloon is a ____________ colour, then more heat will be absorbed, and therefore it is a better solar collector.
Prior understanding
One simple solar collector that has been used by campers for a long time is the solar shower. This is a plastic bag with a shower hose attached. The bag is filled in the morning and left in the sun to heat the water during the day. The hot water can be used to shower at night. The design of the solar shower needs to allow the bag to efficiently absorb the radiant heat with as little waste as possible and retain the heat once absorbed.
which solar collector is the best? Aim
Practical 6.1
Figure 6.16 Some of the many roles of renewable energy engineers
Materials
• balloons of different colours × 4 (e.g. black, green, red and white) to act as solar collectors
• straws × 4
• ice cream containers × 4
• aluminium foil
Method
1. Identify the independent variable in this practical.
2. Identify the dependent variable in this practical.
3. Identify the controlled variables in this practical.
Follow these steps to make a solar collector.
• approximately 1.5 L of sand, soil or other packing material
• sticky tape
• a thermometer or data logging temperature sensor
• paper and pen or computer for the table entry
1. Copy out and label the results table to record your data.
2. Line each ice cream container with aluminium foil. Place it so that the shiny side is visible.
3. Fill the bottom of each container with packing material and make an indent in the middle to support the balloon.
4. Fill each balloon with about 200 mL of water. All four balloons must contain the same amount of water.
5. Place the balloons onto the packing material in the ice cream container.
6. Secure the opening of each balloon by taping the opening tightly around a straw, with the straw facing upwards.
7. Slide the thermometer into each full water balloon and record the initial temperature
8. Place the solar collectors on the ground in sunlight for the same amount of time for each collector. Leave them for 15–20 minutes.
9. Record the final temperature inside the collector when the time is up.
10. Calculate the change in temperature.
Results
Table showing the temperature change for different coloured balloons
Independent variable
Group 1 ______________
Group 2 ______________
Group 3 ______________
Group 4 ______________
Discussion: Analysis
1. Describe any trends or patterns in your results.
2. Organise the colours of the balloons from most effective to least effective at absorbing radiant heat. Use the data to justify your answer.
Discussion: Evaluation
1. Critique your management of the controlled variables. Were they managed properly to ensure they did not change and affect the measurements?
SAMPLEPAGES
2. Now that you know the best colour of solar collector, develop a new method that will allow you to investigate how the effectiveness of this colour can be improved. Perhaps resting the balloon on a reflective surface, or changing the size or shape of the balloon, could increase the effectiveness.
Conclusion
1. Copy and complete this statement in your science book. From this activity it can be claimed that __________. This is supported by the observations that __________. The hypothesis was supported/not supported by the findings of this experiment.
Section 6.1 review
Section 6.1 questions
Remembering
1. Read each statement and identify which renewable energy source is being described.
a) Water turns turbines to generate this type of renewable energy.
b) By drilling deep wells and pumping the heated underground water or steam to the surface, this energy can heat homes.
c) This type of energy depends on the gravitational pull of the Moon and the Sun.
d) This energy source includes wood, straw and manure.
e) This energy source involves using buoys connected to pumps to pressurise sea water, which is then used to spin turbines.
Understanding
Go
SAMPLEPAGES
2. Identify the missing information in the table regarding different renewable energy sources.
Type of energy
Solar
Wind
Applying
How it works
Water is collected in a dam. When released, the fast-flowing water is used to turn a turbine and generator, thus generating electricity.
It can be used in countries where there is volcanic activity.
3. Explain what prevents hydroelectricity from being used everywhere in Australia.
4. Deduce why solar energy is sometimes called 'green' energy.
5. State the main disadvantage of using solar energy.
Analysing
6. Summarise the advantages and disadvantages of a hydroelectric power station. You may do so in table format.
7. Turbines usually spin in one direction, but the turbines used to capture tidal energy move in two directions. Explain why this would need to be the case.
Evaluating
8. Discuss reasons why some people think forests can be classified as a renewable resource and others consider them to be a non-renewable resource.
Figure 6.17 Solar panels on the roof of the first solar-powered supermarket in Melbourne
Figure 6.18 Maroondah Dam in Victoria
nuclear energy the energy obtained from inside particles; two processes used to obtain nuclear energy are nuclear fission and nuclear fusion
6.2 Non-renewable resources
Learning goal
At the end of this section, I will be able to:
1. Describe some examples of non-renewable sources of energy, including their advantages and disadvantages.
Remember that non-renewable resources cannot be replaced easily and not within a human lifetime. Rocks, minerals and soil are all non-renewable resources. These are also a source of nonrenewable energy, such as fossil fuels and nuclear energy (see Figure 6.19).
SAMPLEPAGES
Figure 6.19 There are many types of non-renewable energy sources. The three sources shaded grey are fossil fuels.
Rocks and minerals
Rocks and minerals are all around us – we have them in our homes, in our gardens, at our schools and in our cities. Minerals are the building blocks of rocks and each has a specific chemical structure that is the same throughout the entire mineral. Rocks, on the other hand, are solid materials found in Earth's crust and are composed of different minerals that vary throughout the structure of the rock.
Many types of rock form over many thousands or even millions of years. Once they have been mined and used, they are considered a non-renewable resource because they are not replaced quickly.
The minerals contained in rocks are needed by living things. Many minerals are used to make our lives easier, such as bauxite, which is the main source of aluminium. The human body also needs different minerals for the elements they contain.
Energy from rocks and minerals: Fossil fuels
Rock layers also contain resources that are not minerals, such as coal, oil and natural gas (though these are counted as part of the mineral and mining industries). These resources are collectively known as fossil fuels and are a major source of energy. Unfortunately, they are non-renewable because the process of forming fossil fuels takes millions of years, and we are using them faster than they can be renewed.
Why do you think fossil fuels are called fossil fuels? The energy in fossil fuels originally came from the Sun. Plants use the Sun's energy to make sugars (by photosynthesis), and this energy in plants passes to the animals that eat them. Once the living things have died, over time the effects of pressure and temperature due to burial can change the plant and animal remains into fossil fuels. While fossil fuels are not mineralised fossils of prehistoric living things, they are resources that have been formed over millions of years from the burial of ancient dead organisms. To be specific, coal is formed from dead plant material, while oil and gas are formed from dead marine life. The burning of fossil fuels releases the energy for humans to use. Unfortunately, it also releases greenhouse gases into the atmosphere.
SAMPLEPAGES
Victoria has an estimated 430 billion tonnes of brown coal, and more than 80 per cent of this is located in the Gippsland Basin, off the south-eastern coast of Victoria. Once coal is removed from the ground, it is transported to a coal-fired power plant. Here the coal is crushed and burnt in a furnace. The energy released is used to heat water, turning it into hot steam, which is then used to turn turbines. The turbines drive generators, which produce electricity. The steam is then condensed (turned back into water) and recycled.
As with all energy sources, whether renewable or non-renewable, there are advantages and disadvantages in using coal. Advantages that people see with the use of coal are that it is abundant, it releases a lot of energy compared to its cost and it provides a steady amount of heat. The disadvantages are that it is dirty, it pollutes the air, and the mines destroy the landscape.
6.21 A coal-fired power station. The short wide towers are cooling or condensing towers; they are involved in recycling steam and they release water vapour. The tall narrow chimneys are connected to the furnace and release carbon dioxide and ash.
Figure 6.20 Coal is a fossil fuel formed from dead plant material.
Figure
Making thinking visible 6.2
Circle of viewpoints: the use of coal as an energy source in australia
Brainstorm a list of different perspectives that people may have about the use of coal as an energy source in Australia.
Choose one perspective to explore, using these sentence-starters:
• I am thinking of … [the topic] … from the viewpoint of … [the viewpoint you've chosen].
• I think … [describe the topic from your viewpoint. Be an actor – take on the character of your viewpoint].
• A question I have from this viewpoint is … [ask a question from this viewpoint].
The Circle of viewpoints thinking routine was developed by Project Zero, a research centre at the Harvard Graduate School of Education.
SAMPLEPAGES
using coal waste to create sustainable concrete!
The production of concrete, which is made by combining cement with sand and gravel, contributes to greenhouse gas emissions worldwide. This is because making cement takes super-high temperatures and a massive amount of energy. Scientists in the US have found a way to use a waste of the coal production process, called coal fly ash, as a substitute for cement, reducing energy use and greenhouse emissions. What a win for the environment!
But wait a minute … aren't we trying to phase out coal power plants? Maybe this is not a good solution for producing concrete. What do you think?
check 6.5
1. Define the terms 'rocks' and 'minerals'.
The other fossil fuels, oil and gas, are also important raw materials for manufacturing products. Every day, we use many things that are made from oil or gas. Look at Figure 6.22 and think about all the things you may have used today that rely on oil or gas.
Figure 6.22 We use oil and gas every day in many ways. Can you list the items you use regularly that are made from oil or gas?
2. Explain why rocks and minerals are considered to be non-renewable.
3. Name the three resources that collectively are called fossil fuels.
4. Summarise the steps involved in turning coal into electricity.
Investigation 6.2: Teacher demonstration
foul-smelling gas
Aim
To model the production of natural gas from organic material.
Materials
• 1 tablespoon of fresh or tinned fish
• 1 cup of chopped green leaves (e.g. lettuce or spinach)
• 1.5 L of pond water or water that has been sitting under pot plants
• sand and soil
Method
Be careful Dispose of all materials in a well-ventilated area.
SAMPLEPAGES
• 2 L clear plastic bottle
• large balloon × 1
• gaffer/duct tape
• funnel
• stirring rod
1. Use a funnel to pour about 2 cm of sand into the bottom of the plastic bottle.
2. Add alternating layers of fish, green leaves and sand, ending with sand on the top about three-quarters of the way up the bottle.
3. Place the stirring rod in the top of the bottle so it is touching the sand, and gently pour the pond water down it so as not to disturb the sand 'sandwich'.
4. Pre-stretch a balloon by blowing it up several times, then fit the uninflated balloon over the top of the neck of the bottle and tape it down so there are no gaps.
5. Label the bottle with a safety warning, as the bottle should not be opened under any circumstances during this activity.
6. Put the bottle beside a sunny window so that it will warm up. Watch the changes over several days, up to a week.
7. Write a prediction: what do you think you will observe in the bottle and what will you observe in the balloon?
Results
Record your observations of the changes in the bottle, and the changes in the balloon.
Discussion: Analysis
1. Explain the changes observed. If a gas was produced that inflated the balloon, research what gas it could be.
2. If a gas was produced, propose how the results of this experiment can be used to suggest alternative uses of garbage dumps. Identify somewhere in the world where this is already happening.
3. Considering the time you let this experiment run, explain why the contents of the bottle did not create oil or fossil fuels.
Discussion: Evaluation
1. Describe how you could improve this activity to better model the production of natural gas from organic material.
Figure 6.23 Experimental set-up
Energy from rocks and minerals: Nuclear
Figure 6.24 A nuclear power station. Note the distinctive shapes of the containment building (dome) and the cooling towers.
The energy released in a nuclear power station comes from the centre of the particles you learned about in Chapter 4. There are two methods of producing nuclear energy: fusion and fission. These are summarised in Table 6.1.
Nuclear fusion
Nuclear fission
Particles are fused together to form new particles. This fusion causes a large amount of energy to be released.
Particles are split to form new particles, which release a large amount of energy as a result.
Nuclear power stations use energy released from some radioactive metals, like uranium, to boil water (see Figure 6.24). This produces steam that drives the turbines, which then produce electricity. Type
The Sun
Nuclear power plants heat water and produce steam, which is used to run turbines and generators that generate electricity.
Table 6.1 Summary of the two types of nuclear energy: nuclear fusion and nuclear fission
Nuclear energy is not renewable, but it is potentially unlimited. Its main advantage is that it does not produce as much greenhouse gas as burning fossil fuels, but its disadvantages are serious. Nuclear power stations are very expensive to build, and there are safety concerns about radioactivity, toxic waste, security and the risk of explosions.
Explore! 6.2
SAMPLEPAGES
Going nuclear
Australia has almost one-third of the world's known uranium resources. There are three operating uranium mines in Australia: Ranger in Northern Territory, Olympic Dam in South Australia and Beverley with Four Mile in South Australia. Currently, all of Australia's uranium is exported to other countries. Uranium is the fuel used in a nuclear reactor to make nuclear power.
1. Research the environmental impact of both the extraction of the uranium and disposal of nuclear waste.
2. Explain the arguments for and against building a nuclear power station in Australia.
3. Organise a debate in your class about whether nuclear power is an energy option for Australia.
Quick check 6.6
1. Describe the two types of nuclear energy.
2. State the advantages and disadvantages of nuclear energy.
soil
Soil is made primarily from rocks. Rocks are worn down and broken up by the action of natural elements such as wind and rain (weathering). The weathering process forms small particles –clay, silt, sand or gravel – that are carried away from the source rock in a process called erosion. The particles mix with air, water and living things (such as worms, bacteria and fungi), along with their waste, dead and decaying parts, to form soil. Soil production occurs over very long periods – sometimes only a centimetre of depth forms every thousand years.
The many uses of soil make it a valuable resource. It is essential for our food and biomass production, it holds and filters water, it provides people with essential materials for building and construction, and it is home to many organisms.
Properties of soil
Aim
To investigate the properties of soil and suggest ways that soil can be used by living things.
Materials
• 1 teaspoon each of three soil samples: sample A, sample B, sample C
Method
1. Take a teaspoon of sample A soil and place it in the palm of your hand.
SAMPLEPAGES
2. Ask your partner to add water drop by drop until the soil is wet but with no excess water. Play with the mixture – roll it into a ball, a sausage, flat like a pancake and into a cube. Record your observations of the soil texture in the 'No excess water' columns of the results table.
3. Ask your partner to add two or three more drops of water to your sample. Repeat your explorations and record your observations in the 'Excess water' columns of the table.
4. Wash your hands after handling the soil.
5. Repeat steps 1–4 with the other soil samples.
Results
Table showing the texture of three samples of soil in two conditions Soil sample
Discussion: Analysis
1. Consider your findings. Summarise the characteristics of the three samples.
2. How would the properties of the samples deter mine what they can be used for? Record what could be some possible uses for the three samples. Remember, these uses can relate to plants, animals or people.
Conclusion
1. Copy and complete this statement in your science book. From this activity it is claimed that the properties of soil ___________. This is supported through observing ___________. This means that ___________.
Practical 6.2
Did you know? 6.2
Cultural burning is better for australian soils
Aboriginal and Torres Strait Islander people have understood the complex relationship between fire, soil and life for millennia. Since colonisation, problems like salinity, poor soil quality and erosion have escalated. One way it is hoped that this damage can be reversed is to use traditional land management strategies, such as cultural burning. For the soil, this is good news! Researchers in NSW have shown how cultural burning has a more pronounced effect on increasing soil moisture, reducing soil density (this improves soil structure) and increasing organic matter content (nutrients for plants), compared to prescribed burning or no burning at all.
SAMPLEPAGES
Quick check 6.7
1. Recall what soil is made up of.
2. Explain why soil is considered to be a non-renewable resource.
3. Describe the process of weathering.
4. Contrast the processes of erosion and weathering.
Figure 6.26 Here you can see the evidence of erosion – the formation of London Bridge along the Great Ocean Road in Victoria.
Figure 6.25 Selecting what areas to burn, when and how often, is part of Aboriginal and Torres Strait Islander Peoples' knowledge of the land.
Try this 6.1
Energy production infographic
Create an infographic using Canva, Adobe Acrobat or PowerPoint to illustrate the risks and benefits of the different forms of energy production covered in sections 6.1 and 6.2.
Figure 6.27 An infographic is a visual representation of information and/or data.
SAMPLEPAGES
Section 6.2 questions
Remembering
1. Rewrite the following table by selecting the correct definition for each term.
Term
Definition
MineralMade from eroded rock, living things and their wastes and remains SoilSolid materials found in Earth's crust, composed of different minerals RockA building block of which there are many types forming Earth, each with its own specific chemical structure
2. Name a non-renewable energy source that is not a fossil fuel.
3. For each resource, identify whether it is renewable or non-renewable. a) water b) crude oil c) gum trees d) sheep e) natural gas
Understanding
4. If crude oil and natural gas resources run out, identify three of our uses for crude oil and natural gas that will be affected.
5. List the advantages and disadvantages of using coal as an energy source.
Applyþing
6. Explain why coal, crude oil and natural gas are fossil fuels.
7. Explain why coal, crude oil and natural gas are considered non-renewable.
8. Describe how a hydroelectric power station is similar to a coal-fired one.
Analysing
9. Distinguish between a nuclear power station and a coal-fired power station and the way they work.
10. Explore why nuclear power stations are considered an alternative to coal-fired power stations in attempting to reduce greenhouse gases.
Evaluating
11. Justify why governments should learn from Aboriginal and Torres Strait Islander Peoples' ways of managing and maintaining natural resources. You may like to conduct some additional research to gain a better understanding of Aboriginal and Torres Strait Islander Peoples' connection to Country.
Section 6.2 review
sustainable using natural resources responsibly so they remain at the same level, in order to support present and future generations renewable energy credits (REC) certified proof that the energy being used from the grid is renewable
6.3 Towards a sustainable future
Learning goal
At the end of this section, I will be able to:
1. Suggest ways that water management, mining and transport can be made more sustainable.
Think about the natural resources you used today; for example, water in your shower, and copper and zinc in your phone or watch. Everything comes from natural resources! But as you may have noticed, many of these resources are being used faster than they are made. If we want to make sure our world can continue to support life in the same way it is now, despite our increasing world population, we need to consider how we can use our natural resources responsibly. This is what it means to be sustainable. We are going to look at how the processes involved in resource extraction (such as mining and desalination plants) and energy production (both renewable and non-renewable) come with benefits and risks to sustainability.
water management
Although water is a renewable resource, good management is essential to the future of life on this planet.
Desalination plants
Rapid population growth and urbanisation have increased the demand for water around the world. Desalination is increasingly being used to meet this demand. In Chapter 5 you learned about the role of desalination plants in separating mixtures (separating salt from seawater). But is desalination sustainable, when the process has an impact on the marine environment? Let's look at Victoria's Wonthaggi desalination plant as an example.
Concern 1: Energy
SAMPLEPAGES
Most forms of desalination use a lot of energy and may even increase greenhouse gas emissions. In Australia, many desalination plants aim to use 100 per cent renewable energy, but this is not always possible because many plants require direct, continuous and reliable power. Instead, the desalination plants may purchase what is known as renewable energy credits (also known as carbon credits) or RECs. Simply, an REC is produced when a renewable energy source generates a certain amount of electricity and delivers it to the grid. Let's say a solar power facility produces a lot of electricity and delivers it to the grid; the solar power facility has now earned credits that it can keep or sell. If the desalination plant buys those credits, it is buying the 'renewable' part of the electricity that was produced by the solar farm. The desalination plant can then say that the power it uses comes from a renewable source.
Figure 6.28 The Wonthaggi desalination plant in Victoria is surrounded by an ecological reserve where locals can relax, bike ride, bird watch and more.
Concern 2: Intake
During the intake process, when water from the ocean is pumped into pipes and transported to the desalination plant, marine life, such as fish and crabs, could get pumped in along with the water and die. The good news is that the future of desalination plant design includes slant intake wells. This means water is extracted from beneath the ocean floor, and sand can act as a filter to protect marine life (see Figure 6.29).
The Wonthaggi desalination plant may not have this new design, but during its design phase, extensive surveys of the marine environment were undertaken to ensure that the location of the necessary marine structures would not affect areas of high biodiversity. The surveys also investigated aspects such as the sensitivity of marine organisms to high salinity, the numbers of organisms reproducing in the area, and the vulnerability of the marine ecosystem. Consequently, Wonthaggi uses:
• inlets that are located approximately 800 metres from the shore, minimising the effect on marine flora and fauna
• intake (and outlet) tunnels that are 15–20 metres beneath the sand dunes and seabed
• protective grills on all water intake structures to prevent larger marine creatures entering
• a low-speed intake so that smaller creatures can freely swim in and around the pipe without being affected by the induced current.
SAMPLEPAGES
Concern 3: Discharge
Around 40 per cent of the water that goes through a reverse osmosis desalination plant, like the Wonthaggi plant, comes out as fresh drinking water. This pure fresh water is unsuitable to be used straight away as drinking water, so it undergoes some treatment before being combined with our water catchments. The remaining 60 per cent is known as brine and is pumped back into the ocean. The problem with brine is that it is a highly concentrated salt solution – it has a high level of salinity (higher than the ocean). This salinity could affect marine organisms in a number of ways (e.g. development of offspring and breeding).
Figure 6.29 Slant wells are drilled hundreds of metres below the ocean floor. The ocean water is drawn in underground through the sand, which minimises the impact on marine life.
Figure 6.30 The Wonthaggi desalination plant has intake and outlet tunnels that are a long way out from the coastline and deep under the seabed to minimise disruption to the marine environment.
The good news is that Wonthaggi has long outlet tunnels, so the returning salty water does not enter sensitive marine environments (see Figure 6.30). The outlet structures also allow for the brine to be diluted in a mixing zone. With constant monitoring by the Environment Protection Authority (EPA), the marine ecosystem is not affected.
A study completed over six years by the University of NSW investigated the effects of pumping and diffusing salt water back into the ocean at the Sydney Desalination Plant. The study found that the concentration of brine discharged from diffusers had little impact on marine life. However, the pressure at which the diffusers released the brine did have an impact. Invertebrates that like high-flow conditions (e.g. barnacles) increased in number around the diffusers, while slow-swimming larvae (e.g. tubeworms and sponges) decreased in number. Although the results were unexpected, it meant that there was a new opportunity to make desalination plants more sustainable.
SAMPLEPAGES
Professor Emma Johnston is a sustainability superstar and a leading authority in marine ecology. In 2018 she was made an Officer of the Order of Australia (AO) in the Queen's Birthday Honours for her distinguished service to higher education, particularly in marine ecology and ecotoxicology, as an academic, researcher and administrator. She has investigated the effects of pollution, dredging, habitat destruction and introduction of invasive species on complex marine ecosystems.
What can you do to ensure a sustainable
1. Save water
by combining traditional laboratory studies with novel field-based experiments.
future?
In 2023, the Victorian Government asked Melbournians to 'Target 150'. This is the goal of using 150 litres per person per day. This might seem like a lot of water, but currently our average use is higher than this. Complete the Try this activity and consider what you could do to minimise your wastage of clean fresh drinking water.
Try this 6.2
Calculating your water consumption at home
Visit the Smart Water Advice website (smartwateradvice.org) and navigate through 'Tools' and 'Water Calculators' to open up the 'Water Consumption Calculator for Victoria'. Work through the questions, which ask about your water use. When you arrive at the results page, think about what your results mean. Are you using more than 150 litres a day per person? Do you need to chat with your family about how to use water more efficiently? Make a list of tips for efficient water use at home.
2. Recycle water
Greywater is wastewater from non-toilet plumbing in your house, such as showers, basins and taps. The exact contents of greywater depend on the household producing it. If you keep your non-biodegradable chemical use to a minimum by using environmentally friendly, biodegradable soaps and detergents whenever possible, you could recycle the greywater by using it to water your plants.
Professor Emma Johnston
Science as a human endeavour 6.3
Figure 6.31 Professor Johnston is a leading investigator into the impact of humans on marine systems. Her research has broken new ground
Greywater can also be treated and then reused indoors for things like toilet flushing and clothes washing, which are both significant water consumers. If you want to recycle your greywater at home, you will need to use some sort of treatment process. This may be biological, chemical, mechanical or a combination of these. Some of the key steps outlined below are covered in Chapter 5.
• Coarse filtration – removes large particles, including hair, and prevents clogging.
• Fine filtration and biological treatment – microbes in a sand filter break down plant/animal matter in the water.
• Disinfection – UV or ozone disinfection.
Explore! 6.3 water is life!
Aboriginal and Torres Strait Islander Peoples have deep connections with water and waterways. In Victoria, water is a sacred part of Country to many Aboriginal groups. Water connects people and communities to land and to each other. Water is an essential part of spiritual and cultural practices, such as sharing knowledge between generations and family time, as well as environmental management and food production.
Conduct research to find out about the following in relation to Aboriginal and Torres Strait Islander Peoples, and discuss your findings as a class. Note down details of the Countries you research, as there are many diverse Aboriginal and Torres Strait Islander communities in Australia.
• Finding water
• Technology for carrying water
Quick check 6.8
SAMPLEPAGES
• Water management
• Use of water throughout time
1. Water is a renewable resource. Recall why we still need to use it sparingly.
2. Describe a way that desalination plants are making efforts to be more sustainable.
3. List five things that you can do to minimise wasting water at home.
Mining
Mining is the process by which minerals and other useful materials are extracted from Earth. The mining process has several stages: exploration, planning and design, construction, mining, processing, and closure and rehabilitation. You will look at these stages in more detail in Year 8.
Many of these stages in the life cycle of a mine can have a massive impact on local ecosystems, and this is why rehabilitation is a critical part of mining management.
Rehabilitation of an old mine
The purpose of rehabilitation is to return the land to the state it was in before the mine was built (or as close as possible). The mining industry is carefully regulated by state governments and together they are continually working to improve rehabilitation efforts to ensure environmental sustainability. Rehabilitation involves scientists, government officials, mining experts, bush regenerators and local wildlife experts.
Figure 6.32 Reusing greywater has become popular.
Figure 6.33 A billabong near the Murray River at Corryong, Northern Victoria
The Fosterville Gold Mine near Bendigo in Victoria is an example. The mine is currently operational, but as different mining pits are closed, their rehabilitation plans are implemented. Sharkey's Pit, which was mined in the early 1990s, began backfilling and rehabilitation in mid-2024. Over eight months, topsoil placement and revegetation activities occurred. This included returning agricultural land to its prior productivity and increasing the number of indigenous plant and animal species where possible. Vegetation monitoring is then completed every three months, investigating species diversity and plant health, to determine the success of species survival. The aim is to ensure a self-sustaining ecosystem over time. An Ecosystem Function Analysis is also completed each year to check habitats for soil stability, erosion and nutrient cycling. This monitoring will continue for a number of years.
SAMPLEPAGES
writing a
case study
A case study is a detailed description and assessment of a specific situation so that generalisations and other insights can be gained from it. Often, a case study is formatted like a report. Write a case study on Sharkey's Pit at Fosterville Gold Mine (rehabilitation in progress) or, if you would like to do some additional investigation, Rehe's Pit at Fosterville (rehabilitation completed 2022). Where possible, use the subheadings below to help you.
• Background (where is the mine and what are the problems that need to be addressed)
• Planning for rehabilitation (how will the problems be addressed)
• Rehabilitation (stages of implementation of the solutions to the problems)
• Monitoring (including instruments for measuring success or failure)
• Outcomes (what succeeded and what failed)
• Conclusion (overall success or failure of plan)
What can you do to ensure a sustainable future?
Reduce, reuse, recycle
In 2020–21, Australia generated 75.8 megatonnes (Mt) of waste! Imagine how massive this number is now. Some of this waste is made of materials originally extracted from mines. There are many ways you can help to change this and minimise wastage of our Earth's natural resources.
Try this 6.4 the three Rs
As a class, discuss and come up with some strategies that you can use as an individual, family and community to reduce, reuse and recycle the Earth's resources. It has been suggested that the three Rs should now be five Rs, with the addition of refuse and repair. What do these terms mean and how might this change your list of strategies?
Figure 6.34 Sharkey's Pit, Fosterville Gold Mine, where rehabilitation has begun
Try this 6.3
Figure 6.35 You can contribute to a sustainable future easily by taking small actions to reduce waste, reuse materials and recycle more.
Science as a human endeavour 6.4
deep Earth Imaging
In 2024, the CSIRO shared some ground-breaking research with the world. Using Deep Earth Imaging, CSIRO scientists have been able to identify mineral, energy and water resources beneath surface sedimentary rock. Deep underground mining will lower the environmental footprint of mining on the surface, and this will help to make resource exploration less risky and more sustainable, and build energy and resource security. The cool thing about Deep Earth Imaging is that it uses smart analytics and algorithms to simulate geological models. This enables patterns to be identified and interpreted.
SAMPLEPAGES
1. State why mine rehabilitation is an essential part of the planning and design stage of a mine's life cycle.
2. Outline how an old mine might be rehabilitated.
transport
Car companies are concerned about how they can help protect the environment, and are making changes to create vehicles that use less fossil fuels and are produced using more sustainable processes. This change is happening not just because of new legislation, but also because people want greener ways to get around. The future of fuel-efficient cars is full of exciting new ideas that will change how we drive and travel.
Hydrogen
Hydrogen is a promising fuel option, because all that comes out of the tailpipe is water! It is a clean fuel and by using it instead of current fossil fuels, we could substantially reduce carbon dioxide emissions into the atmosphere. In 2023, a hydrogen plant and refuelling station was opened in the Clayton suburb of Melbourne by the CSIRO and Swinburne University. It is primarily used for research and training, but is believed to produce around 20 kg of hydrogen a day, which can keep three hydrogen-powered cars on the road. Another 12 hydrogen refuelling stations are operational or under construction around Australia.
There are some disadvantages to using hydrogen fuel cell technology. One in particular is the fact that hydrogen is highly explosive! In addition, the fuel cells themselves contain non-renewable and expensive metals such as platinum and iridium.
Figure 6.36 There are currently only two models of hydrogen-fuelled vehicles available to buy in Australia. But that might change when consumers find out that they take about 6 minutes to fill from empty, compared with several hours to charge an electric vehicle!
Quick check 6.9
Practical 6.3
Making hydrogen from water
Aim
To use the process of electrolysis to split water and make hydrogen.
Materials
• 250 mL beaker
• 9 V battery
• paperclips or wire × 2
Method
SAMPLEPAGES
• tap water
• lemon juice
• baking soda
1. Unbend the two paperclips and connect one to each terminal of the battery, as shown in Figure 6.37.
2. Pour water into the beaker until it is about half full.
3. Hold the battery above the beaker with the paperclips 'hanging' down towards the water.
4. Place the ends of the paperclips into the water. What you have set up is a process called electrolysis.
5. You may notice bubbles coming off both paperclips. Record your observations in the results table.
6. Discard the solution in the beaker and repeat the experiment, but this time add a big pinch of baking soda to the tap water. Record your observations.
7. Again, discard the solution in the beaker and repeat the experiment, but this time add lemon juice to the tap water. Record your observations.
Results
Table showing observations when using different solutions to make hydrogen from water
Solution
Tap water
Tap water and baking soda
Tap water and lemon juice
Discussion: Analysis
Observations
1. Consider your findings. Did you observe differences between the different solutions? Were some solutions better than others at making bubbles? Can you find out why this is the case?
2. The formula for water is H2O. Suggest why the paperclip making hydrogen bubbles produced more than the paperclip making oxygen.
3. How could splitting water be used to make hydrogen cars work?
4. Based on this experiment, what do you think about the use of hydrogen as a car fuel?
Conclusion
1. Copy and complete this statement in your science book. From this activity it is claimed that ________ . This is supported through observing ________ . This means that __________ .
Figure 6.37 Experiment set-up
Electric and hybrid
Electric vehicles (EV) are powered by an electric motor with a battery. In a push to reduce our use of fossil fuels, Australians have embraced EVs. With advances in battery technology, EVs are becoming more affordable, offering longer ranges and faster charging times. However, EV production has its challenges. The batteries are heavier than an engine, and to allow EVs to drive further, the battery size needs to be increased. This makes the cars even heavier, so they need more frequent charging … and so the cycle continues.
SAMPLEPAGES
Hybrid cars combine a petrol engine and an electric motor to improve fuel efficiency, performance and emissions. Some are plug-in vehicles with a large battery and can be recharged using an electrical plug. Some are non-plug in, where just the running of the engine generates electricity, which is stored in a small battery in the vehicle.
The batteries used in both EVs and hybrids are typically lithium-ion batteries. These may be very useful, but the liquid inside the battery is highly volatile and flammable. Usually nothing goes wrong, but the batteries produce heat – a failing battery can reach up to 400°C in just a few seconds. The risks include explosions and highly toxic gas being released. Additionally, there is currently very little capacity in Australia for recycling lithium-ion batteries, and lithium-ion battery waste is growing by 20 per cent per year. Thanks to the CSIRO, research is under way into processes for the recovery of the metals that make up the battery, development of new battery materials, and support for battery reuse and recycling.
Solar
Solar cars are essentially electric cars with photovoltaic cells that can convert the Sun's energy into electricity. Some of the solar energy can be stored in batteries to allow them to run at night and in the shade. Just like using solar panels for powering our houses, there are advantages and disadvantages in using solar energy to power a car.
One advantage of a solar electric vehicle (SEV) over a standard EV is that, while there is daylight, the car can be charging, so the range it can travel is greater than that of EVs. However, solar panels are expensive, heavy and only about 30 per cent efficient. Once again, there are many opportunities for development that are being pursued.
Biofuels
Another avenue for the automotive industry is to search for alternative fuels derived from renewable sources. Biofuels, such as ethanol, can be made from sugar cane, corn and cellulose and can be blended with petrol to reduce greenhouse gas emissions and therefore our dependence on fossil fuels. You may have seen ethanol-based fuels at your local petrol stations – an example is E85, which is 85 per cent ethanol and 15 per cent petrol. Unfortunately, E85 is not very popular, as there aren't many vehicles on the market that can use it.
Figure 6.39 Corn can be converted into ethanol and used as an alternative fuel
Figure 6.38 An electric vehicle charging bay station
Go online to access the interactive section review and more!
What can you do to ensure a sustainable future?
How can you minimise your use of fossil fuels and have an impact on greenhouse gas emissions? Most homes are powered by electricity, and most cars are powered by petrol, diesel or natural gas. If you reduce your electricity use and don't use your car unless you need to, this will definitely help. Talk with your family about turning off lights when you go out of a room, and carpooling or catching public transport.
Quick check 6.10
1. Outline the different ways in which the automotive industry is working to reduce fossil fuel use and become more sustainable.
2. List some advantages and disadvantages of using alternative energy sources to power cars.
Section 6.3 review
SAMPLEPAGES
can assign tasks and track results
Section 6.3 questions
Remembering
1. Define the term 'sustainability'.
2. Bioethanol is increasingly being used as an additive in petrol. List what bioethanol is made from.
Understanding
3. Identify some of the advantages and disadvantages of using solar panels to power a car.
4. Describe the evidence that a mine rehabilitation has been successful.
5. Summarise the advantages to a community of mine rehabilitation.
Applying
6. Demonstrate why solar cars may be considered better for the environment than electric cars at present.
7. Researchers have designed a new solar desalination system that takes in saltwater and heats it with natural sunlight. The system flushes out accumulated salt, so replacement parts aren't needed often, meaning the system could potentially produce drinking water at a rate and price that is cheaper than tap water. Explain how the benefits of this new system are linked to the benefits of solar energy.
Analysing
8. Your friend in class said, 'Electric cars are the answer to all our greenhouse gas problems. All you need to do is plug in an electric car at the end of the day and it charges. No greenhouse gases are produced.' Explain, giving reasons, whether you agree or disagree with your friend's statement.
Evaluating
9. Hydrogen can be made by splitting water, but it is so expensive that it isn't a viable option commercially. Researchers at RMIT have developed a cheaper, more energy-efficient way to make hydrogen from saltwater, without needing to desalinate it first. To be sustainable, the production of hydrogen must not be at the expense of scarce freshwater supplies. Decide whether this is good research to pursue.
Chapter review
Chapter checklist
Success criteria Linked questions
6.1I can define renewable and non-renewable resources. 1, 2, 4, 9, 14
6.1I can describe some examples of renewable sources of energy, including their advantages and disadvantages. 7, 13, 15, 16, 17, 18
6.1I can list the timescales for the regeneration of Earth's renewable resources. 5, 14
6.2I can describe some examples of non-renewable sources of energy, including their advantages and disadvantages. 10, 11, 17
6.3I can suggest ways that water management, mining and transport can be made more sustainable. 3, 6, 8, 12, 19
competition
Review questions
Remembering
1. Identify the missing information in the table regarding Earth's resources and their uses.
SAMPLEPAGES
Living things to breathe, burning things, wind for drying clothes, powering windmills
Growing
food
Energy from the Sun
2. Provide two examples of fuels made from biomass.
Understanding
3. Identify where greywater comes from.
4. Compare a hydroelectric power station and a nuclear power station.
5. Describe why minerals are non-renewable.
6. Outline the advantages of recycling greywater at home.
Applying
7. Summarise how ocean energy is used to create electricity.
8. We are often encouraged to recycle, reduce and reuse rather than buy new items. Explain why this is the case.
Go online to access the interactive chapter review!
9. Identify two reasons why soil is such a precious resource.
10. Identify the reasons why it is so important for us to reduce our dependence on fossil fuels.
11. Identify two advantages of using nuclear energy as an energy source.
12. Summarise two ways that the automotive industry has responded to the depletion of the world's fossil fuel stores.
13. Explain why hydroelectricity would not be possible if it was not for solar energy.
SAMPLEPAGES
Analysing
14. Classify each of the resources in the table as renewable or non-renewable, identifying the timescale for renewal.
ResourceRenewable or non-renewableTimescale for renewal
Geothermal
Coal
Wind
Tides
Natural gas
Biofuel
15. The Sun, wind, waves, tides, hydro and geothermal are all renewable sources of energy. While there are many advantages to using these sources, discuss some limitations of renewable energy.
16. Compare hydroelectricity with a giant battery as a source of electricity.
17. Most of the methods of generating electricity involve using turbines. Discuss some examples of how turbines are used in different situations to produce electricity, stating what other device needs to be connected to them.
Evaluating
18. In 2017, Australian researchers developed printable solar technology. They made an electronic ink product from non-toxic materials, and when this ink was printed onto plastic sheets, they had flexible solar panels. Predict some of the uses of this new solar panel in the future.
19. Discuss a resource extraction process that has been made more sustainable.
Data questions
With current government policies aiming to reduce pollution and reduce our impact on the environment, some Australian states are working towards producing up to a third of their electricity from renewable energy sources by 2030. The main renewable energy sources can be categorised as solar, hydroelectricity, wind and biomass. The approximate amount of electricity produced by each energy source in the involved states from 2009 to 2018 is represented in Figure 6.40.
SAMPLEPAGES
Figure 6.40 Approximate amount of electrical energy produced from renewable energy sources from 2009 to 2018
Applying
1. Identify which of the renewable energy sources contributed the largest percentage of renewable energy in 2018.
2. Identify the trend in the total use of renewable energy over time.
3. Recognise whether solar electricity or hydroelectricity generation has increased more over the period of 2009–18.
Analysing
4. Contrast the growth of wind energy to that of solar over the 10-year period.
5. Determine the amount of electricity produced from biomass in 2015.
6. Explain a limitation to attempting to accurately predict the energy that will come from renewable sources in the future.
Evaluating
7. Predict whether the involved states will achieve a goal of generating 15 000 GWh of electricity from renewable energy in 2030.
8. Using the data presented, justify which renewable energy source is likely to make up the lowest percentage of electricity generation in the year 2030.
SolarHydroWindBiomass
stEM activity: Reduce, reuse, repurpose, recycle
background information
SAMPLEPAGES
Waste is a huge issue for the whole world. Since 1 February 2023, retailers, wholesalers and manufacturers have been banned from selling or supplying single-use plastics in Victoria, in the hope that Victoria will eventually become a zero-waste society. Reducing waste helps to conserve our natural resources, while saving energy and reducing pollution. It protects habitats, preserves biodiversity and extends landfill lifespans. By supporting sustainable practices and reducing carbon emissions, we are ensuring a healthier planet for future generations.
But habits are hard to change. Being a zero-waste society involves rethinking how we use our resources to eliminate all waste products. With this important goal, society needs to be educated about having a zero-waste philosophy.
DESIGN BRIEF
Design an educational poster for the Victorian Government to distribute through schools about zero waste and the science behind making a zero-waste society.
activity instructions
Your group has been employed by the Victorian Government to produce an educational poster about zero waste for primary school children. It should include the science behind how different waste products are made, and how different items can be reused, repurposed and recycled, as well as the reasons why certain products must be avoided.
Figure 6.41 Return. Reuse. Recycle. Reusable cups reduce the impact of waste generated by takeaway drinks.
Suggested materials
• pens/pencils
• butcher's paper
• PowerPoint/poster-making software
• computers
Research and feasibility
1. Research, discuss in your group and list different types of waste produced by society.
2. Discuss in your group which types of waste you think should be the focus of your poster and research how they are made, used and then reused/repurposed/recycled.
3. Create a table like the one shown here to help determine which types of waste are easiest or most difficult to make zero waste. An example has been provided.
Waste Household/ society quantity
Can this product be made zero waste? How? Level of difficulty
Cling wrapVaries depending on household Yes It can be recycled, but it is more difficult, and should be avoided as a product.
SAMPLEPAGES
Design and sustainability
4. Decide, as a group, five key ideas you want to have on your poster, and discuss whether you have enough important research to help convince students of their importance.
5. Sketch, as a group, different poster designs and annotate the locations of the most important information. Discuss as a group whether the poster is effective visually.
Create
6. Use butcher's paper or a computer to create your information poster. Remember, this is a poster designed for primary school children.
Evaluate and modify
7. Present your poster to your class as a group, and encourage questions and feedback from your class.
8. Evaluate your poster's effectiveness in presenting the message of zero waste to your class.
9. Discuss modifications you would make to your poster based on feedback from the class.
Chapter 7 Planet Earth
SAMPLEPAGES
Introduction
In this chapter, you will find out more about the world you live in and investigate the motion of Earth, the Moon and the Sun through space. You will learn why a day is 24 hours long and why different countries have different time zones. You will also learn why there are seven days in a week and 365.25 days in a year, and why there are seasons, phases of the Moon, and solar and lunar eclipses. You will investigate the reason there are low and high tides, and how Aboriginal and Torres Strait Islander Peoples use their knowledge of the seasons and the lunar cycle to inform their practices on Country.
Events:
• Solar eclipse
• Lunar eclipse
Concept map
SAMPLEPAGES
Sun
• Made of gas
• Different areas rotate at different speeds
Earth Revolves around the Sun yearly (365.25 days)
• Rotates on an axis daily
• Time zones
Revolves around Earth every 27.3 days
Moon
• Rotates on its axis once every 27.3 days
• Tides
Section
Section
Section 7.3
Section 7.4
Seasons
Phases of the Moon
Curriculum content
cyclic changes in the relative positions of Earth, the Sun and the Moon can be modelled to show how these cycles cause eclipses and influence predictable phenomena on Earth, including seasons and tides (VC2S8U12)
• using physical models or virtual simulations to explain how Earth's tilt and position relative to the Sun cause differences in light intensity on Earth's surface, resulting in seasons
SAMPLEPAGES
• examining the effect of the gravitational attraction of the Moon and Sun on Earth's oceans and describing how the positions of the Moon and Sun in relation to Earth result in tidal variations
• using physical models or virtual simulations to explain the cyclic patterns of lunar phases and eclipses of the Moon and Sun
• researching knowledges held by Aboriginal and/or Torres Strait Islander Peoples about the phases of the Moon and the connection between the lunar cycle and ocean tides; for example, understanding by Torres Strait Islander Peoples of the relationship between lunar cycles and neap tides enables prediction of the safest periods to reef-dive for lobster
• investigating some examples of Aboriginal and/or Torres Strait Islander Peoples' seasonal calendars and how these can be used to predict seasonal changes; for example, the seasonal calendar of the people of D'harawal Country (south-west of Sydney) identifies the cries of tiger quolls in search of mates as indicating that the lilly pilly fruit has started to ripen and that falling lilly pilly fruit is a sign that the people of the D'harawal Country should begin their annual journey to the coast in search of other seasonal resources
• researching Aboriginal and/or Torres Strait Islander Peoples' oral traditions and cultural recordings of solar and lunar eclipses, and investigating similarities and differences with contemporary understandings of these celestial phenomena
communication of scientific knowledge has a role in informing individual viewpoints, and community policies and regulations (VC2S8H04)
• examining how global reporting on high-impact weather events such as cyclones, tidal surges and heatwaves has led to the development of warning systems and evacuation policies
1. Describe the effect of Earth's rotation on temperature and time zones.
2. State the rotation times for Earth, the Moon and the Sun.
the daily cycle
Have you ever thought about how much of your life is regulated by a daily routine? Much of this is determined by the movements of Earth, the Moon and the Sun.
Try this 7.1
the daily cycle
In small groups, think about and describe your observations of the Sun, Earth, the Moon and stars during a typical day. For example, the day begins officially at midnight when the date changes. The new day starts in darkness. Most people are asleep as dawn approaches. When the morning sun appears over the horizon, it is time for us to wake up. Birds announce the dawn, animals that hunt at night look for somewhere to hide, and animals that are busy during the day get up to look for food. Now keep going with the list, but remember to focus on the changes in the Sun, Earth and the Moon. List any other changes you have seen as the day or night progresses. Remember, you are only looking at what changes over 24 hours, so do not include weather events because these do not repeat every day.
Did you know? 7.1
Flower cycles
Some flowers have a daily cycle. Daisies close their petals at night and open them again during the day. Arctic poppies and sunflowers turn their heads to follow the Sun as it moves across the sky.
Figure 7.1 Sunset over the Melbourne city skyline, Princes Bridge and Yarra River. Temperatures generally increase during the day and decrease at night.
Figure 7.2 Daisies (a) open their petals during the day and (b) close them as the light fades.
Try this 7.2
Finding out why
For this activity, you will need a round yellow balloon or ball, another smaller balloon or ball and a marker pen.
In small groups, choose a question from the list below and develop an explanation to share with the rest of the class.
• Why does it get warmer during the day and colder at night?
• Why does the Sun appear to move across the sky?
• Why do stars appear to move across the sky at night?
• Why is there maximum risk of sunburn between 10 a.m. and 2 p.m.?
• Why does the length of your shadow change during the day?
To help with your explanation, use the larger yellow balloon/ball to represent the Sun and the smaller balloon/ball to represent Earth. Draw a map of Australia on the smaller balloon/ball, with a small dot to represent your location.
Our rotating Earth
You can think of Earth as a giant ball in space that is spinning anticlockwise (when viewed from the North Pole), making one rotation per day. Sunlight shines on one side, while the other side is in darkness. The side of Earth facing towards the Sun experiences day and the side facing away experiences night. Dawn and dusk occur on the boundary between light and dark when the Sun is on the horizon. The Sun does not actually move across the sky. It appears to do so because Earth is rotating. The Earth rotates from the west to the east, which is why the Sun rises in the east and sets in the west.
rotating planets
SAMPLEPAGES
Venus rotates in the opposite direction to Earth, so on Venus the Sun rises in the west and sets in the east.
Speed of Earth's rotation
Because Earth is rotating anticlockwise, the whole state of Victoria is moving to the east at around 400 metres per second, which is faster than the speed of sound. You do not feel like you are moving because everything around you is moving as well. In addition to the motion caused by its rotation, Earth is also moving anticlockwise around the Sun at a speed of around 28 kilometres per second. If an aircraft could fly at that speed, it would get to London from Melbourne in about 10 minutes!
Figure 7.3 This picture shows how the Earth rotates on its axis, with the Sun in the distance. Earth's rotation causes night and day. In the picture, it is night-time in Australia.
Figure 7.4 The view of Earth from above the South Pole. Earth is rotating clockwise from this pole. Different parts of the world are experiencing morning (yellow), afternoon (orange) and night (blue). This image shows morning in Australia.
Temperature and shadow changes
SAMPLEPAGES
Sun at position 1
Sun at position 2 Sun’s rays absorbed by the atmosphere
Earth
Shadow from Sun at position 1
Atmosphere
The Sun is a star, and temperature changes experienced on Earth during the day are due to the position of the Sun in the sky. If you track one location on our spherical Earth, it is turning towards the Sun in the morning and away from the Sun in the afternoon. This means the temperature increases in the morning as the Sun rises in the sky and continues to increase throughout the day as the Sun provides heat. At night, there is no heat from the Sun in that location and the temperature falls until the next day when the cycle repeats.
Shadow from Sun at position 2
Figure 7.5 When the Sun is close to overhead, its rays pass through less atmosphere. For this reason, the midday sunlight is more intense and more likely to cause sunburn. The length of your shadow also changes due to the angle of the Sun's rays.
axis
doesn’t rise
Figure 7.6 The axis of rotation of Earth is tilted by 23.4 degrees.
Try this 7.3
Simulating the movement of the Sun
In a group, use a yellow balloon and a camera for this simulation. A simulation is a model of an event, or a way to see what happens without it actually happening.
1. Choose someone to be Earth and hold a camera.
2. Choose a second person to be the Sun by holding the balloon.
3. The person with the camera stands in front of the Sun and rotates slowly on the spot while recording a video.
SAMPLEPAGES
What did you see? Did it appear as though the Sun is moving past the camera? What was the cause of the movement?
Did you know? 7.4
antipodes
The place on the exact opposite side of the world to a region is called its antipode. The antipode of Melbourne is in the middle of the Atlantic Ocean, due west of Portugal. If the Sun is setting in Melbourne, it is rising at its antipode. If it is winter in Melbourne, it is summer at the antipode.
Positions of stars in the sky
Like the Sun, the stars do not move. During the night, and from night to night, the position of the stars appears to shift. This movement is an illusion caused by Earth's rotation about its own axis, and by the Earth's revolution around the Sun.
Figure 7.7 The antipode of Melbourne is west of Europe in the Atlantic Ocean.
VIDEO Timelapse of stars in Australia
Antipode at La Frontera
Melbourne
To navigate around the night sky, it makes no sense to say that a star is 5 cm to the right of another. So we measure angles (out of 360 degrees) instead. But what if you don't have a protractor? No matter! You have an inbuilt measuring tool. Hold your hand out at arm's length and close one eye. Make a fist so you can see the back of your hand. Stick your index and little finger up and look at the night sky; this makes approximately 15 degrees in the night sky (see Figure 7.9). If you then stretch out your thumb and little finger, this is approximately 20 degrees. One finger is 1 degree.
Did you know? 7.5
the changing night sky
The night sky appears differently over time. The current North Star (a star that sits above the North Pole) is Polaris, but in about 12 000 years it will be Vega. This is due to the wobble of Earth's tilted axis of rotation, which is not perpendicular to the plane of orbit around the Sun. The combined gravitational pull of the Sun and the Moon makes the Earth's axis itself rotate about (precess) the position that the axis would be in if it was perpendicular to the orbit. The period of precession is about 26 000 years.
SAMPLEPAGES
Quick check 7.1
1. Define the following terms in your own words: rotation, dawn, dusk.
2. Explain why the Sun and stars appear to move across the sky, when they are not really moving.
3. Explain why it is cooler at night and warmer during the day.
4. Compare the effect on shadows when the Sun is directly overhead with when it is at a low angle in the sky.
15°
Figure 7.9 You can measure the distance stars travel in an hour by using your hand.
Figure 7.8 The stars in the sky are not moving. It is Earth's rotation that makes them appear to move.
time zone
Earth is divided into 24 time zones, each about 15 degrees of longitude and each one representing a time difference of 1 hour
time zones
It takes about 24 hours for Earth to complete one rotation, which is 360°. This means Earth is rotating at a rate of about 15° per hour. For this reason, Earth is divided vertically into 24 time zones, each of which is about 15° or 1 hour apart. At certain times of the year, there may be up to 38 time zones because of daylight saving of half or one hour differences. It gets complicated! Time zones are measured from Greenwich in the UK. The time in Greenwich is called Greenwich Mean Time or GMT.
New York, USA
SAMPLEPAGES
Greenwich, UK
Melbourne, Australia
7.10 The
Some states and countries use daylight saving, which involves turning all clocks forward by an hour at the beginning of summer. There are two reasons for daylight saving. First, it delays the time of dawn in summer by an hour, so people can get an extra hour of sleep before being woken by the rising Sun. Second, daylight saving saves energy because the Sun goes down an hour later, so households use less electricity for lighting at night. In Australia, daylight saving is used in South Australia, New South Wales, the Australian Capital Territory, Victoria and Tasmania.
Explore! 7.1
Indirect effects of Earth's rotation
Some amazing things in the world are linked to our daily cycle but are not directly a consequence of Earth's rotation. Using the internet, research to find out more about these indirect effects. For example, why does the wind usually seem to blow from the sea during the day?
Figure 7.11 Why is the sky red at sunset? Clouds are illuminated by the Sun at sunset. The blue light from the Sun has travelled through the atmosphere and has been scattered, leaving only red light to illuminate the clouds. Red light does not scatter because it has a longer wavelength than blue light.
Figure
time zones of the world. Victoria is 10 hours ahead of GMT because it is about 150° east of Greenwich. New York is 5 hours behind GMT because it is about 75° west of Greenwich.
Did you know? 7.6
Mars has blue sunrises and sunsets!
The Martian atmosphere is too thin to scatter blue light, but it is full of dust particles that scatter red light. This means that on Mars the sky is pink during the day, but at dawn and dusk the sunrises and sunsets are blue!
SAMPLEPAGES
Quick check 7.2
1. State how many degrees Earth rotates in one hour.
2. State how many time zones there are.
3. Explain why it is necessary to have time zones.
4. Describe the advantages of daylight saving time.
rotation of the Sun
The Sun also rotates but at a very different speed to Earth. Unlike Earth and the Moon, the Sun is not solid – it is a hot gas – so different parts of the Sun rotate at different speeds. The equator of the Sun rotates approximately once every 25 days, while the poles (top and bottom) rotate at a much slower rate, about once every 38 days. Even though 25 days sounds like a long time, the Sun is so big that the surface at the equator is still travelling at around 2 kilometres per second!
There are dark spots on the surface of the Sun, called sunspots. These can be seen with special equipment and are seen to move with the surface of the Sun as it rotates. You should never look at the Sun directly to see sunspots – it is very dangerous to look at the Sun, even with sunglasses, because the powerful ultraviolet light will damage your eyes.
Be careful
Never use binoculars or telescopes to look anywhere near the Sun.
Figure 7.12 A blue sunset on Mars, taken by the NASA Mars Curiosity rover
sunspot a feature on the Sun's surface that moves slowly across the surface
Figure 7.13 Sunspots, such as the one shown, stay visible for about 11 days as they cross the face of the Sun.
VIDEO Animation of the Sun activity
Quick check 7.3
1. State how long one rotation of the Sun takes.
2. Explain how it is known that the Sun rotates.
Making thinking visible 7.1
Connect, extend, challenge
How does the information about the movements of the Earth, Moon and Sun connect to what you already knew?
What did you learn in this section that broadened your thinking or extended it in different directions? What challenges or puzzles emerge for you after reading this section?
The Connect, extend, challenge thinking routing was developed by Project Zero, a research centre at the Harvard Graduate School of Education.
Section 7.1 review
SAMPLEPAGES
can assign tasks and track results
Section 7.1 questions
Remembering
1. Recall how long it takes Earth to complete one full rotation.
2. State at what time of day the Sun reaches its highest point in the sky.
3. State where time zones are measured from.
Understanding
4. Describe how sunsets on Mars are different from those on Earth.
5. Explain how Earth experiences day and night.
6. Explain why the Sun, Moon and stars rise in the east and set in the west.
7. Explain how your shadow changes length over a day.
Applying
8. Find out what the current time is in Perth and Brisbane. Explain your findings.
9. At what time of the day is it most important to wear sunscreen and seek shade? Explain your answer.
10. Describe what would happen if Earth did not have different time zones.
Analysing
11. China is one of the largest countries in the world and should span five geographical time zones, but has only one (Beijing Standard Time). When it's 7 a.m. in Beijing, it's also 7 a.m. nearly 3000 km west in the Xinjiang region. Critique the decision to have a single time zone in such a large country.
Evaluating
12. Propose some of the consequences of removing daylight saving time.
13. 'If Earth stopped rotating, one side of Earth would be in total darkness all the time'. Decide whether you think this statement is true, giving your opinion on how life would be different if Earth did not rotate.
7.2 Earth's yearly cycle
Learning goals
At the end of this section, I will be able to:
1. Recognise that gravity keeps planets in orbit around the Sun.
SAMPLEPAGES
2. Describe the cause of seasons in different regions on Earth.
3. Recognise how Aboriginal and Torres Strait Islander Peoples' calendars can be used to predict seasonal changes.
Apart from rotating on its axis, which results in the day–night cycle that repeats every 24 hours, Earth also moves around the Sun on an elliptical path. It takes 365.25 days for Earth to travel around the Sun; the path is called an orbit. One complete orbit around the Sun is called a revolution. The calendar is simplified by using 365 whole days and adding an extra day once every 4 years. We call that year a leap year
Figure 7.14 The Moon orbits Earth, and Earth orbits the Sun. If you were standing at the North Pole, these rotations would appear to be anticlockwise.
Earth orbits the Sun
Gravity is a force of attraction between objects with mass. Objects around a body with a very large mass (like a planet or star) experience a force pulling them towards the centre of the large body. This force is called the gravitational force. The space around the large body where objects will experience this gravitational force is called a gravitational field. An object with larger mass has a stronger gravitational field and will cause objects with less mass to go into orbit around it. The Sun is 333 000 times heavier than Earth, so the gravitational field of the Sun causes Earth to orbit the Sun.
Seasons
You may have observed that over the course of a year, the days change slightly in length. In the southern hemisphere, where Australia is located, the day length decreases from January to June and increases from July to December. The shortest day occurs around 21 June. The longest day occurs around 21 December. The opposite happens in the northern hemisphere, where the longest day is in June and the shortest day is in December. Interestingly, for places on the equator, the day length is always 12 hours, every day of the year.
elliptical oval-shaped orbit the curved path of a celestial object or spacecraft around a star, planet or moon revolution one complete orbit leap year a year that happens every four years and has an extra day on 29 February
mass the amount of matter in an object; mass never changes, even in space
gravitational force a force caused by a large object pulling everything around it towards its centre gravitational field the region around a large object where another object experiences its gravity or pull southern hemisphere the half of Earth south of the equator
northern hemisphere the half of Earth north of the equator equator an imaginary line around the middle of Earth, equidistant (halfway) between the North Pole and South Pole
Seasonal changes
What things do you observe throughout the year that are explained by the seasons changing? See how many of the following you came up with.
• The number of hours of daylight. During the year, the time the Sun rises and sets changes. There are more daylight hours in summer than in winter.
• The point on the horizon where the Sun rises and sets changes. The Sun always rises in the east and sets in the west, but the position varies. The Sun sets further south in spring and summer, and further north in autumn and winter.
SAMPLEPAGES
• The average daily temperature is lower in winter and higher in summer. The difference between average summer and winter temperatures increases with distance from the equator.
• The Sun's position in the sky at midday is highest in summer and lowest in winter.
• Some animals and plants change their behaviour and appearance at different times of the year. In winter, deciduous trees lose their leaves, some animals hibernate and others migrate. In the warmer months, birds nest and lay eggs, and plants produce flowers and then fruit, though there are winter-flowering plants as well.
• Seasonal changes also affect people. For example, farmers are heavily reliant on seasons for their livelihood. They can only sow and harvest at certain times of the year.
Figure 7.15 Summer at Brighton Bay Beach, Melbourne, Boonwurrung Country
Figure 7.16 Autumn in the Macedon Ranges, on Dja Dja Wurrung, Taungurung and Wurundjeri Woi Wurrung Country
Figure 7.17 Winter on Mount Buller, Taungurung Country
Figure 7.18 Canola fields on Yorta Yorta Country, in spring
deciduous
a tree that loses its leaves in autumn and grows new ones in spring
Earth's tilt causes the seasons
SAMPLEPAGES
Believe it or not, Earth's tilt can explain all these observations. The axis of rotation of Earth passes through the North and South Poles. This axis is at an angle of 23.5° from the vertical and the angle does not change as Earth goes around the Sun.
7.20 Seasonal arrangements of Earth and the Sun. The tilt of Earth causes the different seasons during the year. Australia is shown in orange.
Figure 7.19 This illustrates the position of the Sun at the same time each week for a whole year.
Figure
VIDEO Earth's tilt and seasons
Explore! 7.2
aboriginal and torres Strait Islander seasons
Aboriginal and Torres Strait Islander Peoples have diverse and sophisticated ways of understanding and mapping the seasons. These systems vary significantly depending on the Country to which they belong, reflecting the unique landscapes, climates and ecosystems of regions. For example, Wurundjeri People, the Traditional Custodians of Melbourne and the surrounding lands, follow a seasonal calendar with seven distinct seasons:
• Biderap: Dry Season (January–February)
• Iuk: Eel Season (March)
• Waring: Wombat Season (April–July)
• Guling: Orchid Season (August)
• Poorneet: Tadpole Season (September–October)
• Buarth Gurru: Grass Flowering Season (November)
• Garrawang: Kangaroo-Apple Season (December).
SAMPLEPAGES
Figure 7.21 A Wurundjeri calendar marking the seasons
Each of these seasons is identified by unique weather patterns, the appearance or behaviour of specific plants and animals, and the position of stars in the night sky. Wurundjeri knowledge reflects an intricate understanding of Country, with careful observations of environmental changes informing their diets, resource management, and seasonal activities such as travel and ceremonies.
These seasonal calendars are not only vital to the cultural practices and sustainable resource management but also represent a profound connection to and knowledge of Country. They demonstrate a sophisticated understanding of ecological systems, which has contributed to advances in scientific fields such as botany, zoology, ecology and meteorology.
Organisations like the CSIRO have collaborated with Aboriginal and Torres Strait Islander communities to co-produce and share seasonal calendars with the wider Australian public, fostering greater appreciation and understanding of this knowledge.
Use the internet to research the seasonal calendar of the D'harawal People and compare it to the Wurundjeri calendar. Investigate the relationship between the cries of the quoll and blooming of lilly pilly flowers during the Time of Marrai'gang (April–June). Consider how this relationship reflects a deep understanding of environmental cycles and the interconnectedness of life.
Explore! 7.3
Daylight hours at different latitudes
The number of daylight hours in a day depends on distance from the equator and how Earth orbits the Sun. The distance north or south of the equator is called latitude. Latitude is measured in degrees, starting with 0 degrees at the equator. The North Pole is at 90 degrees, or 90 degrees north. The South Pole is at –90 degrees, or 90 degrees south.
Prediction
How do you think the number of hours of daylight in the summer changes as you go further north or south from the equator?
How do the number of hours of daylight vary in the winter?
Test your prediction
Using an atlas or website, select 10 northern hemisphere cities from a range of latitudes. Do the same with 10 southern hemisphere cities. Note each city and its latitude. You only need to write down the latitude to the nearest degree.
Use the internet to find out the number of hours of daylight for each city on 1 January and 1 July.
Draw a graph of latitude against the hours of daylight for January and July.
SAMPLEPAGES
Can you identify any patterns in the proportions of a day spent in sunlight and in darkness, and the seasons?
Figure 7.22 Sunset in Antarctica. The South Pole experiences several months of darkness during winter, when the Sun remains below the horizon.
Investigation 7.1
Modelling the seasons
Aim
To investigate how the angle of Earth to the Sun affects the temperature of the area where the Sun's light hits.
Prior understanding
Be careful
Take care when handling light sources after extended use. They may be hot.
Take care when handling the opened can, as it may have sharp edges.
Light is energy from the Sun. When light rays hit the surface of an area and are absorbed, they can cause the area to heat up. When the Sun's rays hit Earth's surface close to the equator, the energy is more direct (because it is closer to a 90° angle), so the area becomes warmer.
Materials
• opened aluminium can with small hole drilled in the side for the thermometer
• thermometer
• adhesive putty
• lamp (a lamp used to heat reptile cages would be ideal)
• cylinder/rectangular shape to cover the lamp and direct light forward
• 1 m ruler or tape measure
• whiteboard with 1 cm graph paper or grid attached
Method
1. Attach a shade to the light to direct the light forward as much as possible.
2. Attach the thermometer through the hole in the can, making sure it is not touching the bottom. Secure in place with some of the adhesive putty.
3. Set up the equipment as shown in Figure 7.23. Secure the can to the table with the putty.
4 Copy the results table into your science book.
5. Measure the direct, or straight position.
a) Measure the temperature inside the can and record. b) Turn on the light for 15 minutes. c) Measure the temperature inside the can and record.
6. Repeat steps 5a–5c for two more trials, allowing the can to cool for a few minutes between each trial.
7. Place the whiteboard in front of the lamp and measure the diameter of the beam hitting the board, as shown in Figure 7.24b. Record the result.
8. Rotate the light until it is at an angle of 30° to the can as shown in Figure 7.24c.
9. Repeat steps 5–7 to measure the angled position for both temperature and diameter, as shown in Figure 7.24d.
SAMPLEPAGES
Thermometer Lamp Shade
Figure 7.23 Equipment set-up
Figure 7.24 Equipment set-up with angled light
Results
Table showing temperature change at different angles of light
Dependent variables
Independent variable:
Angle of the light
Straight position
Angled position
Temperature (°C)
InitialFinalChange
Diameter of the beam (cm)
Radius of the beam (cm)
Area of the beam (cm2)
Trial 1
Trial 2
Trial 3
Mean
Trial 1
Trial 2
Trial 3
Mean
1. Add up your three initial temperatures for the straight position, then divide by three. This is the mean.
2. Repeat for the final temperatures and the change in temperature.
3. Repeat for the angled position data.
4. Divide your diameter data by two to calculate the radius.
5. Use this radius data to calculate the area, by using A = πr2 (3.14 × radius2).
Discussion: Analysis
1. Describe the differences between the change in temperature when the lamp is in the straight position and when it is in the angled position.
2. Compare the area of the beam when it is in the straight position to when it is in the angled position.
3. Identify which position simulated the way the Sun hits the South Pole. Explain your reasoning.
Discussion: Evaluation
1. Discuss how much variation was observed between the trials for each position.
2. Identify any other factors (control variables) that may have changed and affected the results.
SAMPLEPAGES
3. Identify any changes that could be made to the method to improve the quality of the data in future experiments.
4. Discuss how the investigation could be extended in future experiments.
Conclusion
1. Draw a conclusion from this experiment about how the angle of light affects the change in temperature, by copying and completing this statement in your science book. From this activity it can be claimed that __________. This is supported by the observations that _____________. Therefore, the hypothesis is/is not supported by these findings.
Try this 7.4 how are the seasons caused?
Create an informative text for a younger audience to show how the tilt of Earth's axis, rotation of Earth on that axis and the revolution of Earth around the Sun cause the seasons.
Explore! 7.4
the celestial emu
The Emu in the Sky, also known as the celestial emu, is a significant constellation in Aboriginal astronomy. Unlike constellations formed by stars, this one is outlined by dark nebulae in the Milky Way, with the Coalsack Nebula near the Southern Cross representing the emu's head. For many Aboriginal groups, including the Kamilaroi and Euahlayi Peoples, the position of the celestial Emu in the Sky signals the emu breeding season and guides the harvesting of emu eggs. When the emu appears clearly at dusk in March and April, it indicates that emu eggs are ready to collect. By June and July, the emu lies horizontally in the sky, meaning the breeding season is over, and most eggs have hatched into chicks. This connection between the stars and the natural world demonstrates the deep understanding Aboriginal Peoples have of the environment and its cycles.
The Emu in the Sky continues to inspire Aboriginal astronomers, like Wiradjuri astrophysicist Kirsten Banks, to share this knowledge through programs such as those at the Sydney Observatory.
SAMPLEPAGES
To explore the celestial emu yourself, you can use planetarium software like Stellarium to track how its position changes throughout the year.
Complete some research to find out about the significance of the Emu in the Sky to the Traditional Custodians of the place where you live.
Explore! 7.5
how do animals adapt to the seasons?
The cycles of animal and plant life follow the seasons.
Flying foxes, short-tailed shearwaters and southern right whales are examples of animals that migrate at different times of the year to find food or to mate. Select one of these species to research and summarise your findings, including a picture and the reason why it hibernates or migrates.
Figure 7.26 Short-tailed shearwaters migrating
Figure 7.27 Southern right whales
Figure 7.25 Wiradjuri astrophysicist Kirsten Banks regularly leads Aboriginal astronomy programs at the Sydney Observatory.
Quick check 7.4
1. Define the terms 'orbit', 'revolution' and 'elliptical' in your own words.
2. State how long it takes Earth to orbit the Sun.
3. Describe things that change during the year due to the seasons.
SAMPLEPAGES
Section 7.2 review
Section 7.2 questions
Remembering
1. State how long a complete cycle of all four seasons takes.
2. Based on your research from this section, name some creatures that are known to migrate with the seasons.
3. State the reason for the seasons on Earth.
4. Construct a diagram to help explain the progression of the seasons. Label each position with the corresponding season.
Understanding
5. Describe how plants and animals act differently in summer than in winter.
6. Describe how the seasons are different in tropical northern Australia.
7. Describe what the effect would be if the angle of tilt of Earth's axis of rotation were increased by 5°.
Applying
8. This table shows hours of daylight in Brisbane on 30 April 2018.
DateSunriseSunsetHours of daylight
30 April6:12 a.m.5:17 p.m.11 h 5 min
Predict whether you expect the number of daylight hours to be more or less than 11 hours 5 minutes on 1 May.
Analysing
9. It is winter in Australia. Infer what months are included in this season.
10. It is winter in China. Infer what months are included in this season.
11. It is autumn in Spain. Infer what months are included in this season.
Evaluating
12. The Sun lights up a tunnel containing a statue of Rameses, a pharaoh of Egypt who died in 1214 BCE, only twice a year. Propose how the Egyptian sculptors working in the tunnel might have seen in the dark to carve a statue of Rameses.
13. The summer solstice is when the Sun reaches its highest point in the sky, and the winter solstice is when the Sun reaches its lowest point in the sky. These are marked by the longest and shortest days respectively. Propose in which months these occur in the southern hemisphere, giving reasons for your answer.
Go online to access the interactive section review and more!
waxing
the period of about two weeks where the illuminated part of the Moon is increasing from a new moon to a full moon
waning the period of about two weeks where the illuminated part of the Moon is decreasing from a full moon to a new moon
synchronous rotation when one rotation of an orbiting body takes the same length of time as its revolution around a larger body
7.3 Movement of the Moon
Learning goals
At the end of this section, I will be able to:
1. Explain the cyclic patterns of lunar phases.
2. Describe how the relative positions of the Moon and the Sun result in tidal variations.
Recall that Earth orbits the Sun because the Sun has a far greater mass. The mass of Earth is 81 times the mass of the Moon and so, for the same reason, the Moon revolves around Earth.
the phases of the Moon
Although the Moon looks bright, it does not give out any light of its own. All the light that comes to us from the Moon is reflected from the Sun. Only the half of the Moon that faces the Sun is bright; the other half is in shadow. The area of the bright side you can see from Earth is the phase of the Moon and it varies in a regular cycle. Figure 7.28 shows the names of the phases of the Moon. Note that between a new moon and a full moon, the Moon is waxing. Between the full moon and a new moon, the Moon is waning.
SAMPLEPAGES
Figure 7.28 The inner part of this diagram shows the Moon's orbit around the Earth, and the outer part shows the phases of the Moon as seen from the southern hemisphere
Have you ever wondered how the Moon keeps the same face towards Earth? Observe the Moon over a period of two weeks. You will see that even though the phase changes, the craters and features on the Moon stay the same.
The reason the Moon always presents the same face to Earth is that it rotates on its axis as well as revolving around Earth. The time taken for it to rotate once is the same as the time it takes to orbit Earth, which is 27.3 days. This is known as synchronous rotation
Quick check 7.5
1. Explain how you can see the Moon if it does not give off any light of its own.
2. Explain why the Moon's surface always looks the same from Earth.
3. Define the terms 'waxing' and 'waning'. the days are getting longer!
Science as a human endeavour 7.1
SAMPLEPAGES
The Moon is moving through space at a speed of one kilometre every second! It used to move much faster and was much closer to Earth. Over millions of years, it has slowly moved away and now moves more slowly around Earth. Scientists study rocks that are millions of years old to understand what Earth was like a long time ago. They have found that when the Moon was a lot closer to Earth, days on Earth were only 18 hours long! The further away the Moon is, the slower Earth rotates. But don't worry, at this rate scientists won't have to recalculate the length of a day for hundreds of millions of years!
Moon orbit versus moon phase
One thing you might notice is that the time the Moon rises and sets is an hour later every day. You might also notice that each day the Moon's phase changes slightly. It takes 29.5 days (hence a month is about 30 days) to complete a cycle of phases from new moon to full moon and back to new moon. Recall that it takes 27.3 days for the Moon to rotate and to orbit once around Earth. Why are they different?
If Earth was not orbiting the Sun, both times would be the same. This means the reason must be related to Earth's movement. A full moon occurs when Earth, the Sun and the Moon form a straight line. After the Moon has completed an orbit 27.3 days later, Earth has moved and the Moon is no longer in line with Earth and the Sun. To form the next full moon and to line up with Earth and the Sun again, the Moon has to keep moving for another 2.2 days.
The position of the Moon after 29.5 days. This is a full moon.
The position of the Moon one orbit later after 27.3 days. This is not a full moon.
Starting position. This is a full moon.
Figure 7.29 The Moon used to be closer to Earth. It is moving away from us at a rate of 3.8 cm per year.
Figure 7.30 The time between full moons and the orbital period of the Moon are different by 2.2 days. It takes the Moon 2.2 days to move from
Explore! 7.6
how many times have astronauts landed on the Moon?
The lunar map in Figure 7.31 shows the face of the Moon with the NASA Apollo and Surveyor and Soviet Luna Moon landings labelled. The first Moon landing was Luna 9 in 1966 and the first crewed landing was Apollo 11 in 1969. Like most maps and pictures of the Moon, the North Pole is at the top.
Investigate the other times astronauts have landed on the Moon. Draw up a timeline to summarise all the landings you find out about. Include details of the date, landing location, country of origin and names of the space shuttles.
SAMPLEPAGES
What does the far side of the Moon look like?
Because the Moon always turns the same face towards Earth, the far side was not seen until spacecraft started to visit the Moon. The first images were seen in 1959 when the Soviet probe Luna 3 sent back pictures to Earth. Over the past 60 years, NASA has sent out many probes to explore the solar system and has obtained clearer images of the far side of the Moon. Detailed maps have now been created of the far side but, as yet, no crewed mission has landed on its surface.
Apollo Surveyor
Figure 7.31 Soviet (red triangles) and US (green and yellow triangles) lunar landing sites
Science as a human endeavour 7.2
far side
the face of the Moon that is always turned away from Earth; also called the dark side
Figure 7.32 (a) The far side of the Moon and (b) the near side (northern hemisphere view). The dark patches visible on the Moon's surface are called seas. They are not made of water but were once liquid, in the form of molten rock or lava that flowed out into low-lying areas on the Moon's surface.
Quick check 7.6
1. Explain how you can tell that the Moon is moving through the sky.
2. State how long it takes to complete a full cycle of the Moon's phases.
3. Describe how scientists know what the far side of the Moon looks like.
Try this 7.5
Modelling the phases of the Moon
Using an electric lamp, an 8 cm polystyrene ball and a pencil, follow the instructions to model the phases of the Moon. Draw diagrams of your observations at each point in the cycle.
SAMPLEPAGES
Be careful
Take care when handling light sources after extended use – they may be hot.
1. Stick the pencil into the foam ball so that the pencil can act as a handle. Place the lamp in the centre of a darkened room.
2. Extend your arm so you are holding the foam ball in front of you. The ball should be between your eyes and the lamp. The foam ball is modelling the Moon, the lamp is the Sun and your head is Earth. Note that the polystyrene ball does not generate light of its own; it reflects light from the lamp.
3. The Moon starts off in a 'new moon' position, as you can only see the unlit side.
4. Sweep your right arm in a clockwise direction to model the waxing moon phases. Move your head to the side to observe these phases. Record what you see in a results table.
5. Once the Moon is behind your head, it will be in the 'full moon' phase unless your head (Earth) is blocking the light and creating a lunar eclipse.
6. Switch the ball to your left hand and continue moving it clockwise back to the start to simulate waning phases of the Moon.
Describe where the ball was in relation to your head when it was at the following phases: new moon, full moon, waxing gibbous, waning gibbous, waxing crescent, waning crescent, first quarter, third quarter. Propose how you could improve this simulation.
the Moon affects the tides
Earth and the Moon orbit each other, spinning around a point between them. This affects the tides in two ways –the force due to gravity pulls Earth (and all the water on it) towards the Moon, and opposing forces pull Earth (and all the water on it) away from the Moon.
At any given time, there are two high tides and two low tides on Earth, but they are constantly changing position as the Moon and Earth rotate around each other. On the side of Earth closest to the Moon, the gravity of the Moon causes the water to bulge towards it – this is a high tide. On the opposite side of Earth, the opposing forces that result from orbiting cause the water to bulge away – this is the second high tide. If there is more water at the bulges, there must be less water elsewhere – so the regions halfway between the high tides experience a low tide (see Figure 7.34).
Figure 7.33 Low tide at Port Campbell, Victoria
Opposing forces push water away from the Moon, due to Earth’s movement.
a b spring tide also known as king tide; when there is the greatest difference between the height of the water at high tide and the height of the water at low tide neap tide when there is the smallest difference between the height of the water at high tide and the height of the water at low tide
Gravity pull here is stronger than on the solid Earth, so, the Moon pulls the water towards it.
High tide
Figure 7.34 High tides are caused by the Moon's gravity and always occur on opposite sides of Earth, which means low tides also occur on opposite sides.
Tide height is also affected by the Sun. The Sun's gravity is stronger than the Moon's, but the Sun is 400 times further away than the Moon. This makes solar tides about half the size of lunar tides.
When Earth, the Moon and the Sun align (during a new moon or a full moon), the gravitational pull of the Moon and the Sun combine to create higher high tides and lower low tides. These are known as spring tides (or king tides). Neap tides, on the other hand, occur when there is the smallest difference between high tide and low tide. This occurs when the Sun is at right angles to the Moon; the tides are weaker as the forces due to the Moon and the Sun are opposite.
Gravitational pull of the Moon Moon
Combined gravitational pull of the Sun and the Moon
SAMPLEPAGES
7.35 (a) Spring (king) tide
Gravitational pull of the Sun
when the Sun and the Moon are in line.
Neap tide occurs when the Sun and the Moon are at right angles.
Try this 7.6
Investigating the tides
In this chapter, we have explored the phases of the Moon and how this affects tides on Earth. Develop a question that can be investigated that explores the relationship between the lunar cycle and the height of tides on Earth. Outline what type of data you could collect to answer your question.
Figure
occurs
(b)
Explore! 7.7
Moon-landing expedition
You are planning a Moon-landing expedition. Astronauts will need to be on the Moon for four days to collect sufficient samples. They need to land on the part of the Moon that is illuminated by the Sun so they can see their surroundings. They will also be communicating with you using radio waves, so their transmitter must be pointed towards Earth.
1. During which phase(s) and where on the Moon would you want to land? Justify your choice using an annotated diagram.
2. You are planning the expedition three years in advance of the launch. Use a lunar calendar on the internet to select some dates when it would be appropriate to launch.
Did you know? 7.7
hunting by the Moon
By carefully observing the phases of the Moon and their connection to tides, Aboriginal and Torres Strait Islander Peoples optimise hunting, fishing and agricultural practices. For example, Yolngu people describe the Moon, Ngalindi, as filling with water as it rises, corresponding to the high tide, and draining as the tides lower. This understanding reflects an advanced grasp of the Moon's gravitational influence on Earth's tides. Similarly, Torres Strait Islander People observe the lunar phases to determine the best fishing times, avoiding spring tides when sediment clouds the water, making fishing less effective. By predicting neap tides, they know when conditions are safe for activities like reef-diving for lobsters. This knowledge illustrates an early understanding of concepts that modern science later formalised, such as the link between the Moon's phases and tidal movements.
Explore! 7.8
tidal warning systems
Sometimes, water levels rise much higher than the normal high tide levels. This is due to a combination of tides and storm surges, where strong winds force water up against the coast. Rising sea levels and increased frequency of severe weather events due to climate change pose a threat to low-lying coastal regions along the Victorian coast. In the future, parts of Port Fairy, Portland, Barwon Heads, Tooradin and Seaspray could be affected by extreme sea levels.
SAMPLEPAGES
A warning system is an example of an emerging information system designed to protect communities. The Australian Warning System is a national approach to information and warnings during emergencies such as bushfire, flood, storm, extreme heat or severe weather. Introduced in 2022, the system uses a nationally consistent set of icons.
Research one of the warning systems used in Australia. Use a collaborative digital tool in your class to brainstorm ideas about how communities can be warned about a disaster. Consider the advantages and disadvantages of warning systems and communication methods. Use the UN Office for Disaster Risk Reduction (UNDRR) Stop Disasters game (www.stopdisastersgame.org) to learn about the risks posed by natural hazards, and the importance of managing resources.
Figure 7.36 Coastal communities are at risk of tidal and storm surges.
Go online to access the interactive section review and more!
Making thinking visible 7.2
Circles of action: Waste management
After every high tide we are reminded of just how badly we have polluted our oceans. Plastic makes up 84 per cent of the rubbish on Australian beaches, with most of that originating from onshore litter.
Use your local council website and find the Waste Management and Recycling page. Consider how your local council has:
• communicated the impact of waste materials on the environment
• encouraged recycling.
Undertake the following Circles of action activity.
What can be done to contribute to waste management:
• among your friends and family?
• in your community (your school, your street)?
• in the world (beyond your local environment)?
Figure 7.37 Kerby is the bin mascot for Macedon Ranges Shire Council's 'Let's Get Sorted' waste and recycling campaign.
The Circles of action thinking routine was developed by Project Zero, a research centre at the Harvard Graduate School of Education.
Section 7.3 review
SAMPLEPAGES
Section 7.3 questions
Remembering
1. State how fast the Moon is moving.
2. State how long the Moon takes to orbit Earth.
3. Name the phases of the Moon.
Understanding
4. Describe the surface of the Moon.
5. Explain why the time taken for the Moon to orbit Earth is different from the time between full moons.
6. Explain why a half-lit moon is called a quarter moon.
7. Explain why the Sun and the Moon appear the same size in the sky.
Applying
8. Illustrate why the Moon takes 27.3 days to orbit Earth and yet there are 29.5 days from one full moon to the next.
9. Explain how it is possible for the Sun's equator to rotate at a different rate than the Sun's polar regions.
Analysing
Use the chart in Figure 7.38 showing the phases of the Moon for 2025 to answer Questions 10, 11 and 12.
10. Describe the phase of the Moon on 6 August 2025.
11. Describe the phase of the Moon on 8 October 2025.
12. The saying 'once in a blue moon' is used when discussing anything that happens rarely. A blue moon occurs if there are two full moons in a month. Analyse Figure 7.38 to see if there were any blue moons in 2025.
13. Compare the speed of the Moon today to the speed it travelled at millions of years ago.
14. Identify the approximate number of weeks from the first quarter phase to the last quarter phase of the Moon.
Evaluating
15. Examine Figure 7.39 to practise reading a tide table.
SAMPLEPAGES
a) Deduce what the following symbols are on the tide table. ●, ◑, ○, ◐
b) Describe the relationship between the lunar cycle and tidal variations.
c) Explain why it may not be the best idea to go to the beach on Wednesday 10 December for a picnic lunch.
d) A teacher is organising a field trip to the beach for students to study rock pools at low tide. The bus will leave school at 7:30 a.m. and it takes two hours to travel. They must leave the beach at 1 p.m. Identify a day that you would recommend to the class to go on their field trip. Justify your answer.
16. Predict how the Moon would look if it had an atmosphere and experienced weather conditions.
Figure 7.38 The lunar calendar for 2025
Figure 7.39 Tidal calendar for Mooloolaba
7.4
Eclipses
Learning goals
At the end of this section, I will be able to:
WORKSHEET Eclipses
solar eclipse
an event when the Sun partly or completely disappears from view, while the Moon moves between it and Earth
lunar eclipse an event when a full Moon becomes dark as it enters Earth's shadow
syzygy the alignment in astronomy of three or more objects in a straight line
total eclipse an event when the Sun is completely blocked by the Moon
umbra
the region in a shadow where the light is completely blocked
partial eclipse an event when the Sun is partially blocked by the Moon
penumbra
the region in a shadow where the light is partially blocked
1. Describe the cause of a solar eclipse and a lunar eclipse.
2. Understand Aboriginal and Torres Strait Islander Peoples' oral traditions and cultural recordings of solar and lunar eclipses.
The motions of Earth around the Sun and the Moon around Earth are complex and require mathematics to describe them precisely. However, they are completely predictable. By looking for patterns in observations made over many years, ancient astronomers could anticipate with reasonable accuracy some of the events you are going to learn about, such as:
• solar eclipses, when the Moon blocks the light from the Sun and casts a shadow on a small part of Earth
• lunar eclipses, when Earth's shadow blocks the light travelling to the Moon.
Solar eclipses
Once a month, in the Moon's orbit around Earth, the Moon moves between the Earth and Sun. There is a chance it may align exactly between Earth and the Sun. If this happens and the Sun, the Moon and Earth all line up, astronomers call it a syzygy and the result is a solar eclipse (see Figure 7.40). Because the Moon is considerably smaller than Earth, a solar eclipse is only visible from a small region on Earth's surface.
SAMPLEPAGES
Figure 7.40 A solar eclipse occurs when the Moon comes between Earth and the Sun. In the diagram, the Moon's shadow on Earth is shaded grey. People in the black spot on Earth would see a total eclipse. People in the surrounding grey circle would see a partial eclipse. This diagram is not to scale and the size of the shadow areas is greatly exaggerated.
Total versus partial eclipse
During a solar eclipse, the Moon blocks the light from the Sun on a small part of Earth's surface. A total eclipse is visible from the dark-coloured central part of the shadow, called the umbra
A partial eclipse occurs when the light from the Sun is partially blocked; it is visible from the area that is lightly shaded on Earth, called the penumbra. Both the umbra and the penumbra are so small that even if there is a solar eclipse, most people won't see it.
Sun
Moon
Earth
Umbra
Penumbra
Science as a human endeavour 7.3
Studying solar eclipses
During a total solar eclipse, the outer atmosphere of the Sun, known as the corona, is visible. Usually, the corona is too faint to see and can only be observed when the Sun's light is blocked. Scientists use an instrument called a coronagraph to study solar wind, a stream of highly charged particles that can affect life on Earth. The temperature of the corona is millions of degrees Celsius, and it can cause solar storms that can damage satellites and affect radio communications and GPS signalling on Earth.
On 8 April 2024, millions of people observed a total solar eclipse in North America. During this eclipse, the Citizen Continental-America Telescopic Eclipse (CATE) experiment engaged members of the community to film a 60-minute movie of the eclipse. Thirty-five teams of citizen scientists were positioned along the eclipse's path, collecting data to gain insight into why the corona is so hot.
SAMPLEPAGES
Measure the distance from Earth to the Moon in Figure 7.43. Multiply the distance by 400 to work out how far away the Sun would be if it were also included in the picture. The distance between Earth and the Sun is known as 1 astronomical unit (1 AU). This avoids having to write the huge numbers required when measuring in kilometres.
Figure 7.44 It might be tempting to think that the Sun is a similar size to Earth because its light can be blocked by the Moon, but the Sun is much larger than Earth. In this image, Earth is placed next to the Sun to show their relative sizes.
Figure 7.41 A total solar eclipse allows the Sun's corona to be studied.
Figure 7.42 People in New York viewing a total solar eclipse on 8 April 2024. Special protective glasses are required when looking at an eclipse.
Figure 7.43 Earth and the Moon drawn to scale. The Sun is 400 times further away from Earth than the Moon.
perigee
the point in the Moon's orbit when it is closest to Earth
apogee
the point in the Moon's orbit when it is furthest from Earth
annular eclipse an event when the Moon blocks the Sun but the Moon is further away and the outer edge of the Sun is still visible
A
Annular eclipses
The Sun is about 400 times bigger than the Moon but it is also 400 times further away. So from Earth, the Moon and the Sun appear to be about the same size. This means that the Moon is just big enough to hide the Sun when it passes in front. However, the orbits of Earth and the Moon are not perfect circles and the Moon's apparent size can vary by up to 12 per cent in its orbit around Earth.
If a solar eclipse occurs when the Moon is closest to Earth (perigee), the result is a total eclipse. If the Moon is at its furthest point (apogee), the result is an annular eclipse (see Figure 7.47). The mathematical word for the shape you get when you cut a small circle from the centre of a larger circle is an annulus, so this type of eclipse is called an annular eclipse.
SAMPLEPAGES
Figure 7.47 If the Moon is not at its closest to Earth at the time of the eclipse, the result is an annular eclipse. In this diagram, the Moon's shadow on Earth is shaded grey. People in the black area would experience an annular eclipse. People in the surrounding grey circle would see a partial solar eclipse. The diagram is not to scale.
Sun Moon
Earth
Figure 7.48 An annular solar eclipse seen through a cloud
Figure 7.46 (a) A series of images showing the stages of a total solar eclipse, and (b) totality
Figure 7.45
solar eclipse photographed from the International Space Station. The Moon's shadow covers only a small fraction of Earth's surface.
Quick check 7.7
1. Define the term 'syzygy'.
2. Explain why a solar eclipse is visible from only a small part of Earth.
3. Explain the difference between a total and partial solar eclipse.
SAMPLEPAGES
Explore! 7.9
aboriginal and torres Strait Islander stories of the Sun and the Moon
In many Aboriginal and Torres Strait Islander cultures, the Sun and the Moon are often described as ancestral spirits with unique roles and responsibilities. The Sun is often seen as a matriarchal spirit, bringing warmth, light and life to the world. She plays a nurturing role, caring for the land, the animals and the people. The Moon, on the other hand, is often seen as a patriarchal spirit, representing cycles, change and renewal, like the phases of the Moon and the tides.
In Euahlayi culture, the Sun, Yhi, is a matriarchal spirit who chases Bahloo, the patriarchal Moon spirit, across the sky. Yhi's life-giving role contrasts with Bahloo's role as a spirit of change and renewal. Their movements sometimes cause eclipses, showing the balance between light and dark.
Research the oral traditions of solar and lunar eclipses in the following Aboriginal and Torres Strait Islander Peoples. Compare and contrast these oral traditions with current understandings.
1. The Lardil of Mornington Island
2. The Yolngu people of Elcho Island in Arnhem Land
3. The Wirangu of South Australia
lunar eclipses
About once a month, the Earth moves between the Moon and Sun. Most of the time the three bodies don't line up exactly but when they do, a lunar eclipse occurs as the Moon moves into Earth's shadow (see Figure 7.49). When the Moon is completely in Earth's shadow during a total lunar eclipse it is called a blood moon. This name refers to the red colour we see (see Figure 7.51), which is due to red light being refracted (bent) by the atmosphere around Earth. Hence, only red light reaches Earth during the total eclipse.
The region of Earth’s shadow is shaded grey. During a total eclipse the entire Moon is in Earth’s shadow.
Sun
Moon
Earth
Figure 7.49 Earth is much bigger than the Moon, so Earth's shadow is big enough to cover the whole of the Moon.
blood moon a name given to the Moon during an eclipse while it is completely in Earth's shadow
Comparison of solar and lunar eclipses
Although the Sun and the Moon are involved in both kinds of eclipses, solar and lunar eclipses are very different (see Table 7.1). A solar eclipse is a rare event and results in the sky turning dark during the day, whereas a total lunar eclipse happens when the sun has set and results in the full moon moving into Earth's shadow.
Total solar eclipse
DurationA few minutes
Who can see itA small area only
OccurrenceOnce every 18 months
Safety
Total lunar eclipse
A few hours
Everyone on Earth's night side
1–2 per year
Special equipment required to viewSafe, no special equipment required
Cause The Moon's shadow on EarthEarth's shadow on the Moon
Moon phaseNew moon
Table 7.1 Differences between solar and lunar eclipses
Section 7.4 review
Go online to access the interactive section review and more!
SAMPLEPAGES
Full moon
Section 7.4 questions
Remembering
1. Recall the phase of the Moon when a lunar eclipse occurs.
2. Recall the phase of the Moon when a solar eclipse occurs.
Understanding
3. Describe how solar and lunar eclipses are created.
4. Explain why a person is likely to see many more lunar eclipses in their lifetime than solar eclipses, even though both events occur with similar frequency.
Applying
5. Describe how our experiences on Earth would be different if the Moon was larger.
Analysing
6. Compare a partial and a total solar eclipse.
Evaluating
7. Propose why eclipses are fairly rare.
8. Discuss the factors that need to be considered when viewing solar eclipses and lunar eclipses.
Figure 7.50 A total lunar eclipse in progress. The round edge of Earth's shadow is visible.
Figure 7.51 A blood moon, during a total lunar eclipse
Chapter review
Chapter checklist
Success criteria Linked questions
7.1 I can describe the effect of Earth's rotation on temperature and time zones. 5, 8, 14, 19
7.1 I can state the rotation times for Earth, the Moon and the Sun.1, 4, 9, 15
7.2 I can recognise that gravity keeps planets in orbit around the Sun.2
7.2 I can describe the cause of seasons in different regions on Earth.17, 19
7.2 I can recognise how Aboriginal and Torres Strait Islander Peoples' calendars can be used to predict seasonal changes. 6
7.3 I can explain the cyclic patterns of lunar phases. 10, 12
7.3 I can describe how the relative positions of the Moon and the Sun result in tidal variations. 11
7.4 I can describe the cause of a solar and a lunar eclipse. 7, 13, 18
7.4 I can understand Aboriginal and Torres Strait Islander Peoples' oral traditions and cultural recordings of solar and lunar eclipses. 3
SAMPLEPAGES
Review questions
Remembering
1. Recall the approximate number of times Earth spins in one month.
2. Recall what keeps planets in orbit around the Sun.
3. Recall what the Sun and Moon are considered as in many Aboriginal and Torres Strait Islander cultures.
4. Recall the approximate number of complete phase cycles of the Moon in one year.
5. State whether the Sun rises first in Brisbane, Sydney, Melbourne or Perth, and why.
6. State the number of distinct seasons according to the Wurundjeri peoples of Victoria.
7. State the cause of a solar eclipse.
Understanding
8. Describe two reasons why the average winter temperature is higher in Brisbane than in Melbourne.
9. Explain why it is difficult to specify the time the Sun takes to rotate.
10. The Moon doesn't emit its own light. Explain how we can see different phases of the Moon.
11. Explain what causes a spring (king) tide.
Applying
12. Explain why an eclipse can never occur during a quarter moon.
13. The Moon is slowly moving away from Earth. Create a diagram to illustrate why total solar eclipses will become less likely in the future.
14. It is dark in Brisbane and daylight in Perth. Determine whether it is morning or evening.
Analysing
SAMPLEPAGES
15. Contrast the time taken for Earth to orbit the Sun with how long it takes the Moon to orbit Earth.
16. Seasons have been observed on Mars. The Martian polar ice caps, as in Figure 7.52, have been seen to grow and shrink with the changing temperature in a similar way to Earth's polar ice caps. What can you infer about the angle of tilt of the axis of rotation of Mars?
Evaluating
17. Discuss whether places near the equator experience seasons.
18. Discuss whether a solar eclipse and a lunar eclipse could occur in the same month.
19. Predict how the seasons and hours of daylight at different locations on Earth would be different from now, if Earth's axis did not have a tilt.
20. Predict what the night sky would look like on Saturn, which has 62 moons.
Figure 7.52 A polar ice cap on Mars
Data questions
Just like Earth's moon, there are moons that orbit the planet Jupiter. In fact, Jupiter has at least 95 known moons! These vary in size and distance from the planet. The eight innermost moons and the time it takes them to complete one orbit are shown in Figure 7.53.
SAMPLEPAGES
Figure 7.53 Orbital period of Jupiter's inner and Galilean moons
Applying
1. Identify which of the moons in Figure 7.53 orbits furthest in distance from Jupiter.
2. Use the data to determine which moon takes approximately 1.8 days to complete a full orbit of Jupiter.
3. Adrastea has an orbit time of 0.3 days, whereas Amalthea has an orbit time of 0.5 days. Calculate the difference in the number of hours it takes these moons to orbit Jupiter.
Analysing
4. Galileo Galilei first discovered the four largest of Jupiter's moons in the 17th century, when he saw them through a telescope. These moons have an average orbit distance of 0.3 to 2 million km from Jupiter. Categorise the moons in Figure 7.53 as 'Galilean' or 'inner orbiting' (for those that orbit at distances other than 0.3 to 2 million km).
5. Distinguish the Galilean moons from the inner orbiting moons by referring to their possible size.
6. Identify the trend in the average distance of a moon from Jupiter and the time it takes for the moon to complete a full orbit of Jupiter.
Evaluating
7. Jupiter's ninth moon is called Thermisto, and its average distance from Jupiter is approximately 7.3 million km. A student has estimated, based on the trend in Figure 7.53, that the orbital period for Thermisto would be approximately 20 days. Use the data to deduce whether this is an accurate estimate.
8. Earth's moon has an average distance from Earth of approximately 0.4 million km and an orbit period of 27.32 days. Compare this data to the data provided in Figure 7.53 for the moons of Jupiter. Does Earth's moon orbit period fit the trend identified in Question 6?
9. Justify your response to Question 8 with an appropriate scientific explanation.
StEM activity: Simulating the orbit of planets in the inner solar system
Background information
SAMPLEPAGES
Have you ever wondered why Earth or other planets do not go flying off into outer space? Or how large bodies (planets!) have followed the Sun across the emptiness of space for billions of years? This is the best explanation scientists have come up with so far: gravitational forces. You will learn more about gravity in Chapter 8.
Gravitational forces operate in a very interesting way. The larger an object, the more gravitational pull it has. So, in the case of our solar system, our Sun (the most massive object in this system) has a powerful gravitational attraction for all the other objects in the solar system. In other words, all objects within the solar system are under the gravitational attraction of the Sun.
On Earth, the gravitational force pulls objects towards the centre of the planet. In other words, objects (including you) are always falling to the ground. So why aren't Earth and the other planets falling into the Sun?
In fact, they are indeed falling, because the Sun's gravity pulls them towards it. But the planets were created in a vast rotating cloud of dust and have a huge amount of momentum directed in a straight line into deep space. The Sun's pull is always towards the centre, meaning the planets move in a curved path around the Sun, always falling towards it, but never reaching it. The closer a planet is to the Sun, the faster it needs to travel to prevent gravity pulling it into the Sun.
DESIGN BRIEF
Create a simulation of the solar system planets orbiting the Sun
activity instructions
In this task, you will investigate how Kepler's laws of orbital motion explain why different planets orbit our Sun at different speeds. Kepler's laws of orbital motion can be summarised as:
A planet's orbital speed changes, depending on how far it is from the Sun. The closer a planet is to the Sun, the stronger the Sun's gravitational pull on it, and the faster the planet moves.
We can observe the effects of Kepler's laws within our own solar system right now. Table 7.2 shows the relationship between distance and orbit of the planets Mercury, Venus, Earth and Mars.
Table 7.2 Distance and orbital period of planets in the inner solar system
Your task is to use Microsoft PowerPoint to create your own simulation of the solar system (like the one shown in Figure 7.54), and to gain a visual understanding of how Kepler's laws of orbital motion apply to planets orbiting the Sun.
Suggested materials
• laptop
• Microsoft PowerPoint
• paper and pencil to do simple calculations
Research and feasibility
1. Research our solar system, the names of the planets, their orbiting speed and distance from the Sun.
Design
SAMPLEPAGES
2. Create a labelled model of the solar system. Include planet names, their orbital speeds and each planet's distance from the Sun.
Create
3. Use Microsoft PowerPoint to create your model.
4. Microsoft PowerPoint has given all planets within the inner solar system the same orbital period (2 seconds). However, you know that planets closer to the Sun (e.g. Mercury) have shorter orbital periods than planets further away (e.g. Saturn). Therefore, you should make changes to your simulation to make it behave as closely as possible to the real solar system.
5. Assuming that, on your model, Mercury orbits your Sun in 2 seconds (orbital period = 88 days), estimate the number of seconds required for Venus (orbital period = 225 days) and Earth (orbital period = 365 days) to do so. After you finish your estimation, you can change the values (seconds) to make your simulation more realistic.
Evaluate and modify
6. Discuss with your group the challenges you have encountered throughout this project. List the strategies or actions that allowed you to overcome these challenges.
7. Reflection is an integral and vital aspect of any project in the real world. In your honest opinion, list what you would like to have included, removed or modified from this challenge as well as ways to improve the way we visualise our solar system.
Extension
Planets in our solar system orbit the Sun like clockwork. For example, Mercury always orbits the Sun in around 88 days, while Earth takes around 365 days to complete one orbit; this is due to the distance between the Sun and the planets (i.e. the closer they are to the Sun, the shorter the time it takes them to complete one revolution).
Now imagine the following scenario: scientists have just released the news that the mass of our Sun has shrunk by half, while the distance between the Sun and the planets remains the same. The scientific community would be worried about this development, because the Sun is at the centre of our solar system. Predict, using your own words and by reading the definition of Kepler's laws, whether the orbital period of the planets would change in this new hypothetical scenario.
Now consider creating a model of the Sun–Earth–Moon system using Microsoft PowerPoint. Could you use your new skills to simulate a solar or lunar eclipse?
Figure 7.54 Model of the solar system
Chapter 8 Forces
SAMPLEPAGES
Introduction
Whether you are walking, running, sitting in a vehicle, riding a bike or sleeping, forces are acting on you all the time. At school, forces are at work when you pick up a book, write a sentence or open a lunchbox. When you are standing perfectly still, forces act on you to make sure you don't fall through the floor or fly up into the sky. In this chapter, you will explore how to measure and identify forces around you. You will discover how forces can be added together, or cancel each other out. In the final part of the chapter, you will learn about gravity and how Earth's gravity determines the orbit of the Moon.
There
Concept map
SAMPLEPAGES
A force is a push or a pull
Section 8.1
Section 8.2
Section 8.3
Types of forces Gravitational
Non-contact
Curriculum content
balanced and unbalanced forces acting on objects, including gravitational force, may be investigated and represented using force diagrams; changes in an object's motion can be related to its mass and the magnitude and direction of the forces acting on it (VC2S8U14)
• investigating the effects of applying different forces to familiar objects of the same mass and different masses
SAMPLEPAGES
• analysing the effect of balanced and unbalanced forces on an object's motion, such as starting, stopping and changing direction
• measuring the magnitude of a force using a force meter, and representing the magnitude and direction of forces acting on an object using force diagrams
• investigating how Earth's gravitational force is the attractive force that pulls objects towards the centre of Earth and how its magnitude is related to the mass of an object
• examining how gravity affects objects in space, including moons, planets, stars, galaxies and black holes
• analysing the forces acting on boomerangs and how early Aboriginal and/or Torres Strait Islander Peoples designed an air-foil profile that could be varied and had several applications
scientific knowledge, including models and theories, can change because of new evidence (VC2S8H01)
• investigating how aeronautical engineers' understanding of the nature of the forces acting in flight has led to changes in the design of aircraft
multidisciplinary endeavours to advance scientific knowledge make use of people's different perspectives and worldviews (VC2S8H02)
• exploring how the personal beliefs and ethical positions of a scientist may influence the questions the scientist chooses to pursue and how they investigate those questions, such as the political views of geneticist Richard Levins, who chose to focus on population ecology, or those of physicist Joseph Rotblat, who refused to work on science that might lead to development of an atomic bomb
• researching how David Unaipon, a Ngarrindjeri man from the Coorong region of South Australia, used his cultural knowledge and understanding of the aerodynamic properties of boomerangs to conceptualise a vertical lift flying machine in 1914 8.2
1. Recall the term 'force' and describe how forces are measured.
2. Describe the impact of balanced and unbalanced forces on an object.
3. Draw a force arrow diagram to indicate forces acting on an object.
SAMPLEPAGES
A force acts on an object whenever something is given a push or a pull. Forces are constantly acting on you, and you constantly apply forces to other objects. For example, pressing piano keys, passing a rugby ball, riding the bus and sitting in a chair all involve forces at work. In the human body, muscles apply force when body parts move. In nature, the forces from the flap of a bird's wings allow it to soar in the air, the sweep of a dolphin's tail moves it through the water, and a frog can push on the ground with its legs in order to jump.
Making thinking visible 8.1
elaboration game: Forces in action
The drawing in Figure 8.1 illustrates many forces in action! In pairs, observe and describe specific forces demonstrated in the drawing.
1. One person in the pair identifies an action occurring in the drawing. The other person in the pair then expands on the first person's observation by adding more detail about how a force (a push or a pull) is present.
2. Repeat the game by identifying more actions taking place in the drawing. Take turns observing and elaborating until at least five actions have been observed.
Figure 8.1 Having fun in the park means many forces are in action.
The Elaboration game thinking routine was developed by Project Zero, a research centre at the Harvard Graduate School of Education.
VIDEO Contact and non-contact forces
Table 8.1 gives a summary of some forces and associated terms.
Contact or non-contact
Contact forces
newton the unit of force; one newton is roughly equal to the force you need to keep an apple from falling force meter a piece of equipment that measures force in newtons (N)
gravity a non-contact force describing the pull of any object with mass
weight the force of gravity on an object; it is measured in newtons and changes in space
Non-contact forces (acting at a distance)
Type of force
Description
PushOne object moves (or tries to move) another object, which it is touching, away from itself.
Pull One object moves (or tries to move) another object, which it is attached to, towards itself.
Example
Pushing a trolley
SAMPLEPAGES
Pulling on a lead to move your dog
ImpactThe force of one object hitting anotherAction of a cricket bat on a ball
FrictionThe force between two things rubbing together that makes them (or tries to make them) slow down relative to each other
GravitationalThe apparent force of attraction between two objects that have mass
MagneticThe attraction or repulsion between magnetic materials and/or moving objects with an electric charge
ElectrostaticThe attraction or repulsion of objects that have an electric charge
Table 8.1 Forces summary
Measuring forces
Forces are measured using a unit called the newton (N). One newton is approximately the force you need to keep a 102 g apple from falling to the ground.
A spring is a useful tool to measure a pulling force because it can be extended when a force pulls on it, and retracts to its starting position when the force is released. In your class, you may use an instrument called a spring balance or newton meter, which uses a spring to measure a pulling force. In this chapter, this piece of equipment will be called a 'force meter' to describe all the different types of meters used. The larger the force being measured, the larger the spring in the force meter will need to be.
At home you have probably used bathroom scales or kitchen scales to measure a force due to gravity, which is often called weight.
Figure 8.2 A force meter can be used to measure a pulling force such as the weight of an object hanging from it. For some scales, you would need to convert kilograms to newtons to obtain the weight.
Brake pads rubbing on the wheel of a bike
The force that keeps you on the ground
A magnet picking up bits of iron
Attraction of pieces of paper to a rubbed balloon
Weight is commonly confused with mass in this context, as household scales give a number in kilograms (kg), which is the unit of mass. An object's mass is related to the amount of material that it contains, measured in grams (g) or kilograms (kg), and it is the same everywhere in the universe. Its weight, on the other hand, depends on its mass and the strength of gravity at its location. The weight of an object is the pulling force of gravity, commonly measured in newtons (N), whether it is falling or pressing down on the surface it is resting on. Household scales actually calculate the weight force, in newtons, acting on the equipment, and convert it to a mass in grams or kilograms.
On the surface of Earth, the force due to gravity is equal to 9.8 newtons per kilogram, or N/kg. So an object with a mass of 1 kilogram (kg) has a weight of about 9.8 newtons (N). If a force meter is labelled in N, it can also be used to measure mass in kilograms, approximately, with a conversion rate of 1 N = 0.102 kg. Thus, household scales can approximate a force acting on them using a conversion of 1 kg = 9.8 N. For example, if a 4 kg cat stood on a bathroom scale, its weight could be calculated as: 4 × 9.8 = 39.2 N.
SAMPLEPAGES
Using a force meter
Aim
To measure the force required to undertake some common actions.
Materials
• a range of force meters (e.g. 1 N, 5 N, 10 N, 50 N)
Method
1. Copy the results table into your science book.
2. Determine the force needed to complete the actions in the table.
Results
Table showing force required to move common objects
Action
Hold your pencil case
Drag this textbook across the table
Remove a piece of sticky tape from your desk
Open the lab door
Drag your school bag across the floor
Hold your school bag
Discussion: Analysis
Force required (N)
1. State whether the forces applied to the items are push or pull forces.
2. Calculate the mass of your pencil case in kilograms by dividing its weight in newtons by 9.8.
3. Sequence the items in order from most to least force required to drag them.
4. Explain why the same force meter could not be used for all the actions.
Conclusion
1. Write a sentence summarising what you have observed about the force required to undertake some common actions.
Practical 8.1
force arrow diagram a drawing showing the direction and size of forces acting on an object using arrows tension the force in a wire, cable or string when being stretched balanced forces forces of the same size but acting in opposite directions unbalanced forces a combination of one or more forces that has an overall effect, and which changes an object's motion
Force arrow diagrams
The direction and size of forces acting on an object can be illustrated by drawing a force arrow diagram. For example, look at the image of a hanging plant held by a hook in Figure 8.3. The plant is being pulled down due to the force of gravity, and the length of the arrow on the diagram represents the size of this force. What stops the plant from falling is a force called tension, which comes from the chain. The size of the tension force must be the same as that of gravity, and work in the opposite direction, to hold the plant in place. In other words, the forces of gravity and tension are equal and opposite, so they are balanced. When the forces acting on an object are balanced, the object will either remain stationary or move at a constant speed. On the diagram, the arrow for the tension force is drawn the same size as the arrow for gravity, but pointing up.
Interactions of forces
Forces can interact to work together, or cancel each other out. Imagine you are trying to push a car on your own. It probably won't move. But when a group of people come to help you push the car, the combined forces work together and overcome the friction forces holding the car in place. On a force arrow diagram, the push forces of each person are added up and can be shown by one force arrow with a length equal to the total length of the individual force arrows (see Figure 8.4).
SAMPLEPAGES
8.4 Friends combine forces to push a car at the beach (blue arrow). The combined pushing force is larger than the friction force (red arrow), so the car will start to move.
Successfully pushing a car is an example of forces that are unbalanced, meaning that one is bigger than another. Unbalanced forces cause a change in movement. This change in movement can be seen as something slowing down, speeding up, changing direction, changing shape or rotating. On the other hand, in a tug-of-war or rugby scrum, the two teams apply forces in opposite directions (see Figure 8.5). If the forces are equal in size, there will be no change in the movement. Equal and opposite forces are said to be balanced.
Figure 8.3 The tension in the chain pulling up (red) balances the pull down (blue) of the plant due to gravity.
Figure
SAMPLEPAGES
1. Define the following key terms in your own words: force, newton, balanced, unbalanced.
2. Identify which of the following activities use a push force and which use a pull force.
a) Catching a fish on a fishing rod
b) Holding your dog from running off on a lead
c) Cutting up salad vegetables for lunch
d) Writing in your exercise book
e) Typing on your computer
f) Lifting a heavy school bag
g) Passing a rugby ball
h) Strumming a guitar
3. Explain how a spring can be useful for measuring force.
4. Match each force to its approximate value if they are measured on Earth.
Weight of an apple
700 N
Weight of a car 1 N
Weight of an adult 100 N
Weight of a small dog
5. The hiker in Figure 8.6 exerts an upward force on his bag when he carries it, while the downward force is gravity.
a) Decide whether these forces are acting together or working against each other.
b) Communicate your answer to part a by drawing and labelling force arrows for this scenario.
N
Figure 8.5 This tug-of-war doesn't move if the forces on each side of the rope are balanced.
Quick check 8.1
Figure 8.6 A hiker on Mount William carrying a backpack while overlooking Gariwerd/Grampians National Park
WIDGET Fly a helicopter rotate to turn or spin on an axis
normal force the force that prevents solid objects from passing through each other, sometimes called the support force buoyancy the upward force experienced by an object that is partially or fully submerged in a liquid or a gas
applying a force
Applying a force to an object often changes the motion of the object, but this is not always the case. There are four main results of applying a force to an object, depending on whether the forces are balanced or unbalanced.
1. A force can balance another force so there is no change in the object's motion.
2. A force can change the object's speed to make it go faster or slower.
3. A force can make the object change its direction of motion or rotate.
4. A force can change the object's shape by moulding, bending, stretching or breaking it.
SAMPLEPAGES
1. A force can balance another force
Forces may act on an object in opposite directions with equal magnitude and thus cancel one another. In these cases, the forces acting an an object are balanced, and there will be no overall effect on the object's motion. So if the object was stationary (not moving), it will continue to be stationary when balanced forces are applied. If the object was moving, it will continue to move in the same direction at the same speed when balanced forces are applied. Let's look at a few real-world examples.
What forces act on a pencil case when it is resting on a surface, such as a desk? The weight of the pencil case is balanced by the desk pushing up on it (see Figure 8.7). This force is equal and opposite to the weight, so they are balanced. If the pull of the pencil case's weight downwards due to gravity was bigger than the upward push of the desk, the pencil case would fall through the desk. What would happen if the desk pushed up more than the pencil case is pulled down?
The force of the table surface pushing up against the pencil case is often referred to as the normal force or 'support force'. This type of force is used to describe the force of any surface that supports a resting mass.
An object floating in water, like the ball in Figure 8.8, has an upwards force called buoyancy (buoyant force) that balances the pull of gravity downwards on the ball (its weight force). Consider what would happen if the weight force was larger than the buoyant force.
Figure 8.7 The weight force of the pencil case (blue) is pulling down towards Earth due to gravity. This is balanced by the normal force of the desk pushing up at it (red).
Figure 8.8 The weight of the ball (blue) is balanced by the buoyant force of the water (red).
Try this 8.1 observing forces
Use the materials listed below to do the tasks listed in the table.
• Rubber band
• Lump of modelling clay
• Tennis ball
• Bar magnet
• Paperclip
• Inflated balloon
• Plastic counter
Draw up the table in your book and record your observations.
Table showing observations from applying forces to common objects
Observations
SAMPLEPAGES
Task
Stretch the rubber band.
Squash a lump of modelling clay.
Drop a tennis ball and catch it when it bounces.
Bring a bar magnet close to the paperclip.
Use your hands to compress an inflated balloon (be careful not to pop it).
Rub an inflated balloon against your head and then hold it near your hair.
Use your fingers to flick a plastic counter across a table.
Try this 8.2 balancing rock
Change in motion or shape Force that caused the change
This rock formation is known as Balancing Rock and is a geological formation in Chillagoe, Queensland.
1. If these are two rocks, identify where the forces are acting.
2. Are the forces balanced or unbalanced?
3. What is the evidence that allowed you to come to this conclusion?
Figure 8.9 Balancing Rock, Chillagoe, Queensland
air resistance the frictional force of the air, a common example of a drag force
friction a contact force opposing motion due to the interaction between two surfaces
net force the sum of all forces acting on an object
drag the frictional force of a liquid or gas
So far, we have looked at examples where balanced forces act on stationary objects to keep them stationary. Balanced forces can also act on moving objects. For example, if a car is travelling at a constant speed in a straight line on a flat road, there are four main forces that act on it as it moves.
The force of the road against the wheels pushes the car forward, while air resistance and a force called friction pull it against the direction of motion, balancing the forwards force. The weight force of the car pulls it down and the road surface pushes it back up with a normal force, balancing the weight force. The car will continue to travel at a constant speed, neither speeding up nor slowing down, as all forces are balanced (see Figure 8.10). The overall force on an object is called the net force. In this case, the forces are balanced and the car has no net force and will travel at a constant speed. If the car was to speed up, slow down, stop or change direction, this would require a non-zero net force, resulting in unbalanced forces acting on the car.
The same could be true of a sailboat gliding through the water in a race. The continuous force of the wind on its sail pushes the sailboat forward, while the drag force of the water balances the forward force, pulling the sailboat backwards and so it travels at a constant speed (see Figure 8.11).
Quick check 8.2
1. A skydiver jumps from a plane and falls towards Earth at an increasing speed for the first 10 seconds. Decide whether the forces on the skydiver in the first 10 seconds are balanced or unbalanced.
2. A drone is hovering in the sky without moving. Its weight is pulling it down and the force of its rotors is pushing it upwards. Decide whether these two forces are balanced.
3. A swimmer is racing from one end of the pool to the other at a constant speed. Describe the forces acting on the swimmer, and whether the forces are balanced or unbalanced.
SAMPLEPAGES
4. Draw a sailing boat, like the one in Figure 8.11, which is changing its speed and going faster as the wind blows harder. Add force arrows to your drawing for the force of the wind pushing it along, the drag of the water, the weight of the boat and the buoyancy.
2. A force can change an object's speed
impact force a contact force that sometimes only lasts for a short time; impact forces often change an object's speed
When a sudden impact causes an imbalance of forces, there can be a change to an object's speed. Consider a golf club hitting a stationary golf ball. There will be an almost immediate change in the speed of the golf ball on impact, and this type of force is thus called an impact force. This type of force is present in many sports including tennis, badminton, hockey, baseball and cricket.
Figure 8.10 When the forces on the car are balanced, the car travels at a constant speed.
Friction and air resistance
Force of the road on the wheels
force
Figure 8.11 When the force of the wind on the sail balances the drag force through the water, a sailboat moves at a constant speed.
Impact forces can also make objects move more slowly. Consider a moving car that crashes into a wall. It will decelerate (lose speed) very quickly on impact.
A more gradual speed change occurs when a car applies its brakes. The brake pads apply friction to the moving wheels with enough force to slow down the moving vehicle. The engine is no longer applying forward force to the wheels, so the frictional force of the road on the wheels is now against the motion and decelerates the car with enough force to eventually stop the car.
3. A force can make an object change its direction or rotate
As well as changing the speed of an object, unbalanced forces can make objects change direction or rotate. Turning forces are used frequently on everyday objects including a vehicle steering wheel, household taps and door handles, and tools such as screwdrivers and drills.
SAMPLEPAGES
turning force a force that increases or decreases an object's rate of rotation
Turning forces can certainly change the direction of an object; however, they are not the only way to change the direction of an object. Consider a soccer ball being kicked at a wall: what would the outcome be? Figure 8.16 illustrates how a wall will exert an impact force that changes the direction of a ball. There are many sports where you can see a force change the direction of an object such as a ball.
Before impactDuring impactAfter impact
Figure 8.16 When a ball directly hits a wall, the direction of the rebound will be in the opposite direction to the initial direction. The green arrows indicate the direction of the ball, and the red arrow represents the force of the wall on the ball.
Figure 8.12 (a) The force of the golf club changes the speed of the golf ball from zero to extremely fast in a matter of milliseconds. (b) A moving car loses speed very quickly when it crashes.
Figure 8.13 The force of your hand results in the top of the tap rotating.
Figure 8.14 In the workshop, screwdrivers and drills require a force to make them turn.
Figure 8.15 In the kitchen, a food mixer uses turning forces.
mouldable soft enough to be shaped
brittle likely to break or snap when subject to a large enough force
elastic bends, stretches or compresses when a force is exerted on it; the material exerts elastic spring force when this happens
Quick check 8.3
1. Name some sports where a force can change the speed of an object or a person.
2. Name some sports where a force can change the direction of an object or a person.
3. Name some sports where a force can change the rotation of an object or a person.
4. Explain whether it is possible for an object to speed up or change direction without a net force.
5. Decide whether two forces that act together to speed up, slow down or change the direction of an object must be balanced or unbalanced.
4. A force can change an object's shape by moulding, bending, stretching or breaking it
When bread or pasta is made by hand, forces are used to mix the ingredients and to mould the dough into a new shape. Similarly, potters use forces to mould clay spinning on a wheel to create bowls. In these examples, the material is soft and is easily moulded into a new shape. Another common example of this is plasticine or modelling clay, which children use to mould shapes with the force of their hands. A material that can be moulded easily is described as mouldable
Not all objects are considered mouldable. Those that break or shatter instead of bending or stretching are described as brittle. If a large enough force is applied to brittle objects, such as glass or fired clay, they will break into fragments.
Elastic materials stretch or bend when a force is applied and then return to their original shape when the force is removed. Elastic materials can also exert a force of their own, called an elastic spring force, when their shape is changed. Objects that exert an elastic spring force include metal springs and elastic bands (see Figure 8.21).
SAMPLEPAGES
Figure 8.17 Dough is moulded when making pasta or bread.
Figure 8.18 Potters use a wheel to spin clay as they shape it to form a bowl.
Figure 8.19 Glass can shatter if a large force is applied.
Figure 8.20 Once clay has been fired in a kiln, it becomes very brittle.
Figure 8.21 The spring on this park ride exerts an elastic spring force when moved from its original position.
Investigating forces
Aim
To measure some everyday forces.
Materials
• a range of force meters (e.g. 1 N, 5 N, 10 N, 50 N)
SAMPLEPAGES
• a selection of masses (e.g. 10 g, 20 g, 50 g, 100 g, 1 kg, 2 kg)
Method
1. Identify the independent variable.
2. Identify the dependent variable.
3. Develop a hypothesis by predicting how a change in the mass will affect the dependent variable.
4. Identify the controlled variables and describe how these will be managed.
5. Copy the results table into your science book.
6. Record the masses you have selected in the first column.
7. Hook each mass onto an appropriately scaled force meter and measure the force required to hang (suspend) it against gravity. Record the measurement in your results table.
8. Place each mass on a bench, attach a force meter near the base and drag each mass along the bench steadily at the same constant speed. Record the force reading when the mass is moving at a steady rate. Write it in your results table.
Results
Table showing force required to move different masses
Mass (g)
Force required to suspend the mass (N)
Force required to drag mass at constant speed (N)
1. Plot a graph showing the relationship between mass and the force required to suspend it. Draw a single straight line so that it best fits through the average line of all the data points.
2. Plot another graph showing the relationship between mass and the force required to drag the mass at a constant speed. Again, draw a line of best fit for your data points.
Discussion: Analysis
1. Identify the relationship between mass and the force required to suspend it.
2. Identify the trend in your second graph.
3. Identify any outliers in your second graph.
4. Extrapolate your second graph to find out how much force would be required to drag a 4 kg mass at the same constant speed you used previously.
Discussion: Evaluation
1. If you had any outliers, explain how these may have been caused.
Conclusion
1. Draw a conclusion from this experiment about the relationship between mass and the force required to suspend it, by copying and completing this statement in your science book. From this activity it can be claimed that __________. This is supported by the observations that _____________. Therefore, the hypothesis is/is not supported by these findings.
Go online to access the interactive section review and more!
Quick check 8.4
Match each word to its correct description.
1. Brittle A. Can be stretched but always returns to its original shape when the force is removed
2. Elastic B. Can be made into a new shape
3. Mouldable C. Breaks into pieces when a large enough force is applied
Section 8.1 review
SAMPLEPAGES
Section 8.1 questions
Remembering
1. State the name that describes two forces that cancel each other's effect.
2. Name one body component that can exert a force.
3. Identify four examples of impact forces.
4. List the things that forces can do to an object.
5. List the features of balanced and unbalanced forces. Include an example where possible.
6. Identify an everyday example of each of the following results that forces can cause.
a) No change in motion
b) Speeding up of object
c) Slowing down of object
d) Rotating of object
e) Changing direction of object
f) Changing shape of object
7. Name an example from everyday life for each of the following types of force.
a) A force that changes the motion of an object
b) A force that changes the shape of something
c) A force that stretches or bends something
8. Name examples of materials that are:
a) able to be moulded
b) brittle
c) elastic.
Understanding
9. If a motor boat is travelling at a constant speed in a straight line on the water, what can you infer about the drag and the force of the engine?
10. Explain whether water can exert a force.
11. Explain how a force meter can be used to measure force.
Applying
12. You push a door, but it is locked and will not open. Apply your knowledge of forces to decide whether you exerted a force even though the door did not move.
13. If you hold a glass of water at arm's length in front of you, explain whether you are exerting a force on it, given that the glass of water is not moving.
14. You are sitting on the couch at home. Draw a labelled diagram of yourself, using arrows to represent the forces acting on you. Are the forces balanced?
15. In Figure 8.22, the weight (force of gravity) of the gymnast is balanced by the normal force of the bar. Draw a force arrow diagram to represent all forces acting on her.
Analysing
16. Force is measured in newtons. Describe how large a force of 30 N is.
SAMPLEPAGES
17. Analyse Figure 8.23 and describe or draw the forces acting on the cyclist. Assume the cyclist is moving at constant speed in a straight line.
Evaluating
18. Three cyclists are triplets, and are identical in every way, including their size, mass and clothing. They have identical bikes. They start a sprint race side by side at the same time. After 10 seconds, Ahmet has gone 200 m, Barak has gone 160 m and Cinna has gone 120 m. Discuss these results. Was the average force each exerted on the pedals the same during the 10 seconds or different? Who exerted the highest force, and who exerted the lowest? Was it a fair comparison? Explain your reasoning.
Figure 8.22 A gymnast training
Figure 8.23 What are the forces acting on the cyclist?
8.2 Contact forces
Learning goal
At the end of this section, I will be able to:
1. Identify examples of contact forces in everyday life.
Forces are pushes or pulls that affect objects in many different ways, depending on whether the forces are balanced or unbalanced.
These forces can be classified as contact forces, where physical contact is made to exert a force on an object, or non-contact forces, where physical contact is not required for the force to have an effect. In this section you will explore four types of contact forces: friction, elastic, buoyancy and impact.
Friction forces
Friction is occurring everywhere in your everyday life. It is a contact force and it occurs when surfaces rub together, or a liquid or a gas flows over a surface. An example is pulling a couch over carpet or even running into a very strong wind. When one object tries to move over or through another, the contact forces act in opposite directions.
While friction is often a hindrance, it can also make our life easier and safer! Walking without it would be difficult because your shoes would have no grip on the floor. Normally you push your foot backwards against the ground and the ground pushes back on you, but if there were no friction, it would feel like everything was covered in a thin film of slippery soap. This type of friction is called traction. Without friction, car brakes would not work and without traction, cars would not be able to move in any direction – backwards, forwards or around corners.
SAMPLEPAGES
Generate-sort-Connect-elaborate: a push or a pull
Create a list of forces (a push or a pull) that you have experienced in the last few days. It might be at school, at home or playing a sport, for example.
Group and connect the forces in your list by placing contact forces in the centre of the page and non-contact forces toward the outside of the page.
Connect your different types of forces by drawing lines between forces that have something in common. Write a short sentence to explain how the forces are connected.
Expand on any of the forces you have listed by adding further details that expand, extend or add to your initial list.
The Generate-Sort-Connect-Elaborate thinking routine was developed by Project Zero, a research centre at the Harvard Graduate School of Education.
Making thinking visible 8.2
surfaces and friction
Aim
To observe the effect of various surface types on the friction force on a moving object.
Materials
SAMPLEPAGES
• large block of wood with hook attached
• force meters (10 N, 20 N and 100 N)
• a variety of surfaces (e.g. vinyl floor, carpet, concrete, polished concrete, sandpaper, grass or bitumen in a safe area)
Method
1. Copy the results table below into your science book. Ensure the independent variable is in the left-hand column and the dependent variable trials and mean sit at the right of the table. Don't forget units in the headers.
2. Place the block of wood on the first surface and attach the appropriate force meter. (Hint: Which force meter would be the best for each surface? How would this be determined?)
3. Pull the block of wood at a constant speed across the surface and read the force on the force meter. The force on the force meter will be equal to the force of friction. Record this reading in your results table.
4. Repeat the measurement two more times and record in your table.
5. Repeat steps 1–4 on three other surfaces.
Results
Table showing frictional force over different surfaces
Surface
Discussion: Analysis
1. Explain why it was necessary to measure the friction of each surface three times and calculate the mean.
2. List your surfaces in order of lowest to greatest friction force.
3. Explain why some surfaces create more friction than others.
Conclusion
1. Draw a conclusion from this experiment about the friction force on different surfaces, by copying and completing this statement in your science book. From this activity it can be claimed that __________. This is supported by the observations that _____________. Therefore, the hypothesis is/is not supported by these findings.
Friction between solid surfaces
The strength of the friction force depends on the type of surfaces. Rough surfaces tend to produce more friction than smooth ones, and heavier objects tend to have more friction than lighter ones. Consider the example of moving a couch over carpet. If the couch is extremely heavy, there will be more friction opposing the push you are giving, so you will have to apply a greater pushing force to get the couch to move. Friction also depends on the angle at which the object is pushed and whether the object is stationary or not.
Friction between two solid surfaces also has a side effect: it releases energy in the form of heat. This means that friction can cause the temperature to increase, which can sometimes be beneficial. For example, you might have rubbed your hands together on a cold morning to warm them up, or rubbed sticks together to start a fire, or for use in a smoking ceremony. However, higher temperature is not always welcome because it can represent wasted energy or be dangerous.
Minimising friction between solid surfaces
One way to reduce friction between two solid surfaces is to polish them or to use lubrication such as oil or graphite. This allows the surfaces to move over each other with less friction force and thus generate less wasted energy. In Figure 8.24, clean oil is put into an engine to lower the friction between the moving parts. If there is not enough oil, the extra frictional forces will damage the engine because the metal expands as the temperature increases.
SAMPLEPAGES
Another way friction can be reduced, especially when moving heavy loads from one place to another, is to use a wheel and axle. This is one of the earliest and most widely used human inventions.
By using a wheel and axle, trains, cars, trucks and even aircraft taking off and landing can all move with little friction. One place where wheels are not the preference is on snow and ice, because the surfaces already have low friction. In this case, it is better to use skis or sledges on runners. Skis and runners do not sink into the snow and get stuck like a wheel would. In fact, in these conditions, a wheel would generate more friction force than skis and runners do. Additionally, being long and thin, skis and runners also tend to run straight, whereas wheels would slide sideways.
Wheels also do not work well if the ground is very rough, so trains need tracks and cars work best on roads. Furthermore, wheels do not work on water, so seaplanes designed to land on water use long, thin, hollow floats or pontoons shaped like closed canoes instead of wheels.
Figure 8.24 Petrol engines need oil to reduce the friction inside.
Figure 8.25 Wheels and an axle allow objects to move over a surface with very little friction.
Figure 8.26 Seaplanes use floats instead of wheels to land on water.
Try this 8.3
Friction in action
Use a force meter to measure the force required to pull a wooden block across your bench. Next, lay out pencils or pens that are perfectly round and about the same thickness next to each other and measure the force required to pull the block over the top of them. Can you explain how the force required differs?
SAMPLEPAGES
Friction in gases and liquids
Friction between a solid surface and a liquid or a gas is also possible, and is called drag. When gases make contact with a solid surface, this type of drag is called air resistance. Friction can also occur between liquids and gases, or even within liquids or gases. Friction involving gases or liquids is called fluid friction.
Air resistance acts as an opposing force when an object moves through the air. A skydiver will reach terminal velocity (a constant speed) when falling towards Earth, because the air resistance provides an opposing force on the skydiver. When an arrow is shot from an archery bow, air resistance will act to slow it down, but because arrows are streamlined, the force slowing the arrow is small.
Fish have a streamlined shape that helps them move through water easily. The same shapes are used by the designers of boats and submarines to reduce drag and enable them to travel at high speed in water.
Birds have a streamlined shape to enable them to fly with as little air resistance as possible. Air resistance is a major consideration for the designers of cars, trains and aircraft. The design of trains (see Figure 8.29) has become more streamlined to allow them to go faster.
Figure 8.27 The friction force on an arrow as it flies through the air is small.
Figure 8.29 Trains have become more streamlined as their speed has increased.
streamlined designed to minimise air resistance or drag
Figure 8.28 The welcome swallow (Hirundo neoxena), native to eastern Australia, has a streamlined shape for fast and sharp movements while flying.
David ngunaitponi (Unaipon) and
Many Aboriginal and Torres Strait Islander Peoples have used boomerangs for hunting for thousands of years. The boomerang's design allows it to lift into the air when thrown, and return to the thrower in flight. When thrown, the boomerang spins and the lifting arm of the tool provides more lift force than the dingle arm (see Figure 8.30b). This difference in lift force causes an imbalance of forces on the tool and it thus turns in flight back towards the thrower. The particular shape of each arm is called an airfoil and is the same design that modern aeroplane wings use.
the vertical
flying machine
David Ngunaitponi (Unaipon) was a Ngarrindjeri man from the Coorong region of South Australia, born in 1872. He was an insightful inventor with a wealth of traditional and cultural knowledge of the aerodynamic properties of boomerangs. In 1914, he predicted that the physics that allowed the boomerang to hover through the air could be applied to an aeroplane.
8.30 (a) David Ngunaitponi (Unaipon) on the Australian $50 note. (b) The boomerang uses forces to make unique movements in the air.
David Unaipon conceptualised this 'vertical lift flying machine' almost 25 years before the first helicopter was constructed. His contribution to science is recognised every day in Australia, with his portrait appearing on the Australian $50 banknote. Science
SAMPLEPAGES
He stated: 'An aeroplane can be manufactured that will rise straight into the air from the ground by the application of the boomerang principle' and 'The boomerang is shaped to rise in the air according to the velocity with which it is propelled, and so can an aeroplane'.
Quick check 8.5
1. Explain how friction can slow down a runner who is running into the wind.
2. Describe a feature of a car that is designed to minimise friction in order to use less fuel per kilometre.
3. Describe a feature of a car that is designed to maximise friction for safety.
4. Define the key terms 'air resistance', 'drag' and 'streamlined'.
5. Explain why a dolphin's body is streamlined, whereas a wombat's is not.
6. Explain how cultural knowledge of the forces acting on a flying boomerang was used when David Unaipon conceptualised the vertical lift flying machine.
Elbow
Trailing edge
Trailing edge Leading edge
Leading edge Direction of rotation
Direction of rotation Axis of rotation
Centre of gravity
Lifting arm
Dingle arm
Figure
Science as a human endeavour 8.2
the breakthrough Laminar aircraft Demonstrator in europe (bLaDe) project Airbus is an international aeroplane manufacturer. It constructs large passenger aircraft for Australian companies such as Qantas. Aeronautical engineers at Airbus understand the forces acting on aeroplanes very well. They use this knowledge to design heavy machines with wings that fly.
While air travel is commonplace in the modern world, there are still many improvements to make to the design of planes. These improvements could make air travel safer, more comfortable and more cost-effective for passengers. They could also improve the environmental impact of aircraft and reduce carbon emissions. These are important ethical, social and economic considerations.
SAMPLEPAGES
The Airbus BLADE project was launched in 2017, with the aim of reducing the air resistance force (drag) on aeroplane wings by up to 50 per cent. This would reduce the force required of the engines and thus reduce fuel consumption and carbon emissions by up to 5 per cent.
The BLADE demonstrator aircraft collected data over 150 flight hours and found that drag could be reduced by up to 10 per cent. The project was put on hold in 2020. However, Airbus aims to conduct more tests to further improve efficiency under different flying conditions.
elastic spring force
Springs can be pulled, pushed or bent sideways (see Figure 8.32). In each case they will exert a force in the opposite direction to the force applied and this is called an elastic spring force.
Elastic spring force
Elastic spring force
Push force
When a spring is compressed, the elastic spring force pushes back.
Elastic spring force
Pull force
When a spring is stretched, the elastic spring force pulls back.
Figure 8.32 Three ways to apply a force to a spring
Pull force
When a spring xed at both ends is pulled sideways, the elastic spring force pulls back sideways.
Figure 8.31 The Airbus A340 laminar-flow demonstrator BLADE aircraft in flight for testing
Forces in elastic materials
Solid pieces of elastic or rubber can be pulled, pushed or bent sideways. A rubber band or strand of elastic, on the other hand, is much harder to compress lengthwise because of its shape (see Figure 8.33).
Rubber and other elastic materials can be compressed when they are formed into a short, fat shape, and they are used in this way to absorb bumps and shocks in vehicles and machines.
Long pieces of wood, plastic or metal can also exert an elastic spring force when they are bent. They spring back to their original position when the force is removed, as long as the force is not large enough to break or deform them permanently. Tree branches are an example of this as they can bend in the wind. If they are unable to bend due to being rotten or having a very large force applied to them during a storm, they will break.
Elastic spring forces are used by divers on a springboard to gain height when they dive. The force exerted by a bow on an arrow is also an example of an elastic spring force. Some of the force comes from the stretching of the string; most of the force comes from bending the wood or plastic of the bow.
SAMPLEPAGES
A rubber band or strand of elastic cannot be compressed easily because of its shape.
A stretched piece of elastic or rubber fixed at both ends gives an elastic spring force when pulled sideways.
Elastic spring force
Elastic spring force
Pull force
Pull force
Figure 8.33 Two ways to apply a force to a rubber band
Figure 8.34 A diver uses the elastic spring forces in a springboard.
Figure 8.35 A pole vaulter uses the elastic spring forces in a pole to reach the top of the vault.
stretching springs
Aim
To observe the relationship between force and extension for a spring.
Materials
• spring
• retort stand, bosshead and clamp
• set of slotted masses
• ruler
Method
1. Using a retort stand, hang a spring on a bar and place an empty weight holder on the end of the spring.
2. Tape a ruler to the vertical bar of the retort stand. Use the scale of the ruler to record the initial position of the bottom of the weight holder.
3. Add masses to the weight holder. Each time a new mass is added, record the new position of the bottom of the weight holder. Be careful not to overstretch the spring.
Results
Table showing force and extension of a spring for different masses
Mass (g)
SAMPLEPAGES
Force (N)
Extension (m)
1. Calculate the force applied to the spring by dividing the mass in grams by 1000 and multiplying by 9.8.
2. Draw a graph of how force affects the extension of the spring.
Discussion: Analysis
1. Identify the trend in your graph.
2. Identify any outliers in your graph.
3. Explain whether you can use your graph to make predictions about other masses.
Conclusion
1. Draw a conclusion from this experiment about the relationship between force and extension for a spring, by copying and completing this statement in your science book. From this activity it can be claimed that __________. This is supported by the observations that _____________. Therefore, the hypothesis is/is not supported by these findings.
Quick check 8.6
1. Describe an elastic spring force.
2. Name another sport or activity that has not been mentioned that uses elastic spring forces.
buoyancy
Buoyant force is the upward push that occurs when an object is partially or fully submerged in a liquid or a gas, such as water or air. If an object placed in water sinks, the buoyant force acting upwards is smaller than the weight force of the object. If it floats to the surface, the buoyant force is greater than the object's weight.
There is also an upwards buoyant force on an object in a gas, but it is much smaller, and can only be seen in an object that is very light compared to its size, such as a helium balloon in the air. If the air's upward buoyant force on a helium balloon is greater than its weight, it will rise.
When you swim, you will have experienced the buoyant force on your body; it allows you to feel almost weightless in the water. In Figure 8.38, the buoyancy (red) here is approximately equal to the weight (blue).
SAMPLEPAGES
Did you know? 8.1
buoyant magma
Magma is the name of molten rock under Earth's surface. Hot molten magma can be more than 1000°C and is less dense than the surrounding cooler magma. Buoyant forces cause molten magma to rise through the cooler magma towards Earth's surface in a giant convection current. When magma reaches the surface, it is then called lava, which we associate with erupting volcanoes. So while buoyancy force is most commonly thought about in connection with objects floating on water, it is also at work in the magma underground.
Figure 8.36 Buoyancy allows heavy container vessels to float.
Figure 8.37 In sparkling water, bubbles of gas rise to the surface due to buoyant forces.
Figure 8.38 The buoyant force on the swimmer is approximately equal to her weight.
Try this 8.4 buoyancy in action
Fill a bucket with water and collect a range of balls such as a table tennis ball, golf ball and tennis ball.
Take each ball and submerge it in the water, releasing it at the bottom of the bucket.
Write down your observations when you let go of each ball. Did the different balls act differently? What forces are acting in this situation? When are the forces balanced and unbalanced?
SAMPLEPAGES
Impact forces
The contact forces you exert or experience in daily life, such as when moving an object or opening a door, are called applied forces. When objects collide, they typically exert or experience a force that lasts just a fraction of a second. This is called an impact force and it is a push that fast-moving objects or particles exert for the very short time that they are in contact with another object. When objects are heavier, have a shorter collision or move faster, impact forces also increase. Constructive uses of impact forces include using an axe to chop firewood or a hammer to hit a nail.
However, the nature of impact forces can make them very dangerous if they are not controlled. For example, a car accident might involve a heavy vehicle travelling at a high speed. In this case, the impact forces could cause severe damage to the vehicle itself, as well as to the passengers.
Car accidents are always a possibility when driving, and so safety measures have been implemented to reduce the impact forces felt by passengers in an accident. Seatbelts, airbags and crumple zones are examples that spread the impact force over a larger area or a larger distance to reduce the risk of serious injury.
Explore! 8.1
Keeping safe on the roads
Seatbelts and bike helmets are important safety measures that can prevent serious injury in the event of an accident. Visit the RACV website to find out:
• the rules about wearing seatbelts and helmets on Victorian roads
• how long the wearing of seatbelts and helmets has been mandatory
• why it is important to wear a seatbelt or a helmet.
applied force force that is applied to an object by another object or person
Figure 8.39 Helmets and seatbelts can prevent serious injury in an accident.
Go online to access the interactive section review and more!
Quick check 8.7
1. Name the two forces acting on you when you are lying on an inflatable mattress in a swimming pool.
2. Define the term 'impact force' in your own words and provide three examples.
Section 8.2 review
SAMPLEPAGES
Section 8.2 questions
Remembering
1. State the names of five main types of contact force.
2. State the contact force that can be easily used to warm up a small object or surface.
3. Recall the common name for friction on an object moving through a liquid or gas.
Understanding
4. The wheels of cars and some bikes are attached with springs. Explain, using your knowledge of forces, how the springs help give a smooth ride even on a bumpy road.
Applying
5. An impact force is a force that acts for a short time. Provide three examples of impact forces in sport.
Analysing
6. Look at the two aircraft shown in Figure 8.40 and identify which one is designed to go faster. Give reasons for your answer.
Figure 8.40 Which plane is designed for a higher top speed?
7. The feet in Figure 8.41 belong to a goose. Use your knowledge of forces to analyse the structure of the foot and how it is adapted to be used in water.
Evaluating
8. Propose whether a glass or plastic bottle is a better choice for carrying water in a backpack.
9. Earthquakes are dangerous and buildings in earthquake-prone places must be specially designed to withstand their effects. There are three types of building materials that could be used in an earthquake zone:
• brittle
• elastic
• deformable.
Use your knowledge of forces to propose how you would use or modify each material to cope with earthquakes. Give your reasons and sketch examples of what you mean.
Figure 8.41 The feet of a goose
8.3 Non-contact forces
Learning goals
At the end of this section, I will be able to:
1. Describe the effect of Earth's gravitational force.
2. Describe three non-contact forces.
SAMPLEPAGES
Non-contact forces do not require physical contact; they act at a distance through space. There are three key non-contact forces you will explore:
• gravitational
• magnetic
• electrostatic.
Gravitational force
Gravity is the name given to the apparent force of attraction that exists between objects that have mass. You might already know about gravity as the force that pulls objects towards the centre of the Earth. However, everything that has mass has its own gravitational force. While Earth's gravitational force pulls you towards it, you also pull Earth towards you with a gravitational force.
Gravitational force increases with increasing mass, so it's no surprise that you feel Earth's gravitational force on you more! This force extends out into the vacuum of space. It constantly pulls the Moon towards Earth and causes its orbit. Satellites also orbit Earth due to gravitational force.
The Sun contains 99.86 per cent of all the mass in the solar system. Earth and all the other planets, even Jupiter, are tiny in comparison. All the planets in the solar system, including Earth, orbit the Sun because of its enormous mass.
Figure 8.42 A basketball falls due to the force of gravity (blue arrow), which is opposed by the smaller force of air resistance (red arrow). The forces are unbalanced and there is a net force downwards.
The gravitational force of an object decreases with distance, so although the force of Earth's gravity gets weaker in space, the weight of an object is almost the same everywhere on Earth's surface. Remember, force is measured in newtons. Weight is a force, so weight is measured in newtons, not kilograms.
Different gravitational forces
At the beginning of Section 8.1, you learned that mass and weight are not the same thing, and that on Earth's surface an object with a mass of 1 kilogram has a weight of about 9.8 N. This relationship can be summarised by the following equation:
Weight (N) = mass (kg) × force of gravity (m/s2)
where force of gravity on Earth = 9.81 m/s2
Table 8.2 shows how different locations in our universe have different gravitational forces, so a mass of 1 kilogram has different weights in different places.
SAMPLEPAGES
Table 8.2 A mass of 1 kg has a different weight at different locations in the universe because of the different strengths of gravity.
Explore! 8.2
Gravity in outer space
Gravity does a lot more than just keep the Moon and planets in orbit. The formation of stars and galaxies is also due to the attractive force of gravity. In fact, when a star is so massive that it collapses into a single point, it forms a black hole. The gravity of a black hole is so strong that nothing can escape – not even light!
Use the NASA Space Place website to research how gravity is involved in the formation of stars, galaxies and black holes.
The Sun has the strongest gravitational force in the solar system, about 28 times the gravity on Earth. Aside from being too hot, an average person would weigh about the equivalent of two cars on the Sun, and it would require a lot of effort just to move, if the person hadn't already been squished by the weight of their own body! Neutron stars are extremely dense objects that are left behind when some stars explode. They are so dense that 1 cm of human hair on a neutron star would weigh more than the water in an Olympic-size swimming pool on Earth. Try this 8.5
jumping on planets: Mass versus weight
Use a metre ruler and sticky tape to calculate how high you could jump on different planets.
1. Tape the ruler to a table leg or wall so that it is vertical.
2. Get a partner to kneel down so their eyes are level with the ruler.
3. Jump as high as you can while your partner records the height you achieved.
4. Repeat the jump two more times.
5. Swap roles so you are now recording the jump height of your partner. Repeat steps 2–4.
6. Copy the following table into your book and calculate the mean jump height.
Table showing jump heights of students
7. Calculate how high you could jump on each planet, plus the Sun and the Moon. Divide your mean height by the surface gravity of each celestial body in the table. For example, if you jumped a mean height of 0.65 m and wanted to calculate how high you could jump on Venus, you would divide 0.65 by 0.91. This would tell you that you could jump 0.71 m if you were on the surface of Venus.
Table showing jump height on different planets
Member of the solar system
Ratio of the surface gravity of each location to Earth's surface gravity
The height I could jump at each location (m)
SAMPLEPAGES
Quick check 8.8
1. Define these key terms: gravity, mass, weight.
2. Describe the relationship between the gravitational force, mass and weight.
3. A supermarket claims that jumbo size chicken eggs have an average weight of 68 g. Compare the meaning of the word 'weight' for the supermarket in this situation versus what it actually means.
4. Use Table 8.2, which shows the pull of gravity at different locations, to decide where you would weigh the most, where you would weigh the least, and where you could jump the highest.
Gravity and air resistance
Do all objects of the same weight fall at the same rate? If they do, then identical pieces of paper, no matter how they are folded or not folded, should fall at the same rate. See whether this is the case in Practical 8.5.
The experiment in Practical 8.5 demonstrates that different objects hit the ground at different times because of the interaction of the object with air: the air resistance of the object. When the flat piece of paper is used, the air resistance is much greater because the paper has to push more air out of the way. This is related to the area of the paper that pushes against the air. The flat paper is a very big area, so it falls much more slowly than the folded piece of paper where a smaller area pushes the air out of the way.
If these experiments were repeated without air (in a vacuum), then all the objects released from the same height at the same time would hit the ground at the same time, regardless of their mass.
Practical 8.5
surface area versus air resistance
Aim
To determine how surface area and mass affect air resistance.
Materials
• piece of A4 paper × 1
• piece of A4 card × 1
• metre ruler
• stopwatch
Method
1. Copy the results tables below into your science book.
2. Take the A4 paper and measure its length and width to calculate its surface area. Record this in your table.
3. Hold the paper horizontally and release from a height of 1.5 m and record the time it takes to reach the ground. Repeat two more times.
4. Fold the paper in half and then repeat steps 1 and 2. Continue doing this until you have folded the paper four times.
5. Repeat, using the piece of card.
Results
Table showing time taken for paper to drop with different folds
Time taken to drop paper (s)
SAMPLEPAGES
Number
Table showing time taken for card to drop with different folds
Time taken to drop card (s) Number
Plot both sets of results on the same graph to compare them. Plot the surface area of each item against the mean time it takes to drop.
Discussion: Analysis
Identify any trends, patterns or relationships in your results.
Conclusion
1. Draw a conclusion from this experiment about the relationship between mass, surface area and air resistance, by copying and completing this statement in your science book. From this activity it can be claimed that __________. This is supported by the observations that _____________. Therefore, the hypothesis is/is not supported by these findings.
Galileo's experiment
Galileo was a scientist who did an interesting series of experiments on gravity. Up until Galileo's experiments it was thought that lighter objects fall at a slower rate than heavy objects. This is our common experience: if a hammer and a feather are dropped together, most people would predict that the hammer will hit the ground first because the force of gravity is greater on the hammer. Galileo had another explanation. He dropped objects from towers and rolled balls down ramps, and observed that all objects fall at the same rate, no matter how heavy they are. In other words, when two stones are dropped, even if one has double the mass of the other, they will hit the ground at the same time. The rate at which an object falls on Earth is called the acceleration due to Earth's gravity and is 9.8 m/s2 near Earth's surface.
To explain why the feather hits the ground after the hammer, Galileo argued that the reason was not gravity, but air resistance. The air resistance for the feather was much greater than for the hammer. Take away the air, Galileo argued, and the two will fall together. This surprising result has been demonstrated many times, most famously by astronaut David Scott of Apollo 15 on the Moon, where there is no atmosphere.
Galileo had a ruler to measure distance, but clocks had not yet been invented to time the balls rolling down the ramp. Instead, he used his pulse to measure time in his experiments.
Parachutes are a practical application of air resistance. You can fall through the air safely if you have a parachute. When the parachute opens, it increases your air resistance so that it greatly exceeds your weight and you slow down due to a net upwards force. As you float to the ground, the air resistance is equal to your weight and there is no net force acting on you. You will fall at a constant speed.
SAMPLEPAGES
Figure 8.43 Galileo's experiment: dropping two stones of different mass out of a tower to see which landed first
Figure 8.44 The way a parachutist falls depends on the size of the pull of gravity and the air resistance from the parachute.
Drop time of a parachute
Aim
To investigate how the surface area of a parachute affects the time it takes to reach the ground.
Research question
How does the surface area of a parachute affect the drop time of a mass?
Materials
• plastic freezer bags
• scissors
Method
• modelling dough
• stopwatch
• cotton or string
• metre ruler
1. You need to provide some background information to the practical. Research how parachutes work. Write a brief paragraph explaining how air resistance is affected by the surface area of a parachute.
2. Identify the independent variable in this practical.
3. Identify the dependent variable in this practical.
4. Develop a hypothesis by predicting how the independent variable will affect the dependent variable.
5. Identify the controlled variables in this practical.
6. Create a risk assessment for this practical.
7. Draw the table below in the results section in your science book.
8. Use the scissors to cut three different-sized squares from the plastic freezer bags. These will be your parachutes.
9. Calculate the surface area of each parachute by multiplying the width by the length of the plastic.
10. Use four pieces of cotton to attach each corner of a plastic square to a mass of modelling dough.
11. Repeat step 10 for the other two parachutes.
12. Use the metre ruler to measure the height you will drop your parachute from.
13. Use the stopwatch to time how long it takes each parachute to reach the ground.
14. Repeat steps 12 and 13 three times for each parachute, recording the drop time in your results table, then calculate the mean for each parachute.
Results
Table showing drop time for parachutes of different surface areas
Surface area
Parachute 1
Parachute 2
Parachute 3
Discussion: Analysis
1. Identify the trend in your results.
2. Identify any outliers in your trials.
SAMPLEPAGES
Discussion: Evaluation
Trial 1
Drop time (seconds)
Trial 2
Trial 3 Mean
1. Explain why there was variation between the three trials for each parachute.
2. Describe how the practical could be improved if you had the chance to do it again.
Conclusion
1. Draw a conclusion from this experiment about how surface area affects the drop time of a parachute, by copying and completing this statement in your science book. From this activity it can be claimed that __________. This is supported by the observations that _____________. Therefore, the hypothesis is/is not supported by these findings.
Quick check 8.9
1. Explain the term 'air resistance' in your own words.
2. Describe the relationship between the speed an object falls at, the pull of gravity and air resistance.
3. Figure 8.45 shows a paramotorist flying through the air. The propeller on his back provides a forwards thrust force and there is also a parachute attached above him.
a) Identify the forces acting on the paramotorist if he is accelerating while moving forwards and not losing or gaining altitude.
b) Describe how these forces change if the paramotorist is moving at a constant speed.
Magnetic forces
Figure 8.45 A paramotorist uses knowledge of forces to fly through the air.
Magnetic force, like gravity, is a non-contact force. You might have seen it in action with the magnets on a refrigerator at home. Magnetic forces are always strongest at the ends of a magnet, which are called poles. There are two types of magnetic poles, north and south, and they always occur as a pair. Even if you break a magnet in half, it will still have a north and south pole at the ends of each of the pieces.
Unlike poles (north and south) of two different magnets experience an attractive force, while two like poles (north and north or south and south) experience a repulsive force (they repel; see Figure 8.46). Have you ever tried to push two magnets together and it felt like there was an invisible barrier? That was the magnetic repulsive force.
1. Which of the situations in the diagram display interactions between like poles?
Which of the situations display interactions between unlike poles?
Some magnets always retain their ability to be magnetic and so they are called permanent magnets. An example is a fridge magnet; these are always magnetic. On the other hand, metals like soft iron become magnets only when they are near a permanent magnet; they can become a temporary or induced magnet. Try hanging a paperclip from a magnet. While it is there, it will behave like a magnet and can be used to attract other paperclips. But on its own, the paperclip does not behave as a magnet.
magnetic force a non-contact force between a magnet and another magnet or magnetic metal repel to force back or apart
Unlike poles attract
Like poles repel
Figure 8.46 Forces between magnets
Try this 8.6
Magnetic poles
alloy a substance composed of two or more elements, usually metals magnetic field the space around a magnet where the magnetic force can act
field
a region in space in which an object is affected by a force
In addition to each other, magnets also attract iron, cobalt, nickel and their alloys, such as steel (an alloy of iron and carbon).
SAMPLEPAGES
Figure 8.47 The magnetic field around a magnet causes the metal filings to form a particular pattern.
A magnet exerts its force through a magnetic field – this is a space around the magnet where the magnetic force can act. The magnetic field is a force field, like the gravitational field, although the two fields are different in most other respects. In Figure 8.47, you can see that the iron filings are strongly attracted to the poles of the magnet and, amazingly, they are lining up in a certain way. In the following activity you will investigate and explore what the shape of this magnetic field is and how it changes with different shapes of magnets.
Magnetic field lines Aim
To visualise the shape of the magnetic field of different magnets.
Materials
• bar magnets × 2
• horseshoe magnet
• iron filings
• piece of A4 paper
• compass
Method
1. Place the bar magnet on a table and cover it with a piece of paper.
2. Sprinkle iron filings on the paper and observe the pattern formed.
3. Hold the compass at different points around the magnet. The direction that the compass points in indicates the direction of the magnetic field lines.
4. Repeat steps 1–3 with the horseshoe magnet.
Results
Draw a sketch of the pattern formed by the iron filings.
Discussion: Analysis
1. Using your diagram, determine where the magnet's poles are.
2. Identify where the magnetic field appears to be the strongest.
3. Investigate different patterns formed when two or more magnets are placed near each other.
Conclusion
1. Write a sentence summarising what you have observed about the magnetic field of different magnets.
Practical 8.7
Quick check 8.10
1. Explain why magnetism is considered a non-contact force.
2. Complete the following sentence: Opposite poles ________ each other, while poles that are the same ________ each other.
3. Explain the difference between a permanent magnet and a temporary magnet.
4. Describe a magnetic field. Draw a picture of the field around a bar magnet and indicate the direction of the magnetic field lines.
SAMPLEPAGES
Science as a human endeavour 8.3
nuclear force and the atomic bomb
Another non-contact force occurs within individual particles. The force acting inside particles, holding them together, is called the 'nuclear force'.
During World War II, a Polish scientist, Joseph Rotblat, was working first in England and then in the USA on research to develop the atomic bomb, as part of the Manhattan Project. An atomic bomb would use nuclear forces to release a huge amount of energy. When an atomic bomb was eventually created, it was used by the USA in 1945, on the Japanese cities of Nagasaki and Hiroshima. The devastating outcome continues to be a reminder of the dangers of nuclear weapons.
At the end of 1944, Rotblat withdrew his participation in the research for ethical reasons, as he was well aware that the research he was undertaking would have dire consequences if used in war.
Rotblat was a keen advocate for the peaceful use of scientific research. For his ethical consideration in World War II and his peaceful work after the war, he was awarded the Nobel Peace Prize in 1995.
Earth itself is a giant magnet with magnetic poles near the geographic poles. A suspended magnet will turn until its north pole points geographically north because of its attraction to the south pole of the internal Earth magnet. This is a property of natural magnets or lodestones and has been used by navigators for thousands of years. What is called the north pole by geographers is called the south pole of Earth's magnet by scientists.
8.49 The magnetic pole near the geographic North Pole is actually the south magnetic pole. This is known because a compass always points
Figure 8.48 Joseph Rotblat in 1956
Figure
Try this 8.7
Making a compass
Use a steel nail, a strong magnet, a piece of cork (or polystyrene foam) and a bucket of water to make a compass. Follow these instructions.
1. Stroke the steel nail with the strong magnet in one direction. After each stroke, be sure to lift the magnet away from the nail before your next stroke. Repeat this process about 50 times.
2. Test your nail to see if it has become magnetised by holding it near some paperclips.
3. Place the cork or polystyrene in the bucket of water. Then place the nail on top.
Identify which end of the nail is the north pole. How did you know this?
Check the accuracy of the homemade compass with an ordinary compass. Discuss the accuracy of the homemade compass. State one way in which the accuracy of the homemade compass could be improved.
Did you know? 8.3
sea turtles use earth's magnetic field to find home
Female sea turtles always return to the beach where they were born to lay their own eggs. Sometimes this means swimming thousands of kilometres, and the way they do this is by relying on Earth's magnetic field. Scientists have hypothesised that turtles have a very sensitive detection of magnetic particles of the surrounding land, and it is possible that tiny magnetic particles in their brains help the turtles navigate.
SAMPLEPAGES
Magnetism and electricity are closely related; wires carrying electricity create a magnetic field around them. Magnets called electromagnets are made by coiling a wire. When a battery is connected, the current flows along the wire and a magnetic field is created. When the current stops, the magnetic field ceases. The strength of the field can be increased by wrapping the coil around a piece of magnetic iron.
Figure 8.50 The sea turtle is guided along the coast by Earth's magnetic field.
electromagnet a magnet made by passing electricity through a coil of wire
Figure 8.51 An electromagnet can attract anything that a magnet can (in this case, paperclips).
Explore! 8.3
Uses of magnets
Electromagnets and permanent magnets are used everywhere and every day, in electric motors, doorbells, computer hard drives, MRI machines, phone speakers, microphones, drills, hair dryers and bank cards, to name a few!
Research any one of these examples and write a short report on it. Include a picture and details of how an electromagnet or permanent magnet is involved in how the object functions.
Quick check 8.11
1. Describe an observation that is evidence that Earth has its own magnetic field.
2. Name some examples of electromagnets used every day.
3. Describe the advantages of an electromagnet over a permanent magnet.
electrostatic forces
Another non-contact force that you might encounter in your everyday life is electrostatic force. This force is the one that gives you a shock when you roll on a trampoline or a carpet. It is also the cause of lightning during a storm.
Like magnets, electrical charges attract and repel each other. There are two types of charge: positive (+) and negative (–). Opposite charges attract each other and like charges repel.
Like gravity and magnetism, objects with an electric charge also create a field around them. The electrostatic field is the region in which a charged particle will feel the electrostatic force.
a
WORKSHEET
Electrostatic and magnetic forces
electrostatic
SAMPLEPAGES
In Figure 8.53, the machine the girl is touching is called a Van de Graaff generator. This machine separates positive and negative charges. The negative charges go down to the ground while the positive charges in the metal dome stay in place. Because the girl is touching the dome, the negative charges from her hair flow to the dome, making her hair positively charged. Remember, like charges repel, so when the girl's hairs become positively charged, they all try to get away from each other!
Like charges repel
Figure 8.52 Forces between charges
force
non-contact force between positive and negative charges; opposite charges attract, like charges repel
Figure 8.53 Electrostatic forces can make your hair stand on end.
A build-up of charge in this way is called static electricity. The girl's hair does not stay charged, and eventually the charges will return to normal. When there is a large build-up of charge, the charge can jump from one area to another, and that jump appears like a spark. This is called a static discharge.
Static electricity can be seen and felt when you get an electric shock or when you see lightning strike in a storm. Charges jump from one place to another due to electrostatic forces.
Quick check 8.12
1. Define the key terms 'electrostatic force' and 'static electricity'.
2. Explain how a Van de Graaff generator works.
3. Explain why you sometimes get a small electric shock even though you have not touched a supply of electricity.
SAMPLEPAGES
observing static electricity
Aim
To observe electrostatic force acting in different situations.
Materials
• balloons × 2
• string
• a metre ruler
• woollen cloth
Method
1. Rub the inflated balloon with the woollen cloth and place the balloon against a wall. Record your observations.
2. Suspend the balloon from the metre ruler using the string.
3. Suspend the second balloon so it is close to, but not touching, the first balloon.
4. Rub both balloons with the woollen cloth on the sides that are facing each other.
5. Record your observations of any movement in the balloons.
6. Rub one balloon with the woollen cloth, then hold it close to, but not touching, a thin stream of water from a tap. Record your observations of the water.
Discussion: Analysis
1. Describe the movement of the two balloons when hung next to each other.
2. Explain whether the movement indicates that the balloons had like or unlike charges.
Discussion: Evaluation
1. State the purpose of rubbing a balloon with a woollen cloth.
2. Did the balloon stick to the wall? Propose reasons why or why not.
Conclusion
1. Write a sentence summarising what you have observed about electrostatic force acting in different situations.
Practical 8.8
Section 8.3 review
Section 8.3 questions
SAMPLEPAGES
Remembering
1. State the forces that are acting on a dropped book as it falls to the floor.
2. Name the force that a magnet exerts.
3. Recall some objects that use electromagnets.
4. Recall three magnetic materials.
5. Define the term 'magnetic field' and illustrate with a picture.
6. Name the two types of electrostatic charge.
7. State whether the mass of an object changes as it moves around the universe.
8. A falling object is pulled down by Earth. Earth is pulled up towards the object. Explain why the movement of Earth cannot be detected.
9. Determine your weight in deep space.
10. State which ball will hit the ground first – a wooden ball, a plastic ball or a metal ball – if air resistance is ignored.
11. The north pole of a magnet points north if it is free to move. Identify which magnetic pole must be near the North Pole.
12. State which types of forces have a field.
13. Identify three situations where air resistance is useful and one situation where it is not useful.
Understanding
14. Summarise how you can visualise the magnetic fields that surround a bar magnet.
15. Two balloons are hanging loosely near each other. One balloon is given a negative charge and the balloons start to move away from each other. Explain what is happening and what the charge on the other balloon must be.
16. Identify the similarities between charged objects and magnets.
17. A parachute is made of large pieces of material. Explain why it has a large surface area and how it makes a falling object slow down.
Applying
18. Calculate the weight of a 5 kg cat on Earth (g = 9.8 m/s2) and on Mars (g = 3.7 m/s2).
19. Describe which would take longer to fall, a rock dropped from 1 m on the Moon (gravity is about one-sixth of Earth's) or a rock dropped from 1 m on Mars (gravity is a little over one-third of Earth's). You can ignore air resistance on both planets.
20. Explain whether a hammer and a feather would hit the ground together if dropped from the same height at the same time on the planet Mercury, where there is no atmosphere.
Analysing
21. Analyse how a compass works and describe why it is useful.
22. The geographic North Pole is located in the middle of the Arctic Ocean, which is covered with sea ice. There is no permanent station or marker of the geographic North Pole. However, in Antarctica there is a marker that shows the location of the geographic South Pole. Infer why the geographic North Pole does not have a marker, whereas the geographic South Pole does.
Evaluating
23. Evaluate the effects of living in a low-gravity environment for a long time.
Go online to access the interactive chapter review!
Chapter review
Chapter checklist
Success criteria Linked questions
8.1 I can recall what a force is and how forces are measured. 1, 2, 4
8.1 I can describe the impact of balanced and unbalanced forces on an object. 5, 6, 7, 10, 11, 12
8.1 I can draw a force arrow diagram to indicate the forces acting on an object. 9
8.2 I can describe some contact forces. 3, 14, 15, 16
8.3 I can describe the effect of Earth's gravitational force. 8
8.3 I can describe three non-contact forces. 3, 13
competition
SAMPLEPAGES
Review questions
Remembering
1. Define the term 'force'.
2. State the units for mass and weight.
3. List three contact forces and three non-contact forces.
4. Define the term 'net force'.
5. Recall the word that is used to describe two forces that are equal in size and act in opposite directions.
6. State whether an object can change direction without a force.
7. State whether an object always moves when a force acts on it.
8. Describe, using your knowledge of forces, why the Moon orbits Earth and why Earth orbits the Sun.
9. Draw or describe the pair of equal and opposite forces on each of the koalas in Figure 8.54.
Figure 8.54 What forces are acting on these koalas as they sit on the tree branch?
Understanding
10. Describe what happens if the forces on an object are unbalanced.
11. Explain whether an object that is travelling horizontally in a straight line at a constant speed needs a force to keep moving.
Applying
12. There are many forces between the parts of the Bolte Bridge in Melbourne (see Figure 8.55). Explain whether all the forces between the parts are balanced or unbalanced.
SAMPLEPAGES
13. Metal recycling takes place in most cities. Aluminium, copper and steel are the most common metals that are recycled. After collection, the first step is to flatten the metal and then cut it into small pieces. The second step is to separate the iron and steel from the aluminium and copper before finally melting the metals ready to be used again. Describe a way that could be used to easily carry out the second step.
14. Figure 8.56 shows a scientist inspecting seagrass. Around his waist he is wearing a heavy belt. Using your knowledge of forces, propose the function of this belt.
Figure 8.55 Bolte Bridge, Melbourne
Figure 8.56 Diver wearing a weight belt
Analysing
15. On snow and ice, wheels with tyres are often replaced by skis and tracks on vehicles. Consider the skis and the tyres in Figure 8.57 and how their shape and friction forces relate to their use.
SAMPLEPAGES
Evaluating
16. Use your answer to the previous question and your knowledge of forces to justify using a snowmobile in the snow rather than a normal motorcycle.
Figure 8.57 Skis versus tyres
Figure 8.58 Snowmobiles use skis and a track instead of wheels. Track Skis
Data questions
Earth's Moon and the other planets in our solar system have different forces of gravity on their surface than Earth does, because they have different masses. These forces of gravity on the surface of each are shown with respect to that of Earth in Figure 8.59.
SAMPLEPAGES
Figure 8.59 Gravity on the Moon and other planets relative to that of Earth, given their relative masses
Applying
1. Identify which planet (not the Moon) in the graph has the lowest mass.
2. Determine which planet has a force of gravity closest to that on Earth.
3. If the acceleration of Earth's gravity is 9.8 m/s2, and the gravity on Mars is 38 per cent of that of Earth, calculate the force of gravity on Mars.
Analysing
4. Identify the general relationship between the mass of a planet and the force of gravity.
5. Use the data in the graph to contrast the gravitational forces of Earth and Mercury.
6. Deduce why the Moon orbits Earth, instead of Earth orbiting the Moon.
Evaluating
7. The mass of Jupiter is approximately 318 times that of Earth. Predict whether the force of gravity on Jupiter would be greater or less than that on Earth.
8. On two of the planets in the graph, a person standing on their surface would weigh about the same. Infer which two planets they are.
9. Pluto has a relative force of gravity of 0.07 of Earth's. Use the relationship you identified in Question 4 to justify the statement that Pluto's mass is less than that of Earth's Moon.
steM activity: The buoyant ferry prototype
background information
Ferries are used throughout Australia and worldwide to connect two or more points over water. They carry passengers but can also carry goods or even vehicles and machinery. They are important in many cities around the world, as it is often expensive to build bridges across large bodies of water. This is also the case in some remote locations throughout the world where rivers are a main avenue for travel, such as the Amazon rainforest.
Ferries, like boats, ships and canoes, float in water as a result of buoyancy. Generally, if an object is less dense than water (less mass per unit of volume), it will float on the surface of water. That is, the less dense an object, the more buoyant it is. But it is hard to imagine how a large ferry made of steel carrying cars can float on water. How can the ferry possibly have less density than the water it floats on?
That is the question that is answered and prototyped by engineers!
DESIGN BRIEF
Design and construct a ferry boat.
activity instructions
In engineering teams (maximum of three people), you will design and construct a ferry for riverside communities that is capable of transporting a payload (goods) and people between two points (return trip) over water.
As an engineer, you should investigate the science and technology of boats.
SAMPLEPAGES
Figure 8.60 Ferries transport passengers in many Australian cities such as Brisbane, Perth, Sydney and Melbourne.
Suggested materials
• ruler and tape measure
• scissors
• cardboard
• bubble wrap
• plastic bags
• 100 g parcels of sugar/salt × 5 (payload)
• sticky tape (duct tape or gaffer tape would be good)
Research and feasibility
1. List the features that would make a useful boat.
2. Research the terms 'density' and 'buoyancy' and discuss in your group how these factors are important in boat design.
Design
3. List all the materials that you have available and that you plan to use for your ferry.
4. Design a ferry that is capable of transporting your payload (set mass) between two points and return.
5. Label and include measurements of your ferry.
Create
6. Build your ferry using the materials, checking as you progress that your ferry is capable of floating.
Evaluate and modify
7. Discuss the challenges you have encountered throughout this project with at least three of your peers. List the strategies or actions that allowed you to overcome it.
8. Create a list of improvements to your design that could be applied to this project to refine its performance.
SAMPLEPAGES
Chapter 9 Simple machines
SAMPLEPAGES
Introduction
Forces are at work in every machine you see in the world around you. In this chapter, you will learn how simple machines are able to make tasks easier. Some tasks require a large amount of force to complete and simple machines can reduce the force required to move an object or increase its speed. You will learn about three classes of levers and the inclined plane, as well as how pulleys and gears use moving parts to multiply a force or a speed.
Section 9.1
Section 9.2
Concept map
SAMPLEPAGES
with rotating parts
Force multiplier Speed multiplier
Wedges
Inclined planes Levers
Pulleys Gears Wheels and axles
Driving gear
Driven gear
Class 3
Class 2
Class 1
Simple machines
Curriculum content
simple machines, including the lever, inclined plane, wedge, pulley, screw, and wheel and axle, alter the direction and magnitude of forces (VC2S8U13)
• evaluating different simple machines for their mechanical advantage
• designing a series of simple machines that take a specified time to move an object a specific height
SAMPLEPAGES
• investigating how simple machines such as levers and pulleys are used to change the magnitude of force needed to perform a task
• investigating the effect of forces through the application of simple machines, for example the spearthrowers used by Aboriginal and/or Torres Strait Islander Peoples as examples of levers that operate as an extension of the arm; and the bows and arrows used by Torres Strait Islander Peoples, with the bow acting as a flexible lever and the arrow as a projectile (rather than a simple machine)
• identifying the simple machines in a complex machine such as a Rube Goldberg machine
• designing and constructing Rube Goldberg machines that use at least 3 different simple machines to perform a specified task
1. Recall some types of simple machines and what they are used for.
2. Describe, and state an equation for, mechanical advantage.
3. Identify and draw diagrams of class 1, class 2 and class 3 levers.
SAMPLEPAGES
In this section, you will learn about how simple machines, including levers, ramps and pulleys, can be used to make a task easier to do. This might be by reducing the magnitude of the force required to do the task or increasing the speed of the task.
Simple machines
Imagine you are fixing something and you hammer a nail in the wrong spot. It is too hard to pull out by hand, so you grab a hammer and use it as a lever to remove the nail. In this case, the hammer or lever is an example of a device that changes the direction or magnitude of a force – it is a simple machine.
The force applied to the simple machine by you, is called the effort force. The object being moved is called the load and the load force is the force applied by the simple machine to the load. Let's look at our hammer and nail example, illustrated in Figure 9.1. The blue arrow represents the pushing force from your hand on the hammer. This is the effort force you put in (or input force). The load is the nail head, as this is the object to be moved. The red arrow represents the force applied by the hammer (simple machine) on the nail head. This is the load force. Ultimately, for a simple machine like a lever or hammer to be useful, we want the effort force needed to push on the hammer to be small and the outcome load force to be large, so the nail comes out easily. When this happens, we can say the use of the hammer has magnified the effort force to produce a larger load force, making it easier to move the load (the nail).
mechanical advantage
Simple machines give us a mechanical advantage. In most cases, simple machines reduce the amount of force required to do a task. They do so because the force acts over a longer distance.
simple machine a basic mechanical device for applying a force and changing its size or direction
lever a rigid bar that moves around a fixed point (fulcrum) so one end can be pushed or pulled to move the other end with a greater or smaller force ramp an inclined surface connecting a higher and a lower level pulley equipment consisting of a grooved wheel (or wheels) with a rope or chain attached to an object to be moved effort force the input force applied by you to a simple machine load the object that is to be moved load force the output force applied by the simple machine to the object (load) mechanical advantage the ratio of the output force to the input force
Figure 9.1 Imagine trying to pull a nail out of wood with the force of just your hands. A hammer is a simple machine called a lever, that makes pulling out the nail easier.
Effort force
Load force
Nail (load)
Fulcrum
class 1 lever
a lever in which the fulcrum is between the load and effort
class 2 lever
a lever in which the fulcrum is at one end and the load is between the fulcrum and the effort
class 3 lever
The reduced force required means that we have an advantage. The mechanical advantage of a simple machine can be measured by the following equation:
Generally, the effort force is less than the load force when using a simple machine, and so the mechanical advantage is greater than 1. The higher the mechanical advantage of a simple machine, the more the effort force is magnified, meaning the easier it is for us to move a load.
SAMPLEPAGES
a lever in which the fulcrum is at one end and the effort is between the fulcrum and the load
fulcrum
the point on a lever where the arm pivots force multiplier something that increases the size of a force
Worked example 9.1
You need to use a simple machine to move a load. The load force is 120 N and the effort required to move the load is 30 N. Calculate the mechanical advantage of the simple machine.
Working
The equation for mechanical advantage is: mechanical advantage = load force effort forc e
Substituting the numbers into the formula gives: mechanical adavantage N 30 N == 120 4
levers
Explanation
Using a simple machine with a mechanical advantage of 4, it will only take an effort force of 30 N to move a load of 120 N. The simple machine made it four times easier to move.
Levers are very common simple machines. They are used in a variety of ways in our everyday lives to make work easier. A cricket bat, a wheelbarrow, tongs, scissors, a seesaw and a shovel are all examples of levers.
A lever usually consists of a rigid arm, which may be bent or straight, commonly made of wood or steel. Levers are used to exert a force on the load and are classified into three types, called class 1, class 2 and class 3.
All levers have the following characteristics.
• The lever has a fixed point called the fulcrum on which the arm pivots.
• An effort force is applied to the lever.
• The effort force is transferred by the lever to exert a load force that moves or pushes the load.
Class 1 and class 2 levers are called force multipliers because they magnify the effort force applied. However, the trade-off is that in order to magnify the force, it must be applied over a greater distance.
Class 1 levers
In a class 1 lever, the fulcrum lies between the load force and the effort force (see Figure 9.3a). This type of lever magnifies the effort force to generate a larger load force. In a class 1 lever, the distance moved by the effort force will be larger than the distance moved by the load. To increase the mechanical advantage and make the job easier, the distance from the point where the effort force is applied to the fulcrum should be increased, either by moving the fulcrum away from the effort force or by lengthening the lever. However, this comes at a cost. The distance you push down on the lever will be larger than the distance your load moves.
Figure 9.2 A nutcracker is an example of a lever.
For example, in Figure 9.3b, if you tried to pull up a floorboard with your fingers, it would require a lot of effort force, but your fingers only move a short distance. Using a crowbar as a lever allows you to use less effort force to complete the job, but your hand has to move a greater distance.
Figure 9.3 shows the direction and size of the effort force (input) and load force (output) in this example. Note that the effort force arrow is shorter than the load force arrow, indicating the mechanical advantage. In a class 1 lever, the effort force moves in the opposite direction to the load force. The hammer in the hammer and nail example at the start of the chapter (see Figure 9.1) is a class 1 lever.
SAMPLEPAGES
Figure 9.3 (a) A class 1 lever: the fulcrum is between the load and the effort. (b) A crowbar is a class 1 lever that can be used to lift a wooden floorboard. The effort force (blue arrow) is applied by the hand and the load force (red arrow) is applied to the floorboard.
Class 2 levers
A class 2 lever has a fulcrum at the end and the load in the middle (see Figure 9.4a). The effort is applied at the other end. Like a class 1 lever, a class 2 lever can magnify the effort force to generate a large load force which can move the object (load). In class 2 levers, the effort force moves in the same direction as the load force.
In the example shown in Figure 9.4b, can you think of a way to make the job even easier?
You guessed it! Increasing the length of the handles will increase the mechanical advantage.
Figure 9.4 (a) A class 2 lever: the fulcrum is at one end and the load is between the fulcrum and the effort. (b) A wheelbarrow is an example of a class 2 lever. The man does not have to apply as much effort force to lift the load. Without this simple machine, it would be nearly impossible to lift that amount of bricks!
Figure 9.5 A bottle opener is a class 2 lever. The fulcrum (shown by the orange triangle) rests on the cap and the effort force is applied to the handle. This results in a large load force on the edge of the cap, which opens the bottle. It would otherwise be difficult to open the bottle with our bare hands.
force
Fulcrum
Effort force
Fulcrum
Load force lifts the wooden oorboard
Effort force
Fulcrum
effect of changing the distance from the effort to the fulcrum
Aim
To investigate the effect on the effort force when changing the distance from the effort to the fulcrum.
Materials
• 1 metre ruler
• rubber stopper (alternative: eraser)
• 100 g mass × 1
Method
• 10 g masses × 10
• 5 g mass × 1
1. Write a research question guided by the aim stated above.
2. Identify the independent variable.
3. Identify the dependent variable.
4. List the controlled variables.
5. State a hypothesis based on your research question.
6. Read the rest of the method below and draw up an appropriate results table.
7. Place the rubber stopper under the 1-metre ruler at the 10 cm mark. The rubber stopper will act as a fulcrum, as shown in Figure 9.6.
8. Place the 100 g mass on top of the ruler at the 0 cm mark.
9. Place a 10 g mass on the 100 cm mark at the other end of the ruler. Observe.
10. Continue to add a 5 g or 10 g mass to the 100 cm mark until the 100 g mass is lifted.
11. Record the mass required to lift the 100 g mass in your results table.
12. Move the rubber stopper to the 20 cm mark and repeat steps 7–11.
13. Move the rubber stopper to the 30 cm mark and repeat steps 7–11.
14. Move the rubber stopper to the 40 cm mark and repeat steps 7–11.
15. Move the rubber stopper to the 50 cm mark and repeat steps 7–11.
Discussion: Analysis
1. State which class of lever was used in this experiment.
2. Describe any trends in your results.
Discussion: Evaluation
1. Discuss whether the controlled variables were managed properly to ensure they did not change and affect the measurements.
2. Identify any changes that could be made to the method to improve the quality of the data in future experiments.
SAMPLEPAGES
3. Describe how the experiment could be extended if it was done again.
Conclusion
1. Draw a conclusion from this experiment about the effect on the effort force when changing the distance from the effort to the fulcrum. Copy and complete this statement in your science book. From this activity it can be claimed that __________. This is supported by the observations that _____________. Therefore, the hypothesis is/is not supported by these findings.
Figure 9.6 Experimental set-up. The position of the fulcrum will vary.
Making thinking visible 9.1
Beginning, middle, end: Simple machines in action
The images in Figure 9.7 show the beginning and middle of a story taking place.
1. What is the person trying to do in the left-hand image and why is it difficult?
2. Identify what type of simple machine is being used in the right-hand image.
3. Describe what the missing third image might look like, using your knowledge of simple machines to explain your answer.
The Beginning, middle, end thinking routine was developed by Project Zero, a research centre at the Harvard Graduate School of Education.
Class 3 levers
Unlike class 1 and 2 levers, class 3 levers do not multiply force. In a class 3 lever, the load force generated by the lever is smaller than the effort force applied, but more speed or distance can be obtained. These levers are called speed multipliers. They are a special case where the effort force is larger than the load force. (Note that this results in a mechanical advantage of less than 1; see the formula in the Extension section.)
In a class 3 lever, the fulcrum is at one end and the effort force is between the load and the fulcrum (see Figure 9.8a). Recall that class 1 and 2 levers increase the force applied to an object, but that force must be applied over a larger distance than the load moves. In class 3 levers, the load moves a much greater distance than the effort, but with a smaller force. This type of lever is common in sports such as tennis, cricket, golf and baseball, where speed multipliers are beneficial. For example, a tennis racquet can hit a ball with much greater speed than can be achieved with just your arms. In a tennis racquet, the wrist acts as the fulcrum and the effort is applied by the hand to the handle. The load is in the middle of the racquet head. The head of the racquet moves a larger distance than the hand, multiplying its speed (see Figure 9.8b).
SAMPLEPAGES
Figure 9.7 The beginning and middle images
speed multiplier something that increases the speed of an object
Load force
Load
Effort force
Fulcrum
Figure 9.8 (a) In a class 3 lever, the fulcrum is at one end and the effort force is between the load and the fulcrum. (b) Sports scientists apply this knowledge of forces to help their clients improve their sporting performance. This knowledge has helped tennis players to now make serves at speeds above 250 km/h!
Try this 9.1 levers are everywhere!
Look around the room that you are currently in and identify as many levers as possible. Once you identify a lever, classify it as either class 1, 2 or 3.
Did you know? 9.1
Biological levers
There are a number of levers in the human body. Raising your forearm, for example, uses a class 3 lever. The elbow is the fulcrum, the bicep muscle provides the effort force to the forearm and the hand holds the load. Other levers in nature include birds' beaks and crabs' claws.
Extension
The mechanical advantage of a lever can also be calculated using the distance of the effort and load from the fulcrum (see Figure 9.10).
mechanical advantage = distance of effort from fulcrum (m) distance of load from fulcrum (m)
You also know that:
SAMPLEPAGES
mechanical advantage = load force (N) effort force (N)
Notice that when calculating the mechanical advantage using forces, the term relating to load is on the top, whereas when calculating the mechanical advantage using distance, the term relating to effort is on the top.
Distance of load from fulcrum
Distance of effort from fulcrum
Effort force
Fulcrum
Figure 9.9 The arm is a class 3 lever.
Fulcrum
Figure 9.10 How to measure the distances to the fulcrum
Worked example 9.2 shows the use of a class 1 lever to move a load. With a short lever, an effort force applied at the end of the lever produces a large force at the other end, but it is not enough to move the load.
Worked example 9.2
Figure 9.11 shows a load being moved by a lever.
a) Calculate the mechanical advantage of the lever.
b) Extension: Determine whether an object with a load of 300 N can be moved by an effort force of 50 N using the lever.
SAMPLEPAGES
9.11 An example of a lever system
Working
a) Mechanical advantage
Use the formula:
Mechanical advantage = distance of effort from fulcrum distance of load from fulcrum
Substitute the numbers:
Mechanical advantage = 90 cm 30 cm = 3
The mechanical advantage is 3.
b) Effort force required to move 300 N
Rearrange the formula so that the effort force required is on the left-hand side:
Mechanical advantage = load force effort force
Doing this gives:
effort force = load force mechanical advantage
Substituting the numbers:
effort force = 300 N 3 = 100 N
The load will not move.
Explanation
This means that the effort can lift a load three times its force.
The effort force required by this lever system to move a load force of 300 N is 100 N. This is because the mechanical advantage is 3.
This means that an effort force of 50 N will not overcome the load and make it move.
Fulcrum
Effort force
Figure
Worked example 9.3 shows that the same load can be moved by the same effort force if it is applied at the end of a longer rod. The longer lever produces a greater load force.
Worked example 9.3
The lever from Worked example 9.2 was replaced with a longer lever. Use the information in Figure 9.12 to determine whether an effort of 50 N could now move the same object with a load of 300 N.
SAMPLEPAGES
Figure 9.12 The lever system from Worked example 9.2 with a longer lever
Working
mechanical advantage = distance of effort from fulcrum distance of load from fulcrum
= 180 30 cm cm = 6
The mechanical advantage is now 6.
The effort required is now: effort forc e load force mechanical advantage = = 300 N 6 = 50 N
The effort force of 50 N is able to move the load.
Alternatively, we can find the maximum load that an effort of 50 N can move with this new lever system.
Rearrange the formula so that load force is on the left-hand side:
mechanical advantage load force effort forc e =
Explanation
The distance between the effort and the fulcrum has been increased by using a longer lever.
Now, an effort force of 50 N is required to move the load force of 300 N.
The maximum load is 300 N. Therefore, in this case, the effort force of 50 N is able to move an object with a load of 300 N.
load forceeffort force mechanical advantage
50 N 6 =× =× = 300 NN
The effort force of 50 N is able to move the load.
Explore! 9.1
aboriginal and torres Strait Islander peoples' use of simple machines
Spear-throwers are simple machines that were developed by Aboriginal and Torres Strait Islander Peoples to help with hunting. Indigenous spear-thrower devices are commonly about 50 cm long and made from hardwood timber. At one end, a hand grip is often coated with spinifex resin. At the other end is a peg, made from either wood or a large tooth, which is attached to the spearthrower using animal sinew and resin to hold the spear in place.
SAMPLEPAGES
The spear-thrower acts as a lever, multiplying the force that a hunter can apply to the spear, as well as improving its projectile accuracy. It allows spears of up to 3 m in length to be thrown at speeds of up to 150 km/h. The peg helps hold the spear (or dart) in position, and focuses the throwing force.
Figure 9.13 The design of the spear-thrower will depend on which Aboriginal and/or Torres Strait Islander group developed it. Spear-throwers are refined and altered by the people of each area to suit their own particular needs.
Torres Strait Islander People also used another simple machine, the bow and arrow, in hunting. This was not used by Aboriginal people on mainland Australia, probably because heavier spears were needed to hunt larger animals such as kangaroos.
The bow is also a simple machine, multiplying the force acting on an arrow for hunting small animals.
Conduct research and watch videos of the spear-thrower and the bow and arrow being used, then answer the following questions. Ensure you source information from a reliable and anti-racist source.
1. Draw a spear-thrower and spear, and identify where on the spear-thrower the load, force and fulcrum are located.
2. Draw a bow and arrow and identify where on the bow elastic energy could be stored and released.
3. Deduce what type of lever is being used in the spear-thrower.
Figure 9.14 A simple bow
Peg
Spear
Spear-thrower
Hand grip
Quick check 9.1
1. Define the terms 'effort force' and 'load force'.
2. Recall an example of a class 1, 2 and 3 lever.
3. Describe the difference between class 1, 2 and 3 levers in terms of where the fulcrum, load and effort are placed relative to each other.
4. Explain the term 'mechanical advantage'.
SAMPLEPAGES
5. Describe how you could make a class 1 or 2 lever more effective.
6. If a load weighs 1000 N and it takes a 100 N effort force to move it using a wheelbarrow, calculate the mechanical advantage of the wheelbarrow.
Inclined planes Ramps
The type of inclined plane you would be most familiar with is a ramp. A ramp allows objects to be moved up against the force of gravity, but over a distance. For example, it takes less effort force to push a box up a ramp onto a truck than to lift it vertically. Therefore, inclined planes provide a mechanical advantage compared to lifting an object vertically. However, once again there is a trade-off. The effort force must be applied over a longer distance. In other words, it is easier to push the object up a ramp, but you have to push it further. Inclined planes are always force multipliers.
Examples of inclined planes are boat ramps that lift boats out of the water, playground slides and inclined (sloping) roads. The longer the distance of the ramp, the greater the load that can be lifted. This means that inclined planes that are longer have a greater mechanical advantage than ramps that are shorter. Heavy vehicles cannot go up inclines of more than about 20°, so mountain roads that rise at a greater angle are designed with a series of bends to increase the horizontal length for the same rise (see Figure 9.15). This results in a longer and less steep road.
Figure 9.16 illustrates the example of a ramp and a removalist truck. Like levers, the mechanical advantage of an inclined plane can also be calculated using the length of the inclined plane:
= mechanical advantage length of theinclinedplane (m) vertical height (m)
Figure 9.16 Ramps are used to lift and move heavy objects.
Figure 9.15 Roads that climb up a steep hill often have hairpin bends to reduce the steepness of the slope (incline) for vehicles.
Worked example 9.4
Figure 9.17 shows a worker loading a heavy box into a truck. Using a ramp decreases the amount of effort needed to lift the box into the truck.
a) Calculate the mechanical advantage of each ramp.
b) Extension: If the load force was 120 N, what is the required effort force?
Working
a) Mechanical advantage
3 m ramp:
Mechanical advantage = length of inclined plane vertical height = 3 m 1 m = 3
8 m ramp: Mechanical advantage = 8 m 1 m = 8
b) Effort force
Mechanical advantage = load force effort force
3 m ramp:
Effort force = load force mechanical advantage = 120 N 3 = 40 N
9.17 Which inclined plane provides a greater mechanical advantage?
Explanation
SAMPLEPAGES
8 m ramp: Effort force = 120 N 8 = 15 N
A less steep ramp gives a greater mechanical advantage but you have to push the object further.
If the box has a load force of 120 N, the worker needs to apply 40 N of effort force with the 3 m ramp shown on the left, and only 15 N of effort force with the 8 m ramp on the right.
Figure
Inclined planes
Aim
To investigate the relationship between the effort force required to pull a mass up a ramp and the height of the ramp.
Materials
• books or wooden blocks
• spring balances (1 N, 10 N)
• 1 kg mass on a trolley
• long wooden plank
Method
1. Set up a ramp using the wooden plank and books/blocks and measure the height and the length of the plank.
2. Place the 1 kg trolley at the bottom of the ramp and attach the appropriate spring balance. (Hint: Which spring balance would be better for each ramp height?)
3. Pull the 1 kg mass up the ramp using the spring balance at a constant speed and record the force required. Record this reading in your results table.
4. Repeat the measurement two more times and record in your table.
5. Repeat steps 1–4 at four different ramp heights.
6. Complete the results table by calculating the average effort force for each ramp height. (To do this, add all the readings you took for a particular ramp angle, then divide the total by the number of readings you took for that ramp angle.)
Results
Table showing force required to pull a mass up different ramp heights
Ramp height (cm)
Height 1:
Height 2:
Height 3:
Height 4:
Force required (N)
Trial 1Trial 2Trial 3Average
Draw a graph showing the relationship between ramp height and effort force.
Discussion: Analysis
1. Identify any trends in your results.
2. Use the load force = 10 N to calculate the mechanical advantage of the ramp. Does it agree with the formula?
mechanical advantage = length of the inclined plane (m) vertical height (m)
Conclusion
1. Draw a conclusion from this experiment about the relationship between the effort force and the height of the ramp, by copying and completing this statement in your science book. From this activity it can be claimed that __________. This is supported by the observations that _____________. Therefore, the hypothesis is/is not supported by these findings. Practical 9.2
SAMPLEPAGES
Did you know? 9.2
ancient use of ramps
While the ramp appears to be a very simple machine, archaeologists believe that it was used extensively to help teams of men move the limestone blocks into position to build the pyramids in Egypt thousands of years ago.
Screws
The idea of the inclined plane is applied to much more than just ramps. Consider a screw or a bolt, and the inclined plane that wraps around its stem. Screws and bolts are used to penetrate materials such as wood or metal. Using a screwdriver to slowly rotate the inclined plane of the screw into a piece of wood takes less effort force than hammering a nail of the same size! Again, the trade-off is that the distance that the screw is rotated is much longer than the hammered nail.
Did you know? 9.3
archimedes' screw
SAMPLEPAGES
planes.
Archimedes was an ancient Greek scientist who invented a simple machine that could carry water up from a river using a screw shape. The Archimedes' screw is essentially a long inclined plane. Figure 9.20 shows a depiction from 1815 as well as a modern-day photo. Invented over 2000 years ago, the Archimedes' screw is still used today to move water to higher levels.
Figure 9.18 Blocks of limestone were moved into position on these pyramids using inclined
Figure 9.19 A screw is a special type of inclined plane.
Figure 9.20 (a) Archimedes' screw illustration from 1815. (b) A modern-day Archimedes' screw
Wedges
A wedge is a portable inclined plane that can be used to split, lift or hold an object. The wedge contains two inclined planes. When used to split an object, such as firewood, the wedge multiplies the effort force. In Figure 9.21, the blue force arrows show that the direction of the force is changed perpendicular to the inclined plane face.
Wedges can also be used to lift heavy objects off the ground by hammering the wedge underneath the object. The wedge acts as an inclined plane, lifting the load force over the distance of the wedge. For very heavy objects, the wedge is made very thin and long to increase the distance and increase the mechanical advantage.
Other examples of wedges are axe heads, doorstops and the pointed ends of nails and pins.
Figure 9.21 A wedge used to split a block of wood. It has been placed with the sharp edge on the end of the block, parallel to the wood grain (the wood's natural layers). It is then tapped with a hammer, driving it into and splitting the wood.
Quick check 9.2
1. Recall three real-world examples of inclined planes.
Force
SAMPLEPAGES
2. Explain the effect of an inclined plane on the effort force required to complete a task.
3. Explain how inclined planes are used to enable vehicles to drive up mountains.
4. Describe what happens to the mechanical advantage of a ramp as it becomes less steep.
5. State whether the effort force increases or decreases as the ramp becomes less steep.
Section 9.1 review
Section 9.1 questions
Remembering
1. Identify the missing words in the following sentence. To calculate the mechanical advantage of an inclined plane, divide ________ by ________.
Understanding
2. If the mechanical advantage is 3, calculate the maximum load force if the effort force is 50 N.
3. If the mechanical advantage is 4, calculate the minimum effort force required to lift an object with a load of 120 N.
4. Most schools and public buildings now have ramps designed for wheelchair access. Use your knowledge of ramps and forces to explain why the maximum gradient of those ramps is about 5°.
Applying
5. Classify each of the following levers as class 1, class 2 or class 3. Justify your response by describing where the fulcrum, load and effort are located for each one. a) Crowbar b) Wheelbarrow c) Seesaw
Analysing
6. Distinguish between a class 1, 2 and 3 lever, what these levers magnify and the trade-offs involved with using them.
Evaluating
7. Consider whether the lower beaks of birds are examples of levers. Examine the picture of the kookaburra beak in Figure 9.22 and use your knowledge of simple machines to justify your answer by identifying the load force, effort force and fulcrum. Do you think your jaw is also a lever? If so, what class of lever is it?
Go online to access the interactive section review and more!
SAMPLEPAGES
Figure 9.22 The laughing kookaburra (Dacelo novaeguineae) holds a meal in its beak.
9.2 Simple machines with rotating parts
Learning goals
At the end of this section, I will be able to:
1. Describe how pulleys are useful.
2. Describe how gears are useful.
SAMPLEPAGES
The lever and the inclined plane are simple machines that use stationary parts. In this section, we will explore simple machines with rotating parts, such as pulleys, wheels and axles, and gears.
pulleys
Pulleys can be used to lift heavy objects by changing the direction of the effort force. When a single fixed pulley is used, a rope attached to the load hangs over a pulley wheel, allowing the effort force to pull down on the rope (see Figure 9.23). A common example is a bucket in a well being moved up by pulling down on a rope over a single fixed pulley. This is also the type of machine used to open and close household blinds.
Although there is no mechanical advantage to using a single fixed pulley, it does allow the work to be done by pulling down on the rope rather than lifting the object directly. This makes the task easier because you are working with gravity, rather than against it.
To decrease the effort force needed to lift an object, more pulley wheels need to be added. The more pulley wheels that are added to a pulley system, the higher the mechanical advantage. If a pulley system has a mechanical advantage of 2, that means it takes half the effort force to lift an object compared to using a single fixed pulley or no pulley. However, the trade-off again is that the rope has to be pulled twice the distance to lift the load.
Pulley systems are used on construction cranes to lift heavy construction materials. This type of load would be impossible to lift by humans without a simple machine.
Figure 9.23 A single fixed pulley system can be used to lift heavy objects. It does not give a mechanical advantage but changes an upwards lifting force into a downwards pulling force, which is easier.
Figure 9.24 Cranes use pulleys to lift extremely heavy loads.
Practical 9.3: Teacher demonstration
observing the effect on effort force of more pulleys
Aim
To observe the effect on the effort force of adding more pulleys to a pulley system.
Materials
• compound pulleys × 2
• string
• 500 g mass
Method
1. You need to provide background information to the practical. Complete research and write a brief paragraph to explain the key concepts of pulleys. Ensure you reference this appropriately.
2. Create a research question based on information in the aim.
3. Set up the four pulley systems as shown in Figure 9.25 or by the teacher.
4. Copy the results table into your science book.
5. Hook a 500 g mass to the load part of the pulley.
6. Attach the spring balance to the effort part of the pulley.
• ruler
• 500 g spring balance
SAMPLEPAGES
Figure 9.25 In these pulley systems, L represents the load force (the weight of the mass attached) and E represents the effort force required to lift the mass.
7. Observe the amount of force required to lift the mass at a constant rate by pulling on the spring balance. Record.
Results
Table showing amount of force required to lift a 500 g mass using different pulley systems
Independent variable
Set-up 1: Set-up 2: Set-up 3: Set-up 4:
Discussion: Analysis
Dependent variable: Effort
1. State which pulley set-up required the lowest effort force to lift the load.
2. Describe the relationship between the number of movable pulleys and the effort force required to lift the load.
Conclusion
1. Draw a conclusion about the relationship between the effort force and the number of pulleys in the system, by copying and completing this statement in your science book. From this activity it can be claimed that __________. This is supported by the observations that _____________. Therefore, the hypothesis is/is not supported by these findings.
Extension
The mechanical advantage of a pulley system can be estimated by the number of ropes supporting the load.
mechanical advantage = number of ropes supporting the load
In Figure 9.27, when the effort force rope (blue) is pulled, each of the two load ropes (red) is shortened. As there are two load ropes and one effort rope, the mechanical advantage of this system is 2.
In Figure 9.28, when the effort force rope (blue) is pulled, the load ropes (red) are shortened. As there are four load ropes and one effort rope, the mechanical advantage is 4.
Figure 9.26 A two-pulley system
Quick check 9.3
SAMPLEPAGES
Note the black ropes have a fixed length and do not contribute to the mechanical advantage in any way.
Figure 9.27 A pulley system with a mechanical advantage of 2
Figure 9.28 A pulley system with a mechanical advantage of 4
1. Identify the mechanical advantage of the pulley system shown in Figure 9.29.
2. Calculate the maximum load that could be lifted if an effort force of 40 N was applied to the system in Question 1
3. Explain why, in practice, the actual load that can be lifted may be less than the value calculated in Question 2
Effort force = 40 0N
Load = 1200 N
Figure 9.29 A pulley system
wheels and axles
Wheels and axles are two connected circular parts that make up a simple machine. The larger circle is the wheel, which revolves on a rod called an axle. The most common use of wheels and axles is to transport heavy objects such as cars, wheelbarrows or shopping trolleys. When a force is applied to an object, it must overcome the force of friction to start moving. Wheels spin around the axle and reduce the friction force involved in moving objects, because less surface area is in contact with the ground at any given time.
SAMPLEPAGES
A wheel can also act as a force multiplier. Applying an effort force to the wheel multiplies the force on the axle, but you have to turn the wheel a larger distance.
Figure 9.30 An example of wheels and axles used to transport objects
Figure 9.31 Wheels make objects easier to move. (a) Shopping trolleys have four wheels that are attached to four separate axles. (b) Cars also have four wheels, but they are joined in pairs by two axles.
Figure 9.32 A steering wheel is an example of a force multiplier and consists of a single wheel attached to an axle.
Axle Wheel
device consisting of connecting sets of wheels with teeth
of the toothlike parts around the edge of a gear driving gear the gear connected to the source of the force driven gear the gear that rotates due to the rotation of a driving gear
Gears
Another type of simple machine is a special type of wheel, called a gear or cogwheel. These are essentially wheels with cogs (teeth) that transfer force from one wheel to another. Gears are used in bikes and clocks. In a bike, the gears are connected by a chain, whereas in a clock they are called 'meshed' gears because the teeth fit into each other.
When gears of different sizes are used, they can be either speed or force multipliers. In a gear system, the driving gear (the gear to which the effort is applied) turns the driven gear. If the driving gear is the larger of the two, then you have a speed multiplier. This is because for each turn of the large driving gear, the smaller driven gear turns more times. A motor can be attached to the gear to produce a turning force. An old-fashioned egg beater is an example of this sort of gear system in use.
A
SAMPLEPAGES
The
In this case, when the larger gear is turned using the handle, the beaters spin faster than the handle is turned. The other type of gear system is a force multiplier, where the smaller gear is the driving gear. For every turn of the driving gear, the driven gear does not turn as many times, so it turns more slowly, but it turns with more force. This type of arrangement provides a mechanical advantage and is used in mountain bikes.
Figure 9.34 By pushing the pedals on a bike, effort force is applied to the larger gear. This transfers a load force to the smaller gear connected by a chain. Selecting a larger gearwheel allows a cyclist to ride faster. If the cyclist chooses a smaller gearwheel, they will move more slowly but can climb hills more easily.
9.36 Every time the larger driving gear turns once, the smaller driven gear turns multiple times, spinning faster.
Figure 9.33
manual egg beater.
handle turns the large gear, which in turn spins smaller gears that cause the beaters to spin quickly.
Figure 9.35 (a) Chained gears in a bicycle. (b) Gears in a wristwatch.
Figure
Investigation 9.1
rube Goldberg machine
Introduction
Machines are useful – we use them to make tasks easier. However, some machines are not as efficient or useful as others. A Rube Goldberg machine is a type of machine that relies on a significant number of steps and is designed to carry out a simple task in a very complicated and convoluted way, often for entertainment purposes. These machines were named after Rube Goldberg, an American inventor and cartoonist. Rube Goldberg machines often contain a number of simple machines.
Aim
To design and construct a Rube Goldberg machine that uses at least three different machines to perform a common task.
Materials
As chosen by students but may include:
• dominoes
• playing cards
• marbles
• elastic bands
• string
• springs
• toy cars
Method
SAMPLEPAGES
• balloons
• toilet paper or paper towel rolls
• cardboard boxes (varying sizes)
• bouncy balls
• cans
• plastic bottles
• flat cardboard
• ramps
• books (preferably sturdy ones, such as old textbooks)
• sticky tape
• appliances (fans, lamps, etc.)
1. Identify a simple common task that you would like to be done by a machine.
2. Draw a plan of your Rube Goldberg machine, labelling the simple machines included in your design.
3. Start building your machine, ensuring that you test each step as you progress.
4. Once your machine is complete, make a video recording of it in action.
Results
Make sure you have at least one usable video of your Rube Goldberg machine in action that shows all the simple machines working together to perform a common or simple task.
Discussion: Analysis
1. Describe the simple machines that were used in your Rube Goldberg machine.
Discussion: Evaluation
1. Compare your final machine to your plan. Which parts (if any) are different? Why did you change them?
2. Propose any improvements or extensions you would make if you were to build another machine.
Conclusion
1. Draw a conclusion from this experiment about whether the aim was achieved, by copying and completing this statement in your science book. From this activity it can be claimed that __________. This is supported by the observations that _____________. Therefore, the hypothesis is/is not supported by these findings.
Figure 9.37 Original artwork for Rube Goldberg's 'self-operating napkin' machine
Try this 9.2
You will need a hand beater.
1. Count how many small gears and large gears are present in your simple machine.
2. Either measure the diameter of each gear or count the number of teeth.
3. Use the handle to operate your beater. Draw a diagram of the gear set-up to show how the machine works. Be sure to label the driving gear and the driven gear.
4. For every full rotation of the driving gear, how many times does the driven gear turn?
5. Explain whether this is a speed or force multiplier.
6. How could you make the machine turn faster? How could you make your machine turn with more force?
Try this 9.3
Search 'Honda – The Cog ad' on YouTube and list in your science book as many different simple machines as you can.
Section 9.2 review
Go online to access the interactive section review and more!
SAMPLEPAGES
can assign tasks and track results
Section 9.2 questions
Remembering
1. List some everyday objects that use gears.
Understanding
2. Illustrate the gear set-up most commonly used in bikes.
3. Explain the difference between a speed multiplier and a force multiplier for gears.
4. Describe when you would use a speed multiplier and when you would use a force multiplier.
5. State whether each of the gears shown here is a speed or force multiplier. The arrows indicate the driving gear. a)
Applying
6. An experiment was done with the pulley system shown in Figure 9.38 and the results are shown in the table.
Use the formula given to complete the following table and hence calculate the average mechanical advantage to two decimal places.
7. Analyse the bike gear system in Figure 9.39. Explain why a bike might have a number of different-sized driven gears.
Evaluating
8. Contrast a force multiplier and a speed multiplier.
9. A gear system has a driving gear with 30 teeth and a choice of driven gear with 10, 15, 30, 45 and 50 teeth. If the driving gear spins once per second, discuss how many times each of the driven gears would turn per second.
Figure 9.39 A bike gear system
Load
Effort
Figure 9.38 A pulley system
Go online to access the interactive chapter review!
Chapter review
Chapter checklist
Success criteria Linked questions
9.1 I can recall some types of simple machines and what they are used for. 3, 8
9.1 I can describe 'mechanical advantage'. 5
9.1 I can identify class 1, class 2 and class 3 levers. 1, 7
9.1 I can explain the types of simple machines used in Aboriginal and Torres Strait Islander Peoples' spear throwers. 9
9.2 I can describe how pulleys are useful. 4
9.2 I can describe how gears are useful. 2
SAMPLEPAGES
Review questions
Remembering
1. Recall the different classes of lever.
2. Describe the two types of gears in a gear system: driving gear and driven gear.
3. Explain how simple machines allow us to do something that would otherwise be difficult.
Understanding
4. A pulley system has a mechanical advantage of 4 but is less than 100 per cent efficient. If an effort force of 80 N was applied, explain whether the maximum load that could be lifted would be less than 320 N or more than 320 N.
Applying
5. Classify the following objects as class 1, 2 or 3 levers. a) Screwdriver opening a lid of paint b) Fishing rod
SAMPLEPAGES
6. Extension: The mechanical advantage of a lever is given by the formula: mechanical advantage = load force (N) effort force (N) = fulcrum to effort distance (m) fulcrum to load distance (m)
Use the formula to analyse the lever in Figure 9.40 and calculate the maximum load that can be moved with this lever.
Load force
e) Nutcracker
f) Pliers
c) Scissors
d) Claw hammer
Fulcrum
Effort = 20 N
Figure 9.40 A lever
g) Barbecue tongs
h) Broom
Analysing
7. Extension: Analyse the pulley system in Figure 9.41 and state the mechanical advantage. Use your result to calculate the maximum load that can be lifted by an effort force of 80 N.
SAMPLEPAGES
Evaluating
8. You have the choice of a ramp that is 6 m high and 10 m long, and a ramp that is 6 m high and 20 m long. Explore the advantages and disadvantages of each situation.
9. Explain, with the aid of a diagram, how a spear-thrower is a type of simple machine used by Aboriginal and Torres Strait Islander Peoples.
Figure 9.41 A pulley system
Data questions
The ancient Greek engineer, Archimedes, said, 'Give me a lever long enough and a fulcrum on which to place it, and I shall move the world.' In this activity you will analyse the results of the experiments by a group of Year 7 students. They designed systems to lift a 10 kg bucket of water using a series of pulleys (see Table 9.1). They also used a 2-metre class 1 lever with the bucket at one end, the effort force at the other end and the fulcrum at different distances from the bucket (see Table 9.2).
SAMPLEPAGES
Table 9.1 Effort force (N) for lifting a 10 kg bucket of water, for different numbers of pulleys used
Applying
Table 9.2 Mechanical advantage of lifting a 10 kg bucket of water using a 2-metre class 1 lever with the load (bucket) at varying distances from the fulcrum
1. Identify the number of pulleys in Table 9.1 that requires the least effort force to lift a 10 kg bucket of water.
2. Calculate the mechanical advantage of using a pulley system with five pulleys.
3. Use the data from Table 9.2 to determine which of the distances of the bucket from the fulcrum would require the least effort force to lift the 10 kg bucket.
Analysing
4. Identify the trend in Table 9.2 between the distance of the bucket from the fulcrum and the mechanical advantage.
5. Use the data in Table 9.1 to identify the relationship between the number of pulleys used and the mechanical advantage.
Evaluating
6. Deduce how the students could gain a greater mechanical advantage using the class 1 lever.
7. Use the data in Table 9.1 and Table 9.2 to compare the mechanical advantage of a five-pulley system to that of using a 2-metre class 1 lever with the bucket 40 cm from the fulcrum, and describe which simple machine would use less effort force.
8. Examine the data in Table 9.1 to predict the effort force (N) used in a 10-pulley system.
9. Predict whether mechanical advantage in Table 9.2 would increase or decrease if a 4-metre lever was used instead.
Stem activity: The mechanical arm prototype
Background information
SAMPLEPAGES
Machines have helped humans use force in efficient ways for centuries. From simple mechanical aids such as a wheel or a pulley, to complex machines such as a modern car, machines are capable of reducing the effort required for us to do work in everyday life. An extreme example of a helpful machine is the tower crane (see Figure 9.42). This machine is generally able to move up to 20 tonnes of mass all day long, which is impossible for a human being!
Simple machines such as levers and pulleys spread the required force over a longer distance, which reduces the effort force required. When two or more simple machines are combined into one machine, a complex machine is formed.
DESIGN BRIEF
Design and build a mechanical arm that can lift and move the greatest weight.
activity instructions
Your team of engineers has been assigned the task of constructing a complex machine that involves at least two simple machines to lift a load a distance of at least 30 cm vertically and move it a distance of at least 30 cm horizontally. You will provide the force to move the machine and to lift and move the load. The machine must stay in one place while its arm moves around and hooks the load.
Figure 9.42 A crane is a complex machine that uses pulleys and levers to move large masses in construction of high-rise buildings.
Your team of engineers should first explore various types of mechanical arms that could be used without a motor. Once your team agrees upon the design prototype, draw the design and start construction using materials provided by your teacher. Record the effort force required to move different load masses.
Suggested materials
• four weights: 50 g, 100 g, 250 g, 500 g
• pulleys
• ruler and tape measure
• scissors
• cardboard
Research and feasibility
• string
• straws
• popsicle sticks
• sticky tape
• wire
1. Research and list all the ways that mechanical arms are useful.
2. List the construction materials and the components used in cranes. Record the explanation for each. The table below shows an example.
MaterialsComponents
SAMPLEPAGES
Explanation
Steel latticeMast – upright steel lattice structure The mast uses triangular steel structures bolted to each other.
3. Explain which simple machine types are involved in a crane and how they contribute to the motion of the arm.
Design
4. List the materials you have available for construction and how they would be useful.
5. Design a mechanical arm that you could build using your available materials. Ensure your design includes the capacity to move a load 30 cm both vertically and horizontally.
6. Label the design and include measurements for construction.
Construction
7. Build your mechanical arm. At several points during the construction process, check that the structure continues to meet the design constraints. You may wish to test the mechanical arm's strength and ability to lift the load during construction in case you need to make refinements.
Evaluate and modify
8. Discuss the challenges that you have encountered throughout this activity. List the strategies or actions that enabled you to overcome each one.
9. Propose ways that your prototype could be improved if you had more time and resources available.
10. Predict what would happen if the prototype was used on a heavier load and test if possible.
Glossary
10 per cent rule when energy is passed from one trophic level to another, only 10 per cent of the energy is passed on
abiotic relating to the non-living things in an ecosystem abundance the number of individuals of a species within a community or ecosystem accuracy how close a measurement is to the true value adaptation a characteristic that helps an organism survive in its environment
air resistance the frictional force of the air, a common example of a drag force alloy a substance composed of two or more elements, usually metals
analyse examine something in order to find meaning, what it is made of, or its relationship to other things annular eclipse an event when the Moon blocks the Sun but the Moon is further away and the outer edge of the Sun is still visible
anomalous an outlying result that does not fit in with the pattern of the other results
apex predator a predator at the top of a food chain
apogee the point in the Moon's orbit when it is furthest from Earth applied force force that is applied to an object by another object or person
aqueous solution a solution in which the solvent is water
balanced forces forces of the same size but acting in opposite directions barrage a dam to generate electricity from tidal power biased influenced by personal opinion or judgement bilateral symmetry a form of symmetry where an organism's body can be divided into identical halves binomial nomenclature a system of naming in which two names are used to identify an individual species of organism
biomimicry the design of materials and structures that are modelled on biological forms (such as animals or biological processes)
biopiracy when naturally occurring biological material is commercially exploited
SAMPLEPAGES
biodiversity the variety of life that exists in an area biological control the practice of introducing an organism into an ecosystem with the intention of limiting the spread of another organism
biologist a person who works in the scientific field of biology
biology the study of living organisms and their interactions with each other and the environment
biomass plant and animal material suitable for using as fuel
biome a large environment that is classified based on various abiotic factors and the organisms found there
biotic relating to the living things in an ecosystem blood moon a name given to the Moon during an eclipse while it is completely in Earth's shadow
boiling the rapid vaporisation of a liquid when it is heated to a certain temperature
boiling point the temperature at which a specific liquid becomes a gas
botanist a scientist who studies plants brittle likely to break or snap when subject to a large enough force
Brownian motion the random movement of particles in liquids and gases
buoyancy the upward force experienced by an object that is partially or fully submerged in a liquid or a gas
calibrate to check the reading given by a measurement tool against a known standard in order to check the instrument's accuracy
calicivirus a virus that damages a rabbit's internal organs and can cause bleeding
carnivore an organism that eats only meat cell the smallest unit of life that makes up all living things
cellular respiration the chemical process by which cells release energy from food
centrifuge a device that uses speed and rotation to separate substances based on their density characteristic a feature or quality of something chemical property the behaviour of a substance when it reacts with another substance chemical substance matter that contains only one type of particle chemist a person who works in the scientific field of chemistry chemistry the study of matter and its composition and properties, and the interactions between substances
chemotroph an organism that obtains energy through chemical processes in its environment
chromatography a technique to separate substances based on their different solubilities in a solvent
citizen scientist a member of the public who assists professional scientists by voluntarily collecting data relating to the natural world
claim a statement made without evidence; it can be investigated and found to be supported or not supported
class the taxonomic ranking below phylum and above order
class 1 lever a lever in which the fulcrum is between the load and effort
class 2 lever a lever in which the fulcrum is at one end and the load is between the fulcrum and the effort
class 3 lever a lever in which the fulcrum is at one end and the effort is between the fulcrum and the load classification the grouping of similar objects or organisms together
cog one of the tooth-like parts around the edge of a gear
colloid a mixture where particles of one chemical substance do not dissolve but remain distributed through another chemical substance commensalism a symbiotic relationship where one organism benefits and the other organism doesn't benefit but is not harmed
community a group of animals or plants that live or grow together
compound a chemical substance made up of two or more types of atoms compress squeeze to make smaller concave a surface that curves inwards concentrated having a relatively large amount of solute concentration the number of particles in a given volume condensation when a gas loses heat and becomes a liquid
consumer an organism that obtains food by consuming other organic material contraction the process of a substance getting smaller: particles move closer together as they cool controlled variables variables that are kept the same during an experiment to ensure they don't affect the dependent variable
convex a surface that curves outwards crystallisation the process through which certain solutes form a crystalline solid when a solvent evaporates slowly
decomposer an organism such as a bacterium or fungus that breaks down organic material
density how much matter (mass) is contained in a certain volume of a substance
dependent variable the variable that is tested or measured during an experiment (to see how it responds to changes in the independent variable) deposition when a gas loses heat and becomes a solid without passing through the liquid state
SAMPLEPAGES
Cultural Lore the stories, customs, beliefs and spirituality of Aboriginal and Torres Strait Islander people, which are passed down through generations and act as a guide for everyday life
data information in the form of facts or statistics gathered to answer a question or for further analysis dawn the time of day when the Sun rises over the horizon and night turns into day
decantation the process of separating substances by using density
deciduous a tree that loses its leaves in autumn and grows new ones in spring
detritivore an organism that feeds on dead or decaying organic matter
detritus dead organic waste or debris
dichotomous key a tool used to identify organisms, where there are a series of questions with only two alternatives
diffusion the movement of particles from an area of high concentration of particles to low concentration of particles
dilute having a relatively small amount of solute dissolve to become mixed in a substance so that it cannot be seen
distillate the condensed liquid product from distillation distillation a technique to separate substances in a liquid using evaporation through boiling and condensation
DNA deoxyribonucleic acid, a chemical in the cells of living things that carries genetic information domain the highest taxonomic rank above kingdom and even more broad
drag the frictional force of a liquid or gas driven gear the gear that rotates due to the rotation of a driving gear
driving gear the gear connected to the source of the force
dusk the time of day when the Sun drops below the horizon and day turns into night earth and space science the study of natural processes and phenomena occurring on Earth and in the universe beyond ecological niche the role and space that an organism fills in an ecosystem, including all its interactions with the biotic and abiotic factors of its environment
ecosystem the interrelationship between living and non-living components of a specific area
ectothermic cold blooded; unable to regulate its internal temperature
effort force the input force applied by you to a simple machine
egestion the process of removing undigested waste material from the body in faeces
elastic bends, stretches or compresses when a force is exerted on it; the material exerts elastic spring force when this happens
electromagnet a magnet made by passing electricity through a coil of wire
electrostatic force a non-contact force between positive and negative charges; opposite charges attract, like charges repel
element a chemical substance made up of only one type of atom
elliptical oval-shaped
emulsion a colloid of two or more liquids endothermic warm-blooded; able to regulate its body temperature
energy the ability to do work
environment the physical conditions in which an organism lives
equator an imaginary line around the middle of Earth, equidistant (halfway) between the North Pole and South Pole
erosion the process by which broken rock particles are carried away by the action of wind and water
eukaryote an organism whose cells contain a nucleus
evaporation when heat causes liquid to become gas; also known as vaporisation
excretion the process of removing metabolic waste from the body
expansion the process of a substance getting larger: particles move further apart as they heat up
experiment a controlled situation where data is gathered to answer a research question
extremophile an organism that thrives in conditions of extreme temperature, pH or chemical concentration
fair test a well-designed experiment where only the independent variable is changed, and all the other variables that might have an impact are controlled family the taxonomic ranking below order and above genus
far side the face of the Moon that is always turned away from Earth; also called the dark side field a region in space in which an object is affected by a force
food pyramid a graphical representation of the flow of energy at each trophic level in an ecosystem
food web a group of interconnected food chains
force a push, pull or twist in a specific direction
force arrow diagram a drawing showing the direction and size of forces acting on an object using arrows force meter a piece of equipment that measures force in newtons (N)
SAMPLEPAGES
filtrate the substance that passes through a filter filtration separating a mixture with different states of matter by passing it through a filter
firestick farming the cool burning of areas of bush in stages, by the application of firesticks, to encourage new growth
flocculant a chemical substance that causes particles to clump together
flotation separating a mixture based on the capacity to float
food chain a sequence of living things that shows their feeding relationship and the flow of energy between them
force multiplier something that increases the size of a force
fossil fuel fuels, such as gas, coal and oil, that were formed underground from plant and animal remains millions of years ago
freezing when a liquid loses heat and becomes a solid friction a contact force opposing motion due to the interaction between two surfaces
fulcrum the point on a lever where the arm pivots gas a substance that expands freely to fill space
gear a device consisting of connecting sets of wheels with teeth
genre a category used to group media such as music, art or books
genus the taxonomic ranking below family and above species
geothermal energy heat energy from inside the Earth gravitational field the region around a large object where another object experiences its gravity or pull gravitational force a force caused by a large object pulling everything around it towards its centre
gravity a non-contact force describing the pull of any object with mass
greenhouse gas a gas that causes heat to be trapped in the atmosphere
greywater water that has been used for washing and can be stored and used again for other things, such as flushing toilets
groundwater water that collects beneath Earth's surface habitat the place where an organism lives hazard a piece of equipment or situation that could cause harm
herbivore an organism that eats only plants
herbivory the consumption of plants
heterogeneous mixture a mixture in which the components are not evenly distributed hierarchical where smaller groups are placed within larger groups, with no overlap between groups holistic considering the whole thing rather than just the parts individually
homogeneous mixture a mixture in which the components are evenly distributed horizon the point where the sky appears to meet the land or the sea
hydroelectricity electricity produced by the force of fast-moving water hypothesis a proposed explanation of, or educated guess about, the outcome of an event (e.g. an experiment) based on research and current knowledge; can be tested impact force a contact force that sometimes only lasts for a short time; impact forces often change an object's speed
independent variable the variable that is deliberately changed during an experiment inference a reason or explanation applied to an observation, based on past experience or known facts insoluble not able to be dissolved in a particular solvent interdependence the dependence between different species in a community interspecific occurring between members of different species
intraspecific occurring between members of the same species
introduced species an organism that is not native to an environment
invasive species an organism that is not native to an environment and causes harm to native organisms invertebrate an animal that does not have a backbone investigable question a research question that can be answered by conducting a scientific experiment kinetic energy the energy of moving matter kingdom the highest and broadest classification on the Linnaean taxonomic rankings knowledge the understanding of information koolamon also spelled coolamon, a carrying vessel, widely used by Aboriginal and Torres Strait Islander Peoples across Australia
mechanical advantage the ratio of the output force to the input force
melting when heat causes a solid to become a liquid melting point the temperature at which a specific solid becomes a liquid meniscus the curved surface of a liquid in a container mesopredator a predator in a mid-ranking trophic level, which usually hunts smaller animals metamorphosis the process of transformation from an immature form to an adult form
SAMPLEPAGES
leap year a year that happens every four years and has an extra day on 29 February lever a rigid bar that moves around a fixed point (fulcrum) so one end can be pushed or pulled to move the other end with a greater or smaller force liquid a substance that flows freely, takes the shape of its container and has constant volume load the object that is to be moved load force the output force applied by the simple machine to the object (load)
lunar eclipse an event when a full Moon becomes dark as it enters Earth's shadow magnetic field the space around a magnet where the magnetic force can act magnetic force a non-contact force between a magnet and another magnet or magnetic metal mass the amount of matter in an object; mass never changes, even in space matter anything that has mass and volume
microbiologist a scientist who studies very small living things like bacteria
microorganism an organism that can only be seen through a microscope
migration the process of animals travelling to a different place, usually when the season changes and often in large numbers
mineral the building blocks of rocks; each has a specific chemical structure that is the same throughout the entire mineral misnomer a wrong or inaccurate name mixture material that is made up of two or more types of chemical substances that are not chemically bonded together
morphology the form and structure of organisms mouldable soft enough to be shaped mutualism a symbiotic relationship where both organisms benefit natural resource a substance or energy source found on Earth that is used by people and has economic value
neap tide when there is the smallest difference between the height of the water at high tide and the height of the water at low tide
net force the sum of all forces acting on an object newton the unit of force; one newton is roughly equal to the force you need to keep an apple from falling non-renewable a resource that cannot be replaced or takes a very long time to be replaced (i.e. much longer than a human lifetime)
non-vascular not containing veins or specialised fluid vessels
normal force the force that prevents solid objects from passing through each other, sometimes called the support force
northern hemisphere the half of Earth north of the equator
nuclear energy the energy obtained from inside particles; two processes used to obtain nuclear energy are nuclear fission and nuclear fusion observation a statement based on information gathered via your senses observe use senses and tools to notice something or to gather data/information
ocean energy energy harnessed from the movement of the ocean, such as waves and tides
omnivore an organism that is naturally able to eat both plants and meat
oral tradition a system for preserving cultural beliefs, knowledge and traditions, passed down verbally or by example from one generation to the next, without written instruction
orbit the curved path of a celestial object or spacecraft around a star, planet or moon
order the taxonomic ranking below class and above family
organism a living thing
outlier an outlying result that does not fit in with the pattern of the other results
parallax error an error caused by not reading a liquid measurement at eye level, which leads to the measurement being too high or too low
parasite an organism that lives in or on another organism and takes its food from the other organism's body
parasitism a symbiotic relationship where a parasite benefits from living on or in a host (which is harmed) partial eclipse an event when the Sun is partially blocked by the Moon
particle model all matter is made of particles that behave differently depending on whether they are solid, liquid or gas
pathogen an organism that can cause illness
peer-review to read, check and give an opinion about something that has been written by another scientist or expert working in the same subject area
penumbra the region in a shadow where the light is partially blocked
perigee the point in the Moon's orbit when the Moon is closest to Earth
photosynthesis the process by which a plant uses energy from the light of the Sun to produce its own food
photovoltaic able to produce electricity from light phylum the taxonomic ranking below kingdom and above class
predator an organism that obtains food by killing and consuming other organisms
prediction an estimate about a possible future event or outcome
pressure the amount of force exerted on a given area prey an organism hunted and killed by another organism for food
primary consumer an organism that eats plants producer an organism that produces food via photosynthesis
SAMPLEPAGES
physical property the way a substance looks and acts; a characteristic of a substance that can be observed and/or measured without changing it chemically
physicist a person who works in the scientific field of physics
physics the study of matter, energy and forces, and their interactions with each other and the universe pollinator an organism that moves pollen from one plant, or part of a plant, to another population all organisms of a particular species or group who live in one area
precision how close measurements are to each other
prokaryote a unicellular organism that lacks a nucleus pull to exert a force away from something pulley equipment consisting of a grooved wheel (or wheels) with a rope or chain attached to an object to be moved
pure substance material that is made up of just one type of chemical substance push to exert a force towards something qualitative a form of data that is descriptive quantitative a form of data that is a numerical measurement
radial symmetry a form of symmetry where an organism's body can be divided into identical parts around a central axis
radiation the emission of energy in the form of light or heat
ramp an inclined surface connecting a higher and a lower level
random error an error that does not follow a regular pattern, and is caused by factors that cannot be easily controlled by the experimenter rehabilitation leaving land that has been mined safe, stable and sustainable for ongoing use reliable complete, accurate and able to be trusted renewable replenished by natural processes within a human lifetime
renewable energy credits (REC) certified proof that the energy being used from the grid is renewable repel to force back or apart residue the substance that is left in a filter revolution one complete orbit rewilding the process of protecting an environment and returning it to its natural state, for example by bringing back wild animals that used to live there rotate to turn or spin on an axis
salinity the amount of salt dissolved in a body of water saturated containing the maximum amount of solute dissolved in the solvent
scavenger an organism that feeds on dead animals that it has not killed itself
secondary consumer an organism that eats primary consumers
sessile fixed in one place and not able to move
sieving separating solids based on the size of their particles
simple machine a basic mechanical device for applying a force and changing its size or direction
slant intake well an intake pipe laid beneath the ocean floor
smog a mixture of smoke, gases and chemicals, especially in cities
solar eclipse an event when the Sun partly or completely disappears from view, while the Moon moves between it and Earth
solar energy the energy from the Sun used to produce electric power or to heat water
solid a substance that has a fixed shape and constant volume
soluble able to be dissolved in a particular solvent
solute the component of a solution that has dissolved into another substance
solution a mixture where one chemical substance is evenly dissolved in another
solvent the component of a solution that another substance has dissolved into southern hemisphere the half of Earth south of the equator
species the most specific taxonomic ranking below genus
speed multiplier something that increases the speed of an object
spring tide also known as king tide; when there is the greatest difference between the height of the water at high tide and the height of the water at low tide
state a distinct form that matter can exist in static electricity a build-up of electric charge
streamlined designed to minimise air resistance or drag sublimation when heat causes a solid to become a gas without passing through the liquid state
sunspot a feature on the Sun's surface that moves slowly across the surface
supersaturated containing more solute than a saturated solution
syzygy the alignment in astronomy of three or more objects in a straight line
taxonomy a branch of science that groups and names organisms based on their relationships tension the force in a wire, cable or string when being stretched
tertiary consumer an organism that eats secondary consumers
SAMPLEPAGES
suspension a mixture where one chemical substance will eventually settle out of the solvent sustainable using natural resources responsibly so they remain at the same level, in order to support present and future generations
symbiosis a long-term close interaction between two organisms of different species synchronous rotation when one rotation of an orbiting body takes the same length of time as its revolution around a larger body systematic error an error that causes measurements to differ from the true result by a consistent amount, often due to faulty or uncalibrated equipment
the Dreaming the spiritual framework of Aboriginal and Torres Strait Islander cultures that explains the creation and interconnectedness of all things, existing beyond time and guiding relationships with land, community and culture
time zone Earth is divided into 24 time zones, each about 15 degrees of longitude and each one representing a time difference of 1 hour
total eclipse an event when the Sun is completely blocked by the Moon
totem a natural object, such as a plant or animal, that is inherited by members of a clan or family as their spiritual emblem
trophic level an organism's level or position in a food web, based on its feeding habits; producers occupy the first trophic level
turning force a force that increases or decreases an object's rate of rotation
umbra the region in a shadow where the light is completely blocked unbalanced forces a combination of one or more forces that has an overall effect, and which changes an object's motion
unicellular consisting of one cell variable a component of an experiment that changes or can be deliberately changed vascular containing veins or specialised fluid vessels vertebrate an animal that has a backbone vibrate move to and fro viscosity the resistance of fluid to flow volatility how easily a liquid evaporates; a volatile liquid has a low boiling point volume the space an object occupies waning the period of about two weeks where the illuminated part of the Moon is decreasing from a full moon to a new moon
water cycle the way that water is taken up from the sea, rivers, lakes and soil, and then comes back down as rain, snow or hail
waxing the period of about two weeks where the illuminated part of the Moon is increasing from a new moon to a full moon weathering the process by which rocks are broken down through natural means weight the force of gravity on an object; it is measured in newtons and changes in space
Peoples astronomy and, 304, 311, 317 body painting by, 77 classification systems of, 61 data about, 40 harvesting by, 147 knowledge and science of, 6–7 land management by, 150, 152, 157, 270 oral traditions of, 5 plants used by, 74 seasonal calendars of, 300 separation techniques of, 220, 221, 222 tools and machines of, 151, 344, 381 water and, 275 abundance (in ecosystems), 109 acceleration due to gravity, 355 accuracy, 34 adaptations by organisms, 108–9 aeroplanes, 345 agnatha, 90, 92 agronomy, 10 air energy from, 256–7 resistance due to, 334, 353–5 alloys, 358 amphibians, 90, 92 analysing data, 7 animals, 64, 82–95 migration of, 304 phyla in kingdom of, 82–3 annelids, 83, 84 annular eclipses, 316 anomalous results, 80 antipodes, 292 apex predators, 130 apogee, 316 applied forces, 349 aquatic centres, 253 aquatic invertebrates, 84 aqueous solutions, 214 archaea, 63–4, 71, 72 Archimedes’ screw, 385 arthropods, 83, 85 astronomical units, 315 astrophysics, 9 asymmetry, 87 atomic bombs, 359 axles, 391
calibration of measurement tools, 38 calicivirus, 157 capacity (as a physical measurement), 35 carbon credits, 272 careers in science, 237 carnivores, 126 carrion, 140 cars, 277, 279 cecotropes, 134 celestial emu, 304 cells, 59 cellular respiration, 122, 256 cement, 266 centrifuges, 220–1 chemical properties of substances, 179 chemical substances, 205 chemical warfare, 186
chemistry states in, 169, 188–91 types of, 9 chemists, 9 chemosynthesis, 127 chemotrophs, 127 chondrichthyes, 90, 92 chordates, 83, 85, 90–2 chromatography, 228, 230 citizen scientists, 158 claims, investigation of, 16 class 1 levers, 374–5 class 2 levers, 374, 375 class 3 levers, 374, 377 classes of organisms, 62, 90–2 classification of organisms, 46, 47, 50, 59–64 dilemmas in, 68 methods used in, 51–3 climate, 106 climate change, 72 climate positive initiatives, 153 cnidarians, 83, 84 coal, 265, 266 cogs, 392 colloids, 207 commensalism, 116, 118 common names of organisms, 51, 65 communication of results, 40–3 communities (in ecosystems), 109 competition (in ecosystems), 114, 118 compounds (in chemistry), 205 compression, 180 concave surfaces, 38 concentration, 173 of solutions, 214–15 concrete, 266 condensation, 190 consumers (in ecosystems), 126–30 levels among, 130 types of, 127–9 contact forces, 328, 340–9 contraction, 175 controlled variables, 19 convex surfaces, 38 coolamon, 220 cooling, 175 corona of the Sun, 315 crescent moon, 306 crystallisation, 231 cultural burning, 150, 270 Cultural Lore, 6
daily cycle on Earth, 289 data, 7, 20–1, 54 dawn, 290 daylight vs days, lengths of, 297, 301
decantation, 219 deciduous plants, 298 decomposers (in ecosystems), 139, 142 Deep Earth Imaging, 277 deforestation, 112, 155 density of matter, 180, 219–21 deoxyribonucleic acid (DNA), 8, 60, 119 dependent variables, 19 deposition, 190 desalination, 226, 272–4 desublimation, 190 detritivores, 139, 141 detritus, 139 dichotomous keys (in taxonomy), 52, 53, 54–5 diffusion, 173 digestion, 134 dilute solutions, 214 dingoes, 136 diseases, waterborne, 246 dissolution, 205 dissolving substances, 205 distillate, 234 distillation, 234 diversity (in ecosystems), 146, 149 DNA see deoxyribonucleic acid domains (in taxonomy), 63–4 drag (in physics), 334 dragons (reptilian), 93 drawing, scientific, 28–9 Dreaming, the, 6 driven vs driving gears, 392 dusk, 290
EEarth, the, 287 deep imaging of, 277 energy from, 252, 255–6, 264–8, 269 hemispheres of, 297 magnetic field of, 360 magnetic poles of, 359 resources from, 249, 251–7, 264–70 rotation of, 290–4, 299 size relative to Moon and Sun, 315 tilt of, 299 yearly cycle of, 297–304 earth and space science, 10 echidnas, 68 echinoderms, 83, 85 eclipses annular, 316 lunar, 314, 317–18 partial, 314 solar, 314–16, 318 total, 314–15 ecological niches, 114 ecology, 9 ecosystems, 102, 103, 106 abundance in, 109
competition in, 114, 118 consumers in, 126–30 distribution of, 107 diversity in, 146, 149 endangered, 110 energy in, 122, 132–3 humans and, 146–58 interactions in, 118 levels in, 109 producers in, 123 recycling in, 139–44 ectoparasites, 117 ectothermic organisms, 91 effort force, 373 egestion, 132 elastic spring forces, 336, 345–6 elastic substances, 336 electric motor vehicles, 279 electricity, 252, 253, 362 electromagnets, 360–1 electrostatic forces, 328, 361–2 elements (in chemistry), 205 elliptical orbits, 297 emergency warning systems, 311 emissions, zero, 253 Emu in the Sky, 304 emulsions, 207 endangered communities (in ecosystems), 110 endangered species, 93, 136, 155 endoparasites, 117 endothermic organisms, 91 energy from air, 256–7 from the Earth, 252, 255–6, 264–8 in ecosystems, 122, 132–3 flow of, 132–3 geothermal, 252, 255–6 from hydrogen, 277 kinetic, 170 from minerals, 264–8 non-renewable sources of, 251, 264–8 nuclear, 264, 268 from oceans, 252, 254–5 from organisms, 257 renewable sources of, 251–61 from rock, 264–8 from soil, 269 solar, 252, 253, 260–1 sources of, 251–61, 264–8 from the Sun, 260–1 from tides, 254 for transport, 277–9 from water, 253–5 from waves, 254, 255 from wind, 257 energy flow (in ecosystems), 132–3 environment, 106 abiotic vs biotic features of, 106, 107 hazards in, 200 equator, 297 erosion of rock, 269
PPE see personal protective equipment precision, 34 predation, 115, 118 predators, 115 apex, 130 meso-, 136 predictions, 7 pressure (in physics), 173 prey, 115 prickly pear, 157 primary consumers, 130 producers (in ecosystems), 123 prokaryotes, 70–1 properties of matter, 179, 205 protected species, 86 protists, 64, 70, 71 pulleys, 373, 388–90, 406 pulling forces, 327, 328 pure substances, 205, 209
R
radial symmetry, 85 radiation, 175 ramps, 373, 382–5 random errors, 37–8 RECs see renewable energy credits (RECs) recycling, 139–44, 211, 274, 276 reduction of waste, 276 rehabilitation, land, 275–6 reliable data, 20 renewable energy credits (RECs), 272 renewable resources, 251–61 repelling (repulsive) forces, 357 reports, 40–3 reptiles, 90, 91, 93 research background, 18 questions in, 16–17 residues, 222–3 resources, 249, 251–61, 264–70 respiration, cellular, 122, 256 results of investigations anomalous, 80 communication of, 40–3 outlying, 80 reuse of materials, 276 reverse sublimation, 190 revolutions (in astronomy), 297 rewilding, 136 ringed worms, 84 risk assessment, 28 rock energy from, 264–8 erosion of, 269 molten, 185 roles in science, 12 rotation/s, 297, 332 of the Earth, 290–4, 299 forces of, 335 of the Moon, 306 planetary, 290 of the Sun, 295 synchronous, 306 Rotblat, Joseph, 359 roundworms, 84
S salinity, 273 saturation of solutions, 215 scavengers, 139, 140–1 science, 3, 5–12 ancient, 6–7
careers in, 237 communication and, 40–3 drawing in, 28–9 fields of, 9–10 method in, 7, 15–21, 41–3 modern, 7–10 names in, 65–6 reports in, 41–3 roles in, 12 scientific drawing, 28–9 scientific method, 7, 15–21, 41–3 scientific names (of organisms), 65–6 scientific practical reports, 41–3 scientists roles among, 12 work arrangements for, 10–11 screws, 385 seasons, 297–304 secondary consumers, 130 sediment, 219 separation techniques, 211, 218–26, 228–36 sessile organisms, 82 shadows, 291 sieving, 222 simple machines, 371, 381 with rotating parts, 388–92 without rotating parts, 373–86 skies, night, 292–3 slant intake wells, 273 smog, 209 snakes, Victorian, 52–3 soft-bodied invertebrates, 84 soil, energy from, 269 solar eclipses, 314–16 annular, 316 partial, 314 total, 314–15 solar energy, 252, 253, 260–1 solar motor vehicles, 279 solar thermal panels, 260–1 solids, 169, 172, 180–2 solubility, 228 soluble substances, 214 solutes, 207 solutions, 207, 213–15 solvents, 207 sources, energy, 251–61, 264–8 southern hemisphere, 297 spear-throwers, 381 species, 62 diversity of, 146, 149 endangered, 93, 136, 155 introduced, 149 invasive, 156 protected, 86 speed multipliers, 377 spiders, trapdoor, 8 sponges (poriferans), 83 spring tides, 310 springs, 345–6 stars, 6, 292–3 states (in chemistry), 169, 188–91
states of matter, 169–70 static electricity, 362 streamlining, 343 sublimation, 189, 190 substances bendable vs brittle vs elastic vs mouldable, 336 chemical, 205 chemical vs physical properties of, 179 dissolving, 205 hydrophobic, 179 impure, 203 insoluble vs soluble, 214 mixtures of, 203, 205–11, 218–26, 228–36 pure, 205, 209 see also matter Sun, the, 297 corona of, 315 energy from, 260–1 positions of, 299 rotation of, 295 size relative to Earth and Moon, 315 sunspots, 295 super properties of matter, 179 superhydrophobic substances, 179 supernatant, 219 supersaturated solutions, 215 support force, 332 suspensions, 207 sustainability, 147, 272–80 symbiosis, 114, 116 symmetry, 85, 87 synchronous rotation, 306 systematic errors, 37–8 syzygy, 314
TThinking with images, 206 What can be, 94 tides, 254, 309–11 time, measurement of, 35 time zones, 294 toads, cane, 156, 158 toothpaste, 172 total eclipses, 314–15 totems, 6, 61 traditions, oral, 5 transport, energy for, 277–9 travel by aeroplane or helicopter, 344, 345 by motor vehicles, 277, 279 trophic levels, 130 Truganini, 5 turning forces, 335 turtles, sea, 360
ChrisSteer, 6.35 / Anadolu, 6.36 / Siegfried Layda, 6.39 / Daniel Bosma, p. 282 / Simone Gramegna, Chapter 7 Opener / Twenty47studio, 7.1 / Dea / V. Giannella, 7.2(a) / Universal Images Group, 7.3, 7.7 / Deimagine, 7.8 / Micha Pawlitzki, 7.11 / Rachel Lewis, 7.15 / Southern Lightscapes-Australia, 7.16, 7.33 / Naomi Rahim, 7.17 / Agitlits, 7.18 / Alasdair Turner, 7.22 / Jason Edwards, 7.24 / Gerard Soury, 7.25 / shoo_arts, 7.28 / Aaron Foster, 7.29 / Dimitris66, 7.32(b) / Andrea Robinson, 7.36 / Todd Ryburn Photography, 7.41 / John Lamparski, 7.42 / Stocktrek Images, 7.45 / Anadolu, 7.46(a) / The Washington Post, 7.46(b) / Masa Asano, 7.48 / Christophe Lehenaff, 7.50 / Carlos Manchego / 500px, 7.51 / Mark Garlick/Science Photo Library, 7.54 / Buena Vista Images, Chapter 8 Opener / J.A. Bracchi, 8.4 / Westend61, 8.6 / Aire images, 8.7 / Elena Popova, 8.8 / Photography by Mangiwau, 8.9 / Douglas Sacha, 8.10 / Anton Petrus, 8.11 / Ben Jared, 8.12(a) / Lucato, 8.12(b) / Michael Rowe, 8.13 / Teerasak Ainkeaw / 500px, 8.14 / Yakobchuk Olena, 8.15 / The Good Brigade, 8.17 / Lola Molina, 8.18 / Junichi Hayakawa, 8.19 / Pinkybird, 8.20 / Lucagal, 8.21 / Technotr, 8.23 / Pavel, p. 344 / Cihatatceken, 8.24 / Magdevski, 8.25 / Peter Charlesworth, 8.26 / Chameleons eye, 8.27 / Albert Wright, 8.28 / Whitemay, 8.29(1) / Lakeview_Images, 8.29(2) / Vicki Smith, 8.30(a) / AFP, 8.31 / Serts, 8.36 / Stockcam, 8.37 / David Madison, 8.38 / Andersen Ross, 8.39(1) / PhotoAlto/Ale Ventura, 8.39(2) / Spooh, 8.40(1) / Foto Voyager, 8.40(2) / David Talukdar, 8.41 / Fabio Formaggio / 500px, 8.42 / Print Collector, 8.43 / New Saetiew, 8.45 / Wittayayut, 8.47 / Ullstein Bild Dtl., 8.48 / Mitchell Pettigrew, 8.50 / Haryigit, 8.51 / Eri Morita, 8.53 / Robertcicchetti, 8.54 / Scott E Barbour, 8.55 / Auscape, 8.56 / Comstock, 8.57(1) / Studiocasper, 8.57(2) / Future Publishing, 8.58 / Peter Unger, 8.60(1) / Pailin S. Kulvong, 8.60(2) / Deejpilot, p. 369(1) / SunflowerEY, p. 369(2) / Hinterhaus Productions, Chapter 9 Opener / SolStock, 9.1 / PM Images, 9.2 / Steve Gorton, 9.3(b) / Ljupco, 9.4(b) / Czekma13, 9.5 / Elodie Rousset, 9.7(1), 9.7(2) / Master1305, 9.8(b) / Independent Picture Service, 9.13(1) / Fiona Harper, 9.15 / Kali9, 9.16 / Amir Makar, 9.18 / Yevgen Romanenko, 9.19 / Print Collector, 9.20(a) / Arterra, 9.20(b) / Sergey Ryumin, p. 386 / Andrew Haysom, 9.22 / Paulo Amorim, 9.23 / Bloomberg, 9.24 / Melvyn Longhurst, 9.30 / Photo Alto/James Hardy, 9.31(1) / Bernhard Lang, 9.31(2) / Aire images, 9.32 / Larry Washburn, 9.33 / Youst, 9.35(a) / Annabelle Breakey, 9.35(b) / Jeffoto, 9.36 / Maisie Paterson, 9.39 / Jakob Helbig, p. 396 / Anton Petrus, 9.42. Jean-Paul Ferrero / / Daniel Bosma, p. 282; Auscape, iii; ‘Sydney-brown-trapdoor-spider’ by Johan C.G. Fagerholm, under a CC BY 3.0 licence, via Wikimedia Commons, 1.4; ‘Aliatypus thompsoni trapdoor opened’ by Marshal Hedin, http://www.bio. sdsu.edu/pub/spiders/Atyp2003/Atyp2003.html, under a CC BY 2.5, via Wikimedia Commons, 1.5(2); Endorphin_ SK / Shutterstock, Table 1.4(9); Sciencephotos / Alamy Stock Photo, Table 1.4(10); Reproduced by permission of McPherson Media Group, 1.28; ‘Eastern Bandy-bandy, Vermicella annulata’ by Will Brown - Eastern Bandy-bandy, Vermicella annulata, under a CC BY 2.0 licence, via Wikimedia Commons, 2.6(3); ‘Eastern Small-eyed Snake’ by Matt, under a CC BY 2.0 licence, via Wikimedia Commons, 2.6(6); ‘Terianniaq-Qaqortaq-arctic-fox’ by Algkalv, under a CC BY 3.0 licence, via Wikimedia Commons, 2.8(a); ‘Lisek2’ by Longdistancer, under a CC BY 3.0 licence, via Wikimedia Commons, 2.8(c); ‘A chital stag’ by T.R. Shankar Raman, under a CC BY-SA 4.0 licence, via Wikimedia Commons, 2.10(b); ‘Leopardus Tigrinus’ by Groumfy69, under a CC BY-SA 3.0 licence, via Wikimedia Commons, 2.10(c); ‘Common Bluebottle-Graphium sarpedon teredon’ by K. Mohan Raj, under a CC BY-SA 3.0 licence, via Wikimedia Commons, 2.11(a); ‘Orchard swallowtail lam08’ by Aviceda, under a CC BY-SA 3.0 licence, via Wikimedia Commons, 2.11(b); ‘Cabbage White (Pieris rapae)’ by Ryan Hodnett, under a CC BY-SA 4.0 licence, via Wikimedia Commons, 2.11(c); ‘Common leopard butterfly’ by Aryashiju, under a CC BY-SA 4.0 licence, via Wikimedia Commons, 2.11(d); ‘Common Imperial Blue’ by Nature Share, under a CC BY 2.5, via Wikimedia Commons, 2.11(e); ‘CSIRO Science Image 3831 Ulysses Butterfly’ by CSIRO, under a CC BY 3.0 licence, via Wikimedia Commons, 2.11(f); ‘CSIRO Science Image 2484 Green spotted Triangle Butterfly’ by CSIRO, under a CC BY 3.0 licence, via Wikimedia Commons, 2.11(g); ‘Cornelian (Deudorix epijarbas) female’ by Anila Manalil, under a CC BY-SA 4.0 licence, via Wikimedia Commons, 2.11(h); ‘Citrus Australasica brown fruit1’ by Zaareo, under a CC BY-SA 3.0 licence, via Wikimedia Commons, 2.12(1); ‘Solanum centrale fruit’ by Mark Marathon, under a CC BY-SA 4.0 licence, via Wikimedia Commons, 2.12(3); Poyt448 Peter Woodard, Public domain, via Wikimedia Commons, 2.12(4); ‘Diploglottis Campbellii’ by Sandid, under a CC BY 3.0 licence, via Wikimedia Commons, 2.12(6); ‘Diprotodon Optatum’ by Nobu Tamura, under a CC BY 3.0 licence, via Wikimedia Commons, 2.13(1); ‘Varanus priscus BW’ by Arthur Weasley, under a CC BY 3.0 licence, via Wikimedia Commons, 2.13(2); ‘Dromornis BW’ by Nobu Tamura, under a CC BY 3.0 licence, via Wikimedia Commons, 2.13(3); ‘Palorchestes BW’ by Nobu Tamura, under a CC BY 3.0 licence, via Wikimedia Commons, 2.13(4); ‘Thylacoleo BW’ by Nobu Tamura, under a CC BY 3.0 licence, via Wikimedia Commons, 2.13(5); ‘Simosthenurus BW’ by Nobu Tamura, under a CC BY 3.0 licence, via Wikimedia Commons, 2.13(6); ‘Carving of Bunjil the eagle’ by Mick Harding, reproduced with the permission of Mick Harding via Copyright Agency Visual Arts, 2.16; ‘Petauroides volans’ by Third Silence Nature Photography, under a CC BY 4.0 licence, via Wikimedia Commons, 2.17; ‘Physalis angulata’ by Len Worthington, under a CC BY-SA 2.0 licence, via Wikimedia Commons, 2.21; ‘Dendrobium bigibbum 74 Sunbury St Geebung’ by John Robert McPherson, under a CC BY-SA 4.0 licence, via Wikimedia Commons, 2.22(b); ‘Red-capped Robin (Petroica goodenovii)’ by Ron Knight, under a CC BY-SA 2.0 licence, via Wikimedia Commons, 2.22(c); ‘Limnodynastes dorsalis Western banjo frog’ by Aussie Oc, under a CC BY-SA 4.0 licence, via Wikimedia Commons, 2.24(a); ‘Limnodynastes peronii’ by Jean-Marc Hero, under a CC BY-SA 2.5, via Wikimedia Commons, 2.24(b); ‘Limnodynastes salmini’ by Donna Flynn, under a CC BY-SA 2.5, via Wikimedia Commons, 2.24(c); ‘Limnodynastes Tasmaniensis’ by Liquid Ghoul, under a CC BY-SA 3.0 licence, via Wikimedia Commons,2.24(d); Daptolestes bronteflavus by Isabella J Robinson and David K Yeates, reproduced by permission of John Wiley & Sons via CCC, p. 67(1); Daptolestes Illusiolautus by Isabella J Robinson and David K Yeates, reproduced by permission of John Wiley & Sons via CCC, p. 67(2); Daptolestes Feminategus by Isabella J Robinson and David K
Every effort has been made to trace and acknowledge copyright. The publisher apologises for any accidental infringement and welcomes information that would redress this situation.