

Tori Shaw
Erin Checkley
Sarah Chuck
Gemma Dale
Brodie Reid


Shaftesbury Road, Cambridge CB2 8EA, United Kingdom
One Liberty Plaza, 20th Floor, New York, NY 10006, USA
477 Williamstown Road, Port Melbourne, VIC 3207, Australia
314–321, 3rd Floor, Plot 3, Splendor Forum, Jasola District Centre, New Delhi – 110025, India
103 Penang Road, #05–06/07, Visioncrest Commercial, Singapore 238467
Cambridge University Press & Assessment is a department of the University of Cambridge.
We share the University’s mission to contribute to society through the pursuit of education, learning and research at the highest international levels of excellence. www.cambridge.org
First edition © Victoria Shaw, Evan Roberts, Christopher Humphreys and Cambridge University Press 2019
Second edition © Cambridge University Press & Assessment 2025
This publication is in copyright. Subject to statutory exception and to the provisions of relevant collective licensing agreements, no reproduction of any part may take place without the written permission of Cambridge University Press & Assessment.
First published 2019
Second Edition 2025
Cover designed by Loupe Studio
Text designed by Matthias Lance
Typeset by QBS Learning
Printed in China by C & C Offset Printing Co., Ltd.
A catalogue record for this book is available from the National Library of Australia at www.nla.gov.au
ISBN 978-1-00960-347-8
Additional resources for this publication at www.cambridge.edu.au/GO
Reproduction and Communication for educational purposes
The Australian Copyright Act 1968 (the Act) allows a maximum of one chapter or 10% of the pages of this publication, whichever is the greater, to be reproduced and/or communicated by any educational institution for its educational purposes provided that the educational institution (or the body that administers it) has given a remuneration notice to Copyright Agency Limited (CAL) under the Act.
For details of the CAL licence for educational institutions contact:
Copyright Agency Limited
Level 12, 66 Goulburn Street
Sydney NSW 2000
Telephone: (02) 9394 7600
Facsimile: (02) 9394 7601
Email: memberservices@copyright.com.au
Reproduction and Communication for other purposes
Except as permitted under the Act (for example a fair dealing for the purposes of study, research, criticism or review) no part of this publication may be reproduced, stored in a retrieval system, communicated or transmitted in any form or by any means without prior written permission. All inquiries should be made to the publisher at the address above.
Cambridge University Press & Assessment has no responsibility for the persistence or accuracy of URLS for external or third-party internet websites referred to in this publication and does not guarantee that any content on such websites is, or will remain, accurate or appropriate. Information regarding prices, travel timetables and other factual information given in this work is correct at the time of first printing but Cambridge University Press & Assessment does not guarantee the accuracy of such information thereafter.
Please be aware that this publication may contain images of Aboriginal and Torres Strait Islander People who are now deceased. Several variations of Aboriginal and Torres Strait Islander terms and spellings may also appear; no disrespect is intended. Please note that the terms ‘Indigenous Australians’ and ‘Aboriginal and Torres Strait Islander Peoples’ may be used interchangeably in this publication.
Cambridge University Press & Assessment acknowledges the Aboriginal and Torres Strait Islander Peoples of this nation. We acknowledge the traditional custodians of the lands on which our company is located and where we conduct our business. We pay our respects to ancestors and Elders, past and present. Cambridge University Press & Assessment is committed to honouring Aboriginal and Torres Strait Islander Peoples’ unique cultural and spiritual relationships to the land, waters and seas and their rich contribution to society.


Tori Shaw
Lead author
Tori Shaw has been committed to sharing her love for science with year 7–12 students for over 20 years. She has worked in both government and independent schools, has been an assessor for the VCAA and IBO, and co-authored Cambridge's VCE Biology series. Her greatest joy comes from making science accessible, exciting and fun for all students. She is currently the Head of Science at Kingswood College in Melbourne.
Erin Checkley has taught science and mathematics across years 7–12 for the past 12 years. Transferring from a career in physiotherapy, she discovered a passion for curriculum development through studying her Master of Education at the University of Melbourne and a strong desire to build students' critical thinking skills. Erin is currently teaching as a science specialist in years Prep–4 at Ballarat Clarendon College.
Sarah Chuck has taught 7–10 Science and VCE Biology for eight years. Having taught in an all-girls context for most of her career, she is passionate about increasing female engagement in STEM and fostering a sense of confidence and belonging among her students. Sarah has been a VCAA assessor and a STAV council member and is currently Head of Science at a Catholic secondary college in Melbourne.
The publisher would like to thank Brodie Reid, Dr Denise Mahon, Dr Gary Turner, Gemma Dale, Naomi Sutanto, Paris Beasy, Rebecca Leibhardt, Stephanie McDougall and Dr Zhen Wang for reviewing and contributing to this resource.
Special thanks to Sharon Davis and Julie Bover of Goorlil Consulting, and to Kingswood College.
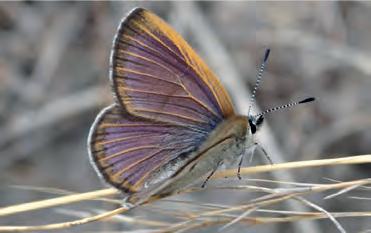
The golden rayed blue butterfly (Candalides noelkeri) is one of the only butterflies endemic to Victoria and is found exclusively in the Wimmera. It relies on one species of plant for food and shelter throughout its life cycle, creeping boobialla (Myoporum parvifolium), which is featured on the cover of this publication. Due primarily to habitat loss, the golden rayed blue butterfly population has declined, and it is listed as Endangered on Victoria's Flora and Fauna Guarantee Act 1988 Threatened List.
5.1 Representing
5.2 Types of
5.3 Reactions that make useful products
5.4 Rate of a chemical reaction
5.5 Extension: Chemistry calculations (available online in the Interactive Textbook)
Designing airbags
6.2
6.3
6.4
6.5 Space exploration
Glossary
Definitions of key terms are provided next to where the key term first appears in the chapter.
Students are encouraged to conduct research online to find and interpret information.
These provide quick checks for recalling facts and understanding content. Cognitive verbs appear in bold. These questions are also available as Word document downloads in the Interactive Textbook.
Learning goals
These are descriptions of what the student will learn throughout the section.
These are short facts that contain interesting information.
These are recent developments in the particular area of science being covered. They may also show how ideas in science have changed over the years through human discovery and inventions.
Section questions
Question sets at the ends of sections are categorised under five headings: Remembering, Understanding, Applying, Analysing and Evaluating. Cognitive verbs appear in bold. These questions are also available as Word document downloads in the Interactive Textbook.
Hands-on activities
Classroom activities help explore concepts that are currently being covered.
Making thinking visible
Visible-thinking-style classroom activities help consolidate the concepts currently being covered.
These activities focus on developing science inquiry skills, including using laboratory equipment. Practicals can be conducted within one lesson, while Investigations are longer and cover more areas of the experimental design. These activities are also available as Word document downloads in the Interactive Textbook.
Worked example
Worked examples are provided for topics that require calculations, or to reinforce important skills.
Chapter checklist
Success criteria
1.1I can explain the choice of independent, dependent and controlled variables in a scientific investigation.
1.1I can refine a research question to target specific information or data collection techniques.
1.1I can assess the validity of an investigation by defining the terms repeatability, replicability, reproducibility, accuracy and precision.
1.1I can describe the difference between random and systematic errors, and calculate both absolute and relative uncertainty.
1.2I can assess and minimise experimental risk.
1.2I can apply skills in the use of specialised laboratory equipment, such as titration equipment. 11
1.2I can explain the use of data loggers, models and simulations for gathering reliable data. 5
14b
14a
1.2I can describe the ethical considerations of using animal and human participants in research. 7, 14d
1.2I can outline research design features that might be employed in trials involving human participants that will increase the reliability and validity of the findings.
1.3I can evaluate the validity of claims in primary and secondary data.4, 9, 12
1.3I can communicate research findings clearly and effectively through the use of structured practical reports and scientific posters.
Data questions
Applying
1. The table below shows the effect of changing the pH of a pond on the number of tadpoles in the pond.
Table showing the number of tadpoles according to the pH of pond water
Review questions
Remembering
1. Recall what a scientist should do if they discover an Aboriginal or Torres Strait Islander artefact during fieldwork.
2. Define the following terms. a) independent variable b) dependent variable c) extraneous variables d) controlled variables
a) Identify the independent and dependent variables in this study.
b) Identify the optimum pH for tadpole survival.
3. Recall the reason a safety data sheet (SDS) should be understood before conducting an experiment.
c) Identify an outlier in the data.
Chapter checklists help students check that they have understood the main concepts and learning goals of the chapter.
Chapter review question sets are categorised under five headings: Remembering, Understanding, Applying, Analysing and Evaluating. These questions can be completed in the Interactive Textbook or downloaded as Word documents.
Data questions help students apply their understanding, as well as analyse and interpret different forms of data linked to the chapter content. These questions can be completed in the Interactive Textbook or downloaded as Word documents.
4. List the research design features of a randomised controlled trial that make it the 'gold standard' in scientific research.
d) Identify at which pH value the data were most precise.
Analysing
2. High school students were analysing the amount of ethanoic acid in a commercial vinegar sample and had made up a dilute solution of 0.1 mol L–1 ethanoic acid based on the concentration of ethanoic acid given on the bottle of vinegar. The students set up a titration with 20.00 mL of their ethanoic acid in a conical flask (via pipette) and filled a burette with 0.1 mol L–1 NaOH. If the ethanoic acid content quoted on the vinegar bottle was correct, the students hypothesised that 'If 20 mL of 0.1 mol L–1 ethanoic acid is present, then 20 mL of 0.1 mol L–1 NaOH will be required to reach an end point'. The titration data from the two students attempting six repeated trials are tabulated in the table below.
Table showing the titres required to reach the end point
a) Identify and circle any outliers in each student's trials.
b) Calculate the mean volume of NaOH required to reach the titration end point, after removing outliers for each student.
c) The 'true' value for the titration, given the actual concentration of ethanoic acid, should have been 20.00 mL of 0.1 mol L–1 NaOH. Recognise the validity of this experiment for identifying the concentration of ethanoic acid.
d) Contrast the data tabulated. Was each student accurate?

e) Analyse the data tabulated. Were the students precise?
f) Justify whether the data presented by students 1 and 2 provide evidence to support the hypothesis.
g) Based on the data presented, infer whether the experiment was repeatable and reproducible.
STEM activities encourage students to collaboratively come up with designs and build solutions to real-world problems and challenges.
VIDEO
These icons indicate that there is a video in the Interactive Textbook.
WIDGET
These icons indicate that there is an interactive widget in the Interactive Textbook.
These icons indicate worksheets, activities or question sets can be downloaded from the Interactive Textbook. DOC
QUIZ
Automarked quizzes can be found in the Interactive Textbook for every section.
SCORCHER
Competitive questions can be found in the Interactive Textbook for every chapter review.
These icons indicate questions can be completed in workspaces in the Interactive Textbook. Question sets can be completed online, or downloaded from the Interactive Textbook.
The Interactive Textbook (ITB) is an online HTML version of the print textbook, powered by the Edjin platform. It is included with the print book or available as a separate digital-only product.
Definitions pop up for key terms in the text.
Videos summarise, clarify or extend student knowledge.
Quizzes contain automarked questions that enable students to quickly check their understanding.


Widgets are accompanied by questions that encourage independent learning and observations.

Try this 2.1
Modelling DNA using lollies
Materials

Practicals are available as a Word document downloads, with sample answers and guides for teachers in the Online Teaching Suite.
Worksheets are provided as downloadable Word documents.


Be careful
• liquorice ribbons or sour strips
• a handful of jelly babies
• toothpicks
Method
1. Sort the jelly babies into four groups of colours.

Do not to consume lollies in the laboratory. Beware of allergies.

2. Pair up the jelly babies so that one particular colour always goes with another particular colour –for example, red with yellow and orange with green.

4. Attach your lolly kebabs to the long strips of liquorice.
3. Place a pair of jelly babies onto each toothpick as if you were making lolly kebabs. Ensure that the pairs are always of matched colours.
5. Keep doing this until you have about five to seven horizontal toothpicks attached and it starts to look a bit like a ladder.
6. The paired coloured sweets represent the base pairs, while the liquorice is the sugar–phosphate backbone.
7. Pick up your lolly ladder and twist it to represent the double helix shape of DNA.


Be careful
Wear safety glasses and a lab coat. Do not consume food items.
other gauze-style filter)
• cold ethanol solution
• test tube (or small beaker)
• stirring rod
• plastic pipette
DNA extraction mixture:
• dishwashing liquid or shampoo (5 mL)
• table salt (0.75 g)
• water (45 mL)
Method
1. Wash the strawberry with tap water and remove the green leaves. Add the strawberry to the plastic sandwich bag.
2. Add the DNA extraction solution (10 mL) and close the sandwich bag, removing the excess air.
Workspaces enable students to enter working and answers online and to save them. Input is by typing, handwriting and drawing, or by uploading images of writing or drawing.
Self-assessment tools enable students to check answers, mark their own work and rate their confidence level in their work. Student accounts can be linked to the learning management system used by the teacher in the Online Teaching Suite.


The Online Teaching Suite is automatically enabled with a teacher account and is integrated with the teacher's copy of the Interactive Textbook. All the assets and resources are in one place for easy access.
The features include:
• the Edjin learning management system with class and student analytics and reports, and communication tools
• teacher's view of a student's working and self-assessment
• chapter tests and worksheets as PDFs and as editable Word documents with answers
• editable curriculum grids and teaching programs
• teacher notes (including suggested responses if relevant) for Practicals, Try this, Making thinking visible, Explore! and STEM activities.
• adaptive tools, including ready-made pre- and post-tests and intuitive reporting.


In previous years, you have considered what science is and refined your understanding of the scientific method. You might be starting to think about what your future holds, and that might include a career in science! A key skill of a research scientist is communicating and publishing your findings. Making scientific claims requires reliable evidence, which is produced by rigorous experimental design. Scientific knowledge is refined over time through publication and the peer review process.
In this chapter, you will explore how scientists plan and conduct valid investigations using specialised equipment. Advances in technology allow us to do more in science than ever before, yet scientists must also consider the ethical implications of their work.
Questioning and predicting
Planning and conducting
The scientific method gives a framework for research
and involves
Section
Section 1.2
Section 1.3
Planning investigations
• Refining the research question, variables and hypothesis
• Integrity of the scientific method
Processing, modelling and analysing
Conducting investigations
• Specialised equipment and techniques
• Risk management
• Ethical, economic, legal and social considerations, and implications
Evaluating
Communicating
Communicating science
• Validity of claims and evidence-based arguments
• Practical reports
• Scientific posters
Questioning and predicting investigable questions, reasoned predictions and hypotheses can be used in guiding investigations to test and develop explanatory models and relationships (VC2S10I01)
Planning and conducting valid, reproducible investigations to answer questions and test hypotheses can be planned and conducted, including identifying and controlling for possible sources of error and bias in sampling or in making observations; safe, ethical investigations include undertaking risk assessments and following protocols when accessing cultural sites and artefacts on Country and Place (VC2S10I02)
equipment can be selected and used to generate and record datasets that show precision, including consideration of sample size and using digital tools as appropriate (VC2S10I03)
Evaluating
the validity and reproducibility of investigation methods and the validity of conclusions and claims can be evaluated, including by identifying assumptions, conflicting evidence, biases that may influence observations and conclusions, sources of error and areas of uncertainty (VC2S10I06)
arguments based on a variety of evidence can be constructed to support conclusions or evaluate claims, including consideration of any ethical issues and cultural protocols associated with accessing, using or citing secondary data or information (VC2S10I07)
Communicating communicating and justifying scientific ideas, findings and arguments for diverse audiences involves the selection of appropriate presentation formats, content, scientific vocabulary, conventions, models and other representations, and may include the use of digital tools (VC2S10I08)
Victorian Curriculum V2.0 F–10 © VCAA 2024
Glossary terms
Absolute
Accuracy
Blinding
Confidentiality
Control group
Controlled variable
Convenience sampling
Cultural appropriation
Data logger
Dependent variable
Internal validity
Investigable
Likert scale
Reading error
Relative uncertainty
Reliable
Matched participants designRepeatable
Model
Novel
Outlier
Parallax error
Peer review
Double-blind procedurePersonal error
Ethics
External validity
Extraneous variable
Fair test
Feasible
Hypothesis
Implicit bias
Placebo
Placebo effect
Population
Precision
Prediction
Primary data
Random allocation
Independent groups designRandom error
Independent variable
Random sampling
Repeated measures design
Replicable
Reproducible
Right to withdraw
Safety data sheet (SDS)
Sample
Secondary data
Simulation
Strata
Stratified sampling
Systematic error
Titration
Titre
Validity
Zero calibration error
At the end of this section, I will be able to:
1. Explain the choice of independent, dependent and controlled variables in a scientific investigation.
2. Refine research questions to target specific information or data collection techniques.
3. Assess the validity of an investigation by defining the terms repeatability, replicability, reproducibility, accuracy and precision.
4. Describe the difference between random and systematic errors, and calculate both absolute and relative uncertainty.
To conduct valid investigations, scientists must follow a common approach that allows their peers to evaluate their research. You may recall from previous years that all scientific investigations should follow the scientific method, which is set out in Figure 1.1 below.
STEP 1: Observe and ask questions
A research question may be identified once an area of scientific interest has been analysed.
STEP 2: Do background research (rationale)
A rationale is a concise version of a literature review. A scientist who is interested in conducting an experiment on a certain topic of interest will first search relevant scientific literature. This requires the ability to find and analyse past research articles and results.
STEP 3: Define variables and state a hypothesis
A hypothesis is a testable prediction about the relationship between two or more variables. It is formulated using the scientific knowledge obtained from the scientific literature. It is not simply a haphazard guess without any prior knowledge – it is more of an educated guess. You should also state your independent, dependent and controlled variables.
STEP 4: Outline methodology
An experiment may include controlled laboratory experiments, observations, case studies, surveys and interviews. Conducting the experiment requires a specific methodology. The methodology usually contains at least two sections:
• Materials (lists the scientific apparatus required to conduct the experiment)
• Method (a step-by-step procedure of how the experiment is conducted).
There may also be a risk assessment section detailing how any risks were managed during the experiment. If human participants were used, the methodology should detail their demographics, how they were sampled and allocated, the research design used and how ethics approval was sought.
STEP 5: Collect and record the data
Data collection is of utmost importance in any scientific experiment. This step involves organising, summarising and representing the data that were collected in the experiment (raw data) in a meaningful way. Generally, descriptive statistics are used to organise and summarise the data. Graphs and tables can be used to represent the data; calculation of means, medians or modes can be used to summarise the data. Error bars can be included to represent uncertainty in any measurements.
STEP 6: Analyse the data
The tables and charts of data then need to be examined. Analysing data can reveal relationships, trends and patterns. The meaning of each of the results should be summarised and there should be an identification of the uncertainty and limitations of evidence.
STEP 7: Evaluate the data
This is a discussion of the reliability and validity of the experimental process. Suggested improvements and extensions to the experiment should be included.
STEP 8: Form a conclusion
This is an insightful interpretation of experimental evidence through a justified conclusion that is linked to the research question.
STEP 9: Communicate your findings
A scientific report is completed to document the research and share the findings with other scientists. Common methods used to report the research findings include practical reports, oral presentations and poster presentations.
Figure 1.1 An overview of the scientific method
investigable
able to be tested through research or experimentation feasible possible within the available timeframe, with the available resources and budget novel new and original peer review a process by which work is examined and approved by experts before being published
For a research question to be considered investigable, it needs to be feasible, relevant and novel Consider what the findings might lead to: Does the question explain some phenomena? Does it fill a gap in the existing research? Will it contribute to the general public's understanding of a modern science issue? A scientist might be asked all of these questions, especially to decide whether their research receives funding.
The research question should specify the experimental variables. Forming an investigable question might involve exploring the existing body of scientific knowledge, having discussions with peers or working with a mentor such as a PhD supervisor.
Before a scientist starts their experiment, they will conduct a literature review. This involves reviewing similar experiments to determine what other scientists have already investigated. This is an important step to learn from the experience, mistakes and evidence shared by other scientists. It may help refine the hypothesis, methodology and data analysis steps, as well as justify why the research should be funded.
A literature review involves:
1. a search for scholarly articles (secondary sources that have undergone peer review and have been published in academic journals)
2. an evaluation of the quality of the research articles, and also whether they are relevant to the topic
3. a written summary of the existing research on the topic in your own words. This is usually located in the 'Introduction' section of your practical report, but you may be asked to attach an appendix showing your background research (rationale). Professional research scientists typically publish their literature reviews as stand-alone documents.
Credible databases can be accessed through libraries and universities, and many articles are available online through search engines such as Google Scholar. Less credible sources include stand-alone websites, and publications that have not been subjected to peer review, such as magazines and blogs.
The independent and dependent variables provide a great starting point as the search terms for a literature review. Typing in the research question in its entirety is unlikely to generate enough results as it might be too specific. Instead, you can combine a few key words in your search. For example, if your research question is 'Does temperature affect the function of the enzyme lipase?' then you might search for 'temperature AND enzyme OR lipase'. Search strategies take a lot of practice. You will then need to summarise the information you find and evaluate the way the authors have conducted their research. Tests such as the CRAAP test (evaluating the Currency, Relevance, Authority, Accuracy and Purpose) allow you to evaluate the reliability and validity of the research. This will assist you in refining the scope and method of your own research.
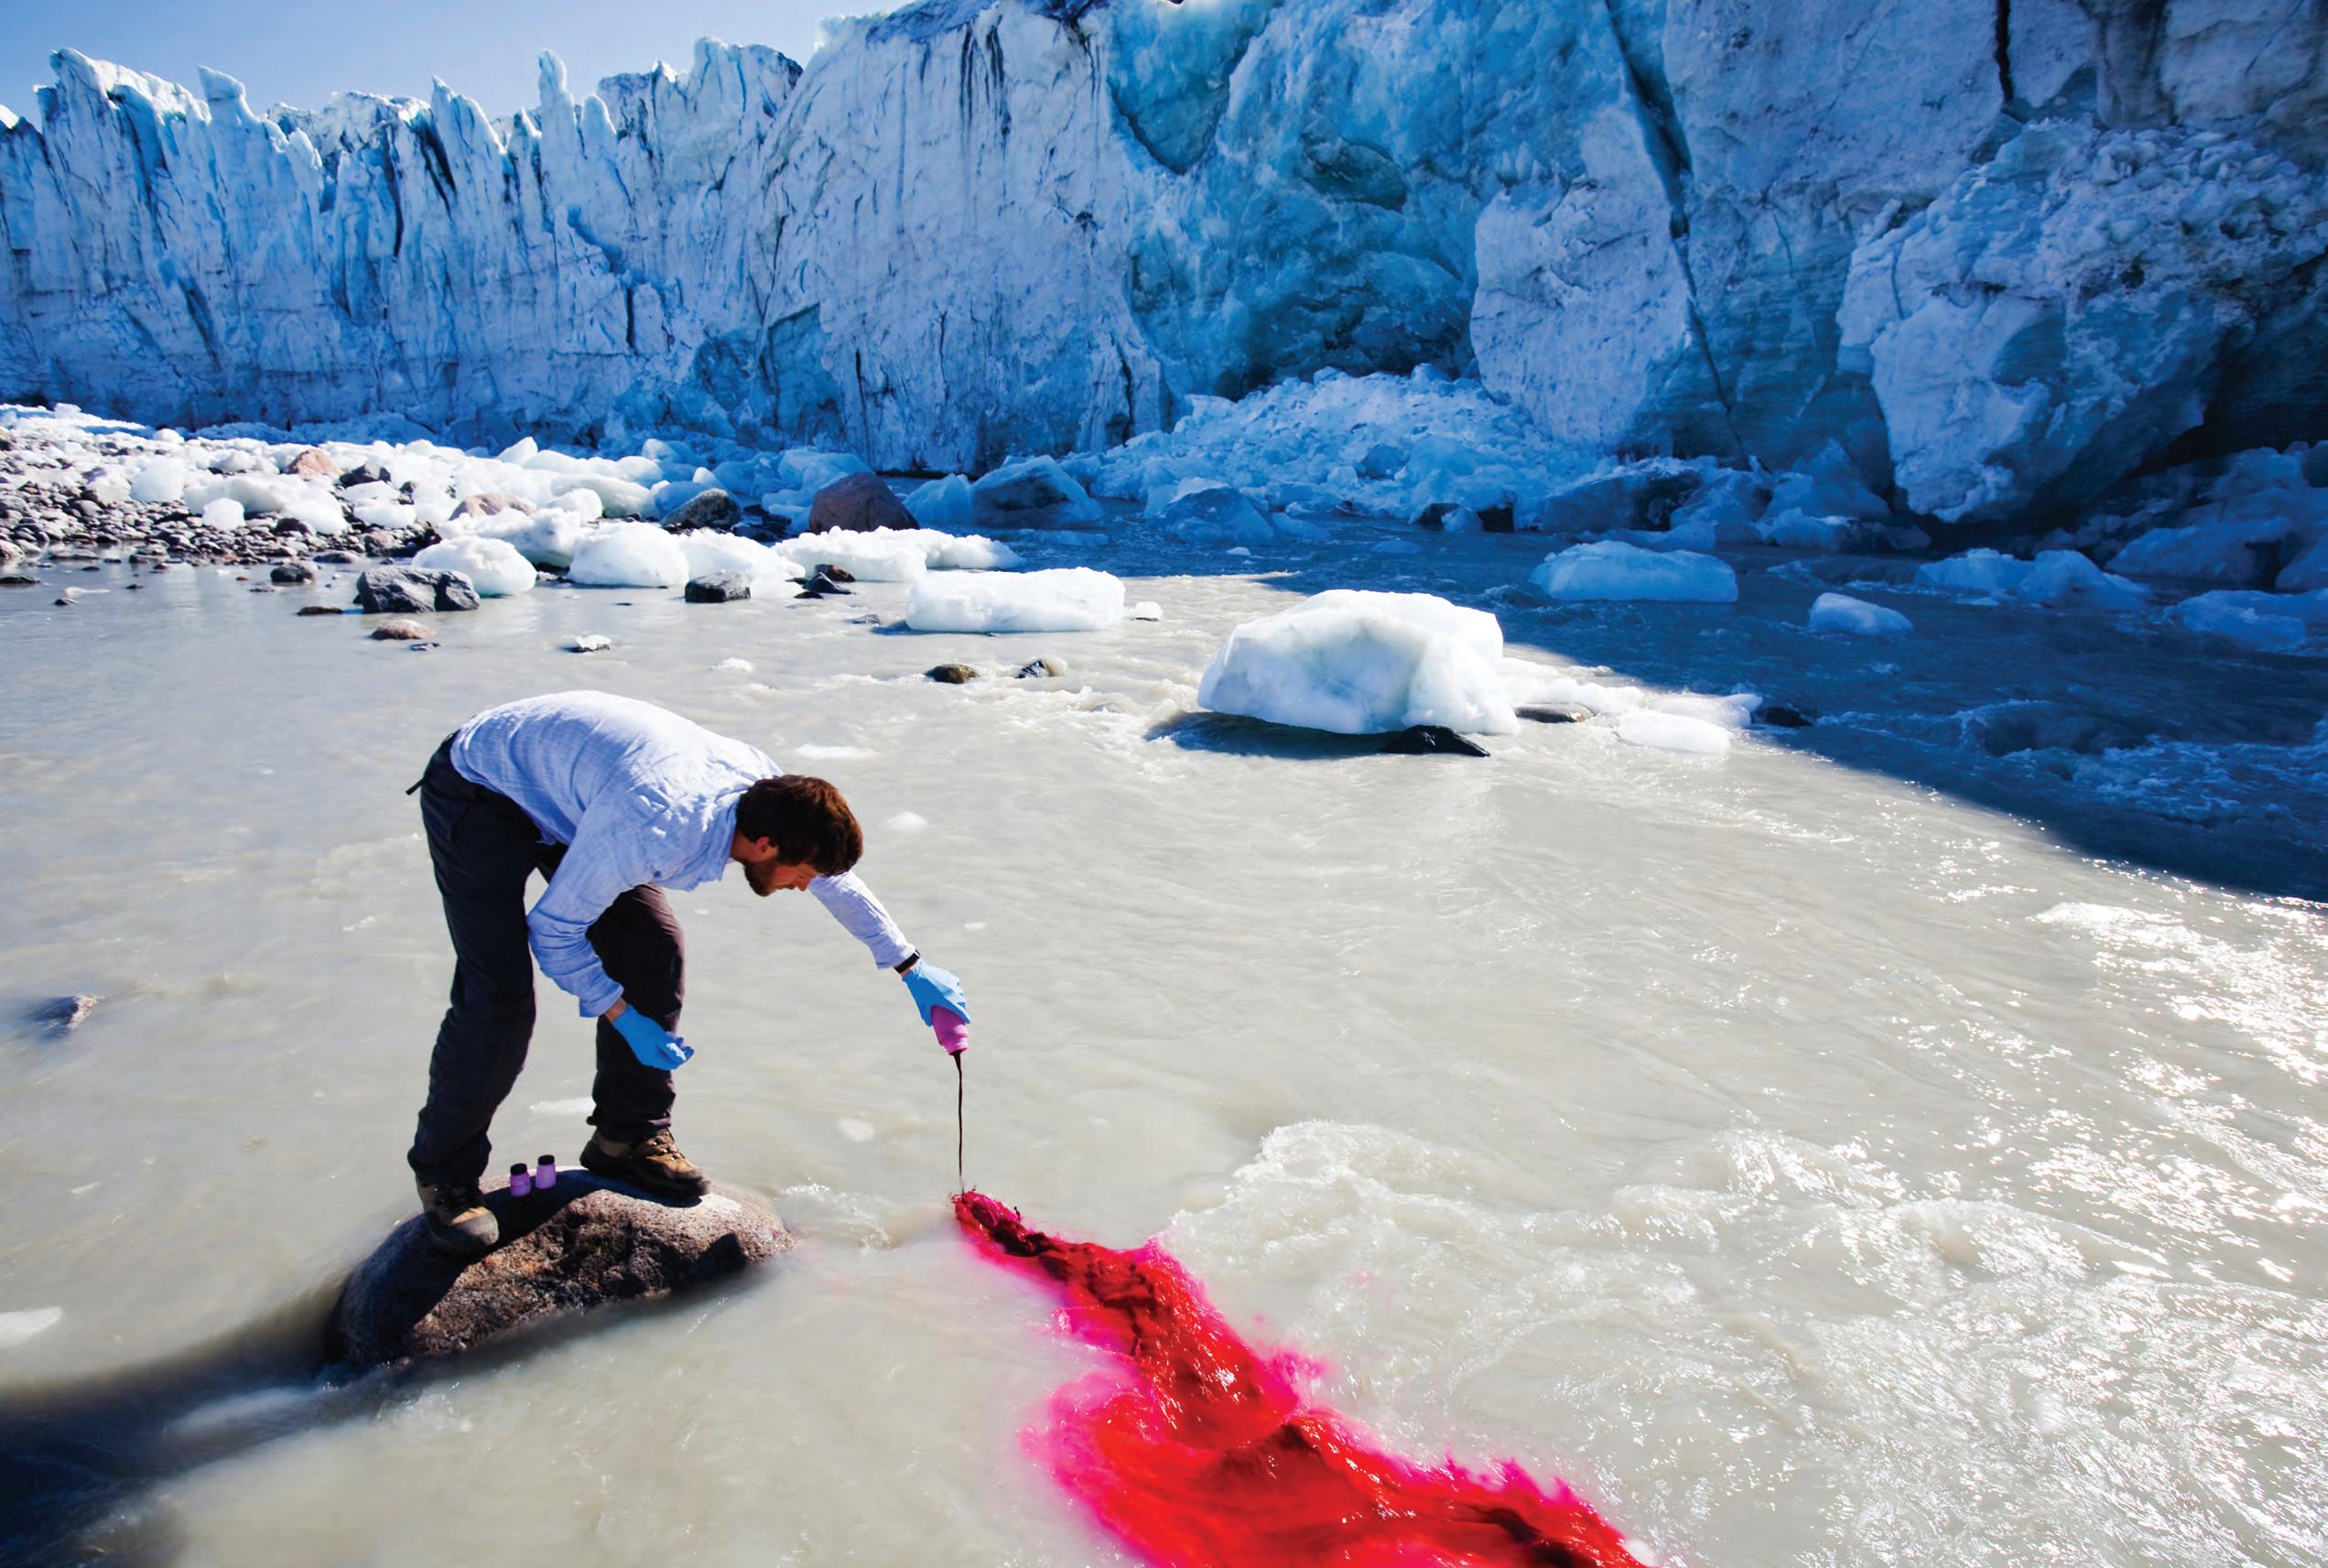
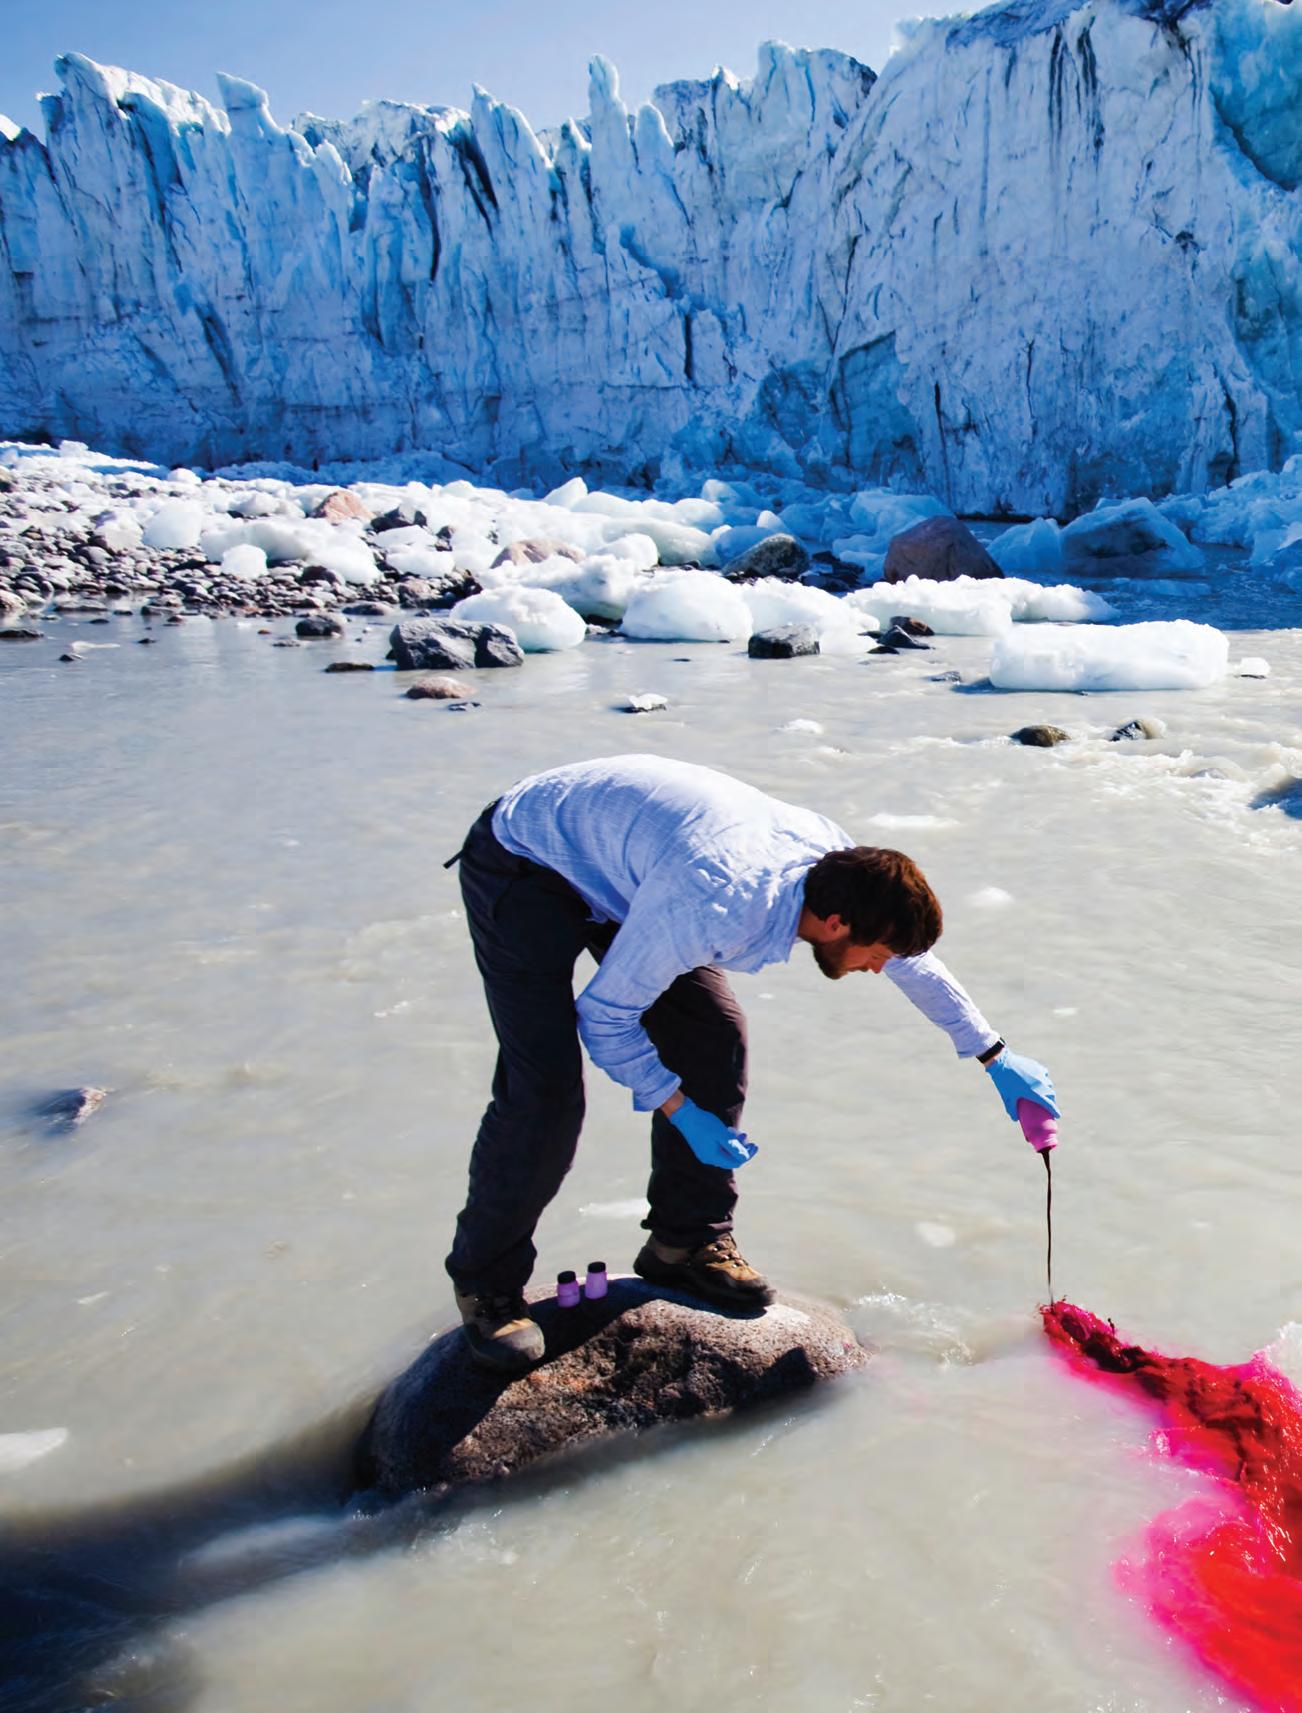
Not all scientific research takes place in a laboratory. Fieldwork involves a scientist conducting practical work in a real-world setting, such as a natural environment. For example, researchers from the University of Queensland discovered that the native legume Crotalaria novaehollandiae is hyperaccumulating zinc (concentrating it in its tissues) at the Dugald River Mine near Cloncurry. This could enable phytomining, the process of harvesting substances from living plants that act as hyperaccumulators. Such plants retain certain substances in high concentrations after they are absorbed through their roots. There are around 100 known hyperaccumulators, and the ash created from burning these plants often contains more than 25% metal. These plants could offer an environmentally friendly method of extracting valuable metals from mining waste, or of cleaning up soil contaminated with mining waste.

This type of research has the potential to impact the future of the metal industry, but it depends on researchers obtaining funds. To make this type of discovery, these researchers would have had to write applications for funding to either the government or, occasionally, commercial entities. To receive funding, they have to provide compelling literature reviews and a well-designed project plan, and outline the likely benefits of their findings for society. Science as a human endeavour
Scientists form a research question after they gather knowledge from observations and a literature review. Their question, for example, might be:
Does caffeine intake affect human reaction time?
To ensure that the experiment addressing this research question is a fair test, the scientists must only change one variable and measure one variable. All other variables that might influence the measured variable should be controlled.
The scientists will change only the independent variable in an experiment, and their methods will state exactly how it will be changed. In the example given above, 'caffeine intake' would be the independent variable. This could be measured as the volume of coffee or energy drink consumed and the caffeine concentration, or as the mass of caffeine in a tablet.
The dependent variable is the variable that is measured in response to a change in the independent variable. The scientists should state what the dependent variable is and how it will be measured in the experiment. For example, the dependent variable in this experiment is the 'reaction time' and might be measured as the time taken in seconds to react to a prompt.
WORKSHEET
Identifying variables DOC fair test an experiment in which all the variables are kept constant except the independent variable being tested independent variable the variable that is systematically manipulated or changed in order to investigate its effect on the dependent variable dependent variable the variable that is measured in response to the independent variable
extraneous variable
a variable other than the independent variable, which, if not controlled, may affect the dependent variable and thereby have unwanted effects or lead to false conclusions
controlled variable a variable that is kept constant so as not to affect the dependent variable in an experiment
hypothesis a proposed explanation or educated guess that can be tested through investigation and experimentation
Other variables can sometimes affect the results in an experiment. Variables that have the potential to interfere with the results are called extraneous variables. It is important that they are controlled; otherwise, it is difficult to conclude if the change in the dependent variable was caused only by the change in the independent variable. It is often challenging to identify extraneous variables, so the best practice is to try and keep all other variables constant (controlled).
Variables that are kept constant throughout an experimental procedure are called controlled variables. In this example, this may be the time of day the caffeine is taken and the method by which the reaction time is measured.
Independent variable (changed)
Controlled variables (conditions that are kept the same)
Caffeine intake (mg) Reaction time (seconds) Time of day and consistent experimental method


Table 1.1 The variables identified for an experiment to address the research question 'Does caffeine intake affect human reaction time?'
Try this 1.1
identifying variables
Consider the research question: Does raising the temperature of water cause more sugar to dissolve?
Look at the table below and tick the appropriate variable type shown in each row.
Temperature of the water (°C)
Volume of water in beaker (mL)
Mass of sugar that dissolves (g)
Duration of stirring (seconds)
Once a scientist has identified their variables, they can write a hypothesis for their experiment. A hypothesis is based on existing knowledge and previous observations. It is an educated guess that is formed before conducting an experiment or making new observations. For a hypothesis to be considered scientific, it must be testable and should be able to be supported or refuted (not supported). It is typically written as an 'If … then …' statement that can be tested through experimentation or observation (see Figure 1.4).
If the ___________ increases/decreases, then the ___________ will increase/decrease.
Write independent variable here
For example:
Write dependent variable here Choose Choose
If caffeine intake (in mg) is increased, then the reaction time of participants completing the task (in seconds) will decrease.
A reasoned prediction is a statement that describes what is expected to happen if the hypothesis is true. It is typically based on the hypothesis and is used to guide the design of an experiment or the collection of data.
think, pair, share: Constructing
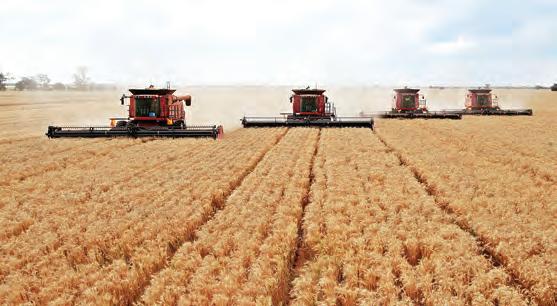
Consider the research question posed by a local farmer: Which brand of fertiliser leads to the best growth in a crop of wheat?
1. Think of what the independent, dependent and at least three controlled variables might be for a potential experiment.
2. Pair up with a partner and share your thoughts.
3. Construct an appropriate hypothesis for your potential experiment, using the 'If … then …' framework.
4. Share your hypothesis with the class.
The Think, pair, share thinking routine was
prediction a statement that describes what is expected to happen if the hypothesis is true
reliable when the results of an experiment are consistent (i.e. repeatable, replicable and reproducible)
1. State the difference between an extraneous variable and a controlled variable.
2. Outline the purpose of conducting a literature review before commencing your own experiment.
For a scientific experiment to fairly test a hypothesis, it must test what it claims to test. It also must produce consistent results, especially if the results are extrapolated and applied more broadly.
When designing the experimental method, you should consider:
• selecting appropriate materials and equipment (ensuring measurement tools are calibrated to minimise errors)
• describing the steps in the method so they are clear and reproducible
• thinking about the safety and ethical aspects of the experiment (addressed later in this chapter).
Results from a single experiment may not be reliable enough to answer a research question or support a claim. Scientists therefore often repeat many trials of the same experiment (under the same conditions) and average the results.
WORKSHEET Experimental design DOC
repeatable when the results are consistent after the same scientist repeats the experiment under the same conditions as the original experiment, including the same equipment and laboratory or field site replicable when the results are consistent after a different scientist repeats the experiment under the same conditions as the original experiment, including the same equipment and laboratory or field site reproducible when the results are consistent after a different scientist repeats the experiment under different conditions to the original experiment, including different equipment and laboratory or field site validity the degree to which we accept the suitability of an experiment to address the research question, and whether it measures what it is intended to measure
internal validity the confidence we have that the change in the dependent variable was solely due to the change in the independent variable
external validity the extent to which results can be generalised and extrapolated to other contexts or populations
accuracy how closely measured values match the 'true' or accepted values
If the results match well, the experiment is said to be repeatable. Results should also be replicable, which means a different scientist gets similar results when repeating the experiment under the same conditions. Finally, results should be reproducible, which is when another scientist carries out the experiment under different conditions and still gets similar results. If experimental results are repeatable, replicable and reproducible, scientists can be confident that their results are reliable.
The validity of an experiment is whether the results measure what they are intended to measure. A valid experiment has a methodology that is suitable for the research question, including sound experimental design and procedure.
Consider the experiment discussed earlier: investigating the effect of caffeine on reaction times. A valid way of measuring the dependent variable would be to ask participants to press a button as soon as they see a specific light turn on. This would measure their reaction time to the light turning on. Asking them to solve a maths equation would not be valid. Solving a maths equation would introduce extraneous variables that might influence the results, such as the participant's prior knowledge of maths.
Another way of conceptualising validity is to consider if an experiment is a fair test. For example, an experiment that is testing the effect of temperature on enzyme action should control all variables except temperature. If one set of enzymes is kept at 20°C and pH 4, and another at 40°C and pH 9, the experiment would not be a fair test. This is because the pH is an extraneous variable that may influence the results. Failure to control an extraneous variable might lead to very reliable results, but results that don't measure what they intend to! This example would be considered reliable but not valid.
Validity can be broken down into:
• Internal validity. This relates to how confidently you can attribute the change in the dependent variable to the change in the independent variable. Controlling the extraneous variables and using calibrated equipment and a standardised method all improve internal validity.
• External validity. This relates to the extent to which the results of an experiment can be extrapolated (generalised) to other contexts or populations. For example, would the conclusions hold for participants of a different age or species? Using a representative sample and accurately analysing the results can improve external validity. Samples and sampling techniques are discussed later in this chapter.
Quick check 1.2
1. Decide whether using the same mass balance when taking 'before' and 'after' measurements during an experiment would increase the internal validity or external validity of the experiment.
2. A scientist based in another country follows your method and gets the same results. State whether this is an example of repeatability or reproducibility.
3. A study claims to investigate the effects of an exercise program on fitness. It measures fitness with a 200-metre swim test. Explain if you think this is a valid experiment.
When collecting data during an experiment, the goal is to gather data that are reliable, valid and accurate. Accuracy is a measure of how close to the 'true' value the measurement is.
Choosing the best equipment is one way to improve the accuracy of the experiment. An example of this is using an electronic timer system to record measurements at given time intervals rather than relying on a hand-operated stopwatch.
Experimental precision refers to how close repeated measurements are to each other. For example, let's say you record the mass of a product of a chemical reaction in grams. You repeat the experiment four times, getting results of 1.54 g, 1.55 g, 1.55 g and 1.54 g. The dataset is precise, because it shows low variation (is tightly clustered around the mean value). Even though this dataset is precise, it is not necessarily accurate, as seen in Figure 1.7a. Subjectively reading values on glassware such as measuring cylinders can sometimes affect precision, particularly when you need to estimate a value between graduated markings.
The goal is for data to be both accurate and precise, as seen in Figure 1.7b. This indicates the equipment is measuring a value close to the true value, without much variation.


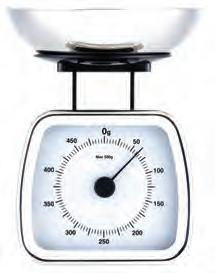
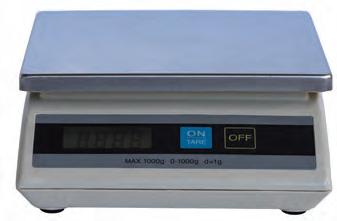
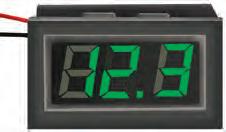
1.6 The precision of measuring equipment varies. It is important to select the appropriate equipment for the experiment.
precision how close repeated measurements are to each other outlier an anomalous data value that does not seem to fit the rest of the data


Precise but not accurate


Precise but not accurate


Precise but not accurate
• data entry errors (human miscalculation)
• measurement inaccuracies (instrument error).


Precise and accurate
Precise and accurate Accurate but not precise
Outliers are data values that do not appear to fit with the other recorded values. These values are often a long way from the mean. Outliers may represent an experimental error, such as faulty measurement tools or human error in reading the scale. You must investigate and account for outliers when discussing your results. If you notice outliers when conducting the experiment, you can repeat the trial, but you should note this in your data analysis and discussion. Outliers are sometimes excluded when calculating the centre and spread of the dataset, but this also needs to be documented and explained. The most common causes of outliers in a dataset within the scientific laboratory are:
Outliers are easier to identify when data are graphed, as shown in Figure 1.8.

Precise and accurate
Accurate but not precise

but not precise
Figure 1.7 (a) A faulty piece of measuring equipment might consistently give wrong values that are very close to one another. These measurements would be precise, but the results are inaccurate and do not measure what they claim to measure; therefore, they have low validity. (b) Measurements that show low variation and are close to the theoretical or 'true' value show high precision and accuracy. (c) While the measurements are not tightly clustered (precise), when an average is calculated it is representative of the true value (accurate).
Figure 1.8 Outliers (such as the data point in red) are often easily spotted once the data have been plotted on a graph.
Quick check 1.3
1. Define the terms accuracy, precision and outlier.
2. Discuss whether a dataset with a high number of outliers represents precise data.
systematic error
a consistent error that gives rise to measurements that are repeatedly higher or lower than the true value
zero calibration error
a measuring instrument giving a non-zero reading when the true value should be zero
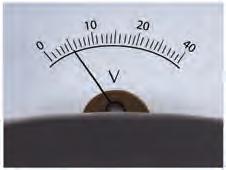
parallax error
a measurement that is not the true value due to the position of the object along the line of sight
A valid experiment is dependent upon a reproducible method and a commitment to minimising potential sources of experimental error.
The accuracy of any measurement will always be limited by several factors, including:
• the equipment used
• the skills of the person collecting the data
• the method
• the environment where the experiment is carried out.
Whenever we do an experiment, we are attempting to determine the 'most true' data, but we will always find some variation in the results.
Systematic errors give rise to measured values that are consistently larger or smaller than the true value. Hence, these errors reduce the accuracy but not necessarily the precision (like the archery target in Figure 1.7a. Systematic errors can be minimised by calibrating equipment and with careful experimental design, and this is one reason why scientists take time when planning experiments. Some types of systematic errors include:
• Instrument effects. These are caused when a measuring instrument is faulty or has not been calibrated correctly. For example, if a balance used to measure mass was not properly calibrated, all the readings might be 3.00 grams greater than they should be. This would lead to a systematic effect because the measurements are wrong by the same amount each time. A zero calibration error occurs when the initial value shown by a measuring instrument, before taking a measurement, is not zero.
• Environmental effects. These are caused by external factors such as temperature or humidity. For example, the measurements taken using a metal ruler will differ depending on the temperature. In low temperatures the ruler will contract, whereas in warmer temperatures it will expand. This means that all the measurements taken under those conditions would be lower or higher than the correct value.
• Observation errors. These are caused by taking the wrong observations or consistently reading instruments incorrectly. For example, a parallax error may be caused when the observer's eye is positioned at an angle to the measurement mark, as shown in Figure 1.9.
Parallax error
No parallax
Parallax error
Figure 1.9 The position where there is no parallax is the correct eye level for reading the scale on the measuring cylinder.
When experiments are designed carefully to remove systematic errors, random errors can still affect the accuracy and precision of a measurement. These are caused by limitations of the equipment and the observer and are unpredictable. They can be caused by the experimenter's inability to obtain the same measurement consistently to get the same result. You may measure the mass of a piece of magnesium ribbon three times using the same balance and produce varied results (e.g. 1.36 g, 1.38 g and 1.39 g). Personal errors include mistakes and miscalculations, such as errors in converting units of measurement, or using depth instead of height.
Reading errors can also occur when a measurement falls between two measurement markers. An observer would have to estimate the true value, and this would differ between observers. It is likely that approximately half of the results obtained would be estimates that are too large and half would be too small. These effects are an unavoidable part of doing experiments and can affect precision. The error can be reduced by repeating the experiment many times and taking the average.
Due to random and systematic effects in the experimental process, there will always be a margin of doubt about any of your results. We have looked at how these can arise, but we need to be able to quantify them. The uncertainty represents the range that measured values fall within when the experiment is repeated. The notation for a measurement and its uncertainty is (remember to add the appropriate units):
measured value ± uncertainty
where ± means 'give or take'. This tells us the absolute uncertainty
The following rules are often used to determine the absolute uncertainty of a measurement when using either an analogue instrument with a scale or a digital measuring instrument:
• For analogue instruments, the uncertainty is equal to the smallest increment of the instrument, divided by two.
• For digital instruments, the uncertainty is equal to the smallest increment of the instrument.
random error error caused by limitations of the equipment or the observer and does not follow a regular pattern
personal error a type of random error that arises from mistakes and miscalculations by the person conducting the experiment reading error a reading or measurement that is not the true value absolute uncertainty the estimated range of values in which the 'true value' of a measurement lies
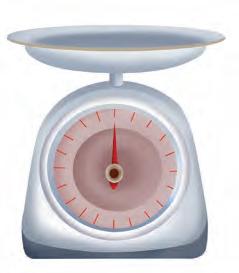
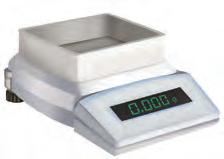
Figure 1.10 There are different rules for calculating the uncertainty in single measurements using analogue (a, c) or
(b, d) instruments. Always remember to include units.
If we take multiple measurements and calculate the mean, we can estimate the absolute uncertainty by calculating half the range, as shown in Worked example 1.1.
example 1.1
Calculating absolute uncertainty
A student measured the mass of a piece of magnesium ribbon three times and recorded the following values: 1.36 g, 1.38 g and 1.39 g. Calculate the absolute uncertainty.
1.36 + 1.38 + 1.39 = 1.38 g 3
1.39 – 1.36 = 0.03
0.5 × 0.03 = 0.015
Calculating the mean
To calculate the mean, add the values collected. Then divide it by the number of values collected. In this case, there are three values.
Calculating the range
gTo calculate the range, subtract the minimum value from the maximum value.
Calculating the uncertainty
gTo calculate the uncertainty, take half the range. This can be rounded up to 0.02 g because this is the same number of decimal places as the measurements.
Mass = 1.38 ± 0.02 gYou can then include this uncertainty when communicating the results. The mass of the magnesium can therefore be expected to be between 1.36 g and 1.40 g.
The uncertainty of any measured value can also be expressed as a percentage or as a ratio. This is the relative uncertainty. This is calculated by dividing the absolute uncertainty of the value by the value itself, as shown in Worked example 1.2. The relative uncertainty is useful because it puts your experimental data into perspective. For example, if you made an error in measuring the length of your eraser, it would be more noticeable than if you made the same error when measuring the length of a larger object, such as the table. Relative uncertainties do not have units, unless the uncertainty is multiplied by 100 to report it as a percentage.
Worked example 1.2 relative uncertainty the ratio of the absolute uncertainty to the reported value, often expressed as a percentage
Calculating relative uncertainty
You measured the length of your table (80.0 cm) and your eraser (5.0 cm) using a metre rule.
Length of table = 80.0 cm ± 0.05 cm
Length of eraser = 5.0 cm ± 0.05 cm
The absolute uncertainty of both measurements is ±0.05 cm. Calculate the relative uncertainty of both measurements.
Calculating the relative uncertainty
Relative uncertainty of table length 0.05 = 0.000625 80.0
Relative uncertainty of eraser length 0.05 = 0.01 5.0
To calculate the relative uncertainty, divide the absolute uncertainty of a value by the value.
Calculating the percentage uncertainty
Percentage uncertainty of table length
0.000625 × 100 = 0.0625%
Percentage uncertainty of eraser length
0.01 × 100 = 1%
This can then be reported as a percentage by multiplying by 100. We can now see that the relative uncertainty of the eraser measurement is much higher than that of the table measurement.
When we measure length, we normally use a ruler or a tape measure. Since these are analogue measuring instruments with an incremental scale, the uncertainty should be equal to half the smallest increment of the instrument. The smallest division of a ruler is typically one millimetre, producing an uncertainty of 0.5 mm or 0.05 cm.
To measure the length of an eraser using a typical classroom 30 cm ruler, you must align the eraser with the 0 cm mark (which is inset from the end of the ruler, see Figure 1.11a) to the best of your ability. You also read the length to the best of your ability. Because each end is an estimation, there is 0.05 cm + 0.05 cm = ±0.1 cm of uncertainty in your measurement. If you use a metre rule as your instrument instead, its physical end is aligned with the 0 cm mark. Hence, it is possible to align the end of your eraser perfectly with this mark, and there is no uncertainty at this end (see Figure 1.11b).
The smallest increment shown on the metre rule is 1 mm (as for the 30 cm ruler), so 0.5 mm or 0.05 cm of uncertainty exists where you take your reading of the length of the eraser. Therefore, the total uncertainty is 0 + 0.05 cm = ±0.05 cm.
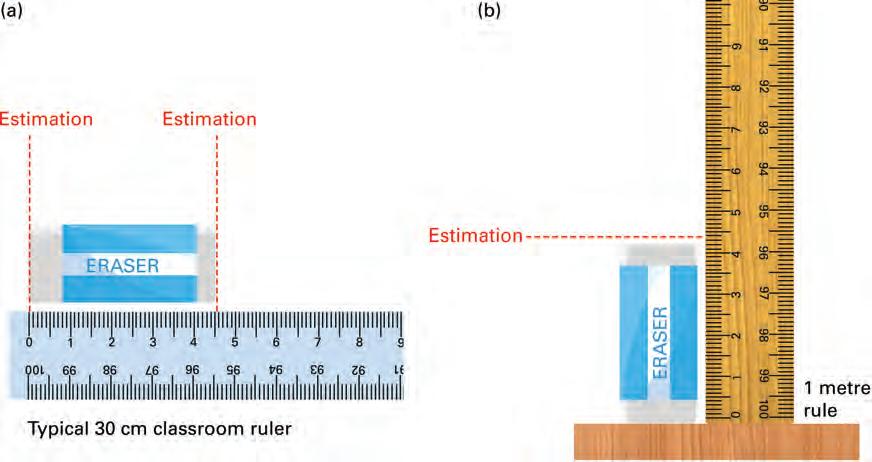
Figure 1.11 The type of measuring device used can affect uncertainty. A 30 cm ruler (a) will give measurements with a higher uncertainty than a metre rule (b), since the 'zero' mark is not aligned with the edge of the ruler.
Which uncertainty should be recorded? Often, you will complete experiments that require the recording of several measurements. You should consider the units in which you are measuring the variables, as well as the precision of the instruments you are using. You should always record the largest source of uncertainty.
sample a group of participants selected from the larger group of research interest population the entire group of people that are of scientific interest during an investigation
Practical 1.1
1. State which type of error is represented in each of the following scenarios:
a) A digital thermometer is faulty and regularly underestimates the temperature.
b) A ruler has only the centimetres marked, so the observer has to estimate values of length that fall between the markings on the scale.
c) A scale is not 'zeroed' before an evaporating basin with salt is weighed.
2. List two causes of random errors.
Random errors can reduce reliability (particularly the replicability and reproducibility) of results. For this reason, repeating multiple trials of the experiment is important. Averaging your results can reduce the impact of errors, and this can be used as the basis for discussion when considering if the results are accurate.
Calibrating equipment reduces systematic error and improves replicability and reproducibility. This means the equipment is more likely to be accurate and precise (improved repeatability). The impact of systematic errors cannot be reduced by doing repeated trials. If the equipment is poorly calibrated or faulty, repeating measurements will not change your results.
Figure 1.12 The effects of experimental errors on accuracy and reliability
Some experiments may require a sample to be drawn from a population. The size of the sample needs to be large enough that it can accurately represent the population. Using a large sample is like doing repeated trials of an experiment; it is more likely to yield reliable data. If you were investigating a new pain relief medication and only tested it on one person, the results would not be reliable. You can't make assumptions about all Australians based on the experience of one person! A large sample size gives a bigger dataset, which means the data can be averaged, minimising the impact of outliers that occur due to random errors. Sampling techniques will be discussed in more detail later in this chapter.
Repeatability and replicability: Does mass change in a chemical reaction?
Aim
To consider the accuracy of measurements before and after a chemical reaction, in determining whether there has been a mass change
Materials
• 20 mL 0.1 mol L–1 sodium hydroxide solution
• 10 mL 0.1 mol L–1 ferrous sulfate solution
• conical flask with stopper × 2
• test tube × 2
• test tube rack
• balance
• measuring cylinder × 2
• Optional: plastic pipettes for measuring liquids
Practical 1.1
Repeatability and replicability continued …
Method
1. Copy the results table below into your workbook.
2. Using a measuring cylinder, measure 10 mL of sodium hydroxide solution and pour into a conical flask.
3. Using another measuring cylinder, measure 5 mL of ferrous sulfate solution and pour into a test tube.
4. Place the test tube carefully into the conical flask and insert the stopper.
5. Now place the conical flask onto the balance and record the 'before reaction' mass in the results table. You are essentially weighing the glassware and the chemical reactants.
6. Invert the conical flask, allowing the two solutions to mix.
7. Mix thoroughly by gently swirling and wait for the complete reaction to occur (a dirty green precipitate will have formed).
8. Place the conical flask (without removing the stopper) back onto the balance and record the 'after reaction' mass in the results table.
9. Repeat the experiment a second time (steps 2 to 8) and record these findings as Trial 2.
10. Share one of your results columns with another group, recording one of their columns as Trial 3.
Results
Table showing measurements of mass before and after the chemical reaction
Mass of conical flask, stopper, test tube and their contents (g) Trial 1
Mass of conical flask, stopper, test tube and their contents (g)
Trial 2 (repeat of experiment)
Mass of conical flask, stopper, test tube and their contents (g)
Trial 3 (results from another group)
Before reaction
After reaction
Discussion: Analysis
1. How did you know a chemical reaction was taking place?
2. How did the mass of the glassware and contents after the reaction compare with their mass before the reaction had occurred?
3. How does this relate to your understanding of the Law of Conservation of Mass in chemical reactions?
Discussion: Evaluation
1. State a potential source of random error in the measurement of mass during this experiment.
2. State a potential source of systematic error in the measurement of mass during this experiment.
3. Discuss any limitations you encountered while conducting this experiment and how they could be addressed in future.
4. Outline the purpose of repeating the experiment twice and comparing your data with another group, with regard to the reliability and validity of your findings.
Conclusion
1. Make a claim about how the mass of chemical reactants changes during a chemical reaction.
2. Support your statement using the data you gathered and include potential experimental faults.
3. Explain how the data support your statement.
Section 1.1 review Go
Section 1.1 questions
Remembering
1. Define an outlier.
2. State the difference between an extraneous variable and a controlled variable.
3. State which type of validity refers to how generalisable the results of an experiment are to other contexts or populations.
Understanding
4. Describe the difference between repeatability, replicability and reproducibility in an experiment.
5. Classify the following errors as random or systematic:
a) Personal error: When recording the data, the researcher has a poor mathematical understanding of rounding decimals and consistently rounds everything up to the nearest whole number.
b) Instrument error: A balance is not very precise and the displayed mass is often out by around 1 gram in either direction.
Applying
6. Biology students were learning that, on a hot day, plants lose water out of pores called stomata on the underside of their leaves. The students were asked to design an experiment that would test how factors of their choice influence the rate of water loss. After conducting some background research, one student identified that temperature should affect the rate at which water is lost via the stomata, and they set up the experiment pictured below.


a) Identify the independent variable in this experiment.
b) Identify the dependent variable in this experiment.
c) State three variables that must be controlled.
d) Construct an appropriate hypothesis for this experiment using the 'If … then …' framework.
7. Discuss how a literature review might help a scientist refine their research question.
8. A farmer noticed that his leaky tanks seemed to lose water quicker if the hole was closer to the bottom of the tank. He designed the research question: Do tanks leak water faster when the hole is positioned lower on the tank?


a) Identify the independent variable in this experiment.
b) Identify the dependent variable in this experiment.
c) State three variables that must be controlled.


d) The farmer repeated his experiment on five occasions and found the same result: that the water flows more strongly from the lowest hole in a water tank. Identify whether this is showing high or low repeatability, and comment on the validity of his findings.
9. Jake took 12 identical pots and 12 identical plants. In four pots he placed soil, 10 grams of fertiliser A and one plant. In another set of four pots he placed in each a plant 15 grams of fertiliser B and an identical amount of soil as in the previous four pots. In another four pots he placed the same amount of soil with a plant but provided no fertiliser. All 12 pots were placed in the same location and received the same amount of water and sunlight every day.
Plants with fertiliser B grew much larger than all the others. Jake concluded that fertiliser B was better than fertiliser A. Discuss whether his conclusion is valid.

At the end of this section, I will be able to:
1. Assess and minimise experimental risk.
2. Use specialised laboratory equipment, such as titration equipment.
3. Explain the use of data loggers, models and simulations for gathering reliable data.
4. Describe the ethical considerations of using animal and human participants in research.
5. Outline research design features that might be employed in trials involving human participants, which will increase the reliability and validity of the findings.
There is a range of scientific research methodologies that can be utilised to make observations, examine relationships and test hypotheses. All methods must be conducted safely, accurately and ethically.
In any experiment, associated risks should be eliminated. If elimination is not possible, then safe practices must be followed to reduce and manage risks. Equipment and materials should be assessed for risk before conducting the experiment. When assessing any risk, two factors are considered: the likelihood of the hazard occurring and the level of harm that might result from the hazard.
Anyone conducting experiments has a duty of care to ensure the safety of themselves, their colleagues, participants and the environment. This may involve:
• using personal protective equipment (PPE), such as gloves, safety glasses and respirators
• implementing safety protocols for handling and disposing of materials
• ensuring that all equipment is properly maintained and calibrated.
Anyone conducting experiments should be familiar with emergency procedures in the event of an accident or exposure. They must ensure all individuals involved in the experiment are adequately trained in safety procedures.
Experiments sometimes include the use of hazardous chemicals. A safety data sheet (SDS) should be provided during all experiments. An SDS is a document that provides information about the health risks and safety of substances. Your school would get the SDSs for any chemicals you use from the chemical supplier. The safety data sheet provides information on:
• how to use a substance during and after the experiment
• the associated health risks
• how to dispose of waste products
• suggested personal protective equipment to use while handling the substance
• first aid information if exposure occurs.

Throughout this resource there are practical and investigation tasks that have been assessed for their level of risk. When you conduct these experiments, consider what low-level hazards the experimenter might still face.
Uncorrected
1. Recall what SDS stands for.
2. Explain why SDSs are essential within the science laboratory.
3. List three ways an experimenter can responsibly manage risk for themselves and their colleagues or peers.
titration
a procedure used to determine the concentration of an unknown solution (often an acid or a base)
Specialised equipment can often give more accurate and precise results, increasing the reliability of an experiment.
Titration is a specialised procedure used in chemistry to determine the concentration of a solution. It involves measuring the volume of one solution (typically an acid or a base) that is needed to neutralise a specific amount of a second solution. Titrations require specialised equipment, including:
• a pipette
• a burette
• a pH probe or data-logging device.
A pipette is an important tool used within the laboratory, as very precise amounts of solution can be measured out accurately. A pipette bulb or pump can be attached to help fill and empty the pipette with solution (Figure 1.14).
When using a pipette pump or bulb to draw up and deliver solutions, it is important to remember:
• When inserting the pipette into the pump or bulb, hold the pipette close to the end being inserted so that the pipette does not break.
• To create a seal, do not insert the pipette too far into the pump/bulb (1 cm should be enough).
• Make sure there is more than enough solution in the beaker to draw up into the pipette. Ensure the tip is underneath the surface of the solution so that you don't draw up bubbles into the pipette.
• Never allow solution to enter the bulb. Tell your teacher immediately if this occurs.
• Be careful when removing the pipette from the pump or bulb at the end of an experiment. A gentle twisting motion will help you remove the pipette safely without breaking it.
Using a pipette pump
1. Attach the pipette pump to the end of the pipette by gently twisting and securing it.
2. Turn the thumb wheel on the pipette pump to allow the solution to be drawn into the pipette. Ensure the tip of the pipette is always in the solution to prevent bubbles being drawn up.
3. Rinse the pipette using a small amount of the solution being used.
4. Draw up the solution above the volume mark of the pipette.
5. Release the solution from the pipette until the bottom of the curve of the meniscus sits just on top of the volume mark. Ensure your eyes are level with the meniscus to prevent parallax error.
6. Deliver the accurate volume of your solution into a flask by pressing the release valve.
1. Hold down valve A (remember 'A' for 'air') and squeeze the air out of the bulb through it.
2. Press valve S (remember 'S' for 'siphon' solution) to draw the solution into the pipette.
Volume mark
S E
Read
3. Press valve E (remember 'E' for 'empty') to release the solution out of the pipette.
A burette is a long, thin glass tube used to measure the volume of solution needed for the titration reaction. A burette can release the solution when the user turns the tap (sometimes called a stopcock). To release the solution the tap is turned to a vertical position, and to stop the flow the tap is turned to a horizontal position (see Figure 1.17). The total volume of solution released out of the burette (and added to the flask) at the end of the titration is called the titre.
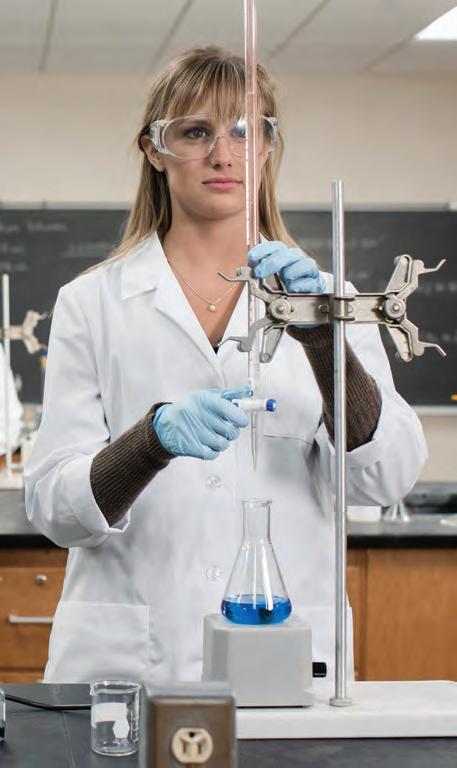
Figure 1.16 The correct way to use the three valves in a pipette bulb. Valves 'A', 'S' and 'E' are sometimes labelled as '1', '2' and '3', respectively. Note that the pipette has been inserted less than 1 cm into the bulb.
titre the volume of solution that needs to be released from the burette to reach the end point in a titration
Practical 1.2
Aim
To practice using a pipette and burette
Materials
• 100 mL of 0.1 mol L–1 sodium hydroxide solution
• 20 mL of 0.1 mol L–1 hydrochloric acid solution
• two or three drops of phenolphthalein indicator
• 100 mL beakers × 3
• burette
• pipette
• pipette bulb
• funnel
• conical flask
• retort stand
• clamp
• white tile (to help detect colour change)
Method
Part 1: Practising reading from a burette
1. When reading from the burette, always record volumes to two decimal places. For example, if a reading is exactly on the 2.7 mL mark, then it should be recorded as 2.70 mL. The example on the right would be read as 1.32 mL.
2. To calculate the titre volume, write down the initial and final burette readings and then subtract the final titre volume from the initial titre volume.
3. Calculate the titre volumes in the following examples.
Example 1
Titre = final reading – initial reading
Titre = 37.91 mL – 0.21 mL
Titre = 37.70 mL
Example 2: Try this one yourself.
Titre = final reading – initial reading
Titre =
Titre =
Part 2: Using a burette
4. Measure 100 mL of 0.1 mol L–1 sodium hydroxide solution into a clean beaker.
5. Use a clamp to secure the burette to the retort stand.
6. Place a waste beaker under the burette tap. Making sure the tap of the burette is closed, add approximately 5 mL of the sodium hydroxide solution from the beaker to the burette using a funnel.
7. Open the burette tap to drain this solution into a waste beaker. This is simply to flush the burette clear of any residue from previous experiments and prevent contamination.
8. Close the burette tap. Using a funnel, add the 0.1 mol L–1 sodium hydroxide solution to the burette, filling to slightly above the 0.00 mL marking line. Remove the funnel.
9. Slowly release the solution (into the waste beaker) eliminating any bubbles in the burette tip and then close the burette tap once the volume has fallen below the 0.00 mL mark.
10. Record the precise scale reading from the burette, ensuring you read from the bottom of the meniscus. Be as accurate as possible by using two decimal places. This is your initial reading. It does not need to be 0.00 mL, as long as it is accurate to two decimal places (see examples in Part 1).
Part 3: Using a pipette
11. Rinse the pipette using a small amount of the 0.1 mol L–1 hydrochloric acid by drawing the solution up above the volume mark of the pipette.
12. Release this solution into a waste beaker.
13. Collect some fresh hydrochloric acid, again drawing the solution up above the volume mark of the pipette.
14. Slowly release the hydrochloric acid from the pipette (into the waste beaker) until the bottom of the curve of the meniscus sits just on top of the volume mark.
15. Release the 20 mL hydrochloric acid solution into a conical flask.
Part 4: Performing a titration
16. Add 2 or 3 drops of phenolphthalein to the hydrochloric acid solution in the flask.
17. Place the conical flask on the white tile under the burette.
18. Open the burette tap and start releasing the solution into the flask.
19. If working in pairs, one person can gently swirl the flask and the other can control the release of the solution from the burette.
20. Once the colour pink starts to appear, slowly continue adding the sodium hydroxide solution drop by drop and keep swirling the conical flask.
21. Once the solution maintains a constant pink colour, close the burette tap. This is called the end point. The lighter the shade of pink, the more accurate your titration. Figure 1.19 shows the shade of pink you are aiming for.
22. Record the final reading from the burette to calculate the volume of hydrochloric acid solution that has been added.
23. Repeat for another two trials.
24. Record the volume of sodium hydroxide solution for these trials and then calculate the mean volume. The table below can be used.
Results
Table showing calculations of the titre from repeated titrations
Trial 1
Initial reading from burette (mL)
Final reading from burette (mL)
Titre (final reading – initial reading) (mL)
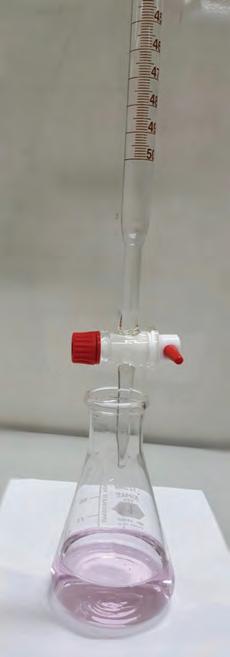
Figure 1.19 Example of titration set-up for Part 4 of this experiment, with pink phenolphthalein indicating the end point is reached
Reading from burette (mL)
Trial 2
Trial 3
A data logger is an electronic measuring tool that accurately records data over time. It has a built-in probe or sensor that can measure variables such as temperature, light, pressure, humidity and pH. The device connects to a computer and produces a readout on the screen. This means the experimenter does not have to take regular readings, as the data logger takes frequent (sometimes almost continuous) readings over time.
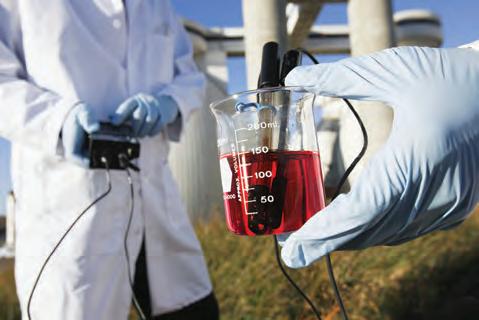
data logger a piece of electronic equipment that collects data independently through sensors when information needs to be collected faster or for longer or more accurately than a human can do
The benefits of data logging in scientific experiments include:
• highly accurate measurements
• an automated process that can be programmed to take many readings in a short period, or regular readings over a longer period (e.g. overnight)
• removal of the risk of human error or misinterpreting a measurement scale.
The data collected can be processed by specialised software or exported into a spreadsheet for further analysis. Scientists can then share this database when working collaboratively and efficiently generate descriptive statistics, tables and graphs.
1. Outline how the position of the burette tap affects flow.
2. Describe an advantage of using a data logger instead of manually recording data.
Practical 1.3
titrating using a pH probe
Aim
To complete a titration using a pH probe linked to a data-logging program to produce a graph showing pH changes as a base is added to an acid
Materials
• 0.1 mol L–1 hydrochloric acid (strong acid)
• 0.1 mol L–1 sodium hydroxide (strong base)
• 0.1 mol L–1 acetic acid (weak acid)
• 0.1 mol L–1 sodium carbonate (weak base)
• pipette
• burette
• burette funnel
• conical flask
• beakers
Be careful Wear appropriate personal protective equipment.
• retort stand
• clamp × 2
• bosshead × 2
• pipette bulb
• wash bottle
• pH probe and data logger
• computer
• data-logging software
Method
You will be provided with four different combinations of acid and base solutions to titrate. The steps below should be repeated for each of the four combinations. Decide who will continuously swirl the solution in the beaker and who will release the basic solution into the beaker using the burette.
1. Set up the burette and other apparatus as shown in Figure 1.21 using a clamp and a retort stand to secure the pH sensor.

2. Rinse the burette thoroughly with a few millilitres of the basic solution.
3. Fill the burette using approximately 50 mL of basic solution and record the precise volume.
4. Add 50 mL of distilled water to a 250 mL beaker.
5. Pipette 10 mL of the acid into the beaker of distilled water.
6. Connect the data logger and pH sensor to the computer and open the relevant 'Acid–Base' titration program.
7. Monitor the pH for approximately 20 seconds and wait for the reading to stabilise.
8. Enter 0 mL in the computer program as the first data point for the amount of base added.
9. Slowly start to add some of the basic solution until the pH has risen by approximately 0.2 units.
10. Wait for a stable pH reading and record the burette reading (volume of base left in the burette) to the nearest 0.01 mL.
11. Repeat steps 9 and 10 until the pH starts to get close to 3.5.
12. Start adding smaller equal volumes of approximately 0.1 mL of basic solution to the beaker, making sure to record the burette reading in the software after each increment.
13. When the pH reaches close to 10, add larger amounts of basic solution that raise the pH by approximately 0.2 units.
14. Continue adding the basic solution until the pH remains constant and stable.
15. Click stop on the software and save copies of the table and graph.
16. Dispose of the beaker contents as directed by your teacher and the safety data sheets.
Results
Print out your table and graph.
Discussion: Analysis
1. Compare the four different graphs you have produced.
2. Discuss the different shapes of curves that were produced in relation to the strength of the acid and base combinations used. Compare them to Figure 1.22, which represents a standard titration graph of the kind that would be found in a literature review.


Figure 1.22 A graph showing how the pH changes as a volume of sodium hydroxide (a strong base) is titrated into a strong acid
Discussion: Evaluation
1. Discuss whether this experiment would have been possible without the use of a data logger.
2. Propose any extensions or improvements that could be made to this experiment if you were to do it again.
3. Suggest whether your pH sensor was appropriately calibrated, outlining how you could mitigate this potential source of error if repeating this experiment.
Conclusion
1. Make a claim about how pH changes during a neutralisation reaction between an acid and a base.
2. Support your statement using the data you gathered and include potential experimental faults.
3. Explain how the data support your statement.
The chosen research methodology will vary according to what is being investigated and the type of data the experimenter wishes to obtain. Table 1.2 provides an overview of some common research methods.
Research methodology Advantages Disadvantages Example
Experiment An independent variable is manipulated and the response in the dependent variable is measured, allowing the experimenter to establish if there is a causeand-effect relationship.
• If conducted in a laboratory, most extraneous variables can be measured or controlled.
• Data is likely to be precise.
Fieldwork
Fieldwork –case studies
Practical scientific work, e.g. evidence is collected in an authentic real-life setting.
Conditions are artificial, meaning results might be less generalisable to real life (low external validity) where variables cannot be tightly controlled.
The effect of temperature on bacterial growth is measured. Students swab surfaces and then rub the swabs on agar jelly, which is incubated. Bacterial colonies are counted and measured 48 hours later.
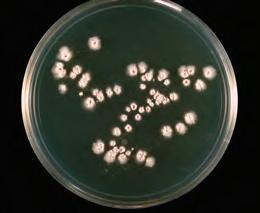
• It is more difficult to control all variables in natural settings outside the laboratory.
• Results are less reproducible.
An investigation of a particular activity, behaviour, event or problem in a real or hypothetical situation. Provides in-depth information (such as rich qualitative data).
Table 1.2 A summary of research methodologies
Utilises one subject or a small sample size, so the results are less generalisable to the population (low external validity).
Marine biologists locate, tag and track humpback whales and their migratory movements.
An infant with a genetic disorder is studied over the course of their childhood to determine the most effective therapies, e.g. physiotherapy versus medical interventions.
Fieldwork –observational studies
Advantages Disadvantages Example
Observing and recording events and behaviours that have not been manipulated or controlled. Can be used to look for correlation between variables.
Because extraneous variables are not controlled, causation is hard to establish. Observations can be subjective.
Children are observed playing in a kindergarten setting. The researcher notes the quality of their interactions with peers and their level of engagement with different activities.
Fieldwork –interviews
Fieldwork –surveys
Structured or unstructured questions posed to subject/s. They self-report, which can yield genuine and rich qualitative data.
Similar to interviews; however, they tend to involve larger sample sizes. Participants can be chosen using selection techniques, which means they better reflect the research population.
Table 1.2 (continued)
Responses can be inaccurate, e.g. dishonest, influenced by experimenter. Extraneous variables cannot be controlled.
The sample may not be representative of the research population.

1.25 Observing children at play in a kindergarten
Participants are asked to reflect on their mental health and identify the most protective factors (e.g. sleep, friendships, exercise).
A sample of university students is taken, and they are asked to record the number of hours they work per week.
Sometimes a research question can't be tested by laboratory experiments or fieldwork. Additionally, scientists may not have the appropriate tools to do the experiment, or it is too complicated, dangerous or unethical. In these cases, data can be obtained from models and simulations. The terms 'model' and 'simulation' are closely related and are often used interchangeably, but there is a difference between the two.
A model is a representation of a real-world object, system or phenomenon that is used to understand, analyse or predict its behaviour. Models can be physical or digital and are designed to be simpler than what they are supposed to be representing. They should also approximate most of the relevant features of the real object. Scientists may propose more than one model to explain something. They may then argue for or against the quality of the explanation and in the process the model will be gradually developed or rejected. Models are key to building knowledge in science, and they show that scientific knowledge is refined over time.
A good example of a model that has been refined over time is a globe representing Earth. The first record of Earth being spherical was made in the fifth century BC by the ancient Greeks. Over 1500 years, this
model a simple representation of an object, system or phenomenon that is used to understand, analyse or predict its behaviour simulation a representation (often digital) of a real situation or event, created to investigate the situation or event and often used to make predictions
model was repeatedly updated, but every version was merely an artistic impression of what Earth looks like. This all changed when NASA started to use technology such as their Earth Polychromatic Imaging Camera (EPIC) to create highly detailed images of Earth.
Figure 1.26 (a) The Erdapfel (translates to 'Earth's apple'), which was created by Martin Behaim in the late fifteenth century. It looks different from the globe we use today because many countries such as the Americas and Australia are not included, and some elements are the wrong shape, size and position. How do you think it compares to (b) the image of Earth taken in 1972 by the Apollo 17 spacecraft on the way to the moon?
Simulations are a way to bring models to life. They allow scientists to investigate and predict how a particular object or phenomenon will behave. They allow the manipulation of variables that could not be controlled in a real system. Simulations work through various computer systems, which vary widely in their complexity. Simulations are useful to study real-life systems that are too complex, large or dangerous to manipulate directly. For example, meteorologists can simulate the possible movement and effects of cyclones and tsunamis. This allows us to mitigate the risk of damage from extreme weather events before they occur.
Supercomputers can analyse massive amounts of data produced in experiments, particularly from data loggers. Supercomputers are powerful computers capable of storing, distributing and analysing data. For example, at the Large Hadron Collider (LHC), data collected is transmitted to the Worldwide LHC Computing Grid (WLCG). The WLCG sorts and filters the data to remove background noise, then analyses it. This occurs millions of times each second, and the grid and algorithms allow large amounts of data to be readily useable.
Researchers at the Queensland Government's environment department have developed tsunami models and simulations that assess what would happen in the case of a one-in-750year, one-in-3000-year or one-in-10 000-year event. This includes calculating the speed, height and inundation levels at different tides. The modelling was based on data from tsunamis generated in the Vanuatu, South America and Kermadec–Tonga regions. Computer simulations found that tsunamis generated in the Vanuatu region would reach Queensland's coast in the fastest time, but waves generated in the Kermadec–Tonga zone would be the most damaging. Researchers discovered that the Great Barrier Reef would provide some protection in the north as the tsunami is slowed as it travels through shallow waters, as well as being blocked by large islands. More exposed regions, such as the Gold Coast and the coastal region between Agnes Water and Bundaberg, would see greater wave heights. The simulations also revealed that the populous region of Brisbane would largely be protected, due to the location of Moreton and Stradbroke islands.
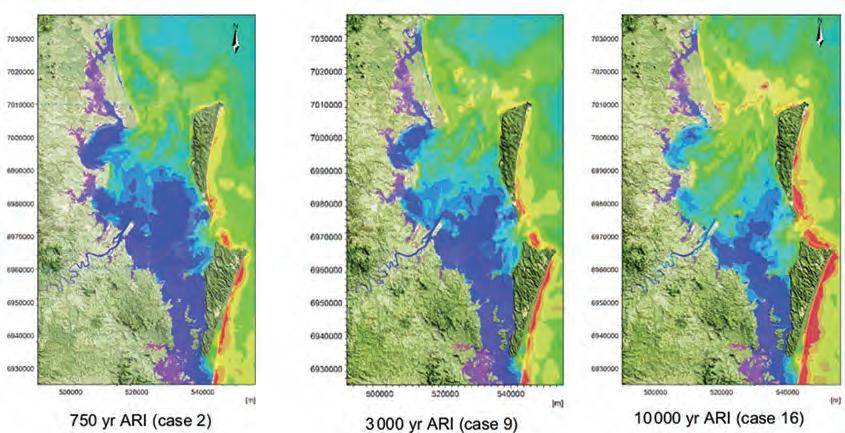
When conducting scientific investigations, it is important to consider ethical implications and guidelines. Ethics refers to the principles and standards that guide acceptable and appropriate conduct.
the standards used to appraise and guide what is considered as acceptable conduct cultural appropriation use of cultural knowledge or tradition without acknowledgement or consent implicit bias when someone's personal opinions influence their judgement without them being aware of it Explore! 1.1
ethics of working with aboriginal and torres Strait islander Peoples
Collaborating with Aboriginal and Torres Strait Islander people on scientific investigations or to explore knowledge of Country raises ethical issues for scientists. It is important that scientists avoid cultural appropriation and exploitation of traditional knowledge. In the context of collaboration, scientists should analyse scientific sources and their own reports for implicit bias or racist ideas and seek multiple sources of information. Moreover, it is important that any Aboriginal and Torres Strait Islander artefacts discovered during fieldwork are left undisturbed. The scientist should
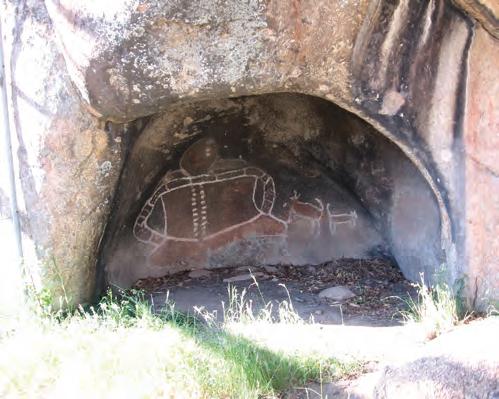
Figure 1.29 Aboriginal art at Gariwerd/Grampians National Park. It is important to report the discovery of any Aboriginal and Torres Strait Islander artefacts without moving or disturbing the artefact.
contact the appropriate government agency and local Aboriginal or Torres Strait Islander community leaders about the finding.
Use the internet to answer the following questions:
1. What is cultural appropriation and exploitation?
2. How might cultural bias be present in scientific literature?
3. How can cultural respect and sensitivity be demonstrated?
4. What does community engagement and data ownership and control mean in the context of working with Aboriginal and Torres Strait Islander people?
5. What is the purpose of the Victorian Aboriginal Heritage Council?
Some fields of science rely upon experimentation using animals and humans. Medical trials, for example, typically involve testing on animals before progressing to human trials. Psychological experiments also rely on human participants to generate data.
Scientists in Australia must follow the animal welfare laws in their state or territory. These laws require that animals must be treated humanely, by providing adequate food, water and shelter, and minimising stress as much as possible. Social issues may arise when scientists experiment using animals without disclosing to the public the nature of their work, as the public may be concerned for the safety of animal test subjects. This is why ethics approval is required before any animal testing. Scientists follow the 'three Rs' of animal ethics:
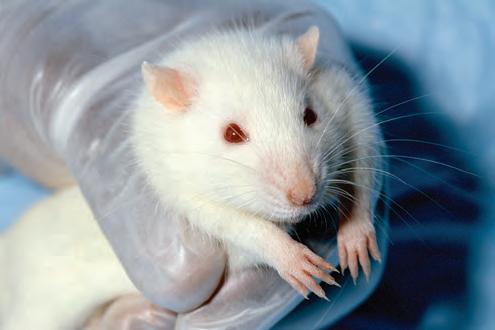
1.30 Wistar rats are a breed of laboratory rats that are widely studied because they have a consistent genetic make-up and are easy to look after. They have a docile and friendly temperament, making them easy to handle and work with. Wistar rats have been used in a wide range of scientific studies, including research on cancer, neuroscience and drug development, and have contributed greatly to our understanding of various biological processes.
• Replacement: substituting conscious animals with insentient materials, such as plants, microorganisms and invertebrates with less complex nervous systems. Using simulations or artificial models should also be considered.
• Reduction: using the minimum number of animals required to meet sample size requirements.
• Refinement: improving the methodology by reducing the number of inhumane procedures applied to animals whose use can't be avoided by 'replacement'.
Before conducting any experiments involving humans or animals, experimenters must request approval from an ethics committee. The participants' welfare is considered by a team of medical and non-medical professionals. Experimenters must comply with guidelines published by the National Health and Medical Research Council, The National Statement on Ethical Conduct in Human Research (2023). This statement aims to protect the welfare and rights of human participants and ensures that the experiment is justified.
The Australian Psychological Society (APS)'s Code of Ethics outlines the rights of human participants:
• Any participants must be voluntarily involved in the research.
• Participants must give informed consent and not be harmed by their involvement, nor subjected to undue distress from deception. Sometimes it is necessary to deceive participants to get accurate data, but they should be debriefed afterwards.
• All data must be kept confidential (and anonymised where possible).
• Participants should have the right to withdraw at any point for any reason. They can also ask to have their data removed from the experiment for a certain period of time after the experiment has finished.
When seeking informed consent, participants must be told about any potential risks or benefits from their involvement. They should also be told about their ethical rights, such as the right to withdraw. Where possible, the participant should be provided with a brief outline of the procedures and purpose of the experiment. This information can be provided in an informed consent form, which participants must sign voluntarily.
check 1.7
1. Define the term 'cultural appropriation'.
2. Define the term 'right to withdraw'.
3. Define the term 'informed consent'.
4. Outline the role of an ethics committee.
5. Suggest a time when deception might be necessary in an experiment.
Unfortunately, there have been distressing cases of unethical research involving human participants. One of the most famous experiments is the Stanford Prison experiment, conducted by Professor Phillip Zimbardo and his colleagues at Stanford University in 1971.
Research exactly what took place in the experiment and outline the ethical rights that were breached.
Figure 1.31 Professor Phillip Zimbardo with his book, The Lucifer Effect, published in 2007, which details the Stanford Prison experiment and related research
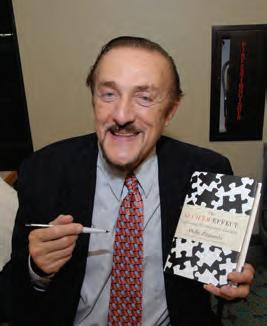
informed consent participants are informed about the risks and procedures involved in an experiment and they agree to participate by signing a form confidentiality keeping participants' data and results private right to withdraw the right for a participant to leave a study at any time for any reason
control group a group that is not subjected to the independent variable; provides a baseline for comparison to all experimental groups
Research involving humans often involves allocating participants into two groups:
• the control group (which does not receive the treatment)
• the experimental group (which does receive the treatment).
The experimental group is exposed to the independent variable being tested. That is, they receive the treatment that is being studied. The control group provides a baseline performance against which the performance of the experimental group is compared. Participant expectations can act as an extraneous variable within an experiment. For example, participants might try harder at the task if
blinding an experimental procedure whereby participants are unaware of whether they have been allocated to the control group or experimental group
placebo a false or fake treatment
placebo effect a phenomenon in which participants who receive a placebo experience a benefit or improvement
double-blind procedure an experimental design in which both participants and researchers are unaware of whether the participant is in the control or experimental (treatment) group
they know they are in the experimental group and want to please the researcher. Conversely, they might feel nervous and not perform well in the same situation.
It is possible to counteract the effect that participant expectations may have on an experiment by blinding participants. This means they do not know which group they have been allocated to. The experimental group receives the actual treatment (such as a new drug being trialled), whereas the control group receives a placebo (a fake version of the drug).
WORKSHEET Conducting an investigation
The placebo effect is a strange and poorly understood phenomenon that occurs during studies. This occurs when participants who have received the placebo experience beneficial effects. For example, during a study on pain medication, participants might report improvements in their pain and function, despite receiving the placebo (i.e. no pain medication). But it's not all in their head! Measurable changes such as a reduction in blood pressure or heart rate have also been observed in participants who received a placebo. The improvement is not due to the treatment, but rather to the patient's belief in the treatment. In some studies, the placebo effect is so strong that the control group improves as much as the experimental group!
The colour and shape of a tablet can influence our belief in how effective the medication is. Studies have found that yellow placebo pills are rated as the most effective in treating depression while white pills are perceived as best at soothing stomach issues. Pills with a brand name stamped on them are rated as more effective than generic, unlabelled pills. Some studies have suggested the placebo effect still exists even when the participant knows they are in the placebo medication group!

1.32 Medications come in a range of colours, shapes and sizes. Who would have expected that this might influence their efficacy?
We have discussed how participant expectations can influence the outcome of an experiment, but the expectations of the researcher can also play a role. For example, researchers might spend longer explaining the psychological questionnaire to participants in the experimental group or provide more encouragement during a task. This influences the data collected. To address this issue, some studies observe a double-blind procedure. This means both participants and researchers collecting the data are unaware of who is in which group. This is considered the gold standard for experimentation involving humans.
When conducting an investigation, the population is the group of people who are of scientific interest. It is rarely possible to survey or experiment upon every member of a population, so to make the investigation more feasible, a sample is drawn. This sample should ideally reflect
the characteristics of the population. This would allow the results to be generalised back to the population. Unfortunately, it is difficult to select a sample that accurately reflects the ages, genders and health status (and the list goes on!) of the population.
Convenience sampling is when a sample is chosen opportunistically. For example, you might select the next 10 people you pass on the street, or the members of your class. This can create a bias, as the sample may not represent the population accurately. Random sampling is a more valid technique and is commonly used (Figure 1.33). Random sampling is conducted by using a random number generator, or even pulling names out of a hat. It is still possible to get a biased sample that does not represent the population well, even when selected at random, and especially if you use a small sample size.
Step 1
Identify the population of research interest
Step 2
Assign a number to each individual in the population
Step 3
Generate random numbers based on how many individuals are to be used in the sample
Step 4
Select individuals to include using the corresponding assigned number
Figure 1.33 A flowchart showing the process of selecting a random sample from a population
Stratified sampling involves dividing the population into distinct groups (called strata). For example, they could be grouped by age (such as 0–29, 30–59, 60–99), by IQ, salary or political views. A random sample is then selected from each stratum in the same proportion as they occur in the population. This ensures a more even spread in the sample and is more likely to represent the population. An example of the process is shown in Figure 1.34.
convenience sampling selecting opportunistic samples based on the ease of accessibility to the researcher random sampling selecting a random sample of participants from a population using a method by which every person has an equal chance of being selected stratified sampling the population is organised into sub-groups (strata) and then a random sample is selected from each group strata (singular: stratum) the sub-groups that a population is divided into for the purpose of stratified sampling
Stratified sample: number of members in each age bracket
Figure 1.34 An example of how a stratified random sample of 20 participants can be selected from a population of football players. The number of participants selected in each age range is in proportion to the number of players in the population in that age range.
Convenience sampling
Interested? Interested?
Interested? Interested?
Interested? Interested?
Random sampling
Stratified sampling
A sample is selected in the simplest way possible – for example, asking people that you know if they are interested to take part in the experiment or not.
A sample is selected by ensuring that every member of the population has an equal chance of being picked to take part in the experiment – for example, use a random number generator or pick names out of hat.
It can be quick and easy to pick people who are easily accessible.
Only people known to the experimenter or people who are easily accessible are used, which may cause a biased sample group.
random allocation participants are randomly placed in the control group or experimental (treatment) group
matched participants design a research design in which similar participants are paired and then randomly allocated to either the control or experimental group independent groups design a research design in which two separate groups of participants are used as the control and experimental groups
A sample is selected by dividing the population into groups (strata) from which the participants are then selected in the same proportion as what is seen within the population.
This is a fair way to select the sample as each member of the population has an equal chance of being chosen. It can also be quick and easy to assign each member of the population a number and to then use a random number generator.
This method may not be practical or representative of the population of research interest.
This accurately reflects the population of research interest. It may be time consuming to divide the population of research interest into appropriate groups (strata) to then select the correct proportion of participants from.
Once a sample is selected, participants are allocated to either the control or experimental group. Random allocation reduces the likelihood that factors such as age or gender might act as extraneous variables. For example, if participants were allowed to choose their own group, the control group might end up with healthy people who do not wish to take the trial drug. The experimental group might contain individuals who are keen to improve their health with medication. Ideally, both groups will be balanced. This procedure can be further strengthened by using techniques such as matched participants design. This means participants are paired up based on similarity (in age, for example) and then randomly allocated to each group. One participant from each pair receives the treatment, while their partner receives the placebo, and thereby acts as the control.
In an independent groups design, each group is only exposed to either the treatment or the control. A repeated measures design involves the groups swapping over and completing the experiment again. Ideally, participants remain blinded throughout. This means data are collected on their response to both the control and experimental conditions. This is like an extension of the matched participants design in that every participant acts as their own matched partner!
identify the experimental design features
Researchers are investigating if sleep deprivation has an impact on driving performance (specifically, reaction time) in probationary drivers.
All probationary drivers registered with VicRoads are divided by gender and allocated a number. A random number generator is used to select 102 males and 98 females, as this reflects the proportion of each gender who are registered. All 200 participants then sit a baseline driving simulator test and are matched with a partner who scored the closest to them (i.e. top two performers are paired, worst two performers are paired, and so on). One member from each pair is allocated to the control group (who is told to get a 'normal' night's sleep) and one member is allocated to the experimental group (who is only allowed four hours of sleep). The next day, they sit the driving simulator test again and their reaction times are measured.
1. What is the population of research interest?
2. Which sampling technique was utilised?
3. Is this an example of a matched participants design or a repeated measures design?
4. Would it have been possible to blind participants to their group allocation?
5. Can you identify any limitations in this methodology?
6. Would this study have good external validity?
repeated measures design a research design that exposes the same participants to both/all the experimental conditions
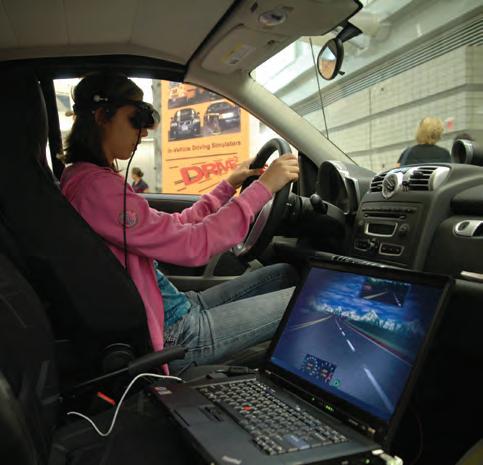
1. State one advantage of using convenience sampling to select participants.
2. Describe one method for selecting a random sample of participants.
3. Explain how random allocation reduces the effect of extraneous variables on the data.
Practical 1.4
Aim
To investigate whether knowing the brand of a food affects a consumer's taste perception
Background
Consumers often prefer well-known brands to generic brands, despite some of their products coming out of the same factory!
Recently, the difference in quality between the cheapest and most expensive brands has narrowed. Supermarkets have devoted more effort to marketing their own brands. It's not a coincidence that the big brands (and the supermarket's own brand) are placed at eye level on the shelf.
A team of psychologists investigated how packaging and taste affect brand preferences in consumers. The participants were all regular supermarket shoppers. They were chosen through a stratified process according to gender (70% females and 30% males) and occupation (70% employed, 30% not currently employed). Data were collected from 93 participants. The median age category was 35–49 years. Participants were given three biscuits to taste: two were from leading manufacturing brands and one was a generic brand product. Preference was measured on a Likert scale with a range of seven points, where 1 indicates very low preference and 7 indicates very high preference.
They were asked to rank the biscuits on their taste. The participants were then shown the packaging for each product and asked to rank the products for a second time.
Tables showing mean scores of participants' blind and packaged taste tests
The results showed that when the participants were not aware of the brand or packaging they generally ranked the products purely according to taste. When shown the brand packaging, some participants adjusted their rating after finding out which brand it belonged to. This is supported by the data, which show a reduction in the mean score for taste for the generic brand biscuit when participants were aware of packaging. There was found to be a clear influence of brand and packaging on consumers' tastes preferences.
Your task
Create a scientific poster addressing the following research question (you may want to follow the template for a scientific poster in Figure 1.40, section 1.3):
Does knowing the brand of a food affect a consumer's taste perception?
You will use the biscuit example above as background information into the brand of food having an influence on the perception of taste. As this is a subjective experiment, a repeated measures design will be used. You will also be expected to obtain informed consent from all participants. If every member of the class can recruit and test at least two participants, then the combined data from each can be used as part of the class results.
Materials
• branded original flavoured potato chips (e.g. Smiths)
• generic brand original flavoured potato chips
• two plates
• cup of water (to clean palate during taste test)
• taste preference data sheet
• pen
• informed consent sheet
Method
1. Copy the following results table for the class results.
2. Choose two participants for the taste test. Recall the stratified sampling technique when recruiting participants; for example, try to get one person from each gender or two participants who are of different ages.
3. Inform participants about the experiment and provide an informed consent sheet for them to sign. The sheet should outline the aim of the research project, the time commitment involved, and any potential risks and benefits they might expect to receive. It should also detail that their results will remain confidential and that they have the right to withdraw at any stage.
4. Check that your participants have no known allergies.
5. Present the participants with the chips without any knowledge of which brand is which. Ask them to rate the flavour and record on a data record sheet under a section titled 'Blind taste test', on a scale of 1 to 5 (see example scale below).
6. Then present the participants with the same plates of chips and place the packets next to each plate so they are aware of the brands. Ask them to repeat Step 5, this time recording their taste scores in the 'Branded taste test' section of the data record sheet.
7. Record the age and gender of each participant.
8. Collate the data as a class and summarise it in the results table shown below.
Results
Table showing taste test scores
Average numerical score for taste quality (from a scale of 1–5) during blind test
Average numerical score for taste quality (from a scale of 1–5) during known brand test
Difference in taste quality score
Smiths (or other well-known brand)
Generic brand
Discussion: Analysis
1. Represent the data as a graph with relevant axes labels and title.
2. What do the mean scores suggest regarding participants' perception of taste when blinded to brand compared to when they are aware of the brand?
Discussion: Evaluation
1. List and explain two possible extraneous variables that may affect the results.
2. List and explain two possible limitations that may impact the results.
3. What future improvements would you recommend should this experiment be replicated?
Conclusion
1. Give a statement regarding the claim you can make about the effect of knowledge of brand on taste preferences in a food product.
2. Support your statement using the data you gathered and include potential sources of error.
3. Explain how the data support your statement.
In addition to ethics, scientists must also consider the legal, economic and social implications of their research.
Scientific research must follow the relevant state and national laws, and the research may in turn influence the development of new laws and policy. For example, a geologist's surveys (fieldwork) may identify significant and previously unknown large seams of coal in Victoria. This may influence politicians when they are considering our transition away from fossil fuel power production.
The economic priorities of a country impact how funding is allocated to scientific research. In Australia, three main bodies administer funding:
• the National Health and Medical Research Council (NHMRC)
• the Medical Research Future Fund (MRFF)
• the Australian Research Council (ARC).
The ARC has responsibility for funding all non-medical research. That's everything from astrophysics to zoology! To access funding, researchers are continually engaged in making grant applications. There is a lot of pressure on scientists to publish frequently to maintain their professional credibility. The results of their research can have economic implications too. Consider the profit that stood to be made from the first Australian company to produce a COVID-19 vaccine! Scientific research must also follow what is considered socially acceptable within a community. This will differ between countries and is influenced by culture and religion. Scientists need to take an objective stance as they conduct their research, which means putting their own biases aside.
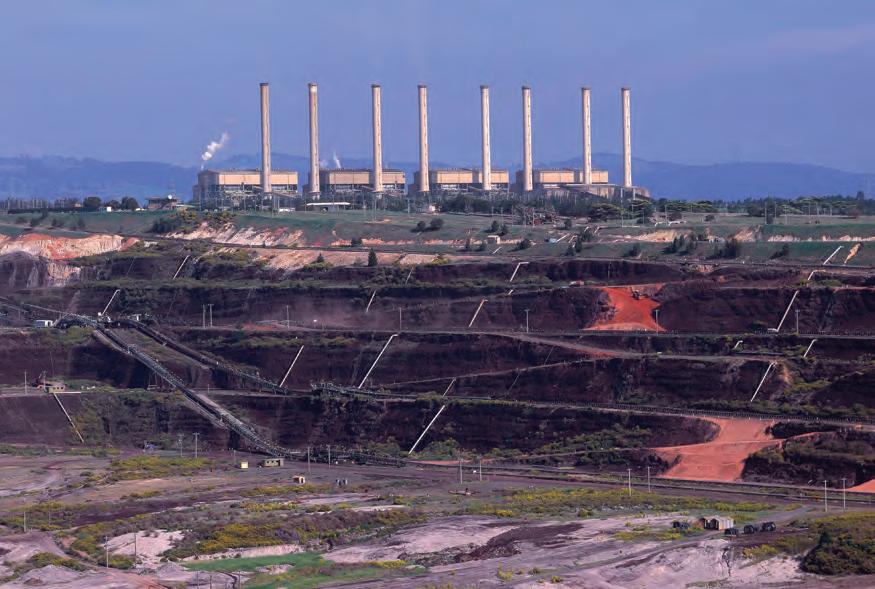
CRISPR-Cas9 is a defence system in certain bacterial cells, which has been repurposed as a gene editing tool. The technique allows the DNA of living organisms to be cut at specific locations, for the removal of certain genes or insertion of new ones. It has applications in the genetic modification of food crops, as well as in medical settings. This could help with the eradication of inherited genetic diseases and the treatment of diseases causes by DNA mutation, like cancer.
The development of the technique earned two of the researchers, Jennifer Doudna and Emmanuelle Charpentier, the Nobel Prize in Chemistry in 2020.
The technique has proven highly controversial. In 2018, Chinese doctor He Jiankui used CRISPR technology to edit the genome of embryos (making them resistant to HIV). Two were successfully carried to term, creating the world's first gene-edited babies. His actions earned him a three-year jail sentence in 2019, but he vowed to continue his research upon release. China has since tightened its legal regulations surrounding experimental biomedical research, but critics fear it hasn't gone far enough. Educational and governmental research facilities are subject to ethical governance, but privately funded research ventures can go largely unregulated.
There are possibilities for non-therapeutic applications of this technology, such as modifying embryos for desirable traits. This has substantial commercial appeal given the process is relatively inexpensive. But it has social and economic implications as there is likely to be inequality in access to the technology according to your country and financial situation. It could also lead to the stigmatisation of certain diseases or traits, and may have implications for whether individuals could access health insurance or face discrimination in employment. Like many genetic engineering tools, there are arguments for and against the use of the technology. The difficulty lies in defining and enforcing which applications it can be legally used for and which applications are deemed to fall outside accepted social and ethical norms.
Section 1.2 questions
Remembering
1. Name two pieces of specialised equipment that might be used in a titration.
2. Complete this paragraph by filling in the blanks:
In a study measuring the impact of a new drug for people with diagnosed anxiety, the group that received the placebo treatment is known as the _________________ group, whereas the group with participants who are exposed to the independent variable (and receive the new drug) is known as the ______________ group.
Understanding
3. Explain how the use of a data logger can be beneficial to an experiment.
4. Explain the difference between random sampling and random allocation of participants.
Applying
5. Explain how you can control for the placebo effect, using a relevant research example.
6. Take the readings from the burette on the right to determine the overall titre volume.
Initial reading: _________ Final reading: _________ Titre: _________
7. Pauline was interested in conducting research that involved human participants, investigating the effects of temperature on memory recall. Outline three pieces of information she must include on her informed consent form.
Analysing
8. Contrast between a model and a simulation.
Evaluating
9. One example of a model is a globe to represent Earth. Propose another example of a model that has been updated over time.
10. A researcher was investigating how driving performance was impacted by blood alcohol concentration (BAC). Thirty participants who responded to an advertisement on Facebook were included in the study. They were tested in a driving simulator under each of the following three conditions: BAC = 0.00 (no alcohol in system), BAC < 0.05 (BAC under the legal driving limit) and BAC > 0.05 (BAC over the legal driving limit). The results are shown in Figure 1.37 below:
Figure 1.37 Bar chart showing number of errors made in the driving simulation according to blood alcohol concentration (BAC)
a) Identify the research design that was used.
b) Justify why this design would be the best to use in this study.
c) Summarise the results found, based on the data in the graph.
At the end of this section, I will be able to:
1. Evaluate the validity of claims in primary and secondary data.
2. Communicate research findings clearly and effectively using structured practical reports and scientific posters.
You might assume that scientific research that has been published can be trusted. It is important to remember that scientific knowledge is contestable and is constantly being refined and validated. Experimental methods should be replicated and expanded upon, and data can be analysed using new techniques.
When reporting on your own research, you are communicating about primary data. It is important that you evaluate the validity of your results. Consider the reproducibility of your method and the internal validity of your data (discussed earlier in this chapter). You might want to consider some of the following:
• Were any assumptions made that might affect the conclusions you have formed?
• Have you assumed that the sample of participants represented the population?
• Have all extraneous variables been controlled?
• Are there multiple possible explanations of the data, beyond your own conclusion? When forming a conclusion, you will always follow these steps:
1. Address the research question.
2. Provide a general statement that refers to your findings.
3. Justify this with the data from your experiment.
4. Accept or reject your hypothesis.
The strength of your conclusion will be determined by the strength of the research methodology, data collection and analysis.
The same is true when evaluating claims made based on secondary data. Secondary data has been collected by someone else for a different purpose. It can be used as the basis of claims in published scientific studies, government reports and even media sources. Any claims made must be supported by reasonable evidence, with references provided. They should be objective, free from bias and supported by data from valid scientific research projects. If you have doubts about the validity of the claims, investigating the research methodology is a great place to start.
Here are some steps you can take when evaluating the validity of media reports:
• Read beyond the headline. The headline of an article is designed to grab your attention, but it may not provide a complete or accurate summary of the study. Read the full article to get a better understanding of the research and the methods used.
• Check the source. Look for reputable sources of information, such as peer-reviewed scientific journals.
• Look for replication. Scientific findings should be replicated by other researchers before they are accepted as reliable.
WORKSHEET
Evaluating investigations
primary data data that researchers collect themselves for a specific purpose; obtained from observations, experiments, surveys or interviews secondary data data that have been collected by somebody else for another research purpose
randomised controlled trial a trial that relies upon random allocation of participants to the control and experimental groups while all known extraneous variables are controlled
• Check the sample size. Studies with larger sample sizes are generally more reliable than studies with small sample sizes.
• Check the methodology. Look for studies that use rigorous methods to control for confounding variables and minimise bias. Randomised controlled trials are generally considered the gold standard of scientific research.
• Look for limitations. No study is perfect, and there may be limitations to the methods used or the results reported. Look for studies that acknowledge their limitations.
Figure 1.38 The MMR (measles, mumps and rubella) vaccine scandal began in the late 1990s when British doctor Andrew Wakefield claimed that the MMR vaccine was linked to autism and bowel disease. Wakefield's study was later found to be fraudulent, but it led to a decline in MMR vaccination rates in the UK and other countries. This resulted in outbreaks of measles and other diseases, causing serious harm and even death in some cases. Wakefield was eventually found guilty of professional misconduct and the study was withdrawn.

Try this 1.3
evaluating headlines
In 2018, a research paper was co-written by William McAuliffe, a psychology PhD student, and published in the esteemed journal Nature Human Behaviour. The paper suggested that people tend to become less generous over time when making decisions in an environment where they lack interaction with others.
However, the university's press department may have sought to increase the study's appeal to news outlets by exaggerating its findings. The press release announcing the study's publication carried the headline 'Is big-city living eroding our nice instinct?'. Consequently, various media outlets picked up the story, with headlines such as 'City life makes humans less kind to strangers' and 'Big city living "switches off human instinct to be nice"'. However, these interpretations of the study were inaccurate, as it was conducted in a lab, not a city, and only measured investment behaviour rather than overall kindness.
Your teacher will provide you with headlines and the scientific report they are based on.
Research the methods used by scientists in the provided studies and evaluate the validity of the headlines written by the media, using the six steps outlined previously.
Quick check 1.9
1. Define primary and secondary data.
2. State three things you might check when evaluating the validity of scientific claims made in media reports.
Scientific texts can range from highly technical to more accessible. This depends on the intended audience and purpose. For example, a scientific paper published in a peer-reviewed journal will be written for scientists and academics. Such papers will often use technical language and complex concepts that may be difficult for the public to understand. Mathematical and symbolic forms may be used without much explanation.
In contrast, a popular science article or blog post will be written for a more general audience, with a focus on making complex concepts more understandable. These articles may include anecdotes and examples to illustrate key points and may be written in a more conversational tone. These articles try to engage and entertain the reader.
When comparing these types of texts, it is important to analyse the author's choice of language, tone and style. These affect the reader's understanding and engagement with the topic. For example, a highly technical paper may provide a more in-depth analysis of the data but may be less accessible to non-expert readers. A popular science magazine may be more engaging but will lack some of the detail. In some cases, it may misrepresent the research findings in the attempt to simplify them.
Presenting investigations as practical reports and as scientific posters is likely to form part of your assessment this year. Both documents involve recording the method under structured headings. Your teacher may also ask you to keep a practical logbook. This is where you record information obtained from background research, development of your research question and experiments conducted in class.
An overview of how the steps in the scientific method align with sections of the practical report is shown in Figure 1.39.
Scientific method
Observe and ask questions
Do background research (rationale)
Define variables and state a hypothesis
Methodology
Collect and record the data
Analyse the data
Section of a practical report
Aim or research question
Introduction
Method (includes materials)
Results
Discussion
Evaluate the data
Form a conclusion
Conclusion
Figure 1.39 Steps of the scientific method matched to sections of a practical report
All of the VCE Science subjects require that students create scientific posters, although the criteria differ slightly between the subjects. Scientific posters are designed to communicate the results of experiments in a clear and succinct way. They are suitable for a more general audience, as they are less detailed than a practical report. There is a standard way of formatting posters, which is shown in Figure 1.40. This is similar to how scientists present their research findings at conferences. Scientific posters tend to have a word limit of around 1000 words.
TITLE: A concise version of the research question (phrased as a question)
Student name
Conclusion
• State the main result, i.e. the claim of causation that can be made from the experiment regarding the independent and dependent variables.
• The evidence from your data that supports this claim (specific data should be stated).
• An explanation of whether the data support or refute the hypothesis.
References: List any references you have cited (referred to) in the body of the poster. Do not make a comprehensive list of all the sources you have accessed in your background research. Use an appropriate format such as APA, Harvard or Oxford referencing style. This is also the appropriate place to thank individuals such as lab partners who provided assistance/funding.
Discussion Approximately 3–4 paragraphs
Analysis: Did the data support the hypothesis? Discuss the relationship between the independent variable and dependent variable based on patterns and trends evident in the data
Results Display a selection of descriptive statistics generated from the experiment, tables OR graphs (you do not need to include both if they display the same data). Ensure any trends are clearly indicated on the graph. You may include a few sentences as a summary of the results.
Introduction A brief summary of the background research/rationale for the investigation. Ensure definitions, acronyms and relevant formulas are included to enable peers to understand the investigation. Define the experimental variables. State the hypothesis.
Evaluation: Compare the results with expected results, with reference to controlled and extraneous variables.
Discuss limitations of the experimental design and potential sources of error.
Relate your findings to previous findings/research.
Methodology
Materials:
• List apparatus and materials in dot point form.
• You can include diagram or photo of experimental set-up.
Method: This needs to be sufficiently detailed to allow replication; however, it does not need to be the detailed step-bystep scientific method one would use in a formal practical report. A summary, diagram or flowchart may be sufficient.
For career scientists, publishing a paper in a peer-reviewed scientific journal such as Science or Nature is rigorous and competitive. Science receives about 12 000 submissions every year, and the editors must evaluate each submission carefully to select the papers that are suitable for publication. Here are the steps involved in the process:
1. Submission: Authors submit their paper online through the journal's website.
2. Initial screening: Once submitted, the editors conduct an initial screening to check whether it meets the journal's requirements. They look at the scope of the paper and the quality of the writing.
3. Peer review: If the paper passes the initial screening, it is sent out for peer review. The editors select a few experts who read the paper and provide feedback on its quality, originality and significance. This is usually a blind process, which means that the reviewers do not know the identity of the authors, and the authors do not know the identity of the reviewers.
4. Decision: Based on the feedback from the reviewers, the editors decide whether to accept, reject or request revisions to the paper. If the paper is accepted, it will be published in the journal.
5. Revision: If the editors request revisions, the authors will have to make the necessary changes and resubmit the paper. The editors will then review the revised version.
6. Publication: Once the paper is accepted, it is formatted before it is published online and in print.
The work of Australian scientists Professor Barry Marshall and Dr Robin Warren on the cause of peptic ulcers was initially rejected for publication because their findings were contrary to the belief that ulcers are caused by stress, lifestyle and diet. Marshall and Warren discovered that ulcers are caused by a bacterium called Helicobacter pylori, but their research was met with scepticism and criticism from the medical community.

Go online to access the interactive section review and more!
However, Marshall was so convinced of his findings that he ingested the bacteria to demonstrate that it caused gastritis, and later an ulcer. Despite the initial rejection and criticism, the researchers persisted and continued to gather evidence to support their findings. Eventually, their work was validated through further research and clinical trials, which demonstrated the effectiveness of antibiotics in treating ulcers caused by H. pylori. Marshall and Warren were awarded the 2005 Nobel Prize in Physiology or Medicine for their discovery, which revolutionised the understanding and treatment of peptic ulcers.
As a result, the protective
the bacteria to swim through it.
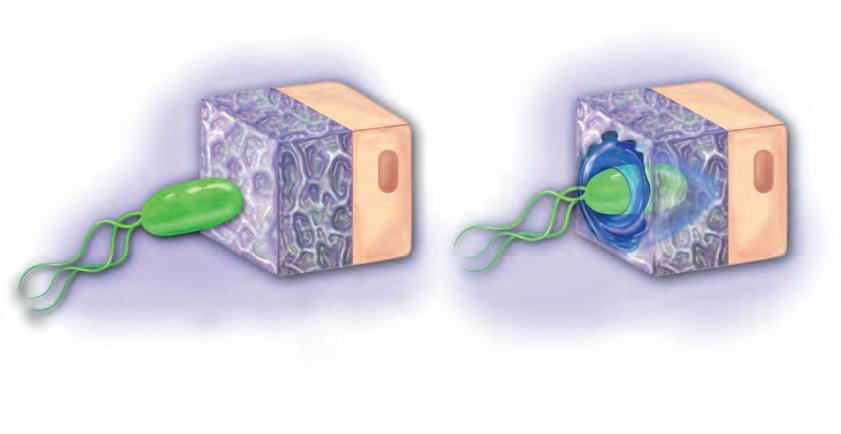
Section 1.3 review
Remembering
1. List the headings of the sections of a practical report.
2. State an intended use of scientific posters.
Understanding
3. Explain why peer-reviewed publications are generally considered to be more credible than those that are not peer-reviewed.
Applying
4. Describe how checking the methodology of a study allows you to evaluate the validity of the claims being made.
Analysing
5. Contrast primary and secondary data.
Evaluating
6. Explore the website www.dhmo.org.
a) Write a brief description of this website.
b) Does it appear to contain credible information?
c) Is the information true or false?
d) How has the information been communicated to cater for its intended audience? Online quiz
Chapter checklist
Success criteria
1.1I can explain the choice of independent, dependent and controlled variables in a scientific investigation. 2, 14b
1.1I can refine a research question to target specific information or data collection techniques. 11, 14a
1.1I can assess the validity of an investigation by defining the terms repeatability, replicability, reproducibility, accuracy and precision. 6, 8
1.1I can describe the difference between random and systematic errors, and calculate both absolute and relative uncertainty.
1.2I can assess and minimise experimental risk. 3
1.2I can apply skills in the use of specialised laboratory equipment, such as titration equipment.
1.2I can explain the use of data loggers, models and simulations for gathering reliable data. 5
1.2I can describe the ethical considerations of using animal and human participants in research. 7, 14d
1.2I can outline research design features that might be employed in trials involving human participants that will increase the reliability and validity of the findings. 13, 14c
1.3I can evaluate the validity of claims in primary and secondary data.4, 9, 12
1.3I can communicate research findings clearly and effectively through the use of structured practical reports and scientific posters.
Review questions
Remembering
1. Recall what a scientist should do if they discover an Aboriginal or Torres Strait Islander artefact during fieldwork.
2. Define the following terms. a) independent variable b) dependent variable
extraneous variables
controlled variables
3. Recall the reason a safety data sheet (SDS) should be understood before conducting an experiment.
4. List the research design features of a randomised controlled trial that make it the 'gold standard' in scientific research.
5. Explain how a computer simulation can be advantageous for a researcher.
6. Outline the difference between a random and systematic error, giving an example of each.
7. Outline three rights of human participants, as detailed in the Australian Psychological Society (APS)'s Code of Ethics.
8. Identify the missing word in the sentence below:
An experiment demonstrates highly repeatable results. However, it is later discovered that the researchers used measurement tools that were not appropriately calibrated. The data can be said to have high precision but low _____________.
9. The findings from an investigation are submitted to a journal for publication. Describe the process of peer review that determines if the article will be published.
10. Calculate the absolute uncertainty in a balance that weighs correct to one decimal place (in grams).
11. This diagram shows the initial and final burette readings during a titration. Calculate the volume of the titre.
Initial reading: Final reading: Titre:
12. A student sets out to conduct a literature review in order to refine their research question. They conduct a search of appropriate databases using the experimental variables as search terms and then write a summary of all the available search results. Identify which critical intermediate step of conducting a literature review they have missed.
13. A rabbit that is being used during a scientific experiment is infected with a virus and then randomly allocated to a group that receives a placebo treatment. Justify whether this rabbit has been allocated to the control group or the experimental group.
Evaluating
14. A student was interested in testing the effects of sleep deprivation on memory recall in secondary school students, so he decided to conduct his own study. He chose four of his friends to be the participants. Two of them went without sleep for 24 hours and were then given two minutes to memorise 20 three-letter nonsense words (e.g. pud, wes). Their recall of these words was then tested. The other two friends were allowed to sleep for their usual time period and were given the same memory test. The results are shown below:
Experimental condition Average recall of three-letter words (out of 20) Sleep-deprived group
a) State a testable hypothesis for this experiment.
b) Outline two possible extraneous variables.
c) Identify what participant sampling technique he employed.
d) Discuss whether this experiment was ethically sound.
e) Write a conclusion based on the results shown above.
Applying
1. The table below shows the effect of changing the pH of a pond on the number of tadpoles in the pond.
Table showing the number of tadpoles according to the pH of pond water
a) Identify the independent and dependent variables in this study.
b) Identify the optimum pH for tadpole survival.
c) Identify an outlier in the data.
d) Identify at which pH value the data were most precise.
Analysing
2. High school students were analysing the amount of ethanoic acid in a commercial vinegar sample and had made up a dilute solution of 0.1 mol L–1 ethanoic acid based on the concentration of ethanoic acid given on the bottle of vinegar. The students set up a titration with 20.00 mL of their ethanoic acid in a conical flask (via pipette) and filled a burette with 0.1 mol L–1 NaOH. If the ethanoic acid content quoted on the vinegar bottle was correct, the students hypothesised that 'If 20 mL of 0.1 mol L–1 ethanoic acid is present, then 20 mL of 0.1 mol L–1 NaOH will be required to reach an end point'. The titration data from the two students attempting six repeated trials are tabulated in the table below.
Table showing the titres required to reach the end point
a) Identify and circle any outliers in each student's trials.
b) Calculate the mean volume of NaOH required to reach the titration end point, after removing outliers for each student.
c) The 'true' value for the titration, given the actual concentration of ethanoic acid, should have been 20.00 mL of 0.1 mol L–1 NaOH. Recognise the validity of this experiment for identifying the concentration of ethanoic acid.
d) Contrast the data tabulated. Was each student accurate?
e) Analyse the data tabulated. Were the students precise?
f) Justify whether the data presented by students 1 and 2 provide evidence to support the hypothesis.
g) Based on the data presented, infer whether the experiment was repeatable and reproducible.

Everyone is unique, but you may look similar to your parents. This is thanks to the genes that they passed on to you. Genes carry the information that determines your traits and are made of DNA. This chapter explores the structure and function of DNA and genes in heredity. You will consider how variation is increased in offspring and predict patterns of inheritance. You will also examine what happens when there are problems with DNA and how these may be caused by the environment.
Required to make proteins via processes involving: • transcription • translation.
• • • Nucleotides contain: a pentose sugar a phosphate group a nitrogenous base (A, G, C or T (or U in RNA)).
made of
DNA
Genetic material in humans and other living organisms undergoes replication prior to
Mitosis (for growth and repair; results in genetically identical cells) and meiosis (for reproduction; results in genetically different cells)
changes can be
Beneficial Harmful Neutral
Patterns of inheritance in characteristics that are passed on
Tools for analysis:
• Punnett squares • pedigrees
Can change (mutate)
Gene mutations Chromosome mutations
Genetically modified organisms (GMO) Gene therapy types of changes DNA can be purposely manipulated.

genetic inheritance involves the function of DNA, chromosomes, genes and alleles, and the roles of mitosis and meiosis in passing on genetic information to the next generation; the principles of Mendelian inheritance can be used to predict ratios of genotypes and phenotypes in monohybrid crosses involving dominant and recessive traits (VC2S10U04)
• using models and diagrams to represent the relationship between genes, chromosomes and DNA of an organism's genome
• explaining how genetic information passed on to offspring from both parents by meiosis and fertilisation increases the variation of a species
• using the concept of Mendelian inheritance to predict the ratio of offspring genotypes and phenotypes in monohybrid crosses involving dominant and recessive alleles or in genes that are sex-linked
• using pedigree diagrams to show patterns of inheritance of simple dominant and recessive characteristics through multigenerational families
• exploring the role of DNA in cancer or genetic disorders such as haemochromatosis, sickle cell anaemia, cystic fibrosis and Klinefelter syndrome
scientific knowledge is contestable and is validated and refined over time through expanding scientific methods, replication, publication, peer review and consensus (VC2S10H01)
• examining how the work of Rosalind Franklin and Raymond Gosling was critical to determining the double-helix structure of DNA, reported by James Watson and Francis Crick
• exploring the role of large data sets and statistical analysis in validating scientific findings, such as Gregor Mendel's experiments with pea plants 2.3 the use of scientific knowledge to address socio-scientific issues and shape a more sustainable future for humans and the environment may have diverse projected outcomes that affect the extent to which scientific knowledge and practices are adopted more broadly by society (VC2S10H03)
• investigating why agricultural practices have changed to include widespread use of genetically engineered crops
Allele
Aneuploidy
Autosome
Carrier
Centromere
Chromatin
Chromosome
Chromosome mutation
Codominance
Codon
Complementary base pairing
Deletion
deoxyribonucleic acid (DNA)
Diploid (2n)
Dominant
Embryo
Fertilisation
Filial
Gametes
Gene
Gene mutation
Gene therapy
Genetic engineering
Genetic screening
Genetically modified organism
Genetics

Genome
Genotype
Germline mutation
Gonads
Haploid (n)
Heredity
Heterozygous
Homologous chromosomes
Homozygous
Hydrogen bonds
Incomplete dominance
Induced mutation
Insertion
Inversion
Karyotype
Locus
Meiosis
Mitosis
Monohybrid cross
Monomer
Mutagenic
Mutation
Non-disjunction
Non-homologous chromosomes
Nucleotide
Ova
Pedigree
Phenotype
Point mutation
Polymer
Polypeptide
Punnett square
Recessive
Recombination
Reduction division
Sex chromosomes
Sexual reproduction
Sister chromatids
Somatic cells
Somatic mutation
Spontaneous mutation
Substitution
Telomeres
Test cross
Transcription
Transgenic organism
Translation
Trisomy
Zygote
genetics the study of genes, genetic variation and heredity
gene a length of chromosome made of DNA; the basic unit of inheritance heredity the genetic passing on of traits from one generation to the next deoxyribonucleic acid (DNA) the molecular unit of heredity, containing the genetic information responsible for the development and function of an organism polymer a molecule made from many repeating subunits called monomers monomer a single subunit that when joined together repeatedly makes a polymer nucleotide a monomer subunit of a nucleic acid, consisting of a phosphate group bound to a five-carbon sugar, which in turn is bound to a nitrogenous base
At the end of this section, I will be able to:
1. Recall the components that make up the structure of DNA and RNA molecules.
2. Describe the relationship between DNA, genes and chromosomes.
3. Describe the steps in which DNA is used to synthesise proteins.
The nucleotides bind together to form two long strands that wind around each other. The bonds that hold nucleotides together are called phosphodiester bonds. Each strand has a backbone made of alternating deoxyribose sugar and phosphate groups. WORKSHEET
Genetics
Genetics is the study of how certain traits (characteristics) can be inherited from a previous generation. It involves the study of genes, genetic variation and heredity. Genes are considered the basic unit of inheritance. They are made of deoxyribonucleic acid, or DNA for short. This hereditary material is passed from parents to offspring and is considered the blueprint for living things, containing the information needed to specify traits.
DNA is a double-stranded molecule that forms a 'double-helix' shape, like a twisted ladder. DNA is a polymer made up of many monomer subunits called nucleotides
The nucleotides that make up DNA have three major components:
• a five-carbon (pentose) deoxyribose sugar
• a nitrogenous base – one of adenine (A), guanine (G), cytosine (C) or thymine (T)
• a negatively charged phosphate group.
Figure 2.1 The double helix structure of DNA: the subunits called nucleotides all join up to form the double-stranded DNA. Note the sugar–phosphate backbone on the edge of the DNA molecule and the nitrogenous bases joining in the centre.

The nitrogenous bases from one strand bind to complementary bases on the other strand using hydrogen bonds
Adenine (A) always pairs with thymine (T), and guanine (G) always pairs with cytosine (C). One way to remember the A–T and G–C pairings is 'Apple in the Tree, Car in the Garage'. This complementary base pairing occurs because of the shape of the nitrogenous bases and the number of hydrogen bonds they can form (Figure 2.3).
Guanine and adenine have a doublering structure, which means they belong to a group of chemical molecules called purines. A helpful way to remember that adenine and guanine are purines is 'Pure As Gold'. Cytosine and thymine have a single-ring structure and belong to the group called pyrimidines. Purines always pair with pyrimidines, but the number of hydrogen bonds between them depends on the structure. Guanine binds with cytosine with three hydrogen bonds, while adenine and thymine form two hydrogen bonds.
hydrogen bonds intermolecular chemical bonds that hold the two DNA strands together complementary base pairing adenine only binds with thymine and cytosine only binds with guanine
Figure 2.3 A closer look at the structure of DNA. The sugar–phosphate backbone forms the outer edge of the helix and the nitrogenous bases form complementary pairs in the centre. Hydrogen bonds hold the two strands together.
Try this 2.1
Modelling DNA using lollies
Materials
• liquorice ribbons or sour strips
• a handful of jelly babies
• toothpicks
Method
1. Sort the jelly babies into four groups of colours.
Be careful
Do not to consume lollies in the laboratory. Beware of allergies.
2. Pair up the jelly babies so that one particular colour always goes with another particular colour –for example, red with yellow and orange with green.
3. Place a pair of jelly babies onto each toothpick as if you were making lolly kebabs. Ensure that the pairs are always of matched colours.
4. Attach your lolly kebabs to the long strips of liquorice.
5. Keep doing this until you have about five to seven horizontal toothpicks attached and it starts to look a bit like a ladder.
6. The paired coloured sweets represent the base pairs, while the liquorice is the sugar–phosphate backbone.
7. Pick up your lolly ladder and twist it to represent the double helix shape of DNA.
Practical 2.1
Aim
To investigate and extract DNA from strawberries
Materials
• plastic sandwich bag (or other material to contain strawberry and liquid)
• strawberry
• DNA extraction mixture provided (10 mL)
• filter funnel and gauze (or other gauze-style filter)
• cold ethanol solution
• test tube (or small beaker)
• stirring rod
• plastic pipette
DNA extraction mixture:
• dishwashing liquid or shampoo (5 mL)
• table salt (0.75 g)
• water (45 mL)
Method
Be careful
Wear safety glasses and a lab coat. Do not consume food items.
1. Wash the strawberry with tap water and remove the green leaves. Add the strawberry to the plastic sandwich bag.
2. Add the DNA extraction solution (10 mL) and close the sandwich bag, removing the excess air.
3. Squash the strawberry into the liquid using your hands until the strawberry is roughly crushed.
4. Pour the strawberry mixture through a filter funnel lined with gauze into a test tube.
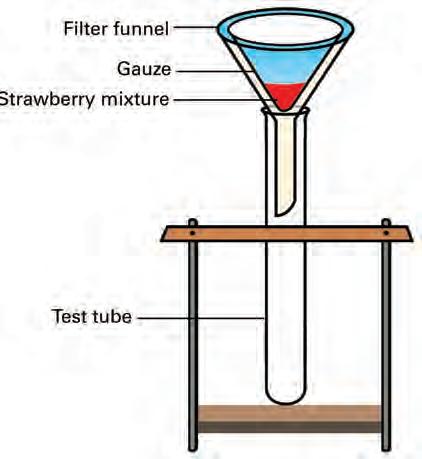
5. Discard the gauze and strawberry remains into a bin.
6. Add to the test tube an amount of cold ethanol equal to the volume of liquid already in the test tube, using a plastic pipette.
7. Collect the white solid that forms on the stirring rod. This is DNA.
Results
Write observations for what occurs during each step of the method.
Discussion: Analysis
1. Describe whether the white solid could contain all of the DNA of the strawberry.
2. Visually compare the amount of solid you collected to that of other groups in the classroom. Were the results consistent? Explain your answer.
Discussion: Evaluation
1. Describe the variables that were not kept consistent between groups in the classroom.
2. Suggest any changes that could be made to the method to improve the quality of the recorded data in future experiments. Justify your suggestions by explaining how each change would improve the data quality.
Conclusion
1. Make a claim about the efficiency of this method for extracting all the DNA from a strawberry.
2. Support your statement using your and other groups' observations, and include potential sources of error
3. Explain how the data support your statement.
Did you know? 2.1
The DNA found in only one cell, if fully unravelled, would be around two or more metres long! The length of a piece of double-stranded DNA is commonly expressed as the number of complementary nitrogenous base pairs it contains. The DNA in an average human cell has an estimated 63 000 000 base pairs.
1. Recall the three key components that make up a nucleotide.
2. Describe the overall shape of DNA.
3. If a strand of DNA contained the nitrogenous bases seen below, state the bases in its complementary strand.
DNA strand: ATATAGATAGATCAGACA.
chromatin a mixture of DNA and proteins that forms chromosomes chromosome a thread-like structure of tightly wound DNA and proteins called histones
The discovery of DNA
Friedrich Miescher was a Swiss biochemist who first observed DNA in 1869. However, it took almost a century for scientists to understand the structure of DNA and the mechanisms by which it carries genetic information.
Research the following scientists who, among many others, contributed to our understanding of DNA:
• Friedrich Miescher
• Erwin Chargaff
• Francis Crick and James Watson
• Rosalind Franklin and Raymond Gosling
• Maurice Wilkins.
Summarise their contributions and place them on a timeline.
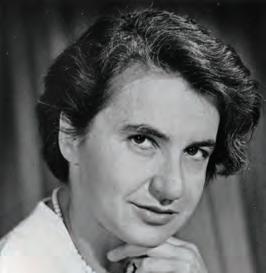
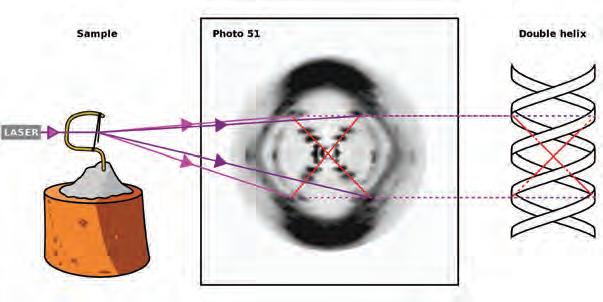
Figure 2.4 Dr Rosalind Franklin (a) and Raymond Gosling fired X-rays at a DNA strand stretched across a paperclip in (b) 1952. The resulting picture was critical to the discovery of the double helix structure of DNA, providing key information that enabled James Watson and Francis Crick to build the first correct model of the structure of DNA.
The DNA found in the nucleus of a cell is usually in a form called chromatin. This is a highly organised complex of DNA and associated proteins such as histones. By wrapping around histones, the long strands of DNA can fit inside the nucleus. When it is time for the cell to replicate, chromatin condenses into structures called chromosomes. Each molecule of DNA forms one chromosome. Along the chromosome are genes, which are the units of inheritance. Genes are sections of DNA that hold the specific instructions required for making every protein in our bodies.
Chromosome
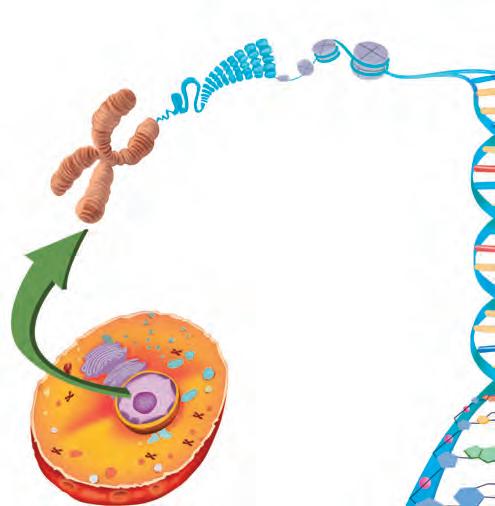
Nucleotide base pairs:

2.5 The relationship between DNA and chromosomes Telomeres

The familiar X-shape of a chromosome is only seen after DNA replication has occurred. Shortly before replication, the chromosome appears as a single condensed DNA molecule. DNA replication produces two identical sister chromatids that are joined together by centromeres to form the distinct X-shape (Figure 2.6). At the ends of each chromosome are protective structures made of DNA and protein called telomeres. These protect the chromosomes, but every time DNA replicates, the telomeres shorten. Eventually, the telomeres shorten to the extent that replication can no longer occur.
Centromeres
Telomeres
One chromosome One chromosome (duplicated)
Sister chromatids
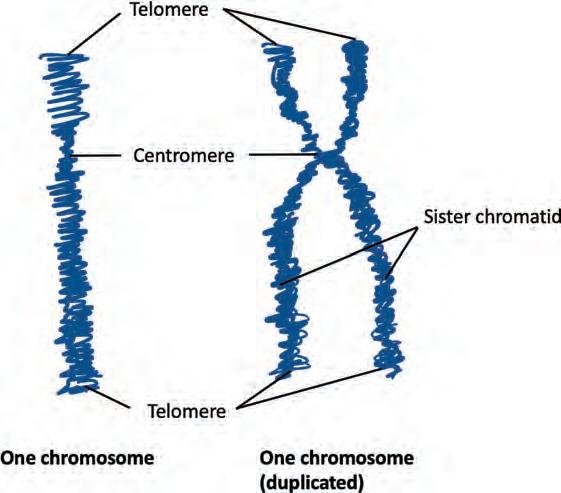
2.6 Before replication, a chromosome is a single molecule (left).
After DNA replication, each chromosome consists of two molecules called sister chromatids (right).
sister chromatids two copies of the same chromosome, connected at a centromere
centromere a structure that holds two sister chromatids together telomeres structures made from DNA and proteins that protect the ends of chromosomes
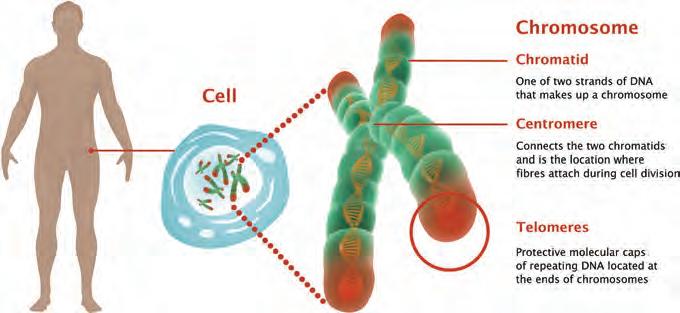
Chromatid
One of two strands of DNA that makes up a chromosome
Centromere
Connects the two chromatids and is the location where fibres attach during cell division
Telomeres
Protective molecular caps of repeating DNA located at the ends of chromosomes
2.7 The distinct X-shaped chromosome, showing the two sister chromatids and the centromere

Telomeres contain thousands of repeated copies of the base sequence TTAGGG. When we are infants, our telomeres are approximately 10 000 bases long, but each time the cell divides, they slowly get shorter. A cell will die when its telomeres become too short. By the time we are in our eighties, our telomeres may only be 5000 bases long, but this varies from tissue to tissue and from person to person. A person in their thirties may well have telomere lengths of a person in their nineties and vice versa.
This means that telomeres are a key component of ageing, and there are efforts to use them to slow down or reverse the ageing process. Some companies say they can measure your telomere length, suggesting that it will indicate your true biological age. Despite limited evidence, there are also companies that sell products that they claim can maintain or lengthen telomeres – in effect, making you younger or possibly allowing immortality.
Complete the Compass points activity about manipulating telomeres to prevent ageing:
E = Enthusiastic
What generates enthusiasm within you regarding this concept? What are the potential benefits?
W = Worries
What causes concern about this idea? What are the potential drawbacks?
N = Need for information
What other details or facts are necessary to evaluate this idea? What additional knowledge would aid in assessment?
S = Suggestion for progress
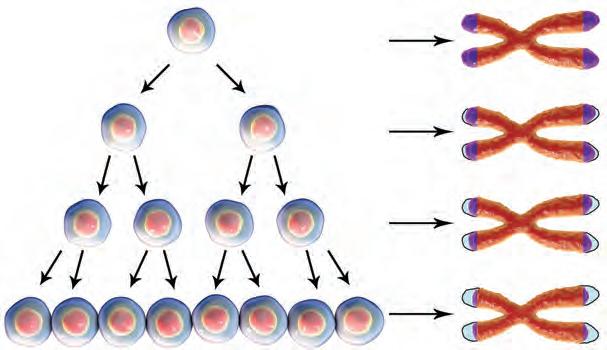
What is your current viewpoint or proposal regarding this idea? How can you continue to assess this concept?
The Compass points thinking routine was developed by Project Zero, a research centre at the Harvard Graduate School of Education.
Different forms of nucleic acids
There are four types of biological macromolecules: proteins, carbohydrates, lipids (fats and oils) and nucleic acids. Nucleic acids are found in two forms: DNA and ribonucleic acid (RNA). The two types of nucleic acids differ in several key ways, which are outlined in Table 2.1 and shown in Figure 2.10.
Number of strands Two
Type of sugar


CH2OH OH OH O
Deoxyribose
Nitrogenous bases Guanine
Cytosine Adenine Thymine
Where is the molecule found?
Nucleus, mitochondria and chloroplasts (in eukaryotes)
Cytoplasm (in prokaryotes)
Different forms DNA
Mitochondrial DNA (mtDNA)
Chloroplast DNA (cpDNA)
One


CH2OH OH OHOH O


Ribose
Guanine
Cytosine
Adenine
Uracil
Cytoplasm
Nucleus
Ribosomes
Messenger RNA (mRNA)
Transfer RNA (tRNA)
Ribosomal RNA (rRNA)
Table 2.1 The main differences between the two nucleic acids, DNA and RNA
Base pair
1. Describe the relationship between chromosomes, genes, DNA and base pairs.
2. Contrast the structures of DNA and RNA.
The purpose of DNA: Making proteins
Why do we need proteins?
Proteins are complex molecules that play a critical role in many body functions. We use approximately one billion proteins every day, just to function normally. Proteins help provide structure to cells and build and repair tissue. Protein molecules play many other varied roles in the body; they include haemoglobin molecules that carry oxygen around our body and the hormones that regulate our glucose levels and development. Collagen and keratin are structural proteins, making up the structural components of organs. Digestive enzymes, such as amylase and lipase, are catalytic proteins that help control the rates of reactions. Other proteins help us fight pathogens, transport molecules and move our muscles. Quick check 2.2
2.2 Protein functions
The many roles of protein include structural, contractile, transport, catalytic, regulatory and immunological functions. Research the following proteins and determine their function.
Oxytocin
Actin
Ferritin
Insulin
The link between DNA and proteins
Genes are sections of DNA that hold the specific instructions required for making each of the proteins in our bodies. The sequence of the nitrogenous bases in a gene provides the instructions (or code) to produce a protein. Amino acids are the monomers of proteins. The order of nitrogenous bases specifies the sequence of amino acids that forms a particular protein.
Alzheimer's disease is a complex neurodegenerative disorder that is thought to be caused by a build-up of abnormal proteins in the brain. These protein deposits are called amyloid plaques and are composed of misfolded amyloid-beta protein. Many different genes have been found to increase susceptibility to Alzheimer's disease. Dr Alison Goate is credited with being the first to discover a gene that directly causes Alzheimer's. Dr Goate's work has laid the groundwork for a better understanding of amyloid plaque formation and the development of possible treatments for the disease.
1. Recall why proteins are important.
2. Describe the relationship between DNA, amino acids and proteins.
To synthesise (or build) proteins using the DNA code in genes, the gene must be expressed; that is, the instruction in the DNA is converted into a protein. This means two processes need to occur: transcription and translation
To transcribe means to put into written form, so in this process the DNA code for a specific protein is 'written down' in the form of mRNA (messenger RNA).
To translate means to convert into another form, so in this process the code (in the form of mRNA) is converted into a chain of amino acids, which will then fold into a functional protein.
DNA molecule unzips. One strand of the DNA molecule acts as a template for the formation of the messenger RNA.
Figure 2.12 When the DNA double helix unwinds and unzips, one strand of the DNA acts as the template on which the messenger RNA strand is formed.
Transcription happens in the nucleus of the cell. The transcription process requires getting access to the DNA code in the genes, otherwise the code cannot be copied. Transcription begins when an enzyme (RNA polymerase) binds to the gene being copied. This causes the DNA double helix to unwind, allowing the enzyme to read the code on one of the DNA strands. This strand is called the DNA template strand because it acts as a template for the production of mRNA. The other strand is called the non-template strand because it is not involved in the production of the mRNA molecule.
transcription the first stage of protein synthesis in which the base sequence of DNA is copied into mRNA translation the second stage of protein synthesis in which a sequence of mRNA is translated into a sequence of amino acids
Uracil replaces thymine in the mRNA
codon
three nucleotides (base triplet) in mRNA that code for an amino acid polypeptide a chain of amino acids forming part or the whole of a protein molecule
As the enzyme reads the code on the template strand, it builds a complementary copy of the gene using RNA nucleotides: C, G, A and U. RNA follows the same complementary pairing rules as DNA, with one exception. Where DNA has the nitrogenous base thymine (T), RNA has uracil (U). The newly formed single-stranded RNA is messenger RNA. When the mRNA peels away from the DNA template strand, the DNA double strands rejoin and wind back up into a helix. The mRNA then leaves the nucleus and goes to the sites of protein production, the ribosomes.
Try this 2.2
Base pairings
Complete the base sequence of the DNA complementary strand and then the mRNA strand formed from the DNA template strand given below.
Complementary DNA
DNA template
TACCCGAAAGTG mRNA
Translation
Once mRNA reaches the ribosomes in the cytoplasm, it must be 'decoded' or translated to make the necessary protein. The nitrogenous bases in the mRNA are decoded in groups of three called codons. Each codon in the mRNA specifies which amino acid is added to the polypeptide chain.
Figure 2.13 depicts a simplified version of the process of translation. It occurs at the ribosomes, which may be freely floating in the cytoplasm or attached to the endoplasmic reticulum (ER). Amino acids are joined together at the ribosome according to the order of codons in the mRNA molecule.
Transcription Occuring in the
Translation Occuring in the cytoplasm
Chain of amino acids
Figure 2.13 The process of transcription and translation from a DNA molecule to an amino acid chain
Second letter in the codon
U U C A G
UUU Phe (F)
First letter in the codon
A
UUA
UUG
CUU
UAU Tyr (Y) UGU Cys (C) U
UUC UCC UAC UGC C
Leu (L)
UCU Ser (S)
UCA UAA STOP UGA STOP A
CCU
CUC CCC CAC CGC C
Leu (L)
CUA
Pro (P)
CAU His (H) CGU Arg (R) U
UCG UAG STOP UGGTrp (W) G C
CCA CAA Gln (Q) CGA A
CUG CCG CAG CGG G
AUU IIe (I)
ACU Thr (T)
AAU Asn (N) AGU Ser (S) U AUC ACC AAC AGC C
AUA ACA AAA Lys (K) AGA Arg (R) A
Third letter in the codon
AUGMet (M) START ACG AAG AGG G G
GUU Val (V) GCU Ala (A) GAU Asp (D) GGU Gly (G) U
GUC GCC GAC GGC C
GUA GCA GAA Glu (E) GGA A GUG GCG GAG GGG G
Table 2.2 Table of amino acids showing that the genetic code is degenerate, which means that more than one codon can code for a single amino acid. This redundancy means that 61 of the 64 codons code for the 20 amino acids (the other three are stop codons).
Table 2.2 shows the 20 different amino acids that form the building blocks for proteins. Using this table, you can identify the amino acid that each codon codes for. For example, if the first codon of your mRNA strand is AUG, you locate the A in the left column and the U in the top row and find where they intersect. At that spot is a box containing four different codons. You then find where the G in the right column of the table intersects and you will see your codon AUG. Next to the codon it says Met, which means AUG codes for the amino acid methionine in eukaryotes. The codon AUG is unique as it is also a START codon. This means that it always is the first codon in the mRNA molecule that undergoes translation. There are also three STOP codons that signal for the process of translation to stop, rather than coding for another amino acid.
Using biotechnology to produce therapeutic proteins
Traditionally, vaccines contain a weakened virus, or a protein of the virus, to trigger the body's immune response and provide immunity.
Two of the common COVID-19 vaccines work in that way. AstraZeneca (a viral vector vaccine) contains material from the SARS-CoV-2 virus within the shell of another virus. Novavax (a protein subunit vaccine) contains part of the coronavirus spike protein, which is injected directly.
mRNA vaccines have been in development for decades but had been progressing slowly. Financial backing from governments and commercial organisations is critical for research, and the significant funding provided worldwide to address the COVID-19 pandemic accelerated mRNA vaccine biotechnology.
Figure 2.14 A colourised electron microscope image of SARS-CoV-2 virus particles. The spike proteins around the edge give coronaviruses their name, as corona is Latin for crown.
mRNA vaccines work differently to traditional vaccines. Instead of delivering a viral protein, the vaccines deliver mRNA. COVID-19 mRNA vaccines contain instructions for making the spike protein from the SARS-CoV-2 virus. The Pfizer and Moderna vaccines package the mRNA into a lipid nanoparticle that can pass through the cell membrane.
Vaccine mRNA is modified to be more efficient at protein synthesis and resistant to degradation. This means it can be used as a template many times. Manufacturers use computer-controlled techniques for generating the required strands of RNA. This method is cheaper and safer than manufacturing proteins or growing viruses. mRNA vaccines have huge potential for preventing and controlling future epidemics and pandemics.
1. The following codons are found in a strand of DNA: TAA TTA TCG ACT ACT AGC. State the complementary mRNA strand.
2. Contrast transcription and translation.
3. Infer why it is not necessary to read the code on both strands of DNA when transcribing DNA into mRNA.
Section 2.1 review
Online quiz
Section 2.1 questions
Remembering
Teachers can assign tasks and track results Section questions
Go online to
1. Name the basic building blocks or monomers of DNA.
2. Recall where proteins are created (synthesised) in the cell.
3. Recall the name for the shape of DNA.
4. Illustrate and label a nucleotide.
5. Recall the four bases found in DNA and the complementary base pair rule.
6. Recall why all mRNA strands start with the codon AUG.
Understanding
7. Describe the purpose of DNA.
8. Describe the relationship between DNA, genes and chromosomes.
9. Make a flow chart to summarise the key steps in transcription and translation.
Applying
10. A template strand of DNA is found to contain the following bases: TAC GGA TCA TCG TGG GAA GCA GGC ATT.
a) State the complementary DNA strand.
b) Using the above template strand of DNA, state the bases on the mRNA strand.
c) Using Table 2.2, identify the amino acids that this strand of DNA would code for.
11. Explain how cells can produce so many different proteins with only four different nitrogenous bases.
12. Explain how the genetic information found in the chromosomes within the nucleus of a cell reaches the ribosomes for protein synthesis.
Analysing
13. Contrast the structures of mRNA and DNA.
14. Differentiate between the functions of a structural protein and a catalytic protein, providing examples of each.
15. A template strand of DNA is found to contain the following bases: TCC TGA TGA TGG GGG GCA AAA CGC GTA.
Something went wrong during the transcription of this template strand, and the mRNA strand contains the following bases:
AGG ACU ACU ACC CUC CGU UUU GCG CAU.
a) Determine the mistake in the mRNA strand above.
b) Propose the outcome of this mistake on the protein produced.
Evaluating
16. Propose what may occur if there was a problem with a certain protein in your body.
sexual reproduction form of reproduction that involves the fusion of gametes from two parents and introduces variation to the offspring
gametes sex cells (sperm and ova) with half the usual number of chromosomes gonads the sexual organs: testes in males and ovaries in females
ova (singular: ovum) mature female reproductive cells
zygote
a fertilised egg produced by the fusion of male (sperm) and female (ovum) gametes
embryo the initial stage of early development in multicellular organisms
haploid (n)
a cell containing only one set of unpaired chromosomes
diploid (2n)
a cell containing two sets of chromosomes
somatic cells the body cells of an organism
meiosis the process by which the gonads make haploid gametes mitosis the process by which diploid somatic cells make identical diploid copies of themselves for growth and repair
At the end of this section, I will be able to:
1. Recall the steps involved in DNA replication.
2. Describe the stages of cell division in mitosis and meiosis.
3. Define the terms 'diploid' and 'haploid' with respect to human chromosome numbers in somatic cells and gametes.
4. Use a karyotype to determine information about an individual. Male
Two different forms of reproduction occur among organisms: asexual and sexual reproduction. Sexual reproduction requires two organisms to each contribute a gamete; these are the sex cells that combine to produce a unique offspring. Gametes are formed in the gonads of the male (testes) and the female (ovaries). Each gamete contains half the genetic information needed to form a new organism of the same species. When the gametes – sperm and ova (eggs) – meet and fertilise, they form a zygote with a full set of genetic information. The zygote divides and as the number of cells increases, cells begin to take on special functions. Eventually, the zygote becomes an embryo.
Sperm (haploid)
(haploid)
You will notice that Figure 2.15 has some new terms:
• Cells that contain only one set of chromosomes are known as haploid (n). Gametes are haploid.
• Cells that contain two sets of chromosomes are known as diploid (2n). Somatic cells (body cells) and the zygote are all diploid.
• Meiosis is the name of the process by which the gonads make the haploid gametes.
• Mitosis is the name of the process by which diploid somatic cells make identical diploid copies of themselves for growth and repair.
In humans, the haploid number (n) is 23. This means that gametes contain 23 single unpaired chromosomes. When the egg and sperm meet and fertilise, the two sets of chromosomes come together and form the diploid zygote (2n). The zygote contains 23 pairs of chromosomes, meaning the diploid number (2n) in humans is 46. The pairs of chromosomes are called homologous chromosomes. One copy within each pair was inherited from from each parent. The haploid and diploid numbers vary between species, but always remain the same for all the organisms within that species. For example, the platypus has a diploid number (2n) of 52, which means it has 26 pairs of chromosomes in its somatic cells. This also means the egg and sperm of the platypus contain half this amount of genetic information, so its haploid number (n) is 26 chromosomes.
Did you know? 2.2
The diploid number of chromosomes in a species is not related to whether an organism is bigger or more complicated. For example, a koala, a tammar wallaby and garlic all have a diploid number of 16 but are very different!

chromosomes.
homologous chromosomes a matching pair of chromosomes with the same length, centromere position and gene locations
Quick check 2.5
1. Differentiate between the terms 'haploid cell' and 'diploid cell', providing an example of each.
2. If a sheep's body (somatic) cell contained 54 chromosomes, calculate how many chromosomes would be found in its gametes.
Before a cell divides, the DNA must be replicated to provide two copies of each chromosome, one for each new cell (refer to Figure 2.6 for a reminder of what this looks like). This occurs before the processes of mitosis and meiosis. DNA replication must be precise, otherwise errors can affect the code in the DNA and lead to mutations (permanent changes in the DNA). The steps involved in DNA replication are outlined below and summarised in Figure 2.17.
1. The DNA molecule unwinds and 'unzips' (breaks the hydrogen bonds) between the nitrogenous bases. This happens with the help of an enzyme called DNA helicase.
2. Another enzyme called DNA polymerase attaches new nucleotides to the exposed nitrogenous bases. The enzyme follows the complementary pairing rule, where adenine can only join with thymine, and cytosine can only join with guanine. The two new strands of DNA will be identical to the original parent strand.
3. The newly added nucleotides are connected with new hydrogen bonds, which results in two identical strands of double-stranded DNA being formed. Each new strand is one-half of the original strand and one-half that was newly built (Figure 2.18). For this reason, replication is sometimes described as being semi-conservative.
mutation a change in the genetic code of a cell
Figure 2.17 DNA replication: (1) the DNA must first unwind and unzip and then (2) the new DNA nucleotides can be added following complementary base pairing rules. (3) This results in two identical strands of DNA.
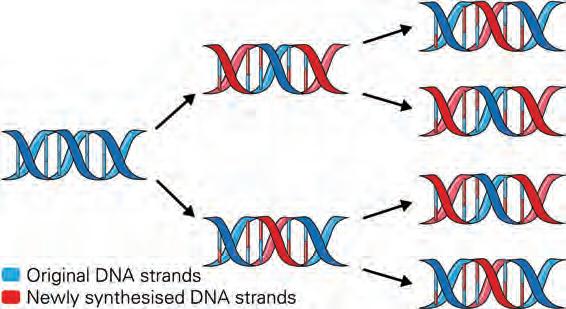
Figure 2.18 After DNA replication, the two new strands of DNA each contain one parent strand and one newly synthesised strand.
Interphase
2n (before mitosis)
Prophase
1. Explain the purpose of DNA replication.
2. Summarise the steps of DNA replication.
Growth and repair of damaged tissues require a form of cell division called mitosis. Mitosis is also important in asexual reproduction to make identical copies of cells. The diploid (2n) parent cell divides to form two diploid cells that are genetically identical, called daughter cells. The sequence of steps in mitosis is shown in Table 2.3. Mitosis produces every cell in the human body, except gametes, which are produced by meiosis and result in haploid (n) cells.
• Parent cell is diploid (2n).
• DNA replication occurs.
• Chromosomes are not visible.
• The cell gets bigger.
• Organelles replicate.
• The nuclear membrane breaks down.
• DNA condenses and appears as distinct chromosomes.
• Spindle fibres begin to form.
Metaphase
Anaphase
Table 2.3 The stages of mitosis
• Spindle fibres attach to the centromere of each chromosome.
• Chromosomes line up along the equator (centre) of the cell.
• The sister chromatids split at the centromere and are pulled to either end of the cell by the spindle.
• Spindle fibres then begin to disappear.
Telophase

Cytokinesis 2 × 2n (after mitosis)
• The nuclear membrane re-forms around the two sets of chromosomes, forming two new nuclei.
• The chromosomes decondense and are no longer visible.
• Division of cytoplasm starts.
• The cell pinches in half and divides into two genetically identical diploid daughter cells.
• In animal cells, a cleavage furrow is formed before the cells separate (shown in Figure 2.19a).
• In plant cells, a cell plate is formed to create a new cell wall between the daughter cells (shown in Figure 2.19b).
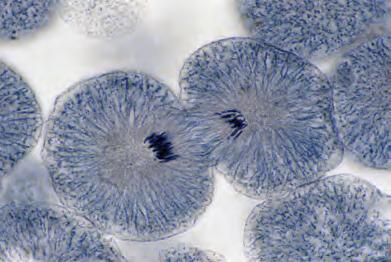
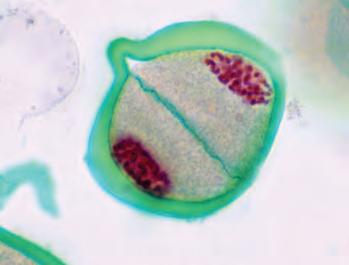
Connect, extend, challenge: Which cells replicate?
Mitosis is the process of cell division in somatic cells; however, not all cells in the body are able to divide. Cell division is a highly regulated process and too much replication can lead to diseases such as cancer.
Mitotic cells are those that are able to divide. These include skin cells, blood cells and cells that line the digestive tract. Non-mitotic cells no longer undergo cell division, such as neurons in the central nervous system and cardiac muscle cells in the heart.
Some tissues in the body contain stem cells, which are a special type of cell that can continuously divide throughout a person's lifetime to regenerate and repair tissue.
Consider what you have just read and then ask yourself:
How are the ideas and information connected to what you already know about cell division?
What new ideas did you get that broadened your thinking or extended it with regard to the purpose of mitosis in the body?
What challenges or questions has this information created for you?
The Connect, extend, challenge thinking routine was developed by Project Zero, a research centre at the Harvard Graduate School of Education.
1. State which cells undergo mitosis. 2. Summarise the steps of mitosis.
Practical 2.2
Aim
To observe cells carrying out mitosis in a growing onion root tip
Materials
• prepared, stained slide of the growing section of an onion root tip caught at different stages of cell division
• microscope
Method
1. Using the lowest magnification, place a prepared slide of a growing onion root tip on the stage of the microscope.
Be careful
Ensure you carry the microscope appropriately: hold the arm with one hand and place one hand under the base. Ensure you don't make big changes in magnification so as not to damage the glass slide.
2. Position the slide so that the pointed narrow end of the root tip is clearly visible.
3. Look for a cluster of rapidly growing cells near this region.
4. Observe several different cells at various stages of cell division under the highest magnification of the microscope.
Results
1. Carefully choose one cell with a clearly outlined cell wall and showing chromosomes in a certain stage of cell division. Sketch a copy of what you observed, labelling the cell wall and the chromosomes. Remember to use a sharp pencil and to document the magnification the sketch is taken at.
2. Count the total number of cells in the field of view. Then identify all the cells undergoing division and count them.
Number of cells in the field of view: ____
Number of cells in the field of view undergoing mitosis: _____
3. The mitotic index is a quantitative expression of the amount of cell division that a particular tissue is undergoing. It is the ratio of the number of cells undergoing mitosis to the number of cells that are not undergoing mitosis. It can be calculated using the following equation: mitotic index = number of cells in the field of view undergoing division total number of cells in the field of view
Calculate the mitotic index for the tissue sample you have observed with your microscope.
4. Using the field of view of your microscope, complete the table and calculate the percentage of cells in each cell cycle stage.
Table showing amount of cells at each phase of the cell cycle
Cell cycle stageNumber of cells in that stagePercentage of cells in that stage
Interphase
Prophase
Metaphase
Anaphase
Telophase
Total
5. Use the calculated percentages to predict which cell cycle stage is the longest and which is the shortest in your sample of cells. Explain your answer.
Discussion: Analysis
1. Explain how you could tell which cells were dividing.
2. Describe the main features of each stage of cell division. Could you use these to identify the stage of mitosis for a particular cell?
3. List the structures in the cells you could observe. Which structures were present that you could not observe? Why might this be the case?
Discussion: Evaluation
1. Discuss any limitations to the data collected and suggest any changes that could be made to improve the quality of the recorded data.
Conclusion
1. Make a claim about the percentage of cells in each stage of mitosis in your onion root tip.
2. Support your statement using the data you gathered, and include potential sources of error.
3. Explain how the experiment could be improved.
Meiosis is the process by which animals and plants produce gametes for sexual reproduction. The process begins with a diploid (2n) germ cell, located in the gonads, and results in four daughter cells (the gametes), which are haploid (n). Because of this reduction in genetic material between the parent and daughter cells, meiosis is also known as a reduction division. The process of meiosis involves two divisions called meiosis I and meiosis II. These steps are further subdivided into distinct stages, as shown in Table 2.4.
Interphase
2n (before meiosis)
Prophase I
Metaphase I
Anaphase I
• Parent cell is diploid (2n).
• Cell growth
• DNA replication occurs.
• The nuclear membrane breaks down, the DNA condenses and chromosomes become visible.
• Homologous chromosomes pair up and crossing over can occur.
• Homologous chromosomes align at the equator in pairs.
• Paired homologous chromosomes separate from each other and are pulled to opposite ends of the cell by the spindle fibres.
Telophase I

Cytokinesis (after meiosis I)
Prophase II
Metaphase II
Anaphase II
Telophase II


Cytokinesis 4 × n (after meiosis II)
• The cell membrane pinches in.
• The nuclear membranes re-form.
• Two separate nuclei form.
• Division of cytoplasm starts.
• The cell pinches completely into two haploid (n) daughter cells.
• Nuclear membranes disappear.
• Spindle fibres re-form in both cells.
• Chromosomes line up at the equator.
• The chromosomes are pulled apart, separating the sister chromatids, which are pulled to opposite sides of the cell.
• The spindle fibres disappear.
• The nuclear membrane re-forms.
• The chromosomes start to become less visible.
• Division of cytoplasm starts.
• The cells produce four genetically different haploid daughter cells (n), each containing half the amount of DNA that was in the parent cell.
• In males, the daughter cells are sperm cells and in females, they are egg cells.
Table 2.4 (continued)
Did you know? 2.3
Crossing over occurs in prophase I of meiosis I when homologous chromosomes get so close together that some of their genetic material gets exchanged. It results in the chromosomes recombining to form a new combination of alleles, increasing the diversity of a species and therefore increasing its ability to respond to changing environments over time. This is how meiosis can increase genetic variation.
1. Describe why the process of meiosis is also known as 'reduction' cell division.
2. Recall where meiosis occurs in humans.
3. Explain why crossing over is an important process during meiosis.
In humans, fertilisation occurs when two haploid gametes fuse to form a diploid zygote. For fertilisation to occur, the sperm must penetrate the outer layers of the egg. The acrosome is a structure, located in the head of the sperm, that is filled with enzymes. These enzymes are released to digest their way through the corona radiata, or outer layer of the ovum. Once the sperm penetrate the next layer of the ovum (zona pellucida), the cell membranes of one of the sperm cells and the ovum fuse together, and the sperm nucleus can enter the ovum. The fusing of cell membranes also triggers a reaction that causes the zona pellucida to harden. This is called the cortical reaction, and it prevents any more sperm cells from entering.

You, or someone you know, might have a twin sister or brother. There are two main types of twins: identical (monozygotic) and fraternal (dizygotic). However, there is another, very rare form of twins known as semi-identical (sesquizygotic). Only two cases have ever been recorded, one in the US and one in SouthEast Queensland. Conduct some research and answer the following questions:
1. Describe how monozygotic and dizygotic twins are formed.

2. Draw a diagram to show how these different types of twins are formed.
3. Discuss why sesquizygotic twins are so rare.
1. Copy the table below and define the terms.
Term
Meiosis
Fertilisation
Zygote
Haploid
Diploid
Definition
2. Identify the missing words in the following sentence. Male gametes are called ______________, whereas female gametes are called ______________.
Although the processes of meiosis and mitosis have similarities, there are some differences:
• In meiosis, chromosomes recombine by crossing over, producing chromosomes with new combinations of genes. In mitosis, chromosomes are replicated to make identical copies of themselves.
• Meiosis involves two divisions that produce four haploid (n) daughter cells containing unique genetic material that is different to the parent cells. Mitosis involves one division that produces two diploid (2n) daughter cells with genetic material identical to the parent cell.


Parent cell (2n) (before chromosome replication) Meiosis I


The number of chromosomes varies between species, but the chromosomes in each body cell are always present in pairs. For example, humans have a total of 46 chromosomes, or 23 pairs of chromosomes in the nucleus of every body cell. However, within the gametes, there are only 23 chromosomes in total. We can take a photo of a cell when it has undergone DNA replication and clearly see the chromosomes.
Homologous chromosomes are present in body cells because we receive one from each parent. Homologous chromosomes have the same length, centromere position and gene locations, and are paired together when displayed in a karyotype (Figure 2.24). Chromosomes that do not match (chromosomes from different pairs) are called non-homologous chromosomes
Autosomes
Of the 23 pairs of chromosomes in humans, pairs 1 to 22 are known as autosomes. These 44 chromosomes are found in both males and females.
karyotype the chromosomes of an individual, often displayed according to size and gene locations non-homologous chromosomes chromosomes that do not belong to the same pair autosome any chromosome that is not a sex chromosome. In humans, these are chromosome pairs 1 to 22
sex chromosomes chromosomes that determine the sex of an organism
In humans, the chromosomes making up the 23rd pair are the sex chromosomes. They contain genes that determine the sex of the individual. Females receive two X chromosomes (one from each parent), whereas males receive an X chromosome from the mother and a Y chromosome from the father (Figure 2.25).


Figure 2.25 If an egg is fertilised by a sperm carrying an X chromosome, the child will be female. If an egg is fertilised by a sperm carrying a Y chromosome, the child will be male. Therefore, it is the male's sperm that determines the sex of the child.
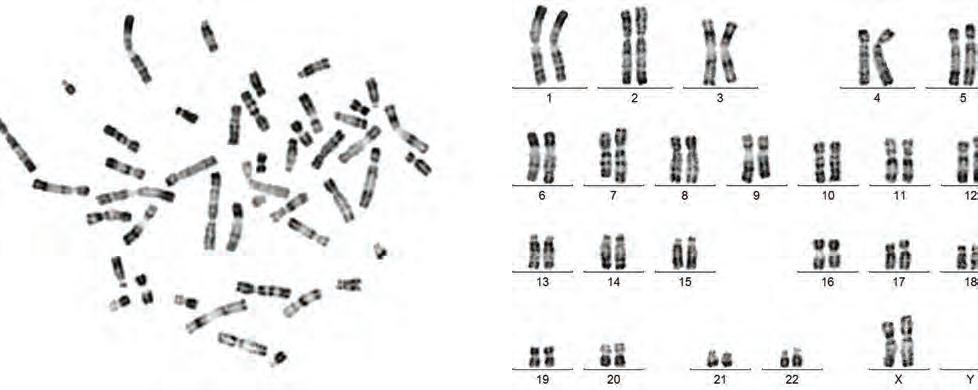
Figure 2.26 The chromosomes seen under a microscope (a) can be arranged according to size in a karyotype (b). Pairs 1–22 are autosomes while pair 23 is the sex chromosomes. The two X chromosomes indicate that this is a female karyotype.
Aim
To investigate the chances of conceiving a male or female at fertilisation
Useful formulas
Theoretical probability (%) = number of a particular outcome (e.g. heads) total number of all possible outcomes (e.g. heads and tails) × 100
Experimental probability (%) = number of a particular outcome (e.g. heads) total number of all experimental trials (e.g. heads and tails) × 100
Percentage error (%) = (experimental probability − theoretical probability) theoretical probability × 100
Materials
• one coin
Method
1. Copy the results table into your science book.
2. Calculate the theoretical probability of landing heads during a toss.
3. Now calculate the experimental probability of your own experiment by tossing the coin 50 times, recording the number of heads and tails in the table.
Results
1. Calculate the experimental probability of receiving a head and a tail based on both the experimental data for your own and the class results.
2. Calculate the percentage error, comparing the difference between the theoretical and experimental probabilities for both your own data and the class data.
3. Optional: Graph the relationships between the number of trials and percentage error.
Table showing results for coin toss experiment
Individual results
Class results
Number of heads
Number of tails
Total number of trials (throws)
Experimental probability
Percentage error
Discussion: Analysis
1. Compare the experimental probabilities of your own and the class results.
2. If a head represents the Y chromosome and a tail represents the X chromosome, explain how accurately this models the process of fertilisation. What would the coin represent?
Discussion: Evaluation
1. Discuss whether increasing the number of trials affects the percentage error of the experiment.
Conclusion
1. Make a claim about the chances of conceiving a male or female at fertilisation.
2. Support your statement using the data you gathered, and include potential sources of error.
3. Explain how the data support your statement.
Did you know? 2.4
In some animals, such as birds, females have two different sex chromosomes (ZW) while males have two of the same (ZZ). In some reptiles, the temperature of the incubating environment determines the sex of the embryo. In some insects, females are XX and males have one X chromosome (written XO).
Monotremes have a complex sex chromosome system. Female platypuses have five pairs of X chromosomes and males five X and five Y chromosomes. Female echidnas have five pairs of X chromosomes and males five X and four Y chromosomes.
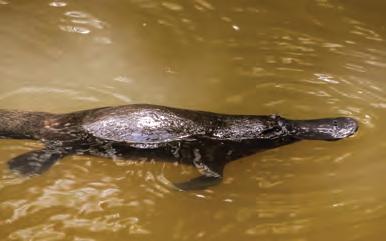
Try this 2.3
Can you sort chromosomes into a karyotype?
Go online and find a karyotype activity. There are many interactives that allow you to sort chromosomes into order and ones that allow you to analyse karyotypes.
When a person is pregnant, their doctor may conduct several tests to screen for genetic and chromosomal abnormalities in the foetus. Creating a karyotype lets the doctor check for abnormalities in the number or length of chromosomes. If anything appears abnormal, the doctor can undertake further genetic tests to check for specific disorders. One such test is chromosomal microarray (CMA) testing, which is much more detailed genetic testing than karyotyping. Chromosomal microarray testing detects around one abnormality in every 70 foetal samples with a normal karyotype. Scientists think that CMA testing will replace karyotyping for prenatal testing.
Genetic testing identifies carriers of genetic mutations and helps people make informed decisions, such as in embryo selection. Genetic counsellors work with people who are concerned about having, or have been diagnosed with, a genetic condition.
Many people are also having genetic testing to discover more information about their ancestry or to connect with unknown relatives. Although it is against the law to be discriminated against because of genetic information, there is some concern regarding its use, either personally or by organisations such as insurance companies or medical facilities.
Have a class discussion regarding the ethical issues of non-therapeutic genetic testing performed by commercial companies. You may want to consider privacy concerns, the possible emotional impact, potential lack of medical knowledge and possible exploitation of vulnerable individuals.
The karyotype shows a female with Down syndrome. Note the three chromosomes in position 21.
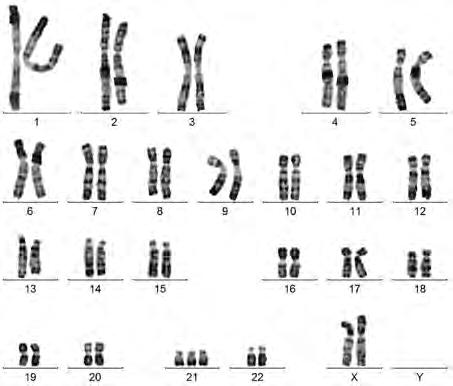
1. Compare mitosis and meiosis using a Venn diagram.
2. Explain what karyotypes can show and why this is useful.
Section 2.2 questions
Remembering
1. State one key difference between mitosis and meiosis.
2. Recall the phase of meiosis when pairs of matching chromosomes separate.
3. State the name of the syndrome that arises from trisomy 21.
4. State what the term 'homologous chromosomes' means.
Understanding
5. Explain why gametes need to be haploid.
6. Explain what is meant by the term 'reduction division'.
7. Explain why a chromosome missing a part may lead to a disorder or syndrome.
8. Explain why the cells produced during meiosis are genetically unique.
Applying
9. Complete the following table to differentiate between mitosis and meiosis.
Type of cell division
Mitosis
Meiosis
10. Illustrate a diagram to represent the steps of mitosis for a cell with two pairs of chromosomes. Be sure to use a different colour for each pair of chromosomes.
Analysing
11. Contrast the daughter cells produced in mitosis versus meiosis.
12. Contrast anaphase I in meiosis and anaphase in mitosis.
13. Contrast prophase I and prophase II in meiosis.
Evaluating
14. Evaluate the following claim: It is the male that determines the sex of the child.
15. Predict the chances of a woman giving birth to a girl if she has already given birth to three boys, giving reasons for your response.
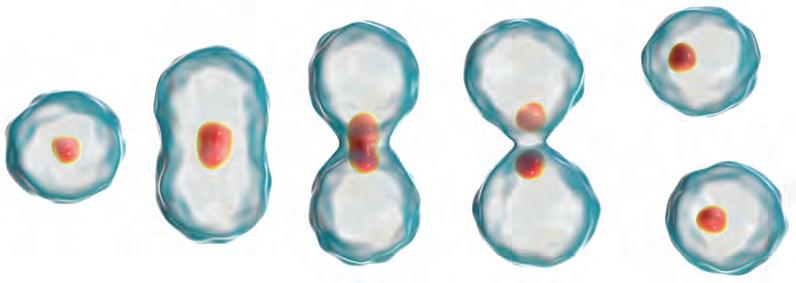
At the end of this section, I will be able to:
1. Define the terms 'homozygous', 'heterozygous', 'dominant' and 'recessive' with respect to genetic inheritance.
2. Use and interpret Punnett squares to identify possible genotypes and phenotypes of offspring.
3. Use pedigree diagrams to determine the type of inheritance that is occurring.
4. Explain codominance, incomplete dominance and sex linkage.
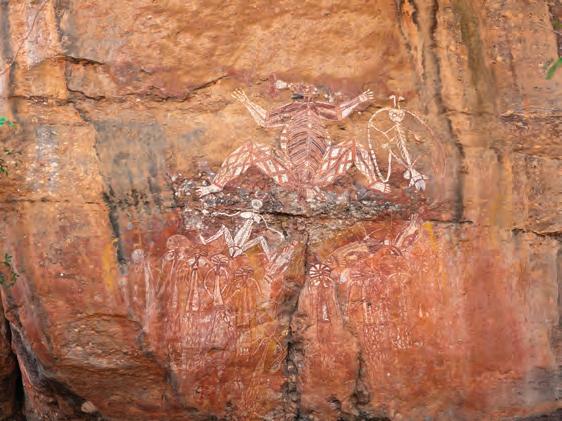
locus (plural: loci)
the location of a gene on a chromosome
genotype the combination of alleles an organism has for a particular gene
homozygous having two identical alleles at a particular gene locus
heterozygous having two different alleles at a particular gene locus
Aboriginal and Torres Strait Islander communities have understood inheritance patterns for a long time. They recognise how traits can be passed down to the next generation and how negative traits and illnesses often appear in the children of closely related parents. Because of this deep knowledge, communities created complex and sophisticated kinship systems that allow individuals to understand who they are and how they fit into the social structure and even the universe. These kinship systems are strictly adhered to and dictate who can or cannot marry through marriage laws. Kinship and family structures also determine how individuals behave towards others and the responsibilities each person has towards others, natural resources and the land. For example, a person may be obliged to care for their sibling's offspring. These children usually address their aunt or uncle as 'mother' or 'father' and their cousins as 'brothers' or 'sisters'. Although they are aware of their biological parents, the societal (kinship) laws assign equal importance to other relatives. When conversing with one another, Aboriginal and Torres Strait Islander people usually speak Aboriginal English and frequently use the terms 'brother' or 'sister', which are derived from the kinship terminology and connections.
Each characteristic or trait that we inherit is controlled by one or more pairs of genes. Members of each gene pair are found at the same location on their respective homologous chromosomes. This is called the locus of a gene.
Genes are sections of DNA that code for a particular protein that contributes to our characteristics, such as a gene for eye colour. However, not all forms of a gene are the same; for example, different people can have different eye colours. We use the term 'allele' to describe the different forms of a gene. We get one copy of each chromosome from each parent, so although we inherit two copies of each gene, we don't necessarily inherit two of the same allele. The combination of alleles an organism has for a particular gene is known as the organism's genotype. If two identical alleles are present in a person's genotype, they are known as homozygous for that particular trait. However, if there are two different alleles present for the same trait, then the person is heterozygous for that trait.
For example, consider the trait of freckles. This trait is controlled by a single gene that is represented using two alleles. The allele of the dominant trait is the presence of freckles (we assign it the capital letter 'F' to show it represents the dominant trait), and the allele for the recessive trait is the lack of freckles (assigned a lower case 'f' to show it represents the recessive trait). A trait or characteristic is described as dominant if you need only one allele for it to be expressed (FF or Ff). For a recessive characteristic, the allele needs to be inherited from both parents for it to be expressed (ff). If you inherit the freckles allele from both parents, you are homozygous dominant for that trait and your genotype will be FF. If you inherit the no-freckles allele from both parents, you are homozygous recessive for that trait and your genotype will be ff. If you inherit a freckles allele from one parent and a no-freckles allele from the other parent, you are heterozygous for that trait and your genotype will be Ff.
The genome refers to all the genetic material in the chromosomes of an organism, including its genes and DNA sequences. The human genome is made of approximately 3.2 billion nitrogenous base pairs, with around 1% of these making up the 20 000 genes that code for proteins. The other 99% of bases is non-coding DNA, which plays important roles in turning genes on and off. Other organisms have different genome sizes.

was printed as 109 books in 23 volumes. The approximately three billion units of human DNA code are printed in a small font, and each book is a thousand pages long.
The interaction of an organism's genotype with the environment results in its phenotype, or its physical appearance. In the example in Figure 2.31, the presence of freckles is the person's phenotype for that trait. The freckles are present due to the person's genotype and their environmental exposure to UV light.
dominant a characteristic in which the allele responsible is expressed in the phenotype, even in those with heterozygous genotypes recessive a characteristic in which the allele responsible is only expressed in the phenotype if there are two copies of the same allele present genome the complete set of genetic material in an organism
phenotype the observable characteristics of an organism, resulting from both genotype and the environment carrier an individual with an allele for a recessive trait but who does not have the trait due to being heterozygous
To determine whether an allele represents a trait that is dominant or recessive, scientists look at the phenotype of a heterozygous organism. If the trait is expressed in this phenotype, it must be the dominant trait. A heterozygous individual can also be called a carrier because they carry the allele for the recessive trait, but they don't express it in their phenotype.

Quick check 2.11
1. Copy the table below and define the terms.
Term
Locus
Allele
Genotype
Phenotype
Dominant
Recessive
Heterozygous
Homozygous dominant
Homozygous recessive
Definition
2. Explain why a genotype can indicate that a person will have freckles, but there are not many on their face.
Inherited features
Aim
To use data to determine how common some key characteristics are in the class
Materials
• mirror
Optional extension: Collect information from other students or family members for further validity analysis.
Method
Part 1: Prepare the results table
1. Copy the results table into your science book.
Part 2: Collect data on the variables
2. Identify whether you possess each of the inheritable features described below.
3. Record your results in the table.
4. Find out how many members of your class share the same features. Record your results in the table.
Optional: Find out how many members of your family display the traits.
a) Attached ear lobes: Are your earlobes attached or unattached to the side of your head?
b) Widow's peak: Do you have a V-shaped peak in the centre of your hairline as shown in Figure 2.32?
c) Tongue roll: Can you roll your tongue as shown in Figure 2.33?
d) Front tooth gap: Is there a definite gap between your two top front teeth as shown in Figure 2.34?
e) Mid-digital hair: Is there any hair on the second joint of at least one of your fingers?
f) Long second toe: Is your second toe longer than your big toe as shown in Figure 2.35?


1. Calculate the total number of people sampled in this survey.
2. Calculate the percentage presence of the trait in your family and within the class.
3. Draw an appropriate graph (or graphs) to compare the percentage presence of each trait within your family with the percentage presence in the whole class.
Table showing physical features and their occurrence in your family and the class Feature Trait present in you (Y/N)
Attached ear lobes
Widow's peak
Tongue roll
Front tooth gap
Mid-digital hair
Long second toe
Sample size (Total number of people surveyed) 1
Discussion: Analysis
1. Describe which traits were commonly found in your family.
2. Describe which traits were commonly found in the class.
3. Describe which traits were commonly found in the whole sample.
4. Do your findings support the idea that a feature such as tongue-rolling is inherited? Explain your answer.
Discussion: Evaluation
1. Can the data gathered in class be reliably applied to the wider population? Justify your response.
2. Can you draw valid conclusions as to which traits are dominant and recessive from this data? Justify your response.
3. Sample size is a factor that commonly affects data in small surveys. Discuss how this relates to the activity.
4. Can you identify possible limitations of this method? Justify your answer.
5. Suggest any changes that could be made to the method to improve the quality of the data in future surveys. Justify your suggestions by explaining how each change will improve the data quality.
Conclusion
1. Make a claim about the frequency of the investigated characteristics in the class.
2. Support your statement using your and the class observations, and include potential sources of error.
3. Explain how the data support your statement.
Gregor Mendel
Gregor Mendel is known as the father of genetics. Born in 1822, he was an Austrian monk who carried out experiments in his garden using pea plants and discovered some of the fundamental laws of heredity we still rely on today.
Mendel looked at the features of pea plants, which could be tall or short (dwarf). He assigned the following letters to represent these alternative characteristics (known today as alleles): T = tall and t = dwarf. Mendel bred the plants and observed the height of the plants in the next generation. He discovered that tall pea plants could be either pure-breeding (TT or homozygous dominant) or hybrid (Tt or heterozygous). The dwarf plants could only be tt (homozygous recessive). Today, we call this the plant's genotype.


• P = parent generation


Mendel also used the following notation to represent different levels of generations:
• F1 = first filial generation (first generation of offspring)
• F2 = second filial generation (second generation of offspring).
Mendel performed many experiments investigating the inheritance patterns of different traits in pea plants. For example, he observed that when a pure-breeding tall plant was crossed with a pure-breeding dwarf plant, all of the offspring in the F1 generation were tall (see Worked example 2.1). He determined that the tall trait was dominant over the dwarf trait. When he crossed the tall offspring together, he observed that the dwarf trait reappeared in the F2 generation. Mendel performed these crosses many times and observed a specific


ratio of three tall plants to one dwarf plant in the F2 offspring (see Worked example 2.2). Mendel produced large amounts of data that all supported his theories, but later statistical analysis suggests that he may have falsified his data – it was simply too good to be true! Large datasets and statistical analyses are vital for validating scientific findings.
An easy way to predict the outcome of crossbreeding plants with certain traits is to use a Punnett square, a specialised grid invented by Reginald Punnett. A Punnett square is a visual representation of a monohybrid cross, which is a breeding experiment involving two individuals that differ in a trait of interest. In a monohybrid cross, the parents are typically represented by letters to denote their respective alleles for the trait being studied.
To use a Punnett square (see Worked examples 2.1 and 2.2), you need to know the genotype of the parents to work out what genetic information they could pass on to their offspring via the gametes. For example, we know a heterozygous, tall pea plant has the genotype Tt. This means that when the plant makes its gametes, they could contain either a T or a t, as gametes only carry one of the alleles from the parent. In contrast, a homozygous tall pea plant has the genotype TT, so its gametes will all contain a T.
Worked example 2.1
Cross between a pure-breeding tall plant and a pure-breeding dwarf plant
Parents: TT × tt
You will notice that all the predicted F1 offspring (shaded) have the genotype Tt. We can write this as:
F1 genotype: 100% Tt
We can also see that offspring with Tt would all physically appear tall, as T stands for the tall allele. The tall trait is dominant over the dwarf trait, which is encoded for by the t allele. So, we can write this as:
F1 phenotype: 100% tall plants
Worked example 2.2
Cross between two of the hybrid F1 plants from Worked example 2.1
F1: Tt × Tt
F2 genotype: 25% TT; 50% Tt; 25% tt
F2 phenotype: 75% tall plants; 25% dwarf plants
We can also write the predicted outcomes as ratios. In this case, when two heterozygous tall pea plants were crossed, there was a genotypic ratio of 1TT : 2Tt : 1tt and a phenotypic ratio of 3 tall : 1 dwarf.
a
cross or
experiment that considers the inheritance of a
or characteristic, typically controlled by a
Huntington's disease
Huntington's disease is inherited as a dominant trait on an autosome. It usually appears in an affected person as neurological symptoms that develop around 30–50 years of age. These symptoms result from an abnormal protein being made.
If we let H = abnormal Huntington's protein allele (Huntington's disease) and h = normal protein allele (unaffected), then we can use these notations to help work out probable outcomes in the offspring (see Worked examples 2.3 and 2.4).
Worked example 2.3
Cross between two individuals unaffected by Huntington's disease
Parents: hh × hh
F1 genotype: 100% hh
F1 phenotype: 100% unaffected
Worked example 2.4
Cross between an individual with Huntington's disease and an unaffected individual
Parents: Hh × hh (Having two H alleles is extremely rare, so we will assume the individual with Huntington's disease is Hh).
Gametes
F1 genotype: 50% Hh; 50% hh
F1 phenotype: 50% with Huntington's disease; 50% unaffected
Try this 2.4
Punnett squares
1. A black mouse mates with a brown mouse. There is a large number of offspring and all of them are black.
a) Which trait is dominant?
b) Draw a Punnett square and determine the genotypes of the offspring. Hint: When assigning letters to alleles, avoid letters where the capital and lower case look similar, for example, Cc, Ss, Oo.
2. A recessive gene causes a condition called cystic fibrosis. If a homozygous recessive individual has a child with a heterozygous individual, what are their chances of producing offspring with cystic fibrosis?
1. Contrast genotype and phenotype.
2. Brown eyes are dominant over blue eyes.
a) Select letters for the brown eye and blue eye alleles.
b) Create a Punnett square for a couple who are both heterozygous.
c) State the genotypic and phenotypic ratios of the offspring.
d) State the chances of this couple producing a blue-eyed child.
Recall that an organism showing a dominant trait can either be homozygous dominant or heterozygous. A test cross can be used to determine their genotype. It involves observing the offspring of the individual in question when it mates with a homozygous recessive individual (for example, aa). This means the individual of unknown genotype mates with an individual of known genotype. By looking at the offspring ratio, we can deduce the unknown genotype of the individual in question.
For example, in mice, coat colour may be black (B) or white (b). You can find out if a black mouse is homozygous black (BB) or heterozygous black (Bb) by doing a test cross between the black mouse and a white mouse (bb).
If the unknown black mouse is BB, the cross would look like this:
Parents: BB × bb
F1 genotype: 100% Bb
F1 phenotype: 100% black
This means if all the offspring are black, the unknown black mouse is probably BB (homozygous dominant).
If the unknown black mouse is Bb, the cross would look like this:
Parents: Bb × bb
F1 genotype: 50% Bb; 50% bb
F1 phenotype: 50% black; 50% white
This means if roughly half the offspring are black and half are white, the unknown black mouse is probably Bb (heterozygous). Note that these expectations are only true when based on large numbers of offspring because they are probabilities. However, if even one white offspring is born, the black mouse must be heterozygous in order to have passed on a b allele.
1. Explain the importance of a test cross.
2. In a bird species, normal feathers are a dominant trait, and silky feathers are a recessive trait. Both traits are coded for by alleles of the same gene. If you had a normal-feathered bird, describe a way to determine whether it is heterozygous or homozygous. Use Punnett squares to help with your answer.
One vital gene located on chromosome 1 in humans is the gene controlling for Rhesus (Rh) blood type. Rh-positive blood is dominant over Rh-negative blood, so we can assign the alleles D (Rh-positive) and d (Rh-negative). Therefore, a Rh-positive person can be either DD or Dd with respect to this gene, but a Rh-negative blood type can only be homozygous, dd.
Instructions
In this activity, we will use coloured counters and felt-tipped pens to model the passing of Rh alleles from heterozygous individuals to their offspring.
1. Copy the results table into your science book.
2. Choose one coloured counter. Print D on one side and d on the other to represent the alleles of the chromosomes. This counter represents an individual who is Dd for Rh blood type, that is, able to produce gametes (eggs or sperm) of the type D and d in equal proportions.
3. Find a partner in the room with a different coloured counter.
4. Make an unbiased toss of your two counters to produce an offspring. The labels facing up on the counters will represent the alleles of the gametes produced by the parents. Record the genotype of the offspring in the Family 1 row of the following table. Repeat this step three more times to produce a total of four children.
5. Generate a total of four families (by pairing up with three different students) with each having produced four children.
6. Record the number of each type of genotype found in the children of each family in the table. Pool your total results with those of the class.
Results
Table showing genotypes of offspring in each family
Genotype of children
Family 1
Family 2
Family 3
Family 4
Total numbers across the class
Discussion: Analysis
1. Using the class data, calculate the probability of obtaining the offspring genotypes:
2. What are the proportions of the different genotypes in your group of 16 children compared to those generated across the whole class? Discuss whether this is expected.
3. A woman with Rh-positive blood insisted that she was the daughter of a rich, elderly couple who both had Rh-negative blood. Use a Punnett square to show your working out to explain whether this woman's statement could be valid.
As we have seen, in humans the sex chromosomes are the 23rd pair. Human females have two X chromosomes while males have an X and a Y.
The X chromosome also contains many genes not related to sex determination (in contrast, the Y chromosome has very few). Characteristics that are coded for by X chromosome genes are termed X-linked. When we predict X-linked traits using a Punnett square, we must use the sex chromosomes and superscripted letters above the X chromosomes to represent the trait.
For example, Duchenne muscular dystrophy (DMD), a disorder in which the muscles progressively degenerate, is inherited as an X-linked recessive trait. The genotype for an unaffected female would be XDXD, a carrier female (who has an allele for the disease but is heterozygous so does not have the disease) would be XDXd, and a female with DMD would be XdXd. On the other hand, an unaffected male would be XDY and a male with DMD would be XdY. As there is no gene for this condition found on the Y chromosome, we do not write D or d next to the Y. Because males have only a single copy of the X chromosome, they are more likely to be affected by sex-linked recessive disorders. A single allele of a mutated gene on an X chromosome will cause the disease in a male but would result in a female carrier (who would need two DMD alleles to be affected).
Worked example 2.5
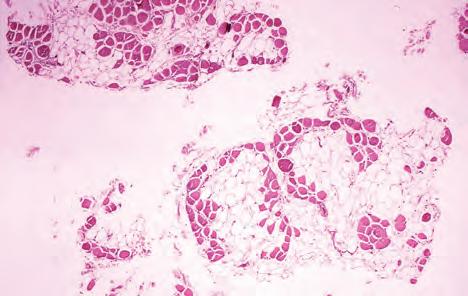
Cross between a heterozygous normal-vision female (carrier) and a normalvision male
Colour blindness is inherited as an X-linked recessive trait. The genotype of a heterozygous normal-vision (carrier) female is XBXb, and the genotype of a normal-vision male is XBY.
Parents: XBXb × XBY
F1 genotype: 25% XBXb; 25% XBY; 25% XBXB; 25% XbY
F1 phenotype: 25% normal-vision male; 50% normal-vision female; 25% colour-blind male
Try this 2.6
Sex-linked inheritance
Now it is your turn to practise. Remember that the gametes need to include the sex chromosomes, and the genotype and phenotype both need to include the sex chromosomes as well.
1. Using a Punnett square, cross a normal-vision female (homozygote) with a colour-blind male.
2. Using a Punnett square, cross a colour-blind female with a normal-vision male.
3. Explain why more males than females have colour blindness.
'Codominance occurs when two alleles are expressed equally in the phenotype of a heterozygote. They will both be expressed in the phenotype of a heterozygote. This is codominance. Look at the picture of the chickens in Figure 2.39. The colours black and white are equally dominant (their alleles are given two different capital letters), so when you cross a pure black chicken with a pure white chicken, you get a heterozygote. In the heterozygote, both colours are expressed equally, so you get a speckled chicken with black feathers and white feathers.


Figure 2.39 White feathers and black feathers are codominant traits. The evidence for this is the heterozygote offspring of the white and black chickens above, which has a mix of black and white feathers. Notice that there are two different letters representing each allele, rather than upper and lower case of the same letter, as is used for complete dominance.
In humans, our blood type is a codominant trait. Our red blood cells have proteins on the surface called antigens, and these determine whether our blood is A, B, AB or O. Type O blood is the absence of antigens (Figure 2.40).
Each person has two copies of the ABO blood type gene, one from their mother and one from their father. The blood type gene is found on chromosome 9 (denoted by the letter I), and there are three possible alleles (denoted by the letters A, B and O):
• IA = production of antigen A (type A blood) is dominant.
• IB = production of antigen B (type B blood) is dominant.
• i = production of neither antigen (type O blood) is recessive.
As we have two copies of chromosome 9, there can be six different allele combinations:
• Type A blood can have genotypes IAIA or IAi.
• Type B blood can have genotypes IBIB or IBi.
• Type AB blood can only have the genotype IAIB
• Type O blood can only have the genotype ii.
Blood types A and B are dominant over type O, but they are codominant to each other.
Worked example 2.6
Cross between heterozygous blood type A and heterozygous blood type B
Parents: IAi × IBi
F1 genotype: 25% IA IB; 25% IB i; 25% IA i; 25% ii
F1 phenotype: 25% AB blood type; 25% B blood type; 25% A blood type; 25% O blood type
type A
type B
type AB
type O
blood cells


Figure 2.40 Illustration of the different antigens on the surface of red blood cells
Incomplete dominance


Incomplete dominance occurs when neither of the traits is dominant over the other, resulting in a third phenotype that is an intermediate form of both. Wavy hair is an example of incomplete dominance. A person with two curly hair alleles will have curly hair. A person with two straight hair alleles will have straight hair. However, a person with one curly and one straight allele will have wavy hair.
1. The flower colour of snapdragons is an example of incomplete dominance. Draw an example of a cross for a white flower (CWCW) and a red flower (CRCR).
2. Eggplant colour is another example of incomplete dominance. Explain how the three colours of eggplant shown in Figure 2.42 are possible.

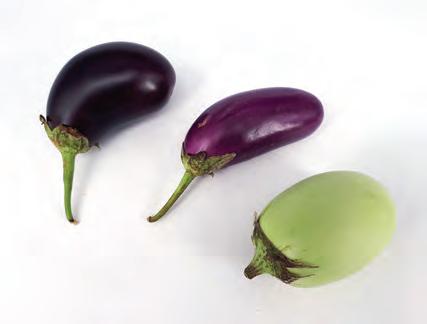
incomplete dominance a form of inheritance in which both alleles are partially expressed, producing a third intermediate phenotype
WORKSHEET
pedigree a chart that shows relationships between family members and indicates which individuals have certain genetic traits
Quick check 2.14
1. Explain why males are more likely to be affected by recessive X-linked disorders than females. 2. Describe codominance.
One way of finding out how a trait is inherited is to follow the inheritance pattern over two or more generations. This technique is called pedigree analysis. To study patterns of inheritance in humans, geneticists investigate the frequency and occurrence of a particular gene over many generations to determine whether the traits are dominant or recessive. The chart formed is called a pedigree and is like a family tree.
Each generation is numbered in Roman numerals and forms a row on the pedigree. Individuals are numbered using Arabic numerals (1, 2, 3 etc.) from left to right on each row. The symbols used are:
• unaffected female
• unaffected male
• female with the trait being investigated
• male with the trait being investigated
• carrier of trait or
• Mating is represented by a horizontal line.
• A vertical line connects offspring to parents.
Figure 2.43 An example of a pedigree showing three generations of a family. Individuals affected by a particular trait are shown in black. Note how male I-1 and female I-2 had three children, and their eldest is an unaffected female (II-2).
There are some points to keep in mind when reading a pedigree and determining inheritance:
• A trait that is common in a population is not necessarily dominant.
• When asked to determine a genotype in a pedigree, you will need to establish the mode of inheritance. You can use Punnett squares to help you.
Mode of inheritance
Autosomal recessive
Autosomal dominant
X-linked recessive
X-linked dominant
Pedigree chart
What to look for
Two unaffected parents can have an affected child.
Males and females are equally affected. The trait may disappear from a branch of the pedigree and then reappear in later generations.
Affected parents produce children that are all affected.
Two affected parents can have an unaffected child.
Males and females can be equally affected, yet all of the affected individuals must have at least one parent affected.
Affected mothers produce affected sons. Affected fathers cannot pass the trait to their sons.
Examples
Albinism, cystic fibrosis, sickle cell anaemia and thalassaemia
Affected fathers produce daughters that are all affected.
Affected fathers cannot pass the trait to their sons, but affected homozygous females will pass the trait on to all of their daughters and sons.
Huntington's disease and haemochromatosis
Did you know? 2.6
Famous people have genetic disorders too!
Megan Fox has a condition called brachydactyly. This is an autosomal dominant condition that causes shortened fingers or toes. Jessie J has Wolff–Parkinson–White Syndrome, an autosomal dominant condition that causes a very fast heart rate.


Colour blindness, haemophilia and Duchenne muscular dystrophy
X-linked hypophosphatemic rickets
Social media is a primary source of health and science information for many young Australians. Raising awareness about scientific discoveries and breakthroughs in medical research is important. However, media stories sometimes leave out important facts or exaggerate the findings of a study. This can lead to the spread of misinformation, which can have dangerous consequences for the health of individuals. In one study, researchers found that 40% of posts on TikTok about liver disease contained misinformation to sell detox drinks and herbal remedies.
Consider the headline below:
Ask yourself:
What do you perceive is being conveyed by this?
Who would decide to convey this message? Why?
How else could this be interpreted?
What do you believe is true in this? What makes you think that?
The Facts or fiction thinking routine was developed by Project Zero, a research centre at the Harvard Graduate School of Education.
1. Study the pedigree chart in Figure 2.45. It illustrates the inheritance of achondroplasia (dwarfism) in humans.
a) Identify a piece of evidence that suggests that this condition is recessive and not dominant.
b) Identify the genotype of individuals I-1, I-2, II-1 and II-2.
2.45 Pedigree chart
c) Suppose individual II-2 has children with a man who does not have achondroplasia but is a carrier for the condition. Determine the chance of having a child with achondroplasia and the chance of having a child without achondroplasia. Use a Punnett square to show how you arrived at your answer.
2.3 review
Section 2.3 questions
Remembering
1. State how many copies of each gene we have and where they come from.
2. Recall the name of the person known for being the father of genetics.
3. Name an example of codominance and of incomplete dominance.
Understanding
4. Describe what pedigrees are useful for.
5. Explain how sex linkage is different from other types of inheritance.
6. Explain why, for a particular characteristic, two homozygous recessive individuals can only produce homozygous recessive children.
7. Explain what is meant by the term 'carrier'.
8. Explain why a test cross is useful.
Applying
9. Dimples are dominant over no dimples.
a) Select appropriate letters for these alleles.
b) Identify the genotype and phenotype of a person who is:
i) homozygous recessive for dimples
ii) heterozygous for dimples
iii) homozygous dominant for dimples.
10. In fruit flies, eye colour is determined by an autosomal gene. Red eyes are dominant whereas white eyes are recessive.
a) Select appropriate letters for the alleles of these traits.
b) Using a Punnett square, determine the offspring produced by a male heterozygous fly that mates with a female homozygous recessive fly.
c) Decide the genotypic and phenotypic ratios of the offspring.
11. In mice, black fur is dominant over brown fur. Mice with black fur can be either homozygous or heterozygous.
Propose how you would find out if a mouse with black fur was homozygous or heterozygous. Support your response with a Punnett square.
Analysing
12. The pedigree chart in Figure 2.46 shows the inheritance pattern of a disease that is caused by a single gene.
a) Identify the sex of the person labelled II-5.
b) State whether the disease is dominant or recessive, giving reasons for your answer.
c) State the genotype of individual II-5, giving reasons for your response.
13. Contrast codominance and incomplete dominance.
Evaluating
14. The pedigree chart in Figure 2.47 shows the inheritance patterns for haemophilia. Haemophilia is an X-linked recessive disorder.
Use evidence from the pedigree to justify that haemophilia is recessive.
15. A brown-eyed male and a blue-eyed female produced all blue-eyed children. Discuss whether that means blue eyes is the dominant trait.
point mutation
a mutation in which a single nucleotide is changed chromosome mutation a mutation involving large segments of DNA spontaneous mutation a naturally occurring mutation induced mutation a mutation produced by environmental factors mutagenic causing mutations in DNA germline mutation a mutation of DNA in gametes, which can be inherited somatic mutation a mutation that occurs in somatic (body) cells, which cannot be inherited
At the end of this section, I will be able to:
1. Distinguish between germline and somatic mutations.
2. Recall types of point and chromosome mutations.
3. Explore the applications of DNA manipulation.
Sometimes, the process of DNA replication makes errors, which cause changes to the genetic code. Often these errors are repaired, but when they are not, they become permanent changes in the genome of the cell. This is known as a mutation. Mutations may be small, such as a change in a single nucleotide (point mutation), or large, involving entire segments of DNA within a chromosome (chromosome mutation). Mutations are the only way that new alleles can be created within a population.
A mutation can be described as spontaneous (naturally occurring) or induced. Induced mutations are caused by exposure to mutagenic agents in the environment like radiation (X-rays, ultraviolet rays or nuclear radiation) or chemicals. Mutations that occur within the gametes are called germline mutations. These can be inherited and will influence the next generation. Mutations that occur within somatic cells will only affect the individual and will not be passed down to future generations. This form of mutation is known as a somatic mutation.
Mutagens and carcinogens
Many factors in the environment are known as 'mutagens' – that is, they cause mutations. Many cancers form as a result of changes to DNA, so a lot of known mutagens are also carcinogens – agents that increase a person's risk of cancer.
1. Research some environmental mutagens.
2. From the list created in Question 1, divide your mutagens into categories according to their source, such as chemical mutagens and radiation.
3. From the list created in Question 1, research which of the mutagens are also carcinogens.
4. Research examples of carcinogens that are not mutagens.
Figure 2.48 Melanoma is linked to UV light exposure as well as gene changes. A mole may be a sign of skin cancer if it has irregular borders, an asymmetrical shape or if it changes in colour, shape, size or height.
Mutations have three possible consequences:
• No effect – neutral. Neutral mutations are non-lethal and make no difference to the organism's ability to survive and reproduce in its environment.
• Negative effect – harmful. Harmful mutations produce proteins that malfunction or cause proteins not to be produced at all. They can cause genetic disorders or cancer and result in organisms that are less likely to survive, reducing the likelihood that the genetic material will be passed on to the next generation.
• Positive effect – beneficial. Beneficial or advantageous mutations give rise to new versions of proteins that increase the chance that the organism will survive and reproduce to pass its genetic material to the next generation. Beneficial mutations increase genetic variation in a population and are essential for evolution to occur.
Did you know? 2.7
Many individuals with European ancestry carry genetic mutations that protected their ancestors from the bubonic plague, a disease caused by Yersinia pestis, a species of bacterium spread by fleas. When plague struck Europe in 1348 and again in 1665, millions of people died. However, some people had mutations that made them more likely to survive.
By examining the DNA of people who died before, during and after the Black Death, researchers have found that carrying two copies of a mutated ERAP2 gene improved a person's survival by 40%. The allele codes for a protein that is involved in the immune response, and the mutation produced a heightened response. This meant that the survivors of bubonic plague passed on this beneficial trait to their offspring. However, this mutation is also problematic. Individuals who carry the mutated ERAP2 gene are at an increased risk of autoimmune diseases.
1. If a mutation is to be passed on to the next generation, recall where it must occur.
2. Summarise the possible effects of mutations that occur in somatic cells.
Gene mutations refer to changes in the DNA sequence that makes up a gene. This involves changes to any of the four nitrogenous bases in the nucleotides that make up the genes.
There are several types of gene mutations, including point mutations, insertions, deletions and inversions.
Changing the nucleotides could change the message carried by the gene, which may change the order of amino acids making up the protein.
• A point mutation is the most common type of gene mutation and involves the substitution of one nucleotide for another (for example, ATG becomes ACG). This mutation only changes the DNA code for a single amino acid. If the new sequence codes for the same amino acid, it is called a silent mutation. An example of a disease caused by a substitution mutation is sickle cell anaemia.
gene mutation a permanent alteration in the DNA sequence that makes up a gene substitution when one nucleotide is swapped for another
insertion when one or more extra nucleotides are inserted into the DNA deletion when a nucleotide is deleted from the DNA sequence inversion when two nucleotides reverse their order
• An insertion mutation occurs when an extra nucleotide (or more than one) is inserted into the DNA sequence (for example, ATG becomes ATCG). This type of mutation changes the DNA code for all amino acids that follow and is called a frameshift mutation. An example of a disease caused by an insertion mutation is fragile X syndrome.
• A deletion mutation occurs when a nucleotide is deleted from the DNA sequence (for example, ATG becomes AG). This type of mutation changes the DNA code for all amino acids that follow and is also a frameshift mutation. An example of a disease caused by a deletion mutation is Duchenne muscular dystrophy.
• An inversion mutation occurs when two nucleotides reverse their order in the DNA (for example, ATG becomes AGT). This mutation only changes the DNA code for a single amino acid, and it could code for the same amino acid (silent mutation). An example of a disease caused by an inversion mutation is haemophilia.
Try this 2.7
Remembering mutations
Find a way to remember the different types of mutations using normal words.
For example:
• normal code – WING
• deletion – WIG
• substitution – WIND
• insertion – WRING.
Chromosome mutations
If a mutation occurs in a gene on one of the chromosomes in a homologous pair, there will still be a normal copy of the gene on the other chromosome. The same applies with chromosome mutations. As chromosomes occur as homologous pairs, if one chromosome is abnormal, the other is still likely to be normal. The different types of chromosome mutations are illustrated in Figure 2.50.
Figure 2.50 The five different types of chromosome mutations. Can you identify what is changing in each type?
Sickle cell anaemia is a disease caused by a mutation in a gene that codes for a subunit of haemoglobin, a protein found in red blood cells. The mutation causes the red blood cells to be misshapen and block blood vessels. Despite this, the sickle cell trait protects against the development of malaria. Research the following questions.
1. Which amino acid is changed in sickle cell anaemia?
2. Sickle cell anaemia is an example of both a harmful and a beneficial mutation. Explain what these terms mean.
2.51 Red blood cells are misshapen and resemble sickles in people with sickle cell anaemia.
3. What is the correlation between the distribution of the mutated gene and the distribution of malaria in Africa?
4. Why is sickle cell anaemia harmful in a non-malarial zone and beneficial in a malarial zone?
Certain individuals may have one more or one fewer chromosomes because of non-disjunction during meiosis. Non-disjunction means that the homologous chromosomes during anaphase I or sister chromatids during anaphase II failed to separate, so the gametes end up with an abnormal number of chromosomes (aneuploidy).
Trisomy occurs when an organism has a third copy of a chromosome that should only be present in two copies. Trisomy is therefore an example of aneuploidy. The most common trisomy among embryos that survive to birth is Down syndrome, or trisomy 21. People with this inherited disorder have distinct facial characteristics and experience developmental abnormalities.
Sex chromosome abnormalities
non-disjunction the failure of homologous chromosomes or sister chromatids to separate correctly in meiosis aneuploidy the presence of an abnormal number of chromosomes in a cell trisomy when an organism has a third copy of a chromosome
2.52 A karyotype of a male with Klinefelter syndrome
Sex chromosome abnormalities occur when a person is missing a whole sex chromosome or has an extra sex chromosome due to non-disjunction. Problems can also occur when a person is missing part of a sex chromosome. Disorders of sex chromosomes include Klinefelter syndrome and Turner syndrome. Some of these disorders are surprisingly common. For example, many men with Klinefelter syndrome (who have two X chromosomes and one Y) have no signs or symptoms, and it is estimated that only one in six are ever diagnosed.
Quick check 2.17
1. Describe a substitution mutation.
2. Recall what the term 'aneuploidy' means.
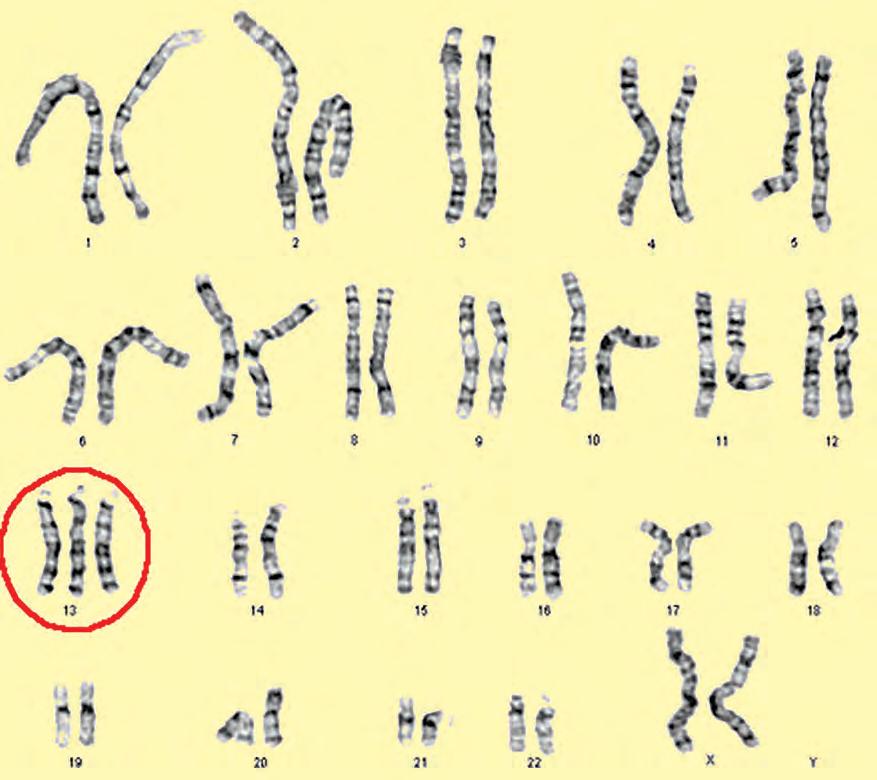
Figure 2.53 There are other types of trisomy apart from trisomy 21. Trisomy 13 and 18 result in more severe conditions. Which trisomy is depicted in this karyotype?
Did you know? 2.9
Madeline Stuart
Madeline Stuart is the first professional model with Down syndrome, and she is Australian! Although the fashion industry has a long way to go in terms of diversity, Madeline is one of the women who are changing the game. As well as being a model, she has also represented Queensland at the Special Olympics in cricket and basketball.

A person's DNA can provide information relating to their ancestry or parentage, confirm if they have a hereditary disease, and inform whether they are a carrier for genetic disorders that may affect their children.
Genetic screening is a type of genetic testing, but instead of identifying a genetic condition, it is used to evaluate an individual's risk of developing a certain disease. These tests are routinely done for anyone in the population, even if they have not shown a family history of the disease. Genetic screening is usually done during pregnancy and at birth. In Australia, about 99% of babies are screened every year. Of the babies screened, around one in every thousand has a condition that would otherwise have gone undetected. Genetic screening provides an opportunity for preventive measures and early treatment.
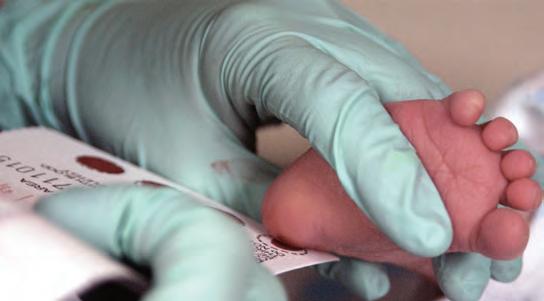
Figure 2.55 In Victoria, the newborn bloodspot screening test screens for cystic fibrosis, phenylketonuria, hypothyroidism, galactosaemia and congenital adrenal hyperplasia.
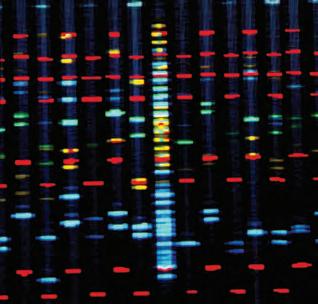
Figure 2.56 A DNA sequence or 'genetic fingerprint' on a computer monitor. The development of fast computers made the analysis of DNA sequences possible.
Making thinking visible 2.4
Think, feel, care: Genetic screening
In your class, divide into teams and engage in a discussion about perspectives within a scenario about genetic testing. You may wish to consider the following scenario, although your teacher may provide you with an alternative.
A woman who is 12 weeks pregnant attends a clinic and expresses her concern about her husband's family history of Huntington's disease (HD). Her sister-in-law tested positive last year, although she is not yet showing symptoms of the disease, but the woman's husband refuses to be tested. Due to this, the woman is asking for her unborn baby to be screened to determine whether it carries the HD gene. If the test comes back positive, which means that her husband carries the HD gene, the woman will discuss terminating the pregnancy with her husband.
Step inside each person's point of view in this scenario. As you think about what you know, consider what each person might understand, respond to and value in the issues raised. Don't forget to consider the legal and ethical issues.
The Think, feel, care thinking routine was developed by Project Zero, a research centre at the Harvard Graduate School of Education.
genetic engineering deliberately modifying genetic material to manipulate the characteristics of an organism
Pharmacogenomic tests look for genetic variants that are associated with an individual's response to specific medicines, by testing genes that affect drug metabolism. Its goal is to help doctors to select the drugs and doses that are best suited to each person.

2.57 Research has shown that people with red hair tolerate pain differently to people with other hair colours. Due to a mutation on the MC1R gene, they require more anaesthesia but need lower doses of opioids as they are more responsive to those painkillers.
check 2.18
1. Explain why an individual might choose to be screened for genetic diseases. 2. Identify some ethical issues with genetic testing.
Genetic engineering technology allows scientists to manipulate genetic material and transfer genes between different organisms. One of the most exciting developments of the last decade is CRISPR, a technology that can edit genetic material quickly and cheaply. Developed by Jennifer Doudna and Emmanuelle Charpentier, the CRISPR tool lets scientists change or delete DNA bases and insert entirely new genes. The gene editing technology has almost endless potential, including editing crops so they're more nutritious or able to survive in different conditions, curing genetic diseases, producing powerful new drugs or even resurrecting extinct species. In 2022, a New Zealand woman became the first to receive CRISPR treatment to treat heart disease by permanently lowering her cholesterol.
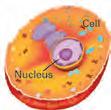

Chromosome


A cell is transfected with an enzyme complex containing: a guide molecule, DNA-cutting enzyme and a copy of healthy DNA.
The guide molecule finds the target DNA strand.
The enzyme cuts out the target DNA strand. DNA-cutting enzyme Defective DNA strand
The healthy DNA copy replaces the defective DNA. Healthy DNA strand
A genetically modified organism (GMO) is an organism whose genome has been altered by humans. Commonly, they are crop species that have been modified to improve growth rates, yield, quality and nutritional value. Genetic modification can decrease pest and disease susceptibility, reducing the need for pesticides.
Agricultural practices have changed to include the widespread use of genetically engineered crops. Crop plants are modified to have a greater tolerance to environmental stressors such as drought or heavy metals, allowing plants to grow in new areas. For example, some plants have been genetically engineered to grow with less water so that they are more resistant to climate change. Until recently, only three GM crops were approved to be grown in every mainland Australian state: canola (rapeseed oil), cotton and safflower. After a ban was lifted, a wider range of GM crops can now be grown in every mainland state. genetically modified organism an organism that has had its genome altered using genetic engineering techniques
A great debate continues to rage within society regarding the health risks associated with eating GM food. Research two advantages and two disadvantages of the use of GM food and be prepared to debate with your classmates.
Figure 2.59 Cassava root has been genetically modified to have increased levels of beta carotene (right). This decreases post-harvest deterioration and also improves the nutritional value of the crop.
Did you know? 2.10
De-extinction
De-extincting is the process of bringing an extinct species back to life through genetic engineering using fragments of DNA from preserved specimens. De-extincting species is a controversial idea, and many scientists argue that funding would be better spent conserving existing species and their habitats. A start-up biotechnology company called Colossal Biosciences quickly raised millions of dollars after announcing plans to de-extinct the woolly mammoth, the thylacine and the dodo.
Genetic engineering is also helping to alleviate global malnutrition and disease. A type of rice called golden rice has been engineered to prevent blindness in children caused by vitamin A deficiency. Another type of GM rice has been developed that has four times more iron than normal rice.

2.62 Mosquitoes have been genetically modified to slow the growth of malaria-causing parasites in their gut, preventing transmission of the disease to humans.
Many foods come from genetically modified organisms, and we call them GM foods. The Flavr Savr tomato was the first commercially grown GM food that was granted a licence for human consumption. Released in 1994, the tomato had an improved shelf life and was developed for long-distance shipping. Recently, a GM tomato has been developed that contains higher levels of anthocyanins, a pigment that occurs naturally in purple or blue fruits and vegetables such as blueberries or red cabbage. By transferring a snapdragon gene into a tomato's genome, scientists have produced a purple tomato that has the same levels of anthocyanins as blueberries.
1. Research why the team chose to genetically modify a tomato.
2. The high levels of anthocyanins in the purple tomatoes are beneficial for several reasons. Research the effect of anthocyanins on:
a) shelf life
b) plant reproduction and survival
c) human health.

transgenic organism an organism that possesses a foreign gene or segment of foreign DNA in its genome because of human experimentation
Figure 2.63 The process by which the John Innes Centre and the Sainsbury Laboratory created a GM purple tomato, which was approved for growing and breeding in the US in 2022. (a) Existing purple-skinned tomatoes do not contain useful levels of anthocyanins. (b) Genes from purple snapdragon flowers were added to the tomato. The snapdragon genes act like 'on switches', causing the purple pigment to be expressed throughout the tomato, instead of just in the skin. (c) The resulting purple tomato is high in anthocyanins, which have a range of benefits for human health.
Transgenic organisms (TGOs) are the result of a type of genetic modification where a 'foreign' gene, or a segment of 'foreign' DNA, is inserted into an organism's genome. A foreign gene is one that is taken from another species. All transgenic organisms are GMOs, but not all GMOs are transgenic.
By inserting human genes into mice, human diseases can be mimicked, particularly as the genome and physiology of mice are so similar to humans. Transgenic mice are being used to study conditions such as obesity, heart disease, diabetes and Alzheimer's disease. Transgenic pigs are being investigated as a source of organs for transplants, which could address severe donor organ shortages. CRISPR technology has greatly reduced the complexity of the creation of transgenic animals, making the process faster and cheaper.
Human genes have been engineered into other mammals to supply the protein products of those genes, usually for medical purposes. For example, transgenic goats have been genetically engineered to produce milk that contains human antithrombin III. This is a protein that is used to prevent clots in patients with hereditary antithrombin deficiency when they are in surgery or giving birth. A herd of approximately 80 goats could supply enough human antithrombin III for all of Europe.

I used to think ... now I think
Xenotransplantation is the transplantation of living cells, tissues or organs from one species to another. Transgenic pigs are promising xenotransplantation donor organisms as they share many anatomical and physiological characteristics with humans. In 2022, the first pig-to-human heart transplant took place. The operation was successful and, due to genetic modification, the heart was not rejected by the patient's immune system. Unfortunately, he died 60 days later; scientists are still investigating why this happened. Scientists have also been successful in transplanting genetically modified pig kidneys into a brain-dead patient, with them functioning normally throughout the study period.
Think about what you have learned about transgenic organisms and xenotransplantation and complete the following sentence stems.
In the past, my viewpoint was … Currently, my viewpoint is …
The I used to think ... now I think ... thinking routine was developed by Project Zero, a research centre at the Harvard Graduate School of Education.
Gene therapy is a process by which a copy of a functional gene is introduced into an organism. The gene is then switched on to produce the functional protein that is missing. This technique aims to treat inherited disorders like cystic fibrosis by directly targeting the genotype (unlike treatments that target the symptoms). Technical difficulties may arise when trying to specifically target the cells of
affected tissue, and when targeting one specific gene without interfering with the function of other essential genes. Ethical issues also arise. Some people argue that gene therapy should be restricted to somatic tissue only, so the introduced gene is not transmitted through to the next generation. What do you think about this issue?
The Human Genome Project (HGP) is considered one of the most important scientific research projects of the twentieth century. The project aimed to sequence the entire human genome, that is, determine the exact order of bases (A, T, C and G) that make up human DNA. It took 13 years, almost three billion dollars and the efforts of thousands of scientists from around the world. Today, the human genome can be sequenced in a matter of days for less than $1000. This is due to advancements in computer science and technology. The method used to sequence DNA during the HGP was Sanger sequencing, which could only read small fragments of DNA at a time. This meant that the entire human genome had to be sequenced in tiny overlapping fragments and then pieced together. The technique used today is called next-generation sequencing (NGS). NGS can produce about 15 000 times as much data per day as a Sanger sequencer. Computational biologists use technology to interpret the data generated. This may include finding mutations that cause disease or running simulations to predict how a biological system would respond to an environmental change. Without advances in processing speed and storage space, it is unlikely that the field of genetics would be as advanced as it is today.
Quick check 2.19
1. Recall what GMO stands for.
2. Describe the process of gene therapy.
3. State an example of the application of genetic screening.
4. Discuss the reasons for the adoption of genetic screening by groups in society.
5. State five conditions that are screened for in Victoria through the newborn bloodspot screening tests.
Section 2.4 review Go online to access the interactive section review and more!
Section 2.4 questions
Remembering
1. If a mutation is to be passed on to the next generation, state where it must have occurred.
2. Define the term 'mutagen'.
3. Recall the definition of a genetically modified organism.
Understanding
4. Explain what will happen if a nucleotide is deleted from the sequence of nucleotides within a gene.
5. Explain what usually results when mutations occur in non-germ (somatic) cells.
6. Explain whether or not all mutations are detrimental (harmful).
7. Explain how a mutated gene can lead to a genetic disorder.
8. Illustrate a diagram to outline how non-disjunction may occur and cause aneuploidy.
Applying
9. Using the table below, answer the following questions.
Second letter in the codon
First letter in the codon
C
UUU Phe (F)
UUA Leu (L)
G
UAU Tyr (Y) UGU Cys (C) U
UUC UCC UAC UGC C
UCA UAA STOP UGA STOP A
UCU Ser (S)
UUG UCG UAG STOP UGGTrp (W) G
CUU
CUC CCC CAC CGC C
Leu (L)
CCU Pro (P) CAU His (H) CGU Arg (R) U
CUA CCA CAA Gin (Q) CGA A
CUG
AUU
CCG CAG CGG G A
IIe (I)
ACU Thr (T) AAU Asn (N) AGU Ser (S) U
Third letter in the codon
AUC ACC AAC AGC C
AUA ACA AAA Lys (K) AGA Arg (R) A
AUGMet (M) START ACG AAG AGG G
GUU Val (V)
GCU Ala (A) GAU Asp (D) GGU Gly (G) U
GUC GCC GAC GGC C
GUA GCA GAA Glu (E) GGA A
GUG GCG GAG GGG G
The original DNA strand is GTC GGG ATA CGG CTC.
A gene mutation occurs, whereby the C in the first codon is replaced with a T, resulting in GTT GGG ATA CGG CTC.
a) State the name of this gene mutation.
b) State the mRNA strand that was copied from the original DNA strand.
c) State the new mRNA strand produced from the mutated DNA strand.
d) State whether the amino acids stay the same or change.
e) Another mutation occurs, whereby a C was added to the beginning of the above original DNA strand, giving CGTC GGG ATT CGG CTC.
State the name of this mutation and describe how it would affect the subsequent amino acids that it codes for.
f) Write out the mRNA code for this mutation and identify the corresponding amino acids.
10. Using the DNA sequence ACAATTGGTAGCTGAGTTGGCCCGTA, create an example of the following mutations.
a) substitution b) inversion c) deletion d) insertion
Analysing
11. Contrast a genetically modified organism and a transgenic organism.
12. Contrast a spontaneous mutation and an induced mutation.
Evaluating
13. Discuss why the substitution of one nucleotide may not be as critical to the functioning of the protein as the deletion or insertion of a nucleotide.
14. Propose an explanation for the relationship between increased rates of skin cancer and the thinning of the ozone layer.
15. Construct a mind map that shows the different types of mutations that may occur
Chapter checklist
Success criteria Linked questions
2.1 I can recall the components that make up the structure of DNA and RNA molecules. 6, 13
2.1 I can describe the relationship between DNA, genes and chromosomes. 1, 4, 14
2.1 I can describe the steps in which DNA is used to synthesise proteins.7, 18
2.2 I can recall the steps involved in DNA replication. 3
2.2 I can describe the stages of cell division in mitosis and meiosis.15, 16, 17
2.2 I can define the terms 'diploid' and 'haploid' with respect to human chromosome numbers in somatic cells and gametes. 8, 9
2.2 I can use a karyotype to determine information about an individual.10
2.3 I can define the terms 'homozygous', 'heterozygous', 'dominant' and 'recessive' with respect to genetic inheritance. 2, 5, 12
2.3 I can use and interpret Punnett squares to identify possible genotypes and phenotypes of offspring. 19, 21, 22
2.3 I can use pedigree diagrams to determine the type of inheritance that is occurring. 20, 23
2.3 I can explain codominance, incomplete dominance and sex linkage.11, 19, 21
2.4 I can explain the different types of mutations, including their causes and effects. 16
2.4 I can recall some applications of DNA manipulation. 24
Review questions
1. State the name of the position on a chromosome where a particular gene is located.
2. Recall two autosomal recessive inheritable traits.
3. Recall the name of the enzyme that unwinds the DNA double helix during DNA replication.
4. Name the structure that results from the wrapping of DNA around histone proteins.
5. Define the terms 'homozygous', 'heterozygous', 'dominant' and 'recessive'.
6. Identify the parts of the nucleotide below.
7. State the locations in the cell where transcription and translation occur.
8. State how many chromosomes you would expect to find in a:
a) human somatic cell
b) human gamete
c) human somatic cell with Down syndrome.
9. The table below shows several different organisms with their diploid chromosome number.
a) Identify the organism with the highest number of chromosomes in its gametes.
b) State the haploid number of the onion.
10. Identify what information can be gained from the following karyotype.
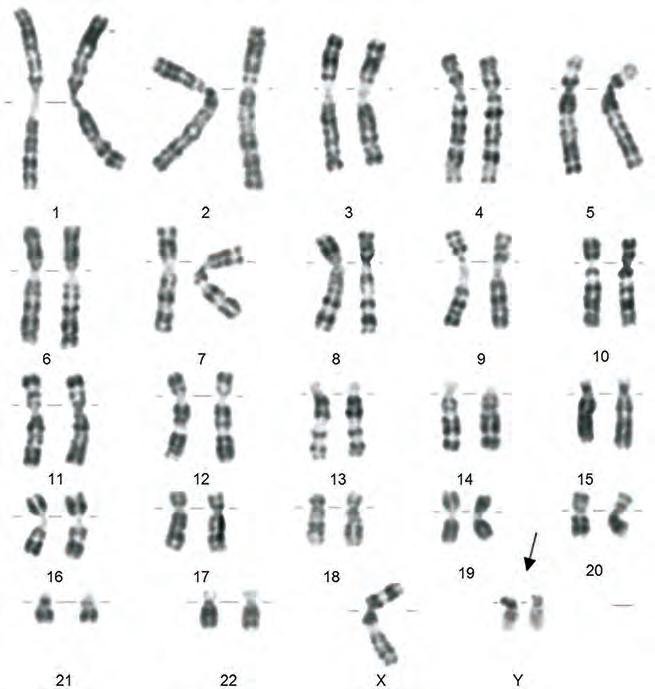
11. Explain why males have more chance than females of inheriting an X-linked recessive trait.
12. Assuming eye colour in humans is controlled by a single pair of genes and that brown eyes are dominant to blue eyes, determine the genotype of a brown-eyed man if he and a woman with blue eyes produce a baby with blue eyes.
13. Illustrate a diagram to show how two nucleotides join together with hydrogen bonds.
14. Explain why chromosomes are not always visible.
15. When cells reproduce themselves, the DNA is replicated. Explain why this is necessary.
16. Explain how aneuploidy occurs.
17. Contrast meiosis and mitosis.
18. Illustrate a diagram to show the processes of transcription and translation.
Applying
19. Using a Punnett square, determine the genotypes and phenotypes of the children if a normal-vision female carrier of colour blindness has children with a normal-vision male.
Normal-vision carrier female (XBXb) XB Xb
Normal-vision male (XBY) XB Y
20. Construct a pedigree with the following information. A woman with Huntington's disease marries a man who does not have Huntington's disease. They have three children. The first child is a male, the second child is a female, and both do not have the disease. The third child, a male, does develop the disease. Remember that Huntington's disease is an autosomal dominant genetic disorder.
21. An abandoned baby was handed in at the police station. Later, two women claimed to be the baby's mother. Blood studies revealed that woman 1 had blood type A, and that woman 2 had blood type AB. The baby had blood type O. Deduce which woman could possibly be the baby's mother and which woman can be ruled out completely. Show your working.
22. Chondrodystrophy is an autosomal recessive condition that is governed by a single gene with two alleles. In turkeys, affected embryos die approximately 16 days after fertilisation, so they do not survive long enough to hatch. Two turkeys that are heterozygous for the condition are crossed. Show your working to determine the phenotypic and genotypic ratios of the offspring.
Let T = normal allele, and t = allele with chondrodystrophy.
Analysing
23. Use information from the following pedigrees to infer the inheritance pattern shown. a) b) c)
24. Personal genome screening can be readily ordered over the internet. Evaluate the pros and cons of having DNA testing so readily available at an affordable cost.
25. You had genome screening and found out that your genes conferred a 25% chance of developing a disease. However, you also know that environmental and lifestyle factors play a large role in whether you develop the disease.
a) Evaluate how this information would affect your life.
b) Discuss how this scenario is different from knowing about a disease that is not influenced by lifestyle factors.
Data questions
A student prepared an onion root tip slide and examined the cells using a light microscope. She recorded the number of cells in each stage of the cell cycle.
Table 2.6 shows her results.
Stage of cell cycle
Table 2.6 Number of onions cells in each stage of the cell cycle
She then calculated the mitotic index for different areas of the root tip. The graph shows her results.
Distance from root tip (mm)
Figure 2.67 Mitotic index plotted against distance from root tip
Applying
1. The mitotic index of dividing tissue is calculated with the following formula: mitotic index = number of cells seen that were undergoing mitosis total number of cells seen
Calculate the mitotic index of the tissue shown in the table.
2. The duration of any phase of the cell cycle can be calculated with the following formula: phase duration (minutes) = number of cells seen in that phase total number of cells seen × cell cycle duration of the organism
The cell cycle duration for the onion is 24 hours.
Calculate the duration of metaphase.
Analysing
3. Identify the trend shown in the graph in Figure 2.67.
4. Extrapolate the data in the graph to estimate the mitotic index of the cells found 2 mm from the root tip.
When a mutation occurs that is not beneficial, complications occur. An example of a disease with genetic causes is scoliosis. Scoliosis is a sideways curvature of the spine that usually occurs before puberty. Genetic diseases such as cerebral palsy and muscular dystrophy can cause scoliosis, but the cause of most cases of scoliosis is unknown.
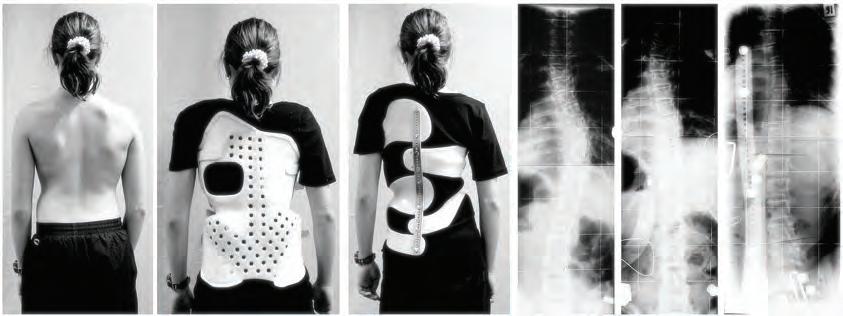
Research a genetic disease. Design and build an apparatus that can help to improve the quality of life for people with the selected disease.
In groups of three or four, conduct basic research on a genetic disease. Then design an apparatus that will improve the quality of life for people with that condition. Consider how the product would be built and marketed. Each team member needs to have a clear role but must be able to contribute to all aspects of the project.
• computer
• pencil
• paper
• ruler
• balsa wood
• plaster

• papier mâché
• chicken wire
• 3D printer
• cardboard
• poster paper
1. Research genetic diseases and as a group decide which genetic disease will be the focus.
2. Create a table of the causes and effects of the disease.
Genetic disease causeEffects on part of body Ideas to help
e.g. Muscular dystrophy
Muscle loss
e.g. Haemophilia
Blood doesn't clot effectively.
Reduced joint movementBrace and orthotics for feet
Whole body can be bruised easily.
• Creation of children's play suit
• Creation of some type of buffing edging that could be applied to furniture
3. Find pictures or diagrams of current equipment used, and annotate them with features and characteristics that relate to assisting people living with this disease.
4. Sketch potential design solutions (at least two) and annotate the purpose of the apparatus and what it is made of. Describe how it will improve the quality of life for people with this disease. How will it improve on current aids or tools (if any)?
5. Reflect on the materials you would use in real-world construction and comment on the durability and sustainability of the materials.
6. Build a prototype of your design using available construction materials.
7. Reflect on the prototype you have created and its effectiveness to help people with your chosen genetic disease.
8. Discuss as a group the modifications you would make in your solution to increase the effectiveness of design.
9. Present your prototype to the class. Outline the effectiveness of the prototype and demonstrate supporting ideas that show how the prototype would improve the quality of life of a person with this genetic disease.
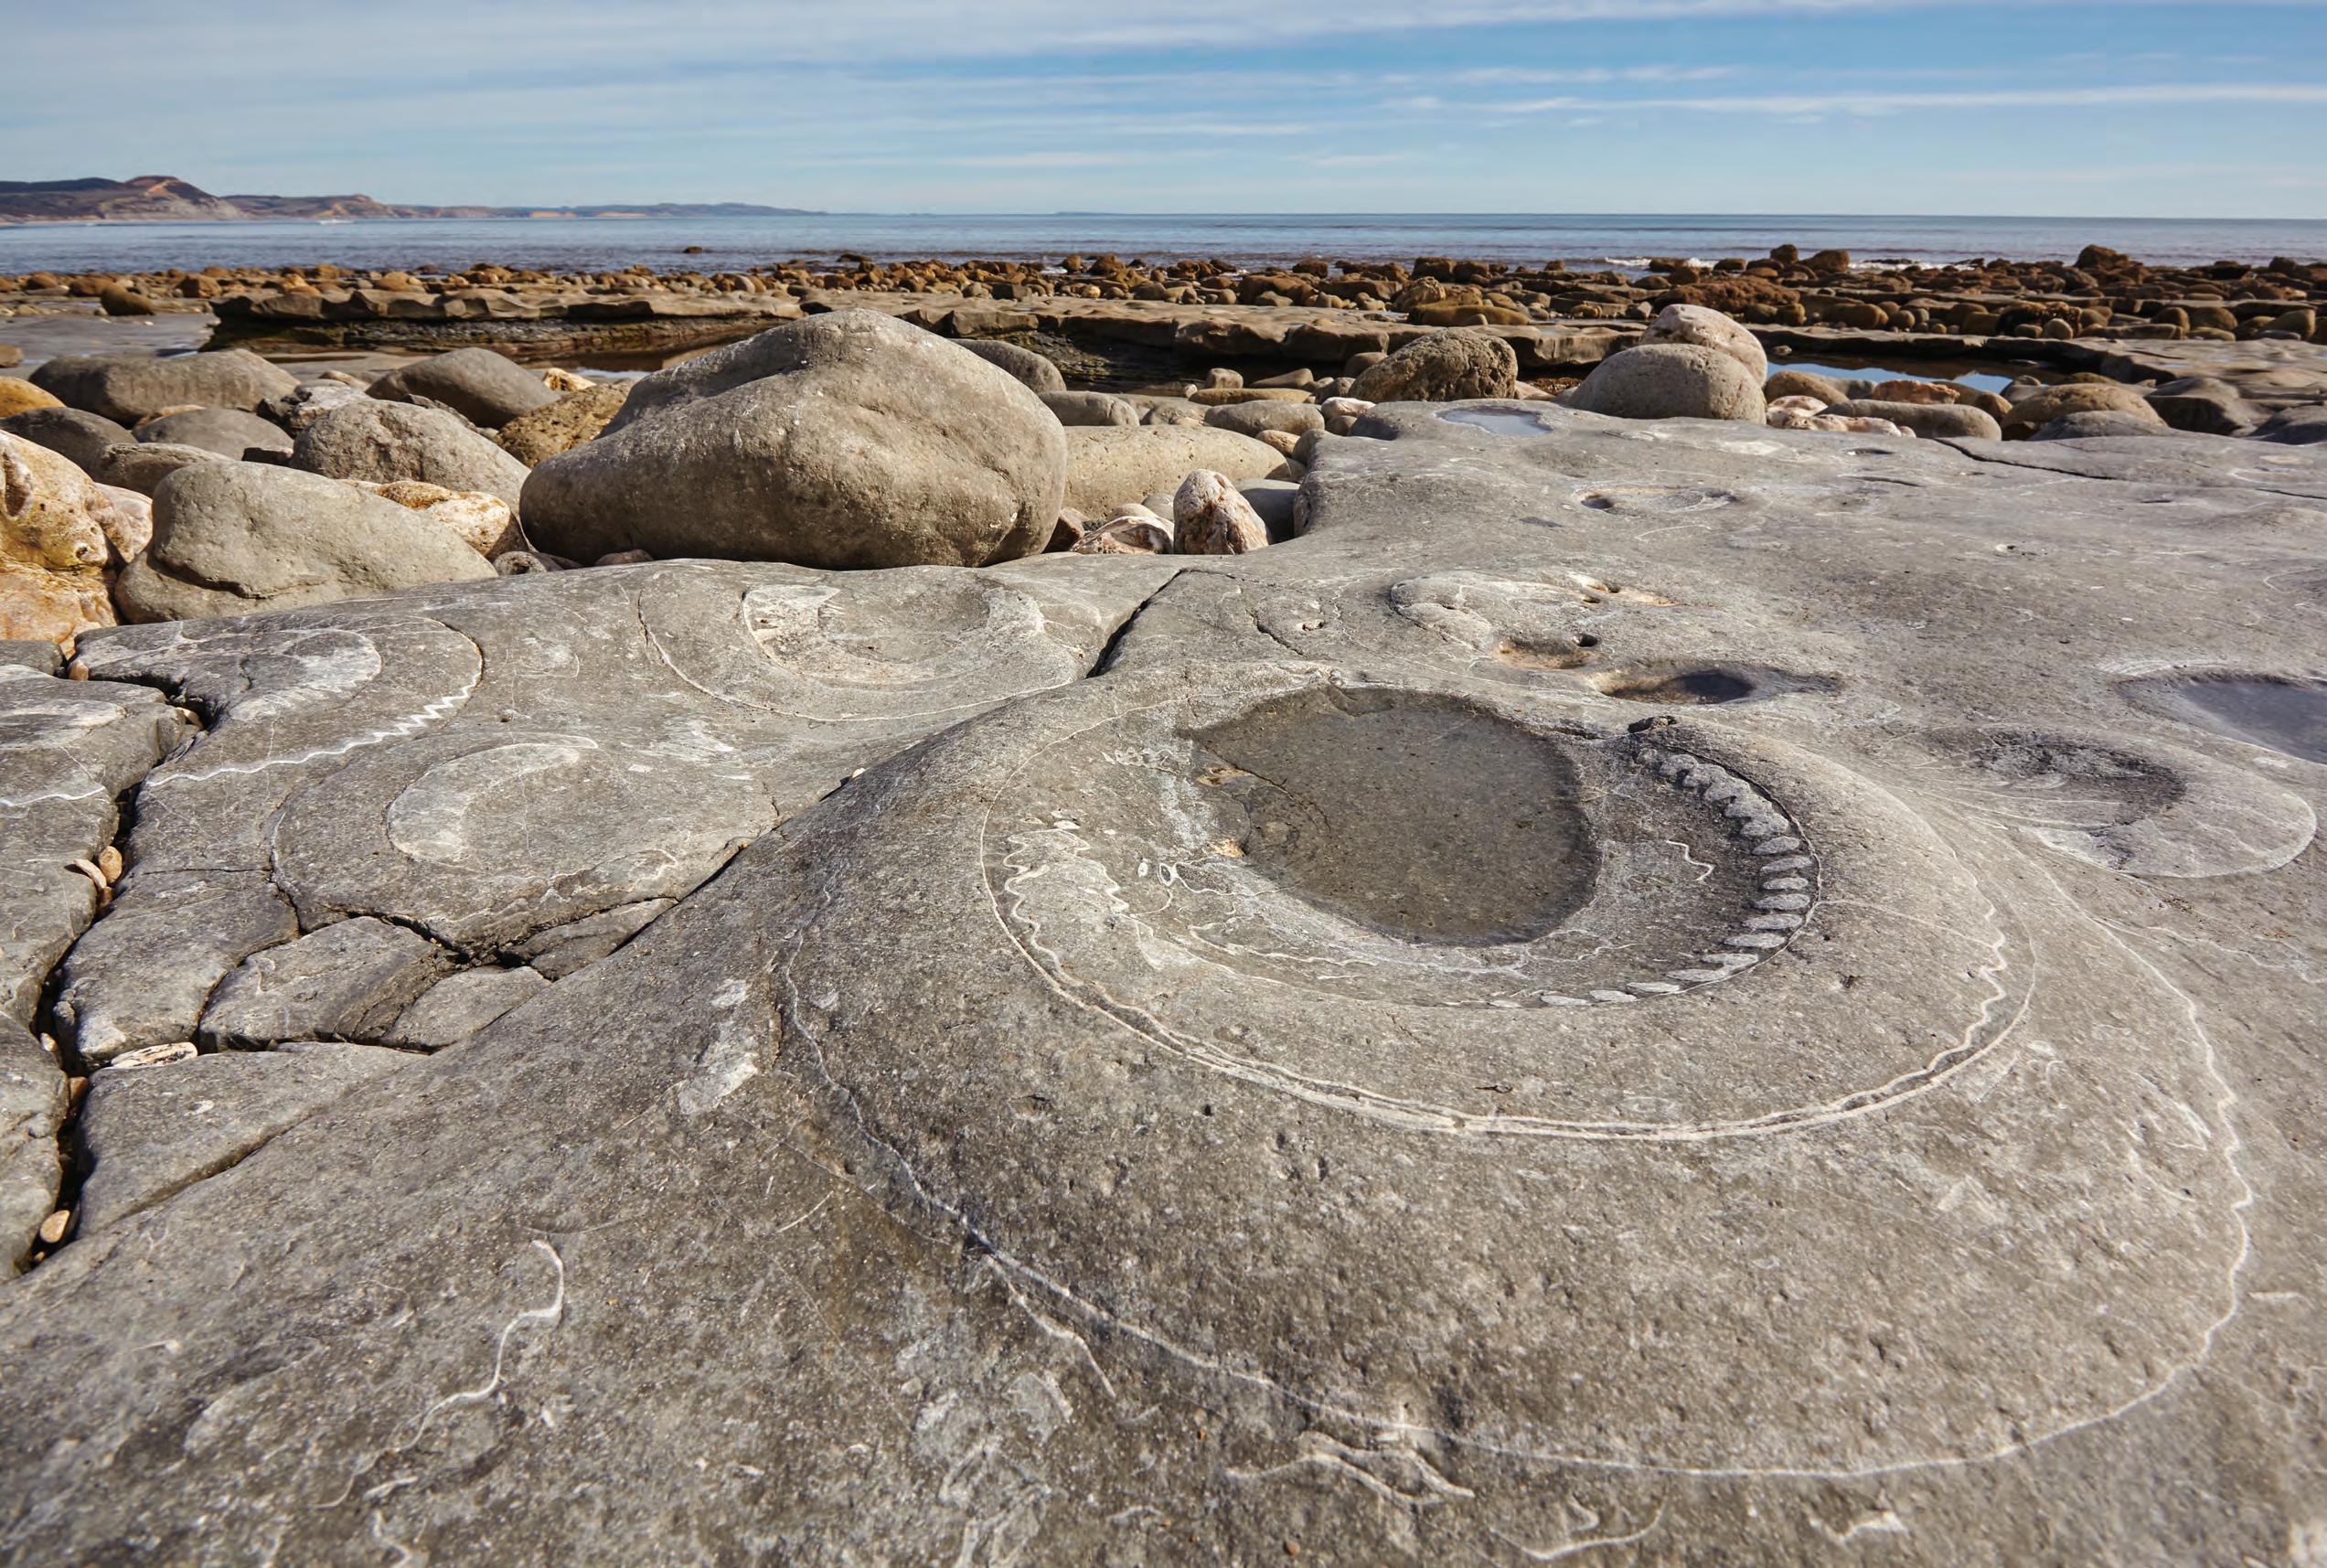
Life on Earth has been evolving for billions of years, resulting in an enormous diversity of organisms. But despite the differences, there are also similarities. While koalas, quolls, frogs and dolphins all look different, their skeletons are organised in the same way. This can be explained by evolution: the idea that all organisms on Earth are the living descendants of common ancestors that have changed over a long period. The evidence we see in the fossil record, genetics and other fields of science supports the theory of evolution. In this chapter, we will analyse the evidence that supports the theory for evolution and look at the key processes involved.
Evolution
Mechanisms of evolution:
• Mutation
• Gene flow
• Sexual reproduction
• Genetic drift
• Natural selection
Natural selection:
• Variation
• Selection
Artificial selection:
• Reproductive technologies
• Gene technologies
Biodiversity
Evidence for evolution:
• Palaeontology
• Comparative anatomy
• Comparative embryology
• Molecular biology
• Biogeography
Speciation:
• Variation
• Reproductive isolation
Section
the theory of evolution by natural selection includes the processes of variation, isolation and adaptation and is supported by evidence, including the fossil record, biogeography and comparative embryology; the theory explains past and present biodiversity and demonstrates how all organisms have some degree of relatedness to each other (VC2S10U05)
• examining biodiversity as a function of evolution
• investigating some of the structural and physiological adaptations of Aboriginal and/or Torres Strait Islander Peoples to the Australian environment
• considering the debates and research regarding whether humans or climate change were causal factors in Australia's Pleistocene megafaunal extinction
• outlining processes involved in natural selection, including variation, isolation and selection
• relating genetic characteristics to survival and reproductive rates 3.1, 3.2
• investigating changes caused by natural selection in a particular population as a result of a specified selection pressure, for example, artificial selection in breeding for desired characteristics
• analysing evidence for the theory of evolution by natural selection, including the fossil record, chemical and anatomical similarities, and geographical distribution of species
scientific knowledge may be interpreted in different ways by individuals and groups in society; the values and needs of society can influence the focus of scientific research (VC2S10H04)
• researching how particular values in nineteenth and early twentieth-century Australia, combined with scientific misconceptions about heredity and evolution, have influenced policies and attitudes about Aboriginal and/or Torres Strait Islander Peoples
Victorian Curriculum V2.0 F–10 © VCAA 2024
Absolute dating
Adaptation
Allele frequency
Analogous structures
Artificial selection
Biodiversity
Biogeography
Biostratigraphy
Biota
Bipedal
Bottleneck effect
Direct evidence
DNA hybridisation
Ecosystem diversity
Endangered
Endemism
Evolution

Evolutionary tree
Extinct
Fertile
Fossil
Fossil record
Fossilisation
Founder effect
Gene flow
Gene pool
Genetic diversity
Genetic drift
Genetic variation
Half-life
Megafauna
Natural selection
Population
Radioisotope
Relative dating
Reproductive isolation
Selection pressure
Selective advantage
Selective breeding
Speciation
Species
Species diversity
Stratigraphy
Homologous structuresTrace fossil
Index fossil
Indirect evidence
Mass extinction
Variation
Viable
Learning goals
At the end of this section, I will be able to:
1. Describe how evolution can take place through five key drivers.
2. Explore how biodiversity has changed over time.
Evolution is a complex process that encompasses genetic changes occurring over extended periods within populations. These changes, combined with environmental influences, give rise to phenotypic variation among individuals. The primary source of genetic variation is mutation, which introduces new alleles into a population. Additionally, meiosis and the random fertilisation of gametes during sexual reproduction contribute to the reshuffling and mixing of existing genetic material.
Within a population, individuals possessing traits that enhance their ability to survive and reproduce in a particular environment have a higher likelihood of surviving to reproductive age and passing on their advantageous alleles to their offspring. Over time, these advantageous alleles become more prevalent in the population, causing a shift in allele frequency
The effect of these genetic changes, driven by natural selection, genetic drift, migration and other evolutionary forces, leads to the changes in populations and the potential emergence of new species.
Mechanisms of evolution
Evolution can take place through five key drivers:
• mutation
• gene flow
• genetic drift
• natural selection
• sexual reproduction – including meiosis and random fertilisation (as discussed in Chapter 2).
Mutation (random change in DNA)
Natural selection (survival of the fittest)
DOC
Sexual reproduction (random change in DNA) Gene flow (migration)
Variation in a population
Genetic composition of population changes over time
Genetic drift (chance)
Figure 3.1 Changing genetic information creates variation within a population. This leads to an overall change in the genetic composition of a population, which means evolution is occurring.
WORKSHEET
Mechanisms for evolution
evolution change in the genetic composition of a population over successive generations, which may result in the development of new species population (ecological) a group of a particular species living and interbreeding in the same geographical area genetic variation the differences in DNA sequences between individuals within a population allele frequency the relative proportion of a specific allele within a population variation the range of differences or diversity in traits, characteristics or genetic make-up among individuals
Evolution
For evolution to occur, there must be a change in the genetic make-up of at least one individual. Recall from Chapter 2 that a mutation is a spontaneous or induced change in the genetic sequence of an organism's DNA. If present in gamete cells, mutations are heritable and can be passed down to future generations (Figure 3.2).
Mutation is a random process, and changes can occur anywhere in the DNA. Mutations may have various effects on the phenotype of organisms, ranging from no change to large changes. These large changes include genetic diseases that are associated with a loss of function. Since genetic disease reduces an individual's chance of survival, these are often not passed on to future generations. However, in specific circumstances, mutations that are usually detrimental or harmful can be beneficial. For example, a mutation in the haemoglobin gene causes sickle cell anaemia, but the trait is also protective against malaria infection.
Mutations are the most important source of genetic variation, as they can introduce new alleles. If the mutation is advantageous and occurs in the gametes, it may lead to a shift in the genetic composition in the population. This links to another driver of evolution called natural selection, which will be covered later. Along with natural selection, mutations are one of the main drivers of evolution, and without them evolution cannot occur.
Albinism


Genetic disease
Cystic fibrosis
Duchenne muscular dystrophy
Haemophilia
Sickle cell anaemia
or induced mutation


Some of the outcomes
No or little colour in skin, hair and eyes
Reduced sun protection
Thicker mucus lining organs
Respiratory and other health problems
Fatigue
Progressive muscle weakness
Blood cannot clot properly
Abnormal bleeding
Sickle-shaped red blood cells can interrupt blood flow
Pain and fatigue
Resistance to malaria, which is beneficial in areas where malaria is common
Table 3.1 Some examples of genetic diseases caused by mutations
Researchers have found that approximately half of the Aboriginal population of Western Australia have a mutation that allows them to produce a different amount of thyroxine, a hormone that regulates metabolism including body temperature. This adaptation provides an advantage in coping with extreme heat, such as in areas that can regularly exceed 45°.

Figure 3.3 Marble Bar, in the Pilbara region of Western Australia, is Australia's hottest town. Temperatures more than 45°C are common in December and January.
Contrastingly, a gene that is associated with cold temperatures has been found in higher frequency in European populations living in (or originating from) cold, northern climates. The gene, called TRPM8, codes for a receptor that detects and responds to cold temperatures. The same receptor is also activated by menthol, causing the 'cooling' sensation we get when consuming mints or mint-containing foods.

Another way genetic variation can be introduced into a population is through gene flow, which is enabled by migration. Migration is the movement of individuals from one population to another, while gene flow specifically refers to the movement of alleles from one population to another. Gene flow can only occur between separate populations of the same species because they must be able to interbreed and reproduce (Figure 3.5).
Gene flow can occur through different kinds of events, such as seed dispersal, animals moving to different areas or movement forced by natural disasters such as fires or floods.


While the koala is one species, there are five distinctly different genetic populations across Australia's east coast. The loss of genetic diversity from small fragmented koala populations increases their risk of extinction due to both inbreeding and an inability to adapt when the environment changes. Maintaining genetic diversity in koalas is critical to their survival. This can be achieved by maintaining large interconnected natural populations or through wildlife translocation, which is an artificial form of gene flow.
Wildlife translocation is being used with increasing frequency to conserve a variety of species, but it is also controversial, even among conservationists. Potential problems include the spread of diseases, increased stress and mortality of relocated animals and negative impacts on the organisms at release sites.
Using your prior knowledge and the information provided, make a claim about wildlife translocations.
Provide evidence to support your claim.
Pose a question related to your claim or supporting evidence. What remains unexplained or requires further investigation? The Claim, support, question thinking routine was developed by Project Zero, a
Genetic drift is random changes in allele frequencies in a population over time. Genetic drift is always happening in a population, as chance outcomes of meiosis, crossing over and fertilisation affect the genetic composition of each new generation. The effects of genetic drift are greater in smaller populations. Two extreme examples of genetic drift are the founder effect and the bottleneck effect
The founder effect occurs when a small number of individuals leave a population and establish their own colony. Simply by chance, it is likely that allele frequencies in the small founder population will be different from those in the larger population they came from.
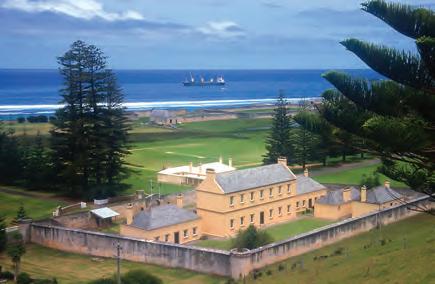
Figure 3.7 Norfolk Island, which is located between New Zealand and New Caledonia, was used as a penal colony and then abandoned in 1855. Most present-day islanders are the descendants of a founder population made up of a small number of the descendants of the HMS Bounty mutineers and Tahitian women who relocated from Pitcairn Island in 1856. The founder effect has significantly affected height and the prevalence of cardiovascular diseases in the islanders.
A population 'bottleneck' occurs when the size of at least one generation of the population is severely reduced, perhaps by a chance event such as an environmental disaster or because of human activities such as habitat destruction or overhunting. This results in the deaths of many organisms, leaving behind a small random population of survivors (Figure 3.8).
The bottleneck effect and the founder effect both result in populations with an allele frequency that differs in a random way from their source or original population. In both cases, because the remaining population is much smaller than the original population, the effect of genetic drift is amplified and there is also less genetic diversity. The gene pool of the new population is not representative of the original population, which may result in the new population becoming genetically distinct from the original population over time.


genetic drift the random change in allele frequencies in a population from generation to generation founder effect the decrease in genetic diversity that occurs when a population is descended from a small population that separated from a larger one bottleneck effect the decrease in genetic diversity resulting from a rapid reduction in the size of a population, due to events such as natural disasters or human activities such as overhunting gene pool the total set of genes and alleles present in a population


3.8 Someone standing on some beetles by accident is a random or chance event. If the population size is greatly reduced to the extent that the genetic composition of the beetles' population has changed, this is an example of how the bottleneck effect contributes to evolution.
Natural selection
selective advantage the characteristic of an organism that enables it to survive and reproduce better than other organisms in a population natural selection a process in which organisms whose phenotype is best adapted to their environment are more likely to survive and reproduce adaptation a characteristic that contributes to an organism’s ability to survive in its environment
Did you know? 3.2
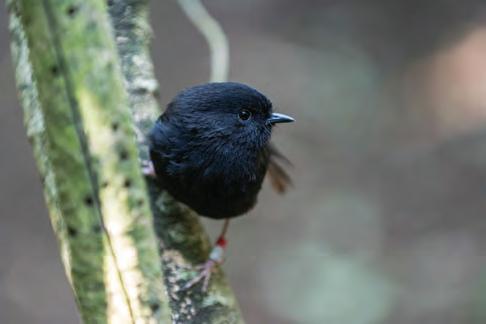
Before European colonisation, black robins (Petroica traversi) were common on Rˉekohu/Chatham Islands, New Zealand. However, their population crashed once rats invaded the archipelago, and by 1976, only seven birds survived. The birds were moved to a predator-free island, but scientists were not confident that the population, which had only one breeding pair (called Old Blue and Old Yellow), would recover due to the severe genetic bottleneck. However, as of 2022, there are approximately 290 surviving birds and, surprisingly, although the bird is certainly one of the most inbred in the world, genome analysis has shown that the frequency of harmful genetic alleles in the population did not increase as a result of the bottleneck.
Individuals in a population show a wide range of phenotypes. Some of these phenotypes may provide selective advantages, meaning those individuals are more likely to survive and reproduce, passing on those advantageous alleles to their offspring. This is natural selection. Often, the term 'survival of the fittest' is used to describe this: the organisms that are best suited to their environment – that is, have the best adaptations – are more likely to survive and pass on their genetic information. For example, look at Figure 3.10. These beetles live in the leaf litter on the forest floor and have natural variation in their colour that is heritable: they can be green or brown. The birds eat more green beetles, because they are easier to spot. The green beetles are at a selective disadvantage (they have a lower fitness value), so fewer green beetles will survive to reproduce and fewer alleles that code for green colouring will be passed on to the next generation. The brown beetles are better adapted to their environment and have the better colour for survival (that is, the brown beetle is at a selective advantage; it has a higher fitness value). Alleles that code for brown colouring are more likely to be passed on to the next generation.

Figure 3.11 Cane toads in rural areas have larger parotid (toxin) glands than those in urban areas. This may be because bush toads are at a higher risk of predation, so it is a selective advantage to have glands that can produce more bufotoxin.
Recall from Chapter 2 that sexual reproduction involves the formation of unique gametes and the contribution of genetic material from two parents. Crossing over and independent assortment occur during meiosis, which forms new combinations of alleles in eggs and sperm. Additionally, the combination of an egg and sperm from two parents further increases genetic variation in offspring. Species with high genetic diversity are more likely to have advantageous adaptations that can help them survive a changing environment.
1. Define the terms 'evolution', 'population', 'variation' and 'adaptation'.
2. Identify the five drivers of evolution.
Try this 3.1
Drivers of evolution
Summarise the five drivers of evolution you have learned by copying and completing the following table.
Mutation
Gene flow
Genetic drift
Natural selection
Sexual reproduction
Practical 3.1
Aim
To simulate genetic drift, natural selection and gene flow in a population of jelly beans and analyse the consequences of each Materials
Be careful
Do not consume food items.
• jelly beans: red × 20, green × 20 and blue × 20 (or anything similar, e.g. coloured paper)
• cups x 3: one labelled 'Population', one labelled 'Next generation' and one labelled 'Spare jelly beans'
Method for Part 1: genetic drift
1. Copy the results table into your science book.
2. Place 10 red jelly beans and 10 green jelly beans in your 'Population' cup. These represent the alleles of the population. Place all other jelly beans in the 'Spare' cup for unused jelly beans. Record the current population in your results table as your first generation.
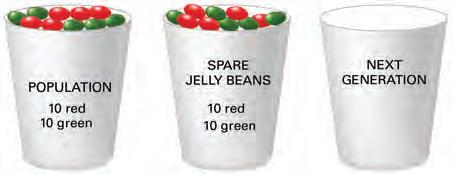
3. With your eyes closed, pick 10 random jelly beans from the 'Population' cup and place them in the 'Next generation' cup. These are the alleles that will be passed on.
4. Throw the remaining jelly beans from your 'Population' cup into the 'Spare' cup. Duplicate the 10 jelly beans in your 'Next generation' cup (e.g. if you picked out 4 red and 6 green, pick out another 4 red and 6 green from the 'Spare' cup and place them in the 'Next generation' cup).
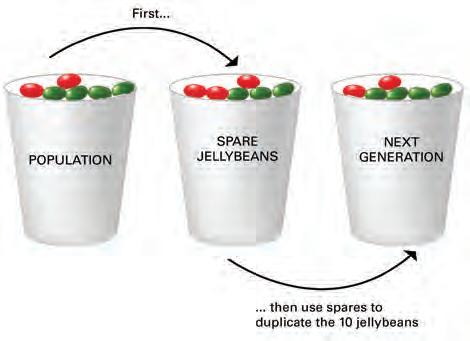
5. Record this in the next row of your results table.
6. Take the new generation alleles (jelly beans) from the 'Next generation' cup and place into the 'Population' cup.
7. Repeat steps 3–6 until you have 10 rows of data, or until one colour is eliminated.
Method for Part 2: natural selection
8. Start by repeating steps 1 and 2 of the method for genetic drift.
9. Imagine that green has a selective disadvantage (the opposite of a selective advantage). Pick out 3 green jelly beans from the 'Population' and move them into the cup for spare jelly beans.
10. Repeat steps 3–6 of the method for genetic drift until you have 10 rows of data or until one colour is eliminated.
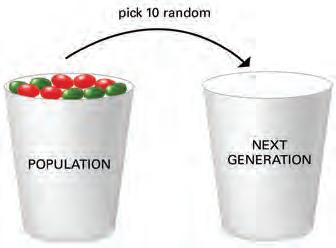
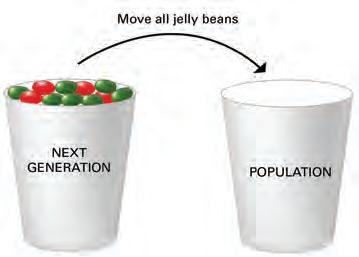
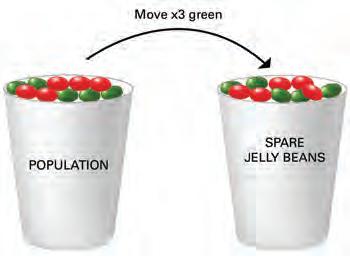
Results for Part 1: genetic drift and Part 2: natural selection
Table showing number of alleles in generation 1 for genetic drift and natural selection
Method for Part 3: gene flow
11. Copy the results table into your science book.
12. Start with 10 red jelly beans and 10 green jelly beans and place them in your 'Population' cup. Record this in your results table.
13. Add 5 blue jelly beans into the 'Population' cup.
14. Repeat steps 3–6 of the method for genetic drift until you have 10 rows of data or until two colours are eliminated.
Results for Part 3: gene flow
Table showing number of alleles in generation 1 for gene flow
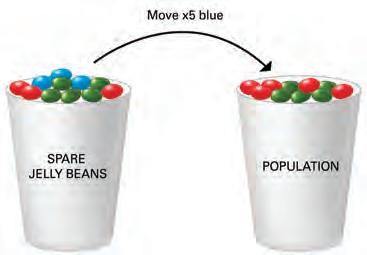
3.17 Part 3, Step 3
(before migration)
Discussion: Analysis
1. Plot your results on a graph. There should be one graph each for the genetic drift, natural selection and gene flow simulations.
2. Describe what happened in each case. How do the results compare to what you would expect for each process?
3. Did your results show any colour becoming extinct in your population?
4. Compare your results for genetic drift with those of another classmate or group. Account for any contradicting trends in the results.
5. Propose what step 6 could represent in the genetic drift simulation.
6. Propose what step 10 could represent in the natural selection simulation.
7. Propose what step 13 represents in the gene flow simulation.
8. Imagine that the introduced blue allele also had a selective advantage in the gene flow simulation. How would you simulate this scenario?
9. Imagine that there was a mutation in one of the jelly beans that turned it orange. How could this affect future generations?
10. What assumptions have we made about the red, green and blue alleles in this simulation?
Discussion: Evaluation
11. Can reliable conclusions and predictions be drawn from the results? Justify your answer.
12. List some limitations of this simulation compared to what happens in real life. Justify your response.
13. What are some ways the simulations can be improved?
Conclusion
1. Make a claim about how genetic drift, natural selection and gene flow affect each population of jelly beans.
2. Support your statement using the data you gathered, and include potential sources of error.
3. Explain how the data support your statement.
biodiversity the variety of life on Earth, including the diversity of species, the genetic differences within a species and the ecosystems where species are found
species diversity
the number and abundance of different species in a given area
genetic diversity
the number of different alleles of genes in a population
ecosystem diversity
the variation in ecosystems in a given area
Biodiversity (biological diversity) refers to the variety of life on Earth. It includes species diversity (the number of different species within an ecosystem), genetic diversity (the number of different alleles of genes in a population) and ecosystem diversity (the variation in ecosystems in a given area). Over time, populations within a species can become so different that they become different species, increasing biodiversity. Thus, evolutionary processes have resulted in the biodiversity we see today.
Australia's unique biodiversity is best explained by isolation. Australia was once part of a supercontinent called Gondwana that even earlier was the southern part of a giant land mass called Pangaea. Gondwana was made up of the continents and countries that we know today as South America, Africa, Australia, India and Antarctica. Gondwana is thought to have begun breaking up approximately 140 million years ago. As a result, our plants and animals have been isolated over a long period of time from the plants and animals of other continents and land masses.
As the continents moved across the surface of Earth, so too did their assemblages of plants and animals. This not only created geographical barriers (like oceans, mountain ranges and large rivers), but over time it also brought new combinations of species together.
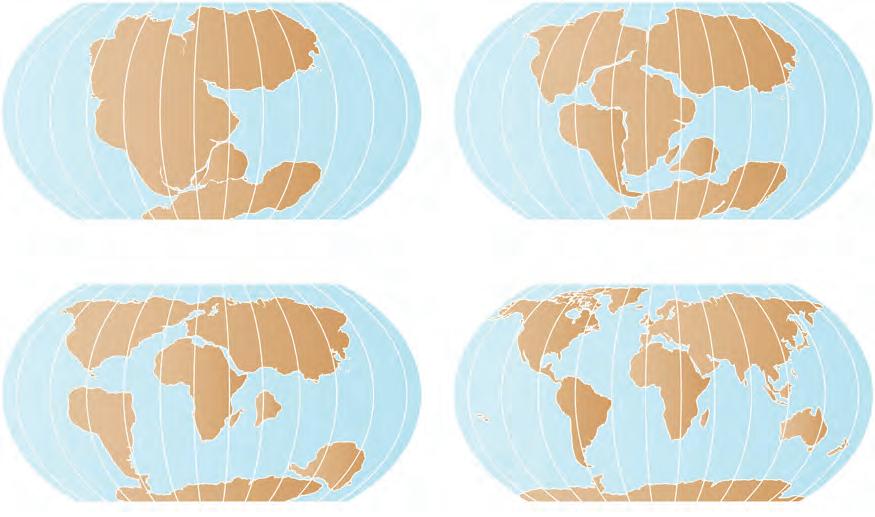
Quick check 3.2
1. State what is meant by the term 'biodiversity'.
2. Recall what supercontinent Australia was once part of.
3. Explain how the movement of continents led to increased species diversity.
Our understanding of the origin of life on Earth is based upon the scientific evidence of the fossil record and genetic comparisons to modern life forms. Earth is approximately 4.5 billion years old, and the most primitive cells first developed some 3.5 billion years ago.
Although life appeared early in Earth's history, evolution beyond the simple cell stage did not occur until much later – approximately 600 million years ago. Since then, the biodiversity that exists on Earth has fluctuated depending on changes in the environment. Figure 3.19 shows a timeline of the major stages in the development of life on Earth.
Biodiversity has been affected by five mass extinction periods. In mass extinctions, a huge number of Earth's species die off over a short period of geological time. One of the best-known causes of a mass extinction is an asteroid impact that may have killed off the dinosaurs. An asteroid is suspected to be involved in just one case of mass extinction, but volcanic activity has been implicated in at least four. Here are some hypothesised causes for the biggest mass extinctions on Earth:
• volcanic activity
• climate change
• changes in deep-ocean oxygen levels
• changes in sea level.
A combination of the above causes may have contributed to mass extinctions, which caused major and rapid changes in Earth's biota. If there is sufficient genetic variation in a species when an environmental change occurs, such as when there is a volcanic eruption, some organisms within a population will be better suited to that new environment than others. The survival of the better-adapted individuals will result in a change in the genetic composition of the species' population, resulting in its evolution over time.
endemism a state of being confined to a small defined geographic location
megafauna large animals with a body mass over 45 kilograms fossil record the record of past life and evolution inferred from fossils

3.20 Eastern Australia is littered with the remnants of hundreds of volcanoes. The region was affected by repeated volcanic super eruptions between 252 and 256 million years ago. (a) Evidence of this can be seen in light-coloured layers of volcanic ash in sedimentary rock. There is also evidence that large areas of forest disappeared and many species of animals became extinct after the supervolcanoes erupted, contributing to the global Permian–Triassic mass extinction. (b) Mount Napier is Victoria's most recently active volcano.
Australia's biodiversity is rich and unique; estimates suggest that between 7% and 10% of all species on Earth are found here. This unique biodiversity developed in isolation over millions of years, producing a high level of endemism. This means many species found in Australia are unique to the region and are not naturally found anywhere else in the world. This high level of endemism is attributed to Australia's geographical isolation and long evolutionary history, which allowed the development of species adapted to the specific Australian environment. Australia's biodiversity is also influenced by its unique environmental conditions, which include high fire frequency, nutrient-poor soils, climatic variability and a relatively flat landscape.
Australia's landscape has undergone significant transformations over tens of thousands of years, shaped by a combination of natural events, ecological processes, and human interactions. Humans, both Aboriginal and Torres Strait Islander Peoples and later, Europeans, have affected Australia's biodiversity. The current scientific understanding is that it is likely that the initial Aboriginal and Torres Strait Islander people arrived in Australia via South-East Asia when ocean levels were lower and there were more land bridge connections between land masses. Scientists have found evidence that Aboriginal and Torres Strait Islander people have lived on the Australian continent for at least 65 000 years. Early sustainable land management practices carried out by Aboriginal and Torres Strait Islander people, such as fire management (often referred to as fire-stick farming), played a key role in promoting biodiversity and managing ecosystems. However, the arrival of European colonisation introduced widespread habitat destruction, invasive species and unsustainable practices that drastically altered the environment and the ability of Aboriginal and Torres Strait Islander people to live in mutually sustainable ways with the environment.
The continent was once home to megafauna, which were large land animals that evolved millions of years after the dinosaurs became extinct. In Australia, they included:
• Palorchestes azael, shown in figure 3.21a, a marsupial about the size of a horse;
• Diprotodon optatum, shown in figure 3.21b, the largest marsupial ever to have lived, with a shoulder height of 1.8 metres and weighing close to 3 tonnes;
• Thylacoleo carnifex, a 1.5-metre-long marsupial lion; and
• Wonambi naracoortensis, a 50-kilogram, 5-metre-long snake.
The fossil record and rock art created by Aboriginal people suggest that these species coexisted with Aboriginal and Torres Strait Islander people for tens of thousands of years. The cause of megafauna extinction is unconfirmed but is thought to have resulted from a combination of factors, including climate change, shifting ecosystems, possible overhunting and changing water and vegetation availability.
Research indicates that increasing aridity, more frequent fires and reduced water sources may have significantly impacted megafaunal habitats and diets, contributing to their decline. Analysis of fossilised teeth has found that climate change had a significant impact on megafaunal diets. These changes highlight the complex interactions between climate, ecosystems, and human practices in shaping the Australian environment over millennia.
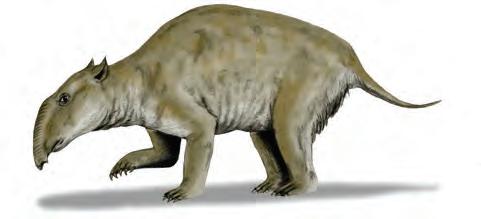
a b
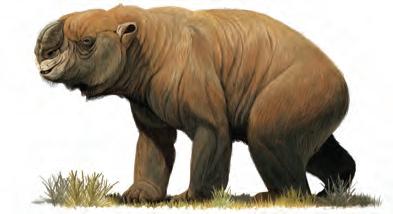
Maintaining biodiversity is extremely important. A reduction in biodiversity can have huge impacts on ecosystems and result in loss of species that are beneficial to other species, including humans. Maintaining diversity means keeping a full range of species in ecosystems in order to conserve the variety of organisms on Earth. Species are considered endangered if they meet the criteria set by the International Union for Conservation of Nature (IUCN). These include species whose numbers have experienced a reduction of 70% in a decade and species with fewer than 250 mature individuals living in a single population.
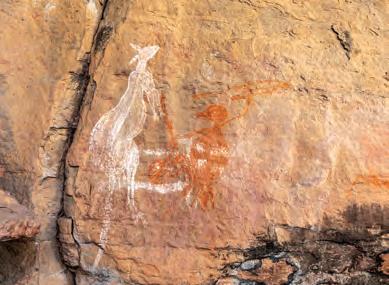
Endangered species are at risk of becoming extinct, especially if there is not enough genetic variation in the population. However, species can be at risk even if their population is large. Changes in the environment that may cause extinction include new diseases, new predators, competition with a better-adapted species and loss of habitat.
thinking visible 3.2
Tug for truth: The Pleistocene megafaunal
There is an ongoing debate as to whether humans or climate change caused the extinction of megafauna during the Pleistocene epoch, with evidence supporting both sides of the debate.
1. Based on the information in this chapter, do you have an opinion about the cause of the extinction of megafauna?

Imagine that you were engaged in a tug-of-war, where each side of the rope represented the cause of megafauna extinction, human or climate change.
Evidence can be found for both sides of the debate, which acts as a tug on the rope.
2. Complete research to find evidence for each side of the debate. Write down the source of each piece of evidence. Ensure the evidence you use is from credible, respectful sources that do not perpetuate stereotypes or bias against Aboriginal and Torres Strait Islander Peoples.
3. After you complete your research, reflect on whether your opinion on the debate has changed.
The Tug for truth thinking routine was deleveloped by Project Zero, a research centre at the Harvard Graduate School of Education.
There are ways that humans can help to maintain biodiversity. In situ protection occurs within an animal's or plant's natural habitat, such as in conservation reserves. Ex situ conservation occurs outside the natural habitat, such as in zoos or seed banks. Many zoos have captive breeding programs in which they breed animals to help the survival of endangered species. Such programs aim to reintroduce the species back into the wild, which would aid in keeping population numbers up and limiting inbreeding.
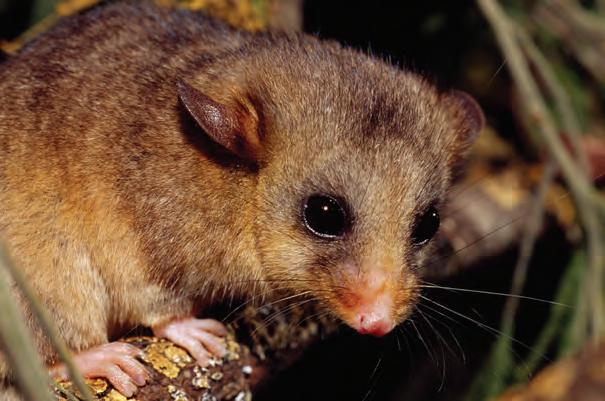
3.23 With less than 2000 mountain pygmy possums left in the wild, they are considered critically endangered. They are Australia's only hibernating marsupial, found in three locations: the Bogong High Plains and Mt Buller in Victoria, and Mt
involved in recovery efforts since 2006, with a breeding population in Healesville Sanctuary.
Conservation of Australian species
Australia has the fourth-highest level of species extinctions in the world and is in the top three for critically endangered animals. Since 2016, 202 animal and plant species have been listed as threatened, including the regent honeyeater, northern quoll and the black-flanked rock wallaby. Conduct some research to answer the following questions.
1. Choose an endangered Australian species and research conservation efforts put into place for the species. These may include education programs, captive breeding, legal protection of habitats and ecosystems created artificially.
2. Many of today's species have survived by adapting where other species, less well adapted, died out. Do you think we should try to protect endangered species to preserve biodiversity? Why?
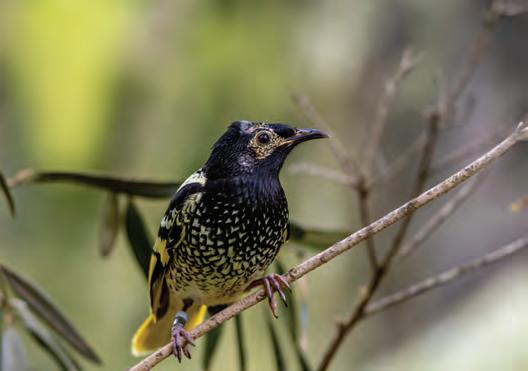
1. Define the terms 'biodiversity', 'endangered' and 'extinct'.
2. Explain the link between biodiversity and evolution.
3. Name one change in the environment that may lead to the extinction of a species.
4. Discuss how humans have affected biodiversity and therefore evolution.
Connect, extend, challenge: Cat curfew Australia has the highest mammal extinction rate in the world: 34 mammal species have disappeared since European settlement. Introduced predators, particularly feral cats and the European red fox, have caused most of these extinctions. Extinctions have been particularly high in arid and semi-arid regions. One report found that every year each individual feral cat in Australia kills 390 mammals, 225 reptiles and 130 birds. Combined with those killed by domestic cats, over two billion native animals are killed by cats each year in Australia.
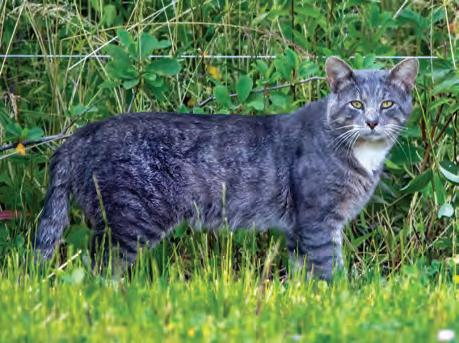
In many Australian local council areas, cat owners must now keep their pets on their own land. In some areas, there is a curfew so cats are not allowed outside after dark; in other areas, cats are not allowed outside at all.
After reading about mammal extinctions in Australia, reflect on the following:
1. How do the concepts and details connect to your existing knowledge?
2. Which new insights did you gain from the text that expanded your understanding or encouraged you to consider new perspectives?
3. What questions arise for you after processing this information?
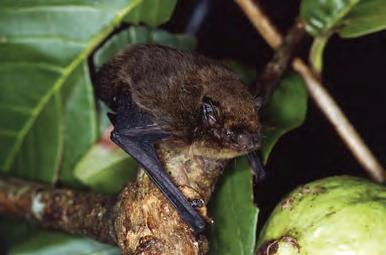
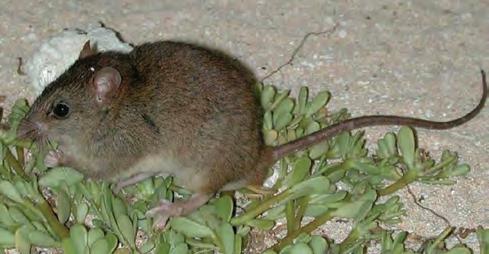
Section 3.1 review
Section 3.1 questions
Remembering
1. Define the terms 'evolution' and 'population'.
2. Name one extinct Australian species.
3. Name one species deemed critically endangered within Australia.
4. Define the term 'variation' and give four different examples of variation within a species not provided in the text.
5. Recall where variation in a population comes from.
Understanding
6. Explain how mutations contribute to variation within a species and, consequently, evolution.
7. Explain how gene flow can contribute to a change in the allele frequency of a population.
8. Summarise how a change of only one nucleotide in DNA can result in a different phenotype and eventually cause evolution.
Applying
9. Identify an example of variation within a species that:
a) increases an individual's chances of survival
b) decreases the species' chance of survival
c) does not affect the species' chance of survival.
10. Explain how mass extinctions can stimulate new biodiversity among species.
Analysing
11. Distinguish between species diversity and genetic diversity.
12. Distinguish between extinct species and endangered species.
Evaluating
13. Discuss why genetic biodiversity is important for the survival of a species.
14. In Earth's past, some species have been wiped out after an environmental change. Decide if this suggests the species had low or high genetic biodiversity and give reasons why this would occur. Online quiz Teachers can assign tasks and track results

At the end of this section, I will be able to:
1. Recall the steps in the process of natural selection.
2. Outline the factors that lead to speciation.
3. Describe some examples of artificial selection.
In section 3.1, you read that there are five drivers of evolution: mutation, gene flow, genetic drift, natural selection and sexual reproduction. In this section, natural selection will be considered in more detail.
In 1831, at the age of 22, the naturalist Charles Darwin set out on a five-year voyage around the world to study and collect animal, plant and rock specimens. He visited the remote Galápagos Islands off the coast of Ecuador and recorded the plant and animal species of the islands.
Initially, Darwin took little interest in his collection of finches from the islands, but this changed when the eminent ornithologist John Gould classified them as 12 new species. Gould had noticed that they showed great variation in their beaks. It was his observations that helped Darwin develop his theory of evolution.
Darwin speculated that although the different islands had similar animals and plants, many species seemed to have specialised features that were particularly suited to their local environments. For example, the different finch species had beaks suited to eating the food source that was available in the habitat they occupied on their island. Darwin explained how species change over time, using the theory we know today as 'natural selection'.

Figure 3.27 The Galápagos Islands, 1000 km off the coast of Ecuador, are home to many plant and animal species found nowhere else in the world. Many of these species observed by Charles Darwin inspired his theory of evolution.
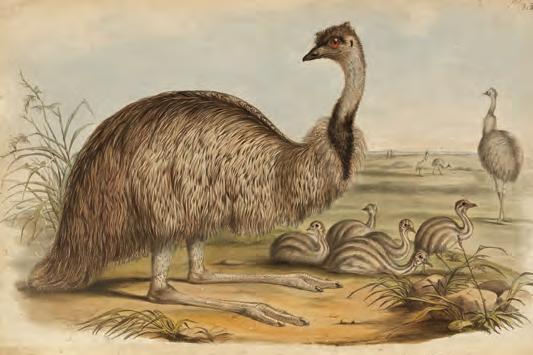
Figure 3.28 John Gould published the first comprehensive survey of birds in Australia. He was accompanied by his wife, Elizabeth Gould, who was a talented ornithologist and illustrator in her own right. This image was taken from his book The Birds of Australia, which was published from 1840 to 1848 in seven volumes.
Natural selection occurs when an environmental factor acts on the phenotype. That is, some individuals in the population are different from others and those differences provide an advantage or disadvantage for survival and reproduction. The following steps outline the process of evolution through natural selection:
1. Variation
Genetic variation naturally exists in the population due to processes such as sexual reproduction, genetic drift, mutation and gene flow.
2. Differential survival
Genetic variation means that some individuals within the population have traits better suited to their environment and are more likely to survive. These individuals are said to have been selected for.
3. Heritability
Individuals with favourable traits are more likely to survive to reproductive age and reproduce more than others of their species, and thus pass on those advantageous traits to the next generation. Those favourable traits are said to be 'selected for' by environmental (or selection) pressures.
4. Change over time
Over time, individuals with the favourable traits become more numerous in the population, increasing the frequency of the advantageous allele.
An example is the case of the light and dark peppered moths (Biston betularia) in Britain. There are two variations within the one species – one is light coloured, the other is dark coloured – and the colour is genetically determined. Look at the moths in Figure 3.29 – the light-coloured variety of the peppered moth initially had the favourable trait (selective advantage) as it blended well with the lighter lichen-covered bark of the trees. This meant that a hungry bird (the selecting agent) would be more likely to see the dark-coloured moths and eat them more often. Consequently, dark-coloured moths were rare. Light-coloured moths were better adapted to survive and reproduce, so they were able to pass on their genetic information to the next generation. This meant that the allele frequency for light colouring increased over time and decreased for dark colouring.
However, during the Industrial Revolution, pollution darkened the bark of trees. This gave the dark-coloured moths a selective advantage, as they were now better camouflaged against the trees and not as easily spotted by predators. Now the roles were reversed: light-coloured moths were at a disadvantage and their numbers fell. The darker moth was 'selected for' and so was able to survive, reproduce and pass on its genetic information to the next generation. The proportion of dark moths, along with the allele frequency for dark colouring, rose. Interestingly, cleaner air in recent decades has seen the light-coloured moths favoured once again. This example also illustrates why genetic variation enables species to survive and adapt to new circumstances.

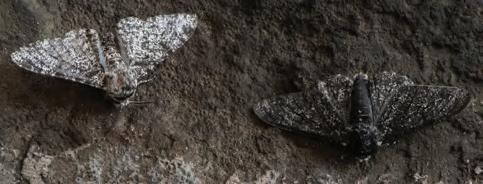
Explore! 3.2
In the nineteenth and early twentieth centuries, there were harmful misconceptions about Aboriginal and Torres Strait Islander Peoples that were considered 'scientific' at the time. These misconceptions included the idea that Aboriginal and Torres Strait Islander Peoples were an inferior race, destined for extinction. These ideas are now known to be false and have been unequivocally rejected by modern science. It is also important to note that these views were, and still are, deeply racist, and were designed and used to justify oppressive policies, dispossession and violent acts of genocide. Aboriginal and Torres Strait Islander Peoples are recognised as the custodians of the world's oldest continuous cultures, with complex knowledge systems, sophisticated social structures, and enduring resilience despite centuries of colonisation and systemic harm.
Use you preferred search engine to research how misconceptions in the nineteenth and early twentieth centuries were used to justify racist and oppressive policies against Aboriginal and Torres Strait Islander Peoples. What were these policies? What does this tell us about the relationship between science and society? Ensure you carefully evaluate your sources to ensure they are free from bias and racism. Ask your teacher for further guidance on evaluating sources about Aboriginal and Torres Strait Islander Peoples.
1. Recall where Charles Darwin collected his finch specimens.
Those organisms best suited to the pressures of their environment are more likely than others to survive, reproduce and pass on their genetic information to the next generation. We call these pressures selection pressures because they determine which variations provide individuals with better chance of survival. Selection pressures refer to the factors that exert an influence on the fitness and reproductive success of individuals within a population. These pressures can be natural, such as predation, competition for resources, or climate conditions, or they can be anthropogenic, including human activities like habitat destruction or pollution. Selection pressures act as the driving forces behind natural selection, shaping the survival and reproductive outcomes of individuals based on their traits and adaptations.
2. Create a flow chart of the four steps involved in the process of evolution by natural selection. Then annotate your flow chart to show how each step relates to the peppered moth example. selection pressure a factor that affects the relative fitness or reproductive success of individuals within a population, leading to natural selection and potential changes in allele frequencies over time
Selective agents are specific factors or agents that directly cause the selection pressure. Selective agents are often associated with specific traits or features of the environment that directly impact an organism's survival or reproductive success. For example, a selective agent could be a particular predator species that preys on individuals with certain characteristics, leading to the selection for traits that enhance evasion or defence against that predator. Individuals that are unable to camouflage well or hide from a predator, for example, would be selected against.
Selection pressures can increase or decrease the occurrence of a trait in a population. Selection pressures are not static and may change with time or with changes in the environment.
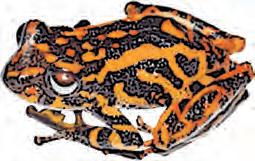
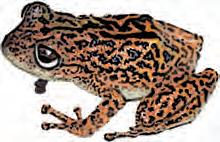
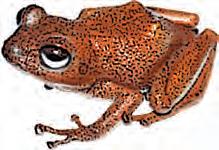
Figure 3.30 Variations of adult males of the frog species Pristimantis leopardus may experience different levels of reproductive success due to the selective pressures exerted by predation, competition for mates, and environmental conditions, thereby driving natural selection.
Predators Natural disasters
Resource availability (e.g. water, shelter, nutrients)
Disease
Waste accumulation
Abiotic factors (e.g. CO2 concentration, temperature)
Table 3.2 Selection pressures can be either density-independent or density-dependent. Density-independent pressures are typically abiotic factors (such as natural disasters or climate events that affect populations regardless of their size). Density-dependent pressures are often biotic factors (such as predation or competition for resources), which vary in impact depending on the population's size or density.
Sickle cell anaemia is a genetic disorder in humans caused by a mutation in the haemoglobin gene, leading to abnormally shaped red blood cells that can block blood flow to parts of the body and cause severe complications such as pain, anaemia, swelling in the hands and feet, increased susceptibility to bacterial infections and stroke. However, this mutation provides a selective advantage in regions with high malaria prevalence, such as sub-Saharan Africa, Latin America and the Caribbean. The incidence of sickle cell trait ranges from 20% to 30% in areas such as the Democratic Republic of the Congo, Ghana, and Nigeria. In some parts of Uganda, the prevalence has been reported to be as high as 45%. Individuals with one sickle cell allele (heterozygotes) produce both normal and sickle-shaped red blood cells. These people are generally unaffected by the disease and live symptom-free but can pass the trait on to offspring. Carrying the sickle cell allele increases resistance to malaria and survival rates in heterozygous individuals.
Research the following questions.
1. How do humans become infected with malaria?
2. How does the sickle cell trait confer resistance to malaria?
3. What is the correlation between the distribution of the mutated gene and the distribution of malaria in sub-Saharan Africa?
4. Why is the sickle cell trait considered harmful in non-malarial zones but beneficial in a malarial zone?
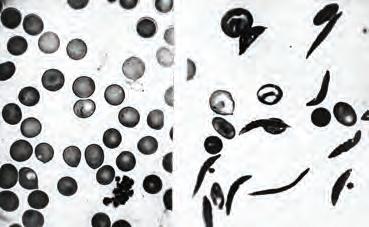
Antibiotics are medicines used to prevent and treat bacterial infections. However, some bacteria have mutations that make them resistant to the effects of the drugs. The World Health Organization has identified antibiotic resistance as one of the greatest threats to human health today, potentially causing up to 10 million deaths per year by 2050 if not overcome.
Some researchers are studying traditional bush medicines that have been used by Aboriginal and Torres Strait Islander Peoples for generations as alternatives to pharmaceutical antibiotics.

Plants such as tea tree (Melaleuca alternifolia) and emu bush (Eremophila species) have been found to be as effective as some established antibiotics and may provide a solution for the current resistance crisis.
Consider the following diagram carefully and then answer the questions that follow.
Resistant bacteria
Population of mainly susceptible bacteria
Subsequent generations of the population of now mainly resistant bacteria
1. What variation between bacteria can you see in the original population?
2. Which variation is selected for (the fittest)? Which is selected against?
3. Which variation will contribute less to the next generation?
4. Which variation will survive in greater numbers to reproduce and pass on its genetic information to the next generation?
5. Identify the selecting agent.
Traditional medicines used by Aboriginal and Torres Strait Islander Peoples represent sophisticated knowledge systems developed over tens of thousands of years. These medicines, derived from careful observation, experimentation, and an intimate connection to the land, have been passed down through generations and remain a vital part of many communities' healthcare practices.
Today, researchers are working alongside Aboriginal and Torres Strait Islander communities to better understand the medicinal properties of these plants and develop pharmaceuticals based on traditional knowledge. It is essential to recognise and respect the leadership role of Aboriginal and Torres Strait Islander Peoples in these processes. Historically, their knowledge has been exploited, with little acknowledgment or benefit returned to the communities. Contemporary practices increasingly strive for ethical partnerships, ensuring that Traditional Owners are equal collaborators in research and benefit equally from any developments. For example, a dual patent was granted to Griffith University and the Jarlmadangah Burru Aboriginal Corporation for pain-relieving compounds derived from the marjala plant. This collaboration began after John Watson, a Jarlmadangah Burru Elder, used the bark of the marjala plant to effectively relieve pain. His empirical ancestral knowledge, combined with scientific inquiry, led to significant discoveries and reinforced the value of respecting and collaborating with Traditional Owners. Respecting the origins and custodians of this knowledge is critical to fostering ethical and inclusive practices in medicine and science in Australia.
Conduct some research into at least one of the plants used in the Aboriginal and Torres Strait Islander pharmacopoeia and shown in Figure 3.33 to find out:
• what ailment it treats
• which part (or parts) of the plant is used
• how it is processed
• if there is ongoing research into its potential applications in modern medicine.


Practical 3.2
Aim
To model a beetle population to simulate natural selection and some of its consequences
Prior understanding
Let us make the following assumptions about a beetle population:
• The original population of 30 beetles consists of 10 red, 10 yellow and 10 green.
• Each year the beetles mate once at random, and each pair produces one offspring (30 beetles produce 15 offspring, increasing the total population to 45 beetles).
• The colour of the offspring is determined by these rules: Table showing the proportions of different coloured beetles over two generations
Parent colour
Offspring
• After the beetles have produced their offspring, a predator kills a third of the total population (15 beetles) each year. Therefore, the population of beetles returns to 30 at the beginning of each breeding season.
• On average, the colour ratio of beetles lost to predation is: 3 red : 2 green : 1 yellow (this ratio is reflected in the coloured sides of the die).
• Other than the deaths caused by the predator mentioned, there will be no further deaths or migration.
Materials
• small circular coloured stickers (three red, two green, one yellow) that are added to the sides of a die
• 60 coloured cards (20 red, 20 green and 20 yellow)
Method
1. Copy the results table into your science book.
2. To create your original population of 30 beetles, take 10 red, 10 yellow and 10 green cards.
3. Shuffle these 30 cards to model the process of random mating and deal them out into 15 pairs.
4. Using the rules from the table, determine the colour of the offspring for each of the 15 pairs.
5. Take a beetle card that represents the colour produced for each of the 15 offspring and add them to the population, creating an overall population size of 45.
6. Due to predation, 15 beetles will die and be removed each year. This will be modelled by rolling the coloured die on 15 different occasions and removing the corresponding beetle colour from the population each time. If the die lands on a particular colour of beetle that has disappeared altogether from the population, roll it again.
7. After one year of mating and predation, complete column for year 1 in the results table, showing the total number of red, green and yellow beetles that remain in the population of 30.
8. Repeat the process of mating and predation by repeating steps 3–7 for as many trials as possible (up to a maximum of 10 trials, modelling 10 years).
Results
Record the total number of red, yellow and green beetles at the end of each year in the results table.
Table showing occurrence of different coloured beetles in the modelled population each year
Discussion: Analysis
1. Within the population of beetles you created, identify the phenotypic trait that was observed, and its variations.
2. Explain the crucial role that variation plays in natural selection.
3. Based on your observations, did any beetle colour give a greater chance of survival than other colours in the population? Explain your answer using the data from your results table.
4. Describe how the process of natural selection relates to genetics.
5. Was there any evidence of natural selection taking place in your population of beetles? Refer to your results in your answer.
6. Did your results show any coloured beetle becoming extinct in your population over the generations?
7. a) Think of another possible ratio of a beetle predation according to colour that differs from the 3 red : 2 green : 1 yellow used in this experiment.
b) Using the predation ratio of beetles you provided in part a, write a hypothesis for this experiment.
8. Another group of students obtained a beetle population of 10 red : 10 green : 10 yellow after completing the same experiment and modelling the same mating and predation rules for 10 trials. What possible explanation could be given for these results?
Discussion: Evaluation
1. Compare the results between different student groups.
2. Can reliable conclusions and predictions be drawn from the results? Justify your response.
3. Can you identify possible limitations of this method when applied to a real-life scenario? Justify your response.
4. Suggest any changes that could be made to the method to improve the quality of the data in future experiments. Justify your suggestions by explaining how each change will improve the data quality.
Conclusion
1. Make a claim about how natural selection affected the allele frequency in your beetle population.
2. Support your statement using the data you gathered, and include potential sources of error.
3. Explain how the data support your statement.
speciation the process by which populations evolve to become distinct species species a group of organisms consisting of similar individuals that can breed with one another fertile able to reproduce viable able to survive
1. Variation is essential for the process of natural selection to occur. Explain what 'variation' means, including where it comes from in a population.
2. Define the term 'selection pressure' and describe how it contributes to natural selection.
Sometimes, natural selection can lead to a new species forming, which is called speciation. For this to occur, there needs to be one extra step in the process of natural selection: isolation.
A species is often described as a group of organisms that are phenotypically and genetically similar and are capable of breeding with each other to produce fertile and viable offspring. However, there are at least 26 recognised ways to define a species!
For example, the offspring of a male and female horse will be a horse that is able to mate and produce offspring with another horse. However, the offspring of a female horse and a male donkey is a mule. A mule is infertile, which means it is unable to produce offspring. This is evidence that horses and donkeys are two different species: they cannot produce fertile offspring.
Hybrids are usually sterile because they either have an extra chromosome that prevents the usual meiosis process, or the chromosomes are incompatible, which means that viable gametes are not produced. However, this is not always the case. A few female hybrids have successfully bred with individuals in the original parent population.
An essential feature in speciation is isolation of populations from one another to prevent gene flow. Isolation is not required for natural selection but is necessary for speciation. Isolation may be caused by a geographical or physical barrier (for example, a large river, a desert or mountain range) or even a natural disaster like a fire, flood or volcanic eruption. The consequence is that the original population is divided into two populations, not necessarily the same size. The two populations are reproductively isolated from one another. That is, there is no gene flow between them.
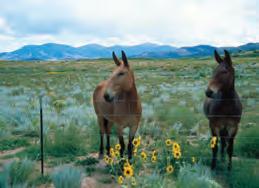
The isolated populations may now be exposed to different selection pressures; for example, one environment may be cooler than the other. Those organisms best suited to their environment will survive to reproductive age, reproduce and pass on their genetic information to the next generation. This will increase the frequency of the trait in the population. On the cold side of the mountain, individuals with thicker fur will be selected for, while on the sunny side of the mountain, those with a thinner coat will be selected for.

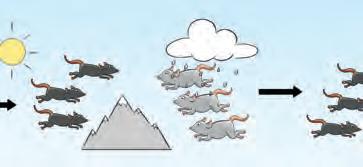
Different selection pressures on the two populations, favouring different phenotypes

Populations come together but can no longer interbreed. They are two different species.

Over time, the accumulation of random mutations and the different selection pressures on the two populations will change the genetic composition of the two populations in different ways. Eventually, enough differences may accumulate between the two populations that individuals cannot breed with one another to produce fertile and viable offspring. The two populations are now reproductively isolated and are two separate species.
Science as a human endeavour 3.1
Did you know there are 16 species of rockwallaby? Since they are different species, they cannot reproduce to create viable and fertile offspring. However, scientists recently found that gene flow somehow occurs between them, meaning that despite being different species with different numbers of chromosomes, they can interbreed. Scientists now know that their evolution is a lot more complex than previously thought, and the way that new species form may need to be further investigated.
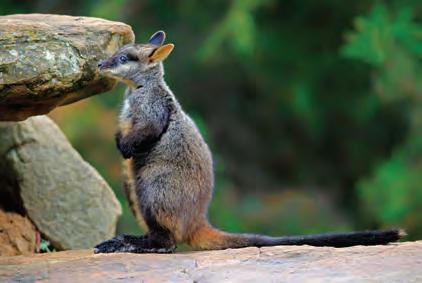
reproductive isolation when members of two related populations can no longer breed
Quick check 3.6
1. Define the term 'species'.
2. Speciation can occur as a consequence of natural selection with one additional step. Recall what must also occur and its role in speciation.
3. Describe how you could determine if two populations are the same species.
Try this 3.3
Speciation story time
With a classmate, take turns telling stories of speciation. You may like to use the images below as inspiration. To tell a story of speciation, use all the scientific terms you have learned that relate to natural selection and speciation. Begin by talking about the possible variation that naturally exists in your organism's population, then a possible geographical barrier that could divide and isolate the population, finishing up with the process of selection and how this leads to the creation of a new species.
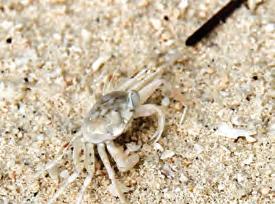
Artificial selection is selection that does not happen naturally but is directed by humans. In other words, humans choose the characteristics they want passed on to the next generation and breed organisms with those traits. Thus, humans, not the environment, select who reproduces. For example, a farmer wants her cows to produce lots of milk, so she selectively breeds the best milk-producing cows and prevents the poorer producers from mating. Artificial selection is also called selective breeding, and humans have been using these techniques for thousands of years. Can you think of any other examples?
3.38 Since 1900, 76% of genetic diversity in agricultural crops has been lost, but there is renewed interest in heirloom or heritage crops. Heritage apples are those that were grown before World War II. Some still remain, but many have been lost after commercial orchards that grow massproduced apples such as pink lady, Granny Smith and gala became more popular. New varieties of apples are constantly being developed to bring novelty to the apple industry. One example is the yello, a cross between a golden delicious apple and a heritage apple from Japan called senshu
Artificial selection is certainly beneficial for humans, but this manipulation typically reduces biodiversity and alters the course of evolution. The outcome is often a population that is genetically very similar and has low variation. For example, there is a worldwide decline in agricultural crop diversity. A 2021 WWF report found that 75% of the food that humans eat comes from just twelve plant sources and five animal sources. Of the plants, just three crops make up 60% of the plant-derived calories in the human diet.
These crops are artificially selected for their production values, but what are the chances of the crop population surviving if it is exposed to a change in environment or a new disease? Reduced variation in the population may mean the crop is more susceptible to threats like these.
To assist human reproduction today, we use many reproductive technologies that involve artificially selecting the genetic information that is passed to the next generation. In this way, humans are affecting their own genetic diversity and consequently affecting our own evolution. For example, in vitro fertilisation (IVF) involves selecting viable sperm and combining them with eggs in a Petri dish. After fertilisation, the healthiest embryo is selected for development and the remainder are frozen.
Medical technology lets us genetically test embryos prior to their implantation and also genetically screen babies. Decisions made on the basis of information gained by using these technologies can change the genetic composition of the human population in the next generation. Evolution takes an extremely long time, so the results of our actions will not be seen for thousands of years.
Did you know? 3.3
Broccoli and kale are the same
Did you know that broccoli, kale, cabbage, Brussels sprouts, cauliflower and gai lan are just some of the variations of the plant species Brassica oleracea? Each variation is called a 'cultivar', which is a plant variety produced by selective breeding.


All domestic dogs belong to one species, Canis familiaris, so how can they appear so different? Go online to research the following topics.
1. Choose one dog breed and identify its unique characteristics.
2. Critique some of the ethical considerations involved in breeding a dog for a particular characteristic that may be detrimental for its health. For example, the cocker spaniel's long floppy ears make it particularly susceptible to ear infections. The pug's wrinkled face is susceptible to infections resulting from dead skin cells and moisture being trapped in the folds of skin.


Designer babies are those whose genetic make-up has been intentionally modified or selected to possess specific traits. The development of technology such as IVF and pre-implantation genetic screening has made this possible. This is useful for couples when one or both parents carry a heritable disease. The embryos can be screened for the genetic disorder prior to implantation, and only healthy embryos are implanted. DNA manipulation technology has advanced to the point where it is possible to directly edit the genome of an embryo before implantation, although this is illegal in many countries.
Complete the Compass Points activity about the creation of designer babies:
1. E = Enthusiastic
What generates enthusiasm within you regarding this concept? What are the potential benefits?
2. W = Worries
What causes concern about this technology? What are the potential drawbacks?
3. N = Need for information
What other details or facts are necessary to evaluate this technology? What additional knowledge would aid in assessment?
4. S = Suggestion for progress
What is your current viewpoint or proposal regarding this technology? How can you continue to assess this concept?
The Compass points thinking routine was developed by Project Zero, a research centre at the Harvard Graduate School of Education.
Desirable traits can also be acquired using gene technology, rather than relying on selective breeding. Gene technology lets us transfer genes from one individual or species to another. Gene therapy allows faulty genes found in an organism to be replaced by the normally functioning gene.
Genetically modified organisms (GMOs) are produced when an organism has its DNA altered or modified using genetic engineering.


3.42 The process of IVF artificially selects the eggs, sperm and embryos that have the best chance of survival.
Consider how gene therapy could change the biodiversity of the human population. Would there be more or less variation? And what would this mean for the process of evolution? What about GMOs? Genetically engineered cotton crops (Bacillus thuringiensis cotton, or 'Bt cotton' for short) were created to produce an insecticide to combat bollworm. GM cotton was first grown in Australia in 1996, and now over 99.5% of cotton grown in the country is genetically modified. What effects could GMOs have on biodiversity and evolution? What ethical considerations would need to be raised?

3.43 Worldwide, bollworms cause millions of dollars worth of damage a year to crops such as cotton and vegetables.
Some scientists have argued that civilisation has ended natural selection in humans. To a large degree, the selection pressures of the past (such as predation) no longer affect us in the same way. Humans modify their surroundings to survive in a wide range of environmental conditions, and vaccines and antibiotics help us to address disease.
However, there have been evolutionary changes since the earliest civilisations. As diets changed to include grains and dairy, genes that coded for enzymes to digest starch and lactose were selected for. People now live in densely populated regions, which could allow the rapid spread of disease but also have mutations that code for disease resistance.
Today, evolution has become less about survival and more about reproduction. Some scientists have suggested that this greater focus on reproductive success might increase selection for attractiveness. And humans might also become more uniform in appearance as travel leads to mixing of populations and easy access to worldwide media may create a set standard of beauty.
Scientists have suggested that the following changes may take place in humans over the next 10 000 years. Complete some research and discuss why future humans may have:
• longer lifespans
• taller stature
• lighter, less-dense skeletons
• reduced muscle, especially in the upper body
• smaller jaws
• fewer wisdom teeth
• smaller brains
• less aggressive behaviour.
Quick check 3.7
1. Define the term 'artificial selection' and provide an example.
2. Contrast natural selection and artificial selection.
3. Discuss whether artificial selection increases or decreases variation and therefore biodiversity.
4. Explain how reproductive technologies can affect human biodiversity.
Section 3.2 review
Go online
Section 3.2 questions
Remembering
1. Recall the key processes involved in natural selection.
2. Identify geographical barriers that could divide a bird population, an eel population and a mammal population.
3. State the different sources of variation in an individual and in a population.
4. Identify three examples of abiotic selection pressures and three examples of biotic selection pressures.
5. Name some different ways that technology can affect the biodiversity of the human population.
Understanding
6. Describe what is meant by the term 'selective advantage'.
7. Summarise the three processes in speciation.
8. Explain why variation is necessary for natural selection to occur.
9. Explain why isolation is necessary for speciation to occur.
Applying
10. Tomato breeders have created the sweetest and juiciest tomato ever. Reflect on how they would have done this, given that they started with a not-so-sweet and not-so-juicy crop of tomatoes.
Analysing
11. The Galápagos finches share similar features but are recognised as distinct species. Propose a test that could be used to identify if two similar kinds of finch are different species or subspecies of the one species.
12. Distinguish between artificial and natural selection, providing examples for each.
Evaluating
13. Determine how speciation, biodiversity and evolution are linked.
14. Decide if humans are evolving by natural selection.

3.44 The small ground finch (Geospiza fuliginosa), one of many finch species isolated to the Galápagos Islands.
15. Predict what will happen if a particular species has low genetic variation and there are changes in the environment in which they live.
Learning goals
At the end of this section, I will be able to:
1. Describe the evidence for evolution.
2. Describe how a fossil forms.
3. Explain how radiometric dating of fossils relies on nuclear decay processes.
Evolutionary theory is supported by a multitude of evidence and findings from observations and experiments, including the sources in Table 3.3.
PalaeontologyThe study of fossils, including their identification and interpretation, enabling the identification and interpretation of ancient organisms, which contributes to our understanding of past life forms and evolutionary history
Comparative anatomyThe study of the structure of specific organs and limbs of different organisms, providing insights into their functional adaptations and evolutionary relationships
Embryology
The study of the development of the embryo in different organisms, providing information about shared developmental processes and evolutionary patterns
Molecular phylogenyThe ability to sequence DNA to indicate the degree of relatedness between organisms, aiding in the construction of evolutionary trees and understanding evolutionary relationships
Biochemistry
Similarities and differences in the biochemical make-up of organisms that can help distinguish differences and similarities
BiogeographyThe study of the geographic distribution of organisms, which can help ascertain the origins, dispersal and adaptation of species in different regions
Table 3.3 Sources of scientific evidence for the theory of evolution
Palaeontology
The term fossil refers to any parts of, or impressions made by, a plant or animal that is preserved following death. Normally, an organism decomposes after it dies, and after a time, no trace of it remains. On rare occasions, evidence of the organism is preserved in the form of a fossil.
Fossils may be the hard parts of an organism, like its bones and teeth (called direct evidence), or evidence of an organism's presence, like footprints, burrows and faeces (called indirect evidence or trace fossils). The process of forming a fossil is called fossilisation. However, because certain conditions are required in order for fossilisation to take place, fossilisation is rare. In addition, organisms with hard parts are more likely to form fossils, leading to gaps in our fossil record. Also, we cannot dig everywhere looking for fossils, so many go undiscovered.
fossil the shape or impression of a bone, shell or onceliving organism that has been preserved for a very long period of time direct evidence evidence that supports an assertion without intervening inferences indirect evidence evidence that requires inferences to be made trace fossil a trace of an animal, such as a footprint or imprint, that has become fossilised fossilisation the process of forming a fossil
Fossilisation
Fossils are formed in many ways, but they are most likely to be found in sedimentary rock. When an organism dies, soft tissues normally decompose, leaving only the hard parts behind. The remains are buried under sediment, volcanic ash or lava. Over a period of time, minerals can fill up empty spaces or replace material, eventually changing to rock.


Figure 3.45 Many opalised fossils have been found on the opal fields of Coober Pedy, South Australia. This phenomenon occurs when opal, instead of the usual minerals found in groundwater, replaces the skeletal material. The photos show a drawing of an extinct, squid-like belemnite (a), a belemnite fossil found in shale (b) and an opalised belemnite found in Coober Pedy (c)
Other ways in which fossils can be formed are presented in Table 3.4.
Method of fossil formation
Impression
Description
The organism's remains are broken down, but an empty space is left in the shape of the organism. If it remains empty, it is a mould. If it fills with minerals, then it is a cast. Alternatively, it can fill with lava forming a rock in the shape of the mould.
3.46 An impression fossil of a pterosaur Amber Organisms become trapped in tree resin that then hardens.
3.4 Methods of fossilisation
Description
Trace fossils Trace fossils, such as footprints, burrows or faeces, give some insight into an organism's behaviour, how it lived and how it interacted with the environment.
Figure 3.48 Lark Quarry Conservation Park in Queensland is the only known site of a dinosaur stampede, providing the most concentrated set of dinosaur footprints in the world. Over 3000 footprints can be seen in an area approximately the size of a tennis court. Trace fossils can provide important information relating to the size and walking or running posture of an extinct species.
Soft tissue It is extremely rare for soft tissues to survive the pressure, heat and chemical changes needed for fossilisation to occur. But nowadays, scientists are increasingly reporting finding fossilised skin and even brain material preserved along with bones.
Figure 3.49 In 2018, researchers found what they believe are fossilised lungs preserved inside a 120-million-year-old bird. Scientists have previously found four fossils of this ancient bird, Archaeorhynchus spathula, but never with plumage or suspected lungs.
Table 3.4 (continued)
Fossilisation requires the following conditions:
• Burial is rapid.
Organisms must be buried quickly in oxygen-poor sediments. Usually this happens when organisms die in seas, lakes, floods or mud slides. Organisms can also be preserved in ice or amber or buried under ash from volcanic eruptions (lava will usually incinerate any remains).
• Decomposition is prevented.
Bacteria, which normally cause the decay of organisms, must be reduced or absent. For example, many bacteria that cause decomposition will die in the absence of oxygen or water, or in conditions of high acidity or extreme cold. Soft tissue and organs break down chemically, so they do not usually get fossilised even in the absence of bacteria.
• Remains lie undisturbed.
Predators and scavengers must not dig up the remains.
Research some well-known fossil sites in Australia. Choose one and record the following information:
• location
• types of fossils found
• age of fossil site.

Figure 3.50 More than 15 000 bones, teeth and fossils of dinosaurs have been found at the Dinosaur Dreaming site in Inverloch, Victoria. Dinosaur Dreaming is a project between Museums Victoria, Monash University and Swinburne University of Technology, in which volunteers search for traces of dinosaurs that date back 125 million years.
check 3.8
1. State two sources of evidence for evolution.
2. Recall some of the information you can find out from fossils that helps explain evolution.
3. Explain why it is rare to find fossils.
4. Summarise the conditions required for fossilisation.
5. Describe what is meant by a 'trace' fossil.
you know? 3.4
Charles Darwin coined the phrase 'living fossils' and, despite not being a scientific term, it has remained in use. It describes modern species of plants and animals that are almost identical to species that lived in ancient geological ages. This means they have survived mass extinctions, ice ages and comets hitting Earth! Examples include the Wollemi pine, the pig-nosed turtle, mountain shrimp and the Australian ghost shark.
3.51 Fossils of the pig-nosed turtle (Carettochelys insculpta) can be found all over the world and date back 33.9–56 million years, but the only remaining species alive today is found in remote rivers of the Northern Territory and New Guinea.
Until last century, relative dating was the only method available for dating fossils. As the term suggests, relative dating techniques only work out how the age of a fossil compares to the ages of other fossils. For example, it can tell you that fossil X is older than fossil Y, but it cannot tell you the actual numerical age of the fossil. Relative dating is used to order the layers of rocks and geological events into a time sequence. The study of the order of the layers of rock (strata) is called stratigraphy
Try this 3.4
Stratigraphy
Where the sediments in which fossils are found have not been disturbed by later events, they nearly always show an age sequence, with the oldest fossils deepest under the ground and the youngest at the top. Often these fossil sequences let us see the change in a species over time. This highlights how the fossil record is valuable for collecting evidence of evolution. For example, fossils have provided evidence for the evolution of modern horses from the ancient four-toed mammal, and the discovery of Tiktaalik gave us evidence for the link between aquatic and terrestrial vertebrates. The fossil record also tells us more about organisms that are now extinct and what Earth was like when particular species existed.
relative dating determining the order of past events without the specific age stratigraphy the branch of geology studying rock layers
Locality 1 Locality 2
Figure 3.52 Relative dating: the different strata and their relative positions at locations 1 and 2 help us date the fossils in each layer relative to other fossils.
The diagrams in Figure 3.52 represent the strata (rock layers) found at two different locations (1 and 2). Each layer has a letter associated with it, and you can see the different fossils found in each layer. Knowing that the youngest layers are on the top and the oldest down below, work out the relative age of all the layers in both locations from oldest to youngest. Then list the clues you used to work this out.
For example, layer G is younger than layer B, but older than layer A.
Fossils are important for working out the relative ages of sedimentary rocks too. Similar fossils in different rocks, even if a great distance apart, suggest the rocks are the same age. This matching process is called correlation, and it has been important in constructing geological timescales. Throughout the history of life, different organisms have appeared, flourished and become extinct. Some of these organisms became fossilised in sedimentary rocks. The geological study of their patterns of appearance and disappearance over time is called biostratigraphy.
biostratigraphy a branch of stratigraphy focused on dating rock layers using the fossils found in them
index fossil a fossil used as the basis for dating the stratum it occupied
absolute dating determining the actual age of a material
radioisotope a radioactive isotope of a chemical element with an unstable nucleus that emits excess energy (radiation)
half-life the length of time needed for the radioactivity of a radioactive substance reduce by half
To help identify matching strata, and to compare strata in different locations, indicator or index fossils can be used. An index fossil is a fossil of known age found in a particular type of sedimentary rock layer. It can be used to indicate the age of any deposit in which it is found, at any locality. For example, trilobites are good index fossils as they were very common at the time they existed (between 488 and 225 million years ago), easy to recognise and well preserved because of their hard exoskeleton. They also evolved rapidly, which means there were different species present at different times. This means that if a fossil was found underneath a rock layer containing trilobites, then it could be deduced that it is older than 225 million years.
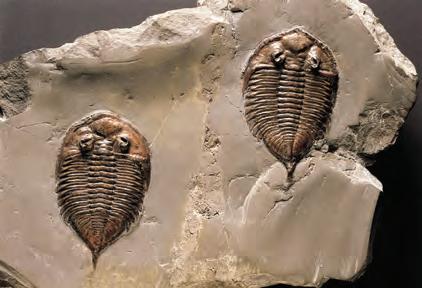

Absolute dating gives a precise age (within certain error margins) for a fossil or, more commonly, for the rock or soil in which a fossil is found. Absolute dating uses radiometric techniques, which means looking at the level of radioactivity detected in rocks containing certain naturally occurring radioactive isotopes (radioisotopes). These isotopes occur in living things and have a known rate of radioactive decay. By measuring the amount of radioactive isotope left in a sample, we can work out how long the organism has been dead. The time in which half of the sample of the radioactive isotope (parent) has decayed to a more stable form (daughter) is known as its half-life and is unique to each isotope. Knowing this helps us determine the best isotope to use to work out the absolute age of a fossil. The longer the half-life of the isotope used, the older the fossil or rock that can be dated.
Radioactive isotopes (parent to daughter)
Carbon-14 to nitrogen-14
Uranium-235 to lead-207
Potassium-40 to argon-40
Half-life (years)Estimated age range of fossils they can date
5730 Up to 55 000 years ago
710 000 000 1 million to 1 billion years ago
1300 000 000 500 000 years and older
Table 3.5 Each radioactive isotope has a different half-life. The longer the half-life, the older the fossil or rock that can be dated.
Try this 3.5 Half-life of C-14
Radioactive decay curve for C-14
Figure 3.54 The amount of C-14 in a sample is halved after each half-life (5730 years).
If the half-life of C-14 is 5730 years and a fossil sample started with 5 grams of C-14:
1. How much C-14 would remain after two half-lives?
2. How much N-14 would there be after one half-life?
3. How much time has passed after three half-lives?
4. If the ratio of C-14 to N-14 is 0.125 (1∕8), how many half-lives have passed?
Did you know? 3.5
Transitional fossils
Transitional fossils are the missing links between a living species and its ancestor, sharing traits that are common to both. Examining transitional fossils allows palaeontologists to piece together the evolutionary pathways of groups of organisms. They provide tangible evidence of the evolutionary transitions between different species.
A famous example of a transitional fossil is Archaeopteryx, the link between dinosaurs and modern birds. Living during the Late Jurassic period, it had feathered wings and a beak but retained dinosaurlike traits. It had teeth, a long bony tail and a skeletal structure similar to small dinosaurs.
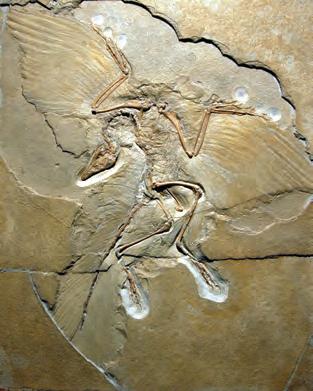
Try this 3.6
Aim
To model radioactive decay
Materials
• M&Ms or counters with one side marked × 100
• graph paper
• plastic container with lid
• plastic tray
• gloves
Instructions
1. Copy the results table into your science book.
Be careful
Do not consume food items.
2. Predict the number of M&Ms that will 'decay' into daughter isotopes each time trial. Place all 100 M&Ms parent isotopes on your plastic tray with the 'm' side up.
3. Record your original number of parent isotopes in your results table for time 0.
Daughter isotope m-side down, stable Parent isotope m-side up, radioactive
4. Place all the isotopes in the plastic container and shake for 10 seconds.
5. Pour your isotopes back onto the plastic tray.
6. With your gloves on, remove all the stable daughter isotopes (m-side down) from the tray and set them aside.
7. Count the remaining M&Ms (parent isotopes), which will be a percentage of the original number since that was 100, and record this in your results table for time 1.
8. Repeat steps 4–7 another eight times, ensuring that you only place parent isotopes back in the container each time.
9. Collate the class results on the board and calculate means for each time.
10. Calculate the percentage of undecayed parent isotopes for each time period.
11. Draw a graph of the time (x-axis) versus percentage undecayed parent isotopes (y-axis) using the class results.
TimeNumber of removed daughter isotopes
Number of remaining parent isotopes
Percentage undecayed parent isotopes: number of remaining parent isotopes starting number of parent isotopes × 100
Class mean percentage undecayed parent isotopes
Discussion: Analysis
1. Calculate the half-life of your isotope using your graph to identify the time in which half of the parent isotopes had decayed into daughter isotopes.
Discussion: Evaluation
1. Compare your results to the class averages you calculated. How do they differ and which do you think is more accurate?
2. It was expected that, each time, there is a 50% chance of the M&Ms being m-side up; therefore, time 1 should represent one half-life. Compare this prediction to your results and the class results.
3. Can you identify possible limitations of this model? Justify your response.
Conclusion
1. Make a claim about radioactive decay and modelling this process.
2. Support your statement using the data you gathered, and include potential sources of error.
3. Explain how the data support your statement.
1. Describe relative dating.
2. Define the terms 'stratigraphy' and 'index fossil'.
3. Describe absolute dating.
4. Name one isotope that could be used to accurately measure the absolute age of a fossil.
The latest fossil finds
In 2022, an international team of palaeontologists identified the world's oldest meal in a 550-million-year-old fossil.
Analysing the fossilised remains of a slug-like Ediacarian called Kimberella showed that it had a mouth and a gut and ate algae and bacteria from the ocean floor. The organism was advanced for the time period, as most other species did not have a gut that went through its entire body.
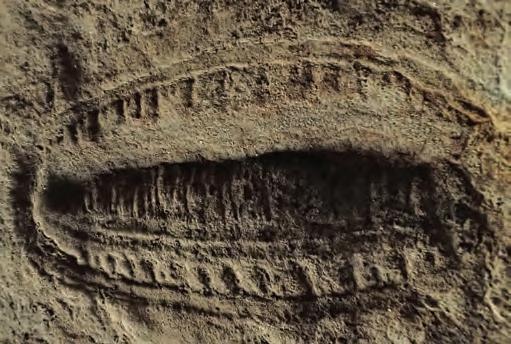
Genetic variation can produce a huge diversity of forms among closely related organisms. But some animals display physical likeness despite not being closely related at all. Think about a bird and a bat, a dolphin and a shark, a sugar glider and a flying squirrel. The members of each pair, despite not being closely related, share some obvious structural characteristics. For example, sugar gliders and flying squirrels look alike, sharing similar characteristics such as size, big eyes and a white belly. Their most striking similarity is that they both have thin, loose skin between their limbs that keeps them stable when stretched while they glide.
However, sugar gliders (native to Australia) and flying squirrels (native to Asia, Central and North America, and Europe) also have many differences. Sugar gliders are marsupials, so they have a pouch to protect their young, whereas flying squirrels have larger babies and no pouch.
By studying their genes and other traits, biologists discovered that sugar gliders and flying squirrels are not very closely related at all. So why do they share some common physical characteristics?

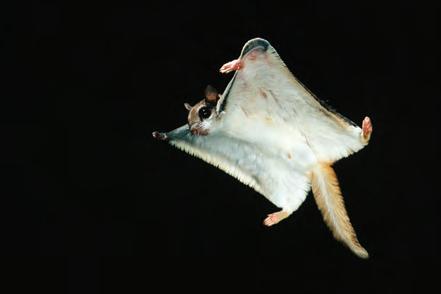
The characteristic 'wings', which are flaps of skin, are known as analogous structures. These are structures that have a similar function but have evolved independently. The two organisms have evolved from different ancestors but in similar environments, so the same selection pressures have caused the same feature to be selected for. The fins of sharks (fish), wings of penguins (birds) and
flippers of dolphins (mammals) are other examples of analogous structures (Figure 3.58). The shape of their fin, wing or flipper is adapted for swimming through water. The three types of animals faced similar selection pressures in their aquatic environment, and evolved into a similar shape, but they do not share a recent common ancestor.
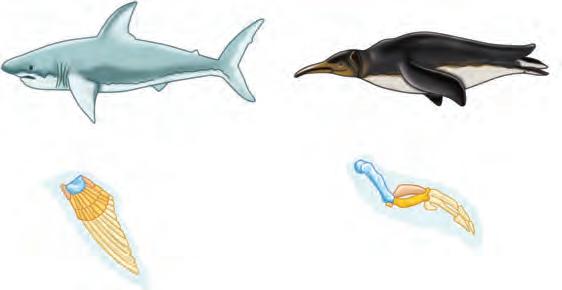

Figure 3.58 The shark, penguin and dolphin have analogous structures – that is, structures with the same function. These arose because they live in similar environments and face similar selection pressures.
Homologous structures are structures that organisms inherit from a common ancestor. 'Homo' comes from the Greek word homos, meaning 'same'; hence, they inherited the same general body plan from the same ancestor. We say these structures have a common evolutionary origin. Homologous structures have similar underlying anatomy but have evolved in different ways over time due to different selection pressures. An example of a homologous structure is the pentadactyl limb, the five-digit limb typical of tetrapod (four-limbed) vertebrates (that is, amphibians, reptiles, birds and mammals). The limbs of different species show basic similarities in the bones present and how they are arranged, even though the limbs may serve different functions (Figure 3.59).
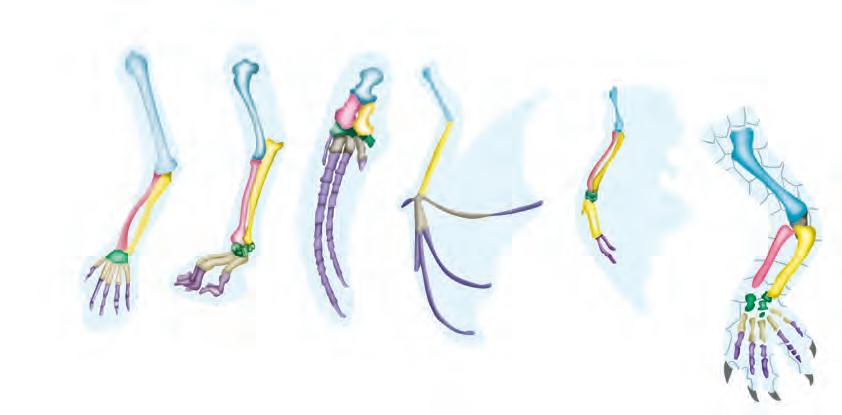
Figure 3.59 The limbs of different tetrapod vertebrates have a common structure and are called homologous, despite having different functions, such as grasping, swimming or flying.
The different limbs are the same bones arranged for different uses. If homologous structures are found in different organisms, it suggests they had a relatively recent common ancestor, which helps to explain their evolutionary path.
homologous structures similar physical features in organisms that have evolved from a common ancestor
1. Describe analogous structures, providing an appropriate example.
2. Describe homologous structures, providing an appropriate example.
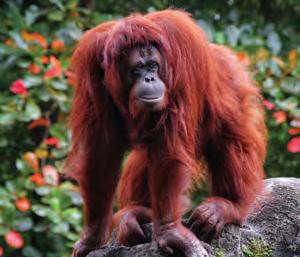
Aim
To compare the structure of a chicken wing to the structure of a human arm
Materials
• fresh chicken wing
• dissecting board
• dissecting scissors
Method
Part 1: Examining the chicken wing
• probe
• disposable gloves
• human skeleton model
Take care when using scissors and probes. Clean the benches and wash your hands before leaving the laboratory.
1. Hold the chicken wing at the shoulder and the tip and then stretch out the wing. Identify where the joints are and in which direction they bend.
2. Use your fingers to feel the bones and muscle under the skin.
3. Using dissecting scissors, carefully remove the skin from the chicken wing, taking care not to cut the muscles, ligaments and tendons.
4. Identify the muscles of the wing and see if you can work out how each one is attached to the bones of the wing.
5. Look for the tendon, which is white and tough and attaches the muscle to the bone.
6. Try squeezing the muscle in the wings and observe what happens to the bones. You may notice there are two muscles that can flex or extend the wing.
7. Look at the surface of each bone where it forms a joint. It should appear white, shiny and slippery – this is called cartilage. Can you find the cartilage at the joint between the humerus and the radius and ulna?


8. Identify the humerus, ulna and radius in your arm. What other features of the chicken wing and your arm are similar?
9. Bend your arm at the elbow and hold it tight. Notice that your biceps muscle shortens. Now, extend your arm and feel your biceps lengthen.
10. Now, look at your hand and identify where the muscles are that move your fingers. You may need to press on your wrist or forearm to figure this out.
11. With a partner, raise and lower a textbook by bending your arm at the elbow. Which muscles were acting as you raised and lowered the textbook?
Results
Take a photo of the finished dissection of the chicken wing.
Discussion: Analysis
1. Compare the structure of a chicken wing with a human arm.
2. Define the term 'analogous structures' and explain what they can tell us about the evolution of a species.
3. Define the term 'homologous structures' and explain what they can tell us about the evolution of a species.
4. Would the chicken bones and human bones be considered homologous or analogous structures? Discuss.
Conclusion
1. Make a claim about the evolutionary relationship between chickens and humans.
2. Support your statement using the data you gathered, and include potential sources of error.
3. Explain how the data support your statement. Radius
evolutionary tree a diagram used to represent evolutionary relationships between organisms
Scientists can construct evolutionary trees using fossil evidence and radiometric dating to estimate when different groups of species diverged from a common ancestor. Evolutionary trees can be constructed when scientists have studied the anatomy of different species to determine which ones have homologous structures. Only homologous traits are evidence of a shared ancestry. An example of an evolutionary tree is shown in Figure 3.62.
Ancestral species of F and G
For example, humans, chimpanzees and gorillas all have thumbs that are very similar anatomically and are considered to be homologous (Figure 3.63). The giant panda also has a thumb, but it has been found to be analogous to these primate thumbs – it serves the same function but is structurally formed by different bones, so it evolved separately. This suggests that humans, chimpanzees and gorillas are much more closely related to one another than any of them is related to giant pandas.


of false

Origin of opposable thumb in primates
The embryos of vertebrate animals look very similar in the early stages, which suggests that they inherited some of the genetic information that contributes to embryo development from a common ancestor. For example, a very early stage human embryo has gill slits, a tail and a simple heart, similar to that of a fish. At later stages, the human embryo develops body proportions similar to the embryos of reptiles and then apes.
Comparative embryology also finds evidence for evolution in the circulatory system of fish and mammals. Adult fish and mammals have quite different circulatory systems. However, during embryonic development you can clearly see that the circulatory systems are based on the same pattern. This suggests that the genetic information responsible for the development of the fish and mammalian circulatory systems has been inherited from a common ancestor.
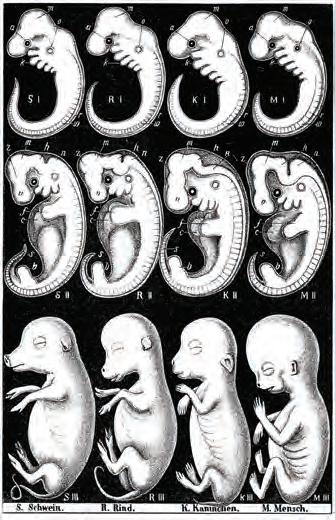
Quick check 3.11
1. Describe an evolutionary tree.
2. Explain how embryology provides evidence for evolution.
Substances that are found in most or all living things are very useful in the investigation of evolutionary relationships. For example, all living things contain DNA, so it is commonly used to compare organisms. This is what the study of molecular biology is all about – investigating DNA, its code and the proteins it codes for. Molecular biology lets evolutionary scientists:
• trace ancestors of species
• estimate how long ago one species diverged into two
• discover how closely related two species are.
Comparing DNA sequences between different species can provide an indication of their relatedness. The more similar the DNA sequences between two organisms, the more closely related they are. Usually, scientists would compare sequences of highly conserved genes, that is, genes that can be found in almost all organisms and have remained similar over evolutionary time. The genes coding for cytochrome c, a protein essential for cellular respiration, and haemoglobin, the protein that carries oxygen around the body, are commonly used for comparison.
hybridisation a
DNA hybridisation is one technique used to compare the DNA sequences of two species to find out how closely related they are. First, as shown in Figure 3.65, the DNA from each organism is extracted and heated so it forms two single strands. When the single strands from the two organisms are mixed together and allowed to cool, complementary nitrogenous bases will bind together (hybridise). The degree to which the single strands form a stable double-stranded DNA molecule is an indication of the relatedness of the species. For example, if there is a lot of hybridisation, there must be a lot of complementary bases, which means the organisms are similar and, therefore, have a recent common ancestor.
Species A
Sequences dissimilar; species A and B not closely related
Single strands of DNA from species A and B mixed together
Species B
Figure 3.65 The process of DNA hybridisation allows scientists to determine the relatedness of two organisms by comparing their DNA.
As we know, proteins are made up of building blocks called amino acids. Scientists can analyse the differences in the amino acid sequences, knowing that this relates to how similar proteins are in the different organisms. The number of different amino acid sequences in the proteins of different species is an indicator of the number of mutations and hence the degree of separation of species. In other words, a large difference in amino acid sequences between two organisms means they had a distant common ancestor, while a small difference in amino acid sequences means they had a recent common ancestor. This is because they have had less time for mutations to accumulate. Table 3.6 shows the differences in the amino acid sequence for cytochrome c between humans and other organisms. Notice how the monkey has the lowest number of differences, suggesting they are more closely related to humans.
Note that it is also possible to predict amino acid sequences from the DNA code, and the latter also tells you about the relationship between organisms.
Number of differences in the amino acid sequence for cytochrome c compared to humans
Table 3.6 The differences in the amino acid sequence for cytochrome c between humans and other organisms
The molecular clock concept says that mutations accumulate in biomolecules at a roughly constant rate because they occur by chance. We can use this mutation rate to deduce the time when life forms diverged. The biomolecular data that are normally used for calculations are DNA nucleotide sequences, including those found in mitochondrial DNA (mtDNA).
25 million years later: GTTAACTAGC
50 million years later: GTTAGCTAGC
Common ancestor:
GTTAAATAGC
25 million years later: GTTAAATAGA
50 million years later: GTTAAATAAA
Figure 3.66 In the same way that a clock tells the time, a molecular clock allows scientists to determine how long ago two species diverged.
1. Describe DNA hybridisation and how it provides evidence for evolution. 2. Describe how the number of differences in the amino acid sequence for cytochrome c can be used to establish the relationship, in evolutionary terms, between organisms.
Biogeography is the study of the distribution of organisms, both today and in the past. Biogeography provides us with additional evidence for evolution, such as when ancient fossils in one area resemble modern organisms in that same area and have a similar pattern of distribution (for example, fossil and modern platypuses are both found in Australia). The similarity of fossil and modern organisms suggests that the modern organisms have descended from ancestors living in the same areas.
Remember that the continents were once joined in one big supercontinent, and ancestral organisms were distributed across more than one continent. When the continents split up and drifted apart, the separated populations evolved into different organisms due to reproductive isolation. However, in some cases, the selection pressures in each new area were so similar that speciation created very similar looking organisms. For example, the emu of Australia, the ostrich of Africa, the cassowary of Papua New Guinea and northern Australia and the rhea of South America are all large, flightless birds. Despite being found on different continents with oceans between them, one possible explanation for their similarity is that they descended from a common ancestor that occurred on the ancient Gondwana supercontinent.
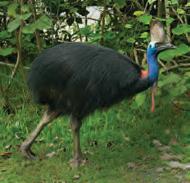
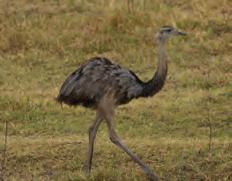
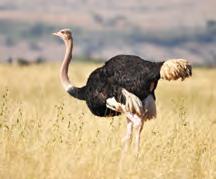
biogeography the study of the geographical distribution of plants and animals
Quick check 3.13
1. Define the term 'biogeography'.
2. Explain how biogeography provides evidence for evolution.
In order to understand human origins, we need to first look at what humans are. Humans are in the animal kingdom, phylum Chordata, class Mammalia, order Primates, family Hominidae, genus Homo and species Homo sapiens (see Figure 3.68).
The primates living today gradually evolved over 65 million years from ancestral primates that were small tree-dwelling mammals. We did not evolve from apes and monkeys, but we share a common ancestor with them. About six million years ago, the line that led to humans is thought to have diverged from the chimpanzee line due to different habitats and different selection pressures. This divergence led to the evolution of the earliest members of the human family, the Australopithecines, which lived in Africa between about two and four million years ago. These early hominids were bipedal and had a small brain and teeth and jaws adapted to a diet that included tough plant materials. Over time, members of the human family continued to evolve and develop new adaptations, such as a larger brain and the ability to use more complex tools.
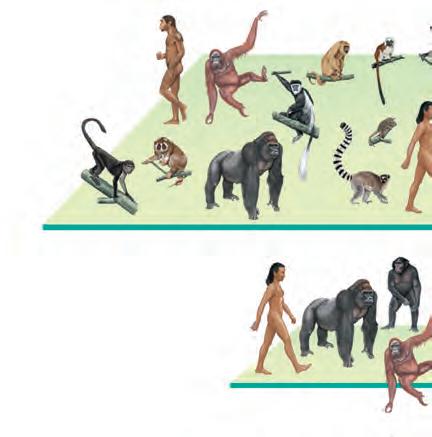
Humans, apes, monkeys, tarsiers, lemurs and lorises
Humans and great apes

Modern and archaic humans Modern humans

One of the most important periods of human evolution occurred around 2.5 million years ago with the emergence of the genus Homo. The first species in this genus, Homo habilis, was known for its ability to create stone tools; it had a slightly larger brain than the Australopithecines.
Over the next few million years, other species of Homo emerged, including Homo erectus, which was the first hominid to leave Africa and migrate into other parts of the world. Homo neanderthalensis, commonly known as the Neanderthals, was a species of hominids that lived in Europe and parts of Asia from about 400 000 to 40 000 years ago. They were named after the Neander Valley in Germany, where the first Neanderthal fossils were discovered in the mid-nineteenth century.
Neanderthals were well adapted to life in cold environments, with a stocky build and short limbs that helped to conserve body heat. They are also known to have used fire and create shelters, indicating a level of social and technological sophistication. Neanderthals produced art, made jewellery and performed burial rituals, indicating a degree of symbolic thought.
The most recent and only surviving species of the Homo genus is Homo sapiens, which emerged in Africa around 300 000 years ago. Homo sapiens is characterised by its large brain, complex culture and use of language. Genetic studies have shown that Neanderthals interbred with modern humans, as evidence of their DNA has been found in the genomes of non-African humans. However, they eventually became extinct around 40 000 years ago for reasons that are not entirely clear, although factors such as climate change, competition with modern humans, and disease have been suggested as possible contributing factors.
Figure 3.69 The biologist and anthropologist Thomas Henry Huxley (1825–1895) was the first to suggest that humans and other species were related.
In this section you have learned about the different ways that we can gather evidence about evolution: palaeontology, comparative anatomy, embryology, molecular biology and biogeography. However, we have not investigated how they have informed us about human evolution.
1. Research the fossil evidence of human evolution. Summarise what fossils teach you about the evolution of humans and use pictures to illustrate what you find.
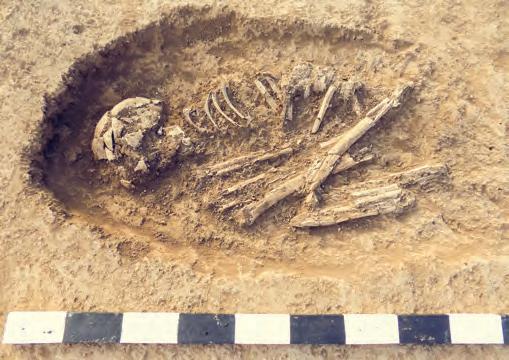
2. Research homologous and analogous structures related to human evolution. Summarise what comparative anatomy teaches you about the evolution of humans and use pictures to illustrate what you find.
3. Research the DNA evidence of human evolution. Summarise what DNA teaches you about the evolution of humans and use pictures to illustrate what you find.
The story of human evolution and migration is constantly being refined and updated in light of new evidence. A lot of what we know so far has been pieced together from the fossils of our ancestors. However, the human fossil record has many gaps due to the process of fossilisation being a rare occurrence.

Man and Mungo Lady were removed from their land without the permission of the traditional owners. The remains of Mungo Man were relinquished by the Australian National University to be returned and buried in a secret place in Mungo National Park in 2017.
The earliest evidence for human occupation of Australia dates back 50 000 to 60 000 years. It comes from charred plant remains, stone axes and ochre crayons found in rock shelters in the Northern Territory. The oldest human remains found in Australia come from Lake Mungo in New South Wales. Mungo Lady and Mungo Man date to around 42 000 years ago and are among the earliest examples of ritual burial in the world. Mungo Lady, discovered in 1968, is the oldest known evidence of cremation in humans.
Recent DNA evidence shows that the ancestors of Aboriginal people here today were likely part of the first wave of modern humans to leave Africa 64 000–75 000 years ago. This places Aboriginal people among the oldest living populations in the world.
Section 3.3 review
Section 3.3 questions
Remembering
1. Name five sources of evidence for evolution.
2. Recall what is meant by the term 'fossil'.
3. Recall what the term 'biogeography' refers to.
Understanding
4. Describe analogous structures, providing an example.
5. Explain how the scales of reptiles and the feathers of birds are considered homologous structures.
6. Explain how DNA hybridisation can show that two organisms share a common ancestor.
7. Summarise why fossils of soft-bodied organisms are relatively rare.
Applying
8. The table below shows the number of nucleotide differences between a region of mitochondrial DNA in humans, chimpanzees and a Neanderthal.
Organism Human 2 Chimpanzee 1 Chimpanzee 2 Neanderthal
1
Chimpanzee 2 71
a) Based on the table, deduce which organism is most closely related to the Neanderthal.
b) Based on the table, deduce which organism is least closely related to the Neanderthal.
c) Decide which method could be used to estimate the absolute age of a Neanderthal fossil.
d) Decide which method could be used to estimate the relative age of a Neanderthal fossil.
Analysing
9. The chronogram in Figure 3.72 shows the evolutionary relationship between some freshwater fish.
a) Infer which genus is most distantly related to Poecilia.
b) Between the genera Cyprinodon and Fundulus, infer which is more closely related to Poecilia. Online quiz Section questions DOC Teachers can assign tasks and track results
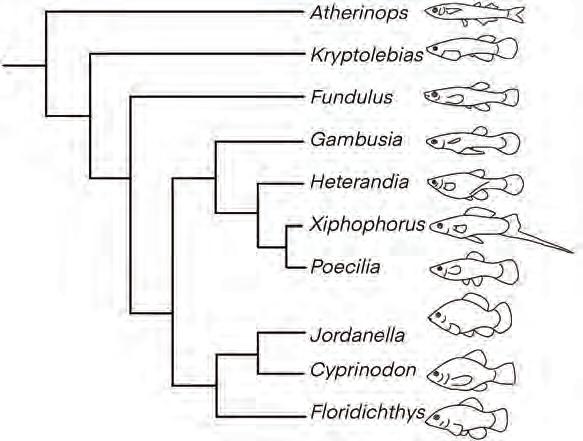
Go online to access the interactive section review and more!
10. Figure 3.73 represents the layers of rock found within a cave. Identify the layer (1 to 5) where you would expect to find the oldest group of fossils, giving reasons for your answer.
11. Distinguish between absolute and relative dating techniques.
12. Figure 3.74 shows a timeline for the evolution of some dinosaurs. The average mass of each dinosaur is shown in brackets under its name. Identify the appropriate dinosaur for each statement.
a) The dinosaur that lived the longest time ago is the __________________.
b) The dinosaur/dinosaurs that evolved from Agilisaurus is/are the _______________.
c) The dinosaur from which Camarasaurus evolved is the _______________.
d) The dinosaur with the largest average mass is the _________________.


Evaluating


13. Propose how you would investigate whether birds are more closely related to mammals or reptiles. Include the evidence you would expect if the organisms were related or not related.
14. Create a concept map that shows the links between the different ways we can gain evidence for evolution. Include information on how each method sheds light on evolution.
Chapter checklist
Success criteria Linked questions
3.1 I can define evolution. 1
3.1 I can describe the five drivers of evolution (mutation, gene flow, genetic drift, natural selection, sexual reproduction). 2, 4, 11
3.1 I can describe the concept and importance of biodiversity. 9, 16
3.1 I can describe some reasons for species becoming endangered or extinct and propose ways to minimise this problem. 17
3.2 I can describe the steps in the process of natural selection. 6, 7, 12
3.2 I can explain how speciation occurs. 10
3.2 I can distinguish between natural and artificial selection. 15
3.3 I can describe the evidence for evolution. 8, 13, 14
3.3 I can describe how a fossil forms. 5
3.3 I can explain how radiometric dating of fossils relies on nuclear decay processes. 3
Review questions
Remembering
1. Define the terms 'evolution', 'gene flow', 'genetic drift' and 'natural selection'.
2. Recall the main causes of variation among organisms.
3. Recall how the quantity of the isotope carbon-14 in a fossil can be used to accurately date a fossil.
Understanding
4. Describe what is meant by the concept of variation in the field of evolution.
5. Describe how a fossil found in sedimentary rock is formed.
6. Explain how the camouflage of organisms supports the idea of natural selection.
7. Explain why 'survival of the fittest' does not necessarily mean survival of the biggest and strongest.
8. Explain how amino acid sequences can provide evidence for evolution.
9. Describe the importance of biodiversity.
10. The following diagram represents the process of speciation.
Species D continues to live in the forest.
Species D continues.
Variation Migration
To desert region
Natural selection
Mutations accumulate
Further natural selection
Species D becomes species E
Explain, using the information from the diagram, the key drivers behind the creation of the new species E in the desert.
11. Explain how mutations contribute to the process of evolution.
Applying
12. Using diagrams, discuss how rabbits may have become resistant to the deadly myxoma virus, which was released in Australia to try to control rabbit populations.
13. Discuss how scientists use information gained from sedimentary rock to arrange fossils into an evolutionary sequence over time.
Analysing
14. The following diagram shows the evolutionary tree for six organisms from a common ancestor.
Common ancestor
Millions of years ago
AB CD EF Present
a) According to the diagram, identify the present-day organism that is least closely related to the others. Justify your response.
b) Infer which two organisms have the most recent common ancestor, giving reasons for your response.
c) Propose a reason why members of the new species E cannot breed successfully with species D.
Evaluating
15. Critique the process of artificial selection.
16. Decide why scientists want to find out about evolution.
17. Discuss why we should conserve species.
Geospiza fortis is a ground finch that feeds on seeds on Daphne Major, one of the Galápagos Islands. From 1975 to 1977, the island experienced a severe drought. The graphs in Figure 3.75 show features of the G. fortis population and the island's seed supply during these years.
Figure 3.75 Features of the Geospiza fortis population and the seed supply on Daphne Major
Applying
1. Calculate the percentage decrease in population size between July 1975 and December 1977.
Analysing
2. Identify any relationships you can find in the graphs.
Evaluating
3. Infer why the size of the finches increased as the drought continued.

Individuals in a species become well adapted to their environment by the process of natural selection. In this process, individuals with characteristics that allow them to thrive in the environment are selected for, and they pass their suitable genes on to subsequent generations. However, individuals within a species being too similar genetically can be detrimental to a species' survival. If the environment changes, genetic variation within a species gives it a better chance of survival because there may be individuals that can cope better with the changed environment. A lack of genetic variation can result in extinction due to an environmental change.
Inbreeding occurs when genetically similar individuals from a species breed with each other. There are many examples of inbreeding in humans and other species that are bred selectively, like dogs. In these cases, the problem is not that a population could be wiped out by an environmental change, but that genetic conditions that would be very rare in wider populations continue to be passed on to subsequent generations.
A famous example of this occurred with haemophilia, a condition resulting from a mutation on the X chromosome. In people with this condition, blood does not clot properly, so injury can cause excessive bleeding. Haemophilia spread throughout European royal families in the nineteenth and twentieth centuries because of arranged marriages among the related royal families.
Humans have bred dogs for thousands of years, originally to serve a specific purpose or job, like herding and hunting. All modern dog breeds exist because of human selective breeding. Unfortunately, many pure-bred dogs suffer from genetic conditions because of inbreeding. For example, pure-bred dachshunds commonly suffer from knee problems because of their short legs and non-ideal angle of the knees. They also often have hip dysplasia and spinal problems because of their long bodies, and eye problems like cataracts.
While dog owners can take preventive measures to reduce the effects of these disorders, often reactive treatment is the method used to give affected dogs a good quality of life. Wheelchairs are a potential solution to help with mobility for dachshunds that have hip and knee problems.
Design a wheelchair to aid dachshunds with genetic knee and hip problems.
In small groups, research the features of dog wheelchairs. You may like to put together a collection of different designs to help you decide which features you would like to include in your own design.
Draw your chosen design and label its features and the materials you intend to use. You will need to consider the method of attaching the wheelchair to the dog and whether the dog's legs will hang down or be supported on a platform. You will also need to think about the best way to make it comfortable for the dog. Some research into the specific genetic problems occurring in dachshunds may be necessary to make sure you are catering for the dogs' needs.
Your wheelchair will need to be sturdy, so remember to use appropriate shapes and bracing to achieve the right strength for your design.
• cardboard
• fabric/felt
• glue
• scissors
• wheels
• icy-pole craft sticks
• elastic bands
• straws
• sticky tape
1. Research and list all the features that make a wheelchair comfortable and functional.
e.g. padded seat Comfortable to use for long amounts of time
2. Research the dog wheelchairs that are currently available and how they are used for dogs with hip and knee problems. List all the problems that exist with current models and solutions that could be included.
3. Research the dachshund breed and make note of the size of the dogs and their common hip and knee problems.
4. Design a prototype of a wheelchair specifically for a dachshund. Annotate your diagram and include all design features and the functionality it provides.
5. Reflect on the sustainability of the materials used, and the life cycle of the wheelchair prototype regarding its durability.
6. Construct the prototype using available materials.
7. Describe any difficulties you came across when constructing your model. Explain how you overcame these difficulties.
8. Propose some improvements to the design of your wheelchair to improve comfort and functionality.
9. Depending on the size of your model, you may be able to test it by using your wrist or palm as the back of the dog and your index and middle fingers as the front legs to pull it along. Test it with different amount of downward pressure to represent different dog sizes and weights. Comment on how your wheelchair fared in your tests.
The modern-day periodic table organises all 118 elements based on the structure and properties of atoms, such as chemical reactivity, but the periodic table has not always had the structure it has today. In this chapter, you will explore how, over many centuries, scientists disputed, debated and refined the periodic table. You will also examine electron shell structure, as well as how the number of valence electrons in an atom affects the chemical reactivity and properties of entire groups of elements.
Electron configuration affects element properties.
Valence electrons Excited electrons
Ionic bonding Covalent bonding
Atomic structure and element properties influence the organisation of the periodic table.
The periodic table was developed over many years.
The periodic table is organised in different ways.
Section
Section
Section
Section
Groups (columns) Periods (rows)
Special groups of elements:
• Group 1 – alkali metals
• Group 2 – alkaline earth metals
• Group 17 – halogens
• Group 18 – noble gases
Metals
• Transition metals
• Non-metals
• Metalloids
Curriculum content
the organisation of the elements in the periodic table is related to the structure and properties of atoms; patterns and trends include the significance of rows and periods, metallic and non-metallic properties, atomic size and reactivity (VC2S10U07)
• examining the significance of groups and periods in the periodic table
• analysing patterns in chemical reactivity of some elements in the periodic table by reacting them with oxygen, water and acids to discern that elements in the same group of the periodic table have similar properties
• investigating the physical properties of some metals and non-metals
• using the Bohr model of the atom to describe the structure of atoms in terms of electron shells, and relating the electron arrangements in different atoms to the properties and positions of their elements in the periodic table
• deducing that repeating patterns of the periodic table reflect patterns of electrons in outer electron shells
• conducting flame tests for a selection of elements and examining emission spectra4.3 scientific knowledge is contestable and is validated and refined over time through expanding scientific methods, replication, publication, peer review and consensus (VC2S10H01)
• investigating how the development of the periodic table has been disputed and refined as science has progressed and new elements have been discovered
Curriculum V2.0 F–10 © VCAA 2024
Glossary terms
Atomic
Cation
Covalent bond
Ductile
Electron
Ionic bond
Lattice structure
Electron configurationLustrous
Valence electrons
Valence shell
Learning goals
At the end of this section, I will be able to:
1. Recall the scientists involved in the development of the periodic table.
2. Describe how Mendeleev arranged the elements according to their properties and atomic mass.
How to best organise the known elements has been a topic of scientific debate since the late 1700s. In this section, we will follow the work of six scientists who influenced the shape and structure of the periodic table.
Antoine Lavoisier
• Through meticulous experimentation, Lavoisier disproved the theory that existed at the time and discovered and named the elements oxygen and hydrogen.
• In 1789, there were thought to be 33 elements (including light!). Lavoisier sorted these elements into gases, metals, non-metals and earths, constructing the first list of the known elements.
• His table of elements quickly became outdated as new elements were discovered. 1808
• Dalton was a chemist, physicist and meteorologist. He was responsible for developing early atomic theory and publishing a table of relative atomic masses.
• Dalton allocated symbols to the 36 known elements, which were later replaced by the notation devised by Jöns Jacob Berzelius that is still used today.
Figure 4.1 Dalton's element symbols 1817
• Döbereiner noticed that known elements could be arranged into groups of three by their similarities in appearance and reactions. He called these groups triads (for example, lithium, sodium, potassium). He found that when the elements in a triad were placed in order of their atomic mass, the middle element had a mass that was the average of the other two.
Figure 4.2 Two Döbereiner triads
• Without Döbereiner's work, other scientists wouldn't have started looking for patterns in chemical properties and atomic masses.
Alexandre-Émile Béguyer de Chancourtois
• de Chancourtois arranged known elements by increasing atomic mass.
• The atomic mass of oxygen was set at 16 and used as a standard for all the other elements. He wrapped his list around a cylinder, which allowed sets of similar elements to line up. As tellurium was situated in the middle of the cylinder, he named his system the telluric screw.
• The first geometric representation of periodic law was created, meaning that de Chancourtois's system showed repetition in the properties of elements at certain regular intervals.

1864
1869
John Newlands
• Newlands listed the known elements in order of their atomic masses into horizontal rows, seven elements long.
• He stated that the eighth element would have similar properties to the first element in the series. This was known at the time as the law of octaves.
Dmitri Mendeleev
• By 1869, 56 elements were known and a new element was being discovered approximately once every year.
• Mendeleev organised the elements into a table with rows and columns, arranging elements by properties and in order of their atomic mass.
• Mendeleev left space in his table for elements he thought would later be discovered.
4.4 Newlands's law of octaves. Every eighth element in the row has similar properties. Track the lines and investigate what is similar about each element.

4.5 Mendeleev's early attempt at arranging the known elements into a table
Quick check 4.1
1. Determine the atomic mass of element Y using Döbereiner's method, if X, Y and Z form a triad.
2. Describe how Mendeleev's attempt at organising the elements was similar and different to those made by other scientists.
Mendeleev's approach differed from other scientists in that he left space for elements that had not yet been discovered; he knew that new elements were being discovered regularly in the 1800s. Figure 4.5 shows that he drew lines to denote 'a missing piece in his arrangement.
Mendeleev left calculated spaces in his periodic table where he thought the elements would have similar properties to those above and below. Take, for example, his prediction of the element between silicon (Si) and tin (Sn), shown in Figure 4.6.
He named this element eka-silicon and made the predictions shown in Table 4.1, based on the known properties of the elements above and below it in his periodic table. He was close! In 1886, the element germanium (Ge) was discovered with the properties described in Table 4.2. The discovery of germanium occurred within Mendeleev's lifetime and confirmed his arrangement.
While Mendeleev's work had a great influence on the work of all chemists attempting to organise the elements in the periodic table, his work did not earn him a Nobel Prize. However, in 1955, scientist Albert Ghiorso and colleagues discovered element 101 and named it mendelevium (Md) after the 'father of chemistry'.
Practical 4.1
Aim
To investigate the relationship between the position of an element in the periodic table and its density
Hypothesis
Develop a hypothesis by predicting the relationship between an element's position in the periodic table and its density. Practise using the 'If ... then ...' format.
Useful formulas
Density (g cm–3) = mass (g) volume (cm3)
Percentage difference = (actual value predicted value) actual value × 100
Materials
• sample elements (carbon rod, silicon, tin)
• 25 mL measuring cylinder
• graph paper
• electronic balance
Method
Part 1: Preparation
• ruler
• weigh boats (small containers to hold sample elements)
• plastic pipette
1. Identify the independent and dependent variables for this task. Make a list of variables that should be controlled and how you will do this.
2. Copy the results table into your science book.
3. For each element used in this experiment, state in the results table its position on the periodic table.
Part 2: Measure the mass of each sample element
4. Place a weigh boat onto the balance and zero the balance by pressing 'tare'.
5. Place the first sample element on the empty weigh boat and record the mass in the table.
6. Remove the sample element.
7. Repeat steps 4–6 with the other sample elements.
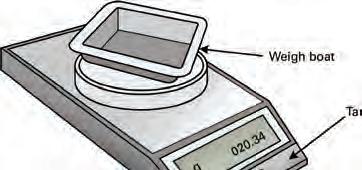

Part 3: Measure the volume of each sample element
8. Add approximately 15 mL of water to the 25 mL measuring cylinder and record the initial volume in cubic centimetres (1 mL = 1 cm3).
9. Gently place the first sample element into the measuring cylinder and record the new volume in the table.
10. Remove the sample element by tipping the water out of the measuring cylinder.
11. Repeat steps 8–10 with the other sample elements.

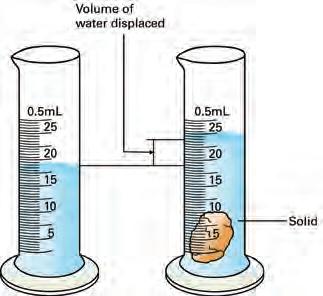
Results
Table showing the position of three elements in the periodic table and their calculated densities
Element sample Position in periodic table (group, period)
Carbon
Silicon Tin
1. Calculate the volume of each sample element in cubic centimetres and record it in the results table.
2. Calculate the density of each sample element using the formula and record it in the results table.
3. Draw a scatter plot to analyse the relationship between the period numbers and densities of different elements.
4. Add a line of best fit to the graph, if possible. Note the type of line that fits best to reflect the relationship between the two variables.
Discussion: Analysis
1. Describe the trend or pattern that was found when the line of best fit was applied to the graph. What type of relationship was found?
2. Predict the densities of germanium (period 4) and lead (period 6) using your graph. Record the predictions in your science book.
Discussion: Evaluation
1. Compare the actual densities for each element (obtained from secondary data sources; the 'properties' tab at the website ptable.com is a good resource to use) with their calculated densities.
2. Determine the percentage difference between the experimentally calculated densities and the actual densities for carbon, silicon and tin.
3. Were the density data obtained in this experiment of sufficient accuracy to be used for predicting the densities of germanium and lead? Justify your response with relevant data.
4. Visit ptable.com to find the actual densities of germanium and lead. Record the actual densities for each in your science book.
5. Determine the percentage difference between the predicted densities and the actual densities for germanium and lead.
6. Can reliable conclusions and predictions be drawn from the results? Justify your response with data.
7. Can you identify possible limitations of this method? Justify your answer using data if possible.
8. Suggest any changes that could be made to the method to improve the quality of the data in future experiments. Justify your suggestions by explaining how each change will improve the data quality.
Conclusion
1. Make a claim about the relationship between the density of an element and its position in the periodic table.
2. Support your statement by explaining how the data you gathered support your claim.
3. State whether your hypothesis was supported or not supported by the data.
The periodic table organises the known elements based on various properties, but has it reached its final form? Consider the following exercise:
1. Review: How did the periodic table get to be the way it is now?
2. Predict: How else might it change in the future?
3. Imagine and create: Future changes might come with challenges. How do you think the scientific community could turn these challenges into opportunities?
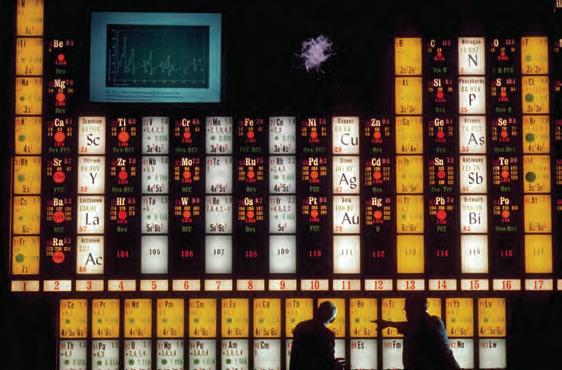
The What can be thinking routine was developed by Project Zero, a research centre at the Harvard Graduate School of Education.
Did you know? 4.1
There are many female scientists who have been instrumental in the discovery of and research into new elements. Some examples are below:
• Marie Curie discovered polonium and radium, elements 84 and 88 (1896).
• Lise Meitner discovered a more stable isotope of protactinium, Pa-231 (1918).
• Marguerite Perey discovered the element francium, element 87 (1939).
• Darleane Hoffman confirmed the existence of seaborgium, element 106 (1974).
• Julie Ezold and Clarice Phelps were involved in the discovery of tennessine, element 117 (2010).
• Dawn Shaughnessy was involved in the discovery of five superheavy elements, elements 114 to 118 (2016).


Remembering
1. List the names of three scientists who attempted to organise elements.
2. Recall who created the first version of the modern periodic table.
3. State the method that most scientists used to arrange chemical elements.
4. State the organisational feature of the modern-day periodic table that was foreshadowed by Döbereiner's triads.
Understanding
5. Explain why de Chancourtois's arrangement was superior to Döbereiner's.
6. Summarise how Mendeleev made his predictions about the properties of elements that were yet to be discovered.
Applying
7. Using Döbereiner's law of triads, calculate the mass of the element B.
Analysing
8. Compare Newlands's and Mendeleev's arrangements.
9. Consider how Newlands reorganised the elements.
Evaluating
10. Propose the reasons why Mendeleev's periodic table was accepted.
11. Discuss the reasons why multiple ways to arrange chemical elements were proposed throughout history.
12. Determine the properties of the middle element in the tables below. Compare your predicted values to the actual values using ptable.com or an alternative website. a)
Figure 4.10 The group 1 metals all have similar properties and so behave in similar ways.
Learning goals
At the end of this section, I will be able to:
1. Label and recognise the groups and periods in the periodic table.
2. Differentiate between metals, non-metals and metalloids by their position on the periodic table and list some general properties of each block.
3. Identify the transition metals, lanthanoids and actinoids on the periodic table.
The modern periodic table organises all known elements by their atomic number, which corresponds to the number of protons in each atom of the element. Hydrogen (H), with one proton, is the first element on the table, giving it an atomic number of 1. Currently, the last element on the periodic table is oganesson (Og), a synthetic element discovered by Russian scientists in 2002 and officially named in 2016. Oganesson has an atomic number of 118, indicating it possesses 118 protons.
Elements within the same group typically exhibit similar chemical properties, meaning that they react with the same chemicals in a similar way. This allows us to predict the behaviour of elements by examining others in the same group. For instance, sodium, a group 1 element, reacts violently with water. Consequently, we can anticipate that potassium, another group 1 element, will react in a similar way. 3
Oganesson is nicely placed in the last position of the noble gases in group 18, but that does not mean that the periodic table is now finished! Elements with atomic numbers greater than 118 are possible, and scientists are currently working to discover these new elements. Where might they go on the modern periodic table?
naming the elements
You may have noticed that many elements have symbols that don't match their English names. Some of them have interesting backstories!
Research the source of the symbol for the following elements:
• Sodium (Na)
• Iron (Fe)
• Lead (Pb)
• Gold (Au)
• Silver (Ag).
The periodic table is arranged into vertical columns called groups. There are 18 groups in total.
1. Decide whether the following statements are true or false. If the statement is false, rewrite it to be true.
a) Groups are the vertical columns in the periodic table.
b) Oxygen (O) is in group 5.
c) As strontium (Sr) is in the same group as silicon (Si), it will have similar properties.
2. Barium (Ba), in group 2, reacts with oxygen (O) to form barium oxide, a metal oxide with the formula BaO. Potassium (K), in group 1, reacts with oxygen (O) to form potassium oxide with the formula K2O. An unknown element was reacted with oxygen. The product was a metal oxide with the formula XO (X being the unknown element). Explain in which group you would place the unknown element.
Groups are the vertical columns and periods are the horizontal rows in the periodic table. There are seven periods in total.
It is often easy to skip over hydrogen (H) and helium (He), but these two elements make up the first period of the periodic table. As you move across a period, the atomic number increases (that is, the number of protons increases), as does the number of electrons period a horizontal row in the periodic table electron the smallest subatomic particle in an atom; arranged around the nucleus in shells
Figure 4.12 Periods are the horizontal rows in the periodic table. See Appendix for a larger version of the periodic table.
This arrangement into groups and periods causes elements to have a specific position on the periodic table. For example, carbon (C) is placed in group 14, period 2, and helium (He) is in group 18, period 1. You might wonder why helium is not placed next to hydrogen, in group 2.
Helium has a full outer shell of electrons and behaves like all the other group 18 'noble gases', being very unreactive, and therefore it is positioned above the other members of group 18.
1. Decide whether the following statements are true or false. If the statement is false, rewrite it to be true.
a) Periods are the horizontal rows in the periodic table.
b) Lithium is in period 1.
2. State the position (group and period) of the following elements in the periodic table.
a) copper (Cu)
c) neon (Ne)
b) calcium (Ca)
d) aluminium (Al)
Try this 4.1
melting points in the periodic table
While we have identified some patterns or trends in the periodic table, like chemical reactivity, a trend in a property such as the melting point of elements is more challenging to identify.
Analyse Figure 4.13.
1. What trends are observed in the melting point of the transition metals? What trends are observed in the melting point of group 14 elements? Are there any other trends you can identify with regard to melting points?
2. Are there any anomalies in your observed trend?
3. What can you deduce about the elements in the periodic table from your answer to questions 1 and 2?
Figure 4.13 Is there a trend in melting points in the periodic table? See Appendix for a larger version of the periodic table.
The periodic table can be further split up into different blocks. Elements can be classified as metals, non-metals or metalloids.
Metals make up most of the elements in the periodic table. In fact, 93 of the 118 known elements are metals, and they sit on the left-hand side of the table. Almost all metals in the periodic table are solids at room temperature; the exception is mercury (Hg), which is a liquid.
Metals have particular properties. They:
• are lustrous
• have high melting and boiling points
• are malleable
• have higher densities than non-metals
• are ductile
• are good conductors of heat and electricity.
lustrous in metals, having a shiny surface malleable can be hammered or beaten into a new shape ductile can be drawn out into long, thin wires
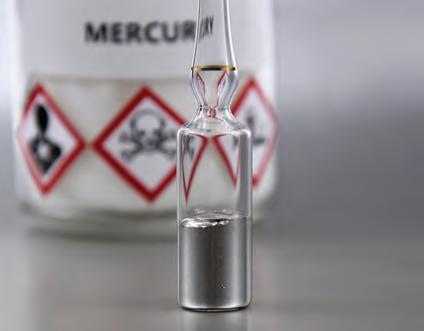
Figure 4.15 Three colours show the elements classified as metals, non-metals and metalloids. The red box shows the location of the transition metals. See Appendix for a larger version of the periodic table.
transition metals the block of metals containing the elements in groups 3 to 12 and in periods 4 to 7 in the periodic table
The actinoids contain elements with atomic numbers from 89 to 103 (in period 7). They are primarily synthetic elements with a few exceptions, such as uranium. The nuclear instability of these elements, including uranium, means they are radioactive. 1
The transition metals are a large block of metals in the centre of the periodic table containing the elements from groups 3 to 12 in periods 4 to 7 (see Figure 4.15). These metals are generally hard and dense, but chemical reactivity does vary among the transition metals. Iron (Fe), silver (Ag), chromium (Cr) and zinc (Zn) are all transition metals but differ vastly in reactivity.
The lanthanoids and actinoids are elements that are positioned at the bottom of the periodic table because they exhibit properties distinct from both group 2 metals and the transition metals. Elements in their respective series have similar properties and are considered to be part of the 6th and 7th periods. They are separated from the rest of the periodic table to maintain the organisation and periodic trends of the table.
The lanthanoids include elements with atomic numbers from 57 to 71 (in period 6) and are sometimes called the 'rare earth elements' along with scandium (Sc) and yttrium (Y), two other elements commonly found in ores containing the lanthanoid elements. The lanthanoids are lustrous grey metals.
Did you know? 4.2
australian scientists help to add a new element to the periodic table Element 117, or tennessine as it is currently known, was first created in 2010 by a Russian–American team of scientists. For the element to be accepted into the periodic table, a second separate creation was needed. A collaboration in Germany was able to confirm the element's existence, and Australia had a role too!
The superheavy artificial element lasts for just 0.1 of a second and is made by colliding the nuclei of smaller atoms together. The Australian National University has an accelerator that was used to help detect the tennessine atoms as they formed. This helped get it onto the periodic table.
Science as a human endeavour 4.1
The lanthanoids are fascinating elements; each has unique luminescent (light-emitting) properties. The light emission of the lanthanoid elements shows bands of very specific wavelengths. This gives the lanthanoids pure colours of visible light emission, making them useful for applications such as the LED pixels in mobile phones and televisions. For example, europium (Eu) emits red light, terbium (Tb) green light and thulium (Tm) blue light.

Interestingly, the lanthanoid ytterbium doesn't emit visible light, but instead emits near-infrared (NIR) light. These wavelengths of light cannot be seen by humans with the naked eye, but they can be seen by some nocturnal animals. This is the type of light that night-vision goggles detect and translate to green visible light on a screen for humans to view, making vision on a dark night possible.
The efficiency and long lifetime of their emissions make the lanthanoids ideal candidates for use in new light-emitting materials. Researchers are continuing to make even brighter emissions and to use these cutting-edge materials for other devices besides mobile phones and nightvision goggles.
WORKSHEET
Properties of metals and non-metals
1. Select the correct word to complete this sentence: The block of elements in the middle of the periodic table, containing groups 3 to 12, is called the ___________.
metalloids elements in the periodic table that are situated close to the border between metals and non-metals; they share properties and appearance characteristics with both metals and non-metals
2. Identify which of the following is a transition metal: sodium (Na), tungsten (W), europium (Eu), aluminium (Al).
3. Decide if the following statements are true or false. If the statement is false, rewrite it to be true.
• Lanthanoids are part of the sixth period on the periodic table.
• Metals are on the right of the periodic table.
• Lanthanoids and actinoids are all non-metals.
Non-metals (except hydrogen) are located on the right-hand side of the periodic table. There are fewer non-metals than metals, but their properties are much more varied. The naturally occurring non-metals consist of one liquid – bromine (which exists as Br2) –five solids and 11 gases at room temperature.
In general, non-metals:
• are dull
• are brittle, meaning they will shatter when bent or struck with something hard
• have a lower density than metals
• have low melting and boiling points
• are poor conductors of heat and electricity.
The elements located between the metals and non-metals are called metalloids. Six elements are typically classified as metalloids: boron (B), silicon (Si), germanium (Ge), arsenic (As), antimony (Sb), and tellurium (Te).The metalloids share some properties of metals and non-metals. For example, germanium has a lustrous grey appearance, like a metal, but is a non-conductor of electricity and is brittle like the non-metals.
Table 4.3 summarises the properties of metals and non-metals.
Lustrous Dull
High density
Low density
Good conductors of heat and electricityPoor conductors of heat and electricity
Malleable and ductile Brittle
High melting and boiling points
Low melting and boiling points
Table 4.3 Properties of metallic and non-metallic elements
1. Recall the side of the periodic table where metals are located and the side where non-metals are located.
2. Select the correct word to complete this sentence:
The name given to elements that behave like metals and non-metals is ____________.
3. Decide whether the following statements are true or false. If false, correct the statement to make it true.
a) Metals have high melting points.
b) Almost all metals are liquids at room temperature.
c) There are more non-metals than metals on the periodic table.
d) There are only two elements on the periodic table that are liquid at room temperature.
e) Non-metals are generally dull but can conduct electricity.
i used to think … now i think … : The structure of the periodic table
Consider how your understanding of the periodic table has changed as you have learned about how it is organised. Think about its history, structure, properties, groups, periods and blocks.
Complete the following sentence stems:
I used to think …
Now I think …
The I used to think ... Now I think ... thinking routine was developed by Project Zero, a research centre at the Harvard Graduate School of Education.
Aim
To investigate the properties of metals and non-metals
Materials
• 12 V light globe (LEDs can also be used)
• connecting wires and alligator clips
• 12 V battery or power pack
• fine sandpaper
• samples of six metals and non-metals – for example, sulfur, magnesium, silicon, copper, iron/steel, tin, zinc, aluminium, carbon
Method
Electrical shocks may occur. Elements may become hot. Ensure the recommended voltage output is not exceeded. Turn the power supply off when changing the circuit.
1. Draw up a table like the one in the Results section. Include the six metals and non-metals you are investigating. Also select a property you would like to investigate as well as those already listed.
2. Use the fine sandpaper to rub each substance and determine its lustre – is it shiny or dull? Record your observations in your table.
3. Try to bend each of the substances – is it malleable or not? Record your observations in your table.
4. Make a prediction about the electrical conductivity of each of the substances.
5. Connect each substance as shown in Figure 4.19 – does it allow electricity to pass through, making the globe glow? Record your observations in your table.
Power supply Globe
Material to be tested
Alligator clips
Figure 4.19 Experimental set-up for testing the electrical conductivity of different substances
6. Investigate another property of your choice.
Results
Table showing the properties of metals and non-metals observed during this investigation SampleLustreMalleabilityElectrical conductivity Your choice of property
Prediction: Observation:
Prediction:
Observation:
Prediction: Observation:
Prediction:
Observation:
Prediction: Observation: Prediction: Observation:
Discussion: Analysis
1. Which of the substances you tested were metals and which were non-metals? Were there any exceptions? List them and name the group that these exceptions belong to.
2. Explain how you tested for your choice of property.
3. Recall the difference between a physical property and a chemical property. Then, summarise the physical properties that metals have in common and the physical properties that non-metals have in common. Name some exceptions and state how they are different.
4. Are the substances you tested elements, compounds or mixtures? Explain your answer by including definitions of these terms.
5. Imagine you have discovered a new element. What tests would you carry out in order to determine whether the substance was a metal or a non-metal?
Conclusion
1. Make a claim about the relationship between the properties observed and whether a material is a metal or non-metal.
2. Support your statement by explaining how the data you gathered support your claim.
Remembering
1. State the number of groups on the periodic table.
2. Name one of the following.
a) an element in period 4
b) an element in group 18
c) a transition metal
d) an actinoid
3. State helium's period on the periodic table.
Understanding
4. Identify the element that is in the following positions.
a) period 4, group 6
b) period 2, group 13
c) period 5, group 18
Applying
5. Describe the properties of metalloids.
Analysing


d) period 7, group 1
e) period 6, group 15
6. Classify the following elements as either metals or non-metals.
ElementMetal or non-metal
Oxygen (O)
Boron (B)
Aluminium (Al)
Iodine (I)
Nickel (Ni)
7. Compare the properties of metals and non-metals.
8. Categorise the following elements as a transition metal, lanthanoid, actinoid or metalloid.
Element
Promethium (Pm)
Zinc (Zn)
Arsenic (As)
Thorium (Th)
Ytterbium (Yb)
Evaluating
9. Decide what happens to the number of protons as you move to the right across a period.
10. A new element is discovered that:
• is shiny
• conducts electricity
• is malleable
• sinks when placed in water.
Determine from these properties whether it will be categorised as a metal or a non-metal.
At the end of this section, I will be able to:
1. Write an electron configuration for the first 20 elements.
2. Outline how electron configuration allows for the identification of period and group number, and therefore the properties of different elements.
3. Describe how electrons can have a ground state and an excited state.
4. Differentiate between electrons in an ionic bond and in a covalent bond.
An atom is made up of a nucleus of positively charged protons and neutral neutrons surrounded by orbiting negatively charged electrons. In this chapter, electrons will be shown orbiting the nucleus in different energy levels, called 'shells'. This shell configuration is shown in Figure 4.20 for the element lithium (Li) with three electrons.
As electrons are negatively charged, they repel (move away from) each other while moving around the nucleus. At the same time, they are attracted to the protons within the nucleus. Therefore, electrons organise themselves in spaces around the nucleus to minimise the possible repulsion from other electrons. This results in electron shells, which are shown as layers that are different distances from the nucleus and can hold different maximum numbers of electrons. Electrons situated in shells furthest away from the nucleus are at higher energy levels than electrons in closer shells.
The first electron shell can hold a maximum of two electrons in its small circumference before the repulsion becomes so much that electrons must move to a second shell. The second shell can hold a maximum of eight electrons, the third shell up to 18 electrons and the fourth shell up to 32 electrons (see Figure 4.21).
4th shell (max. 32 electrons)
3rd shell (max. 18 electrons)
1st shell (max. 2 electrons)
2nd shell (max. 8 electrons)
However, electrons do not fill shells completely before moving to a higher energy shell; in fact, the order of filling is 2,8,8,2 for the first 20 elements. This occurs because electrons repel each other and it requires less energy to place them in a space with less repulsion, even if it is a higher energy level. This phenomenon, in which electrons tend to fill electron shells to a stable number of eight electrons first (or two electrons in the first shell) is referred to as the octet rule. Note that further electron shells exist but are not covered here.
Table 4.4 summarises the maximum number of electrons in each electron shell and the actual order of filling.
4.4 The maximum number of electrons in each electron shell and the order of filling
1. State how electrons arrange themselves in an atom.
2. Complete the sentence by circling the correct italicised words:
The electron shell closest to/furthest from the nucleus is the first/last to be filled.
3. List the maximum number of electrons in the following shells.
a) first shell
b) second shell
c) third shell
The electron configuration is the term we use to describe how the electrons are arranged for a particular element. Remember that when electrons fill shells, they always start from the lowest energy level (the electron shell closest to the nucleus). This means that atoms are always at their lowest energy level, and we call this their ground state
Magnesium (Mg) has an atomic number of 12, so it has 12 electrons. It has an electron configuration of 2,8,2. This shows that there are two electrons in the first shell, eight in the second and two in the third. Figure 4.22 shows the electron configuration of a magnesium atom. The sum of all the numbers in the electron configuration should add up to the total number of electrons in that atom.
d) fourth shell electron configuration the arrangement of an atom’s electrons in the shells around the nucleus ground state the lowest energy level of an atom
Calcium fills its shells with 20 electrons in the order 2,8,8,2 (see Figure 4.23). Electron configurations with more than 20 electrons are beyond the scope of this course as the order of electron shell filling becomes quite complicated.
1)
2)
3)
Quick check 4.7
1. State the name given to atoms when they are at their lowest energy level.
2. State the number of electrons in an element with an electron configuration of 2,8,5.
3. State the atomic number of an element that has 18 electrons.
valence electrons the electrons in the outer shell of an atom
valence shell the outermost shell of the atom that contains electrons atomic radius a measure of atomic size: the distance between the centre of the nucleus of an atom and its valence shell
4. State the electron configuration of
a) an oxygen atom
b) an element with 14 electrons
c) a magnesium atom
d) an atom of the element with the symbol K
e) an element with 18 electrons.
The way atoms react in a chemical reaction is largely determined by the arrangement of their electrons. We know protons and neutrons are situated in the centre of the atom (in the nucleus) and therefore are not affected when particles collide during chemical reactions.
The outermost electrons in an atom are called valence electrons and exist in the valence shell. It is these electrons in the outer shell that are most affected when atoms collide with one another during chemical reactions.
The biggest influence on an element's chemical and physical properties is the number of electrons in the valence shell. This means that elements with the same number of valence electrons are grouped together in the periodic table with similar chemical properties. For example, all elements in group 1 have one valence electron. You can see in Figure 4.24 that their electron configurations all end in the number 1. For groups 13‒18, it is important to note that only the second number of the two digits in the group number translates to the number of valence electrons. That is, carbon, in group 14, has 4 valence electrons (not 14).
We can also determine the period an element is in using its electron configuration. For example, if an electron configuration contains two shells (as for lithium, 2,1), then it is in period 2. If an electron configuration contains three shells, then it is in period 3.
If you look again at Figure 4.24, you will notice that potassium appears bigger than both sodium and lithium, which are both above it on the periodic table. We say potassium has a larger atomic radius than both sodium and lithium, as the distance between the centre of its nucleus and its valence shell is greater. Do you think this trend appears in other groups or across periods?
1. Recall the definition of valence electrons.
2. Recall how reactivity of an element is determined.
3. State the group that the element with the electron configuration 2,8 belongs to, and why.
4. State the period on the periodic table where the element with the electron configuration 2,8,4 is found.
5. State what happens to the atomic radius as you move down group 1.
Try this 4.2
modelling electron configuration
You may have wondered why, particularly in science, we make so many models! Models allow us to represent scientific concepts in a way that can make them more understandable. It allows you to identify your misconceptions and gives your teacher an opportunity to help you.
For this task, try to make a 2D model of an atom, showing its electron configuration. You may like to do this using plasticine, beads, lollies, or pens and paper. For a challenge, try making a 3D model. you could even use a coding program like Scratch or a stop motion app to present your model.
excited electrons
When atoms absorb energy, for example, light or heat energy, the valence electrons gain energy to move to higher-energy electron shells. An electron that has jumped to a higher-energy shell is said to be in an 'excited state', and when it releases energy to return to its 'ground state', that energy is released as a specific wavelength (colour) of light.
Figure 4.25 What happens to atoms when electrons gain energy?
The difference in energy between electron shells is unique for every element, because they have different electron configurations and energy levels. As a result, each element emits a unique wavelength of light. This allows for a qualitative observation and inference of the identity of a particular element based on the colour of the light emission when excited with light or heat. An example of this is a flame test, in which the heat energy from the flame causes the electrons in the substance to become excited. For example, copper (Cu) emits green light and lithium (Li) emits red light, as can be seen in Figure 4.26. Flame tests can be used to work out the elements in an unknown sample.
Figure 4.26 A copper compound burning with a green flame and a lithium compound burning with a red flame
Did you know? 4.3
Fireworks are an example of multiple flame tests occurring all at once as explosions in the sky! The colours observed are due to the absorption and emission of light from various elements, including calcium (yellow), strontium (red) and potassium (lilac).

Try this 4.3
niels bohr and the atomic emission of hydrogen
A spectroscope is an instrument capable of separating white light into a continuous spectrum of visible wavelengths that resembles a rainbow. In 1913, the Danish scientist Niels Bohr used a spectroscope to view the continuous spectrum of light that had been absorbed and emitted by hydrogen. He observed that hydrogen absorbed very specific wavelengths of light (shown in its absorption spectrum) and emitted these exact wavelengths of light (emission spectrum).
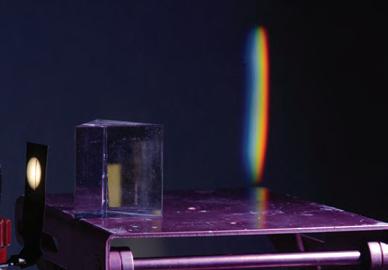
Hydrogen is an atom with one electron, and Bohr theorised that the absorbed light energy was transferred to the electron, which moved to a higher energy state. As the electron released this amount of energy as light it returned to its original energy level. This is the same explanation used to describe the colours observed in a flame test. In 1922, Niels Bohr was awarded the Nobel Prize for this work, which led him to propose an atomic model in which electrons orbited the nucleus in shells.
The pattern of lines on an emission spectrum corresponds to a particular element. It is exactly like a barcode!
1. What are the main differences between an emission spectrum and an absorption spectrum, such as those shown in Figure 4.29?
2. Research which colour of light has the highest energy.
3. Deduce what element is present in the unknown emission spectrum shown in Figure 4.30.
Figure 4.29 The absorption spectrum (a) and emission spectrum (b) of a particular element
Figure 4.30 We can compare emission spectra to find out the identity of an unknown element.
1. Recall what causes electrons to become excited and move up energy levels.
2. State the type of energy that is emitted when electrons return to ground state.
3. Recall how we can identify the type of element present when electrons are excited.
Practical 4.3
Aim
To observe the flame colours of different salt solutions
Materials
• 1 mol L–1 solutions of copper(II) chloride, potassium chloride, sodium chloride, lithium chloride and strontium chloride
• beakers
• test tubes
• two unknown metal compounds
Method
Be careful
Wear appropriate personal protective equipment.
• distilled water
• wooden splints
• Bunsen burner
• bench mat
• matches
1. Copy the results table into your science book. Ensure you include the title.
2. Prior to the lesson, thoroughly soak a supply of wooden splints in a beaker of distilled water.
3. Fill sets of test tubes to half full with the salt solutions and immerse one splint in each of the tubes.
4. Hold a soaked splint in a blue Bunsen flame to reveal the flame colour, being careful not to let the splint burn too vigorously.
5. Dispose of used splints in another beaker filled with water.
6. Repeat steps 4 and 5 for all other known and unknown samples.
Results
Table showing the flame colour of five metal compounds
Metal compound
Copper(II) chloride
Lithium chloride
Strontium chloride
Sodium chloride
Potassium chloride
Unknown 1
Unknown 2
Discussion: Analysis
Name of metal
Colour of flame
1. What provides the energy in this experiment for electrons to be excited to the next energy level?
2. Why is it better to use a blue flame than a yellow safety flame to observe the colour of light emitted?
3. Explain why different colours of light were observed for compounds containing different metallic elements.
4. Justify how you determined the metal in the two unknown compounds.
Discussion: Evaluation
1. Consider the meaning of the term 'subjective'. How could being subjective affect the results of this experiment?
ion a charged version of an atom, formed by the loss or gain of electrons cation a positively charged ion formed by the loss of electrons anion a negatively charged ion formed by the gain of electrons
Not only does the number of valence electrons in an atom influence how it will react in a chemical reaction, it also influences how it will bond with other atoms.
Before we look at bonding and how this occurs, we need to understand something about atoms. Atoms like to be stable. They tend to achieve stability by acquiring an electron configuration like that of the noble gases, with eight electrons in the valence shell. Elements that start out with one, two or three valence electrons tend to lose these electrons to achieve stability. In contrast, elements that start out with five, six or seven electrons tend to gain electrons to achieve stability.
Let's begin by looking at metal atoms.
Metals generally have fewer than four electrons in their outermost shell. Thus, metals tend to lose electrons to obtain a full, stable valence shell. When they lose electrons, they become less negative, and so they form positively charged ions (known as cations) represented like this:
Na+ or Mg2+
A single + sign indicates the atom has lost one electron, while a number before the + sign indicates how many electrons were lost.
Non-metals, located on the right-hand side of the periodic table, have valence shells that are almost full. To achieve stability, non-metallic atoms tend to gain electrons because it is easier for them to acquire a few electrons than to lose many. This results in the formation of negatively charged ions, known as anions, which can be represented like this:
S2– or F–
A single – sign indicates the atom has gained one electron, while a number before the – sign indicates how many electrons were gained.
In summary, ions can be either positive (cations) or negative (anions), indicating that an atom has lost or gained electrons, respectively.
Figure 4.31 An oxygen atom has an electron configuration of 2,6. It tends to gain two electrons to achieve a stable outer shell, giving it an electron configuration of 2,8. It now has a net negative charge and is represented as O2–
The large hadron Collider
The Large Hadron Collider (LHC) is used for international scientific research and is based at the laboratory operated by CERN on the border of Switzerland and France. The LHC is a particle accelerator that can make particles, like protons and ions, collide at close to the speed of light!
Use your preferred search engine to find the Large Hadron Collider page on the CERN website. Explore the facts and figures for answers to the following questions.
1. How long is the ring used to accelerate particles at the LHC?
2. What is a hadron?
3. What is one of the main goals of the LHC?
Ionic bonding occurs when a metal atom loses its electrons to achieve stability and transfers them to a nonmetal atom, which gains the electrons to become more stable. This results in the formation of a positively charged metal cation and a negatively charged non-metal anion (see Figure 4.32).
Positively charged cations are electrostatically attracted to negatively charged anions, and this attraction is known as an ionic bond.
These strong electrostatic forces bond the ions together into an ionic compound, which tends to take on a lattice structure. The structure of a sodium chloride lattice is shown in Figure 4.33. Because the bond is strong, ionic compounds tend to have high melting temperatures. For example, table salt (NaCl) has a melting point of 801°C.


ionic bond a strong bond between an anion and a cation, formed via electron transfer lattice structure a three-dimensional arrangement of atoms that pack together very tightly and form bonds that are extremely strong because the atoms bond to each other in multiple directions


covalent bond a strong bond almost always between two nonmetals that share electrons, forming a molecule


Figure 4.33 A sodium atom donates an electron to a chlorine atom (left). The sodium atom now forms a positively charged cation and the chlorine atom forms a negatively charged anion. These ions are attracted and bond into an ionic compound (right). A crystal lattice configuration is a common structure of ionic compounds.
A covalent bond is the sharing of valence electrons, typically between two non-metal atoms. In most cases, both atoms have almost full valence shells and, rather than donate and gain electrons as in an ionic bond, they share some of their valence electrons. Covalently bonded atoms together form molecules.
WORKSHEET Ionic and covalent bonding DOC VIDEO Ionic versus covalent bonding
For example, an oxygen (O) atom has an electron configuration of 2,6. Oxygen is certainly capable of accepting electrons to form the oxide ion (O2–) and contribute to ionic bonding. However, it can also share two electrons with another non-metal to complete its valence shell. An oxygen atom could share two electrons with two hydrogen atoms, which each require one electron to complete their valence shells. Look at the molecule in Figure 4.34: each hydrogen atom has a full outer shell (two electrons), and the oxygen atom has a full outer shell (eight electrons). Each bond in a covalent molecule is a shared pair of electrons.
Figure 4.34 (a) Two hydrogen atoms and an oxygen atom showing only their valence electrons. These electrons covalently bond to form a water molecule. (b) The lines between the atoms represent covalent bonds.
Quick check 4.10
1. Define these terms.
a) ion
b) cation
c) anion
2. Explain why certain elements are likely to form cations while others tend to form anions.
3. Complete the following sentences by filling in the blanks.
a) Covalent bonds are usually between a _____________ and a ______________ atom.
b) Ionic bonds are usually between a _____________ and a ______________ atom.


Section 4.3 review
quiz Teachers can assign tasks and track results
questions
Section 4.3 questions
Remembering
1. State the correct numbers to complete the following table:
Electron shell Maximum number of electrons
First Second Third Fourth
2. Recall why the shell closest to the nucleus fills with electrons first.
3. State the electron configurations for the following elements.
a) helium (He)
b) beryllium (Be)
Understanding
Go
c) phosphorus (P)
d) potassium (K)
4. For each of the following electron configurations, state the:
• name of the element
• number of valence electrons
• period the element is in
• group the element is in.
a) 2,8,2 b) 1
c) 2,5 d) 2,8,8,2
5. The electron configuration of carbon is 2,4. Draw a diagram of a carbon atom with this electron configuration.
6. Describe the order in which electrons fill shells around the nucleus.
Applying
7. Explain why elements in the same group have similar properties.
8. Chlorine has the electron configuration 2,8,7. Represent the arrangement of the electrons within a chlorine atom in a diagram.
9. Use your knowledge of electron arrangement to explain what is significant about the electron configurations of group 18 elements.
Analysing
10. Compare the number of protons and electrons in an uncharged atom with those in an ion.
11. Distinguish between valence electrons and other electrons of an atom.
12. Compare how an oxygen atom would participate in an ionic bond versus a covalent bond.
Evaluating
13. Helium, a group 18 element, has the electron configuration 2, meaning that it has two valence electrons. Discuss why helium is not located next to hydrogen with the other group 2 elements, which also have two valence electrons.
14. Construct a diagram that shows an example of what happens when electrons are excited from ground state.
15. A student was instructed to conduct a flame test using copper chloride and strontium chloride. Discuss the results they would obtain.
At the end of this section, I will be able to:
1. Recall the physical properties and reactivity trends in group 1 and 2 metals.
2. Recall the physical properties and reactivity trends in group 17 and 18 non-metals.
Generally, the periodic table groups elements based on similar chemical properties such as reactivity. This is more true in some groups of the periodic table than others. Groups 1, 2, 17 and 18 are examples of groups having consistent chemical properties and will be explored in this section. Remember that elements in a group tend to have the same number of valence electrons, which is the primary factor that influences chemical reactivity.
The alkali metals (group 1) make up the first group of the periodic table. The elements lithium (Li), sodium (Na), potassium (K), rubidium (Rb), caesium (Cs) and francium (Fr) all belong to the alkali metals. Note that hydrogen is also in group 1 but is not considered an alkali metal as it is a non-metal.
The alkali metals, including those you might observe in the classroom (sodium (Na) and potassium (K)), are soft and can be cut with a knife. When they are cut open, they have a shiny appearance on the inside compared to their dull outer surface. This is because their outer surfaces readily react with oxygen in the air, forming dull metal oxides.
This reaction can be written as the following word and balanced chemical equations.
+ oxygen → sodium oxide
When placed in water, lithium, sodium and potassium will float as they are less dense than water. Again, this is unlike most other metals you may have encountered.

4.36 A piece of sodium metal that has been cut by a knife. It is shiny on the inside and dull on the outside.
All group 1 metals are highly reactive due to their one valence electron. Recall that elements are stable when they have a full outer shell of electrons, so group 1 metals readily react with other atoms by donating the one valence electron. When they do this, they all form ions with a +1 charge.
The elements in group 1 become more reactive the further you go down the group. This is because the one valence electron is farther away from the nucleus and so is less attracted to it as the atom gets larger (there are more electron shells). The weaker attraction to the nucleus makes the electron easier to lose when colliding with other atoms. In fact, caesium can be quite explosive when reacting with substances such as water.
Group 1 elements readily react with group 17 elements, forming white salts – one of these salts being table salt that you might put on your chips!
The following word and balanced chemical equations show how sodium (Na) reacts with chlorine (Cl) to form table salt (sodium chloride, NaCl).
sodium + chlorine → sodium chloride
2Na + Cl2 → 2NaCl
To show how other alkali metals and group 17 elements react with each other, all you need to do is substitute their chemical names and symbols into the equations above.
Alkali metals are most famous for their reaction with water, and this is where they get their name. All group 1 metals react violently with water, producing hydrogen gas and an alkaline solution.
The word and balanced chemical equations show what happens when sodium reacts with water.
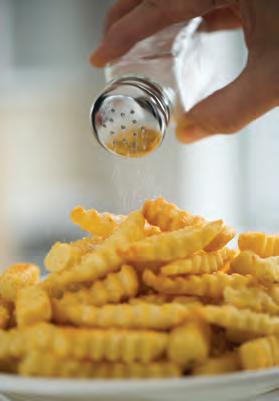
You can use these equations to predict what will happen when other alkali metals react with water.
Did you know? 4.4
Group 1 metals, such as sodium and potassium, are stored in jars of oil. When they come into contact with oxygen or water, these metals react, producing a lot of heat, an alkaline solution and hydrogen gas. This can often cause the metals to burst into flames. Due to this fire risk, group 1 metals are stored in oil, to be protected from oxygen and water vapour. The reactivity of group 1 metals increases down the group, so don't add caesium or francium to water!
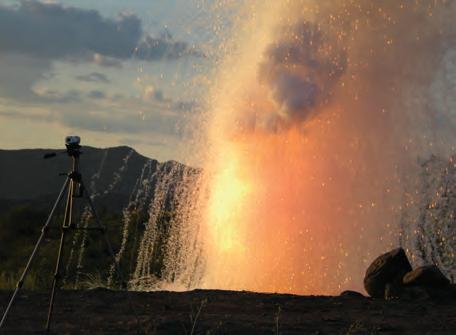
Figure 4.39 What happens when sodium reacts with water? Here, the hydrogen gas produced has ignited.
investigating the reactivity of group 1 metals
Aim
To determine the order of reactivity of two group 1 metals
Hypothesis
Write a prediction stating which metal you think will be the most reactive out of sodium and potassium.
Materials
• sodium and potassium metals
• universal indicator
• large thick-walled glass bowl
• scalpel blade
• white tile
Method
1. Copy the results table into your science book.
Steps 2–6 will be performed by your teacher.
• absorbent paper
• tweezers
• safety screen
• disposable gloves
Be careful
This demonstration should only be performed by your teacher. Stay behind the safety screen at all times. Wear appropriate PPE.
2. Half fill the large glass bowl with water and add about 10 mL of universal indicator, until the colour can be seen throughout the liquid.
3. Using the tweezers, take a piece of sodium from its bottle and place it on the white tile.
4. Use the scalpel to cut off a small piece of the metal and observe the appearance of the metal on the inner and outer surfaces.
5. Making sure that all students are behind the safety screen, add the small piece of metal to the water and record your observations.
6. Repeat steps 2–5 with potassium.
Results
Table showing the properties of two group 1 metals
Metal
1. Explain the decision to use tweezers rather than hands to pick up the metals.
2. Why was a safety screen necessary when conducting this experiment?
Discussion: Analysis
1. Describe the purpose of the universal indicator.
2. Describe any patterns, trends or relationships in your results.
3. Describe how you determined the reactivity of each of the metals investigated.
4. How did you determine whether the metals were more or less dense than water?
5. Explain how the reactivity of the metals changes as you go down group 1.
Conclusion
Observations during reaction
1. Make a claim regarding the varying levels of reactivity of group 1 metals based on this experiment.
2. Justify your claim by explaining how the data you gathered support it.
3. State whether your hypothesis was supported or not supported based on your findings.
Consider what you have learned about the reactivity of the alkali metals in group 1.
How are the ideas and information you have learned connected to what you already know from sections 4.2 and 4.3 of this chapter?
What new ideas did you learn that extended your thinking? What challenges or puzzles emerge for you?
1. State why group 1 metals are also known as alkali metals.
2. Explain why alkali metals form +1 ions when they react with other substances.
3. Write a word equation for lithium reacting with fluorine.
4. Suggest why alkali metals are shiny on the inside and dull on the outside.
5. Identify whether the following statements are true or false. If false, rewrite the statement to be true.
a) Alkali metals are more dense than water, so they float.
b) Alkali metals react with oxygen to form metal oxides.
c) Alkali metals are hard.
6. Other than an alkaline solution, identify what other product is formed when alkali metals react with water.
7. Identify which metal is the most reactive in group 1.
Group 2 metals are also known as the alkaline earth metals. This group contains the elements beryllium (Be), magnesium (Mg), calcium (Ca), strontium (Sr), barium (Ba) and radium (Ra).
The naturally occurring alkaline earth metals tend to be shiny and silvery white in colour, just like the group 1 metals (under their oxide layer). They are also good conductors of heat and electricity. However, the alkaline earth metals tend to be more dense, harder and have higher melting and boiling points than the group 1 metals.
All group 2 elements are reactive, but not as reactive as group 1 elements. This is because they have two valence electrons compared to one in group 1 elements. Group 2 elements form ions with a charge of +2 as they lose two electrons when they react.
Just like group 1 metals, alkaline earth metals react with water to form alkaline solutions, react with oxygen to form metal oxides and react with group 17 elements to form metal salts. Table 4.5 shows the names and formulas of the products formed for reaction with oxygen and chlorine.
Element
Beryllium (Be)
Magnesium (Mg)
Calcium (Ca)
Product formed when reacting with oxygen
Beryllium oxide
BeO
Magnesium oxide
MgO
Calcium oxide
CaO
Product formed from reacting with chlorine
Beryllium chloride
BeCl2
Magnesium chloride
MgCl2
Calcium chloride
CaCl2
Table 4.5 The products formed when group 2 metals react with oxygen and chlorine
1. List four of the alkaline earth metals.
2. State the charge that alkaline earth metals tend to form when they react.
investigating the reactivity of group 2 metals
Aim
To investigate the relationship between the position of a group 2 element in the periodic table and its reactivity with acid
Useful formula
Change in volume (mL) = final volume (mL) – initial volume (mL)
Rate of gas produced (mL min–1) = mean change in volume (mL) meanreaction time (min)
Hypothesis
Be careful To reduce risk of skin burn from acid:
• Wear appropriate personal protective equipment.
• Wear safety glasses at all times.
• Wash your hands after the investigation.
Develop a hypothesis by predicting how the different periodic positions of the group 2 metals will affect their reactivity.
Materials
• similarly sized samples of calcium (approximately 5 mm in diameter) × 3
• similarly sized samples of magnesium (approximately 5 mm in diameter) × 3
• 30 mL hydrochloric acid (1 mol L–1)
• test tubes × 6
• 10 mL measuring cylinder
• 100 mL measuring cylinder
• test-tube holder
• rubber stopper to fit the test tube, with glass tubing inserted through the stopper
• rubber stopper to fit the 100 mL measuring cylinder
• 4 mm plastic tubing (minimum 30 cm)
• large bowl
• retort stand, bosshead and clamp
• stopwatch
• tweezers
Method
Part 1: Prepare
1. Identify as many controlled variables as possible and describe how these will be managed to prevent any from affecting the measurements.
2. Complete a risk assessment for this investigation, describing how any risks will be controlled.
3. Copy the results table into your science book.
Recommended: Use a spreadsheet to analyse the data for this experiment and calculate uncertainty.
Part 2: Measure the reactivity of the first metal sample
4. Fill the large bowl with tap water.
5. Fill the 100 mL measuring cylinder with tap water.
6. Stopper the measuring cylinder using the rubber stopper (a complete seal will not be possible).
7. Invert the measuring cylinder into the large bowl (your teacher will show you how to do this if you are not sure) and clamp it in place with the stopper below the water line, as shown in Figure 4.41.
8. Remove the stopper from the measuring cylinder.
9. Attach the plastic tubing to the glass tubing on the rubber stopper. Place it beside the measuring cylinder for easy access later.
10. Measure 5 mL of 1 mol L–1 hydrochloric acid and pour into a test tube.
11. Using tweezers, add a piece of the first metal sample into the acid in the test tube. Be careful not to splash the acid.
12. Attach the rubber stopper with the plastic tubing to the test tube and position the end of the plastic tubing underneath the measuring cylinder so the gas can be collected.
13. Measure the initial volume of the gas in the inverted measuring cylinder and record in your table. Start the stopwatch.


14. After 5 minutes, record in your table the final volume of the gas in the inverted measuring cylinder.
15. Remove the rubber stopper and tubing from the test tube. Store the test tube and contents in the test-tube holder.
16. Repeat steps 10–15 with the other two samples of the first metal.
17. Remove the measuring cylinder and refill it with tap water.
Part 3: Measure the reactivity of second metal sample
18. Repeat steps 7–16 from Part 2 with the second metal samples.
Results
Table showing the mean rate of gas production for different group 2 elements reacting with acid
1. Calculate the change in gas volume for each trial and record it in the results table.
2. Calculate the rate of gas production in mL min–1 for each metal and record it in the results table.
3. Calculate the uncertainty for each metal.
Discussion: Analysis
1. Compare the mean rate of gas production for the different elements.
2. Predict the trend in reactivity for group 2 elements that are positioned lower on the periodic table.
3. Explain the relationship between completing an experiment three times (in triplicate) and the reliability of the data.
Discussion: Evaluation
1. Compare the uncertainties for each element. Which were the best results? Justify your answer with data.
2. Critique your management of the controlled variables. Were they managed properly to ensure they did not change and affect the measurements?
3. Could these results be used to predict reactivity trends in other groups on the periodic table? Explain your reasoning.
4. Suggest any changes that could be made to the method to improve the quality of the data in future experiments. Justify your suggestions by explaining how each change will improve the data quality.
Conclusion
1. Make a claim about the relationship between the position of a group 2 element in the periodic table and its reactivity with acid.
2. Justify your claim by explaining how the data you gathered support it.
3. State whether your hypothesis was supported or not supported based on your findings.
halogens group 17 elements
Group 17 elements are known as the halogens. This group contains the elements fluorine (F), chlorine (Cl), bromine (Br) and iodine (I). Astatine (At) is also a halogen, but it is a rare radioactive element and will not be considered here.
Physical properties
The halogens form diatomic molecules (for example F2), and their states and colours vary at room temperature. For example, fluorine and chlorine are gases, bromine is a liquid and iodine is a solid. Table 4.6 lists some of the properties of these elements.
BromineBr2 Liquid Red
IodineI2 Solid Grey (purple in gas state) 114184
Reactivity increases up the group ChlorineCl2 Gas Greenishyellow
Reactivity
All group 17 elements have seven valence electrons. When they react with other substances, they gain an electron to make a full outer shell of eight electrons. This means that they form ions with a charge of –1, or they covalently bond with non-metal atoms capable of sharing one electron.
As shown in Table 4.6, the reactivity of group 17 elements decreases as you move down the group. As the atom gets larger, the valence shell is further from the nucleus. This makes it more difficult for the elements to attract electrons to fill the valence shell.
halogen light globes help special lampshades become indoor purifiers!
In 2023, a team of scientists published work on their incredible design – a lampshade with a filter! The lampshade has a special coating that transforms air pollutants into harmless compounds. The lampshade targets volatile organic compounds (VOCs), which account for most indoor airborne pollutants. Interestingly, halogen light globes use only 10% of their power to make light. The remaining 90% is wasted as heat energy. This team has worked out how to use the wasted heat to activate a catalyst that acts to break down the VOCs in the air.
1. Name three elements in group 17.
2. State the charge of a group 17 ion.
3. State one physical or chemical trend that can be observed going down group 17.
The noble gases (group 18)
Group 18 elements are also known as the noble gases. This group contains the elements helium (He), neon (Ne), argon (Ar), krypton (Kr), xenon (Xe) and radon (Rn).
The noble gases tend to be colourless, odourless and non-flammable. They are all gases at room temperature, have low densities, low melting and boiling points, and are poor conductors of heat and electricity. Their applications include neon signs, like the Victoria Bitter sign shown in Figure 4.43.

Unlike the other groups we have discussed, noble gases are extremely unreactive and are sometimes called the inert gases to reflect this.
Figure 4.44 Group 18 elements all have eight valence electrons and therefore a full outer shell.
What are the elements used for in the ‘real’ world?
We have learned a lot about the physical properties and the reactivity of some special groups of elements in the periodic table. But what are they used for in the 'real' world?
Research the uses of elements from the different groups covered in Section 4.4. When recording your findings, describe how the physical properties of the element relate to its use/s.
1. Name three elements in group 18.
2. State why group 18 elements don't form ions.
Section 4.4 review
Section 4.4 questions
Remembering
1. State the group number of the following.
a) alkaline earth metals
b) halogens
c) noble gases
d) alkali metals
2. Recall what happens to the reactivity as you move down group 1.
3. State the number of valence electrons for the elements in each of the following groups.
a) alkali metals
b) alkaline earth metals
c) halogens
d) noble gases
4. A new element is discovered. It is shown to form an ion with a charge of +2. Identify which group it could belong to.
Understanding
5. Identify if the following statements are true or false. If false, rewrite the statement to be true.
a) All halogens are gases.
b) All alkali metals form hydrogen when they react with water.
c) Noble gases do not form ions.
d) Alkaline earth metals form ions with a +2 charge.
e) The general formula of a halogen molecule is X2
6. Explain why group 2 elements are less reactive than group 1 elements.
7. Helium does not have eight valence electrons. Explain why it is still classified as a noble gas.
8. Explain why alkali metals are stored in oil or even sealed in inert gases.
Applying
9. Classify the following elements as alkali metals, alkaline earth metals, halogens or noble gases.
a) magnesium
b) argon
c) sodium
d) potassium
e) iodine
Analysing
10. Compare the properties and reactions of group 1 and 2 elements.
11. Use Table 4.7 to predict the properties of astatine.
HalogenFormula
FluorineF2 Gas Yellow −220−188
ChlorineCl2 Gas Greenishyellow −101−35
BromineBr2 Liquid Red −7.258.8
IodineI2 Solid Grey (purple in gas state) 114184
Table 4.7 Properties of halogens
Evaluating
Reactivity increases up the group
12. Use examples provided in the text to construct a balanced chemical equation for the reaction between the following.
a) rubidium and water
b) lithium and oxygen
13. Predict the products of the following reactions.
a) potassium and water
b) magnesium and chlorine
c) calcium and oxygen
d) sodium and fluorine
14. Propose why group 18 was not present in Mendeleev's periodic table.
15. Decide if you would expect strontium to be chemically more similar to calcium or rubidium, giving reasons for your choice.
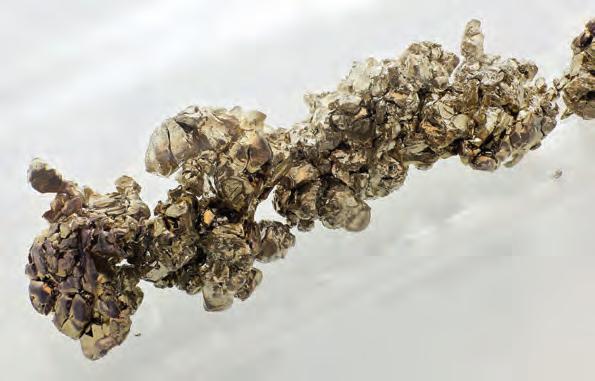
Chapter checklist
Success criteria Linked questions
4.1 I can recall the scientists involved in the development of the periodic table. 7
4.1 I can describe how Mendeleev arranged the elements according to their structure and properties. 10, 17
4.2 I can label and recognise the groups and periods in the periodic table. 1
4.2 I can differentiate between metals, non-metals and metalloids by their position on the periodic table and list some of their properties. 8, 14, 21
4.2 I can identify the transition metals, lanthanoids and actinoids on the periodic table. 3, 5
4.3 I can write an electron configuration for the first 20 elements. 9, 12
4.3 I can outline how electron configuration allows for the identification of period and group number, and therefore the properties, of different elements. 2, 6, 18, 19
4.3 I can describe how electrons can have a ground state and an excited state. 20
4.3 I can differentiate between electrons in an ionic bond and those in a covalent bond. 13, 15
4.4 I can recall the physical properties and reactivity trends in group 1 and 2 metals. 4, 16
4.4 I can recall the physical properties and reactivity trends in group 17 and 18 non-metals. 11, 14
Remembering
1. State the group and period of the following elements.
a) boron (B) b) titanium (Ti) c) platinum (Pt) d) strontium (Sr)
2. State the group number of the following elements.
a) an element with the electronic configuration 2,8,1
b) an element with 18 electrons
c) a halogen
d) a noble gas
3. Identify each of the following elements as a transition metal, lanthanoid or actinoid.
a) europium (Eu) b) rhenium (Re) c) uranium (U)
4. Magnesium and beryllium are in group 2. State the other name given to elements in group 2.
5. Identify the names and positions of three elements that are transition metals.
6. State why elements are placed together in the same group.
7. List the scientists involved in the development of the periodic table.
Understanding
8. Describe the position of metals and non-metals on the periodic table.
9. Write the electron configuration for a sulfur atom.
Applying
10. Explain why Mendeleev left gaps in his periodic table.
11. Describe the change in properties of the halogens as you move down group 17.
12. Illustrate the electron arrangement of an atom of carbon in a diagram.
Analysing
13. Compare ionic and covalent bonding by completing this table:
Bond description Ionic bondingCovalent bonding
Strength of bond
Bond is between ___ and ___.
How is the bond formed?
14. Compare the properties of iron and chlorine gas.
15. Observe the ammonia molecule shown in Figure 4.45. It is a gas at room temperature and has a chemical formula of NH3 Identify the type of bonding between the nitrogen and hydrogen atoms.
16. Contrast the physical and chemical properties of group 1 and group 2 elements.
17. Critique Mendeleev's method of predicting the properties of unknown elements.
Evaluating
18. A unknown element is found to:
• react violently with water
• feel soft
• have an electron configuration of 2,8,8,1.
Given those properties, determine the group in which it belongs. Give reasons for your choice.
19. Determine the relationship of an element's atomic number, number of electrons and its position in the periodic table.
20. Explore how Niels Bohr used the absorption and emission spectra of hydrogen to propose how electrons are configured in an atom.
21. Use the melting point data below to predict the physical states (solid, liquid or gas) of the unknown elements at room temperature. Note that room temperature is around 25°C.
Magnesium and calcium are group 2 alkaline earth metals and can be taken as general health supplements to aid regulation of bodily functions, including muscle function and bone development. A scientist is testing the claim from eight different supplement brands that their magnesium and calcium tablets contain 200 mg of each element. Each supplement was analysed, and the amounts of magnesium and calcium present in each tablet are presented in Figure 4.46.
Figure 4.46 Mass of magnesium and calcium found in eight commercial supplement samples
Applying
1. Identify all samples that had less than the advertised 200 mg of magnesium.
2. Brand 3 advertised that the magnesium content was 200 mg ±10%. Calculate the minimum amount of magnesium that could be present in this advertised sample.
3. Use your answer to Question 2 to determine whether the analysed brand 3 has a magnesium content within the advertised range.
Analysing
4. Brand 5 is being investigated for false advertising with its claim that 'we have a more accurate calcium content than brand 1'. Explore this statement and draw conclusions about its accuracy.
5. Compare the magnesium and calcium content in brand 6.
6. Identify the general trend between the mass of magnesium and the mass of calcium in a brand's supplements.
Evaluating
7. The 200 mg magnesium supplements are deemed to be falsely advertised if the content is found to be below 180 mg. Compare the data for the eight samples; which brands have falsely advertised?
8. A magnesium content of over 220 mg would also be considered misleading advertising. Use the data to justify that no brand is providing misleading information in this regard.
9. Brand 7 has released a new series of magnesium and calcium supplements containing 250 mg each of magnesium and calcium. Use your response to Question 5 to predict whether the samples of these products would contain more magnesium or calcium.
Elements have very particular properties, but these properties alone are often not suitable for the range of engineering projects that are required in society. Elements therefore need to be chemically or physically combined to create materials with different properties that are more suited to particular tasks.

for stability.

Materials engineers study the properties of materials such as metals, ceramics, nanomaterials (extremely small substances) and other substances. They may also combine different materials that have already been combined to produce new materials with properties combined from each of its parts. These are called 'composite materials'.
In composite materials, the combined initial materials do not bond or blend with one another, so it is easy to tell the different materials apart. Mud bricks are an example of a composite material. Mud bricks are made of straw and mud. Mud is strong if you press down on it but breaks when you bend it. Straw is strong if you pull on it, but it easily crumples. Mixing straw and mud together creates bricks that hold shape when squeezed or bent. Mud bricks are great as building blocks, whereas neither mud nor straw individually is good.
In small groups, consider the type of structure that you would like to build. For example, you could build a beam bridge, an aeroplane, a building or a chair. Then conduct some research and brainstorm what kind of properties you need in the material used to build the product. Think about what kinds of tests would be useful to determine if the material is suitable or not.
Next, design a prototype of the composite material and test it against these properties. Build and test the prototype. Then think of some ways it could be improved and test it again.
Create a composite material for the purpose of building a specific product.
• internet
• scissors
• ruler
• coins
• paper towels
• tape
• PVA glue
• popsicle sticks
• paper
• cardboard
• elastic bands
• string or wool
• other materials, where possible
a b

4.48 Modern dental fillings may use a composite material containing acrylic resin and glass. When these materials are combined, a strong natural-tooth-coloured filling is formed. The liquid composite is added to the tooth (a) and then sets to a solid (b)
1. Research the two composite materials: glass fibre–reinforced concrete (GFRC) and steel-reinforced concrete.
a) Copy and complete the table below and add other properties you believe are important.
b) What are the differences between, and benefits of, one material compared to the other?
c) How did the discovery of each material change the way we use concrete?
Glass
Strength
Benefits compared to concrete
Temperature variance
2. As a group, decide on a purpose for creating a new material for manufacture. Research the important properties and features the new composite material will require.
3. You will be testing composite materials made up of different ratios of component materials. List the ratios of each component material used in the composite that your group will be testing and write the method for manufacturing and testing your composite material. (Think about the properties of your materials and which material would be the best.)
4. Design the best possible method to create your new composite material.
5. Discuss the sustainability of your material and its environmental impact. Your new material must have a positive or neutral environmental impact and be sustainable to manufacture.
6. Manufacture the composite material in the various ratios set out in the design phase and allow it to set if required.
7. Test your material by applying forces to your material. Record the type of force (such as gravity).
8. Evaluate the capabilities of the original materials compared to the new composite material. Discuss and explain the differences.
9. What are the maximum forces that could be applied for each ratio? Explain the effect of the ratios of the single materials when used as a composite material.
10. Suggest ways to improve the composite material. Should another material be added? Should the ratios of the component materials be altered?
11. Predict how the composite material might behave if it were constructed differently but with the same materials.

The chemical industry produces a range of useful substances in vast quantities, many of which you could not do without. These products are a result of chemical reactions, which can be represented as word equations, balanced symbol equations and particle diagrams. In this chapter, you will learn how to predict the products of common types of chemical reactions and how changes in the conditions of a chemical reaction can affect the rate at which the reaction progresses. Finally, you will learn to calculate the amount of reactants and products that are used and produced in a chemical reaction using the mole concept.
Can be represented as:
• word equations
• symbol equations
• particle diagrams.
Chemical reactions
Can be quantified by:
• the mole
• mole equation.
Can be classified based on the movement of heat energy:
• Exothermic
• Endothermic.
Section 5.1
Section 5.2
Section 5.3
Section 5.4
Section 5.5 (available online)
Types of reactions include:
• synthesis
• decomposition
• displacement.
Reactions can produce useful products:
• Ethanol
• Pigments and plaster
• Charcoal.
Reaction rates can be affected by:
• concentration
• pressure
• surface area
• stirring
• temperature
• catalysts.
Curriculum content
chemical reactions include synthesis, decomposition and displacement reactions and can be classified as exothermic or endothermic; reaction rates are affected by factors including temperature, concentration, surface area of solid reactants and catalysts (VC2S10U09)
• defining and representing synthesis, decomposition and displacement reactions using a variety of formats such as molecular models, diagrams, and word and balanced symbol equations
• identifying reaction type and predicting the products of a reaction
• investigating synthesis reactions such as reaction of metals with oxygen, formation of water and sodium chloride; decomposition reactions such as those used to extract metals; and displacement reactions such as metal and acid, neutralisation and precipitation
• investigating how hot and cold packs work as applications of exothermic and endothermic reactions
• investigating the effect of a range of factors such as temperature, concentration, surface area and catalysts on the rates of chemical reactions
• investigating chemical reactions employed by Aboriginal and/or Torres Strait Islander Peoples in the production of useful substances, for example, fermentation to produce ethanol, pyrolysis to produce charcoal, and calcination to produce plaster and pigments such as iron oxide
• investigating some of the chemical reactions and methods employed by Aboriginal and/or Torres Strait Islander Peoples to convert toxic plants into edible food products, for example, the detoxification of cycad seeds by the Rainforest Aboriginal Peoples of North Queensland that involved speeding up the rate of reaction by increasing temperature and surface area
Extension (available online in the Interactive Textbook)
• Avogadro's constant as the number 6.02 × 10²³, indicating the number of atoms or molecules in a mole of any substance; determination of the amount, in moles, of atoms (or molecules) in a pure sample of known mass
• determination of the molar mass of compounds
VCE Chemistry Study Design extracts © VCAA; reproduced by permisssion.
Activation energy
Agitating
Aqueous
Bioethanol
Calcination
Catalyst
Chemical formula
Coefficient
Collisions
Concentrated solution
Concentration
Decomposition reaction
Diatomic

Dilute solution
Displacement reaction
Endothermic
Exothermic
Fermentation
Kinetic energy
Metal displacement reaction
Molar mass
Mole
Monatomic
Neutralisation reaction
Particle diagram
Potential energy
Precipitation reaction
Products
Pyrolysis
Reactants
Reaction rate
Reactivity series
Relative atomic mass
Salt
Surface area
Synthesis reaction
Thermal decomposition
Word equation
At the end of this section, I will be able to:
1. Represent a chemical equation using word, symbol and particle equations.
2. Recall the correct use of state symbols in a symbol equation.
3. Balance a chemical equation.
List 3 ideas, 2 questions and 1 metaphor (or simile) relating to what you already know about chemical reactions.
The 3-2-1 Bridge thinking routine was developed by Project Zero, a research centre at the Harvard Graduate School of Education.
In a chemical reaction, the bonds in reactants are broken and new bonds are formed between atoms to make the products. Reactants are the chemicals that react together in a chemical reaction and the products are the chemicals that are produced in a reaction. In this section, you will learn how to represent chemical reactions in three different ways.
Word equations describe the reactants and products of a reaction using their names. Below is the word equation for the reaction of two common chemicals.
sodium + hydrochloric → sodium +water ✔ hydroxideacidchloride
You may recall from Year 9 that the reactants are always positioned on the left-hand side of the arrow and the products are on the right-hand side. Take care when writing your equations, as unlike writing a paragraph, if you run out of paper, you can't just continue your word equation on the next line, as shown below.
sodium hydroxide + hydrochloric acid →
sodium chloride + water
1. Correct the following word equation: CO2 + water → glucose + oxygen
2. Identify which of the following options you should not do if you are running out of paper and still have to finish writing a word equation.
A. Just carry on to the next line; it does not matter where you write the reactants and products.
B. Rewrite the equation, so it fits onto the piece of paper.
C. Split some of the reactants or products over two lines, to ensure that all reactants are on the left of the arrow and all products are on the right.
3. In the following equation, label the reactants and the products.
zinc + iron sulfate → zinc sulfate + iron
reactants the chemicals that react together in a reaction products the chemicals produced in a reaction word equation a chemical reaction written using the names of the reactants and products
chemical formula the symbols and formulas of the reactants or products
monatomic (also monoatomic) existing as one atom
diatomic existing as two atoms bonded together
Another way of representing a chemical reaction is by using the chemical formulas for the reactants and products. Symbol equations are structured the same way as word equations but use chemical symbols instead of words to represent the substances in the reaction.
Recall that the periodic table lists all the possible elemental symbols you will need. Just make sure that you write your symbols as they appear. That is, the first letter of the element is capitalised and the second letter (if present) is lower case (see Figure 5.1).
WORKSHEET Representing chemical equations
Element
Formula Hydrogen H2 Nitrogen N2 Oxygen O2
All the metallic elements on the periodic table exist as individual atoms and are thus described as being monatomic, meaning existing as one atom. On the other hand, non-metals, other than noble gases, tend to exist as molecules, sharing their valence electrons to achieve stability. For example, hydrogen exists in nature as H2 – a molecule consisting of two hydrogen atoms covalently bonded together. See Table 5.1 for other examples of diatomic molecules.
Fluorine F2
Chlorine Cl2
Bromine Br2
Iodine I2
Table 5.1 Seven diatomic elements
The subscript (small and low) '2' shows that there are two atoms of these elements bonded together. Substances with no subscript number after the chemical symbol have only one atom of that element present; for example, Ca represents just one atom of calcium.
Working out the formulas of compounds, such as sodium carbonate, is more complicated than determining the elements in a compound. In Year 10, you will either be provided with the necessary formulas or be able to look them up when writing your symbol equations.
Let's look at the word equation from the previous page, also shown below, and see if we can turn it into a symbol equation.
sodium hydroxide + hydrochloric acid → sodium chloride + water
The word equation shows us that sodium hydroxide (NaOH) is reacting with hydrochloric acid (HCl) to form sodium chloride (NaCl) and water (H2O). Using the symbols for these compounds, a chemical equation can be created, like the one below.
NaOH + HCl → NaCl + H2O
This symbol equation shows what happens when the compounds sodium hydroxide and hydrochloric acid react. The atoms are rearranged to form two new compounds: sodium chloride and water.
check 5.2
1. State
a) the number of different elements in one molecule of sucrose (C12H22O11).
b) the number of atoms in one molecule of sucrose (C12H22O11).
2. Explain the term 'diatomic molecule'.
3. Write a chemical equation with symbols for the reaction between iron (Fe) and chlorine (Cl2) to make iron(II) chloride (FeCl2).
Chemical reactions written as symbol equations give you more information than word equations about the amount of each element involved in the reaction. You can convey more information in chemical equations by including state symbols, which indicate the physical states of the substances involved. As shown in Table 5.2, these symbols provide additional information about whether each substance is solid (s), liquid (l), gas (g) or aqueous (aq).
You may remember from previous years, that the term aqueous (aq) is used to describe a solution, that is, when a solid, liquid or gas is dissolved in water. An example is salt water.
We can now make our symbol equation even more informative by adding in state symbols for the four substances in the equation.

Solid (s)Iron
Liquid (l)Water
Gas (g)Oxygen
Aqueous (aq)Salt water
Table 5.2 State symbols are used to represent the physical states of the substances in a chemical equation.
Many of the acids and bases we look at in this chapter are aqueous. In this example, sodium hydroxide (NaOH) is in an aqueous state because it is formed by dissolving solid sodium hydroxide in water. Similarly, hydrochloric acid is also aqueous, created by dissolving hydrogen chloride gas in water.
1. Explain why salt water is described as an aqueous solution.
2. Identify which two of the following compounds would be given the state symbol (s) at room temperature: hydrogen gas, copper, sugar (sucrose), hydrochloric acid.
Finally, you can also use particle diagrams to represent chemical reactions. Let's convert the chemical equation we have been looking at into a particle diagram.
One of the advantages of using a particle diagram to represent a chemical reaction is that you can visualise how the atoms are bonded. For example, the formula for water is H2O. This, however, only shows that water contains two hydrogen atoms and one oxygen atom.
aqueous a physical state of matter that means 'dissolved in water' particle diagram a representation of elements and compounds in which atoms are drawn as balls or circles
WORKSHEET
Balancing formula equations
The particle diagram tells you this as well, but it also shows that each of the hydrogen atoms is bonded to the oxygen atom. Another advantage is that you can see how the atoms have rearranged in the reaction. In the particle diagram shown in Figure 5.3, the bond between the sodium and oxygen in sodium hydroxide and the bond between hydrogen and chlorine in hydrochloric acid have broken, and these atoms have bonded with other atoms to make new products.
WIDGET
Balancing chemical equations
1. Describe what particle diagrams are.
2. State the main advantage of using a particle diagram to represent chemical reactions.
The Law of Conservation of Mass states that mass is neither gained nor lost in a chemical reaction, but always stays the same. Therefore, the mass of reactants must equal the mass of the products in any chemical reaction. Atoms from the reactants cannot disappear, and similarly, atoms cannot just appear in the products.
A balanced symbol equation has the same number of atoms for each element on the left-hand side (reactants) as it does on the right-hand side (products). Looking at a diagram of the particles involved in the reaction can make it easier to pinpoint when equations are not balanced.
For example, consider the following symbol equation and the particle diagram of the same reaction shown in Figure 5.5.
Figure 5.4 Equations with the same number and type of reactant atoms as product atoms are said to be balanced.
To determine whether this equation is balanced or not, you need to count the number of each type of atom on both sides of the equation. It helps to do this in a table, as shown in Table 5.3.
Table 5.3 Using a table makes it easier to see if an equation is balanced or not. In this example, there are the same number and types of atoms in both the reactants and the products. Therefore, the reaction is balanced and nothing else needs to be done.
In another example, solid sodium metal (Na) reacts with chlorine gas (Cl2) to make solid sodium chloride (NaCl).
Na(s) + Cl2(g) → NaCl(s)
Recording the number of each atom on both sides of the equation using the method you used in the previous example gives the results shown in Table 5.4.
You can see that there is one more chlorine atom in the reactants than there is in the products. This equation is therefore not balanced and mass is not conserved.
Element
Number of atoms in reactants
Number of atoms in products
Sodium (Na)1 1
Chlorine (Cl)2 1
Table 5.4 Recording the number of atoms in this equation shows the equation is unbalanced.
When fixing an unbalanced chemical equation, it is not possible to change the formula of any of the substances in the equation, as you cannot change how the atoms have arranged themselves. For example, you cannot simply remove one of the chlorine atoms in a Cl2 molecule, as this is not how chlorine exists in the real world (it is a diatomic molecule). The subscript numbers that appear after a chemical symbol indicate how many atoms of that element are present, and they cannot be altered.
Instead, you should add more of each substance to both sides of the equation until the number of atoms balances out. Putting numbers in front of the chemical symbol or chemical formula changes the amount of that substance. For example: Changing O2(g) to 2O2(g) means there are two molecules of oxygen gas instead of one.
The problem identified in the equation was that there were two atoms of chlorine in the reactants, but only one in the products. To even out the number of chlorine atoms, you can add another unit of NaCl to the products, as shown here.
Use Table 5.5 to see if you have balanced the equation. Although the chlorine atoms are now balanced, by adding another unit of sodium chloride (NaCl) to the products, you have also altered the number of sodium atoms. Now these do not balance. To make the sodium atoms balance, you need to add another sodium atom to the reactants. See if this works using Table 5.6.
+ Cl2(g) → 2NaCl(s)
Element
Number of atoms in reactants
Number of atoms in products
Sodium (Na)1 2
Chlorine (Cl)2 2
Table 5.5 Is the equation balanced now?
Element
Number of the atoms in reactants
Number of atoms in products
By adding another unit of sodium chloride to the products and a sodium atom to the reactants, the equation is now balanced and mass is conserved. All you have to remember is that the numbers before the chemical symbol (or coefficients) indicate the number of formula units, and the small subscript numbers indicate the number of atoms within the formula unit. coefficient the number placed before a chemical species (formula unit) in a chemical equation to ensure it is balanced
Sodium (Na)2 2
Chlorine (Cl)2 2
Table 5.6 A balanced equation
Aim
To consider the accuracy of experimental data compared with the theoretical outcome based on chemical equations
Theoretical equations
Reaction 1:
Be careful Wear appropriate personal protective equipment (safety glasses, disposable gloves and lab coat).
sodium hydroxide + iron(II) sulfate → iron(II) hydroxide + sodium sulfate
2NaOH(aq) + FeSO4(aq) → Fe(OH)2(s) + Na2SO4(aq)
Reaction 2: calcium carbonate + hydrochloric acid → calcium chloride + water + carbon dioxide
CaCO3(s) + 2HCl(aq) → CaCl2(aq) + H2O(l) + CO2(g)
Hypothesis
For each reaction, predict whether the mass will change during the reaction. Justify your reasoning for this based on the details provided in the theoretical equation.
Materials
• 4 mL of 1 mol L–1 iron(II) sulfate solution
• 5 mL of 1 mol L–1 hydrochloric acid solution
• 8 mL of 1 mol L–1 sodium hydroxide solution
• 1.5–2 cm piece of calcium carbonate
Method
Part 1: Prepare the results table
1. Copy the results table into your science book.
• 10 mL measuring cylinders × 2
• 125 mL conical flasks × 2
• plastic pipette
• electronic balance
Part 2: Measure the mass of the reactants and products for Reaction 1
1. Using a measuring cylinder, measure 8 mL of sodium hydroxide solution.
2. Using a second measuring cylinder, measure 4 mL of iron(II) sulfate solution.
3. Place the conical flask on the electronic balance and press 'tare' to zero it.
4. Pour the contents of both measuring cylinders into the conical flask.
5. Record the mass of the combined mixture.
6. Observe the chemical reaction taking place and record your observations.
7. When it has finished reacting, record the mass of the final products in the flask.
Part 3: Measure the mass of the reactants and products for Reaction 2
1. Using a measuring cylinder, measure 8 mL of hydrochloric acid solution.
2. Place the conical flask on the electronic balance and press 'tare' to zero it.
3. Pour the hydrochloric acid into the conical flask. Add the calcium carbonate to the balance plate beside the flask.
4. Record the mass of the two reactants.
5. Add the calcium carbonate to the conical flask.
6. Observe the chemical reaction taking place and record your observations.
7. When it has finished reacting, record the mass of the final products in the flask.
Results
Table showing the change in mass recorded after two chemical reactions
ReactionInitial mass (g)Final mass (g)Change in mass (g) Other observations
Reaction 1
Reaction 2
1. Calculate the change in mass for each reaction and record it in the results table.
Discussion: Analysis
1. Describe the change in mass for each of the reactions using data.
2. Discuss possible reasons for a change in mass in the two reactions.
3. Relate these results back to the Law of Conservation of Mass and discuss any discrepancies.
4. Discuss whether the experimental data supports the predicted outcomes as shown in the chemical reactions.
Discussion: Evaluation
1. Identify possible limitations of this method.
2. Suggest any changes that could be made to the method to improve the quality of the data in future experiments. Include mention of how to modify the experiment so that the Law of Conservation of Mass can be observed for Reaction 2. Justify your suggestions by explaining how each change will improve the data quality.
Conclusion
1. Make a claim about the accuracy of experimental data compared with the theoretical outcome based on chemical equations.
2. Support your statement by explaining how the data you gathered support your claim.
3. State whether your hypothesis was supported or not supported based on your findings.
Consider the chemical equation represented in the particle diagram shown in Figure 5.5. Using M&Ms or coloured beads to represent atoms, and some paper with plus signs and an arrow, set up the reactants. You will need to use the correct number of M&Ms for each molecule and ensure each type of atom has its own colour. Now set up the products using some more M&Ms. Is there the same number of each type of atom/M&M on each side of the equation? Is it balanced?
In pairs, take turns setting up symbol equations using M&Ms and practise balancing each other's reactions. How will you balance the equation if there is more of one type of atom on one side than the other? Remember, you cannot change the molecular formula, only the coefficient (the number before the chemical symbol). It will help to use a table like Table 5.3.
1. Determine whether the following chemical reactions are balanced or unbalanced.
a) Fe + O2 → Fe2O3
b) H2 + O2 → H2O
c) Zn + CuSO4 → Cu + ZnSO4
d) Be + Cl2 → BeCl2
2. Balance these chemical equations. (Draw a particle diagram if you need help. To help you, the first two have spaces to show where you should add coefficients.)
a) __ H2 + O2 → __ H2O
b) __ Mg + O2 → __ MgO
c) Fe + O2 → Fe2O3
d) Ca(OH)2 + HNO3 → Ca(NO3)2 + H2O
3. Write a balanced symbol equation for the reaction between aluminium (Al) and chlorine (Cl2) to make aluminium chloride (AlCl3).
Go online to access
The German scientist Fritz Haber and his assistant Robert Le Rossignol developed the Haber process, which was later industrialised by Carl Bosch.
The Haber process enabled the production of ammonia (NH3) gas on a large scale by reacting nitrogen (N2) gas with hydrogen (H2) gas under optimum conditions.
Haber was awarded a Nobel Prize for his efforts in 1918.
What is so special about ammonia? Once made by the Haber process, ammonia can be put into the ground to provide plants with the nitrates they need to grow. Eighty per cent of the world's production of ammonia is used as fertilisers.
1. Write a word equation for the production of ammonia in the Haber process.
2. Write a balanced symbol equation with state symbols.
3. The Haber process has been referred to as the chemical reaction that killed millions and saved billions. Find out how the Haber process could do each of these things.
4. Research the products that are manufactured from ammonia.
Table 5.7 summarises three ways in which a chemical reaction can be represented.
Type
Word equation
Balanced symbol equation with state symbols
Particle diagram
Example
sodium hydroxide + hydrochloric acid → sodium chloride + water
NaOH(aq) + HCl(aq) → NaCl(aq) + H2O(l)
Table 5.7 Three ways a chemical reaction can be represented
Section 5.1 review
Section 5.1 questions
1. Identify the type of equation shown in the following examples.
2. Name the state symbols that would represent the following substances.
3. Identify which of the following molecules are diatomic.
a) H2O b) CO2 c) N2 d) F2
4. When sodium is reacted with water containing universal indicator, the water will turn purple as sodium hydroxide (a base) is produced. Hydrogen gas is also made.
a) State the reactants in the reaction. b) State the products in the reaction. c) State the word equation.
5. Identify the coefficients in the equations below.
a) 2Ca + O2 → 2CaO b) 2Fe + 3Cl2 → 2FeCl2 c) C6H12O6 + 6O2 → 6CO2 + 6H2O
Understanding
6. Describe the composition of copper(II) sulfate (CuSO4) in terms of the number of each type of atom.
7. Explain, using the term 'conservation of mass', why it is important that chemical equations are balanced.
8. Represent different ways of writing a chemical reaction by completing the following for the reaction between solid calcium (Ca) and liquid bromine (Br2) to form solid calcium bromide (CaBr2).
a) word equation b) balanced symbol equation with state symbols c) particle diagram
Applying
9. Explain why it is important to only change coefficients of formulas of substances in a chemical equation and not to change the subscripts.
10. Balance the following equation.
HNO3 + Ca → Ca(NO3)2 + H2
11. Construct a balanced symbol equation with state symbols for the reaction of potassium metal with oxygen to form solid potassium oxide (K2O).
12. Electricity can be used to break down water (H2O) into its constituent elements. There is no other reactant.
a) Construct a balanced symbol equation with state symbols to show this.
b) Identify how much more hydrogen is produced in this reaction compared to oxygen.
Analysing
13. Analyse whether the unbalanced symbol equation below has been balanced correctly. If it hasn't, write the correct balanced equation.
Unbalanced: H2(g) + O2(g) → H2O(l) Balanced: H2(g) + O2(g) → H2O2(l)
Evaluating
14. Decide whether the following equations are balanced or unbalanced, and then correct the unbalanced equations.
a) Ca + Br2 → CaBr2 b) NaOH + HCl → NaCl + H2O
c) CuO + C → Cu + CO2 d) C2H6 + O2 → CO2 + H2O
e) Ag + H2S + O2 → Ag2S + H2O
chemical reactions
kinetic energy the energy of an object or particle has due to its motion
potential energy (chemical) the energy stored in the chemical bonds of a substance
exothermic a release of heat in a chemical reaction characterised by an increase in surrounding temperature
Figure 5.6 The word 'exothermic' means external heat.
At the end of this section, I will be able to:
1. Classify reactions as endothermic or exothermic.
2. Identify different types of chemical reactions (synthesis, decomposition and displacement) and predict the products.
Before we explore some of the different types of chemical reactions that exist in our world, we need to consider how energy can change during a chemical reaction, as this is another way we can classify chemical reactions.
Particles in a chemical reaction are constantly moving, which means they have kinetic energy. They also have potential energy, or chemical energy, stored within the chemical bonds that hold the atoms in molecules together. When the atoms rearrange in a chemical reaction, the potential energy stored in the bonds changes, as old bonds are broken and new bonds are formed during the reaction. As the new chemical bonds will always be different to the old chemical bonds, the potential energy of the reactants and products will always be different.
Remember, energy cannot be created or destroyed, so it must go somewhere! If the energy is lost, it is lost as heat energy to the surroundings, and if it is gained, heat energy is removed from the surroundings. This is observed as a change in temperature, an indicator of chemical change.
Reactions that release energy, like the burning of wood on a campfire, are described as exothermic reactions.
In science, it is useful to understand where words come from, so let us split up the word exothermic. The exo part means external or outside. The thermic part means heat. If you put these two parts together, then exothermic just means external heat (heat leaving the reaction).
You can tell if a reaction is exothermic because you will observe a rise in temperature. Heat has left the chemical reaction and gone into the immediate surroundings; it is the temperature of the surroundings that you will measure in an experiment.

5.7 An energy profile diagram for an exothermic reaction
In exothermic reactions, the reactants have more potential energy than the products. So, as the reactants are converted to the products during the reaction, the surplus energy is released into the surroundings as heat energy. It is helpful to see what is happening in an exothermic reaction by looking at an energy profile diagram, such as shown in Figure 5.7.
Portable hand warmers are used in many different situations. These work through an exothermic reaction, as heat energy is released from the reaction. What are the reactants needed to make this reaction happen?
1. Investigate the chemical reaction involved in disposable portable hand warmers. Record what you find out by writing a word equation and a chemical equation.
2. How are disposable and reuseable hard warmers different? Explain in terms of the substances involved and the chemical reactions that occur.
Reactions that take in energy from the surroundings are described as endothermic reactions. In this word, endo means internal and thermic means heat.
One example is photosynthesis, in which plants use light energy to make their own food. Another example you may be familiar with is an instant ice pack, which is commonly used to treat sprains or other injuries. You pop a bubble inside the pack and the pack starts to absorb heat from the surrounding environment, making it feel cold.
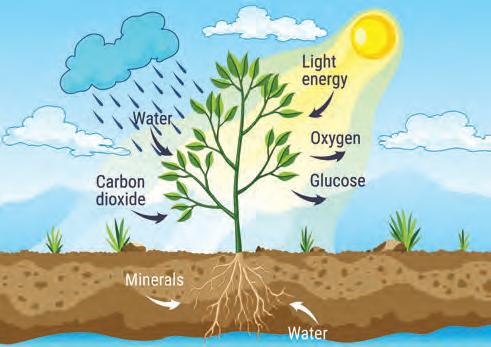
You can tell if a reaction is endothermic because you will observe a decrease in temperature: heat is absorbed from the immediate surroundings and stored as potential energy in the products. Therefore, the products have more potential energy than the reactants. It is helpful to visualise what is happening in an endothermic reaction by looking at an energy profile diagram, such as the one shown in Figure 5.12.
5.12 An energy profile diagram for an endothermic reaction
an absorption of heat in a chemical
characterised by a decrease in surrounding temperature
Practical 5.2: Teacher demonstration
Endothermic and exothermic reactions (1)
Aim
To determine whether a reaction is endothermic or exothermic
Materials
Experiment 1
• 1.4 g of potassium iodide
• 35% hydrogen peroxide solution
• food colouring
• dishwashing detergent
Experiment 2
• 10 g of ammonium chloride
• 32 g of barium hydroxide
• 250 mL beaker
Method
Experiment 1
Be careful
Ensure that appropriate gloves are worn during this experiment.
• 100 mL measuring cylinder
• plastic tray
• spatula
• heatproof mat
• glass stirring rod
• thermometer
1. Place the 100 mL measuring cylinder in the middle of the plastic tray.
2. Add a squirt of dishwashing detergent and three drops of food colouring to the measuring cylinder.
3. Pour about 65 mL of 35% hydrogen peroxide into the measuring cylinder.
4. Add the potassium iodide to the flask, stand back and watch.
5. Record your observations in the results table.
Experiment 2
1. Place the 250 mL beaker on a heatproof mat.
2. Mix the ammonium chloride and barium hydroxide together in the beaker, stirring with the stirring rod, and observe the change in temperature.
3. Touch the side of the beaker and feel the change in temperature.
4. Record your observations in the results table.
Results
Table showing evidence that experiments 1 and 2 are either endothermic or exothermic
Experiment
Observations Exothermic or endothermic 1 2
Discussion: Analysis
1. How did you know that a chemical reaction had taken place in both experiments? Include a list of evidence.
2. Draw an energy profile diagram for each experiment.
3. Determine why the reaction mixture shot out of the measuring cylinder in Experiment 1
Conclusion
1. Draw a conclusion from this experiment regarding whether each reaction is endothermic or exothermic.
Aim
To determine whether a reaction is endothermic or exothermic
Materials
• 0.5 mol L–1 hydrochloric acid
• 1.0 mol L–1 hydrochloric acid
• 0.5 mol L–1 sodium hydroxide solution
• 1 mol L–1 copper sulfate solution
• 1 mol L–1 sodium hydrogen carbonate solution
• 3 cm piece of magnesium ribbon × 2
Method
Be careful
Ensure that appropriate gloves are worn during this experiment.
• spatula of zinc powder
• spatula of citric acid
• 10 mL measuring cylinder
• thermometer
• 80 mL beakers × 5
1. Copy the results table, which gives the reactants to be used in five experiments.
2. Pour 10 mL of the first substance in Experiment 1 into the beaker and measure the starting temperature. Record the temperature in your results table.
3. Add the required amount of the other substance listed in Experiment 1 to the beaker and insert the thermometer.
4. When the temperature on the thermometer remains stable, record the final temperature in the results table.
5. Work out the temperature change and decide whether the reaction is endothermic or exothermic.
6. Repeat for the other experiments listed in the table.
Results
Table showing the temperature change observed for five different experiments
1.10 mL 1 mol L–1 hydrochloric acid + 3 cm piece of magnesium ribbon
2. 10 mL 0.5 mol L–1 hydrochloric acid + 3 cm piece of magnesium ribbon
3. 10 mL 0.5 mol L–1 hydrochloric acid + 10 mL sodium hydroxide solution
4.10 mL copper sulfate solution + 1 spatula zinc powder
5.10 mL sodium hydrogen carbonate solution + 1 spatula citric acid
Discussion: Analysis
1. Explain how you determined if each reaction was endothermic or exothermic. Include a list of evidence.
2. Compare the temperature change for Experiments 1 and 2. Did changing the concentration of HCl affect the temperature change in the reaction? Explain your answer using the terms atom, concentration and reaction.
3. Describe what happened to the energy in the reaction between sodium hydrogen carbonate and citric acid in Experiment 5.
synthesis reaction
a reaction in which two (or more) elements or reactants combine to form new substances or products
Quick check 5.6
1. During a chemical reaction, the temperature of the solution decreases. Infer whether this reaction is endothermic or exothermic.
2. 'Cellular respiration is an example of an endothermic reaction because it releases energy into the surroundings.' Decide if this statement is true or false. If it is false, rewrite the statement to be true.
3. During a chemical reaction between hydrochloric acid and sodium hydroxide, the temperature went up by 5°C. Infer whether the reaction is endothermic or exothermic.
4. 'Burning wood is an example of an exothermic reaction because the products have more potential energy than the reactants.' Propose whether this statement is true or false. If it is false, rewrite the statement to be true.
Now that we can classify reactions as endothermic or exothermic, we can look at some of the common types of chemical reactions:
• synthesis
• decomposition
• displacement (including neutralisation and precipitation).
Synthesis reactions
The synthesis reaction (sometimes called a combination reaction) involves two or more elements or reactants combining to form one new substance or product. Synthesis reactions can be represented in this way:
A + B → AB
where A and B are the reactants and AB is the product.
An everyday example of a synthesis reaction is rust forming on iron. Iron metal reacts with oxygen gas in the air to form rust, as shown in the following equations.
Word equation:
Symbol equation:
iron + oxygen + water → hydrated iron(III) oxide
4Fe(s) + 3O2(g) + 6H2O(l) → 4Fe(OH)3(s)
This reaction can be classified as a synthesis reaction as two or more reactants combine to form one new product.
Other examples of synthesis reactions you may be familiar with include:
• the synthesis of sodium chloride (table salt) using sodium metal and chlorine gas reactants.
Word equation: sodium + chlorine → sodium chloride
Symbol equation:
2Na(s) + Cl2(g) → 2NaCl(s)
• the synthesis of water using hydrogen gas and oxygen gas as the reactants.
Word equation:
hydrogen + oxygen → water
Symbol equation:
2H2(g) + O2(g) → 2H2O(l)

Did you know? 5.1
The hydrogen fuel cell
Hydrogen gas is considered a green or renewable fuel, and it can be combusted in oxygen gas to produce water and energy. The symbol equation for this reaction is:
2H2(g) + O2(g) → 2H2O(l) + energy
As two reactants combine to form one product, this is an example of a synthesis reaction. The reaction vessel is called a 'fuel cell'. The energy released can be used to power vehicles and even space capsules.
Transit Systems Vic., is adding two Australian-built hydrogen fuel cell buses to their fleet as part of the Victorian Government's three-year Zero Emissions Bus Trial. Melbourne's west will be their home and they will be deployed across 26 regular services.
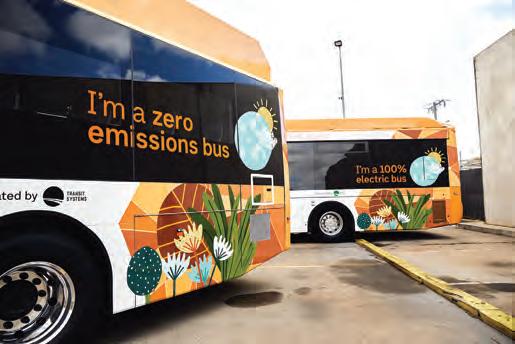
Decomposition reactions
Reactions in which one reactant breaks up into multiple products is called a decomposition reaction. Decomposition reactions are essentially the opposite of synthesis reactions and can be represented in this way: decomposition reaction a reaction in which one reactant breaks up into multiple products
AB → A + B
where AB is the reactant and A and B are the products.
thermal decomposition decomposition that occurs when a substance is heated
For example, carbonic acid (H2CO3) is a component in soft drinks. When you open a can of soft drink, the carbon dioxide that escapes is a result of a decomposition reaction that has occurred within the drink.
Word equation: carbonic acid → water + carbon dioxide
Symbol equation: H2CO3(aq) → H2O(l) + CO2(g)
Some compounds break down when heated, in a reaction called thermal decomposition
For example, Australia is a world leader in the export of iron ore, which contains iron oxides such as iron(III) oxide (Fe2O3). This compound needs to undergo thermal decomposition to produce the pure iron metal that can be turned into stainless steel products.
Iron smelting is the process by which iron oxides are heated with carbon (in the form of coal) in a blast furnace to over 1000°C to decompose the iron oxides into iron metal and carbon dioxide. The word and balanced symbol equations for this reaction are shown below.
Did you know? 5.2
Figure 5.15 Every time you bake in the kitchen with baking soda, you are watching thermal decomposition in real time!
Thermal decomposition is when a decomposition reaction is caused by heat. It may be surprising, but these types of reactions are common in everyday life. For example, baking soda, or sodium bicarbonate, thermally decomposes when you bake muffins. The carbon dioxide gas that is produced in this reaction helps the muffin mixture rise.
2NaHCO3(s) → Na2CO3(s)+ H2O(g) + CO2(g)
sodium bicarbonate → sodium carbonate + water + carbon dioxide
At temperatures above 80°C, the sodium bicarbonate starts to break down into the three compounds you can see above. The higher the temperature of the sodium bicarbonate, the faster it will decompose.
Quick check 5.7
1. Explain the difference between synthesis and decomposition reactions.
2. State how thermal decomposition is different from the decomposition reaction you mentioned in question 1
Displacement reactions encompass a wide variety of different types of reactions, but all follow the general theme in which elements are exchanged between two reactants. Displacement reactions can be represented in two ways depending on the number of elements being displaced.
• Metal displacement and acid–metal reactions can be represented by: A + BC → AC + B
• Neutralisation and precipitation reaction can be represented by: AB + CD → AD + BC
Metals can be ranked in terms of their observable reactivity in a list called the reactivity series. The reactivity series describes the observable reactivity (most likely in terms of rate of reaction) of some common metals with acids and cations. Table 5.8 shows the order of reactivity of some common metals in the periodic table. The reactivity series demonstrates that tin is more reactive than lead, and, similarly, zinc exhibits greater reactivity than gold.
Potassium (K)
Sodium (Na)
Calcium (Ca)
Magnesium (Mg)
Aluminium (Al)
Zinc (Zn)
Iron (Fe)
Nickel (Ni)
Tin (Sn)
Lead (Pb)
Copper (Cu)
Silver (Ag)
Gold (Au)
reactivity series a series of metals ordered by their observable reactivity, from highest to lowest
metal displacement reaction when a more reactive metal removes a less reactive metal from its compound
Quick check 5.8
1. Decide whether the following statements are true or false. If false, give a reason why.
a) Potassium is the most reactive metal in the reactivity series shown in Table 5.8.
b) Silver is less reactive than gold.
c) Group 1 metals are the most reactive in the reactivity series.
2. Name the only group 13 element in the reactivity series shown in Table 5.8.
Using the reactivity series, you can predict the outcome of a particular type of reaction involving these metals, called a metal displacement reaction. In a displacement reaction, an ion of a more reactive metal will displace (remove or replace) an ion of a less reactive metal from a solution of its compound. The following is an example:
copper sulfate + iron → iron(II) sulfate + copper
CuSO4 + Fe → FeSO4 + Cu
In this reaction, because iron is more reactive than copper, the iron atom easily loses two electrons to form an Fe2+ ion and it displaces (or removes) the copper ion (Cu2+) from its compound. The iron ion (Fe2+) joins with the sulfate ion (SO42–) and the Cu2+ ion gains two electrons to form copper metal.
So what happens when the metal on its own is less reactive than the metal in the compound?
zinc sulfate + tin → X
ZnSO4 + Sn → X
In this case there is no reaction. Tin is not reactive enough because it is lower in the reactivity series than zinc, so it cannot remove the zinc from its compound.
WORKSHEET The reactivity series DOC
5.4
You will investigate the reactivity of metals using displacement reactions. This is a type of reaction involving a metal salt solution (a metal salt is a compound made from a combination of a metal and a non-metal) and a pure metal. Pure metals with a higher reactivity than the metal within the salt solution will react and 'push out' (displace) the metal that is within the salt solution, forcing the less reactive metal into its pure element form.
Aim
Be careful
To avoid risk of contamination from chemicals:
• Wear safety glasses and appropriate personal protective equipment at all times.
• Wash your hands after the practical.
To determine the order of reactivity of metals by the outcome of displacement reactions
Hypothesis
Develop a hypothesis using the reactivity series as to how the position of a metal in the reactivity series will affect its reactivity with a metal lower in the series.
Materials
• three pieces of each metal (zinc, magnesium, copper)
• dropper bottle of 1 mol L–1 zinc sulfate
• dropper bottle of 1 mol L–1 magnesium sulfate
• dropper bottle of 1 mol L–1 copper(II) sulfate
• dimple tile or spotting tile
• tweezers
Method
1. Add 3 drops of copper(II) sulfate to 4 dimples in a row, as shown in Figure 5.16.
2. Add 3 drops of magnesium sulfate to 4 dimples in a row.
3. Add 3 drops of zinc sulfate to 4 dimples in a row.
4. Add a piece of the first test metal to each dimple in the second column.
5. Repeat step 4 for each of the other two test metals, placing them in the third and fourth columns of dimples. Wait 10 minutes before recording your observations in the results table.
Results
Draw a results table that will allow you to record sufficient data.
Discussion: Analysis
1. Describe the observations you used to determine whether a displacement reaction had taken place.
2. Identify the reactions that did not show displacement. What can you conclude from this result?
3. Write word equations for each of the successful displacement reactions.
Conclusion
1. Make a claim about the order of the reactivity of the elements in the investigation.
2. Support your statement by explaining how the data you gathered support your claim.
3. State whether your hypothesis was supported or not supported based on your findings.
1. For the following mixtures of metals and metal compounds, state whether a reaction will occur.
a) iron(II) chloride + nickel
b) copper(II) sulfate + zinc
c) iron(II) sulfate + aluminium
d) sodium sulfate + gold
2. Describe the term 'metal displacement reaction'.
The metal reactivity series can also describe the observable reactivity of metals with acids. Before we learn about these reactions, it is important to know how to write the formula of a common product of acid–metal reactions, a salt.
In chemistry, a salt is a substance that forms when acids react with metals, bases or metal carbonates. Salts are ionic compounds, which means they are formed from the bonding of a cation and an anion. In this case, the metal in the reactant will form the cation, while the acid forms the anion.
It is the metal cation that provides the first part of the salt's name, while the type of acid anion used in the reaction provides the second part of the name. Table 5.9 summarises how to predict the name of a salt produced in reactions that involve acids.
Name
2. Describe the two rules for naming a

Practical 5.5
Acid–metal reactions occur when an acid reacts with a metal to produce a salt and hydrogen (H2).
The general word equation for any acid reacting with any metal is:
acid + metal → salt + hydrogen
The hydrogen produced in the reaction can be identified using a simple pop test. In this test, if a flame is placed near the gas produced and a 'squeaky pop' is heard, then the gas produced is hydrogen.
For example, when hydrochloric acid reacts with magnesium, the salt magnesium chloride is formed, and the other product in the reaction is hydrogen:
hydrochloric acid + magnesium → magnesium chloride + hydrogen
You can see how the first part of the salt name comes from the metal and the second part comes from the type of acid used.
Acid–metal reactions can also be described by looking at the reactivity table we met earlier (Table 5.8). The least reactive metals (gold, silver, copper, platinum) do not react with dilute acids, and there is no visible reaction.
The reaction between acids and metals can be a problem in everyday life. For example, if there is acid in rain, this can cause damage to the many buildings made of metals.
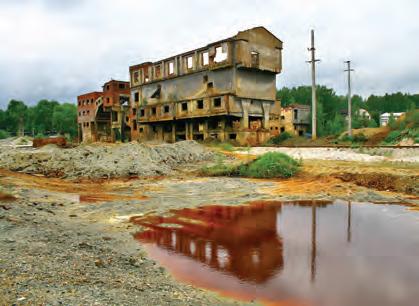
The
1. Recall the general word equation for when any metal reacts with any acid.
2. List four metals that do not react with dilute acids.
3. Complete the word equation below. nitric acid + → zinc + hydrogen
Aim
To observe what happens when metals react with acids
Materials
• 2 mol L–1 dilute hydrochloric acid
• 0.5 mol L–1 dilute sulfuric acid
• small granules of zinc and iron
• 5 cm strip of magnesium ribbon
• test tubes × 12
Be careful
Wear appropriate personal protective equipment.
• test-tube rack
• wooden splints or matches
• Bunsen burner (if using wooden splints)
5.5
Reaction of acids with metals
Hypothesis
Write a hypothesis describing what you expect will happen when metals are reacted with acids.
Method
Before beginning, consider the equipment and processes you will be using by first reading through the task. Identify potential risks and how you can minimise their impact.
1. Copy the results tables into your science book.
2. Place the 12 test tubes in the test-tube rack.
3. To three of the test tubes add 10 mL of hydrochloric acid.
4. To another three test tubes, add 10 mL of sulfuric acid.
5. To each of the hydrochloric acid test tubes, add a different type of metal. Invert empty test tubes and place over the top of the test tubes and record your observations. NOTE: Ensure all metal samples have been cleaned before adding them to the acid. Also note that some of the reactions between the acid and metals may be rather slow and not produce enough hydrogen gas to cause a pop.
6. After about 30 seconds, light a match or wooden splint, lift one of the inverted test tubes (keeping it inverted) and hold the flame beneath the mouth of the inverted test tube. Repeat for the other two test tubes and record your observations.
7. Add the same types of metal to the test tubes containing sulfuric acid, place an inverted test tube over the top of the test tubes and record your observations.
8. After about 30 seconds, light a match or wooden splint, remove the inverted test tube and hold the flame to the mouth of the test tube. Again, record your observations.
Results
Table showing the reactions with hydrochloric acid
Table showing the reactions with sulfuric acid
produced?
Discussion: Analysis
1. Discuss which of the metals reacted with the hydrochloric and sulfuric acids. How did you know?
2. Write word equations for each of the reactions carried out in this practical.
3. State what happened to some of the reactions when the lit splint was put at the mouth of the test tube.
4. Explain what this experiment tells you about the reactivity of metals.
5. During this reaction, you may have felt the temperature of the reaction increase. Recall the name of this type of reaction.
Conclusion
1. Make a claim about what happens when metals are reacted with acids.
2. Support your statement by explaining how the data you gathered support your claim.
3. State whether your hypothesis was supported or not supported based on your findings.
neutralisation reaction
a reaction between an acid and a base, forming a solution that has a pH of 7
Acid–base reactions, also known as neutralisation reactions, occur when any acid reacts with any base to produce a salt and water. Notice that a salt is produced, just like in acid–metal reactions, but instead of hydrogen being the other product, water is made.
The general word equation for any acid reacting with any base is:
acid + base → salt + water
For example, when nitric acid reacts with sodium hydroxide, the salt sodium nitrate is formed:
nitric acid + sodium hydroxide → sodium nitrate + water
A base is a substance that typically contains an oxide (O2–) or hydroxide (OH–) anion. Common bases that you may have in your house are hand soap and oven cleaner.
The reason acid–base reactions are also known as neutralisation reactions is that when acids and bases with the same volume, concentration and strength react, they make a neutral solution (pH 7) (Figure 5.18). Soothing indigestion with an antacid or a wasp sting with vinegar are examples of common neutralisation reactions.
pH = 1 pH = 14 pH = 7
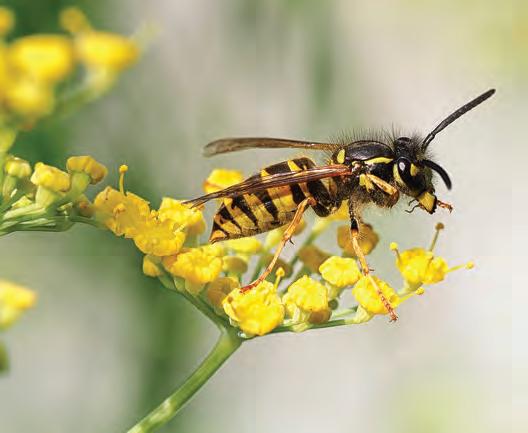

Materials
• 0.1 mol L–1 sodium hydroxide
• 0.1 mol L–1 hydrochloric acid
• sheet of filter paper
• white tile
Method
• pencil
• universal indicator solution
• pipette × 2
1. Using a pencil, draw two circles on the filter paper as shown in the diagram.
2. Label one of the circles 'acid' and the other one 'base'.
3. Use a pipette to place three drops of hydrochloric acid into the 'acid' circle, and a clean pipette to place three drops of sodium hydroxide into the 'base' circle.
4. Wait until the solutions soak into the filter paper. If the solutions don't meet in the middle, add more drops to both circles.
5. Now add a three drops of universal indicator solution to the area where the acid and base have met.
Results
1. Describe what you observed when adding the universal indicator.
2. Explain your observations.
Quick check 5.12
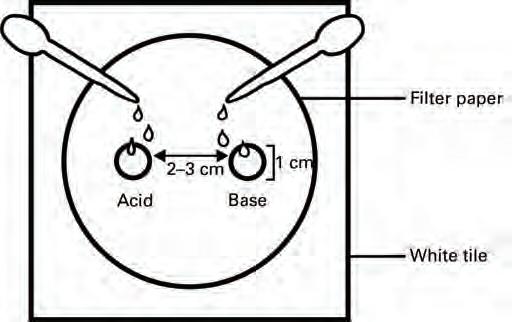
1. Recall the general word equation for when any base reacts with any acid.
2. Identify the name for a reaction between an acid and a base.
3. Complete the word equation below. sulfuric acid + → iron + water
WORKSHEET Reactions
Acid–carbonate reactions are another example of an acid–base or neutralisation reaction. They occur when any acid reacts with any metal carbonate (CO32–, e.g. CaCO3), which is a weak base, or a metal hydrogen carbonate (HCO3–, e.g. Ca(HCO3)2) to produce a salt, water and carbon dioxide.
The general word equation for any acid reacting with any carbonate or hydrogen carbonate is:
acid + metal hydrogen carbonate → salt + water + carbon dioxide
For example, when sulfuric acid reacts with calcium carbonate, the salt calcium sulfate is formed:
sulfuric acid + calcium carbonate → calcium sulfate + water + carbon dioxide
You can test for the presence of carbon dioxide produced in an acid–carbonate reaction by bubbling the gas through limewater. Limewater goes from colourless to milky white in the presence of carbon dioxide.
Chemical reactions that involve the mixing of two solutions to produce a solid are called precipitation reactions. This is because the solid that is formed is called a precipitate. These solids are insoluble, which means they are unable to dissolve in water. Precipitates are often very colourful, and some are used as pigments in paint.
Word equation: precipitation reaction a reaction that involves the mixing of two solutions to produce a solid called a precipitate
For example, when a blue solution of copper(II) nitrate and a colourless solution of potassium hydroxide are added together, a blue precipitate called copper(II) hydroxide forms. This observation is depicted in Figure 5.21.
copper(II) nitrate + potassium hydroxide → copper(II) hydroxide + potassium nitrate
Symbol equation:
Cu(NO3)2(aq) + 2KOH(aq) → Cu(OH)2(s) + 2KNO3(aq)

Figure 5.21 A blue copper(II) nitrate solution is added to a colourless potassium hydroxide solution to form a blue precipitate in a colourless solution.
Practical 5.6
Precipitation reactions
Fluorine, chlorine, bromine and iodine are found in group 17 of the periodic table and are all called 'halogens'.
Ionic compounds that contain halogen atoms as anions are called 'halides'. When silver combines with halides it forms a precipitate.
Aim
To determine the colour of the silver precipitate formed when silver combines with different halides
Materials
Be careful
To avoid the risk of contamination from chemicals:
• Wear safety glasses and appropriate personal protective equipment at all times.
• Wash your hands with soap and water after this experiment.
• 0.1 mol L–1 solutions of potassium chloride, potassium bromide and potassium iodide
• 0.1 mol L–1 silver nitrate
• test tubes and test-tube rack
Method
1. Add five drops of your first halide compound solution to a test tube.
2. Add three drops of silver nitrate solution.
3. Record your observations.
4. Repeat steps 1–3 for the second and third halide compound solutions.
Results
Table showing the results of precipitation reactions involving halides, including the colour of the precipitate formed
Halide compound
Potassium chloride
Potassium bromide
Potassium iodide
Discussion: Analysis
Observations
The general equation for these reactions is: metal halide (aq) + silver nitrate (aq) → metal nitrate (aq) + silver halide (s)
Complete the word equations for the reactions below:
1. potassium chloride (aq) +
2. potassium bromide (aq) +
3. potassium iodide (aq) +
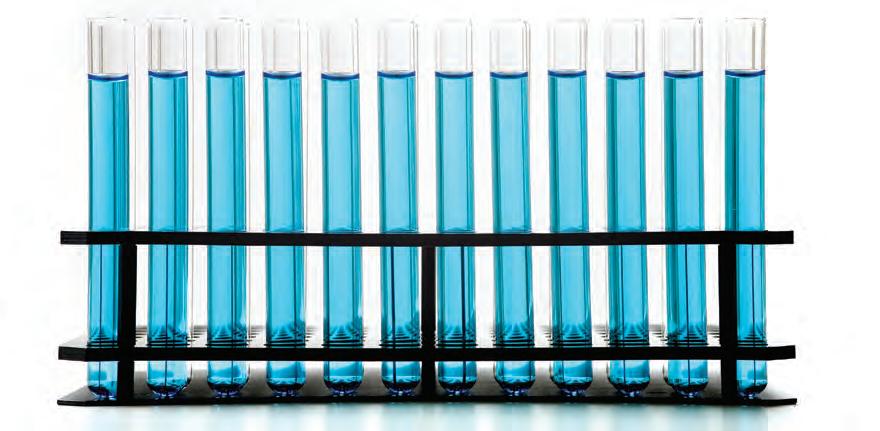
Online quiz
Section 5.2 questions
Remembering
Teachers can assign tasks and track results Section questions DOC
1. Name five types of chemical reactions.
2. Recall the general equation for a decomposition reaction.
Understanding
3. Write a balanced equation for the decomposition of calcium carbonate (CaCO3) to calcium oxide (CaO) and carbon dioxide (CO2).
4. Write a balanced equation for the reaction of lead(II) nitrate (Pb(NO3)2) and sodium iodide (NaI) to form the yellow solid lead(II) iodide (PbI2) and sodium nitrate (NaNO3).
Applying
5. Predict the products of the reaction between sulfuric acid (H2SO4) and sodium hydroxide (NaOH).
6. Explain the importance of the synthesis reaction that takes place in a hydrogen fuel cell.
Analysing
7. Contrast exothermic and endothermic reactions.
8. Classify the following as exothermic or endothermic reactions.
a) a reaction in which the temperature decreases
b) releasing energy from food in cellular respiration
c) baking a cake
d) burning a birthday candle
9. Classify the following reactions as either a synthesis reaction, decomposition reaction or a displacement reaction.
a) 2K + Cl2 → 2KCl
b) zinc + hydrogen chloride → hydrogen + zinc chloride
c) iron(II) sulfide → iron + sulfur
d) CaCO3 + 2HCl → H2CO3 + CaCl2
10. Classify the following decomposition reactions as either an acid–metal reaction, acid–base reaction or precipitation reaction.
a) H2S(g) + 2KOH(aq) → K2S(aq) + 2H2O(l)
b) magnesium + sulfuric acid → magnesium sulfate + hydrogen
c) 2NaOH(aq) + CuSO4(aq) → Na2SO4(aq) + Cu(OH)2(s)
Evaluating
11. Write a balanced symbol equation for the metal displacement reaction of lead (Pb) with silver nitrate (AgNO3).
12. Write a balanced symbol equation for the reaction of calcium metal (Ca) with nitric acid (HNO3).
13. Justify how you can identify the type of reaction shown below. copper + silver nitrate → silver + copper nitrate
Learning goal
At the end of this section, I will be able to:
1. Describe how Aboriginal and Torres Strait Islander Peoples use pyrolysis, fermentation and calcination reactions to produce useful products.
Chemical reactions produce a large variety of different products. In this section, you will explore how some useful products are created using chemical reactions.
Making thinking visible 5.2
Chalk talk: useful chemical reactions
Chemical reactions are used to make useful products that humans use every day
1. What ideas and examples come to mind when you read the above statement?
2. Share your ideas with a partner.
3. Which of your ideas connect with your partner's responses?
4. What questions do you have after considering your partner's responses?
The Chalk talk thinking routine was developed by Project Zero, a research centre at the Harvard Graduate School of Education.
Ethanol fermentation, also known as alcoholic fermentation, is a process in which yeast (a microorganism) breaks down glucose (sugars) in the absence of oxygen to produce ethanol and carbon dioxide. You may recognise this reaction as an example of a decomposition reaction. The reaction equation is shown below.
Word equation: glucose → ethanol + carbon dioxide
Symbol equation: C6H12O6(aq) → 2C2H5OH(l) + 2CO2(g)
It is important to understand that fermentation is a naturally occurring chemical reaction. There is evidence that Aboriginal and Torres Strait Islander Peoples have been making fermented beverages for thousands of years. For example, the Eucalyptus gunnii trees that originate from the Central Highlands of Lutruwita/Tasmania contain a sap that looks a lot like maple syrup. Yeast ferments the liquid gold into an alcoholic cider-like beverage that the local Aboriginal Peoples may consume. Scientists from the University of Adelaide are currently using DNA sequencing to identify the microorganisms responsible for this natural fermentation to determine if they are the same or different to those found in other fermentation contexts. It is possible that new species will be identified!

fermentation a biological process in which microorganisms convert glucose into ethanol and carbon dioxide
This fermentation process is not only used to produce alcoholic beverages but also to manufacture biofuels, like bioethanol. Many Australian drivers can now purchase petrol that contains a certain percentage of bioethanol. Bioethanol is added to petrol because it produces heat energy when burned, just like petrol, but it burns more 'cleanly', releasing fewer smog-producing chemicals. Normally, the ethanol that petrol contains is produced on an industrial scale using non-renewable fossil fuels. Production of ethanol in this way is obviously not sustainable as there is a limited amount of fossil fuels in our world. However, the production of bioethanol is sustainable as it involves the fermentation of glucose obtained from sugar cane, a renewable resource.
Practical 5.7
Aim
To examine the effect of temperature on the fermentation of sugar by yeast, by looking at the production of carbon dioxide
Materials
• 30 mL of yeast suspension
• 25 mL of 5% glucose solution
• distilled water (room temperature)
• ice
• large test tubes × 2
• test-tube rack
• balloons × 4
Method
Part A
Be careful
You must wear a lab coat and eye protection during this experiment.
• stopwatch
• stirring rod
• thermometer
• ruler
• 250 mL beakers × 4
• 5 mL measuring cylinder
1. Place two large test tubes in the test-tube rack. Label the test tubes A and B.
2. Prepare the balloons by inflating and deflating each balloon 3–5 times.
3. Place 3 mL of the yeast suspension in each test tube.
4. Fill each test tube with warm water to a depth of 2 cm; use the ruler to measure the depth.
5. To test tube A, add 3 mL of 5% glucose solution. Gently swirl the test tube until the contents are mixed. Then place a deflated balloon over the top of the test tube.
6. To test tube B, add 3 mL of distilled water (room temperature). Gently swirl the test tube until the contents are mixed. Then place a deflated balloon over the top of the test tube.
7. Place the test tubes back in the rack. Describe the test tubes at time 0 minutes. Use the ruler to measure the distance (mm) from the bottom of the test tube to the top of the mixture for each test tube.
8. Observe the balloons on the test tubes after 30 minutes. Record the distance (mm) from the bottom of the test tube to the top of the mixture for each test tube.
Part B
1. Label two test tubes 1 and 2 and place them in the test-tube rack.
continued … bioethanol ethanol produced biologically from the fermentation of sugar
2. Prepare two different temperature environments using the 250 mL beakers. You can use ice and hot tap water to get the desired temperatures. Fill the beakers to 150 mL. Record the temperature of each beaker.
3. Add 3 mL of 5% glucose solution to each test tube.
4. Add 3 mL of yeast suspension to each test tube.
5. Swirl the test tubes gently to mix the contents.
6. Carefully place a balloon over the top of each test tube. Place each test tube in a different temperature water bath (beaker prepared in step 2).
7. Leave the test tubes for 10 minutes in their respective water baths. Remember to keep the temperature as constant as possible; you may need to add hot water or ice.
8. After 10 minutes, start your experiment.
9. Using a stopwatch, record your results each minute, starting at time 0 min, for 10 minutes. Use a ruler to measure the distance (mm) from the bottom of the test tube to the top of the mixture for each test tube. Also note any changes in the balloon.
10. Collate the class data.
Results
Table showing the results from Part A
Observations
A (glucose) B (water)
Table showing the results from Part B
1. Draw a line graph of the class results.
Discussion: Analysis
1. Outline the purpose of Part A of the experiment.
2. Explain why it was recommended that the balloon was inflated and deflated several times before use in the experiment.
3. Explain, referring to the data, the effect that temperature has on the production of carbon dioxide in Part B. Include the word equation for fermentation as part of your answer.
4. Suggest what Part B tells us about the temperature at which Aboriginal and/or Torres Strait Islander Peoples make ethanol.
Discussion: Evaluation
1. Suggest possible errors in the experimental design and how they may have affected the results.
2. Recommend improvements related to the errors identified in question 1.
Quick check 5.13
1. Name the microorganism needed to break down sugars in fermentation.
2. Name the fuel that is made by fermenting sugars.
It is well known that Aboriginal and Torres Strait Islander Peoples have created artworks on rock surfaces for tens of thousands of years. The Bunjil Shelter in Gariwerd/Grampians National Park is an example of this and is a significant cultural site. The age of the painting itself is not known; however, the pigments of the paint have been tested and are believed to be thousands of years old.
Figure 5.23 Bunjil Shelter at Gariwerd is home to the only known rock-art depiction of the Aboriginal creator spirit Bunjil.
The pigments in paint used by Aboriginal and Torres Strait Islander Peoples are made from different clays. For example, kaolin clay produces the white pigment, while ochre clay is responsible for the red, yellow and orange pigments. Ochre is a complex mixture of iron oxides and other minerals that can include calcite and gypsum. It is the iron oxides, such as haematite and goethite, that contribute to the beautiful ochre pigment colours.
Ochre
Mixture of different materialsYellow, red, brown
Yellow, brown
Table 5.10 Some common iron oxide pigments
There are also historical accounts that some white pigments were deliberately manufactured from calcium sulfate dihydrate (gypsum) using a chemical reaction called calcination. This is where the substance is heated, using a furnace or kiln, and carbon dioxide and sulfur dioxide are removed. This results in a fine white powder that can then be used as a pigment for painting or the foundation for making plaster. Plaster is used by many Aboriginal and Torres Strait Islander Peoples to make balls for various rolling and spinning games, and also for body ornamentation. The chemical reaction is shown below, and you will notice that it is an example of a thermal decomposition reaction.
Word equation: calcination the process of heating a substance in a controlled environment to change its physical or chemical composition
Symbol equation:
A requirement of calcination is that the heating process must be very carefully controlled, so that only the right amount of water (in crystalline form) is removed. For example, when using calcination to make plaster from gypsum, the reaction must occur for the right amount of time at the right temperature, otherwise too much of the crystalline water will be removed from the gypsum and the mineral will be rendered useless.
using a synchrotron to help conserve Aboriginal and Torres Strait Islander Peoples' cultural heritage
Researchers are now using X-ray science to understand the chemical composition of the different pigments and binders in the paints used by Aboriginal and Torres Strait Islander Peoples. Using synchrotrons (particle accelerators) in the US and France, scientists have analysed century-old plant secretion samples, such as sap and resin, by aiming high-energy X-rays at them. In this way, they were able to uncover their detailed molecular structures. This breakthrough will aid in identifying and conserving Aboriginal and Torres Strait Islander art and possibly even tools. The successful use of this technique paves the way for further studies on other culturally significant organic materials. Science as a human endeavour 5.1
The process used by Aboriginal and Torres Strait Islander Peoples to make charcoal is called pyrolysis. Pyrolysis describes the burning of organic matter in a low-oxygen environment. However, now that we know more about types of reactions, we should also mention that pyrolysis is a thermal decomposition reaction. You have likely seen this type of chemical reaction in action when watching a campfire and a dark smoke appears. While the surface of the wood has sufficient atmospheric oxygen to burn, the interior of the wood is in a low-oxygen environment. This combination of low oxygen and high heat causes the interior material to undergo pyrolysis, transforming it into charcoal. The reaction for this process is shown below.
Charcoal has a variety of uses for Aboriginal and Torres Strait Islander Peoples, including:
• paints (when combined with animal fats) for decorating different surfaces
• adhesives (when combined with tree gums and resins) for gluing axe heads or spear heads to shafts, and patching water containers and watercraft.
Careful control and knowledge of combustion is required to maximise charcoal production, as the wood must be burned not only in a low-oxygen environment but also at a temperature low enough that the carbon does not burn to ash.

pyrolysis the burning of organic matter in a low-oxygen environment
Did you know? 5.3
In Central Australia, Aboriginal Peoples of the area pyrolyse the plant matter of a plant species known to have a high calcium content. The calcium is converted to calcium oxide during the pyrolysis reaction and collected in the resulting ashes. These ashes are then combined with the leaves of a medicinal plant for chewing. The calcium oxide enhances the release of the medicinal chemicals from the plant leaves, creating a very effective medicine.
Figure 5.26 Some Aboriginal and Torres Strait Islander Peoples in Central Australia pyrolyse biomass in the form of twigs and leaves as a source of calcium oxide.
Quick check 5.14
1. Outline the role of pyrolysis and calcination in traditional ways of making pigments.
Section 5.3 review
Go online to access the interactive section review and more!
Section 5.3 questions
Remembering
1. State the reactant/s in the process of fermentation.
2. Define the term thermal decomposition.
Understanding
3. Describe the purpose of calcination, including an example.
Applying
4. Outline an example of how Aboriginal and Torres Strait Islander Peoples use decomposition reactions.
5. Describe a use of the fermentation reaction as used by groups of Aboriginal and Torres Strait Islander Peoples to prepare useful products.
Analysing
6. Some Aboriginal people living far from the sea use alkali salts in wood ashes as a substitute for the essential and highly desired ingredient, sea salt. By pyrolysing specific plant matter, potassium and sodium bound within the plant are released. Explain how this process may be different from the process used to make charcoal.
Evaluating
7. Evaluate the advantages and disadvantages of biofuels produced by fermentation.
8. Chemical reactions happen everywhere in the world around us. Discuss the benefits of some of the chemical reactions used by Aboriginal and Torres Strait Islander Peoples. WORKSHEET
Learning goals
At the end of this section, I will be able to:
1. Calculate the reaction rate of a chemical reaction.
2. Outline the methods used to measure the quantity of reactants used up or the quantity of products formed in a chemical reaction.
3. Describe how different factors affect the frequency of collisions between reacting particles and consequently the rate of a chemical reaction.
4. Describe a chemical reaction employed by Aboriginal and/or Torres Strait Islander Peoples to convert toxic plants into edible food products.
Reaction rate
How quickly a chemical reaction progresses is described by the term reaction rate. The rate of a chemical reaction can be calculated by measuring the quantity of a reactant used up over time, or the quantity of product formed over time.
reaction rate = quantity of reactant used up time
reaction rate = quantity of product formed time
The quantity of a reactant or product can be measured by the mass (in grams) or volume (in millilitres), and the time should be measured in units of seconds. Therefore, the units for rate of reaction are usually given as g s–1 or mL s–1. In some cases, when a quantity of reactant or product has not been measured, a reaction rate can be calculated just from the time taken for the reaction to go to completion.
reaction rate (s–1) = 1 time (s)
A higher reaction rate is characterised by faster formation of products, faster consumption of reactants, or more rapid completion of the reaction.
reaction rate the quantity of reactant or product used up or made per unit of time; how quickly the reaction progresses
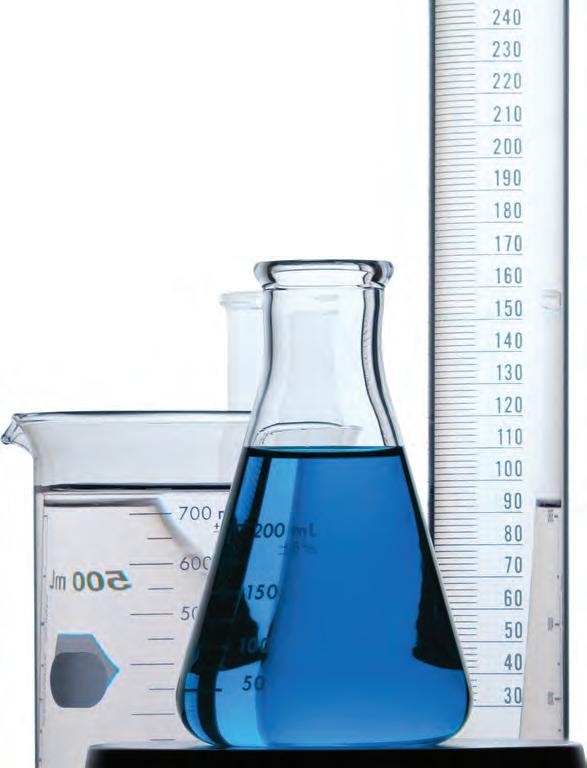
Aim
To determine how the mass of zinc affects the rate of reaction with nitric acid, using the upturned measuring cylinder technique
Hypothesis
Write a hypothesis for your investigation regarding the effect that the mass of zinc will have on the rate of the reaction.
Materials
• zinc powder
• 2 mol L–1 nitric acid
• 25 mL measuring cylinder
• 50 mL measuring cylinder
• 250 mL conical flask
• large bowl or container
Method
Be careful
Wear appropriate personal protective equipment.
• stopper and delivery tube
• weighing boat
• bosshead and retort stand
• electronic balance
• stopwatch
Before beginning, remember to first read through the method. Identify potential risks and how you can minimise their impact. Identify the independent and dependent variables, and consider three variables you will need to control and how you will do this.
1. Copy the results table into your science book.
2. Half fill the large bowl or container with water.
3. Fill a 50 mL measuring cylinder with water and carefully invert it in the large bowl of water. Do not lose any water out of the measuring cylinder. Try to remove as much air as possible from the measuring cylinder.
4. Clamp the measuring cylinder in place using a bosshead and clamp.
5. Using the 25 mL measuring cylinder, measure 20 mL of 2 mol L–1 nitric acid and pour the acid into the conical flask.
6. Using the electronic balance, measure 1.0 g of zinc powder into a weighing boat.
7. Set up the delivery tube so the end without the stopper runs underneath and into the upturned measuring cylinder (see Figure 5.27 to help you).
8. Pour the zinc powder into the conical flask containing the acid. Immediately put the stopper on top of the flask and start the stopwatch.
9. After one minute, record the volume of water displaced from the measuring cylinder. This is the same as the volume of gas produced.
10. Repeat twice more with the same mass of zinc powder.
11. Repeat the steps for the other masses of zinc powder.


Measuring cylinder filled with water


Results
Table showing the volume of gas collected from a reaction between acid and different masses of zinc
Mass of zinc (g)
Trial 1
Volume of gas collected after 1 minute (mL)
Trial 2
Trial 3
Mean 1.00 1.50 2.00 2.50
1. Calculate the mean volume of gas released for each mass of zinc.
2. Plot a graph with mass on the horizontal axis and volume of gas on the vertical axis.
1. What does your graph tell you about the relationship between the mass of zinc and reaction rate?
2. Write a balanced symbol equation with state symbols for the reaction between zinc metal (Zn) and nitric acid (HNO3) to form zinc nitrate (Zn(NO3)2) and hydrogen (H2).
3. List other methods you could have used to monitor the rate of this reaction.
Conclusion
1. Make a claim about the effect of the mass of zinc on the rate of the reaction in this experiment.
2. Explain your claim using the data you gathered and include potential sources of measurement uncertainties or experimental faults.
3. State whether your hypothesis was supported or not supported by the data you gathered.
In the chemical manufacturing industry, it is important to know how to change the speed or rate of chemical reactions to ensure the most efficient, cost-effective and time-effective method is being used.
For a chemical reaction to occur, reactant particles must collide with one another to cause bonds to break and new bonds to form. However, not all collisions are 'successful' in forming new products. This is because bonds will only break if the reactant particles collide with at least a certain level of energy, called the activation energy, which is unique to each chemical reaction. To increase the rate of a reaction, we can increase the frequency (or how often) the reactant particles collide with each other and/or the proportion of reactant particles that have sufficient energy to overcome the activation energy. Both would lead to a greater chance of a successful collision, resulting in a higher rate of product formation. An analogy to help you conceptualise this is playing the drums. An increase in the frequency of collisions between reactants is analogous to beating the drum quicker (up-tempo). An increase in the energy of collisions can be likened to striking the drum harder (accent). Both actions produce more sound, similar to how both factors lead to a faster rate of reaction.
Now we are ready to learn about six different factors that can contribute to increasing the rate of reaction.
concentration the amount of substance in a given volume
concentrated
solution a solution that contains a relatively large amount of solute compared to solvent
dilute solution a solution that contains a relatively small amount of solute compared to solvent
1. State two requirements for a successful chemical reaction. 2. Define the term 'activation energy'.
WORKSHEET
The concentration of a solution is a measure of the number of solute particles there are per unit volume.
We can describe a solution in different ways:
Increasing concentration
Figure 5.29 Increasing the concentration of a solution increases the number of particles within the same volume, increasing the frequency of collisions between particles.
• A solution that contains a high number of solute particles within a given volume of solvent is called a concentrated solution
• A solution that contains a low number of solute particles within a given volume of solvent is called a dilute solution.
If there are more particles, the particles are more likely to collide with each other, so there will be more frequent collisions and the reaction rate will increase.
Although increasing the concentration increases the frequency of collisions, it does not affect the kinetic energy of the particles. However, as collisions are occurring more frequently, successful collisions will also occur more frequently.
1. Decide whether the following statements are true or false. If false, state a reason why.
a) A dilute solution contains few reactant particles in a given volume.
b) Increasing the concentration of a reactant decreases the activation energy needed for collisions.
Practical 5.9
Concentration and reaction rate
Aim
To determine how changing the concentration of sodium thiosulfate affects the rate of reaction with hydrochloric acid
Hypothesis
Construct a hypothesis regarding how the sodium thiosulfate concentration will affect the reaction rate.
Materials
• 2 mol L–1 hydrochloric acid
• 0.15 mol L–1 sodium thiosulfate solution
• 250 mL conical flask
• 10 mL measuring cylinder
• 50 mL measuring cylinder x 2
Be careful
Hydrochloric acid is corrosive.Wear appropriate personal protective equipment. This experiment must be performed in a fume hood. Do not breathe in fumes when making observations.
• distilled water
• stirring rod
• piece of white paper
• black marker pen
• stopwatch
Practical 5.9
Concentration and reaction rate
Method
Remember to begin by first reading though the method, identifying risks and considering ways to minimise or control them.
1. Copy the results table into your science book.
2. Using the black marker, draw a large 'X' on the white paper.
3. Using a 50 mL measuring cylinder, measure 50 mL of sodium thiosulfate and pour it into the 250 mL conical flask. In the fume hood, centre the conical flask on the black cross (Figure 5.30).
4. Using the 10 mL measuring cylinder, measure 5 mL of hydrochloric acid.
5. Pour the acid into the conical flask, stir with a stirring rod and start the stopwatch.
6. Stop timing when the cross is no longer visible and record the time in your results table.
7. Follow your teacher's instructions for disposing of the reaction mixture.
8. Repeat steps 3–7 for each concentration of sodium thiosulfate in the results table. Remember to check the results table for the volume of sodium thiosulfate and water required for each concentration. The concentration of the sodium thiosulfate you are starting with is 0.15 mol L–1; adding water dilutes the solution.

Conical flask

Write a title for your table. Begin with 'Table showing ...' and include reference to the independent and dependent variables.
thiosulfate (mol L–1)
1. Work out the relative rate of the reaction by calculating: 1 reaction time
2. Plot a graph of concentration (horizontal axis) versus rate (vertical axis).
1. Using your graph, describe how increasing the concentration of sodium thiosulfate affects the rate of this chemical reaction.
2. Explain why increasing the concentration of a reactant normally increases the rate of reaction.
3. Explain why the disappearing cross method was suitable for this reaction, using the equation below:
Na2S2O3(aq) + 2HCl (aq) → S(s) + SO2(g) + 2NaCl(aq) + H2O(l)
Conclusion
1. Make a claim about how the concentration of sodium thiosulfate affects the rate of reaction.
2. Support your claim using the data you gathered.
3. State whether your hypothesis was supported or not supported based on your findings.
or
of an object
To increase the pressure of gaseous particles you can increase the number of particles in a given space, or decrease the volume of the container that the particles are in.
Gaseous particles under high pressure are likely to collide more frequently as there are more particles per unit of volume.
Therefore, increasing the pressure of the reactants in a chemical reaction will increase the rate of reaction.
This can only happen if one of the reactants is a gas because solid and liquid particles are not easily compressed. It is a bit like the comparison between a class of 30 students running around a sports hall with the same class running around in a classroom. The smaller space increases the pressure, meaning you are more likely to collide with another student. The energy with which the students collide, however, is not affected.
Imagine a loaf of bread: when its surface area is increased by cutting into slices, there is a greater area of the bread exposed to the air, so it dries out or becomes stale more quickly. surface
Figure 5.31 Reducing the volume of the container increases the pressure and increases the chance a collision will occur.
1. Describe why increasing the pressure of a solid and liquid does not affect reaction rate.
2. Describe a way in which the pressure of gas in a container can be increased.
When solids react, only the particles on the surface are in contact with particles of the other reactant when they collide. By making a solid smaller, such as by cutting it into pieces or grinding it into a powder, the surface area is increased. Consequently, more particles are exposed to possible collisions, which can increase the reaction rate, as shown in Figure 5.33.

Low surface area High surface area
Zinc particle Water molecule
Using the scientific method, design a mini investigation you could do at home to determine the effect of surface area on reaction rate. You will use effervescent drink tablets and water to create your reaction. Remember that in science you need to ensure your experiments are a fair test. So, as you plan and conduct your experiment, you may want to review Figure 1.1 in Chapter 1 to ensure all aspects are covered.
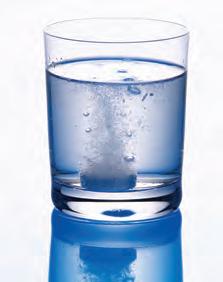
Did you know? 5.4

The pharmaceutical industry manufactures a wide variety of medicines through chemical reactions to produce very specific chemicals to help an immune response or reduce pain, for example. Often pharmaceuticals are sold in tablet form and are meant to be swallowed in that form – not crushed! The chemicals in the tablet can react with stomach acid to release the active ingredients into the bloodstream in a controlled fashion. However, if the tablet is crushed, the surface area of the reactant is increased and the reaction in the stomach becomes much faster and less controlled. Therefore, there is a possibility of experiencing other side effects, as the medicine has been released into the body too quickly. Moreover, it might also render the medicine less effective. Pharmaceuticals in tablet form are designed to both give you relief from illness and provide the medicine over the right amount of time.
1. List two ways that the surface area of a solid can be increased.
2. A chemical reaction contains two different gaseous reactants. Justify whether increasing the pressure of the reaction is a reasonable strategy to increase the reaction rate.
3. Explain why increasing the surface area of a reactant increases the reaction rate.
Practical 5.10
Surface area and reaction rate
Rhubarb contains oxalic acid, which will react with pink-coloured acidified potassium permanganate to form colourless manganese(II) ions. This provides an ideal end point for measuring the rate of reaction.
Aim
To investigate how changing the surface area affects reaction rate
Hypothesis
Be careful
Risk of acid burns. Wear appropriate personal protective equipment. Wear safety glasses at all times. Do not consume food items.
Develop a hypothesis by predicting how a change in the independent variable will affect the dependent variable.
Materials
• 250 mL measuring cylinder
• 50 mL measuring cylinder
• 80 mL beakers × 9
• 300 mL beaker
• potassium permanganate crystals
• 1 mol L–1 sulfuric acid
Method
Preparation
• white tile
• rhubarb stalks with leaves removed
• cutting tile
• knife
• stopwatch
• tweezers
1. Identify the independent variable from the information in the aim and describe the different groups that will be set up for the experiment.
2. Define the dependent variables and how they will be measured.
3. Identify and list the controlled variables to be monitored. For each variable, you must define the property that will be measured (numerically if possible) to ensure they are not changing throughout the experiment – for example, temperature (to be maintained at 25°C).
4. Write a risk assessment for this investigation.
5. Create a results table that will allow you to collect sufficient and relevant raw data, in addition to calculating the mean and uncertainty. Remember to write a title for your table. Begin with 'Table showing ...' and include reference to the independent and dependent variables.
Part 1: Prepare the potassium permanganate solution
1. Using a 250 mL measuring cylinder, measure 150 mL of 1 mol L–1 sulfuric acid, and pour into a 300 mL beaker.
2. Add a small pinch of potassium permanganate crystals to the beaker and stir well.
3. Add another 150 mL of 1 mol L–1 sulfuric acid to this solution. The solution will change to a light purple colour.
Part 2: Prepare the rhubarb
1. Cut nine identical lengths of rhubarb (about 3 cm long), ensuring they are as uniform as possible. You may need to use your knife to create straight edges and remove any excess.
2. Take three of the lengths and calculate the approximate surface area of one of these lengths using the calculation in Figure 5.36. These will be your 'low'-surface-area rhubarb.
3. Take another three of the lengths and cut them each in half. Calculate the total surface area for the two halves. This will be your 'medium'-surface-area rhubarb.
4. Take another three of the lengths and cut them into four even pieces. Again, calculate the total surface area for the four quarters. This will be your 'high'-surface-area rhubarb.
SA = 2lw + 2lh + 2wh l h w
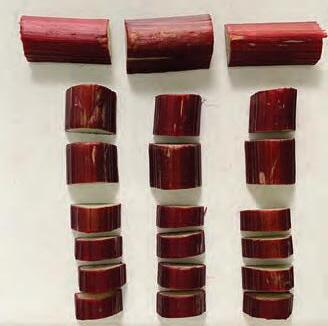
Part 3: Measure the reaction time
Low surface area
Medium surface area
High surface area
1. Using a 50 mL measuring cylinder, measure 30 mL of acidified potassium permanganate and pour into an 80 mL beaker and place on a white tile.
2. Using tweezers, add a piece of the low-surface-area rhubarb to the beaker. Be careful not to splash the acid.
3. Immediately start the stopwatch. Stir the solution until the purple colour disappears, then stop the timer. You may want to have a beaker of water next to the reaction beaker for a comparison.
4. Complete Part 3 steps 1–3 twice more with the other pieces of low-surface-area rhubarb.
5. Repeat steps 1–3 with the other samples. Remember that for your 'medium' surface area, you will need to add both halves to the beaker together. For your 'low' surface area, you need to add all four quarters.
6. Record your data in the table.
Results
1. Calculate the mean reaction rate for each rhubarb sample.
2. Draw a scatter plot to analyse the relationship between the numerical independent variable and its dependent variable.
Discussion: Analysis
1. Describe any trends, patterns or relationships that are found in your results.
2. Use your graph to predict the value of the dependent variable if you were given rhubarb pieces that were halfway between the sizes of the medium-surface-area and high-surface-area groups.
3. Extrapolate your data to predict the value of the dependent variable if you were given rhubarb pieces that had been cut into eight pieces.
Discussion: Evaluation
1. How much variation was observed between the measurements for different student groups within the class?
2. Were other variables that could affect the validity of the results successfully controlled during the experiment?
3. Suggest any other changes that could be made to the method to improve the validity of the results in future experiments.
Conclusion
1. Make a claim about the relationship between the surface area of the rhubarb and the reaction rate.
2. Support your statement by explaining how the data you gathered support your claim.
3. State whether your hypothesis was supported or not supported based on the data you gathered.
agitating stirring, swirling or shaking a mixture
Stirring (agitation)
When a chemical reaction like the one in Figure 5.38 is left undisturbed, the product forms on the surface of the solid reactant, creating a barrier for any further reaction. Stirring or agitating the reaction mixture will remove or break apart the layer of product coating the reactant. This increases the reaction rate as it exposes more of the reactant particles to the possibility of collisions. As with increasing concentration and surface area, stirring a chemical reaction only increases the frequency of collisions and, by extension, the frequency of successful collisions. Agitation does not change the activation energy of the reaction and so does not affect the proportion of successful collisions.
Reactant 1
Reactant 2
Product


5.38 Stirring this reaction mixture would allow more of Reactant 1 to come into contact with Reactant 2.
1. Explain why reaction rate increases when a mixture is agitated.
Temperature
When you increase the temperature of a reaction, the rate of reaction also increases. This is because when thermal energy is added to a reaction, it is converted into kinetic (movement) energy, so the particles move at greater velocity or speed. Particles are therefore likely to collide more frequently with each other, and because they move at greater velocities, they are also more likely to collide with more force. This means a greater proportion of particle collisions will overcome the activation energy and a product will form.
Increasing temperature
Figure 5.39 Increasing the temperature of a reaction increases kinetic (movement) energy of the reactant particles, increasing the number of successful collisions.
Quick check 5.20
1. When heat is applied to a chemical reaction, state which one of the following types of energy the heat energy is converted to by the particles.
A. chemical energy
B. gravitational potential energy
C. kinetic energy
D. light energy
2. Describe why increasing the temperature of a chemical reaction increases the frequency of successful collisions.
Try this 5.4
Get three glasses and fill one with ice-cold water, one with room-temperature water and one with hot water. Crack three glow sticks and add one to each glass. Observe which one glows the brightest.

Did you know? 5.5
When James Cook's fleet arrived in Australia in 1770, many of his crew became very ill after consuming the toxic seeds of the cycad plant. Many Aboriginal and Torres Strait Islander Peoples in North Queensland, such as the Dyirabal People, had already mastered the processes for detoxifying the seeds. The detoxification process involves roasting, slicing and pounding the seeds to increase the surface area. The seeds are then leached overnight (or longer) in running water, so that the exposed soluble toxins are washed away. Sometimes heating is included in the process to make the toxic substances more soluble. Following this, the seeds are buried in the ground, allowing for fermentation of the seeds by microorgansims. This is just one example of how Aboriginal and Torres Strait Islander Peoples increase the rate of chemical reactions using surface area and temperature to detoxify plants into edible foods.

Temperature and reaction rate
Aim
To determine the effect of temperature on reaction rate
Hypothesis
Write a hypothesis for your investigation regarding the effect of temperature on reaction rates.
Materials
• 0.15 mol L–1 sodium thiosulfate solution
• 2 mol L–1 hydrochloric acid, initially at room temperature
• 10 mL measuring cylinder × 2
• 50 mL measuring cylinder
• 250 mL conical flask × 3
• ice
• stopwatch
• thermometer
• water bath (heated to 50°C)
• bench mat
• stirring rod
• piece of white paper
• black marker pen
Method
Be careful
Hydrochloric acid is corrosive. Avoid breathing in the gas it produces. Heat the hydrochloric acid using a water bath only. Do not heat the acid directly with a Bunsen burner or hotplate. Do not seal the test tube while reacting the acid and sodium thiosulfate. Wear appropriate personal protective equipment. Wear safety glasses. This experiment must be performed in a fume hood.
Remember to consider your materials and method, identifying risks and determining how best to minimise and control them. You may notice that this practical activity uses the same reactants that you used in your investigation into the effect of concentration on reaction rate.
1. Copy the results table into your science book.
2. Using the 10 mL measuring cylinder, measure 10 mL of the sodium thiosulfate solution and 40 mL of water into a conical flask.
3. Measure 5 mL of dilute hydrochloric acid in a small measuring cylinder.
4. Put the conical flask over a piece of white paper with a cross drawn on it.
5. Add the acid to the conical flask, swirl the flask, place it back on the cross and start the stopwatch.
6. Record the temperature of the mixture in your results table.
7. Look down at the cross from above. When the cross disappears, stop the stopwatch and record the time taken for the cross to disappear.
8. Follow your teacher's instructions for disposing of the reaction mixture.
9. Repeat steps 2–8 another two times.
10. Repeat the entire experiment, but this time using ice to cool the sodium thiosulfate solution in the conical flask prior to adding the acid.
11. Again, repeat the entire experiment, but this time using a heated water bath to warm the sodium thiosulfate solution in the conical flask prior to adding the acid.
Results
Write a title for your table. Begin with 'Table showing ...' and include reference to the independent and dependent variables.
Temperature (°C)
Trial 1
Time taken for the cross to disappear (s)
Trial 2
Trial 3
Mean
1. Give two controlled variables and state why they needed to be controlled.
2. Calculate the mean time taken for the cross to disappear at each temperature.
3. Plot a graph of your results, including a line of best fit.
Discussion: Analysis
1. Identify any patterns, trends or relationships in your results.
2. Explain why increasing the temperature of a reactant usually increases the rate of reaction.
Conclusion
1. Make a claim regarding the effect of temperature on reaction rate based on this experiment.
2. Support your claim by explaining how the data you gathered provide evidence.
3. State whether your hypothesis was supported or not supported based on your findings.
A catalyst is a substance that can be added to a chemical reaction to increase the reaction rate. There is no net consumption of a catalyst, so it is present at the beginning and end of the reaction in the same quantity. For this reason, a catalyst is shown above the arrow in a chemical equation rather than on the reactant or product side of the equation.
For example, when you eat carbohydrate-rich foods, the starch molecules react with water and are broken down into glucose. The enzyme amylase, which is found in your saliva, acts to catalyse this reaction. catalyst a substance that speeds up a chemical reaction by lowering the energy needed to break bonds (activation energy); does not get used up in the process
Catalysts increase the reaction rate by lowering the energy needed to break bonds (activation energy), as shown in Figure 5.42.
Figure 5.42 Adding a catalyst to a chemical reaction decreases the activation energy required to start the reaction, thus increasing the number of successful collisions and therefore the reaction rate.
It is a bit like sheep jumping over a fence. The sheep are the reactant particles and the fence is the activation energy. If the fence (activation energy) is high, fewer sheep (particles) will reach the other side (fewer collisions will produce a successful reaction). On the other hand, if the fence is lowered by adding a catalyst, more sheep will be able to jump the fence (there will be a greater number of successful collisions).
Quick check 5.21
1. Define the term 'catalyst'.
2. Describe how a catalyst increases the reaction rate.
Practical 5.12
Catalysts and reaction rate
Aim
To determine the most effective catalyst to decompose hydrogen peroxide
Materials
• 0.5 g manganese(IV) oxide
• 0.5 g iron(III) oxide
• 35% hydrogen peroxide solution
• 1 cm3 piece of potato
• 1 cm3 piece of liver
Method
1. Copy the results table into your science book.
Be careful
Wear appropriate personal protective equipment.
• 1 cm3 piece of celery
• dishwashing detergent
• 250 mL measuring cylinders × 5
• plastic tray
2. Line up the five measuring cylinders on the tray and add about 1 mL of dishwashing detergent to each measuring cylinder.
3. Add 25 mL of the 35% hydrogen peroxide to each measuring cylinder.
4. Add the manganese oxide to one of the measuring cylinders and start the stopwatch.
5. Measure the height of the foam when it stops rising.
6. Rinse the measuring cylinder and repeat this method for two more trials.
7. Repeat steps 2–6 for each of the catalysts.
Results
Write a title for your table. Begin with 'Table showing ...'.
Catalyst
Manganese oxide
Iron oxide
Potato
Liver
Celery
1. Calculate the mean height of foam for each catalyst.
Discussion: Analysis
1. Identify the catalyst that was the most effective at decomposing the hydrogen peroxide. How did you know?
2. Identify the catalyst that was the least effective at decomposing the hydrogen peroxide. How did you know?
3. Write a balanced symbol equation, including state symbols, for the decomposition of hydrogen peroxide (H2O2) into water (H2O) and oxygen (O2).
4. One of the products produced, water or oxygen, relights a glowing splint. Identify this product.
Discussion: Evaluation
1. Identify any limitations of your experiment.
2. Describe any changes you could make that would improve the reliability of your results.
Conclusion
1. Make a claim about which catalyst was most effective at speeding up the decomposition of hydrogen peroxide.
2. Support your statement by explaining how the data you gathered support your claim.
3. State whether your hypothesis was supported or not supported based on the data you gathered.
Table 5.11 summarises how each factor discussed in this section influences the rate of a chemical reaction.
Increasing concentration of reactants
Increasing pressure of gaseous reactants
Increasing agitation (stirring)
Increasing surface area of solid reactants
Increasing temperature Increased Adding a catalystNot affected
Table 5.11 A summary of how each factor discussed affects reaction rate
AI can be used to create brand new catalysts
In 2023, a team of scientists used AI algorithms to create new enzymes, or biological catalysts, in order to accelerate chemical reactions. These new enzymes could have some very important uses. For example, enzymes can improve biofuel production, food processing and pharmaceutical manufacturing. It may even be possible that the new enzymes can improve the environment by breaking down pollutants or cleaning up contaminated sites.
3-2-1 Bridge: Chemical reactions
List 3 ideas, 2 questions and 1 metaphor (or simile) relating to what you now know about chemical reactions.
Look back to when you did this activity at the start of Section 5.1. Explain how your new responses connect to or have changed from your initial responses.
The 3-2-1 Bridge thinking routine was developed by Project Zero, a research centre at the Harvard Graduate School of Education.
Section 5.4 questions
Remembering
1. State three factors that can affect the rate of a chemical reaction.
2. State whether the following statements are true or false. If false, state a reason why.
a) Increasing the rate of stirring has no effect on the rate of reaction.
b) Changing the surface area of liquid reactants will increase the reaction rate.
c) Changing the pressure of a reaction mixture will only affect reactions containing gaseous reactants.
d) Increasing the temperature of a reaction increases the frequency and energy of collisions.
3. Define the term 'collision'.
4. Recall the name of substances that can be added to a chemical reaction to reduce the activation energy.
5. a) Identify the two solutions in Figure 5.43 that have the same concentration.
b) Identify if the solution in the remaining beaker is more concentrated or more dilute, giving reasons for your choice.
6. State how the rate of reaction changes as the surface area of a solid reactant increases.
Understanding
7. Identify the correct word to complete the following sentences.
a) The greater the rate of reaction, the the reactants are used up.
b) The steeper the slope or gradient on a volume versus time graph, the the rate of reaction.
8. During an experiment, 45 mL of carbon dioxide was collected in 90 seconds. Calculate the rate of reaction and give appropriate units. Show your working.
9. Describe the requirements for a chemical reaction to occur.
10. Summarise the relationship between temperature and reaction rate.
11. Custard powder can explode when thrown into the air in the presence of a spark, but not when it is tightly packed in a container. Explain why.
12. Scientists often use magnetic stirrers to stir chemical reactions. Explain why this continuous stirring increases the rate of reaction.
13. Describe what is meant by the term 'rate of reaction'.
14. Explain why the rate of reaction is greatest at the beginning.
Section
Analysing
15. Contrast a dilute and concentrated solution.
16. Consider the reaction shown in Figure 5.44. Propose what you think may have happened when the graph changed direction, indicated by the '?'.
17. A student has two beakers of the same solution. They both have the same concentration. The student then combines them into the same beaker. Explain whether the student has changed the concentration of the solution.
Evaluating
18. Children are advised to take a smaller dose of medication than adults. Decide the factor affecting reaction rate that is influencing this advice.
19. The chemical reaction that occurs when you bake cake mixture requires a large amount of heat to be successful. What can you deduce about the activation energy of this reaction?
20. A student conducted an experiment to determine how changing the concentration of hydrochloric acid affected the rate of reaction with sodium thiosulfate. They plotted a graph of their results, which can be seen in Figure 5.45. Discuss what can be concluded about the effect of increasing the concentration of acid in this reaction, giving detailed reasoning why this may be the case.
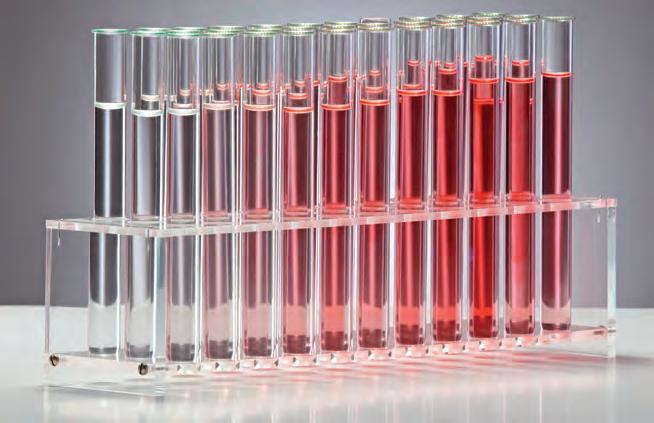
Chapter checklist
Success criteria
Linked questions
5.1I can represent a chemical equation using word and symbol equations, and particle diagrams. 1, 10, 13
5.1I can recall the correct use of state symbols in a symbol equation.17
5.1I can balance a chemical equation. 11, 17, 21, 22
5.2I can classify reactions as endothermic or exothermic. 8, 9
5.2I can identify different types of chemical reaction (synthesis, decomposition and displacement) and predict the products.
5.3I can describe how Aboriginal and/or Torres Strait Islander Peoples use pyrolysis, fermentation and calcination reactions to produce useful products.
4, 15, 18, 19
5.4I can calculate the reaction rate of a chemical reaction. 5, 7, 14, 16
5.4I can outline the methods used to measure the quantity of reactants used up or the quantity of products formed in a chemical reaction.
5.4I can describe how different factors affect the frequency of collisions between reacting particles and consequently the rate of a chemical reaction.
5.4I can describe a chemical reaction employed by Aboriginal and/ or Torres Strait Islander Peoples to convert toxic plants into edible food products.
Extension (available online in the Interactive Textbook)
5.5I can calculate the number of moles from a given mass or number of particles of substance.
3, 24, 25
2, 6, 12, 23
Section 5.5 questions
Review questions
Remembering
1. Name three diatomic elements on the periodic table.
2. State six factors that affect the rate of a reaction.
3. Describe two ways of monitoring the production of a gas from a chemical reaction.
4. Recall the products of an acid reaction with the following.
a) metal
b) base c) carbonate
5. State the units of rate for the following methods of measuring reaction rates. a) loss of mass b) production of a solid c) gas syringe
6. Recall one factor that speeds up the rate of a chemical reaction solely by affecting the frequency of collisions.
7. Recall the relationship between reaction rate and the time a reaction takes to reach completion.
8. State whether the temperature of the surroundings would increase or decrease in an endothermic reaction.
9. Identify if thermal decomposition reactions like pyrolysis and calcination would be classified as exothermic or endothermic.
Understanding
10. Write the word equation and balanced symbol equation for the process of fermentation.
11. Write a balanced equation for the reaction of magnesium metal (Mg) and aqueous hydrochloric acid (HCl), showing state symbols.
12. Describe what is meant by a 'successful collision'.
Applying
13. Represent the following balanced equation as a word equation. H2SO4 + Na2CO3 → Na2SO4 + CO2 + H2O
14. Calculate the rate of a reaction in which 1.5 grams of solid product was formed in 56 seconds.
15. State whether the following reactions are synthesis or decomposition reactions.
a) CuCO3 → CuO + CO2
b) 2H2 + O2 → 2H2O
16. Identify which of the 20-second time periods shown in Figure 5.46 demonstrates the fastest rate of reaction. Justify your choice.
Analysing
17. Analyse the equation to find the mistakes. 4HNO3(aq) + Cu(g) → Cu(NO3)2(aq) + H2O + 2NO2(g)
18. Classify the following as more or less reactive metals than iron.
a) potassium
b) gold
c) copper
d) zinc
19. Predict the outcome of the following displacement reactions.
a) iron oxide + carbon
b) copper nitrate + zinc
c) magnesium sulfate + zinc
d) gold + zinc nitrate
20. Explain how different Aboriginal and Torres Strait Islander Peoples' cultural knowledge of pyrolysis reactions is used to prepare effective medicines.
21. Discuss the importance of balancing equations.
22. a) Write a balanced equation for the calcination reaction involving CaCO3, commonly found in bones and shells, and the production of calcium oxide (CaO) and carbon dioxide.
b) Name the type of reaction that is shown in a
c) Give reasons for your decision in b
23. The reaction of hydrogen gas and ethene (C2H4) produces ethane (C2H6) in the presence of a palladium (Pd) catalyst. Write a balanced equation for this chemical reaction.
24. Discuss the importance of our understanding of reaction rates for the chemical industry.
25. Determine the most appropriate technique to monitor the rate of the following chemical reaction, giving reasons for your choice.
Zn(s) + H2SO4(aq) → ZnSO4(aq) + H2(g)
26. Cycads are a rich source of carbohydrates. However, if consumed, they can cause vomiting and nausea, and long-term damage to the nervous system. The removal of the toxic substance cycasin is a slow process. Discuss the processes used by the Aboriginal Peoples of North Queensland to speed up the detoxification process.

A group of chemistry students is measuring the rate of a reaction of magnesium metal and hydrochloric acid under different conditions. In three separate test tubes, the students added a strip of magnesium to 1 g L–1 HCl, powdered magnesium to 1 g L–1 HCl, and powdered magnesium to 2 g L–1 HCl. The data points are presented in Figure 5.47. Note that the mass of magnesium used was the same for each reaction.
Mg strip in 1 gL-1 HCl
Mg powder in 1 gL-1 HCl
Mg powder in 2 gL-1 HCl
Applying
1. Identify the conditions in which the reaction went to completion fastest.
2. Calculate the rate of the reaction (in mL s–1) for the magnesium strip in 1 g L–1 HCl from the time 0 to 40 seconds.
3. The rate of the reaction for the magnesium powder in 1 g L–1 HCl is 0.67 mL s–1. Use this information and your answers to questions 1 and 2 to determine which reaction has the slowest reaction rate.
Analysing
4. Identify the trend in the plot that is similar for all three experiments.
5. Contrast the effect of the magnesium surface area on the volume of gas produced and the rate of the reaction.
6. Analyse the data presented in Figure 5.47 for the three experiments. What would be the volume of gas collected for each experiment at 0 seconds (before reactants were mixed)?
Evaluating
7. A student has stated that when all magnesium and hydrochloric acid has reacted, the volume of gas produced will be 20 mL. Justify this conclusion with reference to the data in Figure 5.47.
8. Extrapolate the data for the magnesium strip in the 1 g L–1 HCl experiment and estimate the volume of gas produced after 120 seconds.
9. The students would like to run another experiment with the same mass of magnesium powder in 5 g L–1 HCl. Predict (using Figure 5.47 as a template) how the data might be different in this experiment.

Airbags work on the principle of increasing the time of impact between two objects. In a car crash this could be the difference between life and death. A sensor is connected to an electrical circuit and, once activated, will send a signal that ignites the guanidinium nitrate (CH6N4O3) and releases nitrogen at high speed. Airbags are not without risk, though. Failures include burns from the explosive chemical reaction and injuries from the projectile velocity of the bag itself, which can reach 330 km h–1
Design and create an airbag prototype that uses environmentally friendly chemicals and materials in its manufacture. The airbag will need to create gas rapidly to work effectively.
In groups you will design an airbag that uses a chemical reaction to produce a safe gas that fills the airbag space. Your design will incorporate features that would make your airbag safe through the whole chemical reaction and environmentally friendly for disposal. If you cannot source the materials you need, you can produce a model and state the chemical reaction.
Suggested materials
• various types of acid (e.g. vinegar)
• various types of base (e.g. baking soda)
• beakers of various size
• measuring cylinder
• rubber tubing
• thermometer
• plastic bags
• stopwatch
• balloons
• various building materials

1. Research how airbags work at present and how the chemicals are reacted in a safe way in the bag.
2. Research safe chemical reactions and different catalysts that could be used.
3. Discuss in your group the available materials you have and research environmental concerns regarding the disposal of these materials.
4. Decide as a group the chemical reaction you will use and how you will increase the rate of reaction of gas produced.
5. Design how your airbag will work, and sketch ideas before deciding on the final design. Remember, you will need to capture the gas. You may want to think about how you will test the effectiveness of your chemical reaction that is occurring within the bag.
6. Complete a risk management table for the chemicals you are using. Risk management should include how to minimise any risks associated with the experiment as well as how to deal with risks that emerge. Make a note of any special disposal conditions the chemicals may have.
Material Hazard Risk management
e.g. 2 mol L–1 hydrochloric acid Burning skin and/or clothing Use gloves and wear aprons; be careful when handling
7. Create your prototype airbag and test the effectiveness of your design.
8. Discuss the positives and negatives about your design. You may use a positive, negative, interesting (PNI) table, as shown below, to present your findings to the class.
9. Evaluate the effectiveness of your chemical reaction at producing gas, the reaction time for gas to be produced, the completion time of the reaction and how safe the chemical reaction was.
10. Recommend changes you would make in your design of the airbag and the chemical reaction choice.

Ranging from subatomic particles to the expanding universe, no other branch of science has the overall scope of astronomy. It has ancient origins and yet is still developing. In this chapter, you will learn about our position in the universe, how the universe began and what it is made of. You will examine how stars evolve and the ways we use technology to observe and learn about space. You will also consider how humans travel to and survive in space, and explore the importance of space research.
Can be classified by:
• colour
• brightness.
Star life cycle:
• Birth
• Main sequence
• Red giants
• Supergiants
• Supernovas
• Black holes
The Big Bang theory explains how everything began.
History of space exploration and human survival in space
Beyond our galaxy are trillions of other galaxies.
Measuring distances in space:
• Speed of light
• Parallax • Blue shift and red shift

the universe contains features including galaxies, stars, solar systems and black holes; the big bang theory models the origin and evolution of the universe and is supported by evidence (VC2S10U13)
• researching Aboriginal and/or Torres Strait Islander Peoples' knowledges of celestial bodies and explanations of the origin of the universe
• identifying the different technologies used to collect astronomical data and the types of data collected, and describing the major components of the universe using appropriate scientific terminology and units, including astronomical units, scientific notation and light years
• examining how the light spectra and brightness of stars are used to identify compositional elements of stars, their movements and their distances from Earth
• explaining how each different type of evidence, such as cosmic microwave background radiation, red shift or blue shift of galaxies, Edwin Hubble's observations and proportion of matter in the universe, supports the big bang theory
• exploring recent advances in astronomy, including the Australian Square Kilometre Array Pathfinder, and in astrophysics, such as the discovery of gravitational waves, dark matter and dark energy, and identifying new knowledge that has emerged
space exploration seeks to expand knowledge of the origins and structure of the universe and to resolve the challenges of humans travelling and living away from Earth's surface (VC2S10U12)
• creating a story about a day in the life of a person living on Mars
• designing and launching simple water or air rockets to understand the principles of rocket propulsion, using altimeters to measure the altitude reached by the rockets and discussing the challenges of escaping Earth's gravitational pull
• researching and designing their own space suits, including creating scaled-down prototypes or artistic representations, following a discussion about the necessary features for survival in space, such as protection from radiation, temperature regulation and life support systems
• developing a report about the current research and inhabitants of the International Space Station 6.5
• exploring the effects of microgravity on the human body by simulating it in the laboratory using reduced-gravity aircraft simulations or creating simple experiments to demonstrate how fluids behave differently in microgravity 6.5
• researching items and technologies that are a result of space research or examining the link between scientific research and real-world applications such as in new materials development 6.5
advances in technologies have enabled advances in science, while science has contributed to developments in technologies and engineering (VC2S10H02)
• investigating how satellites generate global data including for ocean temperatures, sea levels, and forest and ice cover, and examining how that data are used to evaluate the effects of climate change 6.5
Glossary terms
Absorption spectrum
Arcsecond
Astronomical unit (AU)
Baseline
Big Bang
Black hole
Blue shift
B–V colour index
Constellation
Continuous spectrum
Cosmic microwave
background
Cultural Lore
Dark energy
Dark matter
Doppler effect
Emission spectrum
Epoch of recombination

Exoplanet
Galaxy
Geocentric
Goldilocks zone
Heliocentric
H–R diagram (Hertzsprung–Russell diagram)
Hubble's law
Interferometry
Light year
Luminosity
Main sequence
Nebula
Neutron star
Nuclear fusion
Observable universe
Optical telescope
Parallax
Parsec
Payload
Photon
Physiological
Planetary nebula
Plasma
Radio telescope
Recessional velocity
Red giant
Red shift
Retrograde motion
Satellite
Singularity
Spectral class
Supernova
Thrust
White dwarf
DOC
WORKSHEET
Discovering the universe
At the end of this section, I will be able to:
1. Describe how human understandings of the universe have changed over time.
2. Explore recent advances in astronomy.
3. Identify the different technologies used to collect astronomical data and the types of data collected.
WIDGET
the universe
constellation a group of stars, as seen from Earth, that appears to form a familiar shape
Cultural Lore the stories, customs, beliefs and spirituality of Aboriginal and Torres Strait Islander people, which are passed down through generations and act as a guide for everyday life
Aboriginal and Torres Strait Islander Peoples have maintained a deep and complex knowledge of the night sky for tens of thousands of years, including naming celestial objects. Their sophisticated understanding of astronomy has led many scholars to recognise them as some of the earliest astronomers in human history.They have a rich and intricate astronomical knowledge that informs various aspects of their Cultures including navigation, weather prediction, calendars, cultural identity and storytelling.
Accounts of the universe's origins vary across different Aboriginal and Torres Strait Islander communities, reflecting the diversity of languages, landscapes, and ways of knowing. For example, in many Aboriginal and Torres Strait Islander cultures, the Sun is seen as a matriarchal spirit, though she is known by different names depending on the community. These variations reflect the Sun's fundamental role in sustaining life and governing cycles of fertility – an understanding that is central not only to Aboriginal and Torres Strait Islander cultures but to all human societies throughout history.
Many constellations are embedded within Dreaming stories, which differ between communities. Aboriginal and Torres Strait Islander astronomy not only identifies stars and constellations by their brightness, but also by patterns originating from the dark clouds. Dreaming stories are part of the Cultural Lore of Aboriginal and Torres Strait Islander Peoples. They are part of a living knowledge system and hold a deep cultural and spiritual significance.
Did you know? 6.1
Stories based on fact
Aboriginal and Torres Strait Islander Peoples have long included the thylacine in Dreaming stories and Cultural Lore, holding ecological knowledge with rigour that predates European science. The Nuenonne of Bruny Island tell of a thylacine pup gifting its stripes for bravery, while the Arrernte of Mparntwe know Akngwelye as a guardian of Country. These accounts encode detailed observations of species behaviour, habitat, and environmental change, now informing research on extinction, conservation, and environmental history. European science increasingly recognises the depth and scientific validity of Aboriginal Cultural Lore.
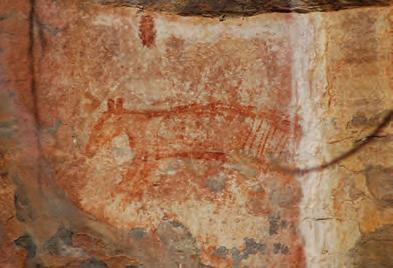
The cultural Lore of many Aboriginal and Torres Strait Islander communities describe the ancestral beings who created the cosmos, including the stars, Moon, Sun and other celestial bodies.
The Seven Sisters, also known as the Pleiades, is a star cluster in the constellation Taurus. The Seven Sisters are culturally important to many different Aboriginal and Torres Strait Islander Peoples. Although this star Lore can vary between cultural groups, it generally describes seven sisters who are pursued by a man and transformed into stars to escape him. In some versions, the man is an ancestral being who wants to marry the sisters, while in others he is a hero who is trying to catch the sisters for their own good.
Research Aboriginal and Torres Strait Islander Peoples' knowledges of celestial bodies.
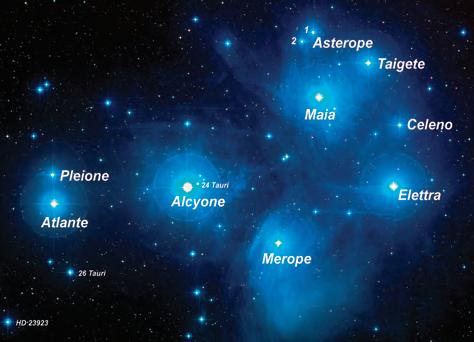

Try this 6.1
Use the Stellarium planetarium software program (available at stellarium.org) to simulate the sky from any place on Earth. Currently, two Aboriginal constellations are available: Boorong and Kamilaroi.
Figure 6.4 Some constellations of south-west Victoria

Constellations were important in early human migration and thereby helped shape the modern world. Today, astronomers and astrophysicists use advanced technology to make their observations. However, astronomy is a field of science in which you do not have to be a professional to take part. An Australian amateur astronomer, Thiam-Guan Tan, discovered from his backyard a distant planet orbiting a star 40 light years away from Earth. The planet is thought to be one of billions of other planets that are 'habitable' – in other words, able to support life.
geocentric a model of the universe with Earth at the centre retrograde motion apparent backwards motion of a planet as seen from Earth
heliocentric a model of the universe with the Sun at the centre
The early astronomers relied on the naked eye to make observations about the positions of celestial objects and how they moved over time.
Claudius Ptolemy was an astronomer in the second century who suggested that Earth was at the centre of the universe. He proposed a geocentric model in which all celestial objects orbited around Earth, shown in Figure 6.5. It is easy to see why he suggested this model, given that the Sun, stars and Moon all appear to rise in the east, follow a circular pattern while they are up, and then set in the west.
There was one main problem with Ptolemy's geocentric model. At different points in the year, the motion of the planets across the sky appear to go backwards for a few days. This is called retrograde motion and could not happen if the planets orbited Earth (Figure 6.6).
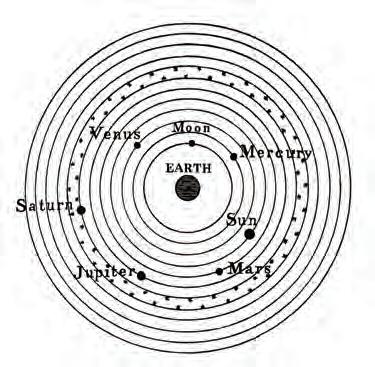
In the early 1500s, Nicolaus Copernicus proposed a heliocentric model of the solar system, in which the planets revolved around the Sun, shown in Figure 6.7. This could explain the retrograde motion of the planets.
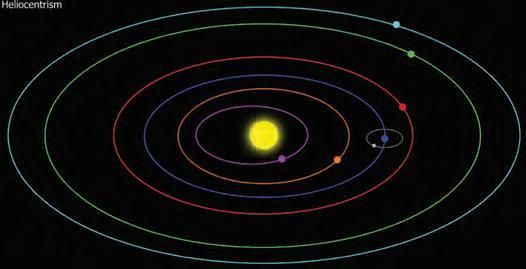
Figure 6.7 The heliocentric model proposes that planets revolve around the Sun, rather than around Earth.
With the invention of the telescope in the 1600s, Galileo Galilei was able to observe the four largest moons of Jupiter and could confirm that they were orbiting that planet.
Telescopes revolutionised the world of astronomy. They allow us to see the outer planets of the solar system, the moons of other planets, stars that are invisible to the naked eye and galaxies beyond our own Milky Way.
Quick check 6.1
1. Name the celestial object at the centre of a geocentric model.
2. Name the celestial object at the centre of a heliocentric model.
3. Explain the circular path of the Sun and stars across our sky each day.
4. Name the people known as the 'world's first astronomers'.
Modern-day astronomers have amazing technology to work with and use a variety of technologies to collect astronomical data, as shown in Table 6.1. These data are usually collected in the form of light. In physics, 'light' is used to mean electromagnetic radiation of all wavelengths, not only the visible light that is used in everyday language. The terms 'light', 'electromagnetic spectrum' and "electromagnetic radiation" are used interchangeably to mean all wavelengths, not only visible but also X-rays, radio waves and microwaves, for example.
Technology
Description
TelescopesObserve radiation across the electromagnetic spectrum – that is, all the wavelengths of light. Optical telescopes and radio telescopes are the most commonly used.
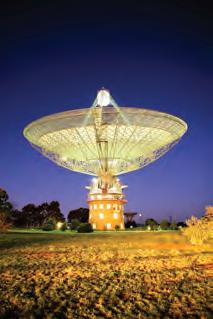
SpectroscopyMeasures the amount and distribution of light at different wavelengths. It provides information about the chemical composition and temperature of celestial objects.
PhotometryMeasures the brightness of celestial objects to study their physical properties, such as size and temperature, as well as their distance from Earth
Interferometry Creates high-resolution images using multiple telescopes to work together as a single larger telescope to observe the interference of light at the operating wavelength.
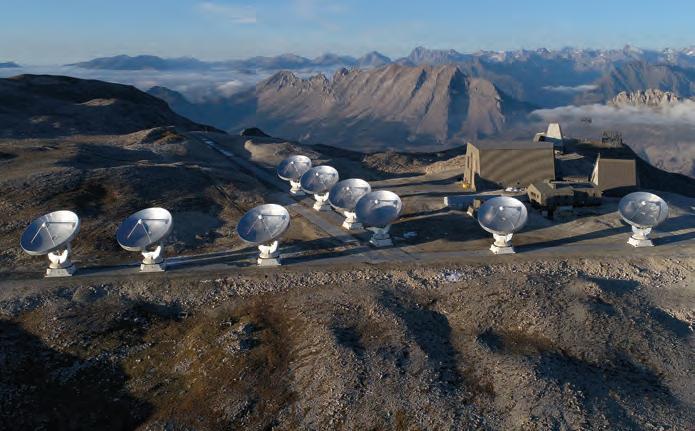
interferometry a technique that uses the interference of waves to measure distances
Technology
Space-based observatories
Description
Allow astronomers to clearly observe celestial objects without the distortion due to Earth's atmosphere
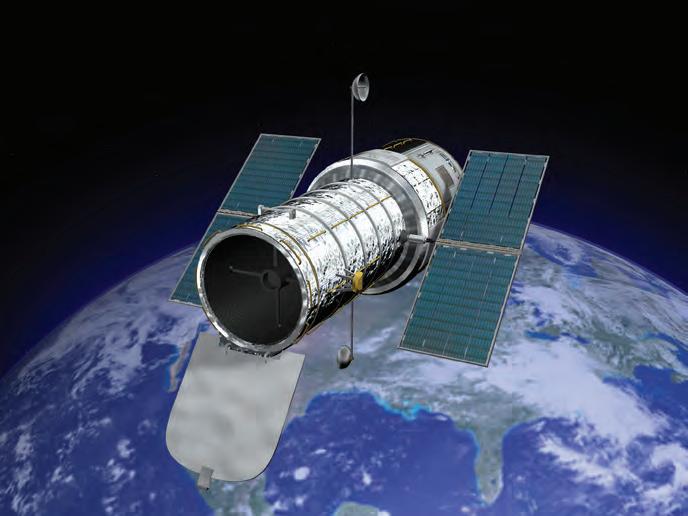
Figure 6.10 The Hubble Space Telescope is a space-based observatory that can take clear images of distant galaxies without the dimming effects of Earth's atmosphere.
Table 6.1 (continued)
Table 6.2 shows the data collected by these astronomical technologies.
Data
Description
Imaging data Provides information about appearance and position of celestial objects
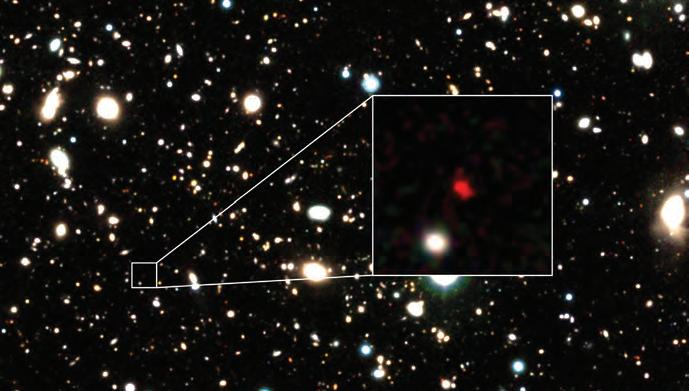
Figure 6.11 A three-colour image of HD1 galaxy, which is the red spot in the centre of the zoom box. In April 2022, HD1 was the most distant galaxy ever identified (at a distance of 13.5 billion light years). The image was created using data from four telescopes around the world.
Table 6.2 Types of astronomical data
continued …
Spectral data
Description
Provides information about the chemical composition and physical properties of celestial objects, such as temperature and density


Figure 6.12 This spectrum of Mars combines data measured by the James Webb Space Telescope NIRSpec instrument. NIRSpec stands for near-infrared spectrograph. Spectra like this are created when light is split apart, producing the signature wavelengths of water, carbon dioxide and carbon monoxide in Mars's atmosphere.
Photometric data Provides information about the brightness of celestial objects
Figure 6.13 A view of the Rosette Nebula seen with the Isaac Newton Telescope (INT) Photometric H-Alpha Survey (IPHAS). The red colour comes from hydrogen.
Polarimetric data Provides information about the polarisation of light from celestial objects. The polarisation can be used to study magnetic fields and the properties of dust and gas.
Figure 6.14 In 2022, astronomers measured and mapped polarised X-rays from the remains of an exploded star called Cassiopeia A using NASA's Imaging X-ray Polarimetry Explorer (IXPE).
Table 6.2 (continued)
continued …
Data
Astrometric data
Description
Provides information about the position and motion of celestial objects to determine their distances, motions and orbits
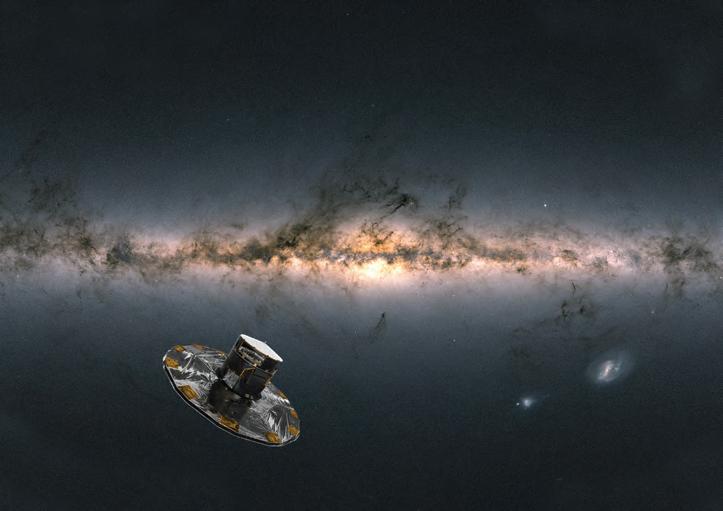
Modern telescopes have become larger and larger to allow us to see further into space. In 1995, the Hubble Space Telescope was pointed towards a region of space previously thought to be empty. The photo produced after two days showed multitudes of galaxies that had never been observed before. It further demonstrated the enormous size of the universe.
To minimise the effects of light pollution and completely eliminate the distorting effects of the atmosphere, the Hubble Space Telescope was launched beyond Earth's atmosphere into Earth's orbit and is controlled remotely from the ground. It has been instrumental in developing our understanding of the universe and the Big Bang.
The first telescopes were optical telescopes, which use lenses to collect visible light and focus it for the eye to see. The larger the diameter of the lens, the more light that can be collected and the further you can see. As telescopes got larger, the size of the glass lenses required reached the point where they became too heavy. Sir Isaac Newton first used polished mirrors instead of lenses to collect and focus light in 1668. The Very Large Telescope (VLT) array in Chile has mirrors 8.2 metres in diameter, and the Extremely Large Telescope (ELT) under construction in Chile will have a mirror 39.3 metres in diameter upon its completion in 2026. Optical telescopes are built in regions of low rainfall to avoid clouds and must be positioned far away from light pollution and at a high altitude to minimise the effects of the atmosphere. The best optical telescopes are located on high mountains in Chile and Hawaii.
Radio telescopes gather information in the form of radio waves. Radio telescopes follow the same principle as optical telescopes in that they collect signals and reflect them inwards to focus them, but the reflective surfaces do not need to be polished mirrors. This means that radio telescopes can be made much larger than optical telescopes. Multiple radio telescopes can also be linked together to look even further into space.
The Australian Square Kilometre Array Pathfinder (ASKAP) in Western Australia is a precursor radio telescope that was built to test the technology that will be used in the construction of the full Square Kilometre Array (SKA) Observatory in Australia and South Africa. Composed of 36 dishes and completed in 2012, ASKAP's purpose was to demonstrate the feasibility of the SKA Observatory project.
The SKA radio telescope is expected to be completed in Western Australia in 2028. It will be made up of thousands of dishes whose total collection area will be bigger than one square kilometre (or one million square metres). An artist's impression of the SKA Observatory is shown in Figure 6.18.
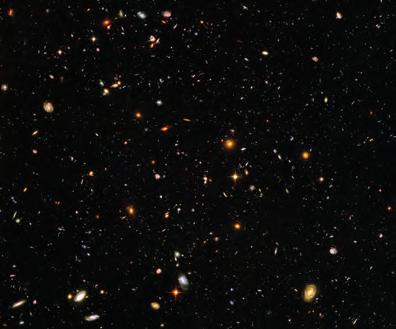
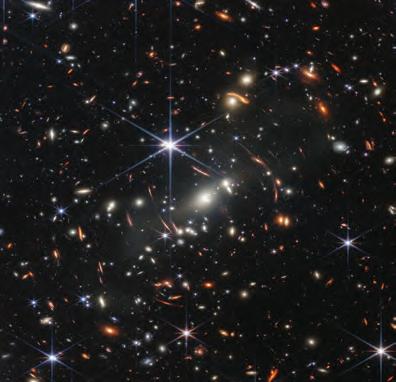
6.16 (a) A portion of the
over a period of months from 2003
More detailed than the original Deep Field image from 1995, the full image covers a tiny portion of the sky and yet shows approximately 10 000 galaxies, many of which contain billions of stars. (b) The new James Webb Space Telescope captured much greater detail again in 2022.
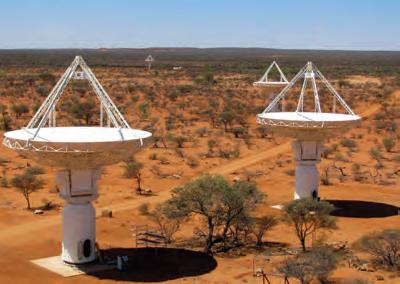
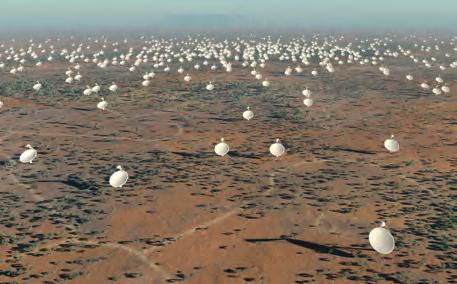

The Event Horizon Telescope (EHT) is an international collaboration of radio observatories. It captures images of black holes using very-long-baseline interferometry (VLBI) techniques. This allows the participating radio telescopes located around the world to work together as if they were a single telescope. This collective power allows the EHT to achieve a higher angular resolution, making it possible to observe black holes and their properties. Earth's atmosphere allows visible light and radio waves through; it blocks a large fraction of the other parts of the electromagnetic spectrum. The ability to place telescopes in space lets astronomers explore the universe by imaging other wavelengths, such as infrared, ultraviolet and gamma rays.
Quick check 6.2
1. Name the two main types of telescopes and recall which part of the electromagnetic spectrum they detect.
2. Recall where the best telescopes are located.
3. Explain why interferometry is so useful.
Science as a human endeavour 6.1
Professor Elaine Sadler is an Australian astrophysicist known for her work on the evolution of galaxies by analysing astronomical radio signals. She will lead the First Large Absorption Survey in HI (FLASH) project, which will use the ASKAP in Western Australia to study the amount of hydrogen in distant galaxies. This will provide information on how star formation has changed over cosmological time and the relationship between hydrogen gas and supermassive black hole formation.
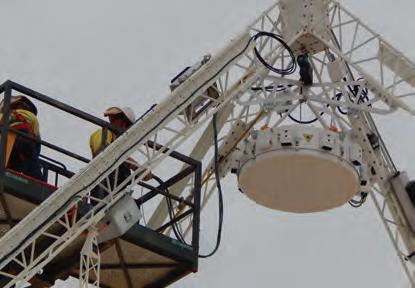
phased array receiver
Did you know? 6.2
The James Webb Space Telescope is the largest optical telescope humans have sent out into space. It can gather light that has been travelling for 13.5 billion years, almost since the beginning of the universe. It is essentially a time machine, allowing us to observe the first galaxies to form after the Big Bang and how they evolved. As it detects infrared light using a near-infrared camera (NIRCam), it can also see through dust clouds and view objects too old, distant or faint for the Hubble Space Telescope.

Figure 6.21 The James Webb Space Telescope has revealed details about the Tarantula Nebula. Young stars can be seen in pale blue at the centre of the image, while stars that are still developing are shown in red. NIRCam can detect these dust-enshrouded stars due to its resolution at near-infrared wavelengths.
Projecting across time: understanding the universe
Reach back in time. How has our understanding of the universe changed over the last 10 years? The last 100 years? The last 1000 years?
Reach forward in time. What do you think we will discover about the universe 10 years into the future? 100 years? 1000 years?
The Projecting across time thinking routine was developed by Project Zero, a research centre at the Harvard Graduate School of Education.
Remembering
1. Recall the reason that most observatories are located in remote areas and at high altitudes.
2. Name the data collection method where two or more telescopes are used together.
Understanding
3. Explain the advantages and disadvantages of having a telescope in space.
Applying
4. Illustrate a diagram to show the purpose of the large dish on the Parkes radio telescope.
Analysing
5. Contrast the geocentric and heliocentric models and explain why the motion of the planets as observed on Earth supports the heliocentric model.
Evaluating
6. Discuss the improvements in technology since the time of early astronomers, which have allowed us to look further and further into space.
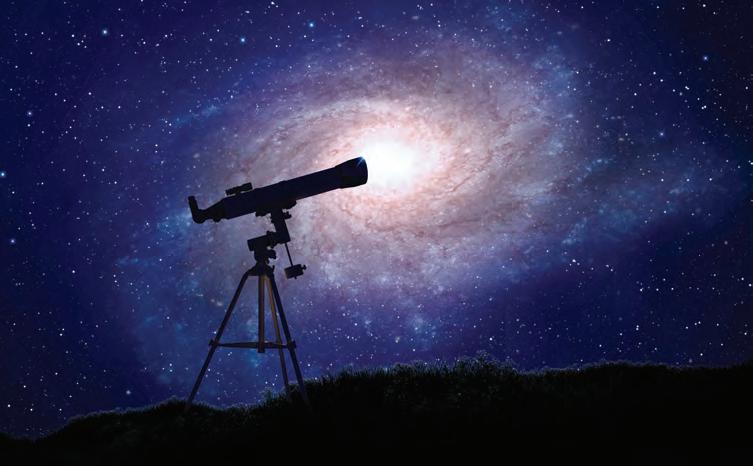
At the end of this section, I will be able to:
1. Describe how stars' light spectra and brightness are used to identify compositional elements of stars, their movements and their distances from Earth.
2. Compare and contrast the life cycles of small and large stars.
Think, puzzle, explore: Stars
Every night you can look up and see stars littering the sky. We experience our closest star, the Sun, providing warmth and light every day.
Write down the following:
What do you think you already know about stars?
What questions do you have about stars?
How might you explore your questions about stars?
The Think, puzzle, explore thinking routine was developed by Project Zero, a research centre at the Harvard Graduate School of Education.
With the exception of hydrogen, helium and a small amount of lithium produced during the Big Bang, everything that comprises us and Earth was formed within stars, either through ongoing fusion processes or during supernova explosions.
Many people will describe the Sun and other stars as big balls of burning gas. That is a rather oversimplified explanation of how they produce their energy. In reality, their energy comes from a process called nuclear fusion
Nuclear fusion occurs when two atoms combine (or fuse) to create a new element. Because it is so hot inside the cores of stars, hydrogen nuclei have enough energy to overcome the electrostatic repulsion between their protons. They fuse together to form helium, and an enormous amount of energy is released in the process.
Figure 6.22
One step in the fusion of hydrogen happens when the isotopes deuterium (one proton and one neutron) and tritium (one proton and two neutrons) fuse together. A neutron is released and a helium nucleus is formed (two protons and two neutrons).
When you look at stars in the night sky, you will notice that they vary in colour. The colour of a star is related to its temperature: blue stars are the hottest and red stars are the coolest. Stars are given a spectral class letter based on their temperature and colour (Table 6.3). They were originally classified alphabetically starting at A, but some letters were skipped and others reordered as more was discovered about star surface temperatures. Our Sun is a relatively small yellow star with a surface temperature of around 6000 kelvin (K), so it is classified as a G-type star.
a group into which stars are classified based on their spectra
B–V colour index
Most stars look white, but a few, such as Betelgeuse, seem to have a very slight reddish tinge. So how do we know what the colours of stars are? Astronomers measure the brightness of stars through different coloured filters. They subtract the amount of light that comes through a green filter (called the visual filter) from the amount of light that comes through a blue filter. This is called the B–V colour index. The lower (or more negative) the number, the bluer the star, and the higher (or more positive) the number, the redder the star. Rigel, a large blue star, has a B–V colour index of –0.03, for example. Betelgeuse, a large red star, has a B–V colour index of 1.85.
1. State the name of the process that occurs inside stars.
2. Recall what the colour of a star tells us.
3. State what colour a star would be with a temperature of 5500 K. Explore! 6.2
Aldebaran is the brightest star in the Taurus constellation. It is classified as an orange K-type star and has a surface temperature of around 4000 K. Research examples of stars that belong to each spectral class (O, B, A, F, G, K and M).
All stars emit a full range of wavelengths from the visible spectrum (colours). This means you would observe a complete rainbow if you were to split the star's light into different colours using a prism. The peak of a star's spectrum depends on its temperature. This peak wavelength is the one that the star emits most of and is the colour that we observe the star to be. You will notice that there are no green stars listed in the spectral class system. There are stars whose spectrum peaks are in the green part of the spectrum, but their total combination of colours emitted appears white to our eyes.
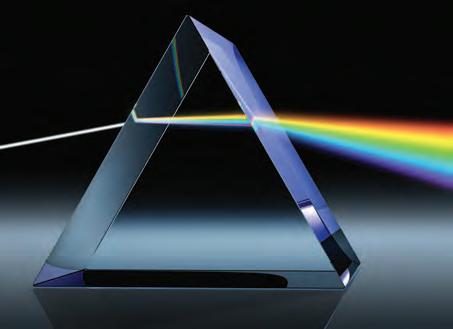
A continuous spectrum contains all the wavelengths and colours possible from the visible spectrum. When light passes through gas (like through an atmosphere), some of the wavelengths (colours) of light are absorbed and black lines will appear in the spectrum. This is called an absorption spectrum. We can compare that to light produced by the gas itself, which absorbs and emits light of a single wavelength. This produces an emission spectrum. Figure 6.24 shows the differences between these spectra. By examining the absorption spectrum of a star, we can determine its chemical composition. The atoms present in the outer atmosphere of a star will absorb certain wavelengths of light being emitted from the core of the star. Each element has its own unique absorption spectrum, much like a barcode. So, by studying which absorption lines are present in a star's spectrum, the elements present in that star can be identified.
continuous spectrum a continuous range of colours (wavelengths) absorption spectrum a spectrum showing dark lines representing specific wavelengths that have been absorbed by a substance emission spectrum a spectrum showing bright lines representing specific wavelengths that have been emitted by a substance


Flame tests and observing emission spectra
To investigate how emission spectra can be used to determine the metal in unknown substances
Materials


Be careful
• 1 mol L–1 solutions of copper chloride, potassium chloride, sodium chloride, lithium chloride and strontium chloride
Wear appropriate personal protective equipment, including safety glasses. Wash your hands after the practical.
• unknown solutions labelled A, B and C (A, B and C should each contain one of the known solutions above)
• wooden splints
• Bunsen burner
• bench mat
• matches
• emission spectrometer
Method
Part 1: Prepare the results table
1. Copy the results table into your science book.
Part 2: Test the known solutions
2. Set up the Bunsen burner with a bench mat and attach the Bunsen burner to the gas.
3. Light the Bunsen burner and adjust to a blue flame.
4. Dip the wooden splint into the first known solution and place the splint in the flame.
5. Observe the colour and record.
6. Dip the same splint into the same solution and have your partner observe the flame through the spectroscope.
7. Draw lines on the results table to match the spectral lines shown through the spectroscope. Take note of the very faint dark lines, the most notable being at wavelengths of 4.9 and 5.2 (in hundreds of nanometres).
8. Repeat steps 4–7 with the other known solutions.
Part 3: Test the unknown solutions
9. Repeat steps 4–7 and record the colour and emission spectra for the unknown solutions.
Results
Determine the metal present in the unknown solutions (labelled A, B and C) and record in the table by drawing lines that match the colours you see. The first row has been completed as an example.
Table showing absorption spectra for known and unknown solutions
Flame test
Solution
Known solution
Spectroscope
Colour in flame Colours (wavelength in hundreds of
Copper chloride Blue or bluish-green
Lithium chloride
Strontium chloride
Sodium chloride
Potassium chloride
Unknown solution
Discussion: Analysis
1. Determine the identity of the three unknown solutions. Justify your statements with data.
2. At which wavelengths would you observe dark lines in the Sun's spectrum? Research which elements are found in the Sun's atmosphere that coincide with spectral lines at those wavelengths.
Discussion: Evaluation
1. Suggest why spectra are referred to as 'fingerprints' of the stars. Explain how the data support the statement.
Conclusion
1. Make a claim about how emission spectra can be used to determine metals in unknown substances.
2. Support your statement using the data you gathered, and include potential sources of error.
3. Explain how the data support your statement.
In general, stars that are located far away are expected to appear less bright than those that are closer. However, if you were able to observe all stars from the same distance, they would not all appear equally bright. The brightness of a star depends on its luminosity, and stars that produce more light are considered to be more luminous. Luminosity is measured on a scale on which our Sun has a luminosity of 1. A star with a luminosity of 100 would be 100 times brighter than the Sun when observed from the same distance.
Stars do not have a limitless fuel source. Most stars produce light by converting hydrogen to helium, but all stars will eventually run out of nuclear fuel and will evolve. The changes that stars go through in their lifetime are predictable and depend on the size of the star.
Stars form inside clouds of dust and gas called nebulae. The dust and gas are pulled into a ball by gravity, with hydrogen gas continuing to accumulate over millions of years. The ball of hydrogen gas starts to spin faster and increase in temperature, forming a protostar. Once the protostar reaches 15 million degrees, nuclear fusion begins and it is considered a main sequence star. It will remain in the main sequence until it dies.
Stars spend most of their life in the main sequence. This is the stage in which they convert hydrogen into helium in their core via nuclear fusion, releasing massive amounts of heat and light. Main sequence stars are stable due to the outwards force generated from fusion being balanced by the inwards force of gravity. The balancing of these forces is called hydrostatic equilibrium and can be maintained for billions of years. Roughly 90% of known stars are in the main sequence. Our Sun is 4.6 billion years old and will spend another 5 billion years in the main sequence before it moves to the next stage of its life cycle.
A star is considered small if it is less than 10 times the mass of our Sun. As a small star's hydrogen is converted into helium, the helium builds up in the core of the star. Helium fusion begins, forming heavier elements such as carbon. This releases much more energy, causing the outer layers of the star to expand into a red giant. For our Sun, this size increase will begin in roughly five billion years, and the red giant will envelop the first four planets in our solar system (including Earth).
luminosity the intrinsic brightness of a celestial object nebula (plural: nebulae) a cloud of gas and dust in space main sequence the phase during which stars convert hydrogen into helium in their cores
red giant a very large, bright, cool star that has run out of hydrogen in its core planetary nebula a type of nebula that forms as a result of a red giant throwing off its outer layers white dwarf a small, dense, dim star that has lost its outer layers and is at the end of its lifetime
When a red giant runs out of fuel, its outer layers drift off in a planetary nebula and its core collapses into a white dwarf The white dwarf will slowly cool over time and eventually be no longer visible. A star at this stage is given the name black dwarf, but it is only theoretical because a black dwarf is expected to take longer to form than the current age of the universe!

supernova the explosion of a massive star neutron
a tiny, hot, dense star formed when a star explodes as a supernova; made only of neutrons


cycle of a star


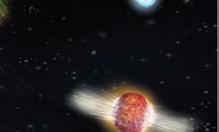


Stars that are more than 10 times the mass of our Sun take a different path. Due to their size, they will become red supergiants before undergoing a supernova explosion. In their core, the temperatures and pressures are so large that they can create elements as heavy as iron. Massive stars have a much shorter lifespan than smaller stars like our Sun. They may be anywhere up to 50 times as massive as our Sun but can be more than a million times brighter. This means that they are hotter and consume fuel much faster than smaller stars. Massive O-type stars may only live for a few million years because they consume their fuel so quickly, whereas the smaller K-type and M-type stars live for many billions of years.

When a supergiant runs out of fuel, it collapses under its own gravity and produces an enormous explosion called a supernova. All the elements heavier than iron, such as uranium and gold, are theorised to have been created during these spectacular explosions. Usually, if a star is less than 40 times the mass of our Sun, it leaves behind a neutron star, while the remnants of a star that has a mass greater than 40 times the mass of our Sun will be a black hole.
black hole the extremely dense remnant of a massive star; a region in space where gravity is so strong that nothing can escape, not even light galaxy a gravitationally bound system containing billions of stars and planets
If the mass of a star prior to the supernova explosion is great enough, the amount of gravity can be so enormous that the core of the remaining star collapses into a tiny amount of space. This is called a black hole. We cannot see black holes because they do not emit light, but we can observe them indirectly by the effects that they have on objects around them. Some black holes have a diameter of only a few kilometres but the mass of 10 000 Suns! There is a supermassive black hole at the centre of the Milky Way galaxy, and many observations made by astronomers indicate that most spiral galaxies have a black hole at their centre.
1. Recall which factor determines the path that a star takes through its lifetime.
2. List the order of phases that a Sun-like star will go through in its lifetime.
Black holes have captured the imagination of astronomy enthusiasts, science fiction writers and astrophysicists alike since their existence was hypothesised in the early 1900s. There are many theories surrounding black holes and how light and matter can interact with them.
1. Research the ideas behind spaghettification and worm holes, and summarise the main concepts in a few paragraphs.
2. Propose what it might look like to watch something travel into a black hole.
Data collected by the Event Horizon Telescope (EHT) in 2019 were used to create an image of a black hole. The black hole is in the centre of galaxy Messier 87, and a network of eight radio observatories on four continents collected data for 10 days to capture the image. Scientist Dr Katie Bouman developed an algorithm called CHIRP to process the enormous amount of data gathered by the EHT project.
The image is not a photograph. Instead, the algorithm created it using the data. The black hole itself can't be seen because light can't escape from it. The golden ring in the image is orbiting material just outside the event horizon, inside of which nothing, can escape the black hole's massive gravitational pull. Objects passing through the event horizon go through spaghettification.
The Laser Interferometer Gravitational-Wave Observatory (LIGO) is designed to directly detect gravitational waves. Gravitational waves are ripples in space–time (the 'fabric' of the universe) that are produced by extreme events, such as the collision of two black holes. LIGO uses laser interferometry to measure tiny distortions in space caused by passing gravitational waves.
The observatory consists of two facilities, located in Hanford, Washington, and Livingston, Louisiana, USA, which work in unison to detect gravitational waves from cosmic sources. LIGO's detection of gravitational waves in 2015 marked the beginning of the new field of gravitational-wave astronomy and created new opportunities for observing the universe.
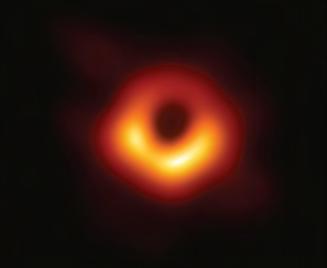
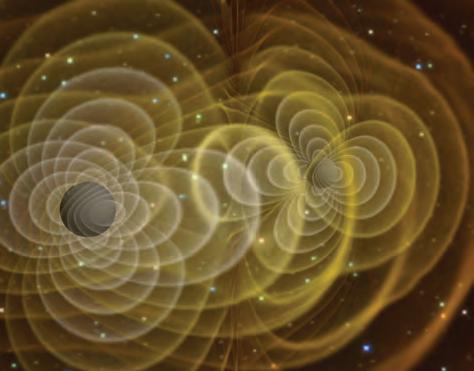
H–R diagram (Hertzsprung–Russell diagram) a graph in which star luminosity is plotted against spectral type/ temperature
A Hertzsprung–Russell or H–R diagram is a plot of star luminosity (energy output) against star temperature/colour. In Figure 6.30 you can see a diagonal band of coloured dots that represent stars in the main sequence. Red giants, supergiants and white dwarfs have their own sections on the H–R diagram.
Remember, the luminosity scale gives us an idea of how bright a star is compared to our Sun. Stars with a luminosity of 1 are as bright as our Sun.
Section 6.2
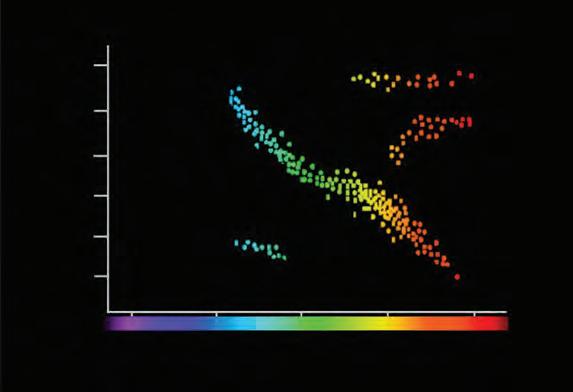
Go online to access the interactive section review and more!
Remembering
1. Recall the temperature and luminosity of our Sun. Understanding
2. Describe the process by which a star forms.
3. Explain the two factors that determine how bright a star appears from Earth. Applying
4. Create a summary of the observable features of stars and how they relate to each other.
Analysing
5. Copy and use the H–R diagram below to plot the following stars on it. Examine the graph to answer the following questions.
a) State which of the stars you have plotted is a red supergiant.
b) State which of the stars you have plotted is most like our Sun.
c) State the colour of Canopus and explain how you know.
d) State how many time brighter Sirius is than the Sun.
e) Predict whether Rigel's lifetime will be longer or shorter than the Sun's. Explain your answer.
Evaluating
6. Propose a reason why nobody has ever seen a black hole. How do we know that they are there?
At the end of this section, I will be able to:
1. Describe the major components of the universe.
2. Describe how distances are measured in space.
All the individual stars that you can see in the night sky with the naked eye are within the Milky Way galaxy. It can be difficult to imagine the immense distances in space unless there is some perspective. Our closest star is the Sun and it takes 500 seconds (about eight minutes) for light to travel from the Sun to Earth (a distance of 150 000 000 km). The closest star to our solar system is Alpha Centauri. Light takes 4.4 years to travel from Alpha Centauri to Earth. Our solar system is positioned on an outer arm of the Milky Way and it takes light 106 000 years to travel across the galaxy. Our closest galaxy is the Andromeda galaxy, and it takes light 2.5 million years to travel to Earth from Andromeda. There are over two trillion galaxies in the observable universe (that is, the part of the universe we can see). In 1936, the astronomer Edwin Hubble classified the Local Group as a group of 12 galaxies, which includes the Milky Way and the Andromeda Galaxy. Since then, as we've learned more, the Local Group has grown to 36 galaxies.
Making thinking visible 6.3
See, think, wonder: Eagle nebula
Figure 6.32 shows star-forming pillars called the Pillars of Creation, which can be found inside the Eagle Nebula. The image is composed of 32 different images from four separate cameras. The missing part at the top right is because one of the four cameras has a magnified view of its portion so the images from this camera were scaled down to match those from the other three cameras.
The photograph was made with light emitted by different elements in the cloud, which appear as different colours in the composite image: green for hydrogen, red for sulfur and blue for oxygen.
1. Can you describe what is visible in the photo?
2. What thoughts come to your mind when you observe it?
3. Are there any questions that arise from your observations?
The See, think, wonder thinking routine was developed by Project Zero, a research centre at the Harvard Graduate School of Education.
Galaxies are classified by their shape according to the Hubble galaxy classification scheme. Galaxies can be classified as elliptical, lenticular, spiral or irregular.
Quick check 6.5
1. Classify the following galaxies using Hubble's classification scheme.


Astronomers now have so many photos of galaxies that they simply do not have the time to classify them all. A group of astronomers has set up a crowd-sourced astronomy project called Galaxy Zoo that allows anyone to take part in some real science. You can try this too.
Search for Zooniverse Galaxy Zoo on the internet and you can have a go at classifying galaxies for yourself. You will be shown a galaxy and asked a series of questions about what you can see and the shape of the galaxy. Do not be afraid that you will get it wrong – the galaxies are shown about 30 different times to make sure that the responses are consistent.
Light travels at a speed of 300 million metres every second, or 3 × 10⁸ m s−1. A light year is a unit of distance equivalent to how far light travels in a year, which is equal to 9.46 trillion kilometres.
Use your microwave to calculate the speed of light!
1. Open your microwave and remove the rotating platform.
2. Line a dinner plate with cheese singles and place it in the microwave.
3. Turn on the microwave for about 10 seconds or until small hotspots start to form on the layer of cheese.
4. Take the plate out of the microwave and measure the distance between two of the hotspots. This value will be half of the wavelength of the microwave radiation.
5. Locate the frequency of your microwave in hertz (Hz), which should be listed inside the door.
Be careful Handle with care as cheese may be extremely hot.
6. Use the formula v = f λ, where v is the speed in m s−1, f is the frequency in hertz and λ is the wavelength in metres, to calculate the speed of light (remember to multiply your hotspot measurement by two to get the wavelength). Compare it to the actual value.
the effect by which the position of an object seems to change when it is observed from different locations astronomical unit (AU) the distance between Earth and the Sun baseline a line between the two viewpoints used to calculate parallax angle (1 AU is the baseline used for calculating star parallax)
One method of measuring distances in space is using parallax. If you hold your index finger in front of you at arm's length and close one eye, then swap eyes and close the other one, your finger will appear to move because you are essentially observing your finger from a different location. The same thing happens when we look at the stars in the night sky from a different position in space. As Earth travels around the Sun, our position in space changes and we see the stars arranged slightly differently. We can measure the angle between the apparent location of a nearby star and a 'fixed' distant star. This is called the parallax angle. Using the distance between Earth and the Sun (the astronomical unit or AU) as the baseline and some trigonometry, we can work out how far the star is from Earth.
parsec the distance at which a star appears to move one arcsecond in six months (equal to 3.26 light years or 30 trillion km)
arcsecond
1/3600th of a degree
This technique enables us to measure distant stars in parsecs (pc): one parsec is equal to 3.26 light years or 30 trillion kilometres. A star that is one parsec away will have a parallax angle of one arcsecond, which is one 3600th of a degree (there are 60 arcminutes in one degree and 60 arcseconds in one arcminute).
Using parsecs to measure distance makes it easier to calculate distances with the following formula:
The further away a star is, the less it appears to move due to parallax, and the smaller the parallax angle becomes. This gives a limit to the distance that we can measure using the parallax method, because when stars are too far away, their parallax angle is too small to measure. The limit to which we can use parallax is around 100 parsecs.
Quick check 6.6
1. State whether a light year measures time or distance.
2. State the outer limit to which star distance can be measured using the parallax method.
3. State whether a closer star will have a larger or smaller parallax angle. distance to star (in pc) = 1 parallax angle (in arcseconds)
Aim
To investigate the use of parallax angles to reliably calculate distance
Materials
• an 'object' (something that can be placed in the middle of the school oval and be visible from the perimeter)
Method
• rulers × 2
• large protractor
• trundle wheel
1. Copy the results table into your science book. You will be collating your results with the class to analyse the reliability of this method.
2. Your teacher will place an object in the middle of the school oval (the whole class will determine the distance to this one object).
3. Find a location near the perimeter of the oval where the object lines up with a distant landmark – for example, a tree, the edge of a fence, a gate, the edge of a building or a flagpole.
4. At this location, use the two rulers and protractor to make a right angle, angle (A), perpendicular to the line going through the object and the landmark, as shown in the diagram.
5. Measure out a 5-metre line along this perpendicular direction (this will be your baseline).
6. At the end of the 5-metre line, use the two rulers and protractor to measure angle (B) (between the baseline and the ruler directed towards the object). (You may have to lie on your stomach to line up the objects by sight.)
Results
1. Calculate the parallax angle (P) by subtracting the angle (B) from 90°.
2. Use trigonometry D = 5 tan(P) to calculate the distance (D) to the object.
3. Use the trundle wheel to measure the actual distance to the object.
4. Calculate the relative error.
5. Combine data on a class board or spreadsheet.
Table showing class results of calculated versus measured distance to object
Baseline distance (m) Angle B (°) Angle P = 90 − angle B (°) Calculated distance to the object (m)
Group 15
Group 25
Group 35
Group 45
Group 55
Group 65
Mean5
Discussion: Analysis
(m)
1. Describe the relationship between the parallax angle and the calculated distance.
Discussion: Evaluation
1. Describe the amount of relative error for your own calculations and the mean relative error for the class group.
2. Instrument error is one factor that could affect the precision of the experiment. Were other factors that could affect the validity of the results successfully controlled during the experiment? Justify your reasoning.
3. Suggest any other changes that could be made to the method to improve the validity of the results in future experiments.
Conclusion
1. Make a claim about the reliability of using parallax angles to calculate distance.
2. Support your statement using the data you gathered, and include potential sources of error.
3. Explain how the data support your statement.
The Doppler effect
Doppler effect a change in the wavelength of sound or light waves emitted from an object when it moves towards or away from an observer
When you hear an ambulance travelling past you, the pitch of the siren changes as it passes. When the ambulance is travelling towards you, the sound wave is squashed together, which results in a shorter wavelength. You hear it as a higher pitch. When the ambulance is travelling away from you, the sound wave is stretched, which results in a longer wavelength. You hear it as a lower pitch. This phenomenon is called the Doppler effect
Doppler effect


Figure 6.36 Sound waves are squashed together as the ambulance travels into them, so we hear a higher pitch as the ambulance drives towards us. Sound waves are spread out as the ambulance moves away from them, so we hear a lower pitch as the ambulance drives away.
The same phenomenon happens with light waves if an object is travelling fast enough. When the object is travelling towards you, the light it emits has a shorter wavelength, which is described as being blue-shifted. When the object is travelling away from you, the light it emits has a longer wavelength, which is described as red-shifted. One misconception is that blue shift and red shift cause objects to appear more blue or red, which is not the case. Since early telescopes used visible light only, historically, visible light that was shifted to a longer wavelength was said to be 'red-shifted' because red light has the longest wavelength of the visible spectrum.
However, now with use of all wavelengths of the electromagnetic spectrum in astronomy, if the wavelength becomes longer the light is said to be 'red-shifted' or that there has been a 'red shift'. This simply indicates that the wavelength has become longer.
When astronomers look at spectra from distant galaxies, they find that the emission lines are almost always shifted towards the red part of the spectrum. This tells us that most galaxies in the universe are moving away from us and the universe is expanding.
Our Earth is not going to be around forever. It may become uninhabitable because of human activity, it may get enveloped by our Sun expanding into a red giant in five billion years, or it may be destroyed by a giant meteor or nearby supernova. For humanity to get the chance to leave Earth to look for somewhere else to live, we will need to find a way to travel large distances and leave our solar system.
Interstellar travel (travelling outside our solar system) throws up quite a few problems. These problems relate to the vast distances that we would need to travel to find and inhabit a new planet. Light takes just over four years to reach the closest star to our solar system, Alpha Centauri. We cannot travel even remotely near the speed of light with current technology. Even if we develop such technology in the future, travelling close to the speed of light has its own problems: it would require an enormous amount of energy to accelerate a conventional spaceship leaving Earth to 99% of the speed of light, and an equally enormous amount of energy to decelerate at journey's end.
blue shift when a spectrum has shifted towards shorter wavelengths red shift when a spectrum has shifted towards longer wavelengths
moving away from us
towards blue if it is moving towards us.
Finding exoplanets, planets that orbit other stars, is a lot harder than you might imagine. We can easily observe stars because they emit their own light. Planets only reflect light from the star they orbit, so are many orders of magnitude dimmer than a star. We cannot see the light from most planets outside our solar system because we are just too far away from them, so the only way we can tell that they are there is indirectly, such as when they pass in front of their own star and block out a tiny portion of its light (like a partial eclipse).
Despite this difficulty, astronomers have found over 5000 exoplanets! The problem we then encounter is finding out whether humans could live on these planets. A liveable planet would need to be made of rock (so that we can land on it) and have an atmosphere so we do not die from the radiation in space (but not so thick that the greenhouse effect makes it unbearably hot). The planet would need to be in what is called the Goldilocks zone: not too hot and not too cold.
Out of all the exoplanets that have been discovered, only a small number could potentially be habitable; however, astronomers have predicted that there might be more than 10 billion exoplanets orbiting Sun-like stars just in our own galaxy.
Hot Jupiters are a class of exoplanets that are similar in size and composition to Jupiter, the largest planet in our solar system, but have orbits that bring them very close to their host stars. As a result, they have extremely high temperatures, sometimes even higher than 700°C. Their short orbital periods make them easy to detect using current exoplanet detection methods.
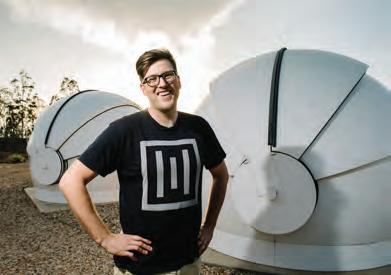
In 2023, Dr Jake Clark, an astrophysicist from the University of Southern Queensland in Toowoomba, discovered a hot Jupiter exoplanet, which was named TOI-778 b.
The exoplanet experiences a very short year, orbiting its dwarf star sun in less than a week.
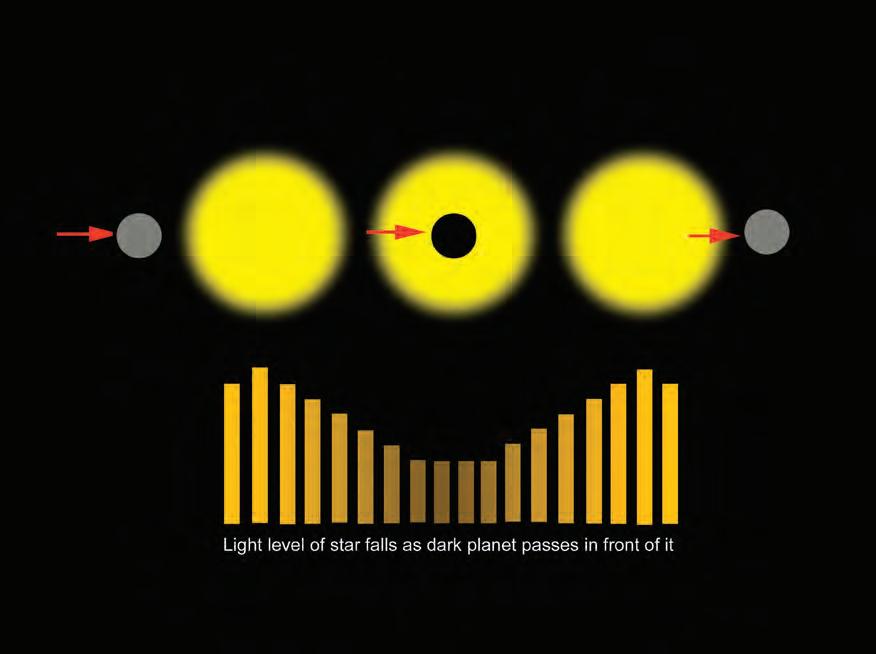
use transit photometry to detect exoplanets.
Given the immensely large distances to these potentially habitable planets, the only way to explore them may be to send out one-way space missions. With current technology, spacecraft need fuel to travel.
To be able to accelerate very quickly, you need to take more fuel, but extra fuel makes the spacecraft heavier, decreasing the acceleration. Even if in the future we discover a way to travel large distances without carrying fuel, the journey to other star systems will still probably be much longer than a human lifetime. There are a few solutions to this problem. One might be to send a population of humans, including several generations, on huge spacecraft to explore the stars. These explorers would have to deal with things like a changed physiology due to living in space. Another solution might be to send people away in suspended animation and wake them up when they get to their destination. A third solution might be to not send humans at all and instead send advanced robots or androids. It is not just a world of opportunities, but a universe of possibilities that awaits us!
Try this 6.4
Australian astrophysicists
Research the following Australian astrophysicists and their contributions to international astronomy:
• Dr Abigail Allwood
• Professor Lisa Kewley
• Kirsten Banks
• Professor Brian Schmidt
• Professor Tamara Davis
• Dr Jessie Christiansen.
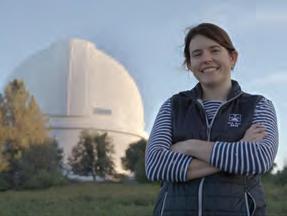
Section 6.3 questions
Remembering
1. Define a light year.
2. Recall the units used to measure parallax angle and star distance (for stars less than 100 light years away).
Understanding
3. Explain why an ambulance siren changes to a slightly lower pitch as it drives past you.
4. Describe what is meant by the term 'Goldilocks zone'. How does it apply to humans being able to live outside our solar system?
5. Explain how astronomers determined that the majority of galaxies we can observe are travelling away from us.
Applying
6. An astronomer collects data from a star in January and then again in July and finds that its parallax angle is 0.8 arcseconds. Calculate the distance to the star. Express your answer in parsecs and light years.
Analysing
7. Contrast red shift and blue shift.
Evaluating
8. Evaluate the potential of humans finding a way to leave our solar system.
At the end of this section, I will be able to:
1. Describe the major changes in the universe that have occurred since the Big Bang.
2. Describe the evidence that provides support for the acceptance of the Big Bang theory.
The Big Bang is a theory that most people have probably heard of and accept as the explanation of how the universe began. But how do we know what happened such a long time ago, and what evidence have astronomers discovered to support it?
The Big Bang theory suggests that the universe began as a very uniform, hot, dense state which expanded rapidly 13.7 billion years ago. The observable universe that we can see today was compacted into a very small singularity. Three main pieces of evidence support the Big Bang theory:
• Almost all galaxies are red-shifted, which means that they are travelling away from us. This suggests that the universe is expanding and, if you extrapolate backwards in time, the universe had a beginning.
• The abundance of smaller elements in the universe is consistent with them being created in a Big Bang and not inside stars through nuclear fusion.
• Radiation left over from the early universe, called cosmic microwave background, is the same in every direction and consistent with the rate of cooling calculated from a Big Bang explosion.


First stars

Now
13700000 000 years after the Big Bang
400000 000 years after the Big Bang

The dark ages
Formation of the solar system
8700000 000 years after the Big Bang


First galaxies
1000000 000 years after the Big Bang
Cosmic microwave background


400 000 years after the Big Bang The Big Bang Inflation

The Big Bang theory suggests that the initial state of the universe was a very hot and very dense plasma, a boiling soup of fundamental particles and forces, that extended uniformly in all directions, perhaps infinitely. From this state, 13.7 billion years ago the universe expanded everywhere in a big explosion that stretched everything apart. The entire observable universe that we see today was compressed into a tiny region called a singularity. In the first stage of the universe's existence, atoms could not yet exist because of the extreme density and temperature of the young universe.
As the universe expanded, it became less dense and cooled to a point at which the fundamental particles and forces of nature became distinct. Around three seconds after the Big Bang, protons and neutrons combined to form the nuclei of the lightest elements: hydrogen and helium. The electrons still remained free in the plasma. During this phase, all the photons emitted in the beginning were scattered by the sea of electrons and so the universe was opaque. Atoms were formed 380 000 years later, when the temperature finally cooled enough for atomic nuclei to capture electrons. This period of time is called the epoch of recombination. With the electron fog cleared, photons were no longer scattered and were free to travel the universe, which became transparent. These photons, the afterglow of the Big Bang, can be observed today as the cosmic microwave background radiation.
Radiation is the name that we give to all frequencies of the electromagnetic spectrum, including gamma rays, X-rays, microwaves, ultraviolet waves, visible spectrum light, infrared waves and radio waves. Radiation was emitted from the Big Bang, and we can still observe that radiation today. It exists in the form of very low-frequency waves in the microwave part of the spectrum and was discovered by accident in the 1960s. Two radio astronomers noticed a subtle continuous buzzing that came from the skies and initially thought that it was some type of interference coming from their antenna. They soon realised they were detecting the cosmic microwave background.
The cosmic microwave background is considered the most ancient view of the universe because it dates to around 380 000 years after the Big Bang, when the universe had cooled enough for photons to escape the plasma and travel freely. This radiation has been travelling through space ever since and constitutes the oldest radiation we can observe. It provides us with a snapshot of the early universe, including its temperature, density and small fluctuations that eventually led to the formation of galaxies and large-scale structures.
If you threw a tennis ball in space it would continue in its motion in a straight line according to Newton's first law. In a similar way, when photons are emitted in space they will keep moving until they hit something. Because it takes light time to travel, when we look at the light from the nearest star cluster, Alpha Centauri, it has taken 4.4 years to travel to Earth, so we are looking at it as it was 4.4 years ago. When we observe the cosmic microwave background, we are looking back in time to the earliest observable radiation in the universe. These photons have been travelling towards Earth for 13.7 billion years!
Did you know? 6.3
The photons emitted in the early stages of the universe are red-shifted. This has resulted in the light becoming less intense and less visible to our instruments.
In the early universe, the expansion was much faster than it is today, causing the light from early photons to be red-shifted even further. The light from the early universe has also been absorbed and scattered by clouds of gas and dust, making it even more difficult to detect.
Quick check 6.7
1. Explain why we cannot see photons emitted in the earliest stages of the universe.
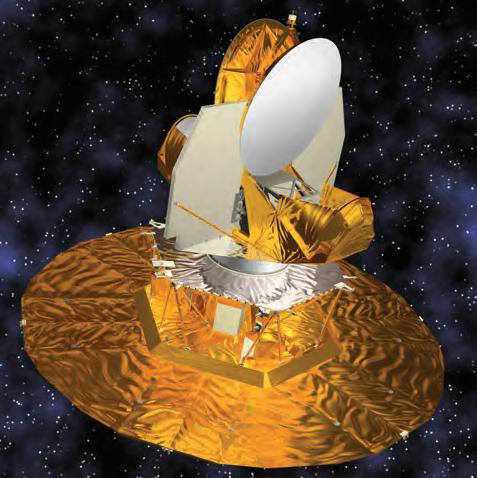


In the first few minutes after the Big Bang, the universe was composed of a hot, dense plasma of hydrogen and helium. As the universe expanded and cooled, matter began to come together through gravitational attraction to form larger structures such as gas and dust clouds. Within these clouds, the density and temperature increased, leading to nuclear fusion and the formation of stars.
Over time, stars produced elements heavier than helium in their cores, which then formed into planets, asteroids and other objects when these stars exploded as supernovas or shed their outer layers as planetary nebulae. The Sun has been found to contain a number of these heavier elements, so it is thought that it and the planets of the solar system formed from a nearby supernova that exploded in the early stage of the universe. Because the Sun formed from the remains of an earlier star, it is called a secondary star. Large collections of stars in the early universe clustered together to form galaxies. These galaxies have continued to move apart as the universe expands.
One of the great mysteries that astronomers are currently working on is finding out about dark matter and dark energy.
Gravity is a property of mass, or matter. All objects have gravity, and the more mass, the more gravity. Astronomers have measured the amount of gravity in the universe indirectly; that is, they can measure it by observing the effects that it has on things around it. They have found that there is more gravity in the universe than the amount that can be attributed to visible matter. Astronomers theorised that there must be some other type of matter causing this extra gravity, calling it dark matter. In 1965, Vera Rubin hypothesised that dark matter existed when she observed a difference in the predicted and observed motion of galaxies. She concluded that invisible gravity sources were pulling planets and stars in certain directions.
Try this 6.5
Animating the Big Bang
Use animation or comic strip software to create an explanation of the Big Bang for other year 10 students.
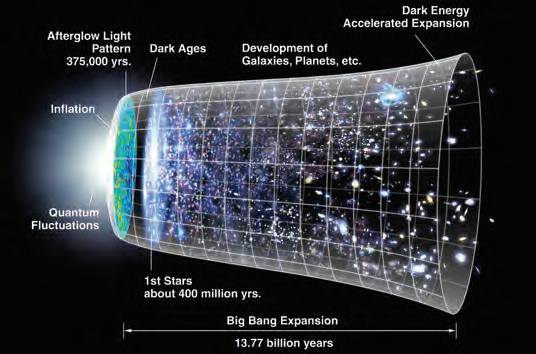
Explore! 6.4
validating the existence of dark matter
Vera Rubin's discovery of the existence of dark matter was validated through multiple lines of evidence. Research how the following pieces of evidence helped to support the existence of dark matter:
• rotation curves
• gravitational lensing
• cosmic microwave background radiation
• numerical simulations.

We know that the universe is expanding because light from other galaxies is red-shifted. But galaxies are not just moving away from all other galaxies; they are doing so at an accelerating rate. It seems that there is some sort of unobservable pressure that is making the universe expansion rate accelerate. This unknown pressure has been termed dark energy. It is amazing to think that in the future, the universe may have expanded so vastly that all other galaxies will be outside our observable universe, so we will not actually be able to see anything beyond our own galaxy!
Explore! 6.5
The search for extraterrestrial intelligence
Given the immense size of the universe, it seems likely that life has also arisen in other places in the universe. The SETI program (Search for Extraterrestrial Intelligence) was developed to monitor radio waves from space to potentially find other intelligent life in our galaxy.
1. Research SETI and describe the projects currently under way.
2. Describe the type of data that are collected and explain what we can learn from them.
3. If you are interested, join SETI@home and let your computer download and analyse data to contribute to the SETI program.
recessional velocity the rate at which a galaxy is moving away from Earth Hubble's law the farther away a galaxy is from Earth, the faster it is moving away from us
Science as a human endeavour 6.5
The observable universe refers to the part of the universe that can be observed through telescopes and other technology, given the speed of light and the age of the universe.
Currently, it has an estimated diameter of about 93 billion light years and contains approximately two trillion galaxies, each containing billions of stars and other celestial objects. It also contains larger structures such as galaxy clusters and cosmic microwave background.
The observable universe is limited by the horizon, which is the maximum distance that light has had time to reach us since the Big Bang. Beyond the horizon, the universe is thought to continue, but it cannot be observed directly.

A
the observable universe. From
to
the known celestial bodies are arranged according to their proximity to Earth. In the far right, cosmic microwave background radiation is present, as the furthest and oldest thing we can see.
Edwin Hubble discovered that other galaxies exist in the 1920s by observing that many 'clouds' of dust and gas were actually extremely distant collections of stars. He noticed that these distant galaxies were different sizes and concluded that the smaller ones must be further away. While this assumes that all galaxies are the same size, which they are not, it is nevertheless a pretty good approximation at these distances.
Hubble calculated the recessional velocity of the galaxies (that is, the speed that they are travelling away from us) by recording the red shift of their spectra. The longer the wavelength of the spectral lines, that is, the more red-shifted they are, the faster the galaxy is moving. Hubble found that the further a galaxy is from us, the faster it is travelling away from us, so he proposed a relationship between distance and recessional velocity. This relationship is called Hubble's law and is given by the formula:
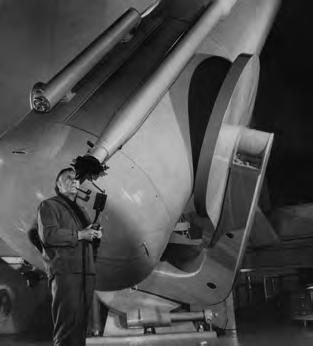
where v is the recessional velocity, D is the distance from Earth and H0 is a constant that we call Hubble's constant. Hubble's original measurement of H0 was 500 kilometres per second per megaparsec (abbreviated as km/s/Mpc or more formally as km s−1 Mpc−1), or 160 km s−1/million-light-years. However, over time, the constant has been measured more and more accurately, and the current value is 73.8 km s−1 Mpc−1.
Hubble's law demonstrates two points:
• The universe is expanding everywhere and in all directions.
• The expansion of the universe given by the Hubble constant can be traced backwards to D = 0 to find the age of the universe.
A few misconceptions arise about the Big Bang – partly because of the name 'Big Bang' and partly because it is just a difficult concept to comprehend.
One slightly misleading concept is the idea of the singularity that existed before the Big Bang. 'Singularity' might sound like it means that the whole universe was located at a single point, and that the expanding universe has an edge. In fact, the universe extends beyond our observable region, perhaps forever and with no edge. In the past, everything was so compressed that our observable region was effectively a point compared to today, and this is what we call the singularity. Essentially, the Big Bang did not happen in a specific place, it happened everywhere. A more accurate description would be to call it the 'big stretch'.
What happened before the Big Bang is a common question, but the answer remains a mystery. It's not clear whether the concepts of time and distance even make sense in the uniform plasma before the expansion. It's sometimes said that time and space were created in the Big Bang, and the theory can only scientifically answer questions up to that point.
Making thinking visible 6.4
The complexity scale: The Big Bang
1. Write down any information you have about the Big Bang, including facts, observations and ideas.
2. Place each statement on the complexity scale, which ranges from simple to complex.
3. Provide an explanation for why you chose to place each statement where you did on the complexity scale.
4. Reflect on the exercise and consider what new insights and questions you have gained about the Big Bang.
Education.
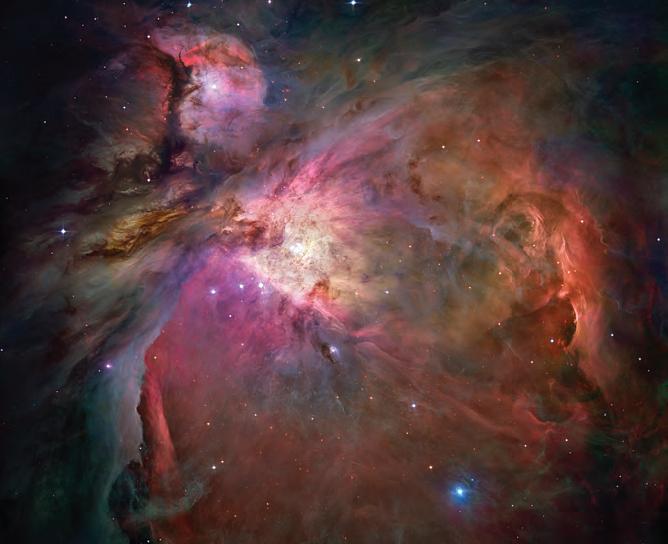
Aim
To model the expanding universe with a balloon and evaluate the limitations of the model
Materials
• balloon
• small dot stickers
• permanent marker
• piece of string around 40 cm long
Method
Part 1: Prepare the results table
• ruler
• paperclip
• stopwatch
1. Draw the table shown in the results section into your science book.
Part 2: Set up the model
2. Partially inflate the balloon to about 10 cm in diameter and secure the end with a paperclip (do not tie the balloon as you will need to further inflate it later).
3. Stick six dots on the balloon at random points and label one H (for home) and the others A, B, C, D and E. The home dot represents the Milky Way and the other dots represent neighbouring galaxies. You may add more than five neighbouring galaxy dots if you like.
Part 3: Measure the variables
4. Use the string and ruler to measure the distances HA, HB, HC, HD and HE. Record them in the results table under D1
5. Remove the paperclip, then fully inflate the balloon, timing how long it takes you to do this with the stopwatch. Tie the balloon off.
6. Measure the five distances again and record them in the results table under D2
Results
Table showing distances between home and neighbouring galaxies
Position on balloon
1. Calculate the mean speed that each dot was moving away from the home dot in the time (t) it took you to blow up the balloon, using mean speed = (D 2 D1 ) t .
2. Draw a scatter plot to analyse the relationship between mean speed (on the y-axis) and the D2 (on the x-axis).
3. Add a line of best fit to the graph if possible. Note the type of line that fits best to reflect the relationship between the two variables.
Discussion: Analysis
1. Describe the trend or pattern that was found when the line of best fit was applied to the graph. What type of relationship was found?
2. Suggest how you apply this relationship to understanding the movement of galaxies and expansion of the universe.
1. Predict the misconception that might arise if you drew the galaxies on with the marker rather than using stickers.
2. Evaluate the limitations of using a balloon as a model for 3D space, and suggest a better model.
3. Can a valid conclusion regarding the expansion of the universe be drawn from modelled experiments such as this one? Support your statement using data and limitations of the model.
4. Suggest any changes that could be made to the method to improve the quality of the data in future experiments. Justify your suggestions by explaining how each change will improve the reliability or validity of the data.
1. Make a claim about modelling the expanding universe with your balloon.
2. Support your statement using the data you gathered, and include potential sources of error.
3. Explain how the data support your statement.
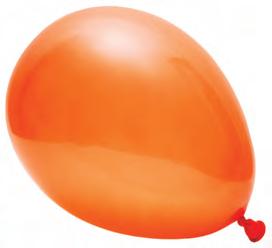
assign tasks and track results
Remembering
1. Recall the age of the universe.
2. State the assumption that Hubble made about galaxies and what he concluded about galaxies that appeared smaller than others.
Understanding
3. Explain the concept of the observable universe.
Applying
4. An astronomer observed a distant galaxy to be travelling at a recessional velocity of 370 km s−1. Use the current value of Hubble's constant (73.8 km s−1 Mpc−1) to calculate its distance from us. Give your answer in both megaparsecs and light years.
5. Create a drawing with labels to demonstrate the enormous size of the universe.
Analysing
6. Organise the following parts of the electromagnetic spectrum from lowest frequency to highest: infrared, gamma, radio, X-ray, microwave, visible, ultraviolet.
Evaluating
7. Discuss the name 'Big Bang' and explain why it might not be accurate to describe the theory.
At the end of this section, I will be able to:
1. Name key dates and events in the history of human space exploration.
2. Describe how the principles of rocket propulsion allow the force of gravity to be overcome.
3. Explain how technology has addressed physical and physiological challenges and enabled us to live beyond Earth's atmosphere.
The exploration of space represents one of the most remarkable scientific endeavours humans have made. Through international collaboration, technological advances and innate curiosity, humanity has embarked on a journey to expand our understanding of the origins and structure of the universe. From the Apollo moon landings and the International Space Station (ISS) to the rise of private companies and space tourism, humans continue to overcome the challenges associated with travelling, and surviving, in space.
katherine Bennell-Pegg
When asked in high school to write down three different career options, Katherine BennellPegg recorded only one: astronaut.
She then went on to study a Bachelor of Engineering (Aeronautical engineering) at the University of Sydney, before an impressive career spanning projects on human spaceflight and technologies, debris removal concepts and space exploration missions. As the Director of Space Technology at the Australian Space Agency (established in 2018), she completed basic astronaut training in Germany in July 2024 – the first person to train under the Australian flag and Australia’s first female astronaut. Her training included robotic arm simulations, human centrifuge and diving in a neutral-buoyancy facility to practise spacewalking, in addition to medical training and learning foreign languages. Katherine is now qualified for long-duration missions to the International Space Station.


2020
2012


NASA's Curiosity rover lands on Mars to explore and determine if the planet was ever habitable to microbial life.

2003

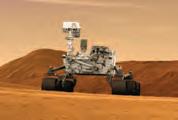
The Colombia space shuttle (USA) explodes upon re-entering Earth's atmosphere, killing all seven astronauts on board.


1990

The Hubble Space Telescope was launched, providing never-before-seen images of the universe.


1969


Australia is one of seven founding signatories of the Artemis Accords, a set of principles to guide cooperation among nations assisting NASA's plans for further lunar landings and a historic human mission to Mars.


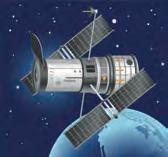
NASA's Apollo 11 mission successfully lands Neil Armstrong and Buzz Aldrin on the moon.

1961
Yuri Gagarin, a Soviet cosmonaut, became the first human to orbit Earth.


1926


The first private company (SpaceX) launches a spacecraft into orbit. It returned safely. This paves the way for the possibility of space tourism.
1998
The International Space Station is launched into orbit.


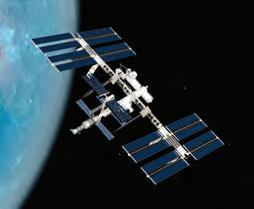
1981


Robert Goddard, considered the 'father of rocketry', created and built the world's first liquidfuelled rocket.


The USA launches the first reusable space shuttle.
1967
Australia becomes one of the first countries to launch its own satellite, in Woomera, with a rocket donated by the USA. It was operational for just five days.
1957
The Soviet Union launched the first artificial satellite 'Sputnik' into orbit around Earth.

'Sputnik 2' was launched with a dog named Laika on board (she did not survive).


Did you know? 6.4
To support the Apollo lunar program, NASA established international tracking stations, such as the ground station at Honeysuckle Creek in the ACT and the radio telescope at Parkes, NSW. Both were instrumental in providing communications between the Columbia command module and Eagle lunar module, and providing television coverage of the 1969 moon landing to the world. Both stations also played a vital role in the rescue of Apollo 13 in 1970, a failed moon landing in which a ruptured oxygen tank caused the crew to lose electricity, water and light before navigating safely back to Earth and splashing down near Samoa.
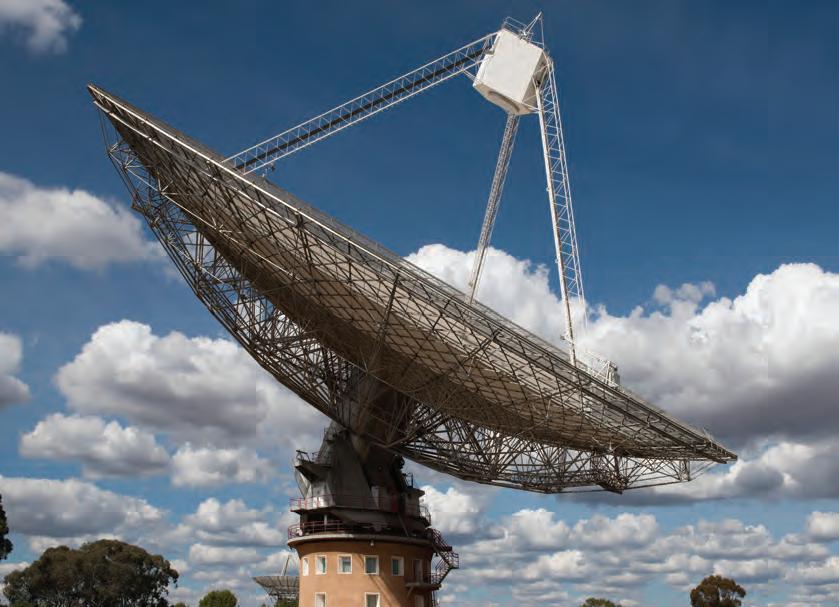
A rocket uses gas (usually from burning liquid fuel) to overcome Earth's gravitational pull and exit the atmosphere. Rockets are used to launch both uncrewed vehicles, such as satellites and rovers, and crewed vehicles.
In the early days of space exploration, the crew lived and worked in a capsule that was attached to the rocket. Shortly after launching, the rocket would detach and burn up. At the conclusion of the mission, the capsule would return to Earth and splash down into the ocean, where it could be recovered but not reused.
In 1981 the United States of America launched the first reusable space shuttle. This spacecraft used solid rocket boosters to launch (which detach in space) and an orbiter, which can re-enter Earth's atmosphere and glide to land in a similar way to an aeroplane.
There have been several significant aeronautical disasters associated with the use of space shuttles, most notably:
• the Challenger disaster in 1986, which saw a malfunctioning seal cause a catastrophic fire several minutes after lift-off and the deaths of all seven crew on board
• the Columbia disaster in 2003, whereby the shuttle disintegrated upon attempting re-entry. Again, seven crew members died.
A rocket is essentially a chamber containing gas under pressure. Releasing the gas enables movement, in the same way that releasing a pinched nozzle of a balloon results in it flying through the air. For rockets that can propel a vehicle into space, the gas is produced by burning solid or liquid propellants (fuel plus oxygen in a combustion reaction). Unlike the case of an aeroplane, which can simply draw oxygen into its engine, there is no air in space. Therefore, rockets must carry a supply of oxygen with them.
Prior to launch, the forces acting on a stationary rocket are balanced. During lift-off, a rocket works by forcing hot gas at high pressure out of a narrow opening at the base of the rocket. The gas exerts a thrust (force) on the rocket, pushing it in the opposite direction. If the thrust exceeds the weight of the rocket, then the forces are unbalanced and motion can occur. The rocket will accelerate upwards, gaining speed.
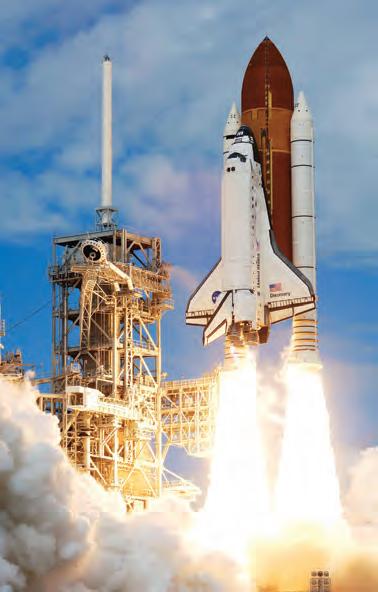
6.51 The launch of the space shuttle Discovery (1984) and its seven-member crew en route to the International Space Station. Note the large red external tank, and the two white solid rocket boosters either side of the orbiter (which resembles an aeroplane).
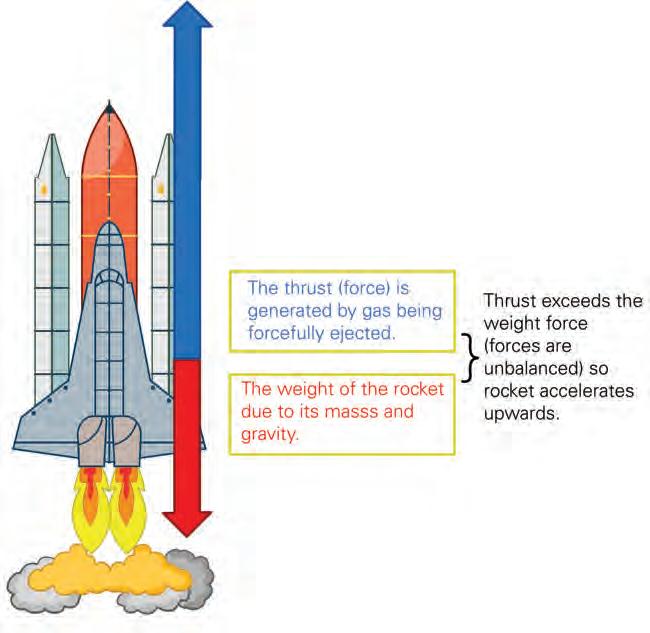
thrust a mechanical force that propels an object forward as it expels or accelerates matter backwards
payload the portion of the spacecraft that addresses the primary mission –i.e. it is specifically dedicated to producing mission data and relaying it back to Earth
The weight and shape of a rocket are important design considerations in order to minimise the amount of thrust required to lift off. Typically, up to 90% of the mass of the rocket is allocated to the propellants, with the other 10% composed of the structure and the payload (satellites, astronauts, orbiter, computing systems).
1. Recall the year that NASA's Curiosity rover landed on Mars.
2. List three different objects that can be launched into space via a rocket.
3. Explain why a rocket must carry a supply of oxygen.
4. Describe how a rocket is able to overcome Earth's gravitational pull.
Aim
To explore the concept of rocket propulsion by constructing a water bottle rocket
Materials
• empty 2 L soft drink bottle, lid removed
• scissors
• paper clip or drill to make hole through the cork
• wine bottle cork
• bicycle pump needle
Method
• bicycle air pump
• duct tape
• cardboard for fins
• water
1. Unwind the paper clip. Push it through the cork lengthways, making a hole the whole way through.
2. Insert the pump needle through the hole in the cork. It should poke out the end. If the cork is too long, cut it down slightly so the needle tip is exposed (see Figure 6.53, Diagram 1).
3. Insert the cork into the mouth of the bottle, needle tip facing down. It needs to be a snug fit.
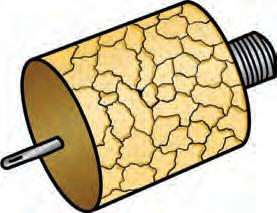
4. Using cardboard and duct tape, design some fins for your rocket and attach to the plastic bottle. The fins should be long enough to act as a stand for the rocket. Tape them on at a height where there is enough clearance underneath for the bike pump to attach to the needle in the cork (see Figure 6.54, Diagram 2).

5. Proceed to testing area outside. Remove cork, pour water into the bottle and then replace the cork. You can experiment with the volume of water you use. Around 200 mL is a good starting point.
6. Invert the bottle and attach the bike pump (see Figure 6.55, Diagram 3).
7. Stand to the side and ensure the rocket is not pointed at anything (including yourself!).
8. Begin pumping. Observe lift-off! Visually estimate the height of your rocket and compare to other groups in your class.
Results
Estimated height rocket achieved = _________ metres
Discussion: Analysis
1. Explain how thrust was generated during this experiment.
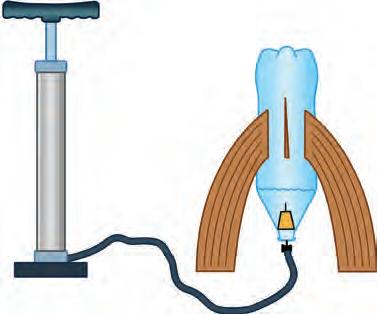
2. What advantage does adding water to the bottle provide over using an air-filled bottle?
Discussion: Evaluation
1. What are the limitations of this experiment in terms of the differences between your model and a rocket designed for space travel?
2. Identify any potential sources of error in your results.
Extension: Experiment with different volumes of water and rocket designs. For example, try adding a streamlined nose to your rocket or adding weights at the front or the rear of the rocket.
The International Space Station has been continuously occupied since the arrival of the first crew in the year 2000. The inhabitants live and work, all while orbiting Earth every 90 minutes, at a speed of almost eight kilometres per second! The international crew experience 16 sunrises and sunsets every day, but their altered perception of time is only the beginning of the many physical and physiological challenges associated with living in space. Table 6.4 summarises how some of these challenges can be addressed.

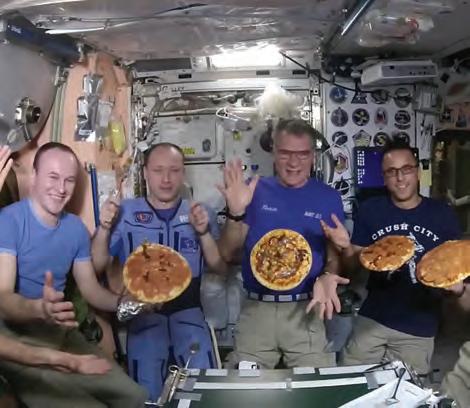
physiological relating to the way in which a living organism, and its body systems, function
Space is a vacuum.
Spacecraft and spacesuits must have a stable internal pressure similar to Earth's atmosphere. No air in space means no oxygen. The by-product of respiration (carbon dioxide) also needs to be removed.
Exposure to ionising radiation without the protection of Earth's atmosphere
Extreme temperatures
Adverse effects of weightlessness on bones, eyesight and muscles
There must be a ready supply of oxygen. In a spacecraft, this would fill the living and working quarters. In a spacesuit, this would be provided from a tank or portable life support system (PLSS). Filters must remove the carbon dioxide.
Radiation can damage DNA leading to mutations and possible health consequences, such as cancer. A spacesuit must feature materials that adequately shield against ultraviolet radiation (from the Sun) and subatomic radiation.
There is no wind in space, so you cannot lose heat by convection. Heat can only be lost by radiation or conduction. Temperatures outside a spacesuit vary greatly depending on the level of sunlight or shadow, so it features thick insulation.
Inside a shuttle/station, the air temperature is maintained at a comfortable level despite massive fluctuations in the external temperature. In full sun, the external temperature can reach over 100° C and in shadow it can fall to below –200° C.
The microgravity environment can cause nausea ('space sickness') due to disturbances in the fluid-filled vestibular system that regulates our balance and awareness of body position. Extended periods of not using postural muscles leads to wasting of the skeletal muscles (atrophy) and also decreased bone density, as bone is laid down under mechanical stress and this is largely absent in a microgravity environment.
Treadmills and resistance equipment are on board the ISS to prevent muscle atrophy. Astronauts strap themselves to the machines using elastic cords.
Psychological effects, lack of real-time connection to Earth, cramped living quarters. Astronauts report a lower amount and quality of sleep.
High levels of sound are present in space stations at all times.
Astronauts on the ISS are from varied cultural backgrounds, but most are proficient in several languages to enable social connection and communication. Mission teams are carefully selected to ensure they can work in a collaborative manner.
Astronauts can utilise social media and make videocalls with family and friends on Earth.
Table 6.4 Physical and physiological challenges of space travel and how they are addressed
In addition to the challenges outlined in Table 6.4, mission controllers and crew members must acknowledge the real possibility of a failure in propulsion or life-support equipment. Shuttles and stations feature built-in fail safes – for example, backup power generation and batteries for vital equipment that requires electricity. There are rescue protocols in place, and crew are appropriately trained in these and rehearse procedures in simulation prior to commencing their mission.
Did you know? 6.5
In 2019, NASA published data relating to the health effects of long-duration spaceflight, which were gathered through the comparison of astronaut Scott Kelly (who spent 11 months aboard the ISS) and his Earth-dwelling identical twin Mark Kelly (himself a retired astronaut).
Significant alterations were observed in Scott's DNA, in addition to changes in his gut microbiome, body weight, the thickness of his retina, several inflammatory markers in his blood and even his cognition. Many of the changes returned to pre-flight levels after returning to Earth.

Try this 6.6
Designing a spacesuit
Spacesuits protect astronauts when they undertake tasks outside the shuttle or space station. In the early days of space exploration, astronauts' suits had to be tethered to the spacecraft at all times via an umbilical cord-like structure. Since the development of the portable life support system (PLSS) they are able to undertake tasks untethered.
Design a spacesuit that will address some of the physical issues outlined in Table 6.4. In your design, consider all body systems and also communication and safety requirements that will allow an astronaut to undertake their work.
Extension: Can you build a prototype?
Explore! 6.6
The International Space Station
Develop a report about the current research and inhabitants of the International Space Station.
Microgravity is not the absence of gravity, but the perceived feeling of weightlessness. It can be experienced in freefall (when skydiving or when objects are dropped from a drop tower) or during space travel (while coasting to the moon or in orbit on the ISS). It can also be simulated in an aeroplane flying repeated parabolic (U-shaped) paths.
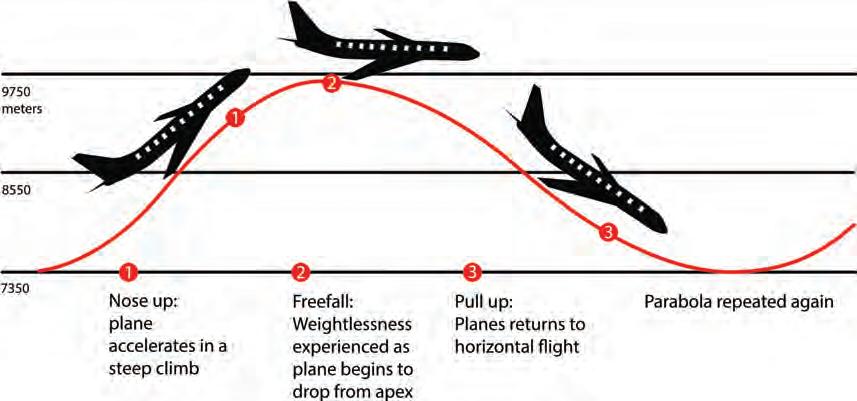
Try this 6.7
Astronaut freefall
Materials
• 2 L clear plastic bottle
• 30 cm piece of string
• sticky tape
• cardboard astronaut picture
• coloured marker
Method
1. Draw a broad stripe around the bottle with the coloured marker.
2. Tape your cardboard astronaut to a length of string and suspend inside the bottle to the level of the line. Hold the string against the mouth of the bottle with your finger so the astronaut is dangling as shown.
3. In Trial 1, hold the bottle steady and release the string. Observe the astronaut falling to the bottom under the force of gravity.

4. Reset the astronaut to the level of the line. In Trial 2, release the string and bottle together by dropping from a table. Have a partner observe how the astronaut behaves during the fall.
Aim
To observe how liquids behave in freefall
Hypothesis
In this activity you will compare how a liquid behaves when subjected to gravity (falls on its own), versus when it falls within a vessel (when gravity acts on the cup and liquid at the same time). Construct a hypothesis for this experiment.
Materials
• plastic drinking cup
• water
• flat rigid surface (e.g. metal biscuit baking tray, heatproof mat or similar)
• basin (e.g. rubbish bin or large plastic tub)
• towels
• chair or stepladder
• phone for recording (optional)
Method
1. Place the basin on the floor in an open area.
2. Fill the drinking cup with water.
3. Place the baking tray over the opening of the cup, and using one hand press the cup firmly up onto the tray to ensure a tight seal. Then invert the tray and cup.
4. Carefully climb the chair/ladder and hold the tray high above the basin.
5. Your practical partner should stand near the basin with their eyes below the level of the tray. They may use a phone to record the trials, and then watch the videos back frame-by-frame.
6. Trial 1: While holding the tray level, gently poke the cup so it slowly slides off the edge of the tray and observe what happens.

7. Trial 2: Repeat steps 2–4. This time, quickly pull the tray out from underneath the cup and observe what happens. You may need to repeat the experiment a few times, taking turns to be the observer.
Results
Copy and complete the following table, giving it an appropriate title.
Trial
Trial 1Liquid falls before the cup
Trial 2Liquid falls with the cup
Discussion: Analysis
Observation
1. Explain your observations with reference to the action of gravity on the water and the cup.
Discussion: Evaluation
1. Identify some potential sources of error in this experiment.
2. State some improvements that could be made to the method.
Conclusion
1. Make a claim about how liquids behave in freefall.
2. Support your statement by referring to your observations.
3. Explain how the observations support your statement, stating if the hypothesis was supported or refuted.
Human spaceflight to Mars has been on the research agenda for several decades. However, at present only robotic landers and rovers have touched down on the 'Red Planet'.
Proposals for human missions vary in scale from research expeditions through to establishing a continuous settlement on the planet. However, there is an enormous financial burden and significant technological hurdles remain:
• The launch of a crewed mission to Mars would need to be precisely timed due to the cyclical fluctuations in distance between Earth's and Mars's orbits. Even minimising this, each leg of the journey is likely to take around nine months, representing a substantial period of time in space.
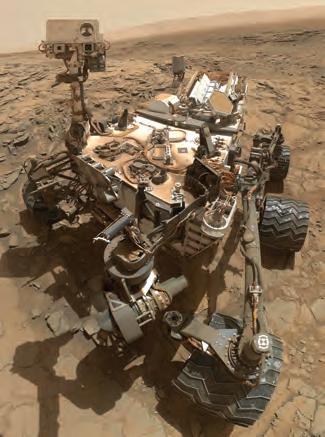
• The thin atmosphere on Mars poses difficulties for entry, as spacecraft will descend too quickly towards the surface of the planet and need to be slowed to prevent violent impact.
• Conditions on Mars are inhospitable. The force of gravity is around one third of what it is on Earth, and the thin atmosphere is composed of only 0.13% oxygen, so humans would need to rely on technology to convert carbon dioxide into oxygen in order to breathe. Temperatures vary between –153°C during winter (near the poles) and 20°C in summer (at the equator), and water is only found underground. Regular dust storms mean solar generation of power is not viable.
• An additional rocket would need to be transported to Mars in order to launch a return journey back to Earth.
thinking visible 6.5
reporter’s notebook: A day in the life on Mars
Research some of the recent projects attempting to simulate Martian life, and then create a diary entry for a scientist spending a day in a Mars settlement. You can follow the Reporter's notebook framework:
Name the facts and events that you might expect during a day on Mars. (What evidence confirms these?)
Identify the thoughts and feelings of the character in the situation. Make your best judgement about living on Mars.
The Reporter's notebook thinking routine was developed by Project Zero, a research centre at Harvard Graduate School of Education.
Travelling beyond Earth's atmosphere offers a unique research environment for experiments and has given us a greater understanding of our own planet. The scientific research that has been conducted in space spans all domains of science. Here are just a few examples of specific projects that have been conducted on the ISS recently:
• Biological sciences: A biotechnology company has studied the effects of radiation on its synthetic muscle products. This has applications for human prosthetics and also humanlike robotics.
• Chemical sciences: A manufacturing company has examined flame propagation and the behaviour of textiles when burning in microgravity. It aims to improve fire-retardant fabrics used for firefighting uniforms.
• Physical sciences: Studies on fluid dynamics (there is no buoyancy in microgravity) allow scientists to understand how molecules behave in magnetic fields, leading to improvements in brake design.
• Earth sciences: Ocean eddies/currents can be monitored via satellites and the effects on the world's weather systems interpreted.
Satellites have a variety of uses, including communication, navigation (GPS), scientific research (measurement tools) and military applications. They must all generate their own operating power, which is often achieved via solar panels, and feature a transponder that allows communication to
ground stations back on Earth. Launching satellites and collecting and on-selling data has become a growth industry, worth around US$10 billion in 2023. The data can be directly fed into AI (artificial intelligence) programs for efficient and complex analysis.
Satellites allow for frequent and precise measurements of sea ice coverage, ocean surface temperature, atmospheric pollution and many other variables relating to our Earth's climate. Dry land, water and ice emit thermal microwave radiation at differing wavelengths, and satellites can detect this in order to construct detailed maps of sea ice coverage and track how it changes over time. These data provide evidence of climate change and can be fed into models and simulations in order to make predictions redundant. Laser altimeters allow scientists to calculate the thickness of sea ice, and infrared imaging provides information about ocean surface temperatures. We know that melting of polar ice caps is a contributor to rising sea levels globally, and that changes in the ocean temperature are leading to coral bleaching and affecting animal migration patterns.
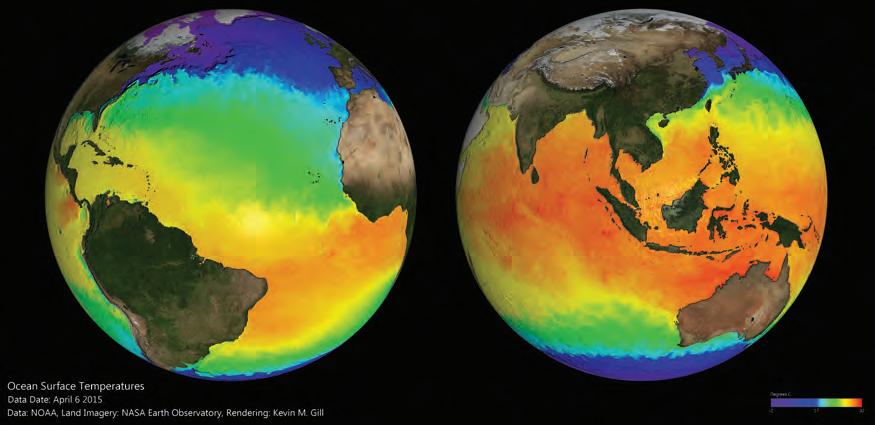
The inherent challenges associated with space travel have led to advances in technology that have been applied beyond their initial aerospace purpose and have delivered benefits to society. Solar panels, implantable heart monitors and materials used in home insulation are just a few examples of technologies born from space research that have become integrated into our everyday lives.
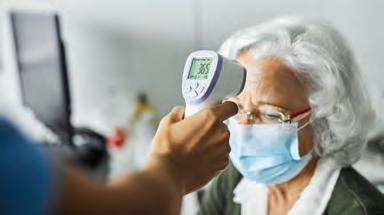
satellite an object in space that orbits a larger object. Natural satellites include moons orbiting planets, and artificial satellites include crewed and non-crewed spacecraft.
Metals in their elemental state are often softer than what is required in industrial and commercial applications. Manufacturing and construction industries have long since relied on alloys (one main type of metal mixed with other elements in small quantities, e.g. stainless steel: a blend of iron, carbon, chromium and nickel). Titanium alloys have been embraced in aerospace fields for their high strength-to-weight ratio and have also been adopted for use in police and military body armour.
A developing field in materials science has seen the emergence of high temperature alloys that are formed by combining metals with other elements that have very high melting points. The result is new materials that are lighter, stronger and more resistant to corrosion and cracking, especially under extreme temperatures. NASA research teams have recently developed a new 3D-printed metal alloy that is more durable and more flexible than previous alloys. It can withstand temperatures over 1000°C, meaning the material is ideally suited for rocket engine parts. This innovative material resulted from modelling and running simulations of alloy composition and then using a 3D-printing technique in which nanoparticles were uniformly dispersed throughout the alloy.
Figure 6.62 A 3D-printed NASA logo, composed of GRX-810, a high-temperature alloy
Explore! 6.7
other materials from space technology
Research some familiar items or materials that have resulted from space research and classify them using the following framework. An example has been completed for you:
Name of item or material In everyday use by the average person? (Yes/No)
Memory foam Yes
Original use or reason for development (space research)
Specialised cushioning for astronauts' seats (lunar landing, NASA)
Present-day application here on Earth
Therapeutic pillows and ma resses, sports helmets, shoe cushioning
Section 6.5 review
Go online to access the interactive section review and more!
Section 6.5 questions
Remembering
1. Recall when the International Space Station was launched.
2. Identify the creator of the first liquid-fuelled rocket.
Understanding
3. Describe the forces acting immediately before and during a rocket launch.
4. Outline three effects of microgravity on the human body.
Applying
5. Summarise the physical conditions (including climate) on Mars.
6. Explain the role of a reduced-gravity aircraft in astronaut training.
Analysing
7. Discuss how technology resulting from space research can be applied in everyday life, using at least one example.
Evaluating
8. Some scientists argue that crewed missions to Mars are too costly and technologically difficult, and we should instead be funding further exploratory research via rovers. Justify why establishing a colony on Mars could be advantageous for the future of the human race.
Chapter checklist
Success criteria
6.1I can describe how our understanding of the universe has changed over time. 1, 2, 6, 20
6.1I can describe recent advances in astronomy. 12
6.1I can identify the different technologies used to collect astronomical data and the types of data collected. 18
6.2I can compare and contrast the life cycles of small and large stars.5, 8
6.2I can describe how stars' light spectra and brightness are used to identify compositional elements of stars, their movements and their distances from Earth. 9, 19
6.3I can describe the major components of the universe. 15
6.3I can describe how distances are measured in space. 4, 14
6.4I can describe the major changes in the universe that have occurred since the Big Bang. 10, 16
6.4I can describe the evidence that provides support for the acceptance of the Big Bang theory. 3, 11
6.5I can name key dates and events in the history of human space exploration. 7
6.5I can describe how the principles of rocket propulsion allow the force of gravity to be overcome. 13, 21
6.5I can explain how technology has addressed physical and physiological challenges and enabled us to live beyond Earth's atmosphere.
Review
Remembering
1. Recall the evidence that Ptolemy used to explain his geocentric model.
2. Recall the evidence that Copernicus used to disprove the geocentric model.
3. Recall the evidence that supports the Big Bang theory.
4. Recall how parallax can be used to measure distances in space.
5. Recall the definition of a red giant.

6. Recall aspects of Aboriginal and Torres Strait Islander Peoples' cultures and societies that are informed by their astronomical knowledge.
7. Recall the year NASA's rover landed on Mars.
Understanding
8. Describe the relationship between star brightness, size and length of lifetime. Explain why this is the case.
9. Astronomers have found that the spectral lines from a distant galaxy are red-shifted. Summarise what this tells us about the galaxy and what it implies about the universe.
10. Explain why we cannot see photons emitted in the earliest stages of the universe.
11. Explain how cosmic microwave background is considered evidence for the Big Bang.
12. Describe some recent advances in astronomy.
13. Describe the forces acting during a rocket launch.
Applying
14. An astronomer makes two observations of a star six months apart and measures a parallax angle of 0.1 arcseconds. Calculate the distance to the star. Convert your answer into light years and kilometres.
15. Discuss the major components of the universe.
16. Discuss the major changes that have occurred in the universe since the Big Bang.
17. Outline two challenges associated with breathing when outside Earth's atmosphere.
Analysing
18. Compare optical and radio telescopes.
19. Contrast red shift and blue shift.
20. Contrast the heliocentric and geocentric models of the universe.
21. In the graph below, each of the coloured triangles represents a spacecraft launched towards Mars (see key below for names). The blue line represents the variable distance between Earth and Mars, in millions of kilometres, due to the differences in their orbits. With reference to the graph, describe the pattern in the timing of spacecraft launches.
Evaluating
22. Discuss the chances of finding intelligent life elsewhere in the universe.
The universe is home to billions of stars, many much larger and much brighter than the star we call the Sun. Figure 6.64 presents a selection of stars in our universe and shows their surface temperature and luminosity. As a reference, the Sun has a luminosity of 1 and a surface temperature of approximately 5800 K. The stars in Figure 6.64 belong to four different categories depending on their properties: the main sequence, white dwarfs, red giants and blue or red supergiants.


Applying
Figure 6.64 A Hertzsprung–Russell diagram illustrating the surface temperature and luminosity of various stars in the universe
1. Identify the category of star to which our Sun belongs.
2. Determine which category of star is most luminous.
3. The x-axis provides the star surface temperature in units of kelvin (°C = K − 273). Given the surface temperature of the Sun is 5800 K, calculate the surface temperature in degrees Celsius.
Analysing
4. Identify the trend of surface temperature and luminosity of stars in the main sequence.
5. Contrast the properties of white dwarfs and red giants.
6. Identify any patterns occurring in the properties of blue and red supergiants.
Evaluating
7. A large star has been discovered and classified as a main sequence star with a surface temperature of 25 000 K. Deduce the luminosity of this star compared to the Sun.
8. New data have suggested that this new star (from Question 7) is almost 100 000 years old, its surface temperature is cooling and it is becoming slightly more luminous. Predict the category this star will belong to as it changes properties from the main sequence.
9. Compare the properties of all four categories of star. Do you think the size of a main sequence star will ultimately determine whether it becomes a supergiant, giant or dwarf?
How do you create an image that shows, as accurately as possible, the distance between our Sun and Earth (150 million km)? Have you stopped to think about those tremendous distances? Why not represent our solar system to scale?
Humans are used to handling small numbers and units. We talk about centimetres, metres or kilometres; and minutes, hours, days, months or years. However, in astronomy we see tremendously large numbers in space and time which escape our understanding and are difficult for us to imagine. In this activity you are invited to create a representation of our solar system to scale to gain a better understanding of its size.
Design a scale model of the universe and present this information in the form of a vlog (video blog or video log).
Figure 6.65 A representation of our solar system where the distances are not to scale, but the sizes are to scale
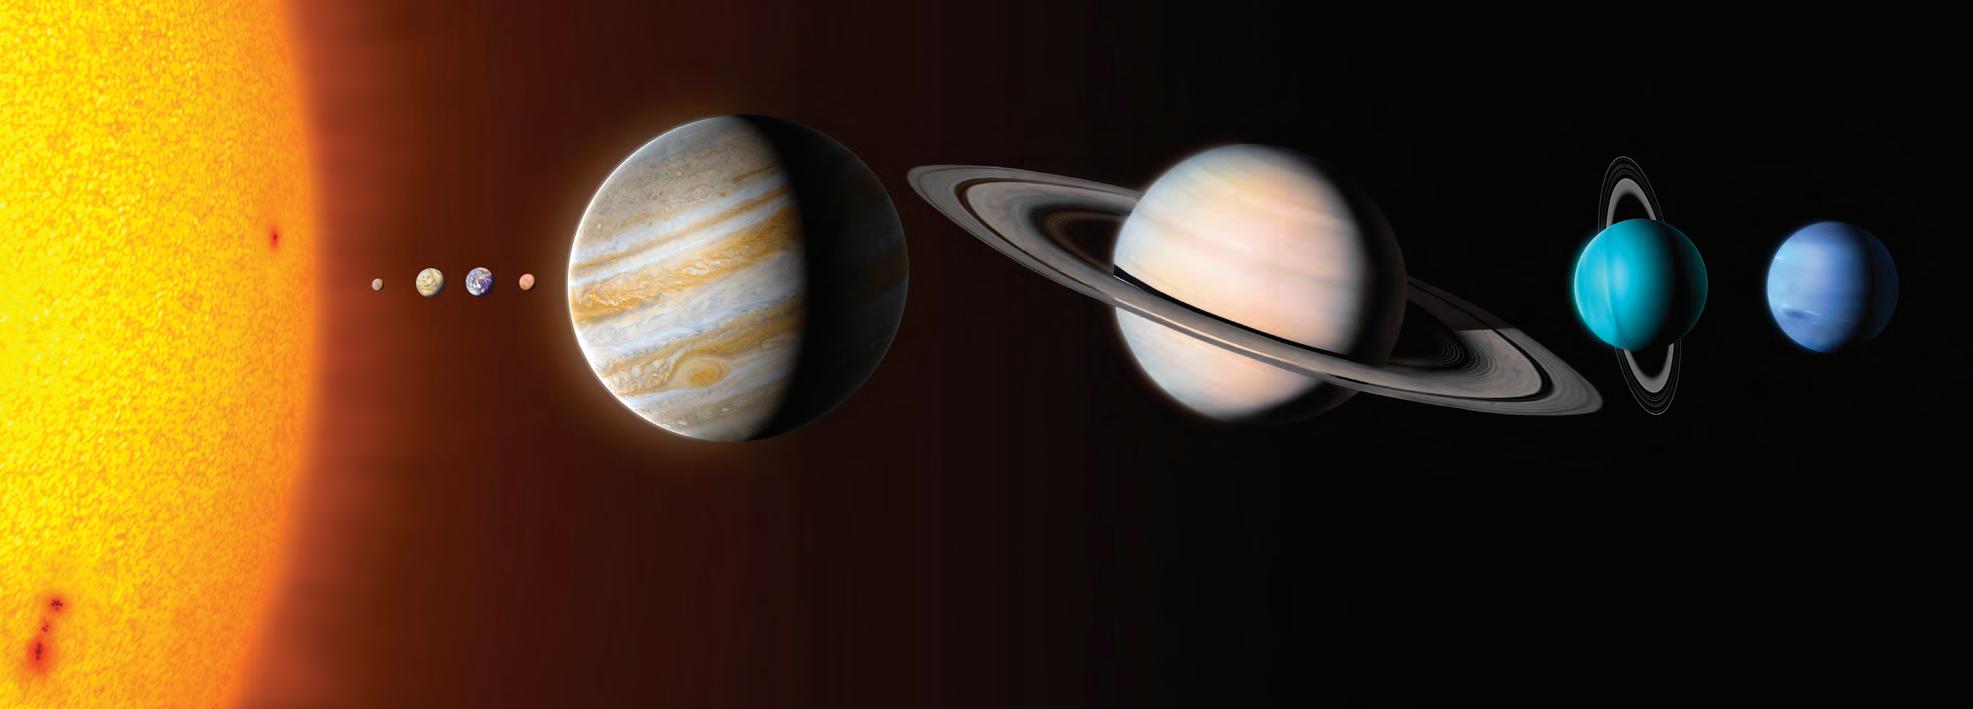
The solar system is much bigger than most people think. In this activity you will collaborate in groups to create a representation of our planetary system to scale, using hands-on materials while recording your journey. The scale model must include all the planets and known dwarf planets. You will need to make sure that your scale model helps others gain a better idea of the vastness and true size of our solar system. To do this you will need to make sure that you find a way (for example, a formula) to convert distances and diameters of planets into something humans can comprehend. How do we do that?
Here are a couple of suggestions:
• Imagine that we convert the distance from the Sun to our Earth from 150 million km to 2 metres instead. Can you see how much easier it is to visualise and comprehend the 'metre' than the 'millions of kilometres'? Now you can repeat this same conversion for all planets on the solar system using Table 6.5. That will allow you to start comparing distances for these celestial bodies in a much more meaningful way. You can finally visualise the scale of the vastness of our solar system.
• Having the correct distances is a good step but does not give the full picture. Consider converting the diameter of our planet (12 756 km) to a more manageable number. What about 10 cm? Then convert the diameters of the other bodies in our solar system.
Use your new measurements to create a 2D version of the solar system, showing Earth and all other planets and dwarf planets. Record a vlog of all the stages of your 2D solar system and edit this video to be used as an educational resource.
Model
• large reel of measuring tape
• colouring pencils, cardboard and paper to create your planets
• protractor
• scissors
• movie maker software and recording device
NOTE: You may need to use the school oval to really represent the distances involved.
1. Using the information in Table 6.5, research how you could create a formula to assist you to convert all values from millions of kilometres to more manageable units (metres or centimetres). What skills do you need to perform that task? Record all information on your vlog.
2. Discuss in your group the feasibility of presenting the scale model within the restrictions of school. List your ideas of how to demonstrate the vast size of the solar system.
3. Record your research and results as the 'Research and feasibility' section of your vlog.
4. Analyse Table 6.5 and make a statement about how the orbital period of a celestial body is affected by its distance from the Sun. Explain your reasoning.
Table 6.5 Some data on the eight planets within our solar system
5. The dwarf planet Haumea has been described as 'eccentric' by its discoverers. Analyse Table 6.6 and determine which piece of data shows how this dwarf planet is very different from other dwarf planets.
Name of planet
Ceres 413 900 000 9509 hours, 5 minutes 4 years, 220 days
Pluto 4 436 820 000 to 7 375 930 000 23706 days, 9 hours 248 years
Haumea 5 260 000 000 to 7 708 000 000 1960 × 1518 × 996 4 hours258 years
Eris 5 665 500 000 to 14 634 000 000 23267 hours, 46 minutes 557 years
Table 6.6 Some data on dwarf planets within our solar system
6. Planets orbit around the Sun on elliptic orbits.
a) Compare and contrast the average distance from the Sun of planets and dwarf planets.
b) How do the orbits of dwarf planets compare (visually) to the orbit of inner planets in our solar system? You can draw or sketch your answer if you like.
7. Record your analysis as the 'Design and sustainability' section of your vlog.
8. Create your 2D solar system model. Make sure to include your scale.
9. Record the whole creation of your 2D model in the 'Create' section of your vlog.
10. Edit your vlog into a video file that can be shared.
11. Reflect on how effective your vlog is in demonstrating the vastness of our solar system.
12. Present your vlog to the class and discuss the use of vlogs to share information, and the effectiveness of their use.
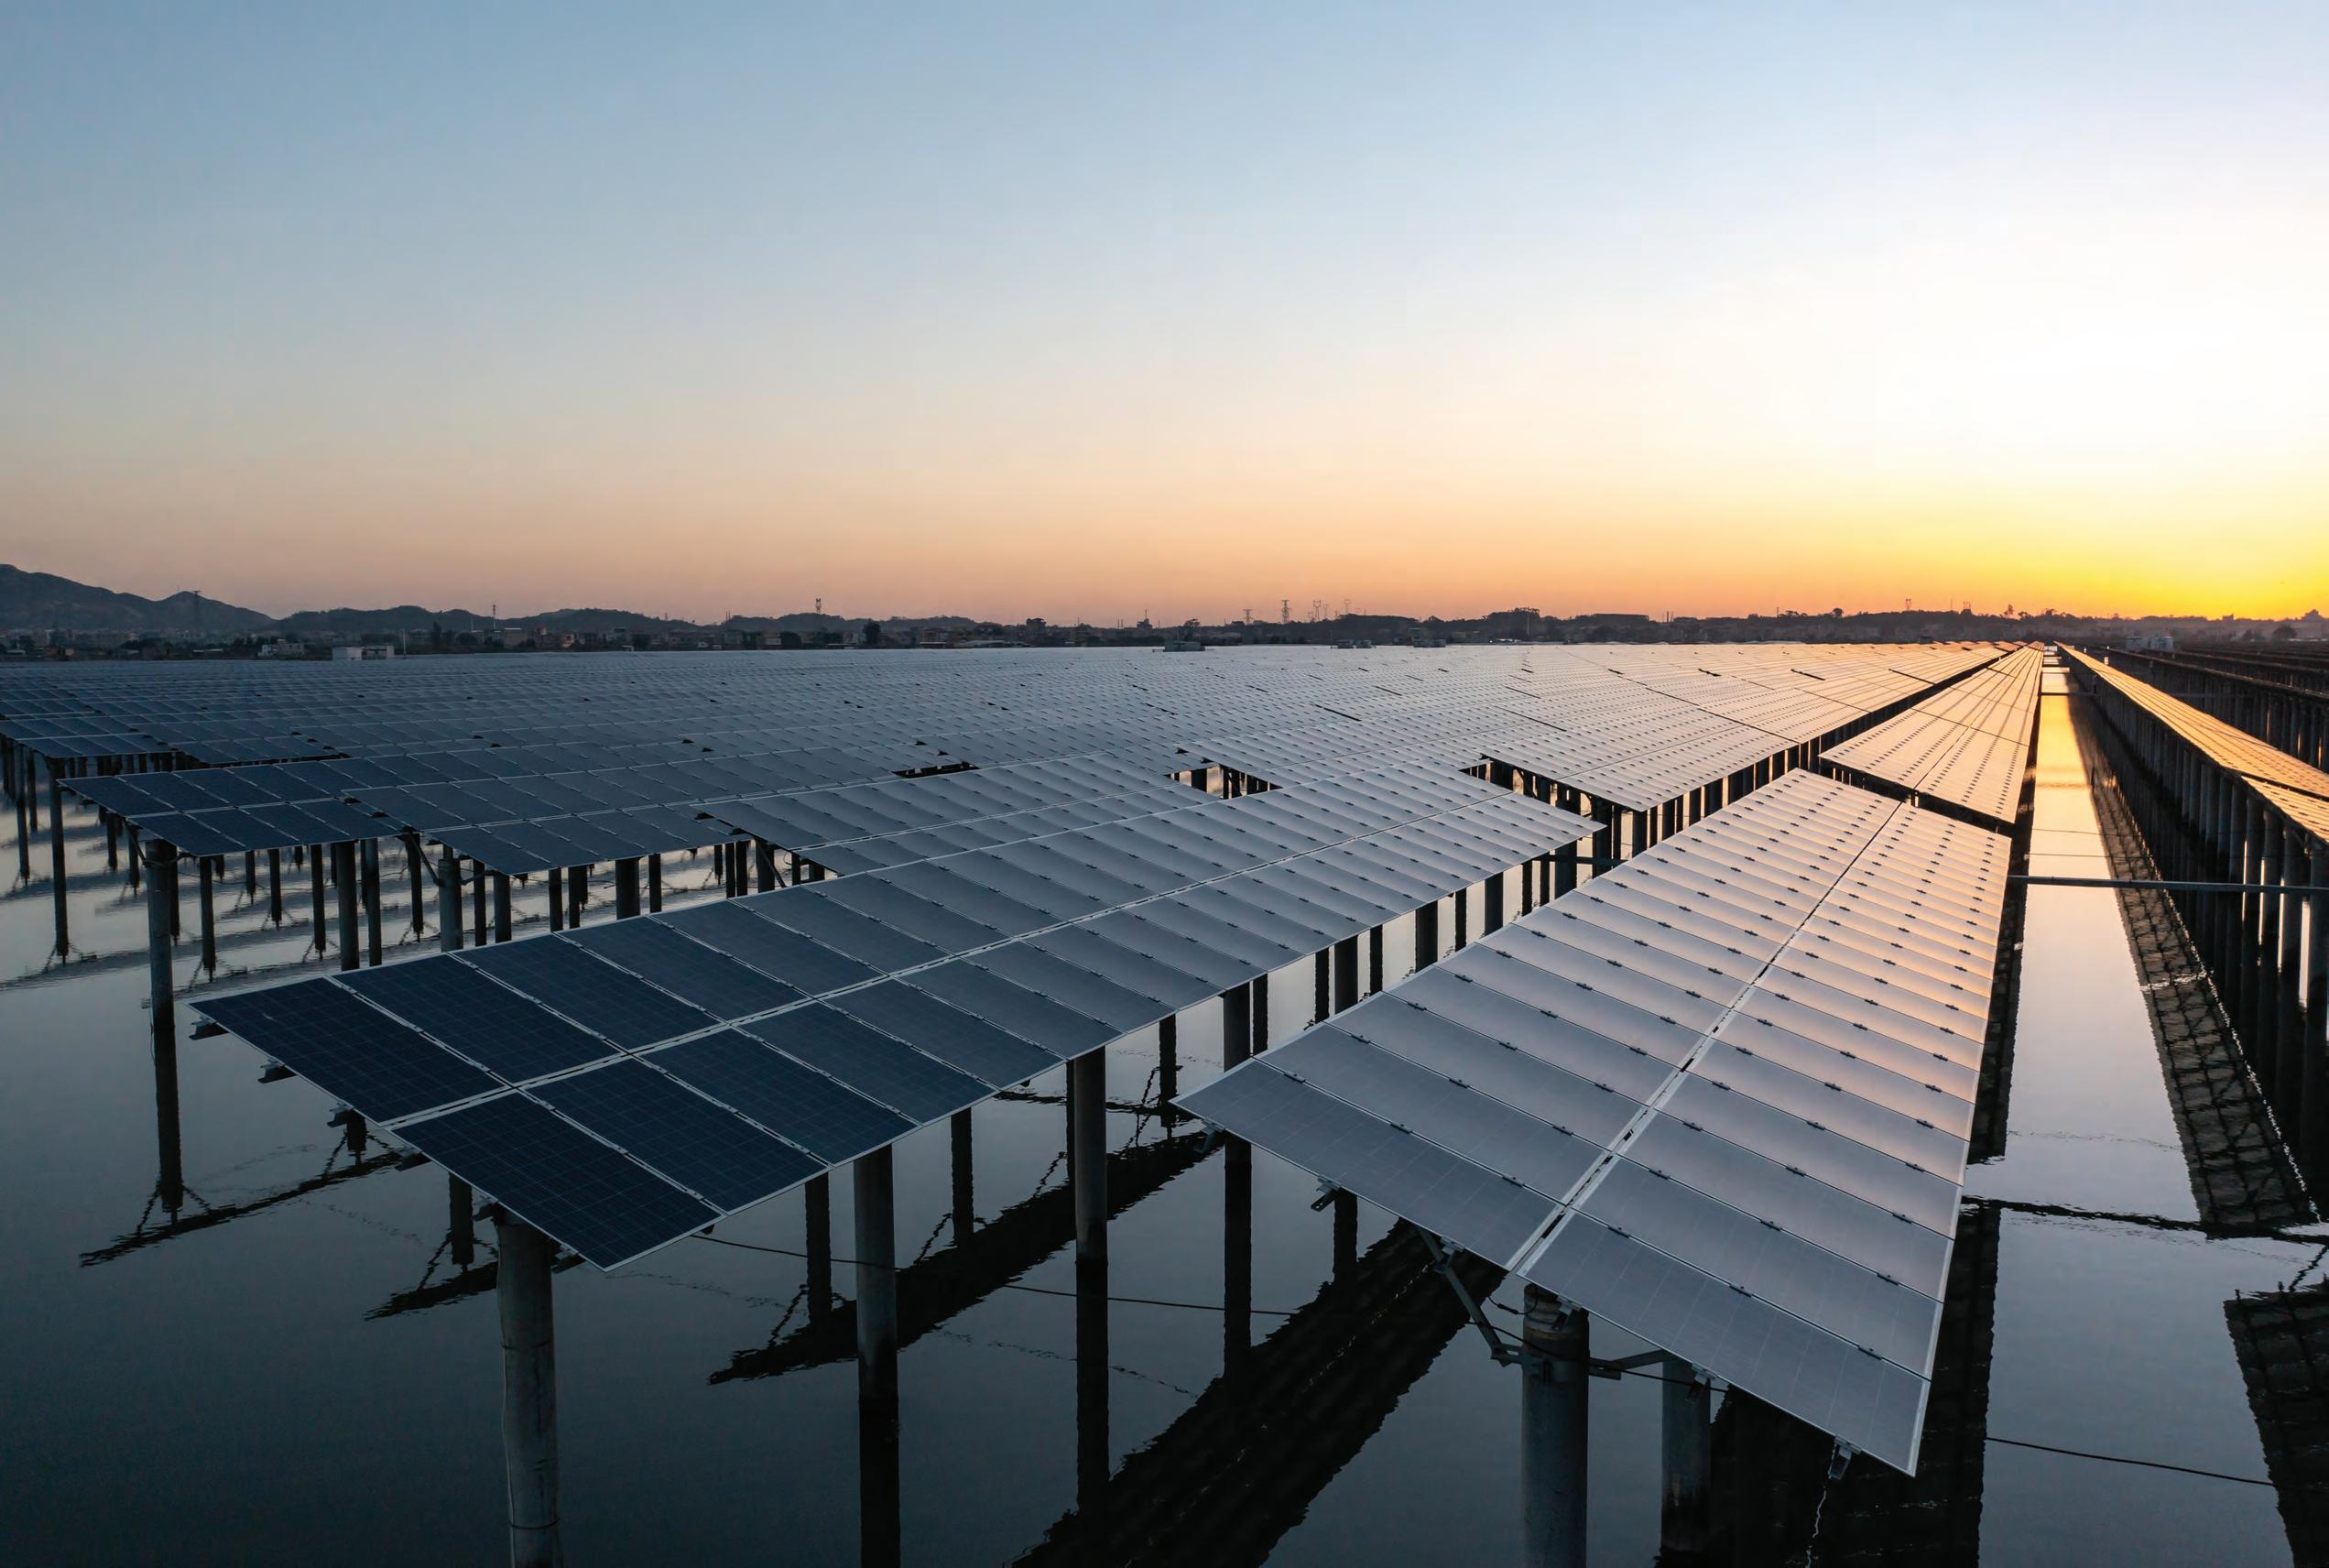
Energy sources, both renewable and non-renewable, are used to transfer and transform energy into the forms of energy we use every day. The transfer of energy obeys the Law of Conservation of Energy by which energy cannot be created or destroyed in an isolated system. That does not mean that when transforming one form of energy to another it is 100% efficient. Energy is often unintentionally transferred to the surroundings as waste in the form of heat, light or sound energy. This chapter will explore different forms of energy and the efficiency of energy transfer, from its source to its intended use.
Kinetic energy (KE)
Fundamental forms of energy
Potential energy (PE)
Renewable
Different sources of energy are used to generate electricity.
Energy can be transferred and transformed. Energy transfers and transformations are never 100% efficient.
represented by
Efficiency calculations Sankey diagrams
Section 7.1
Section 7.2
Section 7.3
Law of Conservation of Energy governed by
Curriculum content
the Law of Conservation of Energy can be analysed in systems, including Earth systems, by assessing the efficiency of energy inputs, outputs, transfers and transformations (VC2S10U15)
• recognising that the Law of Conservation of Energy explains that total energy is maintained in energy transfers and transformations
• recognising that energy transfers and transformations can have several steps and that systems are not 100% efficient, which means that usable energy is reduced
• creating a Sankey diagram of the transformation of energy as light travels from the Sun to Earth
• investigating the energy efficiency of ground ovens used by Aboriginal and/or Torres Strait Islander Peoples
• examining how improving efficiency in energy transfer and transformations in sporting activities such as pole vaulting and archery improves athletic performance
• comparing the efficiency of electricity generation from different sources, for example coal, nuclear, hydroelectricity, gas, solar and wind
Victorian Curriculum V2.0 F–10 © VCAA 2024
Glossary terms
Displacement (s)
Elastic potential energy
Energy
Energy
Enrichment
Fossil fuel
Geothermal energy
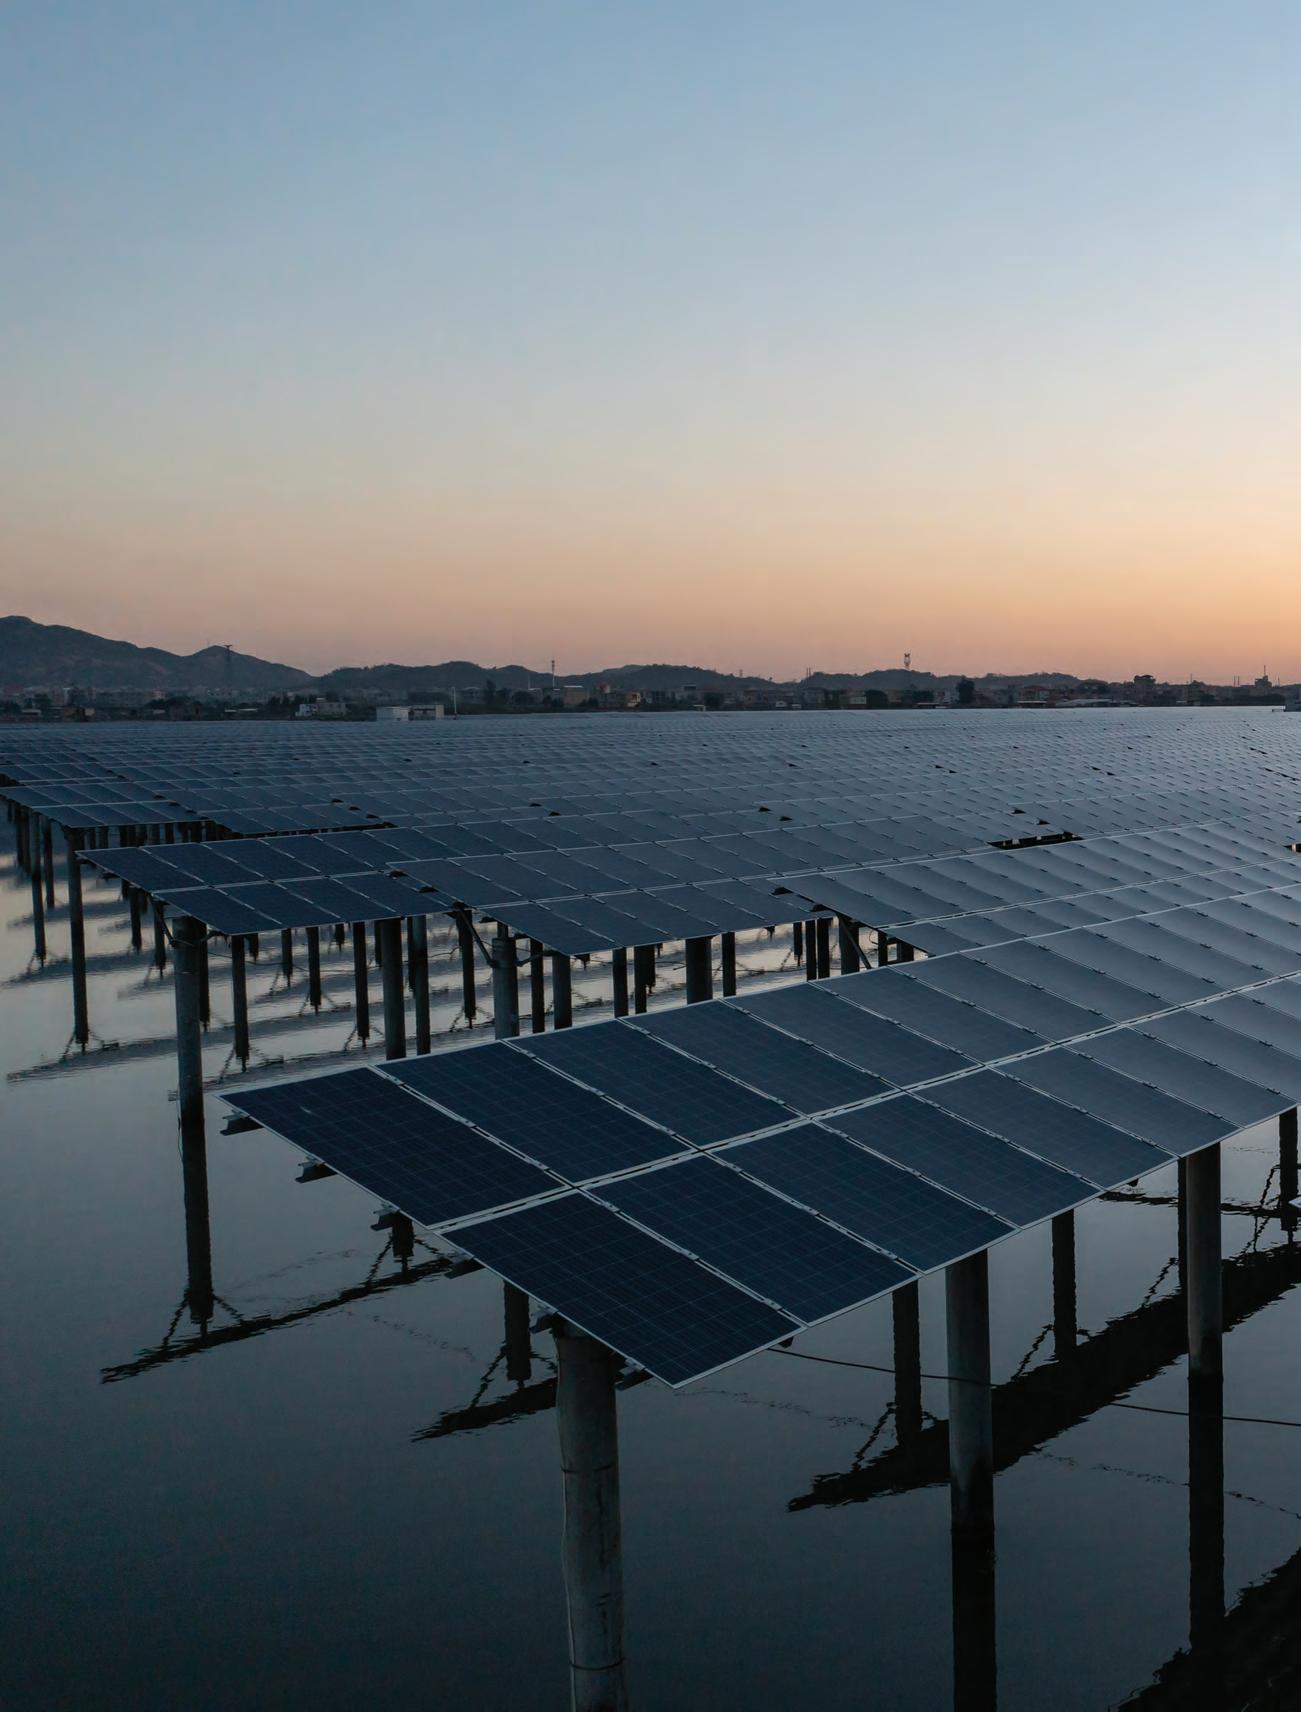
Kinetic energy
(W )
At the end of this section, I will be able to:
1. Define the terms 'energy' and 'work'.
2. Recall the forms of potential and kinetic energy.
3. Use scientific equations to perform calculations.
It does not matter where you are in the world or what you are looking at − everything happening around you, and even within you, is powered by energy. But what exactly is energy? Let us take a closer look.
Energy is a word that can be used to describe when we move around or exert force on our surroundings. Objects can have energy too, and while energy itself cannot always be seen, changes in energy are easier to observe. In physics, energy is defined as the ability to do work. Work is the amount of energy transferred when a force is applied to an object to make it move or be displaced. For example, when you push a box across the floor, force is being applied to the box and is making it move a certain distance, and this means that work is being done. Energy is measured in joules, which have the symbol J. One joule is the amount of energy transferred when a force of one newton applied to an object causes it to be displaced by one metre. That is, 1 J = 1 N m.
Work is something that is done on or to an object when an applied force causes the object to move some distance. When you push a box across the floor, you are said to have done work on the box.
Work can be quantified by the formula:
work = net force × displacement
W = Fs
where W is work, measured in joules (J); F is the net force acting on the object, measured in newtons (N); and s is the displacement, or distance moved from the origin (its starting point), in the direction of the force, measured in metres (m). Displacement will be covered in more detail in the next chapter.
For work to be done, the displacement needs to be in the direction of the force. Therefore, if a force is applied to an object and it does not move, no work is done.
You may have noticed that energy and work both have the unit joules (J). This is because a joule is equal to the amount of energy transferred when work is done – that is, when a force of one newton is applied to an object and it is displaced one metre from the starting position.
energy the ability to do work
work (W ) the amount of energy transferred when an applied force causes an object to move some distance displacement (s) the length and direction of an object from its origin, measured in metres; also used for the change in length when an object is compressed or stretched

Figure 7.1 Work is done on a box when a force is applied to it, causing it to move some distance in the direction of the force. The larger the applied force or the greater the displacement, the more work is being done.
Worked example 7.1
A weightlifter applies a force of 300 N to a barbell and lifts it 1.5 m off the ground. Calculate how much work is done by the weightlifter to lift the barbell.
Working
Explanation
F = 300 N, s = 1.5 mList the relevant data that have been provided.
W = Fs
W = 300 N × 1.5 m
W = 450 J
Recall the definition of work and the formula.
Substitute the relevant data into the formula.
Solve the problem, giving an answer with appropriate units.
When a force acts on an object, it causes a change in energy because energy is transferred from other objects or transformed into different forms of energy. Worked example 7.1 shows that 450 J of work was done, which means that 450 J of energy was transferred or transformed. In this example, chemical potential energy in the weightlifter is transformed into the gravitational potential energy stored in the barbell. Chemical potential energy and gravitational potential energy are different forms of energy.
Table 7.1 lists the different forms of energy that you may have learned about in previous years. All of these different forms of energy can be broadly classified as one of two types: kinetic energy or potential energy.
Forms of energy
Potential energy
Chemical (including food energy and batteries) Kinetic (motion)

Nuclear
Gravitational

Kinetic energy

Thermal (heat energy, internal particle motion)

Radiant (electromagnetic radiation, including light)

Elastic (including springs) Electric (current) Electric (static)

Mechanical vibrational waves (sound, water waves)


Note that mechanical energy is defined as the sum of the kinetic energy and the potential energy. Therefore, sound energy (that is, mechanical vibrational waves passing through an elastic medium) is a combination of kinetic and potential energies.
Think back to when you ate breakfast this morning and try to identify the forms of energy involved with making and eating your breakfast − you will be surprised at how many there actually are.
1. Explain what it means when work is done on an object.
2. A weightlifter applies an upward force of 100 N to a barbell and in doing so lifts it 1.2 m off the ground, holding it there for 10 seconds before dropping it.
a) Calculate how much work is done by the weightlifter to lift the barbell.
b) Calculate how much work is being done by the weightlifter during the 10 seconds of holding the barbell at 1.2 m above the ground.
Kinetic energy is one of the two main types of energy. Kinetic energy (KE, or in an equation, Ek) is the energy an object has due to its motion. When a force is applied to an object that then causes that object to move, we know that this means work is being done − energy is being transferred. The energy transferred is known as kinetic energy and is possessed by all moving objects.
The amount of kinetic energy that an object has depends on its mass and its velocity. Thus, the faster an object moves, the more kinetic energy it has. And the more mass an object has, the more kinetic energy it has.
To calculate how much kinetic energy an object has, we can therefore use the following formula:
Here, Ek is kinetic energy, measured in joules (J); m is the mass of the object in motion, measured in kilograms (kg); and v is the velocity at which the object is moving, measured in metres per second (abbreviated as m/s or more formally as m s−1).
This formula shows that an increase in velocity has a more significant effect on the amount of kinetic energy than the same increase in mass. If the mass doubles, kinetic energy doubles as well, but if the velocity doubles, the amount of kinetic energy increases by a factor of four. This is because velocity is squared in the formula.
Speed is often calculated in fast-moving objects, such as motor vehicles and projectiles, in kilometres per hour (km h−1). In order to convert to m s−1 so as to use the given formula, divide the km h−1 value by 3.6. This conversion will be explained in more depth in the next chapter.
Worked example 7.2
A motorcycle has a mass of 120 kg and is travelling at 72 km h−1. How much kinetic energy does the motorcycle have?

Working
m = 120 kg, v = 72 km h−1
Explanation
List the relevant data that have been provided. 72 km h−1 ÷ 3.6 v = 20 m s−1
Ek = 1 2 mv2
Ek = 1 2 × (120 kg) × (20 m s−1)2
Ek = 24 000 J = 24 000 J ÷ 1000 = 24.00 kJ
Quick check 7.2
Convert units to the units used in the formula.
Recall the definition of kinetic energy and the formula.
Substitute the relevant data into the formula.
Solve the problem.
When there is a large number of joules, it is usually more appropriate to give the answer in kilojoules, by dividing by 1000.
(Note that rounding to four significant figures gives 24.00 kJ.)
1. Identify two factors that affect the amount of kinetic energy an object has, and give an example of the effect they have.
2. A cricket player bowls a 160 g cricket ball at a speed of 150 km h−1. Calculate how much kinetic energy is transferred to the ball.
Science as a human endeavour 7.1
Cows wearing smart watches powered by kinetic energy!
Energy cannot be created or destroyed; it can only be transformed into other forms of energy or transferred to other objects. But what does this have to do with cows and smart watches? Well, large cattle farms need to monitor environmental and health information of their cattle, in order to prevent diseases and improve farm efficiency. Originally it was thought that cattle could wear small sensory devices around their ankles and necks, and this would make the job easier. However, it had the potential to add a lot of extra costs. In 2022, researchers in China published their design for a wearable smart device for cattle that captures the kinetic energy created by even their smallest movements and uses it to power smart technology. The team's design is unique because it contains a motion enhancement mechanism that uses magnets and a pendulum to amplify all of the movements the cattle make. Pretty cool!
Figure 7.5 In the future, cattle may be wearing smart watches, powered by kinetic energy, that can monitor oxygen concentration, air temperature and humidity, amount of exercise, reproductive cycles, disease and milk production.
potential energy energy that is stored in an object due to its position and other factors, such as its mass, electric charge and internal stresses
gravitational potential energy amount of energy that an object has stored due to its position in a gravitational field
We now know that the man flying through the air in Figure 7.6 has kinetic energy as he is in motion. We even know that the amount of kinetic energy he has depends on his mass and speed. But what do we know about the man standing on top of the mountain?
The observer standing on top of the mountain has stored energy due to his position high above the valley below. This type of energy is called gravitational potential energy. Potential energy is energy that is stored in an object due to its composition or position. Since the man who has jumped is also above the surface of Earth, he has some gravitational potential energy as well.

7.6 Forms of energy do not exist in isolation: a man moving through the air high above the ground has both kinetic energy and gravitational potential energy, while a man standing on top of a mountain has more gravitational potential energy and less kinetic energy than the other man. Both men still have chemical energy and thermal energy; however, they aren't as relevant in this example.
Gravitational potential energy (GPE, or Ep in equations) is the amount of energy that an object has stored due to its position in a gravitational field. Similar to the observer standing on top of the mountain, anything that is positioned above the surface of Earth has the potential to fall due to the effect of gravity. Therefore, the higher an object is above the surface of Earth, the more gravitational potential energy it has.
To calculate how much gravitational potential energy an object has, we use the following formula: Ep = mgh
where Ep is the gravitational potential energy, measured in joules (J); m is the mass of the object, measured in kilograms (kg); g is the gravitational acceleration experienced by the object due to the strength of Earth's gravitational field (9.8 metres per second per second, or m/s/s or m s−2); and h is the height of the object above the surface of Earth, measured in metres (m).
From this formula, the amount of gravitational potential energy an object has depends on its mass and height above the ground. Say you wanted to lift an object from height A to height B. What would be the difference between the GPE at both heights?
The change in something is represented by the symbol Δ. If you are looking at the change in velocity, it would be written as Δv. So the change in GPE (ΔEp) would equal the GPE at height B (EpB) minus the GPE at height A (EpA)

Figure 7.7 As you ride on a roller coaster, the amount of gravitational potential energy that you have is constantly changing, as is your kinetic energy.
Note that when an object is raised, its GPE increases. When it falls or is lowered, the GPE decreases. We subtract GPE at the lower height from GPE at the higher one. We can take this further and substitute into the formula for GPE:
You will learn in the next chapter that F = ma, where force is equal to mass × acceleration. In this case the acceleration, a, is due to gravity, so we can say F = mg. Substituting for mg into our formula, we get:
Now, moving the object from height A to height B is the same as moving an object a certain distance vertically, so hB − hA = s, where s is the displacement of the object. This means that:
ΔEp = Fs
We know from earlier in this chapter that W = Fs, so therefore:
ΔEp = W
This means that the change in GPE between two heights is equal to the amount of work done to move an object vertically.
These formulas tell us two things about GPE. Firstly, since an object's mass and the value of g near Earth's surface are constants, any change in its GPE is proportional only to its height at the start and end, and doesn't depend on the path it takes between them.
Secondly, for the same two heights, the amount of GPE is the same when going from higher to lower heights, as it is when going up. However, as we saw with the object being lifted up, the GPE increases when going up, meaning energy is transferred to the object, and decreases going down, meaning energy is transferred from the object.
Worked example 7.3
A diver has a mass of 60 kg and is standing on a diving board.
a) If the diving board is 10 m above the ground, what is the diver's gravitational potential energy?
b) When the diver is 0 m above the ground, what is their gravitational potential energy?
c) What is the work done (W = ΔEp) on the diver from beginning to end of the 10 m dive?
d) What is the work done (W = ΔEp) on the diver when they climb from 0 m back up the steps to the diving board 10 m above the ground?
a) GPE at 10 m above ground
m = 60 kg, h = 10 m, g = 9.8 m s−2
Ep = mgh
Ep = 60 kg × 9.8 m s−2 × 10 m
Ep = 5880 J = 5.88 kJ
b) GPE at 0 m above ground
Ep = 60 kg × 9.8 m s−2 × 0 m
Ep = 0 J
c) Work done to dive 10 m
W = ΔEp
W = 5.88 kJ – 0 J
W = 5.88 J

Figure 7.8 A diver waiting to dive has gravitational potential energy due to their position relative to Earth's surface.
List the relevant data that have been provided. Recall the definition of gravitational potential energy and the formula. Substitute the relevant data into the formula. Solve the problem, giving an answer with appropriate units.
At h = 0 m, the gravitational potential energy is 0 J.
Work done is the change in GPE from 10 m to 0 m, which we know from the answers to a and b
d) Work done to climb back up to the board
W = 5.88 kJ
Although the diver climbs back up the stairs rather than reversing their dive, the change in GPE depends only on the change in height, not on the path taken. So the change in GPE, and therefore the work done on the diver, is the same as for the dive. That is, the answer is the same as for part c
Try this 7.2 energy skate park
Visit the 'Energy Skate Park' on the PhET website. Investigate what happens when you start skating from the top of the ramp. Activate the pie chart and look at how the energy changes as you move up and down the ramp. Find out the impact of changing the level of friction the board experiences on the ramp. And what about the impact of mass? Look at the energy graph by clicking on the + symbol. What do you notice about the total energy? When is potential energy highest? Kinetic energy highest? And thermal energy highest?
Enjoy playing and learning at the same time! Summarise what you find out.
In a powered aircraft, the energy required to give sufficient lift to oppose the weight of the plane and achieve lift-off is provided by the thrust force produced by the engine. The thrust force also opposes the drag (air resistance) during the flight, so the plane can maintain its altitude for a long time. A glider, on the other hand, is a special kind of aircraft that has no engine. In order for a glider to fly, it must generate enough lift to oppose its weight (force due to gravitational acceleration). As the glider moves through the air, it also generates drag due to air resistance. If a glider has no engine, it cannot produce the thrust required to overcome the effects of air resistance and gravity. How then are gliders able to stay aloft for hours at a time?


Research gliders to answer the following questions.
1. How do gliders gain potential energy?
2. How does a glider generate the velocity needed for flight?
3. Explain how some gliders can stay aloft for hours despite their constant descent.
Aim
To investigate the effect of height on the energy of a falling object
Hypothesis
Develop a hypothesis about the effect of height on the energy of a falling object.
Materials
• projectile ramp
• ball bearings
• paper cup
Method
1. Copy the results table below into your science book.
• scissors • ruler
• balance
Be careful
Loose ball bearings can be a slip hazard.
2. Cut a square section out of the side of your cup, larger than the diameter of your ball bearing.
3. Measure the mass of the paper cup in kilograms using a balance and record in the results table.
4. Set up equipment as shown in the diagram, ensuring that the cup is placed at the end of the ramp and the ball bearing in the groove of the projectile ramp's track.
5. Select an initial release height and record it, in metres, in the results table.
6. Place ball bearing at the selected height and release.
7. Measure the displacement of the cup using a ruler and record, in metres, in the results table.
8. Repeat steps 6–7 twice more, recording data in the results table.
9. Repeat steps 6–8 for two additional heights.
10. Calculate the average displacement for each release height and record it in the results table.
11. Calculate the gravitational potential energy of the ball bearing and record your results, in joules, in the results table.
12. Calculate the work done on the cup to displace it and record your results, in joules, in the results table.
Results
Table showing the height of the falling object and the distance the cup was displaced
Distance the cup was displaced (m)GPE of ball bearing (J)
Trial 1Trial 2Trial 3Average EP= mgh W = Fs Practical 7.1
Work done to displace the cup (J)
Discussion: Analysis
1. What happens to the cup when it is struck by the ball bearing?
2. How does the displacement of the cup change when the release height is increased?
3. Explain why the release height affects the displacement of the cup. Ensure that you use the following terms in your answer: gravitational potential energy, force on cup, work done to displace cup.
Conclusion
1. Make a claim about height and energy based on this experiment.
2. Support the statement using the data you gathered.
3. State whether your hypothesis was supported or not supported by the data you gathered.
Just as an object can have stored energy due to its position, it can also have stored energy due to its shape. Elastic potential energy (EPE) is the energy stored in an object due to its shape, and usually results from the object either being compressed or stretched. When stretched or compressed, some materials store more energy than others.
To calculate the amount of elastic potential energy an object has, we use this formula:
Ee = 1 2 kx2
where Ee is the elastic potential energy, measured in joules (J); k is the elasticity constant, which is an indication of the object's stiffness and is measured in newtons per metre (N/m or N m–1); and x is the linear length that it has been expanded by or compressed to, relative to its resting ('equilibrium') position, measured in metres (m). This change in length is also called displacement, but in elasticity we generally use the symbol x rather than s.
This formula shows us that the amount of elastic potential energy possessed by an object depends on the elasticity of the material, as well as the displacement of the material due to compression or stretching. Again, some force (F) is needed to stretch or compress the material, and there is a displacement (x, or s); thus, work is being done. The amount of work done by the spring is equal to the change in elastic potential energy:
W = ΔEe
Worked example 7.4
A bow has an elasticity constant of 2000 N m−1. It is stretched by 30 cm. How much elastic potential energy does the bow store?
k = 2000 N m−1, x = 0.30 mList the relevant data that have been provided, converting to the units required by the formula.
Ee = 1 2 kx2 Recall the definition of elastic potential energy and the formula.
Ee = 1 2 × (2000 N m−1) × (0.30 m) 2 Substitute the relevant data into the formula.
Ee = 90 J

Solve the problem, giving an answer with appropriate units.
Recreate this 'paper spinner' in four simple steps.
1. Find a button with a diameter of at least 5 cm (a piece of cardboard with two small holes about 1 cm apart will also work).
2. Thread 60−80 cm of string through two of the holes in the button and tie it off, forming a loop like the one shown in Figure 7.13.

Figure 7.13 A paper spinner or 'woer woer' uses elastic potential energy to create motion and sound.
3. Hold onto the strings and position the button in the middle. Then, using your wrists, swing the button in a vertical loop to wind up your spinner.
4. Release the potential energy with alternating high and low tensions in the string (change by how much the string is stretched by moving your hands closer and pulling them further apart).
1. Describe what the word 'potential' in potential energy means.
2. Other than gravitational and elastic, state two other forms of potential energy and give an example of each.
3. A gymnast on a balance beam has a weight of 500 N. If the beam is 1.25 m above the ground, calculate her gravitational potential energy.
7.14 What is the gravitational potential energy of a gymnast?
Try this 7.4
Create an origami frog to demonstrate the conversion of elastic potential energy to kinetic energy and gravitational potential energy. You will need origami paper and optionally a ruler.
Instructions
1. Use the following steps to create your own jumping frog.
2. Press down on your frog to make it jump and record both the height and distance it jumped.
3. Explore ways to change the amount of energy your frog has so it can jump different heights and/or distances.
Questions
1. Where does the energy that enables your frog to move come from?
2. Complete the illustration below by indicating the form of energy (kinetic, gravitational potential or elastic potential) possessed by the frog at different stages of its jump.

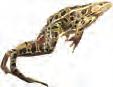
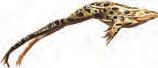
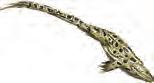


Section 7.1 review
Go online to access the interactive section review and more!
Section 7.1 questions
Remembering
1. Define the term 'energy'.
2. Recall what kinetic energy is.
3. Name three everyday objects that have elastic potential energy.
Understanding
Teachers can assign tasks and track results
4. Calculate the displacement of a table tennis ball hit with a constant force of 333 N by a table tennis player who does 100 J of work while hitting the ball.
5. Demonstrate that the change in GPE between two heights is equal to the amount of work done to move an object vertically between them, using the formula W = ΔEp.
Applying
6. Describe the forms of energy possessed by the roller coaster car below at points a, b, c and d. Describe any energy transformations taking place, noting if a form is increasing or decreasing, or is at a maximum or a minimum. Compare the amount of each form of energy at point d to that at point a.
7. Classify the following as possessing either kinetic energy or potential energy.
a) the moving (or spinning) blades in a blender
b) books sitting on a bookshelf
c) hot water in a kettle
d) the sound coming from a radio
e) a cheeseburger
Analysing
8. Compare gravitational and elastic potential energy and their respective formulas.
9. Organise the following items from having the most to the least amount of gravitational potential energy.
A. an apple hanging in a tall tree
B. an apple lying under a tree
C. an apple in a fruit bowl on a table.
Evaluating
10. In the case of a person pushing against a rock wall, justify why no work is being done. Online quiz
Learning goals
At the end of this section, I will be able to:
1. Define the Law of Conservation of Energy.
2. Calculate the efficiency of energy output.
3. Describe energy transfers and transformations.
4. Draw and interpret Sankey diagrams, illustrating energy transfers.
Energy is constantly changing from one form to another. For example, the fabulous lights and sounds produced by fireworks are the result of a series of energy transformations. When a firework explodes, thermal energy, in the form of a lit fuse, in addition to chemical potential energy, is transformed into heat, light and sound energy, as well as kinetic and gravitational potential energy.

Not all energy transformations are this complex. For example, a toaster transforms electrical energy to thermal energy, which toasts the bread by radiation. Regardless of how simple or complex the transformations are, energy is conserved in all energy conversions. In other words, all conversions are governed by the Law of Conservation of Energy in that energy can neither be created nor destroyed; it can only be converted from one form of energy to another, or transferred between objects and substances.
input energy = output energy
that
can be neither created nor destroyed, only converted from one form of energy to another or transferred between objects
Incandescent light globes can be quite inefficient.
useful energy the output energy that a machine is designed to produce; an efficient machine will maximise the useful energy it produces
The optimisation of many machines and devices involves ensuring that as much of the input energy is transferred or transformed to the output energy that is required, making it as efficient as possible, meaning it does what it is supposed to with minimum effort and wastage. Consider the incandescent light globe in Figure 7.16. Only about 10% of the total electrical energy input is transformed into useful visible light energy. The remaining 90% is transformed into thermal energy.
The main use of a light globe is to produce light, so we call this useful energy. The thermal energy produced is referred to as wasted energy. Given the high proportion of wasted energy (90%) in this scenario, we can say that the energy transformation is inefficient.
Achieving a 100% efficient energy conversion (when input energy = useful energy) is extremely unlikely, especially for machines that do work, because energy in some form is almost always lost to the system. Consider the ball being dropped from a height onto a concrete surface in Figure 7.17. At its maximum height, the ball has a large amount of gravitational potential energy. When the ball is dropped, this gravitational potential energy is converted to kinetic energy, which reaches a maximum just before the ball hits the ground. As the ball hits the ground, the kinetic energy is converted into elastic potential energy. This is converted back into kinetic energy as the ball bounces up again. If this system was 100% efficient, the ball would bounce back up to its starting height and have the same amount of gravitational potential energy as before being dropped. We know that this is not the case because with each bounce the ball reaches a lower maximum height until eventually the ball comes to a stop.
Figure 7.17 A soccer ball released from a height, h, will convert GPE to KE as it falls toward Earth. At the point of impact, most of the kinetic energy is converted to EPE, which causes the ball to bounce back up, but some kinetic energy is 'lost' as it is converted to sound energy and thermal energy.
Let's look at how energy is lost from this system. First, as the ball is falling towards the ground, it is encountering air particles. Contact with these particles results in friction and heat. Thus, energy is lost as heat to the surrounding air particles. When the ball bounces, it creates a sound and there is also friction within the material of the ball and the air it contains as it is compressed and returns to its shape during the bounce. In addition, there is friction between the ball and the ground. Therefore, each successive bounce of the ball has less energy than the preceding bounce. As a result, the ball slows down, before coming to a stop when all the energy it initially possessed is lost to the system.
You may recall from earlier years that energy transformations can be represented in a flow diagram (see Figure 7.18). On the left-hand side of the flow diagram are the energy inputs. On the right-hand side are the energy outputs. Waste energy would be included as an energy output. A brief description of how the machine works may be placed between them, and arrows are added to show the flow of energy.
For example, Figure 7.19 shows the energy flow diagram for a candle that has been lit.
Some energy flow diagrams may have intermediate steps involving another form of energy. For example, a battery-powered torch has a more complex energy flow diagram (see Figure 7.20). Imagine the complexity of an energy flow diagram representing the bouncing ball scenario!
There are many sports in which performance depends on the interaction of a human and an object; for example, a cricketer's technique when bowling or batting, or the technique used when throwing or kicking a football. In individual sport, it might be the interaction of a pole vaulter and the pole or of an archer and the bow. Performance in these sports requires peak energy efficiency in the energy transfer processes.
Draw an energy flow diagram and explain how energy is optimally transferred between:
a) a pole and a pole vaulter b) an archer and an arrow.
Figure 7.21 Athletic performance can be improved with efficient energy transfer.

Did you know? 7.1
Some Aboriginal and Torres Strait Islander Peoples use earth ovens as a method of transferring heat energy to cook food by conduction, convection and radiation. A hole is made in the ground and lined with hot rocks heated from a fire. The food is then placed on the hot rocks and often covered with leaves and more rocks to insulate the heat, creating an oven environment.
Like all ovens, the earth oven is not 100% efficient; energy is lost from the cooking process as heat and light to the surroundings as well as contributing to other chemical reactions. However, earth is an excellent insulator due to pockets of air in the soil. This makes earth ovens an energy-efficient method of cooking food.
The energy efficiency of a machine or system is a measure of how good it is at converting the input energy to useful energy. The amount of useful energy put out as a percentage of input energy is used to give the machine an efficiency rating.
The formula used to calculate the efficiency rating of a machine is: Efficiency (%) = useful output energy (J) input energy (J) × 100
Worked example 7.5
energy efficiency of a kettle
A kettle uses 261 500 J of electrical energy to heat 500 mL of water. If the thermal energy of the water is increased by 209 200 J, calculate the efficiency of the kettle.
Working
Useful output energy = 209 200 J
Input energy = 261 500 J
Efficiency (%) = useful output energy input energy × 100
Efficiency (%) = 209 200 261 500 × 100
Efficiency = 80%
Explanation
List the relevant data that have been provided.
Recall the definition of energy efficiency and the formula.
Substitute the relevant data into the formula.
Solve the problem, giving an answer with appropriate units.
Worked example 7.6
energy efficiency of muscles
A girl runs upstairs and uses up 4000 J of energy from food she has eaten. If this energy is used to output 1000 J of gravitational potential energy, calculate the efficiency of her muscles.
Working
Useful output energy = 1000 J
Input energy = 4000 J
Efficiency (%) = useful output energy input energy × 100
Efficiency (%) = 1000 4000 × 100
Efficiency = 25%
The other 75% would be waste energy, lost mainly as thermal energy as she climbs the stairs.
Try this 7.5
Calculating energy efficiency
Explanation
List the relevant data that have been provided.
Recall the definition of energy efficiency and the formula.
Substitute the relevant data into the formula.
Solve the problem, giving an answer with appropriate units.
Calculate the energy efficiency of each of the globes shown. State which globe is no longer recommended for household use and justify your choice.
Scientists and engineers continually strive to make smart devices such as smartphones more energy efficient. That is, when you charge your smart device, scientists want to make sure the battery lasts longer, and the chemical energy that is being used is efficiently performing the tasks required of the device.
In fact, researchers in the United Kingdom have developed a more energy-efficient alternative to transmit data than using Bluetooth. They have found a way of connecting devices and improving battery life that is so energy efficient it can be applied to wearable devices. Maybe in the future you will be able to exchange phone numbers just by shaking hands!
See: What do you see scientists and engineers doing to make smart devices more energy efficient?
Think: What thoughts come to mind as you consider these strategies?
Wonder: Given the progress towards energy-efficient smart devices, what do you wonder about the future of energy-efficient smart devices?
The See, think, wonder thinking routine was developed by Project Zero, a research centre at the Harvard Graduate School of Education.
Aim
To investigate which type of bouncy ball is most energy efficient
Materials
• a range of bouncy balls
• metre rulers
Method
Design an experiment that will test the rebound height of a range of bouncy balls. In a group, discuss how you will carry out this experiment, and write a step-by-step method.
Results
1. Draw a results table for your experiment.
2. Produce a suitable graph for your experiment.
Discussion: Analysis
1. Using the energy efficiency equation, calculate the efficiency of each type of ball. Use the drop height and the rebound height in your calculations.
HINT: Assume that the energy used to compress the ball is proportional to the drop height, and that the energy released by decompressing the ball is proportional to the bounce height.
Discussion: Evaluation
1. Identify sources of error in your experiment.
2. Suggest how your experiment may be improved.
3. Describe the effect of the surface on the efficiency of the bouncing ball.
Quick check 7.4
1. Define 'energy efficiency'.
2. Copy and complete the following table and give an example of the useful energy and waste energy produced by each device.
Device
Light globe
Car
Lawnmower
Useful energy outputWaste energy output
3. A light globe uses 3000 J of electrical energy. Of this, 600 J is transformed into light energy and 2400 J is transformed into thermal energy. Calculate the energy efficiency of this globe.
Try this 7.6 energy forms and changes
Visit the 'Energy Forms and Changes' page on the PhET website. Investigate the systems interactive. Here, by revealing the energy symbols, you can manipulate systems and see the transformation of different forms of energy and identify what is useful and what is wasted energy. Have a play and summarise what you learn.
Sankey diagrams
We have seen how flow diagrams show the energy transfers and transformations within a system. But how can we see the efficiency of the energy system in the same diagram? A Sankey diagram is a flow chart that quantitatively represents the flow of energy through a system. A Sankey diagram has an arrow that starts from a wide base, which represents the energy input into a system. The arrow then branches off into two or more arrows, the thickness of which is directly proportional to the amount of output energy in that form. You can see in Figure 7.23a that the horizontal output arrow represents the useful output energy, while the downwards arrow represents the wasted output energy.
Now look at Figure 7.23b, which shows a Sankey diagram for an incandescent light globe where only 10% of output energy is in the useful form of light. The Sankey diagram shows that most of the electrical energy is transformed into thermal energy (thicker arrow), which is wasted energy.
Remember the Law of Conservation of Energy: input energy will be equal to the output energy, both useful and wasted.
Worked example 7.7
drawing a sankey diagram
Draw the Sankey diagram of an energy-efficient light globe with an input energy of 10 J, an output energy of 8 J in the form of light and wasted output of 2 J in the form of heat.
Explanation
The height of the box represents the amount of energy that is put in. In this case it is 10 J, so it should be 10 units high. Note that the length of the box does not matter.
The height of the next box represents the amount of useful energy. In this case, it is 8 units high.
The height of the final box represents the amount of wasted energy. In this case, it is 2 units high.
Rotate the wasted energy box 90° clockwise so it points down. This shows that it is wasted energy. Add arrow heads to the output boxes.
Finally, add the labels.
1. Outline the energy changes that take place when you jump on a trampoline without putting any muscular effort into the landing or the subsequent jumps (bounce), by keeping your body and legs straight. Explain why you do not bounce back up to the same height after successive bounces.
2. Calculate the efficiency of an electric stove that has an input of 1500 J of energy and produces 200 J of light energy and 1300 J of useful thermal energy.
3. Draw a Sankey diagram for the electric stove in question 2.
Imagine the Sun's electromagnetic energy travelling to Earth. When 100 units of energy released from the Sun reach Earth's atmosphere, energy is absorbed (30 units), reflected (30 units) and scattered (20 units). Only 20 units make it to Earth to heat the land and oceans, and to be used by plants for photosynthesis.
a) Draw an energy flow diagram to show the energy transformations in this scenario.
b) Draw a Sankey diagram to show the efficiency of the energy transformations.
c) Calculate the efficiency.
Section 7.2 questions
Remembering
1. Define 'useful energy'.
2. Recall the energy transformations that occur when fireworks explode.
3. Consider how hot your charger gets when you charge your laptop.
a) List the forms of energy that are involved inside the charger.
b) Identify the useful energy and the wasted energy.
4. State what usually happens to wasted energy.
Understanding
5. An organism uses 500 J of chemical potential energy stored in its body to produce 125 J of kinetic energy so that it can climb a tree. Calculate the energy efficiency of this process.
6. A kettle has an energy efficiency of 89%. Calculate how much electrical energy is required to produce 1068 J of thermal energy.
7. The following Sankey diagram is for a light globe.
Energy input = 20 J
Useful energy output = 4 J
Waste energy output = 16 J
a) Identify the useful energy output that the light globe is designed to produce.
b) Recall the effect that the wasted energy has on the surrounding air.
c) Calculate the efficiency of this light globe.
Applying
8. A car has an energy efficiency of 35%. Explain what this means in terms of energy.
9. Explain what the term 'energy efficiency' means.
10. Explain how the Law of Conservation of Energy still applies to a system despite energy being 'lost' during a transformation.
11. On cold days, some of the heat transferred from a hot car engine is used to warm the air inside the car. Describe the effect that this has on the overall efficiency of the car engine.
Analysing
12. Organise the following processes from the highest amount of energy to the lowest:
• falling raindrop: 85 × 10−6 J
• cosmic ray: 1.6 × 10⁻⁹ J
• car travelling on the Princes Freeway: 4.00 × 10⁵ J
• strong earthquake: 1.0 × 10¹⁶ J
• falling snowflake: 6.50 × 10⁻⁷ J
Evaluating
13. Incandescent light globes convert about 10% of their input energy into light energy, whereas LEDs (light-emitting diodes) convert 60% of their input energy into light energy. Determine which type of light globe is more energy efficient.
14. As Emerson slides down a playground slide, the amount of kinetic energy that he gains is less than the amount of gravitational potential energy that he loses.
a) Predict where the missing energy goes.
b) Propose what Emerson can do to minimise the amount of wasted energy.

At the end of this section, I will be able to:
1. Describe examples of renewable and non-renewable sources of energy.
2. Compare the efficiency of electricity generation from a number of sources.
Sources of energy used on Earth can be classified according to whether they can be replaced as fast or faster than they are used.
• Sources that are replaceable are called renewable sources of energy and include wind, solar, hydroelectric and geothermal.
• Sources of energy that cannot be replaced are called non-renewable and a typical example is fossil fuels, which include coal, oil and natural gas.
Transferring the energy provided by renewable and non-renewable sources to useable forms of energy requires various methods of energy transformation.
• Methods of energy production that allow natural resources to be maintained at a constant level without jeopardising future supply or the environment are called sustainable
• Methods that are not sustainable include mining substances or burning substances that release greenhouse gases into the atmosphere.
These methods have a large impact on the local environment, as well as the potential to accelerate climate change globally.

The Victorian Government has developed a Zero Emissions Vehicle Roadmap, which supports the goal of reaching net zero emissions by 2050.
The Victorian Government is investing a lot of money to install new charging stations in regional Victoria, as well as key tourist sites, to accelerate the uptake of zero-emissions vehicles.
This development consolidates Victoria's progress towards innovative energy use in the transition to an electric-vehicle future.
cannot be replenished as fast as or faster than it is used fossil fuel a non-renewable energy source, such as oil, coal or natural gas, that has formed underground from plant and animal remains over millions of years sustainable practices that use natural resources responsibly so they remain at the same level, in order to support present and future generations
Coal
Fossil fuels are a non-renewable source of energy. Most deposits of coal formed 300 million years ago during the Carboniferous period. This was 100 million years before the dinosaurs, when Earth was warm, wet and covered with giant forests. Eventually the forests died and layers of mud, soil and sand, which later turned into rock, covered the dead trees. Deep underground and under high temperatures and pressure, the remains of the forest trees changed into coal.
Coal is mined and then transported to a power station where it is burned to generate thermal energy and then electrical energy. As burning coal produces carbon dioxide, a greenhouse gas, there has been a lot of work to improve the efficiency of the coal combustion process. It is believed that currently only approximately 20–40% of coal actually leads directly to the generation of electricity.
The energy flow diagram for a coal-fired power station is shown in Figure 7.29.
Nuclear energy
Nuclear energy is an option for countries that have the technology to build nuclear power stations. The fuel for a nuclear reactor comes from radioactive substances, mainly uranium, which can be mined from Earth's crust. The mass of fuel required is a tiny fraction of that required to run a coalburning power station. Although the materials used in nuclear power generation are not renewable, it is unlikely that the world will ever run out of nuclear fuel as the energy released from a nuclear reaction with a very small amount of fuel is immense.
The energy flow diagram for a nuclear power station is shown in Figure 7.30.
energy produced by cosmic processes (stored in the form of radioactive atoms)
to make steam
A nuclear power station does not produce polluting greenhouse gases in its reactor. The energy released heats water, which produces steam to turn turbines and generate electricity. However, some steam (water vapour) is released from the top of nuclear stacks (towers), and water vapour itself is a greenhouse gas!
Although nuclear energy has the potential to supply the world's energy needs when fossil fuels start to run out, there are some problems with nuclear energy that need to be considered. You might remember the problems associated with nuclear energy from your investigations in Year 7.
the radioactive nucleus
Knowledge of the structure of the atom and the energy contained within the nucleus of the atom has changed over thousands of years. Today, scientists not only know about the energy holding together subatomic particles in the nuclei of atoms of different elements, but they also know how to make a nucleus more unstable so that it releases some of that energy by breaking nuclei into smaller fragments. The process of purifying a radioactive substance is called enrichment, and a common enriched nuclear fuel is the nuclear isotope, uranium-235.
The Australian Nuclear Science and Technology Organisation (ANSTO) is Australia's only nuclear facility, and it operates to produce nuclear medicines and enable scientific research, rather than to produce electricity from nuclear energy. It uses low-enriched uranium, which has just under 20% enriched uranium-235, to achieve its goals.
Wind energy is a renewable energy source. Electrical energy is generated by large wind turbines, usually built in groups called wind farms. The advantage of wind energy is that, once the wind turbine has been built, wind energy is free, non-polluting and available at night. The main disadvantage is that it depends on the availability of the wind. For this reason, the energy that wind turbines produce is intermittent and must be combined with a storage capability, such as a battery, to provide a continuous energy supply.

However, the good news is that wind turbines convert around 45% of the wind passing through the blades into electricity. This is an energy-efficient process.
The energy flow diagram for a wind turbine is shown in Figure 7.34.
Solar energy
Solar energy is a renewable energy source. Solar panels convert the light energy from sunlight directly into electrical energy and can also supply energy to heat water. The advantages of solar panels are that the energy they produce is free once the initial cost is met, and they are non-polluting to use. When solar panels are combined with storage batteries, they can provide a constant supply of energy, as the batteries store energy during the day and release it at night.
In terms of efficiency – that is, the ability of a solar panel to convert sunlight into useable electricity –the first solar cell had an efficiency of around 5%. However, after many years of research this has risen to around 20%. You may notice this is lower than the efficiency of coal, but the environmental benefits are massive!
In 2014, a team from the University of New South Wales set a new world record for solar energy efficiency by successfully converting 40.4% of available sunlight into electricity. Since then, scientists have achieved as high as 47.5%. However, they were not using commercially affordable materials.
The energy flow diagram for a solar panel is shown in Figure 7.36.
Chemical energy (storage battery)
Light energy (sunlight)
Interacts with the solar panel to make electrical energy
Electrical energy (supply)
Hydroelectric power
Hydroelectric power is generated using the gravitational potential energy of water held in dams to drive turbines that generate electricity (see Figure 7.37). The dams are designed so that the water surface is as high above the turbines and generators as possible. The water's gravitational potential energy is converted to kinetic energy by turbines at the base of the dam or well below it. These turbines turn generators that convert this kinetic energy into electrical energy.
Some countries, such as Norway, China and Brazil, are mountainous and are well suited to hydroelectric energy generation. For example, Norway generates about 95% of its energy in this way. In Victoria, hydroelectric energy accounts for approximately 7% of total energy production. Tasmania has extensive hydroelectric power generation, and Snowy Hydro 2.0 in New South Wales is a large hydroelectric project designed to help provide renewable energy into the future. The energy flow diagram for hydroelectricity generation is shown in Figure 7.37.
Explore! 7.3
efficiency of electricity generation
Renewable and non-renewable sources of energy provide the capacity to transform various energy types into useable energy, but the different sources have different energy efficiencies.
geothermal
Conduct some research to find the average energy efficiency of the following electricity sources:
• coal
• nuclear
• hydroelectricity
• gas
• solar
• wind.
Which are the most efficient and least efficient processes? Is this what you expected?

Geothermal energy is both sustainable and renewable. It is thermal energy left over from Earth's formation, as well as being produced by radioactive decay. Where Earth's crust may be fractured or thin, it is possible to drill down to find rocks hot enough to boil water. Cold water is pumped down to this hot rock. The water boils, producing steam, which is brought to the surface and used to turn a turbine and generate electrical energy.
An energy flow diagram for a geothermal energy power station is shown in Figure 7.41.
energy from Earth’s formation Water pumped into rock
energy in radioactive elements
Quick check 7.7
1. Define 'renewable energy source'.
2. Recall some different types of renewable energy.
3. Draw a flow diagram to show the energy transformations that occur while producing electricity from wind turbines.
Science as a human endeavour 7.3
renewable energy research Scientists are continuing to publish their research into renewable energy sources. Here are some examples of the amazing work happening in our world today:
• Scientists are exploring making solar cells more efficient by investigating materials that are better at capturing sunlight. For example, solar cells made from perovskite, a material known for its crystal structure, offer numerous benefits over traditional silicon-based solar cells: they are lightweight, flexible and can be applied through spraying or printing, much like ink. Additionally, producing perovskite solar cells may result in a smaller carbon footprint compared to silicon photovoltaics.

• Scientists are investigating the global potential for using floating solar photovoltaic panels. The researchers have estimated the daily electrical output of floating photovoltaics (FPV) on nearly 68 000 lakes and reservoirs worldwide by utilising available climate data specific to each location. There are many advantages to FPV. Using FPV frees up land for other uses and the water keeps the panels cooler, making them more efficient.
• Scientists have determined that a wind farm can offset the carbon emissions generated across its entire 30-year lifespan in under two years.
Generate-sort-connect-elaborate: Conservation of energy
Before completing this chapter's review questions, begin revising and connecting all of the ideas you have learned about. This is like a concept or mind-mapping activity.
1. Generate a list of terms/concepts that come to mind when you think about the topic 'Conservation of energy'. Write each term on its own Post-it note.
2. Sort your ideas according to how they are related. You might find that some terms are central to your understanding of energy – for example, the terms 'energy' and 'work'. These terms will be more central on your page, while the more specific or tangential terms sit towards the outside of the page.
3. Connect your terms by drawing lines between terms that have something in common. Explain and write in a short sentence how the ideas are connected.
4. Elaborate on any of the terms you have written by adding new ideas that expand, extend or add to your initial list. You may like to add definitions or examples.
The Generate-sort-connect-elaborate thinking routine was developed by Project Zero, a research centre at the Harvard Graduate School of Education.
Remembering
1. State the fossil fuels used to provide energy in Australia.
2. Recall approximately how many years ago coal deposits were formed.
3. State a source of energy that harnesses the gravitational potential energy of water.
Understanding
4. Describe the main reason behind switching to renewable energy sources.
5. Draw an energy flow diagram for a hydroelectric power station.
6. Distinguish between 'renewable' and 'sustainable'.
7. Explain why nuclear energy is not considered renewable.
8. Explain why each renewable source of energy is considered renewable.
Applying
9. Draw an energy flow diagram for a petrol engine car travelling at a constant speed on a flat road.
10. Suggest factors that have led to more and more individuals, communities and industries in Victoria adopting solar panels and battery storage as alternative energy sources.
11. A cyclist used 1000 kJ of energy riding to work. Of this, 250 kJ was transformed into kinetic energy to move his muscles. The other 750 kJ was transformed into thermal energy. Calculate the energy efficiency of the cyclist.
12. Explain how energy is produced using thermal energy from Earth.
Analysing
13. Explain how non-renewable energy sources such as natural gas are not sustainable for the future. Discuss their impact on the environment.
Evaluating
14. Propose one drawback of using solar energy as an energy source.
15. Propose two reasons why coal may not be suitable as a long-term energy source.
Chapter checklist
Success criteria
Linked questions
7.1I can define the terms 'energy' and 'work'. 1
7.1I can recall the forms of potential and kinetic energy. 3
7.1I can use scientific equations to make calculations. 8, 16
7.2I can define the Law of Conservation of Energy. 4, 5
7.2I can calculate the efficiency of energy output. 6, 7, 10, 14b, 15a
7.2I can describe energy transfers and transformations. 13
7.2I can draw and interpret Sankey diagrams, illustrating energy transfers.9, 14a, 15b
7.3I can describe examples of renewable and non-renewable sources of energy. 2
7.3I can compare the efficiency of electricity generation from a number of sources. 11, 12
Scorcher competition
Review questions
Remembering
1. Define the terms 'energy' and 'work'.
2. List four types of renewable energy source.
3. Name the two types or categories of energy into which all of the various forms of energy can be placed.
4. Define 'energy transfer' and 'energy transformation'.
Understanding
5. Suggest how the Law of Conservation of Energy is demonstrated using a Sankey diagram.
6. A light globe has an input of 1400 J and an output of 760 J of light energy and the remainder is lost as thermal energy. Calculate the energy efficiency of the light globe.
7. Explain what types of waste energy might be present in a ground oven used by Aboriginal and Torres Strait Islander Peoples.
Applying
8. A worker carries some timber up a staircase. The worker moves 9.6 m vertically and 22 m horizontally. If the timber weighs 45 N, calculate how much work was done.
9. A light globe uses 60 J of electrical energy to produce 3 J of light energy. Illustrate, with the use of a Sankey diagram, the amount of wasted energy and suggest what form this wasted energy will take.
10. Calculate the efficiency of a blender that converts 200 J of electrical energy to 120 J of kinetic energy and 80 J of thermal energy.
Analysing
11. Compare the energy efficiency of coal and wind as sources of energy.
12. Compare coal and solar as renewable or non-renewable sources of energy.
13. Distinguish between useful and wasted energy.
14. An electric motor attached to a crane is being used to lift a heavy weight. An input energy of 500 J is used and only 120 J is transferred to lifting the weight.
a) Draw a Sankey diagram to illustrate the energy transformation in the motor of the crane.
b) Calculate how much energy is wasted.
Evaluating
15. A ceiling fan has an input of 2400 J of electrical energy. Of this, 300 J of energy output is lost as thermal energy due to friction between metallic parts and 40 J is lost as sound energy.
a) Calculate the energy efficiency of the fan.
b) Draw a Sankey diagram for the ceiling fan.
16. A barge (a long boat with a flat bottom) is pulled down a canal by a horse walking beside the canal. If the angle of the tow rope to the direction of motion is 60°, as shown, the force exerted is 500 N, and the barge is pulled 50 m, calculate how much work the horse did in pulling the barge in the direction shown. (Hint: The component of the force in the direction of motion is given by F × cos θ.)
Data questions
Solar panels are used across Australia to convert the energy provided by sunlight into electricity. The electricity produced by a typical commercial solar panel in Victoria over a summer's day is shown in Figure 7.43. The efficiency and price of six different solar panel models are shown in Table 7.2.
Figure 7.43 The electricity produced, in kilowatt-hours, by a typical commercial solar panel in each hour of a sunny day
Table 7.2 Energy efficiency and price per square metre of different solar panel models
Applying
1. Identify the time of the day the solar panel presented in Figure 7.43 produces the most electricity.
2. Calculate how many hours per day the solar panel can produce electricity.
Analysing
3. Identify the pattern of electricity production throughout a sunny day.
4. Refer to Table 7.2 and identify the trend of the relationship between the efficiency of a solar panel and the price per square metre (i.e. how the price changes as energy efficiency changes).
Evaluating
5. Infer whether the price of a solar panel is directly proportional to the efficiency.
6. Deduce why electricity is not produced between midnight and 4 a.m. and again between 8 p.m. and midnight.
7. Predict the effect on the data in Figure 7.43 if the weather was overcast and rainy.
8. A domestic household owner in Victoria would like to install solar panels on the roof of their home. The owner would like a solar panel with an efficiency above 20% to cover 3 m2 Deduce the type of solar panel and the lowest price that the homeowner could pay for these requirements.
9. Based on the general shape of the data presented in Figure 7.43, justify why the angle at which the solar panel is oriented on a roof is important for a higher electricity production.

Have you ever thought about the amount of carbon emissions produced when you perform an internet search on your smartphone or tablet? Experts have estimated that a simple search consumes enough energy to release 0.2 grams of carbon dioxide into the atmosphere. The number might seem small, but imagine the emission from more than 15 billion connected devices today!
Governments worldwide invest in renewable and sustainable energy sources because fossil fuel sources are finite. As the world's population grows, greenhouse gases are being released into the atmosphere at an alarming rate. Now, more than ever, it is important that we all do our best to change our current practices into more sustainable ones.
There are many ways to demonstrate this message to the world; one of the most powerful involves storytelling. Good stories have the power to bring us together and encourage us to understand and empathise with many causes. Recently, digital storytelling has been used by many professionals (including famous social media influencers) to tell (or sell) their ideas, opinions or products.


Design and create a 60-second infomercial to be shared in your local area that promotes the use of renewable energy.
In teams (maximum of four people), use the digital storytelling process (described on the following page) to create a 60-second video to answer a specific scenario. It is recommended that you and your colleagues think about assigning roles and tasks for this project (e.g. videographer, researcher, movie editor) so everyone has the chance to develop and use different skills.
Your local council has just informed its residents that they wish to invest in securing the energy needs for its residents for the next 20 years. One local company, Coal Co., has lobbied heavily for funds to expand an old open-cut coal mine in the region. Another company, a new start-up business, Argus Renewables, has hired your team to create a 60-second video to gain support from residents for the development of a large solar farm in the region.
• mobile device with camera to record footage
• laptop or tablet with a video editor
• paper to create a storyboard
• your imagination!
1. Discuss within your group who your target audience is going to be. Include discussion about your local area.
2. Conduct some research on advantages and disadvantages of renewable energy compared with non-renewable energy that should be communicated to your audience through the infomercial and make a table to rank them in order of importance for your project. You can use Table 7.3 as a guide.
Comparison between renewable and non-renewable energy
Advantages
Disadvantages
Rank of importanceComments when considering target audience
Table 7.3 Advantages and disadvantages of renewable energy compared with non-renewable energy
3. Conduct some research on the population of your local area. Discuss and then list important information about your target audience. Considering this information about your target audience, add comments to your advantages and disadvantages research.
4. As a group, decide on the key issues you are going to present in your infomercial. Then write the script for the video, assign roles to individual members and reflect on what is required to achieve the goal.
5. Design a storyboard to put the script together with a visual representation.
6. Create the video by recording the storyboard sections. As a group, gather short clips and images, and/or record your own video using a mobile device.
7. Put it all together using video-editing tools such as iMovie, Movie Maker or Adobe Spark (recommended) to put your ideas into video format.
8. In your group, discuss the challenges you encountered throughout this project. List the strategies or actions that allowed you to overcome each challenge.
9. Evaluate the effectiveness of your infomercial by sharing it with your target audience.
10. Create a range of evaluative questions to use to gauge the success of your infomercial. Show your infomercial to a target audience and use the questions to test its effectiveness.

Introduction
Earth and everything on it are constantly moving. In this chapter, we will continue our exploration of the domain of physics and learn how to describe motion scientifically. We will review the concepts of distance, time, speed, force, velocity, displacement, acceleration and mass, and discover how to quantify the relationships between them mathematically and display them graphically. To change an object's motion, a net force is required. Sir Isaac Newton's three laws of motion provide the foundation for analysing the movement of objects and the forces that are acting on them.
Is governed by:
Section 8.1
Section 8.2
Section 8.3
• distance
• displacement
• speed (average and instantaneous)
• velocity (average and instantaneous)
• acceleration. Can be described by:
Can be visualised by:
• distance–time graphs
• displacement–time graphs
• velocity–time graphs.
• Newton’s first law of motion: inertia
• Newton’s second law of motion: F = ma
• Newton’s third law of motion: Every action has an equal and opposite reaction.
Newton's laws of motion can be used to quantitatively analyse the relationship between force, mass and acceleration of objects (VC2S10U17)
• investigating a moving object and using mathematical representations, including graphs and algebraic formulas to quantitatively determine relationships between distance, time, speed, force, acceleration and mass
• investigating how Aboriginal and/or Torres Strait Islander Peoples achieved an increase in speed and subsequent impact force using spearthrowers and bows
• modelling how a change in net force acting on an object affects its motion, and relating this to the purpose of safety features such as seatbelts, airbags and crumple zones in vehicles
• investigating the application of Newton's laws in sport and how these are applied to improve an athlete's performance or safety
• constructing an argument, supported by data, to support lower speed limits for vehicles near schools or for trucks in urban environments
• investigating how driverless vehicles apply Newton's laws of motion to brake at the right times
advances in technologies have enabled advances in science, while science has contributed to developments in technologies and engineering (VC2S10H02)
• examining how the recent use of female crash-test dummies has shown that women are at greater risk of injury in a car accident, and considering implications for changing car safety features
the use of scientific knowledge to address socio-scientific issues and shape a more sustainable future for humans and the environment may have diverse projected outcomes that affect the extent to which scientific knowledge and practices are adopted more broadly by society (VC2S10H03)
• examining statistics to compare bicycle or electric scooter injuries sustained by riders with and without helmets, and relating these to helmet-wearing requirements
Victorian Curriculum V2.0 F–10 © VCAA 2024
Glossary terms
Acceleration (a)
Average speed
Average velocity
Constant velocity
Deceleration
Displacement (s )
Distance (d )
Force (F )

Gradient
Gravity
Inertia
Instantaneous speed
Instantaneous velocity
Mass (m)
Net force
Newton's first law of motion
Newton's second law of motion
Newton's third law of motion
Origin
Speed
Stationary
Vector
Velocity (v )
Weight
At the end of this section, I will be able to:
1. Distinguish between distance and displacement.
2. Convert between units of m s–1 and km h–1
3. Calculate and distinguish between quantities of speed, velocity and acceleration.
In motion, distance refers to the length an object travels along a path. The symbol d is used to denote the distance an object has travelled, and it is measured in SI units (International System of Units) of metres (m). For example, the soccer ball in Figure 8.1 has travelled a distance of 20 metres (3 + 4 + 5 + 3 + 5).
Displacement is different to distance in that displacement is the length and direction of an object from its origin, regardless of its path. That is, an object's displacement is how far its final position is from its starting position and in what direction. Displacement is denoted by the symbol s and is measured in SI units of metres. It has both magnitude and direction, which makes displacement a vector
Looking ten times two: Melbourne in motion
Look at the image in Figure 8.2 for at least 30 seconds and let your eyes wander.
length and direction of an object from its origin, measured in metres; also used for the change in length when an object is compressed or stretched
vector a quantity having both magnitude and direction

1. List ten objects you can see in the image, or that would occur within the pictured city, that might have motion. Look at the image in Figure 8.3 again for at least 30 seconds.
2. What words could be used to describe the motion of the objects that you have listed in Question 1? What units of measurement would be used?
The Looking ten times two thinking routine was developed by Project Zero, a research centre at the Harvard Graduate School of Education.

Figure 8.3 Often a compass bearing is used to describe the direction of displacement, but simpler directions like left, right, up, down, backwards and forwards are sometimes used.
Figure 8.4 shows a scenario where the direction of travel matters. The starting point is the cross in the middle. A sailor knows they have sailed 20 kilometres (km), but they would not know where they are unless they know the direction they were sailing. Sailing 20 kilometres from the origin might mean the sailor ends up on any three of the different islands. Knowledge of direction matters!
Displacement provides different length information to that provided by distance. For example, a cat might walk 10 metres, but its displacement would be 0 metres if it had returned to its original position. Knowing an object's displacement is often more helpful in finding it than knowing the entire journey the object took to get there.
Consider a cat's journey in Figure 8.5. It walks east from point A to point B for six metres, and then west to point C for two metres. Its total distance covered is 6 m + 2 m = 8 m, but it has only displaced from its origin 6 m – 2 m = 4 m east. Distance provides information of the whole journey, while displacement gives information on the difference between the start and end positions.
Did you know? 8.1
8.5 The walk described can be represented using arrows, where the length of the arrow symbolises the magnitude, and the direction of the arrow shows the direction of motion.


Throughout history, many systems have been used to measure distance. Our metric system began during the French Revolution of the late 1700s when the French Academy of Sciences proposed the creation of a standard unit of length that could be used anywhere in the world. The meridional distance from the North Pole to the equator passing through Paris was defined as 10 000 km, and the metre was defined as one ten-millionth of this distance. Examples of the 'provisional metre' were erected on walls in Paris in 1796–1797 to inform the population of this new unit of measurement (it was provisional while final measurements of the meridian were being made). A one-metre platinum–iridium bar was produced in 1889 and kept in Paris as the international standard for the measurement. Prototype bars were made as a reference for other parts of the world. The original prototype is still displayed in France at the International Bureau of Weights and Measures, but in 1960 the definition of a metre was changed to one based on the wavelength of a particular orange light radiated by krypton-86. Then in 1983, the General Conference on Weights and Measures redefined one metre as the distance that light travels through a vacuum in 1 299 792 458 seconds.


Figure 8.6 The meridional distance, from the North Pole to the equator, passing through Paris
Worked example 8.1
Distance and displacement
A person walks four metres east and then three metres north. This can be represented in a simple diagram as follows.
1. What is the distance travelled by the person?
2. What is the displacement?
Working
1. Distance
d = 3 m + 4 m = 7 m
2. Displacement
Explanation
Add the two distances travelled to find the total distance that the person has travelled.
Use Pythagoras's theorem to find the distance from A (the starting point) to C (the end point).
Using Pythagoras's theorem, find the distance from A to C.
AC = √42 + 32 = √16 + 9 = √25 = 5 m
Use trigonometry to find the direction of travel.
Remember that you also need the direction travelled from the starting position to the final position.
We use inverse trigonometric functions to find unknown angles in right-angled triangles. Since we know the length of the opposite (O) and adjacent (A) sides in the triangle, we can use tan to solve for the angle:
Therefore,
Quick check 8.1
1. Distinguish between the terms 'distance' and 'displacement'.
2. A classmate travels between classrooms. From their initial classroom, they travel west 100 metres and then north 50 metres, where they arrive at the intended classroom.
a) Illustrate this journey in a diagram.
b) Calculate the distance travelled by the student.
c) Calculate the displacement of the student, to the nearest metre.
d) The student then travels back to the initial classroom. Calculate their displacement.
We all use words or phrases to describe how quickly something travels, or maybe even to determine how long it will take to get from one place to another. Speed is a general term for how fast something travels. It is a measure of the distance (d) travelled, in SI units of metres, divided by the amount of time (t) it took to travel that distance, in SI units of seconds. Thus, speed is commonly measured in SI units of metres per second, which can be shown as m/s, or using index notation, m s–1. Depending on the speed being observed, it is common to state speed in more appropriate units, such as kilometres per hour (km h–1), or even metres per minute (m min–1), centimetres per hour (cm h–1) or kilometres per second (km s–1).
Consider the examples of motion shown in Figure 8.7.
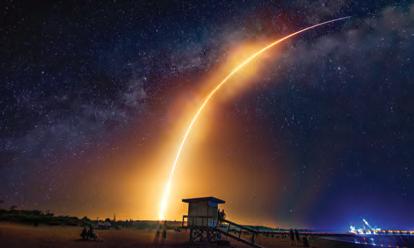
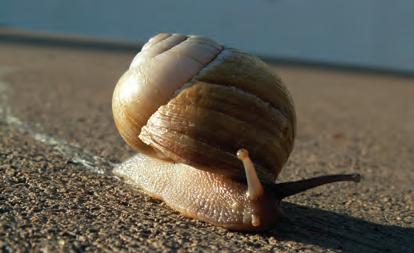
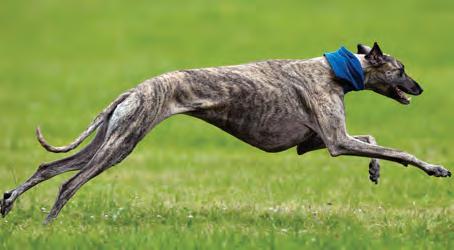

Speed is calculated as follows:
average speed (m s–1 or km h–1) = distance travelled (m or km) time taken (s or h) speed = d t
A simple way to remember this equation is by using the average speed triangle shown in Figure 8.8.
Using the average speed triangle, you can derive formulas for:
• speed = d t
• change in time t = d speed
• change in distance d = speed × t
t speed
Figure 8.8 To use the average speed triangle, cover the variable you want to calculate. If the other variables are on the same row, multiply them together. If they are on different rows, divide the top variable by the bottom variable.
Worked example 8.2
Consider two runners who are competing in a 100-metre sprint at a school athletics carnival. Runner 1 finishes in a time of 12.5 seconds. Runner 2 runs the race with an average speed of 7 m s–1
1. Who wins the race?
2. How long does it take runner 2 to cross the finish line? Round your answer to one decimal place.
1. Who wins?
d = 100 m
t = 12.5 s
speed = ?
speed =
d t = 100 m 12.5 s = 8 m s–1
Runner 1: speed = 8 m s–1
Runner 2: speed = 7 m s–1
Since runner 1 has a higher average speed, they finish before runner 2. Therefore, runner
1 wins the race.
2. Runner 2 time t = ?
speed = 7 m s–1
d = 100 m
t = d speed = 100 m 7 m s–1
= 14.3 s
It takes 14.3 seconds for runner 2 to complete the 100-metre race.
List the relevant information for runner 1.
Calculate the average speed using the formula for average speed.
Compare the average speed of each runner.
List the information you have for runner 2.
Calculate the time taken for runner 2 to complete the race using a rearranged average speed formula.
Interpret the solution, ensuring that you have correct units and decimal places.
While the SI unit for speed is m s–1, it is common to state speed in units of km h–1, particularly for vehicle movement. It will be important to convert km h–1 to m s–1 later in this chapter, to use quantities such as velocity and acceleration. To make this conversion, kilometres should be converted to metres, and hours should be converted to seconds:
1 kilometre = 1000 metres
1 hour = 3600 seconds
1 1000 3600 1 36 km h m s m s == .
Multiplying both sides by 3.6 and rearranging the sides to make 1 m s–1 the subject gives:
1 m s–1 = 3.6 km h–1
To convert m s–1 to km h–1, multiply by 3.6.
To convert km h–1 to m s–1, divide by 3.6.
× 3.6 ms−1 kmh−1
÷ 3.6
Figure 8.9 Converting m s–1 into km h–1
1. A cat and a dog are in a 60-second race. Whoever travels the furthest in 60 seconds wins the race. The cat travels at an average speed of 4 m s–1. The dog travels a total distance of 500 metres in the 60 seconds.
a) State whether the dog or cat travels further and which one wins the race.
b) Calculate the average speed of the dog, to two decimal places.
Consider the speed of a train in Victoria travelling at 120 km h–1. Convert this speed to m s–1.
Is this result what you expected? Can you think of a scenario that would be appropriate to measure speed using m s–1 instead of km h–1?
Did you know? 8.2
The light year
Light travels at a constant speed of 3 × 10⁸ m s–1 in a vacuum and almost as fast in air. The distance light travels in one year through space is one light year or 9.46 trillion kilometres. The light year is used to measure distances to stars and galaxies. For example, the brightest star in the night sky is Sirius, and it is 8.6 light years away. The nearest large galaxy is Andromeda, a mere 2.5 million light years away. Earth is 0.0000158 light years from the Sun. That means it takes eight to nine minutes for light from the Sun to reach Earth!
Speed can be described as either average speed or instantaneous speed

Average speed is the total distance an object travels divided by the time it takes to do so. The speed of the object may change as it moves. Instantaneous speed is the speed something is travelling at a given point in time.
Instantaneous speed can be determined using a radar gun or a speed detector. A speed detector calculates the average speed but over such a small timeframe that it is essentially capturing the speed at that instant, so it is called instantaneous. Another example of the measurement of instantaneous speed is a speedometer in a car.
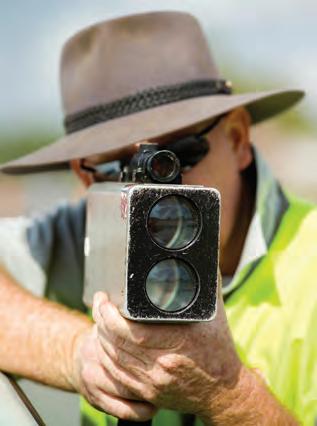
Velocity is a term used to describe how fast something travels in a particular direction. Like speed, the common units associated with velocity are metres per second (m s–1) or kilometres per hour (km h–1). However, unlike speed, velocity is a measure of the change in displacement of an object within a certain amount of time rather than a change in distance. Velocity includes more information than speed because it includes direction; it is used as a measure of how quickly something travels in a specific direction. For example, aeroplane pilots and ship captains need to know their velocity so they can accurately navigate towards their destination.

Figure 8.12 Terminal velocity is the highest attainable speed of a skydiver. It occurs when a skydiver is in freefall and the downward force of gravity is balanced by the upwards force of air friction, so they are no longer accelerating. This skydiver's terminal velocity is roughly 60 metres per second down to Earth.
Calculating velocity is similar to using the formula for speed, except distance travelled is replaced by displacement. As with speed, velocity can be classified as instantaneous velocity or average velocity
Mathematically, velocity can be described in the following ways:
average velocity (m s–1 or km h–1) = displacement (m or km) time taken (s or h)
Worked example 8.3
Average speed versus average velocity
velocity (v) change in displacement divided by change in time instantaneous velocity the velocity of an object measured at a particular moment in time average velocity the rate at which an object is displaced or changes position over a time interval
Consider the triangle in Figure 8.13 between Adelaide, Brisbane and Alice Springs. Imagine two aeroplanes that need to get from Alice Springs to Brisbane. Plane 1 travels directly to Brisbane. Plane 2 must stop in Adelaide before flying to Brisbane. It takes both planes 4.00 hours to reach Brisbane. The true bearing of Brisbane from Alice Springs is 106 degrees clockwise from north.
1. What is the average speed of each plane?
2. What is the average velocity of each plane?
3. Which plane travels faster in the air?
1. Average speed
Plane 1: speed –1965 km 4.00 h = 491 km h–1
Plane 2: speed –(1330 + 1603) km 4.00 h = 733 km h–1
2. Average velocity
Plane 1:
vav = 1965 km 4.00 h = 491 km h–1 106 degrees clockwise from north
Plane 2:
vav = 1965 km 4.00 h = 491 km h–1 106 degrees clockwise from north
3. Comparing speeds
Plane 2 is faster in the air.
Quick check 8.3
Two students, Liam and Mira, leave school to meet at the local coffee shop for a hot chocolate after school. Liam decides to jog to the coffee shop, but also stops at a flower shop along the way. Mira decides to walk from school directly to the coffee shop. They arrive at the coffee shop at the same time, 30 minutes after they leave school. Use the diagram to answer the following questions.
1. Calculate how much further Liam travels than Mira.
2. If it takes them both 30 minutes to reach the coffee shop, calculate:
a) Mira's average speed
b) Liam's average speed c) their average velocities.
For average speed, use this formula:
speed = d t
For average velocity, use this formula: vav = s t
The plane with the greater average speed travels faster as it covers more ground in the same amount of time.
Acceleration describes the situation when an object speeds up (accelerates) or slows down (decelerates). Acceleration (a) is defined as the change in velocity divided by time. For instance, an object travelling with a velocity of 5 metres per second north starts accelerating by 1 metre per second each second So, after 1 second its velocity is 6 metres per second north; after 2 seconds its velocity is 7 metres per second north. A shorter way of saying this is that it is accelerating at 1 metre per second per second. This SI unit of acceleration can be abbreviated to m/s/s, or using index notation, m s–2 . Think of s–1 as meaning 'per second' and s–2 as meaning 'per second per second'.
Just as velocity provides directional information, acceleration provides directional information too. So acceleration can be given as, for example, '1 m s−2 north' (or up, down, left, right, etc.).
Consider a stationary bus at a traffic light; we would say that it has an initial velocity of 0 km h–1
Imagine that when the light turns green the bus 'speeds up' to 40 km h–1 in the next five seconds. This change in velocity means that the bus has an acceleration. Similarly, if the bus was moving and put on the brakes to 'slow down', this is known as deceleration or negative acceleration. If the bus is travelling at a constant velocity, that is, it is not speeding up, slowing down or changing direction, its acceleration is zero. That is, there is zero change in its velocity over that time.
Acceleration can be calculated as follows:
acceleration change in time taken final i velocity velocity n nitial time taken velocity acceleration change in time taken final i velocity velocity n nitial time taken velocity a vv t 21
Using the acceleration triangle in Figure 8.14 is another helpful way to remember the formula for acceleration.
Using this acceleration triangle, you can derive formulas for:
• acceleration a vv t 21
• time taken t vv a 21
• change in velocity v2 – v1 = a × t.
Worked example 8.4
Consider the motion of a dirt bike.
1. If it speeds up from rest to 54 km h–1 in a straight line in 3.0 seconds, calculate the acceleration.
2. If that same bike travelling at 54 km h–1 comes to a stop in a straight line within 5.0 seconds, what is the acceleration?
3. If better brakes were installed on the bike, it could decelerate at a quicker rate of 10 m s–2. Calculate how long it would take to stop if it was initially travelling at a speed of 72 km h–1
stationary not moving deceleration change in velocity of an object over time when it is slowing down constant velocity when an object is travelling at the same speed without changing direction
1. Acceleration
v1 = 0 m s–1
v2 = 54 km h–1 = 15 m s–1
t = 3.0 s
a = ?
Figure 8.14 To use the acceleration triangle, cover the variable you want to calculate. If the other variables are on the same row, multiply them together. If they are on different rows, divide the top variable by the bottom variable.

List the information you have. Since the bike begins at rest, the initial velocity is zero.
Recall that to convert from km h–1 to m s–1 we divide by 3.6.
EXTENSION WORKSHEET Scalar and vector quantities DOC
a = v2 – v1 t = (15 – 0) m s–1 3.0 s = 5.0 m s–2
The bike accelerates (speeds up) at a rate of 5.0 m s–2 (5 metres per second, every second) in the direction of travel.
2. Negative acceleration (deceleration)
v1 = 54 km h–1 = 15 m s–1
v2 = 0 m s–1
t = 5.0 s
a = ?
a = v2 – v1 t = (0 – 15) m s–1 5.0 s = –3.0 m s–2
Since there is a negative acceleration, the bike is decelerating at a rate of 3.0 m s–2
3. Faster stopping a = –10 m s–2
v1 = 72 km h–1 = 20 m s–1
v2 = 0 m s–1
t = ?
Calculate using the acceleration formula by substituting in all the known values.
Interpret the answer.
List the information you have. In this example, the bike has an initial velocity of 54 km h–1 and a final velocity of 0 km h–1
Substitute the known values.
Interpret the solution and remember to include correct units.
List the known information. –10 m s–2 = (0 – 20) m s–1 t
t = –20 m s–1 –10 m s–2 = 2.0 s
It takes the bike 2.0 seconds to decelerate from 72 km h–1 to rest.
Try this 8.2 Car acceleration
Substitute the values into the acceleration formula.
Rearrange so that the unknown is the subject of the equation.
Interpret the solution.
Next time you are in a car and travelling in a straight line, use the stopwatch on your phone to time the change in speed. Get the driver to read the speedometer to capture the instantaneous speed. Calculate the acceleration of the car under different circumstances using the formula for average acceleration in the following table. Remember not to distract the driver when doing this.
TestInitial velocityFinal velocityTime takenAcceleration
Example 0 km h–1 = 0 m s–1 10 km h–1 = 2.8 m s–1 (divide by 3.6 to convert)
5 s a = (2.8 – 0) m s–1 5 s = 0.56 m s–2 1 2 3
1. Define the terms 'acceleration', 'deceleration' and 'constant velocity'.
2. An object increases its velocity from 5.2 m s–1 to 7.7 m s–1 in 4 seconds.
a) Calculate the acceleration of the object.
b) Assume that the object could decelerate at a rate of 1.5 m s–2 Calculate the time it would take for the object to stop if it was initially travelling at a velocity of 10 m s–1. Round your answer to two decimal places.
It might be surprising to learn that prior to 1967 some roads in Australia had no speed limit at all! Over the decades since, road speed limits have been installed and updated to improve the road safety of drivers and pedestrians. In the 1980s, the maximum speed limit in some built-up areas such as school zones was decreased to 40 km h–1, and there are proposals to decrease this further to 30 km h–1, as is common in some other countries in the world.
Explore the National Road Safety Week website as a starting point to gather some data. Construct an argument, supported by data, for a campaign to reduce speed limits in school zones from 40 km h–1 to 30 km h–1
Aim
To investigate the effect of ramp height on the average speed of a crash trolley or model car
Hypothesis
Develop a hypothesis by predicting how a change to the height of the ramp will affect the average speed of the model car.
Materials
• ramp at least 90 cm long
• stopwatch
• metre ruler
Practical 8.1 continued …
• books or blocks that can be used to make a ramp
• crash trolley or model car
Method
Part 1: Prepare the results table
1. Copy the results table into your science book.
2. Identify the independent variable and state it in the table.
3. Identify the dependent variable and state in the table.
Table showing the average speed of a car relative to ramp height
Independent variable
Dependent variable
Trial 1 Trial 2
Part 2: Collect the data
4. Set up the ramp as shown in Figure 8.17.
Experimental set-up
5. Measure the height of the ramp.
6. Use the stopwatch to measure how long it takes for a crash trolley or model car to roll down the ramp. Record the results in the results table.
7. Repeat step 3 three times so you can calculate the mean of the results.
8. Repeat steps 5–7 using some different heights and record your results in the table.
Results
1. Calculate the average time taken for the car to roll down the ramp for each height.
2. Draw a scatter plot to analyse the relationship between the height and the average speed.
3. Insert a copy of your graph below the results table in your science book.
Discussion: Analysis
1. Identify the extraneous variables that you controlled during the experiment, stating how they were controlled.
2. Referring to trends in the data, describe the effect of different ramp heights on the mean average speed of the model car.
Discussion: Evaluation
1. Explain why you conducted three trials at each ramp height, with reference to the methodology.
2. Describe any limitations of your investigation and how these might have affected your results.
3. Suggest any changes that could be made to the method to improve the reliability of the data in future experiments. Justify your suggestions by explaining how each change will improve the reliability of the data.
Conclusion
1. Make a claim about how ramp height affects average speed.
2. Support your statement using the data you gathered, and include potential sources of error
3. Explain how the data support your statement.
Remembering
1. Recall a unit used for distance.
2. Recall a unit used for speed.
3. Recall the formula and unit for average acceleration in a straight line.
Understanding
4. The average top speed of an e-scooter is 40 km h–1. If the e-scooter is already travelling at that speed, calculate how far it will travel in 3 minutes.
5. If a person walks at an average speed of 4 km h–1, calculate how long it will take them to travel 50 metres, to the nearest second. HINT: First convert 4 km h–1 into m s–1.
Applying
6. Determine the acceleration of a car travelling at a constant speed of 50 km h–1 in a straight line.
7. A sprinter starts from rest before running forwards along a straight track. In the first 3 seconds they reach a velocity of 2 m s–1. After the next 10 seconds they reach a velocity of 6.5 m s–1.
a) Calculate the average acceleration in the first 3 seconds, and round to two decimal places.
b) Calculate the average acceleration in the last 10 seconds.
c) Identify whether the sprinter's acceleration is greater in the first 3 seconds or the last 10 seconds.
8. A car starts from rest and accelerates in a straight line at a constant rate of 5 m s–2 for 3 seconds.
a) Calculate the final velocity.
b) Calculate the average velocity. Because the velocity increases at a constant rate, you can do this by using v1 + v2 2 to find the average velocity.
c) Calculate the displacement of the car after 3 seconds.
9. Describe displacement.
Analysing
10. Distinguish between speed and velocity.
11. Contrast average speed and instantaneous speed.
12. Categorise the following motions as either acceleration, deceleration or constant.
Acceleration/deceleration/constant
a) A bike rider slowing down
b) A textbook sitting on a desk
c) A sprinter taking off at the start of a race
d) A dog running forwards at 5 m s–1
e) A car crashing into a brick wall
f) A car rolling down a hill and gaining speed
Evaluating
13. Imagine you were trying to determine how efficiently your car uses petrol. Discuss if you would use distance travelled or displacement covered with one tank full.
At the end of this section, I will be able to:
1. Interpret distance versus time and displacement versus time graphs.
2. Calculate the velocity from a displacement versus time graph.
3. Calculate acceleration and displacement from a velocity versus time graph.
Quantities that describe motion, such as distance, displacement, speed, velocity and acceleration, can be calculated using mathematical equations. However, they can also be illustrated on journey graphs, which represent the information visually.
Distance–time graphs display the total distance an object travels over time. The gradient of the line indicates the speed of the object. Recall that: gradient in physics, how quickly something changes, or the rate of change. The gradient of a graph is calculated as the rise over the run.
Table 8.1 shows some shapes you may see on a distance–time graph. Note that distance–time graphs are always horizontal or increasing; they cannot be decreasing.
Horizontal lines indicate that an object is stationary.
The rise run of horizontal lines is zero because the rise is 0 m. So the speed is 0 m s–1
A straight line with a gradient indicates that the object is moving at a constant speed.
The gradient of the first graph is steeper, which shows that the object has a greater speed.
Table 8.1 S Two shapes of distance–time graphs
Worked example 8.5
Distance–time graph
Take a look at the distance–time graph that shows Elliott's walk in a straight line for 6 seconds.
1. Calculate his speed at the following time intervals: from 0 to 2 seconds, 2 to 5 seconds and 5 to 6 seconds.
2. When is Elliott travelling fastest?
1. Average speed 0 to 2 seconds:
2 to 5 seconds:
A horizontal line indicates he is stationary. 5 to 6 seconds:
=
2. Fastest interval
Explanation
Select two points from each time interval and use rise run to calculate the average speed.
He travels the fastest from the 5th to the 6th second. The steeper line indicates a faster average speed.
Quick check 8.5
1. Analyse the distance–time graph of a moving object in Figure 8.19.
a) Calculate the average speed for each of the sections A, B and C.
b) Describe the motion of the object in the graph.
origin the zero point on the y-axis of a displacement–time graph
Displacement–time graphs display an object's movement with respect to a starting point. The starting position is often located on the graph at the coordinate (0, 0), and is referred to as the origin. When displacement returns to 0 on the vertical axis, the object has returned to the point of origin at a particular time. This type of graph shows the displacement that the object travels away from and towards the origin over time. The gradient of a displacement–time graph is the velocity as it includes information of direction.
Worked example 8.6
Remember the distance–time graph for Elliott's walk. Here is his displacement–time graph for the same motion.
Figure 8.20 Displacement–time graph of Elliott's walk
1. Describe his movements in relation to his starting point.
2. Calculate his velocity at the following time intervals: 0 to 2 seconds, 2 to 5 seconds and 5 to 6 seconds.
1. Describing movements
For the first 2 seconds, Elliott moves away from his starting position by 2 metres. For the next 3 seconds, he is stationary. In the final second, he increases his velocity, moving back to the origin (his starting position).
2. Velocity
0 to 2 seconds:
2 to 5 seconds:
A horizontal line indicates he is stationary. In other words, v =
5 to 6 seconds:
The displacement vertical axis indicates how far from the start he is. In the distance–time graph, you could not tell which direction he was travelling, only that he was moving.
Select two points from each interval and use rise run to calculate the velocity.
A negative velocity means that he has changed direction and is travelling the opposite direction – in this case, back to the start.
He is travelling faster towards his original position (5 to 6 seconds) than he was when travelling away from it (0 to 2 seconds).
1. Describe the motion of an object according to the following displacement–time graph shapes.
Elaboration game: Displacement–time graphs
As a group of four, observe the displacement–time graph in Figure 8.21.
1. One person starts a plausible story by describing the first motion in the graph.
2. When the motion changes, a second person in the group continues the plausible story until the motion changes again.
3. Continue to take turns creating the motion story until each group member has had two turns.
4. Bring together your creative story that accurately describes what is occurring in the displacement–time graph.
Hold off giving your ideas unless it is your turn to continue the story. Remember to include words from this chapter such as 'constant velocity', 'stationary', 'acceleration' and 'at rest'. Be creative!
Challenge: If you have finished your story, calculate the average velocity at certain intervals along the path.
The Elaboration game thinking routine was developed by Project Zero, a research centre at the Harvard Graduate School of Education.
WORKSHEET
Speed–time and velocity–time graphs
Velocity–time graphs show the velocity of an object over time. This is a versatile graph as it can be used to calculate other quantities such as displacement, average velocity, instantaneous velocity and acceleration:
• Instantaneous velocity can be read directly from the line at any point in time.
• The gradient between two points on a velocity–time graph represents the acceleration over that time period.
• The area under a velocity–time graph represents displacement of an object in that time period.
Describing the motion
From the general shape of the graph, we see that the object increases velocity in the first 5 seconds, then travels at a constant velocity for 3 seconds. Finally, in the last 2 seconds it slows down until it is stationary.
Determining the time an object reaches a certain velocity
For example, this object reaches a velocity of 10 ms–1 at the 5-second mark and continues at that velocity for 3 seconds before it slows down.
Determining the instantaneous velocity at any point in time
For example, at 2 seconds the object has an instantaneous velocity of 4 ms–1
An object will be stationary when the velocity is zero. Any time the graph touches the horizontal axis, the object must be stationary.
8.22 A velocity–time graph tells you a lot about an object's motion.
Imagine that a detector is used to capture the instantaneous velocity of an object moving in a straight line away from the detector. It records at every second for a period of 10 seconds. The following table is created and then the data can be represented on a velocity–time graph.
The three velocity–time graphs in Table 8.2 help to identify when an object in motion is accelerating, decelerating or travelling at a constant velocity.
Horizontal lines indicate that an object is travelling at a constant velocity.
Positive gradient means positive acceleration (speeding up). The steeper the gradient, the faster the object accelerates in the direction of travel.
Negative gradient means negative acceleration (deceleration). The steeper the gradient, the faster the object decelerates in the direction of travel.
Table 8.2 Three types of velocity–time graphs
Displacement can be calculated from a velocity–time graph by calculating the area under the graph. In some cases, it is easier to split the graph into smaller sections that have simple shapes.
Worked example 8.7
Consider the following graph of an object in motion.
1. Calculate the displacement in the first 5 seconds.
2. Calculate the displacement from t = 5 s to t = 8 s.
3. Calculate the displacement in the final 2 seconds.
4. What is the total displacement covered by the object over the entire 10 seconds?
under velocity–time graph is the displacement
1. Displacement in first 5 seconds
The area in the first 5 seconds can be described by the triangle shown.
A1 = 1 2 (5 s)(10 m s–1) = 25 m
This means that in the first 5 seconds the object displaces 25 metres.
2. Displacement from t = 5 s to t = 8 s
The area under the graph between t = 5 s and t = 8 s can be described by the rectangle shown.
A2 = 3 s × 10 m s−1 = 30 m
This means that the displacement over this period is 30 metres.
3. Displacement in final 2 seconds
The area under the graph in the final 2 seconds is represented by the triangle shown.
A3 = 1 2 (2 s)(10 m s–1) = 10 m
In the final 2 seconds the object displaces 10 metres.
4. Total displacement
Sum each of the areas for the total distance covered.
AT = A1 + A2 + A3 = 25 m + 30 m + 10 m = 65 m
Therefore, the total displacement by the object over the 10 seconds is 65 metres.
Redraw the shape and label the known sides. Calculate the area of the triangle, which is given by the formula A1 = 1 2 bh
Interpret the area, and check that units are correct.
Redraw the shape and label the known sides.
Calculate the area of the rectangle, which is given by the formula A2 = l × w
Interpret the solution with correct units.
Redraw and label the shape.
Calculate the area.
Interpret solution with correct units.
Add up all of the area sections under the graph to get the total displacement.
Try this 8.3
100 metres
Instructions
1. Copy the results tables into your science book.
2. As a class, choose two students to run a 100-metre sprint.
3. All other students should line up at the 0, 20, 40, 60, 80 and 100-metre marks with a stopwatch.
4. Use stopwatches to capture the time from when a sprinter begins to when they pass each 20-metre mark. Ideally, there will be at least two classmates at each point so that an average of the times can be calculated. Record these results in the table.
Results
1. Calculate the difference in elapsed time for each 20-metre interval.
Sprint times (s) at each 20 m mark
Student name20 m40 m60 m80 m100 m
2. Calculate the average velocity for each interval and complete the table of average velocity for each distance. Average velocity (m s–1) Student name0–20 m20–40 m40–60 m60–80 m80–100 m
3. Plot the displacement–time graph by drawing smooth trend lines.
Analysis
1. Describe the shapes of each interval in each graph.
2. Propose why it was important to gather data from more than one classmate.
3. Identify some potential sources of error in the data.

Gait analysis is the study of human motion. It is undertaken by medical professionals who are seeking insight into the factors affecting the way someone walks and what treatments they might require. Physiotherapists work in conjunction with podiatrists, prosthetists and orthotists (who provide assistive devices like orthotics), doctors and biomechanists in multidisciplinary teams.
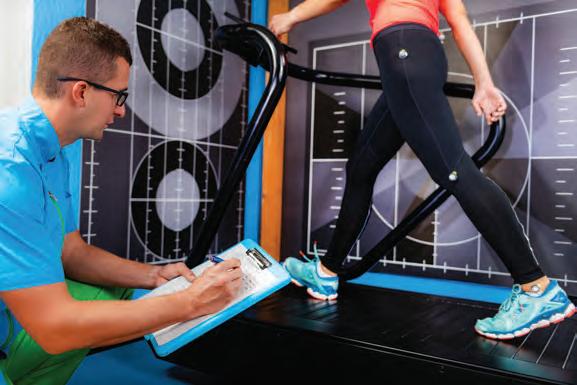
The gait analysis laboratory at the Royal Children's Hospital Melbourne features state-of-the-art technology that allows clinicians to track reflective markers applied to the skin to examine the movements and forces acting on joints. Electromyography monitors the electrical signals occurring in muscles through tiny electrodes and provides further information about how muscles are firing during a complex task like walking.
Researchers in the wearHEALTH group at the University of Kaiserslautern, Germany, are developing a wearable system for analysing people's gait as they move around. Using sensors for acceleration and angular velocities, the technology can calculate the motion parameters of the hip, knee and ankle, and also step lengths. This technology could give users real-time information about their posture as they are walking. It has the potential to help people who have joint diseases and require hip or knee replacements as they go through rehabilitation and learn how to walk with the correct posture after the surgery.
Analyse the velocity–time graph in Figure 8.26.
1. Describe the motion of the object shown in the graph.
2. Calculate the acceleration over the first two seconds.
3. Calculate the acceleration between t = 2 s and t = 4 s.
4. Calculate the displacement after the first two seconds.
5. Determine the total displacement over four seconds.
Figure 8.26 Velocity–time graph
Section 8.2 review
Section 8.2 questions
Remembering
1. Recall what the gradient of a displacement–time graph indicates.
2. Recall what the gradient of a velocity–time graph indicates.
3. Recall what the area under a velocity–time graph indicates.
Understanding
4. Consider the velocity–time graph in Figure 8.27.
a) Calculate the acceleration in the first three seconds.
b) Calculate the acceleration for the next two seconds.
c) Calculate the displacement of the object after five seconds.
5. Describe what the shape of a displacement–time graph can reveal about an object's movements.
6. Describe what the shape of a velocity–time graph can reveal about an object's movements.
Applying
7. The path of a hiker in the Croajingolong National Park from the car park to a lookout is described in the displacement–time graph in Figure 8.28.
a) Determine the displacement to the lookout, where the walker sat to take a break.
b) Determine the average velocity of the hiker in the first two hours.
c) Determine how long the hiker sits at the lookout.
d) Determine the velocity of the hiker on their way back to the car park.
Go
Analysing
8. Hundreds of thousands of animals in Australia are killed every year by vehicles. Consider the velocity–time graph in Figure 8.29.
a) If a driver travelling at 90 km h–1 takes 0.5 seconds to react, and they come to a stop according to the following velocity–time graph, determine the total stopping displacement.
Stopping displacement
Reaction displacement

Braking begins Hazard detected
Braking displacement
Figure 8.29 Velocity–time graph
b) If the reaction time was increased to one second, determine what the stopping displacement would be.
Evaluating
9. a) Use the following table to construct a displacement–time graph of a koala.
b) Using the graph, decide what conclusions can be made about its movements, including whether we can tell the direction it went.
At the end of this section, I will be able to:
1. Recall Newton's first law of motion.
2. Use the equation F = ma, Newton's second law of motion.
3. Recall Newton's third law of motion.
4. Describe how Aboriginal and Torres Strait Islander Peoples use tools to increase impact force.
5. Apply Newton's laws of motion in sports and transportation.
Newton's first law of motion
Newton's first law of motion is the law of inertia.
An object will remain at rest or travel at a constant speed in a straight line unless it is acted upon by an external force.
A force is a push or a pull, and when unopposed, a net force causes an object to speed up, slow down or change direction. This means a force could accelerate or decelerate a moving object, and can cause a moving object to become stationary. In the real world, an object will often have multiple forces acting on it, all contributing to that object's motion. If the multiple forces acting on an object are balanced – the forces are equal in magnitude and occurring in opposite directions – the object's motion will not change. A stationary object will remain stationary, and a moving object will continue to move in the same direction at constant velocity. The term net force is used to describe the sum of all forces acting on an object. When the net force is zero (Fnet = 0), the forces are balanced and will not change the motion of the object. However, if the forces applied to an object are unbalanced (Fnet ≠ 0), the object will either accelerate, decelerate or change direction.
and Newton's laws of motion
Newton's first law of motion an object will remain at rest or moving at a constant speed in a straight line unless acted upon by an external force inertia the tendency of an object to resist a change in its state of motion force (F) any interaction that, when unopposed, will change the motion of an object net force the sum of all the forces acting on an object
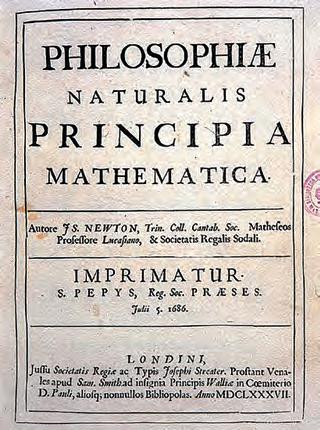
Figure 8.30 Newton's Philosophiae Naturalis Principia Mathematica (The Mathematical Principles of Natural Philosophy) was published in 1687. It revolutionised the scientific thinking of the time by formulating the laws of motion.
The forces acting on an object are balanced and sum to zero. The motion of the object is not changing in speed or direction.
The forces on the object are unbalanced and sum to either a positive or negative number. The motion of the object changes. It either speeds up or slows down or changes direction, depending on the direction of the net force.
Inertia is responsible for the feeling that you get when you suddenly change motion in a car, train or aeroplane or on a bike. At times when we travel at a constant speed we hardly even recognise that we are moving. But when the vehicle that we are travelling in suddenly stops, turns a sharp corner or accelerates, we notice that our body moves unexpectedly. This is inertia! It is the tendency for objects to either stay at rest or continue travelling at a constant speed in the same direction.
Figure 8.31 Consider travelling in a car at a constant speed. When the brakes are suddenly pressed, the car quickly slows down but our body continues to move forwards at the original speed. If it were not for seatbelts, we would continue our motion through the front window of the car.
Imagine you are sitting in the back seat of a car and the driver drives around a roundabout rather quickly. How does your body move?
You might have experienced a force pulling you to the side. Remembering that inertia is an object's tendency to resist a change in motion, consider how your body moves in a car when it:
• travels at a constant speed
• brakes suddenly
• takes a roundabout turn quickly
• takes off at a green light.

Newton's second law of motion is a mathematical formula that describes the relationship between net force, mass and acceleration.
The net force acting on an object equals the mass of the object multiplied by its acceleration.
It can also be written as:
NOTE: The units for force are newtons, N, in which 1 N is equal to 1 kg m s–2.
From this equation, the following relationships can be noted:
• The greater the mass of the object, the greater the force needed to accelerate it.
• The greater the force applied to an object, the greater its acceleration.
• If an object is accelerating, then there must be a net force.
Figure 8.33 shows a cricket bat hitting a cricket ball of mass m. When a net force F is applied to the cricket ball, it will experience an acceleration a. If a cricket ball of larger mass 2m was hit with the same net force F, its acceleration (1/2a) will be less than that of the original ball. Finally, if the cricket ball is hit harder with a net force of 2F, its acceleration will also increase to 2a, in proportion to the force.
Newton's second law of motion an object acted upon by a force experiences acceleration in the same direction proportional to the magnitude of the net force and inversely proportional to the mass of the object mass (m) the quantity of matter in an object, regardless of its volume or any forces acting on it
they
in
Using the force triangle (Figure 8.34), we have:
net
Newton's first law of motion describes how a net force on an object is required to overcome its inertia and change its motion. Newton's second law of motion allows this change in motion to be quantified.
a
Figure 8.34 To use the force triangle, cover the variable you want to calculate. If the other variables are on the same row, multiply them together. If they are on different rows, divide the top variable by the bottom variable.
Worked example 8.8
Consider two students moving a table of mass 13 kilograms. One student pushes horizontally with a force of 30 N while the other pulls horizontally with a force of 80 N. Ignore all vertical forces and ignore frictional forces between the table and the floor.

Figure 8.35 Two students trying to move a table
1. What is the net force and direction of the table?
2. What is the acceleration of the table?
Working
1. Net force
Fnet = 30 N + 80 N = 110 N to the left.
There is effectively 110 N of force acting on the table towards the left direction.
2. Acceleration
the left
Explanation
Calculate the net force by adding all of the forces acting on the object, i.e. the table. Since the surface of the floor pushes up on the table with the same force as the table pushes back on the floor, you can ignore the vertical forces. The only relevant forces acting on the table are the two in the horizontal direction. The net force is the sum of the two forces that the students exert on the table.
Newton's second law allows you to calculate how quickly the table will accelerate if you know what the mass of the table is. (In real life there would be a frictional force between the table and the floor acting against the motion. If in this example, the frictional force was 50 N, then the net force would be 110 N – 50 N = 60 N and the acceleration 60 N/13 kg = 4.62 m s–2 to the left.)
The story goes that an apple falling from a tree onto Newton's head led him to wonder why the Moon does not also fall towards Earth. His question led him to the discovery of gravity, which is an attractive non-contact force felt by all objects that have a mass. The greater the mass of an object, such as a planet, the greater the gravitational force it will exert. This discovery answered Newton's question about the Moon: he was able to identify that the Moon is attracted to Earth's gravity, just as the apple is, but the Moon's attraction and velocity cause it to orbit Earth.
Mass is the quantity of matter in an object and does not change regardless of the gravitational force acting on it. Mass is measured in kilograms when using SI units. Weight is different to mass, as it is actually a force, measured in newtons. In physics, weight is often called the 'force due to gravity', or the 'weight force'. It is calculated by multiplying the mass of the object by the acceleration due to gravity acting on it. For example, Earth's gravitational field pulls objects to its centre at a rate of 9.8 m s–2, so a person with a mass of 70 kilograms will have a weight of 70 kg × 9.8 m s–2 = 686 N (where N is the unit used to describe kg m s–2).
In general, you can use the following equation to calculate the weight force:
Fg = mg
where Fg is the force due to gravity, also known as the weight force measured in newtons (N); m is the mass of the object measured in kilograms; and g is the strength of the gravitational field measured in m s–2. Note that g can be given as 9.8 m s–2 or 9.8 N kg–1; the two units are equivalent. The unit N kg–1 is convenient when working out the weight of an object.
Remember, the mass of an object is the same regardless of the strength of the gravitational field.

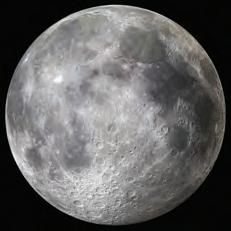
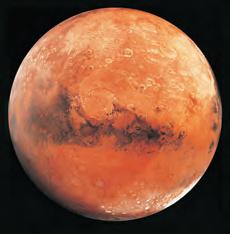
gravity the force by which a planet or other large body draws objects toward its centre
weight the force of gravity on the mass of an object
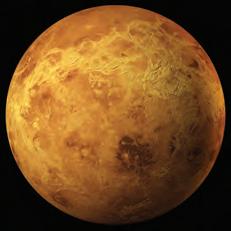
1. Calculate the force that is required to accelerate an object of mass 6 kilograms at 2.3 m s–2
2. Calculate the mass of an object that accelerates at 0.2 m s–2 when it is pushed with a force of 20 N.
3. If a car of a mass of 1000 kilograms is travelling at a constant velocity, calculate the deceleration when the brakes are applied with a force of 1500 N.
4. Calculate the weight of a 60 kg person on Earth, the Moon, Mars and Venus.
Aim
To accurately calculate acceleration due to gravity
Useful equation
Acceleration due to gravity (m s–2) = 2 × distance travelled during vertical descent (m) time2 (s2)
Materials
• a number of objects to drop (e.g. marble, steel ball bearing, tennis ball)
• 3-metre measuring tape
• smartphone with high-speed slow-motion video capabilities
Method
Use the formula given as a guide to design a method of accurately calculating acceleration due to gravity. For example, tape the 3-metre measuring tape to a wall and drop different objects a number of times. Try a few different dropping heights. Analyse the high-speed videos.
Results
1. Create a table for your results.
2. Record all the collected data.
3. Process the data to produce an estimate of the magnitude of the acceleration due to gravity.
Discussion: Analysis
1. Discuss if the different objects accelerate at the same rate. Why or why not?
2. Determine if air resistance affected your results. Explain your reasoning.
Discussion: Evaluation
1. State how many trials you conducted for each object and justify why that number was selected.
2. Explain why you did not measure the mass of the various objects you were dropping.
3. Identify any potential sources of error in your experiment.
4. Suggest any improvements that should be made to the methodology.
Conclusion
1. Make a claim about your measurement of acceleration due to gravity.
2. Support your statement using the data you gathered, and include potential sources of error.
3. Explain how the data support your statement.
Aim
To investigate the effects of force or mass on acceleration
Hypothesis
Write a hypothesis regarding the effect of changing force or mass on the velocity or acceleration of a trolley.
Materials
• crash trolley
• elastic bands
• weights
tape
stopwatch
data logger (if available)
Method
1. Design an experiment that investigates the effects of either force or mass on acceleration.
2. Team up with another group, who should investigate the effect of the other factor (force or mass).
NOTE: You can use increasing numbers of elastic bands to demonstrate increased force applied on the trolley, and increased masses on the trolley to investigate mass.
Results
1. Record your mass, force, velocity or acceleration data in an appropriate table.
2. Plot an appropriate graph or graphs of force or mass versus velocity and/or acceleration.
Discussion: Analysis
1. As force increases, what happens to velocity and acceleration?
2. As mass increases, what happens to velocity and acceleration?
Discussion: Evaluation
1. How can your experimental design be improved?
2. Identify any sources of error (experimental uncertainties or experimental faults).
Conclusion
1. Make a claim about force, mass, velocity and acceleration based on this experiment.
2. Support your statement using the data you gathered, and include potential sources of error.
3. Explain how the data support your statement, stating if your hypothesis was supported or not supported.
Car crashes can result in extreme forces acting on humans within the crashed vehicle. Engineers are constantly investigating ways to reduce the possible impact forces on drivers and passengers of all body types and ages. They might do this by conducting test car crashes with human-like crash-test dummies or even by engineering driverless cars, whose reaction times are far superior than those of humans, to reduce the occurrence of crashes.
Use the internet to gather some answers to the following questions.
1. In 2022, the first female crash-test dummy was produced. Why was this important in the future of car safety?
2. What are some causes of car crashes, even if the driver is following the road rules?
3. Driverless cars will have a 360-degree view of their surroundings, and a faster reaction time and better braking performance than a human driver. Research your preferred car brand and describe the time frame for the future of any driverless vehicles in production.
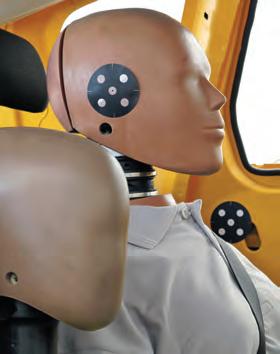

An infographic is a helpful tool to communicate complex scientific information in a simplified visual way that is more appropriate for your audience. Explore some examples of infographics online and create an infographic that illustrates the relationship between mass, acceleration and force.
Newton's third law of motion describes the interaction of forces between two separate objects. It states that the force exerted by object A on object B will be matched with an equal and opposite force exerted by object B on object A. These paired forces are called action and reaction forces.
For every action, there is an equal and opposite reaction.
For example, if you were to push on a wall, the wall pushes back just as hard (Figure 8.37). If it did not, you would fall through it! Similarly, if you were to exert a force to throw a ball, the ball would also exert an equal force back on your hand. For every action force, there is a reaction force.
action of pushing against a wall has a reaction force that pushes back on the person with the same magnitude.
Consider a car driving on the road. The engine turns the wheels, which push backwards against the road. The road pushes back with an equal but opposite force, and this propels the car forwards. You can see evidence of a car's wheels pushing backwards when the tyres are struggling to grip and are spinning on a dirt road: watch the dirt and gravel flying backwards!
Quick check 8.9
1. Copy the diagram in Figure 8.39 and label the action force and the reaction force. Alternatively, describe where the action and reaction forces should be.
Explore! 8.3
Foot scooters and e-scooters
In Victoria, mandatory bicycle helmet laws were introduced in 1990. Since then, the law has been expanded to include people riding foot scooters, e-scooters and other electric transportation devices. The rules apply to roads, bicycle lanes, shared paths and parks, and even include passengers on a bike (such as children in approved child bike seats). Helmets are capable of reducing the impact force of the head on another hard object such as the ground in a crash or fall. They also increase the visibility of riders, potentially reducing the risk of collisions on footpaths or roads.
Use the internet to investigate the statistic that helmets can reduce the risk of head and brain injury for e-scooter riders by at least 80%. Examine the information that you collect in your research and make a statement about the effectiveness of helmets for the safety of e-scooter riders.


Try this 8.6
Newton's third law in sport
Action and reaction forces are at play in all sports, and some of those forces can impact the safety of players. Consider some of the safety gear or precautions in the rules of the following sports that might protect players from dangerous action and reaction forces.

for the Philadelphia Eagles.
Sport
Australian rules
football
Netball
Cricket
Horse riding
American football
Ice hockey
Table 8.5 Mitigating the effects of forces
Protective gear or rules
Aim
To design and build a car with safety features that will protect an egg from breaking during a collision
Hypothesis
Write a hypothesis investigating how the crash impact force and speed will affect whether the egg in the car will break.
Materials
As chosen by students but may include:
• rubber bands
• wheels
• icy-pole craft sticks
• dowels
• plastic cups
• straws
• string
Method
• springs
• balloons
• toilet paper or paper towel rolls
• cardboard boxes (varying sizes)
• plastic bottles
• flat cardboard
• sticky tape
1. Research vehicle collisions, safety features of cars and the forces involved during a collision.
2. Based on your research, design and build a vehicle or device that has safety features to protect an egg during a collision.
3. Test your design by competing as a class to see whose crash-test egg survives.
Results
Take a high-speed video of your collision and slow it down to see the forces in effect.
Discussion: Analysis
1. Compare your safety device to a safety feature in a car.
2. Draw the forces acting on the egg during the collision.
3. Describe how seatbelts, airbags and crumple zones in a car reduce the force on a passenger in a car crash. How have you modelled these aspects in your model?
Discussion: Evaluation
1. What difficulties or errors did you encounter during the experiment?
2. How could you improve the experimental design to avoid these in the future?
Conclusion
1. Make a claim about safety based on this experiment.
2. Support your statement using the data you gathered, and include potential sources of error.
3. Explain how the data support your statement, stating if your hypothesis was supported or not supported.
Aboriginal and Torres Strait Islander Peoples have developed and refined the use of spears, spear throwers, and bows and arrows over tens of thousands of years, demonstrating advanced knowledge of physics, engineering, and environmental adaptation. These tools vary widely across different regions of Australia, reflecting the diverse cultural practices and environmental conditions of each community.
Spear throwers, known as woomeras in some regions, and bows function as mechanical advantage devices, amplifying the force applied to the projectile. By increasing the leverage and acceleration, these tools enable greater velocity, range, and impact force. This innovation showcases a deep understanding of the relationships between mass, force and motion, as well as practical knowledge gained through generations of observation and experimentation.
For example, spear throwers are often tailored to the size and weight of the spear to optimise performance, and their design incorporates features that allow for precise targeting and energy transfer.
Use your preferred search engine to research the principles behind these tools and explore how Aboriginal and Torres Strait Islander Peoples have used them to adapt to different environments. Consider how these technologies reflect their innovation, cultural significance and sustainable practices.
Throwing devices


Projectiles


Figure 8.42 Throwing devices such as bows and spear throwers can increase the velocity of a projectile. The boomerang is a projectile thrown by hand.
Section 8.3 questions
Remembering
1. An object is travelling at a constant speed and zero net force is applied to it.
a) Recall what happens to the object.
b) Identify the Newton's law that applies in this situation.
2. Define the term 'inertia'.
3. Describe the term 'net force'.
4. Describe the term 'weight'.
Understanding
5. Calculate the mass of an object, to two decimal places, that accelerates at 0.63 m s–2 when it is pushed with a force of 20 N.
6. If a car of mass 1500 kilograms is travelling at a constant velocity, calculate the deceleration when the brakes are applied with a force of 1200 N.
Applying
7. Contrast the quantities 'weight' and 'mass'.
Analysing
8. A 50-kilogram person sits on a chair with feet dangling above the ground. Construct a diagram to represent the action–reaction pair of forces acting in the scenario and include labels to indicate the force quantities. (Note that acceleration due to gravity, g = 9.8 m s–2.)
Evaluating
9. Two students are trying to push a mass towards each other. Student 1 on the left exerts a force of 155 N on the mass to the right and student 2 on the right exerts a force of 220 N to the left. Ignore frictional forces.
a) Determine the net force acting on the mass.
b) Deduce the direction in which the mass will move.
c) Using Newton's second law, if the mass is 216 kilograms, determine the acceleration of the mass.
d) Elaborate on whether there are action–reaction pairs in the system. Quantify the forces where possible.
Chapter checklist
Success criteria Linked questions
8.1 I can distinguish between distance and displacement. 7
8.1 I can convert between units of m s–1 and km h–1 8, 10a
8.1 I can distinguish between quantities of speed, velocity and acceleration. 1, 3, 10b
8.2 I can interpret distance versus time and displacement versus time graphs. 2, 9a, 9b, 9c
8.2 I can calculate velocity from a displacement versus time graph. 9d, 9e, 9f
8.2 I can calculate acceleration and displacement from a velocity versus time graph. 10c
8.3 I can recall Newton's first law of motion. 2
8.3 I can use the equation F = ma, Newton's second law of motion. 2
8.3 I can recall Newton's third law of motion. 2, 5
8.3 I can describe how Aboriginal and Torres Strait Islander Peoples use tools to increase impact force. 6
8.3 I can apply Newton's laws of motion in sports and transportation. 4, 5, 8
Review questions
Remembering
1. Recall what the gradient of a displacement–time graph indicates.
2. Describe Newton's three laws of motion.
Understanding
3. Provide one example that demonstrates average speed and one example that demonstrates instantaneous speed.
4. Identify three action–reaction pairs in Figure 8.43.

Applying
5. Describe, using your knowledge of Newton's third law of motion, how a cricket helmet can protect a player's head from the impact force of a cricket ball.
6. Use of a spear thrower increases the spear's speed. Describe, using your knowledge of Newton's second law of motion, how the use of an Aboriginal or Torres Strait Islander spear thrower can increase the impact force of a spear.
Analysing
7. Distinguish between distance and displacement, and between speed and velocity, using an example.
8. Consider the hypothetical times of a runner's personal best 400-metre sprint.
Distance (m)050100200300400 Time (s) 05.9811.5423.6535.2248.63
a) Calculate the average speed of the runner for the entire 400 metres. That is, from t = 0 s to t = 48.63 s.
b) Determine if they travel quicker in the first 200 metres or the last 200 metres.
Evaluating
9. Consider the path of a bungee jumper. For simplicity, assume that the path of motion is straight up and down. As a person jumps from the platform, they accelerate towards the ground. They decelerate when the cord tightens, then accelerate back up, and so on.
The first ten seconds of the jump are plotted in Figures 8.44 and 8.45, where the origin represents the position of the jumper just before they leap from the platform.
a) Determine the distance that the jumper travels in the first four seconds.
b) Determine the displacement of the jumper after four seconds.
c) Determine the distance covered by the jumper in the first ten seconds.
d) Determine how far the jumper is from the platform after ten seconds (i.e. the displacement).
e) Calculate the average speed in the first four seconds.
f) Determine the speed at the six-second mark.
Figure 8.45 A
A
graph of the bungee jumper
10. A car starts from rest and accelerates at a constant rate in a straight line for five seconds to a final velocity of 54 km h–1.
a) Calculate the final velocity in m s–1
b) Calculate the acceleration, in m s–2, over the five seconds.
c) Construct the velocity–time graph for this scenario and use it to calculate the car's displacement using the area under the graph.
Data questions
Applying
1. Using the velocity–time graph in Figure 8.46, identify the velocity of the object at the 10, 40, 90 and 140-second marks.
)
Time (s)
Figure 8.46 Velocity–time graph of unknown object
2. Calculate the acceleration of the object at the 10, 40, 80 and 110-second marks.
3. Calculate the displacement of the object from its origin after 170 seconds.
Analysing
4. Interpret the velocity–time graph to describe the motion of the object in words.
Evaluating
5. Deduce a potential identity of the object.
6. Propose why the object is unlikely to be a bicycle.
Transportation is a major part of everyday life, and whether it's a car, train, bus, plane or even a boat, energy is used in some form. While there has been a considerable push towards replacing fossil-fuel-burning engines with rechargeable batteries in the 2020s, many vehicles still use petroleum-based fuels as their source of energy. This makes it really important to be efficient in transportation design, including considering how energy is being transferred and transformed in the vehicle.
In petroleum engines, some energy is lost as heat going into the surrounding environment rather than directly into moving the wheels. Kinetic energy, which comes from the transformation of mechanical energy, is also lost as heat energy within the tyres and the road. It is estimated that approximately 75% of the energy input into a petrol-powered car engine is lost. Of this, the majority is engine losses, but there are also losses in the drivetrain and tyres. The aerodynamics of the vehicle shape also contribute to the energy efficiency issues.
Decide on a mode of transportation and create a model with design improvements that will increase energy efficiency.

In groups of three, decide on a mode of transportation that you are interested in and research the ways in which energy is lost due to inefficiencies in design. Then, design and test improvements that could be made to improve energy efficiency.
• cardboard boxes
• cardboard
• tape
• various types of materials
• glue
• force meter
• measuring tape
1. Discuss and decide with your group which type of transportation you would like to learn about.
2. List all the ways energy goes in and then is used or lost.
3. Research ways to increase efficiency of energy as it goes in and is used or lost. This can be done in a table – an example is shown below.
e.g. Car Energy in – petrol Engine can be dirty and incomplete combustion occurs.
e.g. Car Energy out – axle turning
e.g. Car Energy out – car shape
Axle can have friction.
Air resistance
Recommend engine regularly serviced
Lubricate axle
Make car bonnet smooth to allow less friction from air resistance.
4. Discuss available materials in your group and decide how you will design your initial prototype for preliminary testing.
5. Design your prototype without any efficiency ideas in place and decide how you will test this prototype.
6. Design a prototype, or changes to your initial prototype, that includes all efficiency ideas. You may choose to test them one by one or all together, depending on time and materials.
7. Discuss and justify why efficient design components are important for sustainability and how they contribute on a global energy scale.
8. Construct your prototype and then complete testing.
9. Using your energy equations, perform calculations on energy you supplied to your prototype and consider how effectively this energy was used.
10. Explain to the class your prototype improvements and justify why your changes resulted in improved efficiency of energy transformation, or why they did not.
absolute dating determining the actual age of a material
absolute uncertainty the estimated range of values in which the 'true value' of a measurement lies
absorption spectrum a spectrum showing dark lines representing specific wavelengths that have been absorbed by a substance
acceleration (a) the change in velocity of an object over time
accuracy how closely measured values match the 'true' or accepted values
activation energy the minimum energy required to break the bonds of reactants
adaptation a characteristic that contributes to an organism's ability to survive in its environment
agitating stirring, swirling or shaking a mixture
alkali metals group 1 metals
alkaline earth metals group 2 metals
allele a different form of the same gene
allele frequency the relative proportion of a specific allele within a population
analogous structures structures that have a similar function but evolved separately
aneuploidy the presence of an abnormal number of chromosomes in a cell
anion a negatively charged ion formed by the gain of electrons
aqueous a physical state of matter that means 'dissolved in water'
arcsecond 1/3600th of a degree
artificial selection intentional breeding of organisms with particular characteristics to produce offspring with more desirable traits
astronomical unit (AU) the distance between Earth and the Sun
atomic radius a measure of atomic size: the distance between the centre of the nucleus of an atom and its valence shell
autosome any chromosome that is not a sex chromosome. In humans, these are chromosome pairs 1 to 22
biodiversity the variety of life on Earth, including the diversity of species, the genetic differences within a species and the ecosystems where species are found bioethanol ethanol produced biologically from the fermentation of sugar biogeography the study of the geographical distribution of plants and animals biostratigraphy a branch of stratigraphy focused on dating rock layers using the fossils found in them
biota all the living organisms found within a particular region or ecosystem
bipedal walking upright on two legs
black hole the extremely dense remnant of a massive star; a region in space where gravity is so strong that nothing can escape, not even light
blinding an experimental procedure whereby participants are unaware of whether they have been allocated to the control group or experimental group blue shift when a spectrum has shifted towards shorter wavelengths
bottleneck effect the decrease in genetic diversity resulting from a rapid reduction in the size of a population, due to events such as natural disasters or human activities such as overhunting
B-V colour index the difference in brightness measured through blue and green filters, indicating the colour of a star
calcination the process of heating a substance in a controlled environment to change its physical or chemical composition
carrier an individual with an allele for a recessive condition but who does not have the condition due to being heterozygous
catalyst a substance that speeds up a chemical reaction by lowering the energy needed to break bonds (activation energy); does not get used up in the process
cation a positively charged ion formed by the loss of electrons
centromere a structure that holds two sister chromatids together
average speed change in distance over a time interval
average velocity the rate at which an object is displaced or changes position over a time interval
baseline a line between the two viewpoints used to calculate parallax angle (1 AU is the baseline used for calculating star parallax)
Big Bang the rapid expansion of matter that marked the origin of the universe
chemical formula the symbols and formulas of the reactants or products
chromatin a mixture of DNA and proteins that forms chromosomes
chromosome a thread-like structure of tightly wound DNA and proteins called histones
chromosome mutation a mutation involving large segments of DNA
codominance both alleles are expressed equally in the phenotype
codon three nucleotides (base triplet) in mRNA that code for an amino acid
coefficient the number placed before a chemical species (formula unit) in a chemical equation to ensure it is balanced
collisions the interaction between reactant particles during which atoms and bonds may rearrange to form a new substance
complementary base pairing adenine only binds with thymine and cytosine only binds with guanine concentrated solution a solution that contains a relatively large amount of solute compared to solvent concentration the amount of substance in a given volume
confidentiality keeping participants' data and results private
constant velocity when an object is travelling at the same speed without changing direction
constellation a group of stars, as seen from earth, that appears to form a familiar shape continuous spectrum a continuous range of colours (wavelengths)
control group a group that is not subjected to the independent variable; provides a baseline for comparison to all experimental groups controlled variable a variable that is kept constant so as not to affect the dependent variable in an experiment
convenience sampling selecting opportunistic samples based on the ease of accessibility to the researcher cosmic microwave background electromagnetic radiation left over from the early stages of the universe covalent bond a strong bond almost always between two non-metals that share electrons, forming a molecule
cultural appropriation use of cultural knowledge or tradition without acknowledgement or consent
decomposition reaction a reaction in which one reactant breaks up into multiple products deletion when a nucleotide is deleted from the DNA sequence
deoxyribonucleic acid (DNA) the molecular unit of heredity, containing the genetic information responsible for the development and function of an organism dependent variable the variable that is measured in response to the independent variable diatomic existing as two atoms bonded together dilute solution a solution that contains a relatively small amount of solute compared to solvent diploid (2n) a cell containing two sets of chromosomes
direct evidence evidence that supports an assertion without intervening inferences
displacement (s) the length and direction of an object from its origin, measured in metres; also used for the change in length when an object is compressed or stretched
displacement reaction a reaction in which elements are exchanged between two reactants distance (d) total length travelled, measured in metres DNA hybridisation a technique that measures genetic similarity between two organisms dominant a characteristic in which the allele responsible is expressed in the phenotype, even in those with heterozygous genotypes
Doppler effect a change in the wavelength of sound or light waves emitted from an object when it moves towards or away from an observer double-blind procedure an experimental design in which both participants and researchers are unaware of whether the participant is in the control or experimental (treatment) group
ductile can be drawn out into long, thin wires ecosystem diversity the variation in ecosystems in a given area
Cultural Lore the stories, customs, beliefs and spirituality of Aboriginal and Torres Strait Islander people which are passed down through generations and act as a guide for everyday life dark energy a theoretical force responsible for accelerating the expansion of the universe dark matter matter that does not emit light and is responsible for unidentified gravity in the universe data logger a piece of electronic equipment that collects data independently through sensors when information needs to be collected faster or for longer or more accurately than a human can do deceleration change in velocity of an object over time when it is slowing down
elastic potential energy energy stored in an object due to its shape, usually resulting from the object either being compressed or stretched electron the smallest subatomic particle in an atom; arranged around the nucleus in shells
electron configuration the arrangement of an atom's electrons in the shells around the nucleus electron shell the energy level in which the electrons orbit the nucleus of an atom element a chemical substance made up of only one type of atom, distinguished by its atomic number (number of protons)
embryo the initial stage of early development in multicellular organisms
emission spectrum a spectrum showing bright lines representing specific wavelengths that have been emitted by a substance endangered a species that is at risk of becoming extinct
endemism a state of being confined to a small defined geographic location
endothermic an absorption of heat in a chemical reaction characterised by a decrease in surrounding temperature energy the ability to do work energy efficiency the percentage of input energy that is converted to useful energy by a machine or system
enrichment the process of increasing the purity of a particular isotope in a substance epoch of recombination the point in time when electrons and ions could combine to form atoms ethics the standards used to appraise and guide what is considered as acceptable conduct evolution change in the genetic composition of a population over successive generations, which may result in the development of new species
evolutionary tree a diagram used to represent evolutionary relationships between organisms exoplanet a planet outside our solar system, orbiting a star other than our Sun
exothermic a release of heat in a chemical reaction characterised by an increase in surrounding temperature external validity the extent to which results can be generalised and extrapolated to other contexts or populations
extinct a species that has no living members extraneous variable a variable other than the independent variable, which, if not controlled, may affect the dependent variable and thereby have unwanted effects or lead to false conclusions
fair test an experiment in which all the variables are kept constant except the independent variable being tested
feasible possible within the available timeframe, with the available resources and budget
fermentation a biological process in which microorganisms convert glucose into ethanol and carbon dioxide
fertile able to reproduce
fossil fuel a non-renewable energy source, such as oil, coal or natural gas, that has formed underground from plant and animal remains over millions of years
fossil record the record of past life and evolution inferred from fossils
fossilisation the process of forming a fossil founder effect the decrease in genetic diversity that occurs when a population is descended from a small population that separated from a larger one galaxy a gravitationally bound system containing billions of stars and planets
gametes sex cells (sperm and ova) with half the usual number of chromosomes
gene a length of chromosome made of DNA; the basic unit of inheritance
gene flow the movement of genetic information from one population to another through migration
gene mutation a permanent alteration in the DNA sequence that makes up a gene
gene pool the total set of genes and alleles present in a population
gene therapy a process by which a copy of a functional gene is introduced into an organism
genetic diversity the number of different alleles of genes in a population
genetic drift the random change in allele frequencies in a population from generation to generation genetic engineering deliberately modifying genetic material to manipulate the characteristics of an organism
genetic screening genetic tests carried out across the population to identify people at risk of genetic disorders
genetic variation the differences in DNA sequences between individuals within a population
genetically modified organism an organism that has had its genome altered using genetic engineering techniques
genetics the study of genes, genetic variation and heredity
genome the complete set of genetic material in an organism
genotype the combination of alleles an organism has for a particular gene
geocentric a model of the universe with Earth at the centre
fertilisation the fusion of male and female gametes to form a zygote
filial offspring of a cross force (F) any interaction that, when unopposed, will change the motion of an object
fossil the shape or impression of a bone, shell or once-living organism that has been preserved for a very long period of time
geothermal energy thermal energy that originates from inside Earth
germline mutation a mutation of DNA in gametes, which can be inherited
Goldilocks zone the habitable zone around a star where the temperature is not too hot and not too cold
gonads the sexual organs: testes in males and ovaries in females
gradient in physics, how quickly something changes, or the rate of change. The gradient of a graph is calculated as the rise over the run.
gravitational potential energy amount of energy that an object has stored due to its position in a gravitational field
gravity the force by which a planet or other large body draws objects toward its centre
ground state the lowest energy level of an atom
group a vertical column in the periodic table
half-life the length of time needed for the radioactivity of a radioactive substance to reduce by half
halogens group 17 elements
haploid (n) a cell containing only one set of unpaired chromosomes
heliocentric a model of the universe with the Sun at the centre
heredity the genetic passing on of traits from one generation to the next
heterozygous having two different alleles at a particular gene locus
homologous chromosomes a matching pair of chromosomes with the same length, centromere position and gene locations
homologous structures similar physical features in organisms that have evolved from a common ancestor
homozygous having two identical alleles at a particular gene locus
H–R diagram (Hertzsprung–Russell diagram) a graph in which star luminosity is plotted against spectral type/temperature
Hubble's law the farther away a galaxy is from Earth, the faster it is moving away from us
hydroelectric power a renewable source of energy that harnesses the gravitational potential energy of water to generate electrical energy hydrogen bonds intermolecular chemical bonds that hold the two DNA strands together hypothesis a proposed explanation or educated guess that can be tested through investigation and experimentation
independent variable the variable that is systematically manipulated or changed in order to investigate its effect on the dependent variable index fossil a fossil used as the basis for dating the stratum it occupied
indirect evidence evidence that requires inferences to be made
implicit bias when someone's personal opinions influence their judgement without them being aware of it
incomplete dominance a form of inheritance in which both alleles are partially expressed, producing a third intermediate phenotype independent groups design a research design in which two separate groups of participants are used as the control and experimental groups
induced mutation a mutation produced by environmental factors
inertia the tendency of an object to resist a change in its state of motion
informed consent participants are informed about the risks and procedures involved in an experiment and they agree to participate by signing a form
insertion when one or more extra nucleotides are inserted into the DNA
instantaneous speed the speed of an object measured at a particular moment in time
instantaneous velocity the velocity of an object measured at a particular moment in time
interferometry a technique that uses the interference of waves to measure distances internal validity the confidence we have that the change in the dependent variable was solely due to the change in the independent variable inversion when two nucleotides reverse their order investigable able to be tested through research or experimentation
ion a charged version of an atom, formed by the loss or gain of electrons
ionic bond a strong bond between an anion and a cation, formed via electron transfer
karyotype the chromosomes of an individual, often displayed according to size and gene locations
kinetic energy the energy an object or particle has due to its motion
lattice structure a three-dimensional arrangement of atoms that pack together very tightly and form bonds that are extremely strong because the atoms bond to each other in multiple directions
Law of Conservation of Energy a scientific law that states that energy can be neither created nor destroyed, only converted from one form of energy to another or transferred between objects light year the distance that light travels in one year (about 10 trillion km)
Likert scale a rating scale in which survey participants rate how strongly they agree with a statement
locus (plural: loci) the location of a gene on a chromosome
luminosity the intrinsic brightness of a celestial object lustrous in metals, having a shiny surface
main sequence the phase during which stars convert hydrogen into helium in their cores
malleable can be hammered or beaten into a new shape
mass (m) the quantity of matter in an object, regardless of its volume or any forces acting on it
mass extinction a widespread decrease in biodiversity on Earth occurring in a short geological period
matched participants design a research design in which similar participants are paired and then randomly allocated to either the control or experimental group
megafauna large animals with a body mass over 45 kilograms
meiosis the process by which the gonads make haploid gametes
metal displacement reaction when a more reactive metal removes a less reactive metal from its compound
metalloids elements in the periodic table that are situated close to the border between metals and non-metals; they share properties and appearance characteristics with both metals and non-metals mitosis the process by which diploid somatic cells make identical diploid copies of themselves for growth and repair
model a simple representation of an object, system or phenomenon that is used to understand, analyse or predict its behaviour
molar mass the mass of one mole of an elementary entity
mole 6.02 × 10²³ particles
monatomic (also monoatomic) existing as one atom
monohybrid cross a type of genetic cross or breeding experiment that considers the inheritance of a single trait or characteristic, typically controlled by a single gene with two alleles
monomer a single subunit that when joined together repeatedly makes a polymer mutagenic causing mutations in DNA mutation a change in the genetic code of a cell natural selection a process in which organisms whose phenotype is best adapted to their environment are more likely to survive and reproduce nebula (plural: nebulae) a cloud of gas and dust in space
Newton's second law of motion an object acted upon by a force experiences acceleration in the same direction proportional to the magnitude of the net force and inversely proportional to the mass of the object
Newton's third law of motion for every action, there is an equal and opposite reaction noble gases group 18 elements non-disjunction the failure of homologous chromosomes or sister chromatids to separate correctly in meiosis
non-homologous chromosomes chromosomes that do not belong to the same pair non-renewable cannot be replenished as fast as or faster than it is used
novel new and original
nuclear fusion the process of joining two nuclei to release energy
nucleotide a monomer subunit of a nucleic acid, consisting of a phosphate group bound to a five-carbon sugar, which in turn is bound to a nitrogenous base
observable universe the spherical region of the universe that can be observed from Earth or space telescopes; it encompasses everything close enough that light has had time to reach Earth
octet rule atoms tend to lose, gain or share outer shell electrons to achieve eight electrons in their outer shell
optical telescope a device that collects and focuses light from the visible spectrum to form an image origin the zero point on the y-axis of a displacement–time graph
outlier an anomalous data value that does not seem to fit the rest of the data
ova (singular: ovum) mature female reproductive cells
parallax the effect by which the position of an object seems to change when it is observed from different locations
parallax error a measurement that is not the true value due to the position of the object along the line of sight
parsec the distance at which a star appears to move one arcsecond in six months (equal to 3.26 light years or 30 trillion km)
net force the sum of all the forces acting on an object neutralisation reaction a reaction between an acid and a base, forming a solution that has a pH of 7 neutron star a tiny, hot, dense star formed when a star explodes as a supernova; made only of neutrons
Newton's first law of motion an object will remain at rest or moving at a constant speed in a straight line unless acted upon by an external force
particle diagram a representation of elements and compounds in which atoms are drawn as balls or circles payload the portion of the spacecraft that addresses the primary mission – i.e. it is specifically dedicated to producing mission data and relaying it back to Earth
pedigree a chart that shows relationships between family members and indicates which individuals have certain genetic traits
peer review a process by which work is examined and approved by experts before being published period a horizontal row in the periodic table
personal error a type of random error that arises from mistakes and miscalculations by the person conducting the experiment
phenotype the observable characteristics of an organism, resulting from both genotype and the environment
photon a massless particle that carries electromagnetic radiation physiological relating to the way in which a living organism, and its body systems, function placebo a false or fake treatment
placebo effect a phenomenon in which participants who receive a placebo experience a benefit or improvement
planetary nebula a type of nebula that forms as a result of a red giant throwing off its outer layers plasma the ionised fourth state of matter, in which nuclei and electrons are separated
point mutation a mutation in which a single nucleotide is changed
polymer a molecule made from many repeating subunits called monomers
polypeptide a chain of amino acids forming part or the whole of a protein molecule
population the entire group of people that are of scientific interest during an investigation population (ecological) a group of a particular species living and interbreeding in the same geographical area potential energy energy that is stored in an object due to its position and other factors, such as its mass, electric charge and internal stresses
potential energy (chemical) the energy stored in the chemical bonds of a substance
precipitation reaction a reaction that involves the mixing of two solutions to produce a solid called a precipitate
precision how close repeated measurements are to each other
prediction a statement that describes what is expected to happen if the hypothesis is true
pressure the force exerted by gas particles, per unit area
radio telescope a device that receives radio waves emitted by stars and other celestial objects
radioisotope a radioactive isotope of a chemical element with an unstable nucleus that emits excess energy (radiation)
random allocation participants are randomly placed in the control group or experimental (treatment) group
primary data data that researchers collect themselves for a specific purpose; obtained from observations, experiments, surveys or interviews products the chemicals produced in a reaction Punnett square a specialised grid to show genetic crosses
pyrolysis the burning of organic matter in a low-oxygen environment
random error error caused by limitations of the equipment or the observer and does not follow a regular pattern
random sampling selecting a random sample of participants from a population using a method by which every person has an equal chance of being selected
randomised controlled trial a trial that relies upon random allocation of participants to the control and experimental groups while all known extraneous variables are controlled
reactants the chemicals that react together in a reaction
reaction rate the quantity of reactant or product used up or made per unit of time; how quickly the reaction progresses reactivity series a series of metals ordered by their observable reactivity, from highest to lowest reading error a reading or measurement that is not the true value
recessional velocity the rate at which a galaxy is moving away from Earth
recessive a characteristic in which the allele responsible is only expressed in the phenotype if there are two copies of the same allele present recombination the rearrangement of genetic material, especially by crossing over red giant a very large, bright, cool star that has run out of hydrogen in its core
red shift when a spectrum has shifted towards longer wavelengths
reduction division cell division that results in a reduction of genetic material in the daughter cells relative atomic mass the total mass of the protons plus the total mass of the average number of neutrons in an atom relative to carbon-12
relative dating determining the order of past events without the specific age relative uncertainty the ratio of the absolute uncertainty to the reported value, often expressed as a percentage
reliable when the results of an experiment are consistent (i.e. repeatable, replicable and reproducible)
renewable can be replenished as fast as or faster than it is used
repeatable when the results are consistent after the same scientist repeats the experiment under the same conditions as the original experiment, including the same equipment and laboratory or field site repeated measures design a research design that exposes the same participants to both/all the experimental conditions
replicable when the results are consistent after a different scientist repeats the experiment under the same conditions as the original experiment, including the same equipment and laboratory or field site reproducible when the results are consistent after a different scientist repeats the experiment under different conditions to the original experiment, including different equipment and laboratory or field site
reproductive isolation when members of two related populations can no longer interbreed retrograde motion apparent backwards motion of a planet as seen from Earth right to withdraw the right for a participant to leave a study at any time for any reason
safety data sheet (SDS) a document that provides information regarding hazards and safe use of chemicals
salt a product formed when an acid reacts with a metal, base or carbonate; generally made up of metals and non-metals
sample a group of participants selected from the larger group of research interest
Sankey diagram a flow chart that represents the flow of energy through a system satellite an object in space that orbits a larger object. Natural satellites include moons orbiting planets, and artificial satellites include crewed and non-crewed spacecraft.
secondary data data that have been collected by somebody else for another research purpose selection pressure a factor that affects the relative fitness or reproductive success of individuals within a population, leading to natural selection and potential changes in allele frequencies over time selective advantage the characteristic of an organism that enables it to survive and reproduce better than other organisms in a population
singularity a point at which infinitely dense matter occupies an infinitely small space
sister chromatids two copies of the same chromosome, connected at a centromere
solar energy a renewable source of energy that converts the light energy from sunlight directly into another useable type of energy
selective breeding another term for artificial selection sex chromosomes chromosomes that determine the sex of an organism
sexual reproduction form of reproduction that involves the fusion of gametes from two parents and introduces variation to the offspring
simulation a representation (often digital) of a real situation or event, created to investigate the situation or event and often used to make predictions
somatic cells the body cells of an organism
somatic mutation a mutation that occurs in somatic (body) cells, which cannot be inherited
speciation the process by which populations evolve to become distinct species
species a group of organisms consisting of similar individuals that can breed with one another species diversity the number and abundance of different species in a given area
spectral class a group into which stars are classified based on their spectra
speed change in distance divided by time
spontaneous mutation a naturally occurring mutation
stationary not moving strata (singular: stratum) the sub-groups that a population is divided into for the purpose of stratified sampling
stratified sampling the population is organised into sub-groups (strata) and then a random sample is selected from each group
stratigraphy the branch of geology studying rock layers
substitution when one nucleotide is swapped for another
supernova the explosion of a massive star surface area the area of the outer part or surface of an object
sustainable practices that use natural resources responsibly so they remain at the same level, in order to support present and future generations
synthesis reaction a reaction in which two (or more) elements or reactants combine to form new substances or products
systematic error a consistent error that gives rise to measurements that are repeatedly higher or lower than the true value
telomeres structures made from DNA and proteins that protect the ends of chromosomes
test cross a genetic cross between a homozygous recessive individual and an individual of unknown genotype showing the dominant trait to determine the unknown genotype
thermal decomposition decomposition that occurs when a substance is heated thrust a mechanical force that propels an object forward as it expels or accelerates matter backwards
titration a procedure used to determine the concentration of an unknown solution (often an acid or a base)
titre the volume of solution that needs to be released from the burette to reach the end point in a titration
trace fossil a trace of an animal, such as a footprint or imprint, that has become fossilised
transcription the first stage of protein synthesis in which the base sequence of DNA is copied into mRNA
transgenic organism an organism that possesses a foreign gene or segment of foreign DNA in its genome because of human experimentation
transition metals the block of metals containing the elements in groups 3 to 12 and in periods 4 to 7 in the periodic table
translation the second stage of protein synthesis in which a sequence of mRNA is translated into a sequence of amino acids
trisomy when an organism has a third copy of a chromosome
useful energy the output energy that a machine is designed to produce; an efficient machine will maximise the useful energy it produces valence electrons the electrons in the outer shell of an atom
valence shell the outermost shell of the atom that contains electrons validity the degree to which we accept the suitability of an experiment to address the research question, and whether it measures what it is intended to measure variation the range of differences or diversity in traits, characteristics or genetic make-up among individuals
vector a quantity having both magnitude and direction
velocity (v) change in displacement divided by change in time
viable able to survive
weight the force of gravity on the mass of an object white dwarf a small, dense, dim star that has lost its outer layers and is at the end of its lifetime
word equation a chemical reaction written using the names of the reactants and products work (W) the amount of energy transferred when an applied force causes an object to move some distance
zero calibration error a measuring instrument giving a non-zero reading when the true value should be zero
zygote a fertilised egg produced by the fusion of male (sperm) and female (ovum) gametes
AABO blood types, 94–5 Aboriginal and Torres Strait Islander Peoples adaptations among, 123 ancestors of, 170 astronomy and, 286–7 cooking by, 362 Cultural Lore of, 286–7 ethics and, 31–2 inheritance patterns among, 84 misconceptions about, 139 natural foods of, 253, 269 tools and artworks of, 256–8, 420 traditional medicines of, 140–2 absolute dating of fossils, 156 absolute uncertainty, 13–14 absorption spectra, 202, 299 acceleration, 392–3, 403 accuracy, 10, 11 acid-base reactions, 248–50 acid-metal reactions, 245–6 actinoids, 192 activation energy, 261 adaptations, 123, 126 adhesives, 257 ageing, human, 62 agitation (in chemistry), 268 AI see artificial intelligence (AI) airbags, 280 albinism, 122 alkali metals, 208–9 alkaline earth metals, 211–12 allele frequency, 121 alleles, 77 alloys, novel, 333–4 Alpha Centauri, 305 Alzheimer’s disease, 64 analogous structures, 160–1 anaphase, 72, 75, 76 anatomy, 151, 160–4 Andromeda Galaxy, 305 aneuploidy, 103 animal welfare, 32 anions, 204 antibiotic resistance, 140–1 antigens, 94 aqueous solutions, 229 arcseconds, 308 artificial intelligence (AI), 273 artificial selection, 146–9 asexual reproduction, 70 astrometric data, 292 astronomical distances, 307–8 astronomical units, 307 astronomy concept map for, 283 data collected in, 290–2
early, 286–8 modern-day, 289–95 technologies used in, 289–90 atomic radii, 200 atoms, 198 autosomal dominant inheritance, 97 autosomal recessive inheritance, 97 autosomes, 79 average speed, 390 average velocity, 391
Bbaking, 242 baselines, 307 bases, 56, 248
Béguyer de Chancourtois, Alexandre-Émile, 182 Bennell-Pegg, Katherine, 322 Berzelius, Jöns Jacob, 181 bias, implicit, 31 Big Bang, 295, 314–19 biochemistry, 151 biodiversity, 130–1 in Australia, 132–3 maintenance of, 133–4 bioethanol, 254 biogeography, 151, 167 biostratigraphy, 155 biota, 131 bipedal creatures, 168 Black Death, 101 black holes, 302, 303 blinding (in research), 34 blood types, 92, 94–5 blue shift, 311 Bohr, Niels, 202 bottleneck effect, 125–6 bubonic plague, 101 burettes, 23 bush medicines, 140–2 B-V colour index, 298
C
calcination, 256 cane toads, 127 carcinogens, 100 carriers (in genetics), 85 case studies, 28 catalysts, 271, 273 cations, 204 cattle, 349 centromeres, 61 charcoal making, 257 chemical energy, 347 chemical formulas, 228 chemical reactions acid-base, 248–50 acid-metal, 245–6
agitation and, 268 catalysts and, 271 chemical concentrations and, 262 concept map for, 225 decomposition, 241–2 displacement, 242–3 endothermic, 237 exothermic, 236–7 gaseous pressure and, 264 precipitation, 250 rates of, 259–73 surface area and, 264 synthetic, 240–1 temperature and, 268 types of, 236–50 useful, 253–8 written representations of, 227–34 Christiansen, Jessie, 313 chromatids, sister, 61 chromatin, 60 chromosomes, 60–2, 70, 71 abnormal numbers of, 103 changes in, 102–3 homologous vs non-homologous, 71, 79 mutations in, 100, 102 non-disjunction of, 103 sex, 80, 82, 103 Clark, Jake, 312 coal, 370 codominance, 94 codons, 66–7 coefficients (in chemistry), 231 collisions (in chemistry), 261 colour blindness, 93 communication of results, 43–7, 98 comparative anatomy, 151, 160–4 comparative embryology, 165 complementary base pairing, 57 composite materials, 222 concentrated solutions, 262 concentrations (in chemistry), 262 conclusions, 5, 43, 44 confidentiality, 33 conservation, 134 constant velocity, 393 constellations, 286, 287 continents, 130 continuous spectra, 299 control groups, 33 controlled variables, 8 convenience sampling, 35–6 cooking, 242, 362 Copernicus, Nicolaus, 288 coronaviruses, 68 cosmic microwave background, 314 covalent bonds, 205–6 cows, 349 CRISPR technology, 41, 106
crossing over, 77 cultivars, 147 cultural appropriation, 31 Cultural Lore, Aboriginal, 286–7
Curie, Marie, 186 cystic fibrosis, 122 cytokinesis, 73, 76
DDalton, John, 181 dark energy, 317 dark matter, 316, 317 Darwin, Charles, 137 data, 5 in astronomy, 290–2 collection of, 10–11 outliers among, 11 primary vs secondary, 43 safety, 20–1 data collection, 10–11 data loggers, 26–8 dating of fossils, 155–6 de Chancourtois, Alexandre-Émile Béguyer, 182 deceleration, 393 decomposition reactions (in chemistry), 241–2 de-extinction, 107 deletions (of nucleotides), 102 deoxyribonucleic acid (DNA) changes in, 100–10 discovery of, 60 hybridisation of, 166 interspecies comparisons of, 165–6 manipulation of, 106–9 purpose of, 64 replication of, 71–2 size of, 59 structure of, 56–7 testing of, 105 dependent variables, 7 design, experimental, 9–16 designer babies, 148 diatomic chemicals, 228 dilute solutions, 262 dinosaurs, 154 diploid number of chromosomes, 70, 71 direct evidence for evolution, 151 displacement (in physics), 345, 385–6, 404 displacement reactions (in chemistry), 242–3 displacement-time graphs (in physics), 400 distance, 385–6 astronomical, 307–8 measurement systems for, 386 distance-time graphs, 398 DNA see deoxyribonucleic acid (DNA)
dog breeds, 148 dominant characteristics (in genetics), 85 Doppler effect, 310–11 double-blind procedures, 34 Down syndrome see trisomy 21 (Down syndrome) Dreaming stories, 286–7 Duchenne muscular dystrophy, 93, 122 ductile metals, 191 dwarf planets, 341
Efor solar panels, 373 for wind turbines, 372 see also Sankey diagrams energy profile diagrams, 236, 237 enrichment, nuclear, 371 environmental effects on measurements, 12 enzymes, 273 epoch of recombination, 315 equipment, experimental, 22–6 errors, experimental, 12–13, 16 ethanol making, 253–4 ethics, 31–4
Event Horizon Telescope, 294 evolution
Döbereiner, Johann Wolfgang, 181
Eagle Nebula, 306 Earth, history of, 131 earth ovens, 362 economic implications of research, 40 ecosystem diversity, 130 elastic energy, 347 elastic potential energy, 355 electric energy, 347 electron configurations, 199–200 electron shells, 198–9 electrons, 189, 198–206 energy and, 201 excited, 201 position of, 198–9 valence, 200, 204 elements (in chemistry), 181 electron configurations in, 199 female researchers and, 186 male researchers and, 181–2 predicting existence of, 183 see also periodic table embryology, 151 embryos, 70 emission spectra, 202, 299 emissions, zero, 369 endangered species, 133 endemism, 132 endothermic reactions (in chemistry), 237 energy, 345–7 activation, 261 conservation of, 343, 359 dark, 317 efficient use of, 360–2 elastic potential, 355 gravitational potential, 350–1 useful, 360 various sources of, 369–75 various types of, 347 wasted output, 360 see also specific types of energy energy flow diagrams, 361 for coal-fired power stations, 370 for geothermal power stations, 375 for hydroelectricity generation, 373 for nuclear power stations, 371
concept map for, 119 evidence for, 151–70 human, 168–9 mechanisms of, 121–7 evolutionary trees, 164 excited electrons, 201 exoplanets, 311–12 exothermic reactions (in chemistry), 236–7 experimental design, 9–16 experimental error, 12–13, 16 experimental variables, 7–8 experiments, 28 design of, 34–6 explosive materials, 209 external validity, 10 extinct species, 133, 134, 135 extinction, 107, 131 extraneous variables, 8 Ezold, Julie, 186
F
fair tests, 7 feasible research, 6 fermentation, 253–4, 269 fertilisation, 70, 77, 147, 149 fertility, 144 fieldwork, 28 funding for, 7 filial (of generations), 88 findings see conclusions fireworks, 202 foods, natural, 253, 269 force/s, 345, 409–10, 411, 413 formulas for acceleration, 393 for average velocity, 391 chemical, 228 for elastic potential energy, 355 for energy efficiency, 362 for gravitational potential energy, 350 for gravity (weight force), 413 for kinetic energy, 348 for net force, 411 for speed, 388 for work, 345 fossil fuels, 369
fossil record, 132 fossilisation, 151–3 fossils, 151 absolute dating of, 156 evolution and, 160 index, 156 living, 154 relative dating of, 155–6 transitional, 157 founder effect, 125 Fox, Megan, 97 Franklin, Rosalind, 60 fuel cells, 241 funding, 7
Ggravitational energy, 347 gravitational potential energy, 350–1 gravitational waves, 303 gravity, 316, 329–30, 413 ground state, 199 groups (in chemistry), 188–9, 208–16 alkali metals, 208–9 alkaline earth metals, 211–12 halogens, 214–15 noble gases, 216
Hinterbreeding, 145 interferometry, 289 internal validity, 10 interphase, 72, 75 interviews, 29 inversion (of nucleotides), 102 investigable research questions, 6 investigations conduct of, 20–40 planning of, 5–16 sharing results of, 43–8 ionic bonds, 205 ions, 204
gait analysis, 406 galaxies, 302, 305 classification of, 306 formation of, 316 Galilei, Galileo, 288 gametes, 70 gene editing, 41 gene flow, 124 gene mutations, 101–2 gene pools, 125 gene technologies, 149 gene therapy, 109–10 genes, 56 genetic diseases, 122 genetic diversity, 130, 146 genetic drift, 125 genetic engineering, 106–9 genetic information, transmission of, 70–82 genetic screening, 105 genetic testing, 82 genetic variation, 121 genetically modified organisms (GMOs), 107–8 genetics, 56 concept map for, 53 genomes, 85 genotypes, 84 geocentric model of universe, 288 geographic isolation, 144 geothermal energy, 374–5 germline mutations, 100 gliders (aircraft), 353 globes of Earth, 30 light, 215 GMOs see genetically modified organisms (GMOs) Goddard, Robert, 323 Goldilocks zone, 311 gonads, 70 Gould, John, 137 gradients (in physics), 398 graphs displacement-time, 400 distance-time, 398 velocity-time, 402
Haber process, 234 haemophilia, 122 half-life, 156 halogen light globes, 215 halogens, 214–15 haploid number of chromosomes, 70, 71
heliocentric model of universe, 288 heredity, 56 heterozygous for a trait, 84 Hoffman, Darleane, 186 Homo sapiens, evolution of, 168–9 homologous chromosomes, 71 homologous structures, 161 homozygous for a trait, 84 hot Jupiters, 312 H-R (Hertzsprung-Russell) diagrams, 304 Hubble, Edwin, 318 Hubble’s law, 318 human genome project, 85, 110 human rights, 33 humans, evolution of, 168–9 Huntington’s disease, 90 hybrids, 144, 145 hydroelectric power, 373 hydrogen bonds, 57 hyperaccumulators, 7 hypotheses, 5, 8–9
Iimaging data (in astronomy), 290 implicit bias, 31 in vitro fertilisation, 147, 149 inbreeding, 176 incomplete dominance, 95 independent groups design, 36 independent variables, 7 index fossils, 156 indirect evidence for evolution, 151 induced mutations, 100 inertia, 409–10 informed consent, 33 inheritance chance and, 88–91 patterns of, 84–97 insertions (of nucleotides), 102 instantaneous speed, 390 instantaneous velocity, 391, 402 instrument effects, 12
J
J, Jessie, 97
James Webb Space Telescope, 295 Jupiters, hot, 312
K
karyotypes, 79–80 kinetic energy, 236, 347, 348 kinship, 84 koalas, 124
L lampshades, 215 lanthanoids, 192, 193 Large Hadron Collider, 30, 204 lattice structures, 205 Lavoisier, Anton, 181 Law of Conservation of Energy, 359 law of octaves (in chemistry), 182 legal implications of research, 40 life on Earth, history of, 131 light, 289 Doppler effect and, 311 speed of, 307, 390 from stars, 298–9 light globes, halogen, 215 light years, 307, 390 light-emitting materials, 193, 201, 269 Likert scales, 38 literature reviews, 6 loci, 84 luminescence, 193 luminosity, 298, 301, 304 lustrous metals, 191
M macromolecules, 63 main sequence (in astronomy), 301 malleable metals, 191 Mars, mission to, 331–2 Marshall, Barry, 47–8 mass (in physics), 348, 411 mass extinction, 131 massive stars, 302 matched participants design, 36 mean, 14
measurements, 12 mechanical energy, 347 medicines, 265 precision, 106 traditional, 140–2 megafauna, 132–3 meiosis, 70 mitosis and, 78–9 stages of, 75–6 Meitner, Lise, 186 melanoma, 100 Mendel, Gregor, 88–9 Mendeleev, Dmitri, 182, 183 metal displacement reactions, 243 metalloids, 194 metals, 191–2 alkali, 208–9 alkaline earth, 211–12 ductile, lustrous or malleable, 191 mining of, 7 transition, 192 see also alloys, novel metaphase, 72, 75, 76 methodology, 5 metre, definition of, 386 microgravity, 329–30 Milky Way, 305 misinformation, 98 mitosis, 70 meiosis and, 78–9 stages of, 72–3 mitotic cells, 73 models, 29–30, 31, 288 molar mass, 432 mole, 432 molecular biology, 165–7 molecular clocks, 167 molecular clouds (nebulae), 302 molecular phylogeny, 151 molecules, 228 monatomic/ monoatomic chemicals, 228 monohybrid crosses, 89 monomers, 56 moths, 138 motion concept map for, 383 graphing of, 398–404 Newton’s laws of, 409–10, 411, 416 Mungo Lady and Mungo Man, 170 mutagens, 100 mutations, 71, 100–2, 122
Newlands, John, 182 Newton, Sir Isaac, 409 Newton’s first law of motion, 409–10 Newton’s second law of motion, 411 Newton’s third law of motion, 416 nitrogenous bases, 56 noble gases, 216 non-disjunction of chromosomes, 103 non-homologous chromosomes, 79 non-metals, 194 non-mitotic cells, 73 non-renewable sources of energy, 369, 370–1 Norfolk Island, 125 novel research questions, 6 nuclear energy, 347, 370–1 nuclear fusion, 297 nucleic acids, 63 see also deoxyribonucleic acid (DNA); ribonucleic acid (RNA) nucleotides, 56
Oobservable universe, 305 map of, 318 observation errors, 12 observational studies, 29 octet rule (in atomic structure), 198 optical telescopes, 292 origin (in graphs), 400 outliers among data, 11 ova, 70, 77 ovaries, 70
N natural selection, 126, 138–40 nebulae, 301, 302, 306 neon signs, 216 net force, 409–10 neutralisation reactions (in chemistry), 248–50 neutron stars, 302 neutrons, 198
paints, 257 palaeontology, 151–60 parallax, 307–8 parallax error, 12 parsecs, 308 participants in research, human vs animal, 32–3 particle accelerators, 257 particle diagrams, 229–30 payloads, 326 pedigrees, 96–7 peer review, 6 peppered moths, 138 peptic ulcers, 47–8 percentage uncertainty, 15 periodic table blocks of, 191–4 concept map for, 179 development of, 181–6 first depiction of, 182 structure of, 188–94 trends in, 190–1 periods, chemical, 189–90 personal errors, 13 pharmaceuticals, 265 pharmacogenomic tests, 106
Phelps, Clarice, 186 phenotypes, 85 photometric data (in astronomy), 291 photometry, 289 photons, 315 photosynthesis, 237 physiological challenges of space travel, 327–9 phytomining, 7 pigment making, 256 pipettes, 22–3 placebo effect, 34 placebos, 34 planes, engine-less, 353 planetary nebulae, 301 planets in our solar system, 340 plasma (in astronomy), 315 plaster making, 256 Pleiades, the, 287 point mutations, 100 polarimetric data (in astronomy), 291 polymers, 56 polypeptides, 66 populations (in ecology), 121 populations (in investigations), 16 potential energy, 236, 347, 350 practical reports, 45 precipitation reactions, 250 precision, 11 precision medicines, 106 predictions, 9 pressure gaseous, 264 selection, 139–40, 145, 149 pressure, gaseous, 264 primary data, 43 probes (in chemistry), 26–8 products (in chemistry), 227 projectiles, 420 prophase, 72, 75, 76 proteins
interspecies comparisons of, 166 misfolding of, 64 synthesis of, 64–8 therapeutic, 67–8 protons, 198 Ptolemy, Claudius, 288 Punnett square, 89 pygmy possums, 134 pyrolysis, 257–8
R
racism, 139 radiant energy, 347 radio telescopes, 293 radioisotopes, 156 random allocation, 36 random errors, 12, 13 random sampling, 35–6 randomised controlled trials, 44 ranges of value (in measurements), 14 rationales, 5 reactants, 227
reaction rates (in chemistry), 259–73 reactivity series (in chemistry), 243 reading errors, 13 recessional velocity, 318 recessive characteristics (in genetics), 85 recombination (in genetics), 77 red giants, 301 red shift, 311 red supergiants, 302 reduction division, 75 relative atomic mass, 189, 433 relative dating of fossils, 155–6 relative uncertainty, 14–15 reliability of results of investigations, 9 renewable sources of energy, 369, 372–5 current research in, 375 repeatability, 10, 16–17 repeated measures design, 36–7 replicability, 10, 16–17 reproducibility, 10 reproduction, 70, 127, 145, 147–8 reproductive isolation, 145 reproductive technologies, 147–8 research
legal, economic and social implications of, 40 sharing results of, 43–8 see also investigations research methods, specialised, 28–31 research questions, 5, 6 retrograde motion (of planets), 288 Rhesus blood types, 92 ribonucleic acid (RNA), 63 right to withdraw, 33 rights, human, 33 risk management, 20–1 RNA see ribonucleic acid (RNA) rock wallabies, 145 rockets, 325–6 Rubin, Vera, 316, 317
SSadler, Elaine, 295 safety data sheets, 20–1 salts, 245 sample sizes, 16 sampling, 16, 34–6 Sankey diagrams, 365 satellites, 332–3 science skills, concept map for, 3 scientific method, 5, 45 scientific papers, 45–7 scientific posters, 45–6 scoliosis, 116 secondary data, 43 sedimentary rocks, 155 selection, natural vs artificial, 137–49 selection pressure, 139–40, 145, 149 selective advantages, 126 selective breeding, 146 sex chromosomes, 80, 82, 103
sex-linked inheritance, 93 sexual reproduction, 70, 127 Shaughnessy, Dawn, 186 SI units of measurement, 389 sickle cell anaemia, 103, 122, 140 simulations, 29–31 singularity (in astronomy), 314, 319 sister chromatids, 61 smart devices/ watches, 349 social implications of research, 40 solar energy, 372–3 solar panels, 372–3, 375 solar system dwarf planets in, 341 planets in, 340 size of, 338–9 somatic cells, 70 somatic mutations, 100 sound, Doppler effect and, 310 sound energy, 347 space exploration of, 322–32 physiological challenges of travelling in, 327–9 as a research environment, 332–3 travel into, 324–6 space technology, 333–4 space-based astronomical observations, 290 speciation, 144–6 species, 133, 134, 135, 144–6 species diversity, 130 spectra, 202, 299 spectral classes, 297–8 spectral data (in astronomy), 291 spectroscopes, 202, 289 speed, 388–9 average, 390 formula for, 388 instantaneous, 390 of light, 307, 390 sperm, 70, 77 spontaneous mutations, 100 Square Kilometre Array Observatory, 293 stars, 297–304 brightness of, 298, 301, 304 colours and temperatures of, 297–9 formation of, 316 life cycles of, 301–2 light from, 298–9 massive, 302 neutron, 302 state symbols (in chemistry), 229 stationary objects, 393 stem cells, 73 stirring (in chemistry), 268 strata, 35 stratified sampling, 35–6 stratigraphy, 155 Stuart, Madeline, 104 substitutions (of nucleotides), 101 supergiants (in astronomy), 302
supernovas, 302 surface area, 264 surveys, 29 sustainable practices, 369, 380 symbol equations (in chemistry), 228 balancing of, 230–1 symbols (in chemistry), 181 synchrotrons, 257 synthetic reactions (in chemistry), 240–1 systematic errors, 12
Ttelescopes, 288, 289, 292–5 telluric screw, 182 telomeres, 61–2 telophase, 73, 76 temperature and chemical reactions, 268 terminal velocity, 391 test crosses, 91 testes, 70 therapeutic proteins, 67–8 thermal decomposition, 242 thermal energy, 347 thinking routines
3-2-1 Bridge, 227, 273
Chalk talk, 253
Claim, support, question, 124
Compass points, 62, 148
Complexity scale, 319
Connect, extend, challenge, 73, 135, 211
Elaboration game, 401
Facts or fiction, 98
Generate-sort-connectelaborate, 376
I used to think … now I think …, 109, 195
Looking ten times two, 385
Projecting across time, 296
Reporter’s notebook, 332
See, think, wonder, 306, 364
Think, feel, care, 105
Think, pair, share, 9
Think, puzzle, explore, 297
Tug for truth, 133
What can be, 186 throwing devices, 420 thrust, 325 titres, 23 tomatoes, genetically modified, 108 trace fossils, 151 traditional medicines, 140–2 traits, 57 transcription, 65–6 transgenic organisms, 108–9 transition metals, 192 transitional fossils, 157 translation (in protein synthesis), 65, 66–7 transportation, 426 travel, interstellar, 311–13
triads (in chemistry), 181 trisomy, 103, 104 trisomy 21 (Down syndrome), 82, 104 tsunami models, 31 turtles, 154 twins, types of, 78
U uncertainty absolute, 13–14 percentage, 15 relative, 14–15 units of measurement, 389 universe age of, 318 expansion of, 317 models of, 288 observable, 305, 318 useful energy, 360
Vvaccines, 44, 67–8 valence electrons, 200, 204 valence shells, 200 validity, 10, 16, 43–4 variables, 7–8 variation, 121 vectors, 385 velocity, 348, 391 instantaneous, 391, 402 recessional, 318 velocity-time graphs, 402 viability, 144 volcanoes, 132
WWarren, Robin, 47–8 wasted output energy, 360 weight, 413
white dwarves, 301 wind energy, 372 wind turbines, 372 word equations (in chemistry), 227 work (in physics), 345
X
X chromosomes, 80 xenotransplantation, 109 X-linked dominant inheritance, 97 X-linked recessive inheritance, 97
Y
Y chromosomes, 80
Z
zero calibration error, 12 zero emissions, 369 zygotes, 70
Title: Cambridge Science for Victoria Year 10 2nd edition
The author and publisher wish to thank the following sources for permission to reproduce material:
Cover: © Getty Images / skymoon13.
Images: © Getty Images / Ashley Cooper, Chapter 1 Opener / SolStock, 1.2 / Zocha_K, Table 1.1(1) / Alikemalkarasu, Table 1.1(2) / Auncaycetin, Table 1.1(3) / Neil W Zoglauer, 1.5 / Tomohiro Iwanaga, 1.6(1) / Chuchart Duangdaw, 1.6(2) / Hill Street Studios, 1.18 / Michele Constantini/PhotoAlto, p.19 / A Mokhtari, p.24 / Huntstock, 1.20 / Smith Collection/Gado, 1.23 / Philip Thurston, 1.24 / Westend61, 1.25 / Pascal Boegli, 1.27 / Gary Leonard, 1.31 / Science Photo Library, 1.32 / Ted Mead, 1.36 / Traffic_analyzer, p.41 / Ktsdesign, Chapter 2 Opener / Ali Damouh, Table 2.1/ Ariel Skelley, 2.2 / Universal History Archive, 2.4 / Kateryna Kon, 2.9 / GSO Images, 2.11 / GlobalP, 2.16 / Science Photo Library, 2.16(3) / Ali Damouh, 2.18 / Ed Reschke, 2.19(a) / Ed Reschke, 2.19(b) / Thomas Barwick, 2.23 / KATERYNA KON/SCIENCE PHOTO LIBRARY, p.83 / Christopher Robbins, 2.31 / Brand X Pictures, 2.32 / Jonathan Knowles, 2.33 / Westend61, 2.34 / John White Photos, 2.35 / Jordan Siemens, 2.41 / Lester Cohen, 2.44(left) / SOPA Images, 2.44(right) / Callista Images, 2.48 / MOLA, 2.49 / Cultura RM Exclusive/Michael J. Klein, M.D., 2.51 / Mike Coppola, 2.54 / Mike Kemp, 2.60 / Wirestock, 2.62(b) / imageBROKER/Juergen Pfeiffer, 2.62(c) / Alan Phillips, 2.66 / NigelHicks, Chapter 3 Opener / Eurasia Sport Images, 3.3(d) / Eva-Katalin, 3.4 / Andrea Gambadoro - Filmmaker and Photographer, p.124 / bortonia, 3.18 / Artie Photography (Artie Ng), 3.20(b) / John Scott, p.133 / Ian_Redding, 3.22 / Jason Edwards, 3.23 / Ali Majdfar, 3.25 / Aaron Foster, p.136 / 4FR, 3.27 / Ian_Redding, 3.29 / Bettmann , 3.31 / PjHickox, 3.33(c) / Chris Rogers, 3.34(a) / Tier Und Naturfotografie J und C Sohns, 3.36 / Thomas Janisch, 3.37(1) / Mark Chivers, 3.37(2) / Bryant Scannell, 3.37(3) / Alexandr Ghereg / 500px, 3.39(a) / Robert Pickett, 3.39(b) / John P Kelly, 3.39(c) / Glasshouse Images, 3.39(d) / Creativ Studio Heinemann, 3.40(a) / Joff Lee, 3.40(b) / AlasdairJames, 3.40(c) / Burke/Triolo Productions, 3.40(d) / GK Hart/Vikki Hart, 3.41 / Vchal, p.148 / Andrew Peacock, 3.44 / LAURENT FIEVET, 3.51 / DEA / G. Cigolini, 3.53(a) / DEA / C. Bevilacqua, 3.53(b) / ullstein bild , 3.55 / Sylvain CORDIER, 3.57(a) / Joe McDonald, 3.57(b) / Rizky Panuntun, 3.60(a) / Vanessa Mylett, 3.60(b) / Kristian Bell, 3.60(c) / Peter Funnell, 3.67(a) / Schafer & Hill, 3.67(b) / Doug Cheeseman, 3.67(c) / Verónica Paradinas Duro, 3.67(d) / , 3.70 / Lisa Maree Williams, 3.71 / SEAN GLADWELL, 3.76(a) / Artur Debat, 3.76(b) / Oselote, Chapter 4 Opener / Davidf, 4.7 / Ted Streshinsky Photographic Archive, 4.8 / Betka82, 4.14 / Jose A. Bernat Bacete, p.191 / Dimitris66, p.192 / PhotoAlto / Dinoco Greco, 4.16 / Lester V. Bergman/ Getty Images, 4.17 / Alfred Pasieka/Science Photo Library, 4.18 / Douglas Sacha, p.197 / Laurie Wilson, 4.25 / Nemoris, 4.26 / The Eternity Photography, 4.27 / Nemoris, 4.28 / Jose A. Bernat Bacete, p.206 / Tom Grill, 4.38 / Kokkai Ng, 4.43 / Adam Brackenbury/Science Photo Library, 4.44 / Vesnaandjic, 4.47 / Kelly Cheng Travel Photography, Chapter 5 Opener / Davidf, 5.1 / Abstract Aerial Art, 5.2 / DNY59, 5.4 / Tianjin Shi, 5.8 / PhotoPlus Magazine, 5.9 / Designer_things, 5.10 / Imagenavi, p.238 / Michelle Bishop, 5.13 / Image Professionals GmbH, 5.15 / Douglas Sacha, p.245 / DarthArt, 5.17 / Jackie Bale, 5.19 / fcafotodigital, 5.20 / dra_schwartz, p.251 / Raj Kamal, 5.22 / REDA&CO, 5.23 / Darknstormy Images, 5.26 / ElementalImaging, p.259 / Szjphoto, 5.28 / Adam Gault, 5.32 / Tom Hoenig, 5.34 / Evrim Ertik, 5.35 / Jakovo, 5.40 / Sergi Escribano, 5.41 / P. Steeger, p.275 / GIPhotoStock, p.278 / Saravuth-Photohut, 5.53 / Jean-Luc Luyssen, 6.3 / Jeren Tan, 6.4 / Yury Prokopenko, 6.8 / Jamesbenet, 6.10 / Andrzej Wojcicki, p.296 / Matthias Kulka, 6.23 / Michael Miller/Stocktrek Images, p.306(a) / Stocktrek Images, p.306(b) / Westend61, p.306(c) / Steven Robinson Pictures, p.306(d) / Ron Miller/Stocktrek Images, 6.39 / The Washington Post, 6.45 / John Shepherd, p.321 / Ina Fassbender, 6.49 / Designer29, p.323(1) / Stocktrek Images, p.323(2) / Bortonia, p.323(3) / Jose A. Bernat Bacete, p.323(4) / Sciepro, p.323(5) / Sorbetto, p.323(6) / VectorBird, p.323(7) / Dimitris66, p.323(8) / Bortonia, p.323(9) / Mark Garlick, p.323(10) / Easy_Company, p.323(11) / Bettmann, p.323(12) / smartboy10, p.323(13) / PhillipMinnis, 6.50 / Quantic69, 6.56(a) / Morsa Images, 6.61 / Print Collector, 6.63 / Mark Garlick, 6.65 / DMP, 7.1 / Mel Curtis, 7.2 / Dove Lee, Table 7.1(1) / RelaxFoto.de, Table 7.1(2) / Johner Images, Table 7.1(3) / Run Photo, Table 7.1(4) / Rich Vintage, Table 7.1(5) / Krystle Wright, Table 7.1(6) / KieselUndStein, Table 7.1(7) / Shahzad Siddiqui, Table 7.1(8) / Catherine Falls Commercial, Table 7.1(9) / Tatiana Maksimova, Table 7.1(10) / Antony xJhn / 500px, Table 7.1(11) / Kali9, 7.3 / Leah Warkentin, 7.4 / Whitworth Images, 7.5 / Cavan Images, 7.6 / Thomas Barwick, 7.7 / Klaus Vedfelt, 7.8 / Colin Anderson Productions pty ltd, 7.9 / Mevans, 7.10 / MirageC, 7.11 / Westend61, 7.12 / Black 100, 7.14 / Boy_Anupong, 7.15 / Design064 / Imazins, 7.16 / Tim Clayton - Corbis, 7.21(1) / Carmen Mandato, 7.21(2) / Az Jackson, 7.22 / Mixetto, 7.22 / Carlo A, p.368 / Paul Souders, 7.24 / Ezypix, 7.25 / Simon McGill, 7.26 / Bloomberg, 7.27 / Bloomberg, 7.28 / Dmitry Naumov, 7.31 / Southern Lightscapes-Australia, 7.33 / Yangna, 7.35 / Tim Phillips Photos, 7.38 / Petmal, 7.39 / Bben Photographer, 7.40 / Songphol Thesakit, 7.42 / Prasert Krainukul, p.379 / Maskot, 7.44(1) / Guido Mieth, 7.44(2) / Nigel Killeen, Chapter Opener 8 / DrPixel, 8.1 / RG-vc, 8.3 / Dave Williams, 8.7(a) / Himagine, 8.7(b) / Photography by Mangiwau, 8.7(c) / Marin Tomas, 8.7(d) / Tobias Titz, 8.11 / Graiki, 8.12 / SolStock, 8.15 / Simon McGill, 8.16 / Cameron Spencer, 8.24 / Microgen Images, 8.25 / Diane Keough, 8.32 / Imaginima, Table 8.4(a) / Parameter, Table 8.4(b) / Digital Vision, Table 8.4(c) / Parameter, Table 8.4(d) / JestersCap, 8.36(a) / Bloomberg, 8.36(b) / Clive Mason, 8.38 / Marlon Trottmann, 8.40(a) /
Uncorrected
Mbbirdy, 8.40(b) / Kevin Sabitus, 8.41 / Cameron Spencer, 8.43 / SimonSkafar, 8.47; Vitold Muratov, CC BY-SA 3.0, via Wikimedia Commons, 1.26(a); Image from NASA, 1.26(b); The State of Queensland (Department of Environment and Science) 2018 CC BY 3.0 Australia licence, 1.28; WikiEdtingProfile2021, CC BY-SA 4.0, via Wikimedia Commons, 1.41(a); A friend of Akshay Sharma, CC BY-SA 3.0, via Wikimedia Commons, 1.41(b); Mark Marathon, CC BY-SA 3.0, via Wikimedia Commons, 1.3; Whispyhistory, CC BY-SA 4.0, via Wikimedia Commons, 1.38; Nick Rains/AUSCAPE, 2.29; Reproduced by the permission of Norfolk Plant Sciences, 2.62(c); Reproduced by the permission of Scolidoc, 2.68; MagentaGreen, CC BY-SA 2.0, via Wikimedia Commons, 2.4(b); NIAID-RML (https://www.niaid.nih.gov/ & https://www.niaid.nih.gov/about/rocky-mountain-laboratories), CC BY 2.0, via Wikimedia Commons, 2.14; Wikipedia, GFDL, via Wikimedia Commons, 2.22; Russ London at English Wikipedia, CC BY-SA 3.0, via Wikimedia Commons, 2.30(1); Stephencdickson, CC BY-SA 4.0, via Wikimedia Commons, 2.30(2); Fructibus, CC0, via Wikimedia Commons, 2.42; CC BY-SA 3.0, via Wikimedia Commons, 2.52; CarloDiDio, CC BY-SA 3.0, via Wikimedia Commons, 2.52; Tobias “ToMar” Maier, CC BY-SA 3.0, via Wikimedia Commons, 2.57; Neil Palmer, CC BY-SA 4.0, via Wikimedia Commons, 2.59; International Rice Research Institute (IRRI), CC BY 2.0, via Wikimedia Commons, 2.61; CSIRO, CC BY 3.0, via Wikimedia Commons, 2.65; Dimitrios Athanatos, Christos Tsakalidis, George P Tampakoudis, Maria N Papastergiou, Fillipos Tzevelekis, George Pados, and Efstratios A Assimakopoulos, CC BY 3.0, via Wikimedia Commons, p.113; / DMP, 7.1/ RG-vc, 8.3imageBROKER. com GmbH & Co. KG / Alamy Stock Photo, 3.3; Used image from, Kjeldsen, S.R., Zenger, K.R., Leigh, K. et al. Genome-wide SNP loci reveal novel insights into koala (Phascolarctos cinereus) population variability across its range. Conserv Genet 17, 337–353 (2016). https://doi.org/10.1007/s10592-015-0784-3, 3.6; Used image from Nicoll, Robert & McKellar, John & Ayaz, Areeba & Laurie, John & Esterle, Joan & Crowley, Jim & Wood, Geoff & Bodorkos, Simon. (2015). CA-IDTIMS dating of tuffs, calibration of palynostratigraphy and stratigraphy of the Bowen and Galilee basins. used with the permission of Geoscience Australia, 3.20(a); Reproduced by the permission of Lindy Lumsden, 3.26(a); Carine06 from UK, CC BY-SA 2.0, via Wikimedia Commons, 3.3(a); Flickerd, CC BY-SA 4.0, via Wikimedia Commons, 3.3(b); Steffen Prößdorf, CC BY-SA 4.0, via Wikimedia Commons, 3.3(c); fourthandfifteen, CC BY 2.0, via Wikimedia Commons, 3.3(e); Steve Daggar, CC BY 3.0, via Wikimedia Commons, 3.7; Leon Berard, CC BY-SA 3.0, via Wikimedia Commons, 3.9; Matt from Melbourne, Australia, CC BY 2.0, via Wikimedia Commons, 3.11; Dietmar Rabich / Wikimedia Commons / “Kakadu (AU), Kakadu National Park, Anbangbang Rock Shelter -- 2019 -- 4092” / CC BY-SA 4.0For print products: Dietmar Rabich, 3.22; Jss367, CC BY-SA 4.0, via Wikimedia Commons, 3.24; State of Queensland, CC BY 3.0 AU, via Wikimedia Commons, 3.26(b); Melburnian, CC BY-SA 3.0, via Wikimedia Commons, 3.32; Geoff Derrin, CC BY-SA 4.0, via Wikimedia Commons, 3.33(a); Vinayaraj, CC BY-SA 4.0, via Wikimedia Commons, 3.33(d); DavidFrancis34 from Australia, CC BY-SA 2.0, via Wikimedia Commons, 3.33(e); Atlas of Living Australia, CC BY 2.0, via Wikimedia Commons, 3.33(f); Mark Interrante from Silicon Valley, USA, CC BY-SA 2.0, via Wikimedia Commons, 3.34(b); Hkandy, CC BY-SA 3.0, via Wikimedia Commons, 3.34(c); Ruth boraggina from Belleville, USA, CC BY 2.0, via Wikimedia Commons, 3.34(d); Golden hamster, CC BY-SA 4.0, via Wikimedia Commons, 3.38; CSIRO, CC BY 3.0, via Wikimedia Commons, 3.35; Dmitry Bogdanov, CC BY-SA 3.0, via Wikimedia Commons, 3.45(a); Partonez, CC BY-SA 4.0, via Wikimedia Commons, 3.45(b); James St. John, CC BY 2.0, via Wikimedia Commons, 3.45(c); Meg Stewart from Poughkeepsie, NY, U.S.A., CC BY-SA 2.0, via Wikimedia Commons, 3.46; Oregon State University, CC BY-SA 2.0, via Wikimedia Commons, 3.47; Jonathan Chen, CC BY-SA 4.0, via Wikimedia Commons, 3.49; Emin Ba ar ÖZDEM R, CC BY 3.0, via Wikimedia Commons, 3.50; Masahiro miyasaka, CC BY-SA 4.0, via Wikimedia Commons, 3.56; Reproduced by the permission of The Board of Trustees of the Science Museum, 4.3 Charles D. Winters / Science Source, 4.36; CC BY 4.0, via Wikimedia Commons, 4.1; Public domain, via Wikimedia Commons, 4.9; Austrian National Library, Public domain, via Wikimedia Commons, 4.9; Science History Institute, CC BY-SA 3.0, via Wikimedia Commons, 4.9; Courtesy of Oak Ridge National Laboratory, U.S. Dept. of Energy., Public domain, via Wikimedia Commons, 4.9; U.S. Department of Energy, Public domain, via Wikimedia Commons, 4.9; United States Department of Energy, Public domain, via Wikimedia Commons, 4.9; Alchemist-hp (talk) (www.pse-mendelejew. de), FAL, via Wikimedia Commons, p.218; Reproduced by the permission of Kelsian Group, 5.14; TURTLE ROCK SCIENTIFIC / SCIENCE SOURCE / SCIENCE PHOTO LIBRARY, 5.21; Used from Bluebell Arboretum and Nursery, 5.22; Used from École normale supérieure Paris-Saclay, 5.24; NASA/JPL-Caltech/R. Hurt (SSC/Caltech), 6.31; Reproduced by the permission of Star News Group, 6.38; Reproduced by the permission of Rhys Taylor, 6.41; nettispaghetti, CC BY-SA 2.0, via Wikimedia Commons, 6.1; Niko Lang, CC BY-SA 2.5, via Wikimedia Commons, 6.7; IRAM-gre, CC BY-SA 4.0, via Wikimedia Commons, 6.9; Harikane et al., CC BY 4.0, via Wikimedia Commons, 6.11; NASA’s James Webb Space Telescope, CC BY 2.0, via Wikimedia Commons, 6.12; Spacecraft: ESA/ATG medialab; Milky Way: ESA/Gaia/DPAC. Acknowledgement: A. Moitinho., CC BY-SA IGO 3.0, CC BY-SA 3.0 IGO, via Wikimedia Commons, 6.15; Ant Schinckel, CSIRO., CC BY-SA 3.0, via Wikimedia Commons, 6.17; SPDO/TDP/ DRAO/Swinburne Astronomy Productions, CC BY 3.0, via Wikimedia Commons, 6.18; ALMA, CC BY 4.0, via Wikimedia Commons, 6.19; NASA, ESA, CSA, STScI, A. Pagan (STScI), CC BY 4.0, via Wikimedia Commons, 6.25; Event Horizon Telescope, CC BY 4.0, via Wikimedia Commons, 6.28; united federation of planets, CC BY-SA 4.0, via Wikimedia Commons, 6.30; Griffith University, CC BY 3.0, via Wikimedia Commons, 6.40; Imagtek, CC BY 4.0, via Wikimedia Commons, 6.43; Pablo Carlos Budassi, CC BY-SA 4.0, via Wikimedia Commons, 6.46; Kevin Gill from Nashua, NH, United States, CC BY-SA 2.0, via Wikimedia Commons, 6.60; Suzyj, CC BY-SA 4.0, via Wikimedia Commons, 6.20; Image used from ANSTO Website, 7.32; Ken Eckert, CC BY-SA 4.0, via Wikimedia Commons, 8.6; Isaac Newton, CC0, via Wikimedia Commons, 8.30(2).
Every effort has been made to trace and acknowledge copyright. The publisher apologises for any accidental infringement and welcomes information that would redress this situation.
The Victorian Curriculum F-10 content elements are © VCAA, reproduced by permission. The VCAA does not endorse or make any warranties regarding this resource. The Victorian Curriculum F-10 and related content can be accessed directly at the VCAA website.
Kingswood College equipment and facilities used with permission.