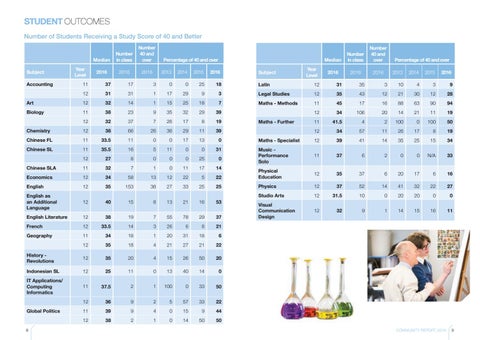
STUDENT OUTCOMES Number of Students Receiving a Study Score of 40 and Better
Subject
Year Level
Median
Number in class
Number 40 and over
2016
2016
2016
Percentage of 40 and over 2013
2014
2015
2016
11
37
17
3
0
0
25
18
12
31
31
1
17
29
9
Art
12
32
14
1
15
25
Biology
11
38
23
9
35
12
32
37
7
Chemistry
12
38
66
Chinese FL
11
33.5
Chinese SL
11
Accounting
Subject
Year Level
Median
Number in class
Number 40 and over
2016
2016
2016
Percentage of 40 and over 2013
2014
2015
2016
Latin
12
31
35
3
10
4
3
9
3
Legal Studies
12
35
43
12
21
30
12
28
18
7
Maths - Methods
11
45
17
16
88
63
90
94
32
29
39
12
34
106
20
14
21
11
19
26
17
8
19
11
41.5
4
2
100
0
100
50
26
36
29
11
39
12
34
57
11
26
17
8
19
11
0
0
17
13
0
Maths - Specialist
12
39
41
14
35
25
15
34
35.5
16
5
11
0
0
31
12
27
8
0
0
0
25
0
11
37
6
2
0
0
N/A
33
Chinese SLA
11
32
7
1
0
11
17
14
Music Performance Solo
Economics
12
34
58
13
12
22
5
22
Physical Education
12
35
37
6
20
17
6
16
English
12
35
153
38
27
33
25
25
Physics
12
37
52
14
41
32
22
27
English as an Additional Language
12
40
15
8
13
21
16
53
Studio Arts
12
31.5
10
0
20
20
0
0
English Literature
12
38
19
7
55
78
29
37
Visual Communication Design
12
32
9
1
14
15
16
11
French
12
33.5
14
3
26
6
8
21
Geography
11
34
18
1
20
31
18
6
12
35
18
4
21
27
21
22
History Revolutions
12
35
20
4
15
26
50
20
Indonesian SL
12
25
11
0
13
40
14
0
IT Applications/ Computing Informatics
11
37.5
2
1
100
0
33
50
12
36
9
2
5
57
33
22
11
39
9
4
0
15
9
44
12
38
2
1
0
14
50
50
Global Politics 8
Maths - Further
COMMUNITY REPORT 2016
9