Sizing the U.S. and California Harbor Craft Market
August 2023

Intelatus Global Partners

August 2023
Lead Authors:
Philip Lewis
John O'Malley
Thisreport wasdeveloped by IntelatusGlobal PartnersforCALSTART.Thisreport isfunded in partby theClean Off-Road Equipment Incentive Project (CORE). CORE is part of California Climate Investments, a statewide initiative that puts billions of Cap-and-Trade dollars to work reducing greenhouse gas emissions, strengthening the economy, and improving public health and the environment particularly in disadvantaged communities.
For over 30 years, it has been CALSTART’s mission to develop, assess, and implement large-scale zeroemission transportation solutions to mitigate climate change and support economic growth. CALSTART workswithbusinesses,organizations,governments,andcommunitiestocreatereal-lifeimpacttowardclean air and equitable access to clean transportation for all. CALSTART provides scientific, technical, and policy support for regulatory development of clean technology and infrastructure acceleration.
Intelatus is a firm of business consultants specializing in strategic planning and market analysis. Intelatus provides its global clientele with accurate, up-to-date business intelligence and consulting services. Intelatus hasa focus onthemarineand offshoreindustry sectors and conductsprojectscovering all aspects of the market.

Intelatus Global Partners excludes any warranty or other assurance as to the completeness or accuracy of this report or as to its suitability for any purpose. Intelatus Global Partners shall not be liable to any legal or natural person for any losses or injury caused wholly or partly by or as a result of any decision or action made or taken (or not made or taken, as the case may be) by any such person in reliance on this report or the information contained herein, or for any consequential, special, indirect or similar damages.

ABS American Bureau of Shipping
AIS Automatic Identification System
AHT Anchor handling tug
AHTS Anchor handling tug and supply
ATB Articulated tug and barge
BTS Bureau of Transportation Statistics
CARB California Air Resources Board
Cat Category, as in Cat 1, C2 and Cat 3
CHC Commercial harbor craft
CO Carbon monoxide
CO2 Carbon dioxide
CTV Crew transfer vessel
DOE Department of Energy
DOT Department of Transportation
DPF Diesel particulate filter
EIA U.S. Energy Information Administration
EPA U.S. Environmental Protection Agency
GHG Greenhouse gas
GT Gross tonnage
GW Gigawatt (1,000 MW)
H2 Hydrogen
HC Hydrocarbons
HFO Heavy fuel oil
ICE Internal combustion engine
IGF Code International Code of Safety for Ships Using Gases or other LowFlashpoint Fuels
IMO International maritime Organization
ITB Integrated tug-barge
kW Kilowatt (1,000 watts)
kWh Kilowatt hour
LNG Liquified natural gas
LOHC Liquid organic hydrogen carriers
LPG Liquified petroleum gas
MARAD U.S. Maritime Administration
MARPOL International Convention for the Prevention of Pollution from Ships
MDO Marine diesel oil
MEPC
Marine Environment Protection Committee, the group of member countries within the IMO with accountabilities, among others, for marine pollution prevention, safety and security
MGO Marine gas oil
MPSV Multi-purpose offshore support vessel
MW Megawatt (1,000 KW)
NAAQS National Ambient Air Quality Standards
NOx Nitrogen oxides
NT Net tonnage
OCV Offshore construction vessel
OSV Offshore support vessel
PEMFC Proton exchange membrane fuel cell
PM Particulate matter
SCR Selective catalytic reduction
SMR Small, modularized reactor
SOLAS Safety of Life at Sea
SOV Service operations vessel
SOx Sulphur oxides
USCG U.S. Coast Guard
CALSTART in March 2023 engaged Intelatus Global Partners to size and analyze the total U.S. and California harbor craft, inland and near shore vessel fleet above 600 kW or 805 bhp to understandthepotentialmarketforzero-emission vessel solutions, such as the hydrogen fuel cellpowered zero-emission tug (HyZET).
This report is funded in part by the Clean Off-Road Equipment Incentive Project (CORE), part of a statewide initiative aimed at reducing greenhouse gas emissions, strengthening the economy, and improving public health and the environment.
Global, regional, national and local agencies are promoting a variety of measures aimed at reducing emissions from the maritime sector that harm the environment and public health.
In the USA, the focus of standards is tilted towards the reduction of NOx and particulate matter. California is in a unique position that it can set its own emission standards, which are currently higher than those mandated by the federal Environmental Protection Agency. Where feasible, California encourages the use of zero-emission options.
Vessel owners are faced with a variety of energy carrier and converter options when seeking to minimize harmful emissions from marine operations.
In the short-sea and inland segment, the most suitable zero-emission options include renewable based hydrogen, hydrogen-based fuels and renewable electricity stored in battery energy storage systems.
All the options have advantages and disadvantages, chief among which is the cost and availability of zero-emission fuel, the certification that a fuel is truly zero=emission and the availability of infrastructure and equipment to produce, distribute and convert zero-emission fuels. As the energy transition continues to gather
pace, these challenges will, in theory, be addressed.
The direction of global, regional and national shipping regulations is shaped by the International Maritime Organization, which is moving to roll out net zero-emissions target by or around 2050 on a well-to-wake basis. Although this is generally not a specific issue for U.S. or Californian harbor craft, the question of whole-life emissions, and the certification of a fuel as zeroemission on a whole-life basis, is likely to become increasingly important.
Well-to-wake emissions calculate emissions from the production (feedstock extraction, cultivation, acquisition or recovery) through to transporting a fuel or energy carrier to the ship and using the energy source in the ship.
In considering how a fuel such as hydrogen is made, well-to-wake certification of a fuel will, in the future, seek to identify whether the hydrogen has a low or high carbon intensity.
• High-carbon intensity hydrogen is made from coal or natural gas and is responsible for most of the hydrogen produced today.
• Hydrogen with a low carbon intensity can be made from renewable electricity (wind, solar, etc.), biomass and natural gas with carbon captureand storage.Relativelylittle lowcarbon intensity hydrogen produced globally today.
Low carbon intensity is further broken down into renewable hydrogen, which is green hydrogen (for renewable electricity and electrolysis), bio-syngas (gasification or reforming of biomass), blue hydrogen (natural gas with carbon capture and storage) and pink hydrogen (nuclear power directly or with electrolysis).
As a result of the regulatory environment and technical and financial challenges,the adoption of zero-emission vessels is accelerating, but from a relatively small base. Globally, there are currently
close to 35 vessels operating wholly or partly with hydrogen that are either active or on order.
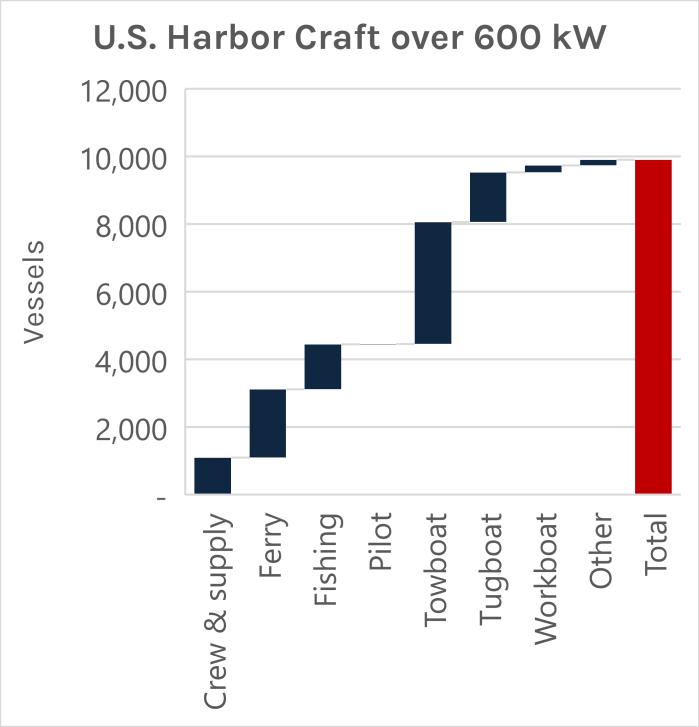
There are over 12 million vessels accounted for in the United States.
Within this group are close to 10,000 harbor craft operating in the United States that are above 600 kW, or 805 horsepower, including crew and supply boats, ferries and excursion vessels, fishing vessels, pilot boats, towboats, tugboats, workboats and other vessel types. We analyze this vessel segment in our report.
Around 12 million recreational and pleasure craft, 34,000 non-self-propelled vessels and barges, deep sea U.S. vessels and international vessels are excluded from our analysis.
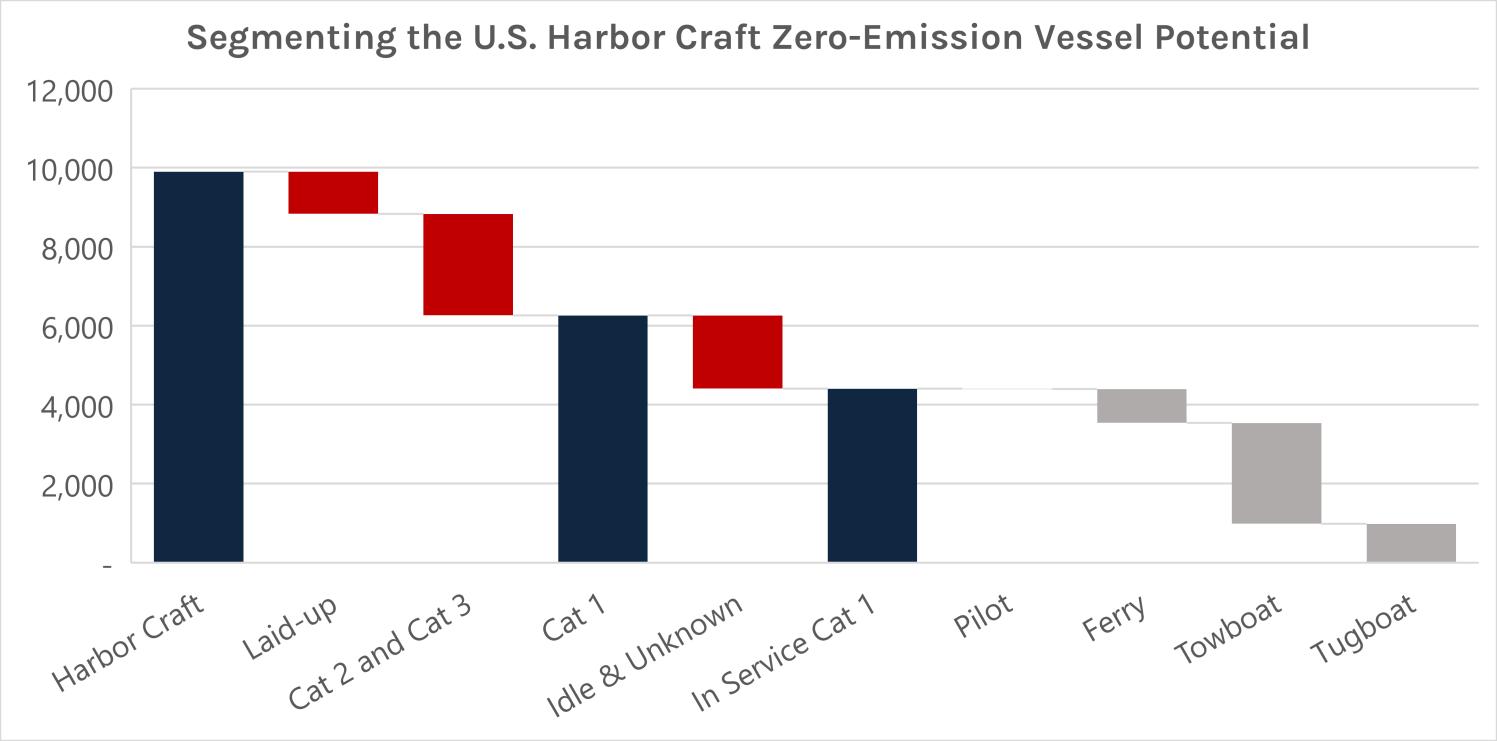
The importance of the demand arising from inland waterborne trade can beseen when breaking down the harbor craft segment into the eight categories analyzed within this report.
In Service Cat 1 California Harbor Craft
Source:IntelatusGlobalPartners
The U.S. is home to over 150 large coastal and inland ports and a network of 25,000 miles of rivers and canals, of which around 12,000 miles supports inter- and intra-state commerce.
Most inland waterborne trade is concentrated in the eastern half of the country and especially withintheMississippiRiverSystem.Inthewestern half of the country, inland waterborne trade is concentrated in the Columbia and Snake River System, and to a lesser extent, on the Sacramento River.
Not all harbor craft are confirmed to be active. The activity of close to a third of the vessels in our dataset cannot be confirmed due to the lack of suitable automated vessel tracking equipment. These vessels may well be active and equally may well be idle or in long term lay-up. Harbor
We have grouped the U.S harbor craft by operational status (In Service, Idle, Unknown and Laid-up) and category (Cat) reflecting suitability for zero-emission technology. This is a high-level subjective grouping and is subject to further technical review:
• Cat 1: the most suitable for hydrogen or electric zero-emission operations. This group of 4,405 vessels includes ferries, pilot boats, towboats and tugboats.
• Cat 2: medium suitability for zero-emission operations. This segment covers crew and supply vessels and workboats.
• Cat 3: lower suitability for zero-emission operations and includes fishing vessels and other vessels, not categorized in the other
seven core segments.
The following chart identifies the 4,405 In Service ferries, towboats and tugboats that have the
highest attractiveness for zero-emission technologies such as HyZET.
Source:IntelatusGlobalPartners
Registered harbor craft are present in all 50 U.S. states, but nearly three quarters of In Service Cat 1 harbor craft are in 10 states.
Harbor Craft by Type and Status
Drilling down in to the 4,405 In Service Cat 1 vessels, we see that towboats account for around 58% of the vessels and that 56% of In Service Cat 1 vessels are 25 years of age or older. The 2,462 older vessels represent the lower hanging fruit in terms of suitability for replacement or repowering with zero-emission solutions, whether hydrogen, fully electric or other zero-emission technology.
Source:IntelatusGlobalPartners
There are 676 registered harbor craft in California that meet the criteria of this study. Of these vessels, 53% or 360 are In Service, of which slightly more than two thirds are classed as Cat 1 vessels.
The 65 tugboats are the closest segment technically for the adoption of the HyZET technology.
As the towboat segment in California also features a number of ocean-going ATBs, this segment may prove less ready for the HyZET concept as, for example, towboats operating on the Mississippi River System.
The ferry and excursion vessels and pilot boats, especially those operating on the routine ferry routes, are generally well suited for zero-emission technologies, such as hydrogen and electricity. That said, some of the excursion vessels that venture further offshore may be less suited for short- and medium-term transition to hydrogen or fully electric technology.
We have performed an analysis on the CHC CARB Reported Vessel Data dated June 20, 2023, to better understand the types of engines installed on harbor craft. This dataset records all vessels, whether above or below 600 kW.
The analysis indicates that 6% of engines are EPA Tier 4 compliant, currently the most stringent federal marine emission standard. A further 44% Tier 3.
Focusing on the Cat 1 vessels, the CARB CHC dataset records 744 engines, of which 402 are main engines. Of these 402 engines, 5% are Tier 4 compliant and 45% Tier 3 compliant, reflecting the opportunity for zero-emission technologies.
This report is funded in part by the Clean Off-Road Equipment Incentive Project (CORE). CORE is part of California Climate Investments, a statewide initiative that puts billions of Cap-and-Trade dollars to work reducing greenhouse gas emissions, strengthening the economy, and improving public health and the environment particularly in disadvantaged communities.
The State of California has responded to the problem of air pollution and its consequential impacts on public health in a number of ways, including the support of the adoption of zeroemission transportation technology. Supported technologies within the road transportation segment have included battery electric or fuel cell buses and trucks. However, some segments, including the harbor craft segment, have presented significant challenges in terms of transitioning to zero-emission solutions.
California aims to reduce harmful air pollution in the maritime segment by supporting the development and deployment of zero-emission harbor craft. The “first mover” focus by the state is on vessels with predictable duty cycles and which generally return to base daily, including tugboats and ferries.
Under the California Air Resources Board’s plan to expand zero-emission operations within the maritime freight segment, CALSTART and its partners within the hydrogen fuel cell-powered zero-emission tug (HyZET) project are developing an actionable liquid hydrogen fuel cell-powered tugboat design that will be ready for construction and implementation at the San Pedro Port Complex, which includes the Port of Los Angeles and the Port of Long Beach. The project will identify and address challenges related to producing, delivering, transferring and storing liquid hydrogen to power a zero-emission tugboat as one pathway to decarbonize the maritime segment. The electrically driven hydrogen fuel cell-powered zero-emission tug features 2,400 kW fuel cell
power and 1,740 kWh of battery energy storage, capable of providingupto5,220 kWfor13minutes.
The purpose of this analysis is to size and analyze the total U.S. harbor craft, inland and near shore vessel fleet to understand the potential market for zero-emission vessel solutions, such as HyZET.
This report is written as a quantitative analysis of the U.S. harbor craft segment and the potential market size for zero-emissions technology.
Given that the vast majority of harbor craft in the U.S. currently feature traditional high and medium speed marine engines operating on marine diesel and marine gas oil, the whole segment effectively represents the longer-term opportunity for zeroemission technologies.
The project data has been extracted from proprietary databases of Intelatus Global Partners and itscompaniesand representstheculmination of over 80 years of information gathering, which have been supplemented by a variety of data sources, including:
• USCG Vessel Database.
• US Army Corps of Engineers, Institute for Water Resources, Vessel Characteristics.
• Output from the database for Airborne Toxic Control Measure for Diesel Engines on Commercial Harbor Craft Operated within California Waters and 24 Nautical Miles of the California Baseline for 2021 in accordance with the Commercial Harbor Craft Regulation. The effective date for the data provided is July 25, 2022. The new CHC Reporting Database, with a company reporting deadline of March 31, 2023, is in process at the time of development of this report and has not been seen or used for this analysis.
It should be noted that this dataset addresses vessels operated within California waters and can include data for vessels registered within another state. Our dataset assigns a vessel to a state based on registry.
• State of Alaska Commercial Fisheries
Statistics and Data.
• Noth Atlantic Area region fisheries data.
• International Telecommunications Union.
Data challenges
Oneissuethathasbeenaddressedbythisexercise is the inconsistency and incompleteness of data between various sources. This manifests itself as spelling mistakes in names, different vessel delivery data and differences in vessel characteristics. We have endeavored to clean up these inconsistencies.
A further issue to note is the issue of identifying the owners of certain vessels, particularly in the fishing fleet. The reason is that certain vessels are registered to an individual person rather than a corporate entity. In this case there are confidentiality provisions in place that result in us not being able to identify all these owners in the database. However, some individual names remain. Due to this privacy issue, CALSTART may wish to consider hiding the vessel owners’ names in the dataset if made publicly available
Are all the vessels database active?
Our database questions the status of a vessel.
We have grouped the vessel data into four subcategories of activity: In Service, Idle, Laid-up & Inactive or Unknown. The basis of this segmentation is an analysis of AIS signals and in particular when a last AIS signal was received for a vessel.
AIS, or the Automated Identification System, is a digital positional awareness system. AIS supports the identification and tracking of ships and is an aid to safe navigation, security monitoring and search and rescue operations. In short, vessels equipped with the correct AIS system can be tracked and their activity status verified.
However, not all U.S. harbor craft transmit AIS signals that allow their activity to be recorded.
Under the International Maritime Organization SOLAS convention, all vessels of 300 gross tons and above engaged on international voyages and all passenger ships of 150 gross tons or more when
carrying more than 12 passengers on an international voyage must carry an AIS Class A onboard.
Non-SOLAS vessels, including pleasure craft, generally use AIS Class B systems, which provide limited functionality.
The U.S. Coast Guardclarifies IMO requirementsfor vessels in the USA to operate with an AIS Class A device:
• Self-propelled vessels engaged in commercial service that have an overall length of 65 feet or more.
• A towing vessel engaged in commercial operations with an overall length of 26 feet or more and more than 600 horsepower (close to all of the towboats in our database).
• A self-propelled vessel certified to carry more than 150 passengers.
• Self-propelled vessels undertaking dredging operations in or near a commercial channel.
• Vessel carrying certain dangerous goods and flammable or combustible liquid cargos.
Vesselspermittedtooperatewitha ClassBsystem and therefore less easy to track include:
• Commercial fishing vessels.
• Vessels carrying less than 150 passengers and operating below 14 knots.
Our database segments data into four categories to reflect activity:
• In Service: Active with AIS signal received within the last three months reflecting movement
• Idle:Last AIS signal received between threeand six months. This indicates that vessel could be temporarily idle for commercial or technical reasons, under repair or upgrade, or trading outside the coverage of AIS.
• Inactive and Laid-up: Last AIS signal received six months or more ago and categorized as inactive or laid-up in the USCG database. Traditionally, for vessels required to transmit AIS signals one would group these vessels as inactive or scrapped in place.
• Unknown: Last AIS signal received six months or more ago.
As we have established, not all harbor craft require AIS Class A, for which there are several possible scenarios regarding the status of the vessel. The vessel could be lost or demolished, on long-term lay-up or scrapped in place, trading outside of the USA or simply does not need to feature AIS Class A.
As part of our data cleaning exercise, we have removed a large number of vessels that are still within federal databases but are either trading overseas or have been lost at sea, abandoned or scrapped.
Marine vessels have traditionally contributed significant amounts of greenhouse gas (GHG) emissions and air pollutants. GHG emissions refer to carbon dioxide (CO2), methane (CH4), nitrous oxide (N2O) and fluorinated gases. GHG emissions are collectively reported as CO2e or carbon dioxide equivalent.Themostrecentestimates forshipping emissions are contained within the Fourth IMO GHG Study (2020)i , which identified that shipping contributed to 2.9% of 2018 global GHG emissions. Vessel-based international shippingaccountedfor 87% of total shipping emissions.
Due to the impact of emissions from international shipping, it is not surprising to see that the IMO has focused largely on emissions reduction from international shipping, leaving regional, national or local administrations to administer domestic shipping – either by accepting the IMO position or implementing specific regulations.
Within the United States, shipping is essentially governed by Title 46 of the Code of Federal Regulations (46 CFR) and addresses the role of the U.S. Coast Guard, the U.S. Maritime Administration and the Federal Maritime Commission.
Title 33 of the Code (33 CFR) governs navigation and navigable waters within the United States and addresses the role of the USCG, the Army Corps of Engineers and the Saint Lawrence Seaway Development Corporation.
The U.S. Coast Guard (USCG) is the main regulatory body for vessels sailing within the United States. However, maritime regulations are also governed somewhat by the United States’ participation in the International Maritime Organization (IMO).
The origins of global shipping GHG reduction by the IMO can be found in the 1997 Kyoto Protocol, which entered into force in 2005. The protocol translated the United Nations Framework Convention on Climate Change to limit and reduce
GHG emissions. The protocol contains provisions for reducing GHG emissions from shipping.
The foundation for the decarbonization of the policies of the international maritime industry is the Initial IMO Strategy of Greenhouse Gas Emissions from Ships (2018). The strategy set firm targets for 2030 and 2050 against 2008 levels:
• Mid-term target (2023-2030) - CO2 emissions reduction by at least 40% by 2030.
• Long-term target (2030-2050) - At least 50% GHGreductionfromshippinganda70%carbon intensity reduction by 2050 from 2008 levels.
• Longer-term aim - To achieve zero CO2 emissions as soon as possible after 2050.
The IMO’s Marine Environment Protection Committee agreed in July 2023 to revised policy ambitions aimed at reducing GHG emissions and carbon intensity from shipping. This revised policy direction should be translated in the coming years through new or revised IMO regulations, the majority of which only impact international shipping from after the middle of the decade. At a high-level, the IMO’s ambitions are:
• To reach net zero-emissions compared to 2008 by or around 2050 on a well-to-wake basis. Current IMO regulations only address tank-towake CO2 emissions from fossil fuels or emissions from burning or using an energy source in a ship. Well-to-wake emissions calculate emissions from production (feedstock extraction, cultivation, acquisition or recovery) through to transporting a fuel or energy carrier to the ship and using the energy source in the ship.
• 40% carbon intensity reduction by 2030 on well-to-wake basis versus 2008.
• 5-10% uptake of zero or near zero GHG emissions technologies, fuels and/or energy sources by 2030 versus 2008.
• Interim reduction targets for absolute GHG emissions versus 2008 of 20-30% by 2030 and 70-80% by 2040.
As the shipping sector takes tentative steps to adopt low and zero-emissions fuels, IMO’s guidelines and regulations addressing the use of hydrogen and hydrogen-based fuels are being
updated. Interim guidelines currently address the installation of fuel cells on vessels and the fuel storage and supply to the fuel cells. However, the agreement of specific guidelines on the use of hydrogen and hydrogen-based fuels by the IMO wouldhelpclarify theregulatory landscapefurther.
For vessels only trading in U.S waters, the alternative design approach allowed for under 46 CFR will be required for hydrogen fueled vessels seeking a U.S. Certificate of Inspection.
Coming into force in 1973, MARPOL, the International Convention for the Prevention of Pollution from Ships, is the main international convention covering the pollution of the marine environment, including GHG emissions. MARPOL is the foundation for global engine maker and ship designer technological developments.
Global standards are presented within the International Convention on the Prevention of Pollution from Ships and are referred to as MARPOL. MARPOL Annex VI (2005) defines the requirements for engines and vessels related to NOx, SOx and PM.
The U.S. EPA and the Coast Guard administer IMO MARPOL Annex VI compliance in the United States. MARPOL Annex VI is applicable to U.S. flagged vessels trading in international waters as well as foreign flag vessels operating within the U.S. Emission Control Area.
U.S. flagged vessels that only operate within U.S. waters comply with the EPA’s domestic emission standards (NAAQS) under the Clean Air Act and 40 CFR in lieu of compliance with MARPOL requirements. The NAAQS regulate emissions from hazardous air pollutants but do not yet cap GHG emissions.
It should be noted that the focus of EPA standards is tilted toward NOx and PM.
The EPA has four tiers for exhaust emission standards: Tier 1 (implemented in 1996), Tier 2 (phased in from 2003 to 2008), Tier 3 (2004 to 2008) and Tier 4. Each new tier of engine brings
stricter emissions standards and requires more advanced technology.
The EPA regulations divide marine engines into three categories based on displacement per cylinder.
• Category 3 marine diesel engines are typically large marine diesel engines used to power deep-sea ships. Typical engines range in size from 2,500 to 70,000 kW or 3,000 to 100,000 hp.
• Smaller vessels, such as harbor craft, tend to feature Category 1 and 2 engines, which are generally high- and medium-speed engines. Category 1 and 2 marine diesel engines typicallyrangeinsizefromaround500to8,000 kw or 700 to 11,000 hp. Categories 1 and 2 are further divided into subcategories, depending on displacement and net power output.
Tier 4 regulations are applicable to a variety of vessels, including ferries, tugboats and deep-sea vessels. Tier 3 requirements generally apply to smaller vessels such as recreational vessels.
Tier 3 and Tier 4 emissions standards for marine engines in Categories 1 and 2 were first introduced in 2008 regulations. Modeled on the 2007/2010 highway engine program and the Tier 4 nonroad rule, there is focus on deploying emission after treatment technology. The use of catalytic aftertreatment was facilitated by the sulfur cap for marine fuels established by the EPA.
Tier4regulations,effectivefrom2014,arecurrently the most stringent federal marine emission standards.
For Category 1 vessels, EPA Tier 4 emission regulations apply to new engines with a power output of 600 kW or 800 hp and above. Tier 4 standards require a 63% reduction in PM over Tier 3 regulations and a 64% reduction in NOx and PM emissions.
In addition to the EPA requirements, the California Air Resources Board (CARB) enforces its own clean air regulations, which are discussed later in this chapter.
Exhibit 1 summarizes the specific exhaust emission components that MARPOL Annex VI and 40 CFR seek to regulate.
Component
The issue
Primary mitigation solutions
NOx Respiratory issues. Acid rain. Toxic ground ozone formation. Temperature reduction during the combustion process. Exhaust gas recirculation.
Secondary and tertiary mitigation solutions
Aftertreatment including selective catalytic reduction. Alternative fuels.
SOx Respiratory issues. Acid rain. Fuel injection control After treatment including exhaust gas scrubbers. Alternative fuels.
PM Air pollution. Respiratory and heart issues Fuel injection control After treatment including direct particulate filter. Alternative fuels.
HC Volatile organic compounds. Some are proven carcinogens. Others can cause ear, nose and throat irritation and liver and kidney damage.
Fuel injection control and engine maintenance
CO Toxic ground ozone formation. Fuel injection control. Low load avoidance.
Oxidation catalyst. Alternative fuels.
Oxidation catalyst. Alternative fuel.
CO2 GHG contributing to climate change. Various measures including carbon capture and storage aftertreatment, hydrodynamic design, voyage planning, maintenance, alternative fuels.
Source:IntelatusGlobalPartnersinterpretationofMarineLinkinformation
Outside of the IMO and the U.S. EPA, the European Union and Chinese Ministry of Ecology and Environment regulate emissions within their territories. The myriad of regulations, even though sharing common DNA, increases compliance requirements for engine makers.
Whereas MARPOL seeks to mitigate the impact of emissions through encouraging the adoption of operational and technical measures, including the adoption of alternative energy carriers to fossil fuels,thesafetyofavesselanditscrewisgoverned by the International Convention for the Safety of
Life at Sea. In the context of adopting hydrogen as a maritime fuel, SOLAS will govern the design requirements for the fuel storage and handling system. The U.S. Coast Guard administers MARPOL compliance in the United States.
Till now, there have been no specific SOLAS regulations governing the use of hydrogen as a marinefuel.Wherevessel designsdeviatefromthe prescribed rules, there is allowance for a risk management based “Alternative Design” approach.
Within the United States, the USCG Marine Safety Center holds the responsibility for ensuring the safety of vessels, regardless of their propulsion technology. The Marine Safety Center is tasked with updating the Code of Federal Regulations to address the commercial adoption of such new
technologies as hydrogen, fuel cells and battery energy systems.
The basis for accepting the Alternative Design approach for using hydrogen as a marine fuel is the International Code of Safety for Ships Using Gases or other Low-Flashpoint Fuels (IGF code). Developed by the IMO’s Marine Safety Committee, the IGF code provides the regulatory framework for low flashpoint marine fuels. However, the IGF Code does not yet include guidelines for the safety of ships using hydrogen in liquefied and gaseous form as fuel Draft interim guidelines to include fuel cells in the IGF code have been agreed by the IMO’s relevant sub-committee.
The USCG administers compliance with the IGF code in the U.S. There are currently no existing U.S. federal regulations that specifically address the designandoperationofhydrogenpoweredvessels.
In the U.S., the Alternative Design must establish equivalency tothedesign standards of Chapter 46, Code of Federal Regulations – Shipping (46 CFR).
Hydrogen may be transported in containment systemsthatcomplywiththeHazardousMaterials Regulation in 49 CFR.
The Clean Air Act ties most states into compliance with EPA standards given that the Act prohibits individual states from setting their own emission standards with the exception of any state that had emission standards pre-dating March 30, 1996. California is the only state to meet this criterion as California had already enacted emission standards to address poor air quality before the federal government passed the Clean Air Act. However, once a standard is implemented in California, other states may adopt California’s emissionsstandardswithoutapplyingforawaiver. Statesmay also create regulationsthat control the use of used engines, referred to as “in-use” engines.
As a result of its unique position, California is leading the way in the U.S. in terms of addressing the pollution from marine engines. In short, California is promoting performance that is cleaner than EPA Tier 4 emissions standards.
Under CARB’s plan to expand zero-emission operations for freight transport, CARB divided the program into five categories:
• Oceangoing vessels.
• Heavy duty trucks.
• Cargo handling equipment.
• Locomotives.
• Harbor craft – the focus for harbor craft is fuel standards and the vessels themselves, which include a zero-emission ferry and the hydrogen zero-emission tug.
First adopted in 2008 and subsequently amended in 2010, the Commercial Harbor Craft Regulation has created a unique situation in State of California whereby vessel owners have been encouraged to replace older, more polluting engines with new and cleaner engines that reduce pollutants such as PM, NOx, SOx and GHGs. The original regulations provided the foundation for vessel ownersto acceleratea transition from Tier 2 to cleaner combustion Tier 3 engines for certain vessel categories, covering all commercial harbor craft categories.
In response to public health concerns, CARB approved amendments to the Commercial Harbor Craft Regulation in 2022. The amendments, which becameeffectiveonJanuary1,2023,areforecastto drive an 89% reduction in PM and a 54% reduction in NOx.
The Commercial Harbor Craft Regulation amendments promote zero-emission options where feasible and Tier 3 (mainly limited to the commercial fishing and new excursion vessels) and Tier 4 engines with diesel particulate filters on all other vessels. The phase-in for the new amendments is 2023-2032, with specific date for vessel categories and year of manufacture.
Exhibit 2 summarizes the Tier 4 standards required for Category 1 and 2 engines i.e., those generally found in harbor craft.
Exhibit 2 EPA Tier 4 Standards for Category 1 and 2 Engines
Source:IntelatusGlobalPartnersinterpretationofEPA information
Compliance extensions for certain vessel categories may be considered subject to certain conditions.
• Delays in developing shore power and/or zeroemission infrastructure may result in a one-totwo-year compliance extension.
• Availability of certified engines and/or diesel particulate filters may result in a two-year renewable compliance extension.
• Commercial fishing vessels (charter or sport fishing vessels), if equipped with a Tier 3 engine by the end of 2024, may receive a onetime ten-year extension option for compliance to 2035.
• Vessels equipped with Tier 4 engines that have recorded limited running hours and where the addition of a diesel particulate filter triggers a vessel replacement may result in a two-year renewable compliance extension.
• Manufacturer or shipyard delays impacting compliance may result in a one-year renewable compliance extension.
There are additional requirements for short run ferries and new excursion vessels (such as those used for whale watching and dinner cruises):
• Short run ferries, including those with a single voyage of less than three nautical miles will be required to be fully zero-emission by the end of 2025.
• New excursion vessels are required to be able
to operate with a minimum of 30% zeroemission power source.
Under the regulation, alternative control of emissions that meet or exceed the PM and Nox reduction targets can be considered. These include:
• Engine modifications. Primary methods for reducing the formation of Nox emissions in an internal combustion engine include primary design i.e., adopting of Tier 3 or Tier 4 engines.
• Exhaust gas emission control: Water injection or exhaust gas recirculation are technical options for NOx reduction. Selective catalytic reduction has become a common solution within the deep-sea fleet but is often considered an impractical solution for the short sea segment.
• Engine repowering or rebuilding to a more stringent/higher EPA Tier standard.
• Shore-side power.
• Fleet averaging, whereby vessels featuring zero-emission and advanced technology generate credits to being overall fleet performance within compliance.
• Other measures that sufficiently reduce emissions.
At a global level, the IMO’s MEPC has agreed that the generation of emissions should have a price. However, there is disagreement on the mechanisms and costing for such measures. Despite these differences among members, MEPC members have set the ambitious target of adopting a mechanism for carbon pricing by 2025 with an entry into force by 2027.
Unlike the European Union, which is extending its carbon pricing Emissions Trading System to the maritime segment including offshore support vessels, the United States has no federal mechanism pricing carbon emissions. Carbon pricing is currently managed at the state level. Several states notably do operate cap-and-trade programs, whereby companies purchase allowances equal to their GHG emissions. Outside
of California, these programs generally do not impact the harbor craft segment.
Till now, most large commercial ships have operated on heavy fuel oil (HFO), marine diesel oil (MDO) or marine gas oil (MGO). Numerous alternative fuels are being evaluated with an aim of reducing carbon emissions from shipping.
Described in this section are the trends and developments in alternative fuelsto HFO, MDOand MGO for shipping.
There is a distinction between short-sea shipping and deep-sea shipping when considering the use of various alternative fuels.
The deep-sea shipping segment mainly includes large, oceangoing vessels that require fuel that is globally available. The fuel used on these vessels
must have a sufficiently high energy density to minimize storage volume and maximize available cargospace.Thisisdriving interest in LNG,LPG(for certain ship types), methanol and ammonia. These ship types – such as container ships, bulk carriers and tankers – generally fall outside of the scope of study of this report.
Vessels in the short-sea and inland shipping segment generally operate in limited geographical areas and make regular port calls – such as harbor craft, passenger ferries, offshore vessels, etc. This segment is more suitable for energy storage systems that cannot be used on the deep-sea shipping segment due to energy storage limitations – such as pure electric power and hydrogen.
Exhibit 3 presents at a high level the energy carrier choices that a ship owner can make.
carrier choices Fossilfuels HFO/
LNG LPG Biofuel
Energy Short-sea segment
The suitability of an energy carrier is somewhat linked to the storage requirement for different fuel options. Exhibit 4 compares the storage volumes
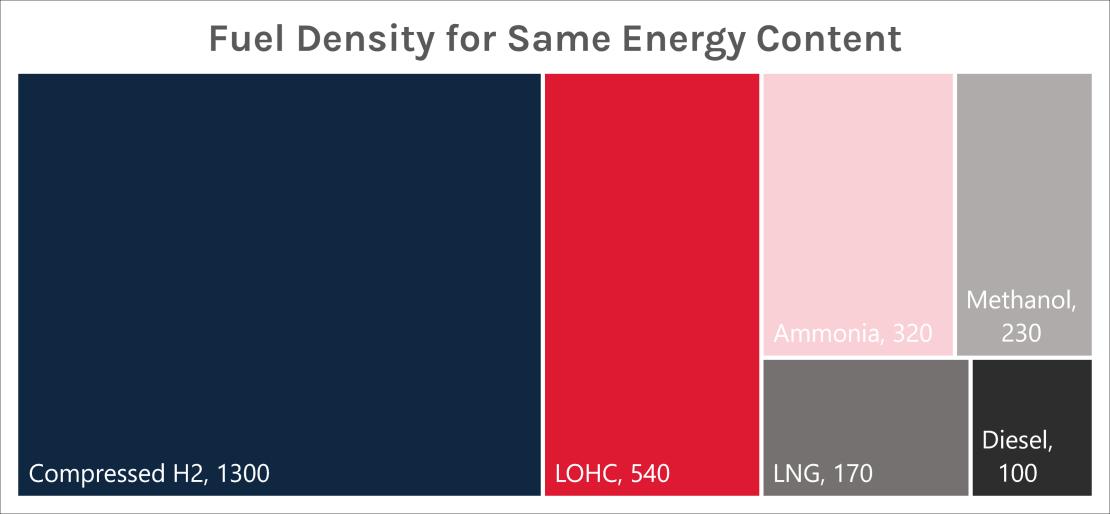
Source:IntelatusGlobalPartnersofdatafromSALTShipDesign
In deciding on what energy carriers to invest in, ship owners in the short-sea and inland segment must weigh a number of advantages and disadvantages for the different options.
• Suited for short-sea applications.
• High energy content.
• Zero-carbon tank-to-wake emissions
• No CO2, Nox, SOx and PM when used in fuel cells.
• Some ICEs can use H2 blended with conventional fuels or gases.
• Can be stored as a cryogenic liquid, a compressed gas, or bonded with other chemicals to carry energy.
• Scale of fuel cell supply – commercial availability expected shortly after mid-decade.
• H2 disperses if leaked.
• H2 electrolyzer capacity is growing.
• Liquid H2 tankers are being built.
Exhibit 5 examines some high-level advantages and challenges to using hydrogen.
• Nox emissions produced when used in an ICE.
• Highly combustible. High explosion risk in confined spaces.
• Compression or cryogenic storage is energy intensive and expensive.
• Requires large storage volume.
• Limited bunkering infrastructure.
• Susceptibility of certain materials to H2 embrittlement.
• H2 proton exchange membrane fuel cells use expensive platinum.
• Competition for renewable H2 with other sectors.
• Immaturity of current safety regulations.
• Fuel cost uncertainty.
• Certifying green fuel.
Source:IntelatusGlobalPartners
Exhibit 6 looks at some of the high-level advantages and challenges to using ammonia.
Exhibit 6 Ammonia
• Carbon free and zero-emission tank-to-wake.
• Low flammability risk.
• Can be stored and transported as a liquid.
• High level of maturity in many aspects of ammonia storage and transport infrastructure.
• A flexible energy carrier with solutions available for ICEs and cracking into H2 and running through fuel cells.
• 2-stroke ICE commercially available by 2025 and 4-stroke by 2026.
• When used directly in a SOFC, no pre-treatment is required.
• SOFCs do not require the use of expensive metals.
• The scale of green ammonia supply & bunker infrastructure is limited.
• Toxicity
• Corrosive to certain materials.
• Lack of safety regulations – expected after the middle of the decade.
• Large storage volume.
• Capex of fuel containment, supply and safety systems.
• Engine development is low maturity.
• ICEs require pilot fuel, with Nox emissions.
• Scale of fuel cell supply. Commercial availability of fuel cells is not expected before mid-2030s.
• H2 conversion equipment required for fuel cells.
• Acid scrubbers are needed for product gas.
• PEMFCs use expensive platinum.
• High fuel costs.
• Certifying green fuel.
Source:IntelatusGlobalPartners
Exhibit 7 summarizes some high-level advantages and challenges to using methanol.
Exhibit 7 Methanol
• Lower ICE tank-to-wake emissions than oil fuel.
• Synthetic/e-methanol has reduced CO2 emissions.
• Virtually sulfur-free.
• Produces almost no PM and low amounts of Nox.
• Suited to storage in near conventional fuel tanks.
• Growing ICE supply 2-stroke engines available commercially today. 4-stroke ICE by 2024.
• Solutions available for cracking into H2 and running through fuel cells. Fuel cells commercially available around 2030.
• Easier to store and handle than ammonia and hydrogen.
• Available at certain ports.
• High safety regulatory maturity. IGC and IGF codes give framework to using methanol.
• Biodegradable in the air and sea.
• ICE produces tank-to-wake CO2 emissions.
• Conventional methanol has higher well-to-tank emissions versus other oil-based fuels.
• Larger fuel tanks than conventional fuels and LNG for the same energy content.
• Uncertainty about fuel cost.
• Scale of renewable H2 production (for green methanol production).
• Limited bunkering infrastructure.
• Scale and cost of fuel cell production.
• Corrosive to some materials.
• Nox emissions require SCR or EGR systems.
• Highly flammable.
• Toxic and can be lethal if ingested.
• Certifying green fuel.
Source:IntelatusGlobalPartners
Electricity stored in battery energy storage systems provides another choice for vessel owners, either for deployment in a hybrid system
featuring other energy carriers or in a pure electric vessel. Exhibit 8 presents a high-level summary of
theadvantagesanddisadvantagesofelectricityas the main energy carrier.
Advantages & opportunities
• Ideal for short-sea segments.
• Zero operational emissions.
• Electric power systems using batteries provide increased control and optimized operational and safety performance.
• Battery technology is developing rapidly; production is scaling up and prices are falling.
• Charging is safe/ Class societies have developed battery safety regulations.
• Batteries are technically easy to replace.
• Growing port based electrical charging supply. Emissions cut further when shore power is produced from green electricity.
Disadvantages & challenges
• Competition from other transport segments for batteries.
• Sustainability of production chain for lithium-ion battery materials – graphite, cobalt, lithium, and nickel.
• Scale of renewable energy electricity supply.
Source:IntelatusGlobalPartners
Using the HyZET project as an example, initially it is estimated that the tug will reduce emissions at the Port of Los Angeles by 476 tons CO2e annually. However, when green hydrogen becomes available in the future, emissions will be reduced by around 2,204 tons CO2e.
But the nature or source of a fuel is an important distinction when considering well-to-wake emissions for future fuels such as hydrogen, methanol and ammonia. It will also become an important factor and challenge in certifying the nature of a low or zero-emissions fuel:
• Grey fuels are the most commonly produced futurefuelsandaremadefromburningnatural gas without carbon capture and storage. Brown/black fuels are made from coal and oil.
• Blue fuels are produced from natural gas or coal with carbon capture and storage. Synthetic/e-fuels produced with CO2 from carbon capture from another combustion process are classed as blue fuels. The focus on bluefuelsisrelativelyhighintheUnitedStates.
In its white paper on hydrogen as a marine
fuelii, ABS explains that hydrogen can be seen as “having a very low tank-to-wake emissions impact.” ABS goes on to explain that hydrogen produced from fossil fuel sources isnotcarbon freeonawell-to-tankbasisandclearlyexplains that “Whenbothwell-to-tankandtank-to-wake emissions are eliminated from the fuel life cycle, a zero-carbon well-to-wake fuel option is created.”
ABS explains that the well-to-tank emissions for traditional marine gas oil are 14.2 kilograms CO2 per megajoule of fuel. Hydrogen produced fromrenewableelectricityornuclearhavezeroemissions. Hydrogen produced from natural gas with carbon capture, utilization and storage technology can reduce carbon dioxide emissions to around 35 grams CO2/MJH2 with a 56% capture rate and around 10 gramsCO2/MJH2
• Green fuels are produced from carbon free electricity, such as wind or solar, and do not take from existing grid supply. Green synthetic/e-fuels are produced with CO2 directly extracted from the atmosphere. Green biofuels are those that meet sustainability requirements.
• Purple/pink fuels are produced from electrolysis powered by nuclear energy.
The chart in Exhibit 9 uses methanol as an example to show the process to produce green, blue, grey and brown methanol. The chart also shows the production routes for green and blue
hydrogen. As well-to-wake emissions reporting evolves, understanding the source and color of hydrogen will become more important.
Biomass
Renewable electricity
Gasification/ reforming
Syngas
Electrolysis
Carbon capture & storage
Naturalgas
Coal
Reforming Gasification
Syngas
Green Methanol
Biomethanol
Bio-emethanol
Emethanol
Blue
Methanol
Renewable
Grey methanol
Syngas
NonRenewable
Brown Methanol
Source:IntelatusGlobalPartnersinterpretationofIRENAsourceinformation
As the International Renewable Energy Agency (IRENA) and the Rocky Mountain Institute (RMI) address in their 2023 report entitled Creating a Global Hydrogen Market – Certification to Enable Tradeiii, hydrogen and hydrogen-based fuels will play an increasingly important role in the energy transition. As end user demand grows, the trade of hydrogen and its derivatives will increase. As trade growssowilltheneedtogiveconfidencetotheend user that the hydrogen or hydrogen derivative is in fact made from renewable sources. Certification will assist the process.
According to IRENA and RMI, “Certification will contain information on compliance with standards and regulatory requirements, and enable verification through data on suitability
Low carbon intensity
High carbon intensity
criteria, such as carbon footprint and renewable energy content, thereby allowing differentiation from other less green products.”
Based on a global survey of certification regimes, IRENA and RMI conclude that significant certification gaps exist for which the partners identify recommend actions. The gaps include:
• Clear information on GHG emissions produced during hydrogen production and/or transportation.
• Common standards used: emissions thresholds, power supply requirement for electrolysis, hydrogen production pathway and chain of custody model.
• Ecolabelling.
• Compliance with environmental, social and governance criteria.
IRENA and RMI point to a variety of voluntary as well as mandatory certification regimes for hydrogen production:
• Voluntary (in alphabetical order): Aichi Prefecture Low Carbon Hydrogen Certification, Australia Clean Energy Regulator is developing the Hydrogen Guarantee of Origin certificate, CertifHy Green and Low-Carbon Hydrogen Certification, CEN-CENELEC is developing Joint Technical Committee 6, the China Hydrogen Alliance Standard and Assessment for Low Carbon Hydrogen, Clean Hydrogen and Renewable Hydrogen Energy, Green Hydrogen Organization Green Hydrogen Standard, Smart Energy Council Zero Carbon Certification Scheme and TUV Sud CMS 70.
• Mandatory (in alphabetical order): California Low Carbon Fuel Standard, the European Commission is developing the Renewable Energy Directive, the UK Department for Business Energy & Industrial Strategy Low Carbon Hydrogen Standard,theUK Department of Transport Renewable Transport Fuel Obligation and the U.S. DOE is developing specific program eligibility for its Clean Hydrogen Production Standard,
3.3. Hydrogen production
According to the International Energy Agencyiv , the demand forhydrogencurrently amountstoaround 94 million tons of hydrogen per year. Much of the current demand comes from traditional uses, mainly refining and industry.
The IEA forecasts demand for hydrogen to grow to around115million tonsby2030.However,newuses are forecast to amount to less than two million tons
Examples of new uses of hydrogen include steel makingusingpurehydrogenfordirectreductionof iron, thefirst fleet of trains featuring hydrogen fuel cells in Germany and around “100 pilot and demonstration projects for using hydrogen and its derivatives in shipping, and major companies are
already signing strategic partnerships to secure supply of these fuels.”
In its review, the IEA points to an increasing interest in the maritime sector in the use of hydrogen and hydrogen derived synthetic fuels (including synthetic ammonia, diesel, methane and methanol). However, the IEA believes that the technologies for maritime “are less mature than thosefor road and rail.”The IEA reportcontinuesto point out that based on current actions, hydrogen will only make a “small penetration” in the shipping sector by 2030. In the more positive case, where aspirational targets are met, annual shipping demand for hydrogen and hydrogenderived fuels is expected to reach close to five million tons by 2030.
Of note, the IEA raises concerns that hydrogen demand will fall short of existing climate pledges put forward by the world’s governments, which identify 130 million tons per year by 2030 of which 25% for new uses. Further, the estimated production required for the world to keep on a net zero pathwayby 2050 is200 million tonsof annual hydrogen production by 2030.
The IEA points to the majority of hydrogen demand currently being met by hydrogen produced from unabated fossil fuels. Low-emission hydrogen production, which amounts to around one million tons,mostlycomesfromfossilfutureswithcarbon capture, utilization and storage.
AccordingtoIEAsreport,“Ifallprojectscurrentlyin the pipeline were realized, by 2030 the production of low-emission hydrogen could reach 16-24 million tons per year, with 9-14 million tons based on electrolysis and 7-10 million tons on fossil fuels with CCUS.” The 9-14 million tons of hydrogen forecast to be produced by electrolysis will require an installed electrolyzer capacity, powered by new renewable energy capacity, of 134-240 GW. Today, electrolyzer capacity stands at around 8 GW annually, and current industry announcements indicate over 60 GW of annual capacity is required by 2030. As a result, more renewable electricity capacity needs to be added to the project pipeline to support the required growth in electrolyzer capacity.
At a high level, current industry plans fall two to four times short of total pipeline capacity, which does not meet government pledges.
The USA
Currently, the U.S. produces around 10 million tons of hydrogen each year, most of which from fossil fuels.
The federal Bipartisan Infrastructure Law and the Inflation Reduction Act contain several provisions supporting the production and use of clean hydrogen:
• The establishment of a National Clean Hydrogen Strategy Roadmap – completed in June 2023v .
• $1 billion of funding for electrolysis.
• $7-8 billion of funding for the establishment of six to ten regional clean hydrogen hubs or H2Hubs. The hubs will demonstrate the production, processing, delivery and storage and end-use of clean hydrogen.
The DOE is planning to review applications from July 2023.
California is expected to feature as one of the hubs. Within the potential California hydrogen hub, the Port of Long Beach and the Port of Los Angeleshaverecently prepareda jointproposal forfederalfundingto demonstratethebenefits ofusinghydrogentopowertrucksandterminal equipment. One can only assume that, if successful, expansion of the capabilities will only benefit the adoption of the HyZET concept.
It should be noted that the H2Hubs are expected to produce blue, pink and green hydrogen.
• Up to $3 per kilogram in tax credits to produce clean hydrogen. The available tax credits are linked to the carbon intensity of the produced hydrogen.
Thefederalgovernmenthassetatargetofnetzeroemissions by 2050 and a 50-52% reduction in emissions by 2030. This translates as a reduction in GHGs of around 5.5 gigatons of CO2e by 2050.
TheDepartmentofEnergyisleadingthestrategyto support these targets being met.
The DOE National Clean Hydrogen Strategy and Roadmap identifies the opportunities for the domestic production of 10 million tons of clean hydrogen per yearby 2030, 20 million tons by 2040 and 50 million tons by 2050. Further, the strategy targets reducing the cost of producing clean hydrogen to $1 per kilogram by 2031 (the so-called Hydrogen Shot). The main short term (2022-2025) actions include:
• Support R&D to demonstrate clean hydrogen production.
• Identify and prioritize barriers to delivery and storage infrastructure roll-out and start to address the challenges by supporting the development of regional infrastructure hubs.
• Engage regulators to lay the groundwork for adoption across sectors, including hard to abate industries.
• Engage stakeholders, address safety standards and develop critical supply chains. The DOE strategy embraces multiple green, blue and pink sources of hydrogen production, including renewable energy (wind, solar, wave, waste, etc.), nuclear, fossil fuel with CCUS and conventional storage. As with the inputs, the uses of hydrogen are expected to be multiple, including shipping, where the maritime sector is identified in a group of “emerging demands and potential new opportunities.”
The DOE identifies opportunities for hydrogen and hydrogen carriers “ranging from inland and harbor vessels to recreational and pier-sideapplications.”
DOE has been collaborating with the Department of Transportation’s Maritime Administration (MARAD) to develop and demonstrate hydrogen fuel cell technologies. These are discussed in more detail in Section 3.2.
According to the DOE, U.S. electrolyzer capacity currently stands at around 650 MW, which is around 7.5% of global capacity.
The DOE cites examples of hydrogen fuel cell deployment as including over 50,000 forklift trucks, 15,000 cars and 80 buses.
The Port of Rotterdam is Europe’s largest port, offering facilities for liquid bulk, dry bulk, Ro-Ro, and container shipping. The port is a major industrial hub with many types of value-adding activities within or near the port. Rotterdam is also Europe’s largest bunkering port. The RotterdamMooerdijk port industry cluster causes around 20% of CO2 emissions in the Netherlands.
Rotterdam Port Authority has been very active in promoting actions to reduce marine emissions and promote carbon neutral industrial operations. Early among the port’s initiatives has been to encourage the transition from HFO to LNG as a shipping fuel by developing LNG bunkering infrastructure. Alternative fuels currently supplied in the port include LPG, methanol and biofuels.
The port is working on a number of projects targeting energy transition, where industry switches to electricity, hydrogen, and green hydrogen. CO2 capture and storage will be used to make blue hydrogen. Green electricity supply will be underpinned by the Netherlands’s land and offshore wind farms. The initiatives include:
• Onshore wind, growing from 200 MW of turbines to over 350 MW within the port area.
• The Port of Rotterdam is a partner in the North Sea Wind Power Hub consortium along with Gasunie and transmission system operators TenneT and Energienet. The consortium is promoting the development of an energy transmission network connecting the Netherlands, Germany, Denmark, and the UK through the gradual roll-out of 10-15 GW offshore wind transmission hubs. The consortium aims to develop 70-150 GW of capacity by 2040.
• The port is a partner in the H-Vision project, where 16 parties mostlyworking within thePort of Rotterdam industrial area are researching the production and use of blue hydrogen produced from natural and refinery gas by 2030.
• In September 2021, the Port Authority announced an agreement with Uniper to
developa green hydrogen production facilityat Maasvlakte – a two-phase development initially producing around 13,000 tons of hydrogena year growing to around 65,000tons.
• The Port Authority and Gasunie are collaborating to develop a hydrogen pipeline grid for the port, to be operational as early as 2024. The first customer for the pipeline will be Shell, who has announced a plan for a green hydrogen plant at Maasvlakte 2. The second customer is expected to be the H2 Fifty project in 2025. H2 Fifty is a BP/Nouryon project to build 250 MW of electrolyzer capacity to produce around 32,000 tons of green hydrogen annually at the BP refinery in Rotterdam.
• As part of its plan to create a green hydrogen hub in the Port of Rotterdam, Shell is also planning to locate a 200 MW electrolyzer in the port to produce 50-60 tons of green hydrogen a day by 2023. The electrolyzers will be powered by Shell’s Hollandse Kust Offshore windfarm.
• In August 2021, the Port Authority signed an MOU with Norwegian energy player Horisont Energy to supply blue ammonia produced from natural gas with carbon capture from Norway to Rotterdam. Under the agreement, blue ammonia will be shipped from the Barents Blue project in 2025. Barents Blue is expected to produce one million tons of ammonia per year. The ammonia will be used either as a marine fuel or broken down, with hydrogen being the main product.
• The Port of Rotterdam, Koole Terminals, Chiyoda Corporation and Mitsubishi Corporation signed an MOU in July 2021 to study the commercial-scale import of hydrogen from overseas and storing at one of Koole’s terminals in the port using Chiyoda’s SPERAHydrogen storage and transport technology. The companies have an ambition toimport300,000-400,000tonsayearby2030.
• The port announced an agreement with the Government of Western Australia to invest in renewable hydrogen production and storage in Australia and transport to Rotterdam in early December 2021. The Port of Rotterdam estimates that it will handle around 20 million tons of hydrogen annually by 2050, of which 90% will be from imports.
• The Port of Rotterdam is a member of the Fieldlab project with Deltalings, Innovation Quarter,FMEandTNO.Fieldlabaimstotestnew technology for industrial electrification by replacing fossil fuels with processes powered by green electricity. The process being studied includes power-to-heat, power-to-hydrogen, and power-to chemicals.
• The Port Authority is a member of the Dutch Green Maritime Methanol consortium, launched in February 2019 to conduct research into the use of renewable methanol as a maritime fuel. The consortium successfully tested 100% methanol in a spark ignited engine, utilizing a Caterpillar 3508 sparkignited high-speed gas engine.
The supply of zero-emission fuel is currently limited.
In the deep-sea segment, we note several public and private initiatives to promote the use of low and zero-emission fuels in shipping. Examples include:
• In Norway, Yara is developing partnerships for the long-term supply of clean ammonia for the shipping segment.
• A core focus of Japan’s green transformation
program is the widespread use of ammonia as a shipping fuel.
• Several large deep-sea shipping companies have invested in methanol-enabled new buildings, including CMA CGM, COSCO Shipping, HMM, Evergreen and Stena Bulk.
• Maersk, one of the world’s largest shipping companies, has signed agreements for 1.4 to 2 million tons per year of methanol to fuel their newgenerationcontainervessels,summarized in Exhibit 10. Maersk is also reviewing another 30 partnerships for fuel supply, including locations in Europe and Suez.
The Maersk supply agreements cover biomethanol (from agricultural and forestry residue and municipal waste), e-methanol (solar, wind and renewable CO2) and green methanol (using biogenic CO2).
The first of Maersk’s current orderbook of methanol capable vessels a 2,100 TEU feeder vessel built in South Korea has recently been delivered and commenced its maiden voyage during Q3-2023.
However, not so many companies have the scaleofoperationofMaersk andcannotalways consider long-term fuel supply agreements. In this scenario, public support is required to develop fuel availability and bunkering infrastructure.
Source:IntelatusGlobalPartnersinterpretationofdatafromMaersk
The IMO’s strategy to identify and develop mechanisms to limit and/or reduce GHGs from shipping does not prescribe solutions to the challenges. Rather, the IMO has initiated several energy efficiency initiatives that have encouraged vesselownerstoinvestigatebothfuelandnon-fuel optionstoimprovetheperformanceofthe,atleast, the larger vessel segments.
Tools include the Energy Efficiency Design Index (EEDI) fornewbuildings,theEnergyEfficiency Ship Index (EEXI) for all existing ships, the Ship Energy
Ship design & hydrodynamics
• Hull-form, ship size, propulsion improving devices (ducts, fins and bulbs), propellers, rudders and material optimization.
• Air lubrication (microbubble drag reduction, air cavity, air layer and air chamber).
• Hull coating and cleaning to reduce biofouling.
• Propeller cleaning to reduce biofouling.
Efficiency Plan (SEEMP), mandatory data collection and the Carbon Intensity Indicator (CII) rating. Compliance levels for carbon intensity of a vessel are tightened periodically.
Outside of choices around energy carrier and energy converter, shipowners have investigated a wide variety of design, operational and economic solutions to improve energy efficiency and reduce emissions.
Exhibit 11 summarizes at a high-level some of the more popular measures selected by vessel owners. However, it should be noted that many of these are more suited to the deep-sea segment.
Energy assistance Logistics & digitalization Secondary recovery After treatment measures
• Wind assisted propulsion (rotor sails, kites, rigid sails, soft sails and suction wings)1 .
• Solar (secondary solution for auxiliary power).
• Speed reduction.
• Just-in-time arrival.
• Weather routing.
• Trim, draft, and ballast optimization.
• Autopilot software.
• Engine derating
• Vessel utilization
• Vessel size.
Source:IntelatusGlobalPartners
• Waste heat recovery
• Kinetic energy recovery from shipboard equipment.
• Post combustion carbon capture and storage
1 Hornblower Cruises and Events operates a diesel-electric hybrid that features vertical axis wind turbines and solar cells in San Francisco.
Inthischapterwepresenta summary ofthestatus of the low and zero-emission fleet today.
It should be noted that the number of ships capable of operating on future fuels, either in operation or construction, is still relatively small and is largely concentrated in the deep-sea segment.
There are around 1,160 vessels trading in the deepsea, short-sea and inland segments that feature alternative fuels power systems that are active or are on-order today. Hydrogen vessels account for around 2% of the total. This is summarized in Exhibit 12.
Exhibit 12 Alternative fuel fleet overview
Other offshore Ro-Pax Ro-Ro cargo Tugs
Other
Oil/chemical tankers
General cargo OSV
Gas tankers
Fishing
Cruise ship
Crude oil
Container ship
Car/Passenger ferry
Car carrier
Bulk Carrier
Source:IntelatusGlobalPartnersinterpretationofdatafrom DNV’sAlternativeFuelInsight
According to the Getting to Zero Coalition, of 100 pilot and demonstration projects currently ongoing, the majority of the 45 hydrogen projects focus on small vessels, ammonia on the deep-sea
segment and methanol is split between both short- and deep-sea segments.
There are also an additional 185 pure electric powered vessels out of a total 800 pure, plug-in hybrid and battery hybrid vessels.
In the USA, the U.S. Coast Guard is generally supportive of new technologies. However, as new energy carrier and converter solutions are brought to market, some delays are to be expected as the agency approves first-of-kind technologies on a case-by-case basis. There are reports that the federal administration has directed the Coast Guard to intensify efforts to accelerate this process to hasten the uptake of clean energy projects in the U.S. maritime industry.
Globally, there are currently close to 35 vessels operatingwithhydrogenthatareeitheractiveoron order.
Exhibit 13 summarizes the breakdown of the vessels by category and expected year of delivery.
Exhibit 13 Vessels with hydrogen capability by delivery year
Source:IntelatusGlobalPartners
Exhibit 13 shows us that car/passenger ferries and offshore windfarm crew transfer vessels account for the largest number of vessels operating on hydrogen in the short-sea and inland segment. For the deep-sea segment, eight cruise ships will be equipped with hydrogen fuel cells to supplement internal combustion engines burning either VLSFO or LNG.
Most vessels aiming to use hydrogen as an energy carrierarechoosingfuelcellstoconverttheenergy. However, it should be noted that there is a growing number of vessels featuring dual fuel capable internal combustion engines, as shown in Exhibit 14.
Exhibit 14
Hydrogen energy converters
Hydrogen Energy Converters
Other Tug
OSV
Inland training vessel
Inland push boat
CTV Dredger
Cruise ship
Container ship
Car/Passenger ferry
Bulk Carrier
Fuel cell ICE
Source:IntelatusGlobalPartners
Around 70% of the vessels are expected to trade within the European Union and Norway, as shown in Exhibit 8. Norway has the largest single country share at seven vessels.
Vessels identified as “Global” in Exhibit 15 are mainly cruise ships and container vessels who have no set region of operation.
Exhibit 15 Trading areas of hydrogen vessels
Trading Area of Hydorgen Vessels
USA
Global


China Europe
Source:IntelatusGlobalPartners
Active vessels in the USA
In the U.S., the SWITCH Maritime owned Sea Changeis the first operational vessel featuring a hydrogen fuel cell.
Operated by SF Bay Ferry and funded within the Advanced Technology Demonstration and Pilot Project – Zero Emissions Ferry (ZEF), the 75-person passenger ferry commenced its demonstration in Spring 2023.
SF Bay Ferry has a plan to replace most or all of its 16 diesel ferries with ZEVs by 2035.
The ferry was built at Bay Ship & Yacht Shipyard (CA) and All American Marine (WA). It features a total installed fuel cell capacity of 360 kW, a 100 kWh Li-Ion battery energy storage system and two 300 kW (400 hp) shaft motors feeding the electric propulsion system that drives the propellors.
Thevesselhasarangeofaround150nauticalmiles at 12 knots. Its max speed is 22 knots.
Initially planned for operations in 2022, the launch of the vessel was reportedly delayed by a lack of existing regulation and approval by the U S Coast Guard As noted previously, as new technological solutions are brought to market, delays are to be
expected as the USCG approves first-of-kind technologies on a case-by-case basis.
It is reported that SeaChangewill potentially be refueled by the DOE Office of Energy Efficiency & Renewable Energy funded SF Waterfront Maritime Hydrogen Demonstration Project. If built, it is also reportedthatHornblower’s DiscoverZero,a four 30 kW fuel cell hybrid equipped with 1.6 MWh battery energy storage will also be refueled by the barge.
Based in the Port of San Francisco and running for four and a half years from 2021 to 2025, the project has two main goals, according to the project teamvi:
• “To demonstrate the feasibility and viability of hydrogen production, storage, and fueling in a maritimecontext,establishing robust sciencebased protocols, procedures, operating parameters, and attendant training materials for the safeand routinegeneration and storage of electrolyzed hydrogen, and handling of water-to-water and water-land hydrogen and fuel-cell power transfer.”
• “To catalyze a “green hydrogen ecosystem,” via localized production of renewable hydrogen at the San Francisco Waterfront, encompassing SanFranciscoandthesurroundingBayAreafor both maritime and landside users.”
The project aims to develop a 130-foot-long refueling barge located at Pier 68 in San Francisco that can produce around 500 kilograms per day of renewable hydrogen for a 1.2 MW NEL electrolyzer. 200 kilograms per day of the hydrogen will be dedicated to fuel vessels with renewable hydrogen and recharge the batteries of diesel-electric hybrid vessels. Electricity will be produced by a 1.2 MW fuel cell. The balance of 300 kilograms of produced hydrogen will be delivered to land-based fuel cell applications to support port operations. The barge will not be classed as inspected under 46 CFR.
Among a raft of energy transition and decarbonization technology research projects, the U.S. Department of Transportation, through the Maritime Environmental and Technical Assistance (META) Program, has funded six research and
development projects to advance the deployment of hydrogen fuel cell applications in the maritime segment:
• Hydrogen Fuel Cell for Port and Shipboard Marine Applications (2014-2017)vii: Co-funded by the DOE, the project designed, developed, built and tested a 100-kW barge-mounted containerized fuel cell, featuring 72 kilograms of hydrogen storage,to provide electrical power to the refrigerated containers loaded on vessels while calling in Honolulu Harbor, Hawaii. The containerized fuel cell system was deployed on an inter-island barge service in Hawaii during 2015 and 2016. Several technical challenges limiting the use of the system were faced during the demonstration period and lessons learnt have been identified for sharing with other hydrogen-based projects. However, at a high level, the project established the technical viability of the concept.
• SF Breeze feasibility study for a 4.8 MW hydrogen fuel cell ferryviii: A 2015 feasibility study to design a 150 passenger 4.8 MW zeroemission hydrogen fuel cell ferry and to establish a hydrogen fueling capability in San Francisco Bay. A further project aim was to advance the development of both federal and state codes and standards for hydrogen fueled vessels.
• Feasibility Study of a Coastal Class Zero Emission Research Vessel (ZERo/V): The 2017 feasibility study for an oceangoing hydrogen powered research vessel led the Feasibility Study of Replacing the R/V Robert Gordon Sproul with a Hybrid Vessel Employing Zeroemission Propulsion Technology (2020)ix: The feasibility study sought to address several boundaryconditionsforthevessel, including 1) vessel performance of 34 individual science missions/14 uniquemission profiles, 2) capital expenditure limited to $30 million, 3) GHG reduction when compared to the R/V Robert Gordon Sproul and 4) compliance with the regulations for a 46 CFR Subchapter C uninspected vessel.
In early 2023, the Scripps Institution of Oceanography, which operates six research vessels, reported that the new hydrogen-fueled research vessel commissioned in August 2022
anddesignedbyGlostenwillbeclassedbyABS. The hybrid vessel will feature both hydrogen fuel cells and a conventional diesel-electric power plant.
In the 2020 report, the cost estimate for the hydrogen hybrid vessel option was $34.4 million, around 15% above target budget. The new vessel meets three other boundary conditions.
• Algae Flow-way Technology and Fuel Cell Reportx: MARAD and the Maryland Port Administration partnered on a demonstration fuel cell project to design, build and test a fuel cell that converts algae to energy. One conclusion from the project is that the fuel cell developed in the demonstration project could be used at the Port of Baltimore as an alternative power source to diesel or electric power supplies.
• Hydrogen Gas Dispersion Modellingxi: An important modelling project conducted by Sandia National Laboratories to support the deployment of hydrogen fuel cell vessels. Sandia deployed computational fluid dynamics(CFD)modellingtogenerateanalysis that addressed regulatory issues associated with bringing a hydrogen fuel cell vessel through the regulatory approval process. The paper focuses on gas dispersion modelling, including 1) a routine of venting of hydrogen from high-pressure storage tanks and 2) nonroutine release of hydrogen. The basis of the modelling included a hydrogen storage solution similar to the one found on Sea Change
Other hydrogen carriers in the U.S. marine segment
In addition to deploying pure hydrogen solutions, thereareexamplesofprojectsusingmethanoland ammonia to carry hydrogen in a safe and costefficient way.
• e1 Marine is a partnership of Element 1 (a developer of on-demand hydrogen generation through methanol reforming technology), Ardmore Shipping (an owner of medium range product and chemical tankers) and Maritime Partners (provides flexible finance solutions to mainly Jones Act new buildings). The partners
are developing a long-range 550 miles/4-day range between refueling) ultra-low emissions towboat that converts methanol in a PEM fuel cell fed by methanol stored in conventional tanks.
HydrogenOne is a methanol-electric tugboat that will join the fleet of Indiana-based American Commercial Barge Line. The target is to cut steel within 2023 and for the vessel to commence operations in 2024/2025. It is likely that the towboat will move petroleum products in and around Louisiana and Texas.
Maritime Partners accepts that the technology is currently not cost competitive. However, the company believes that the solution will eventually be cost competitive with a towboat featuring an EPA Tier 4 ICE, especially with the cost differential between Tier 3 and Tier 4 engines.
• We are currently tracking three projects featuringfuelcellsfedbyliquidammonia,both initiated by U.S. start-up Amogy.
Amogy’s first marine project is to retrofit a 1 MW fuel cell to a 1957 built shipyard tug. The conversion is planned to be completed by late 2023, when the vessel is scheduled to take an initial voyage in an inland waterway in New York. Yara is providing green ammonia for the demonstration.
• In its second marine project, Amogy is working in partnership with Southern Devall to integrate an ammonia fuel cell system into an inland tank barge for commercial deployment by 2025. Once demonstrated, the companies plan to retrofit ammonia power packs to additional barges and tugboats.
• The Brooklyn, N.Y. based company announced in June that it has entered a preorder contract to supply four of its 200-kilowatt (kW) ammonia-to-power systems to an undisclosed Norwegian shipping company. The Amogy powerpacks will provide the primary power on a newbuild vessel slated for zero-emissions sailing in 2025. The preorder is Amogy's first with a maritime industry customer ahead of planned commercialization in 2024.
Non-U.S. vessels (over 100 kW)
Most of the non-U.S. hydrogen fueled vessels feature hybrid systems, to ensure maximum flexibility in operations.Combinations of fuel cells, dual-fuel internal combustion engines and/or battery energy storage systems are common as we discuss below.
• MFHydra : Operating in Norway, Norled’s MF Hydra finally received approval from the Norwegian Maritime Authority in the first half of 2023 and has commenced ferry operations. The ferry features a hybrid power train consisting of 400 kW of fuel cells, two internal combustion engines totaling 800 kW and a 1,456-kWh battery energy storage system. Liquid hydrogen, supplied by road from Germany, is stored in pressurized tanks on board. Bunkering is every three weeks and takes five hours for 3 tons Norled is reviewing installing an onshore autonomous battery swap system for the ferry.
The Norwegian government drives the fuel strategy of ferry owners through central procurement requirements. To support its plan to reduce emissions from domestic shipping by 50% by 2030, the government has committed to build five hydrogen hubs to produce hydrogen and provide the infrastructure to fuel between 35 and 45 vessels.
In response to a government-led procurement process, Norway’s Torghatten Nord is building two hybrid vessels featuring 6,000 kW of fuel cell capacity, internal combustion engines to be run on biofuel and a battery energy storage system. The two vessels which will operate on long ferry routes in Norway are due to be delivered in 2025. Torghatten has reported that it is sourcing green hydrogen to power the vessels, which have a capacity of 120 cars and 599 passengers.
It should be noted that Norway is also supporting the electrification of the domestic ferrynetworkthroughtheprocurementprocess and supporting the roll-out of charging infrastructure throughout the county.
• Hydrocat48 : Owned and operated by Windcat Workboats, a CMB subsidiary,Hydrocat48is a crew transfer vessel supporting offshore wind farms in the North Sea. The CTV features two
internal combustion engines capable of running on hydrogen with a combined output of 1,498 kW.
Windcat currently has four CTVs with the same specification as Hydrocat 48 on order for delivery in 2023 and a further two for delivery in 2024.
Windcat is also investing in 2+2 service operations vessels for the European offshore wind segment. The SOVs are hybrids, featuring 3 x 1,800 kW conventional ICEs, 1 x 800 kW hydrogen fuel cells and a battery energy storage system.
• Hydrotug1 : Operating in the Port of Antwerp, Belgium and another CMB vessel, the 65 tons bollard pull harbor tug stores up to 405 kilograms of liquid hydrogen onboard to fuel two dual-fuel internal combustion engines developing 4,000 kW. CMB built a hydrogen refueling station next totheport to support the tug.
• Elektra : TheElektrais aninland tugboat owned by BEHALA and operating in Germany. The vessel features three dual fuel diesel-hydrogen internal combustion engines with a total installed capacity of 300 kW.
• ThreeGorgesHydrogen1 : Owned and operated by China Yangtze Power and Hubei Three Gorges Tourism Group, the 50-meter-long tourist vessel is equipped with a 50-kW hydrogen fuel cell.
• Viking Neptune : Owned by Viking Ocean Cruises, the large cruise ship is powered by 23,520kWofdieselfueledinternalcombustion engines, supported by 100 kW of fuel cells for port operations and hotel loads. Viking is currently building four additional cruise ships featuring diesel internal combustion engines supported by hydrogen fuel cells. The vessels will be delivered between 2026 and 2028.
• FPSMaas : Future Proof Shipping is retrofitting two inland container vessels with hydrogen fuelcellsamountingto1,200kWpervessel.The first vessel, FPS Maashas been renamed H2 Barge1and was launched at the end of May of this year. The vessel will sail between Rotterdam and BCTN’s Meerhout terminal in the Netherlands several times a week, carrying
Nike merchandise. Future Proof Shipping has identified further vessel candidates for conversion to zero-emission operations.
• Cap de Barbaria: Balearia has built a new car/passenger ferry equipped with a 100 KW fuel cell, internal combustion engines and battery energy storage. The vessel will operate in Spain from 2023. The green hydrogen fuel cell, battery energy storage and cold ironing capability support zero-emission operation during the approach, maneuvering, mooring and stay in port.
• HyDroMer : HyDroMer is a trailing suction hopper dredger operating for the Occitanie Region in France. The hybrid dredger is equipped with 200 kW of fuel cells, four IMO Tier II internal combustion engines and a battery energy storage system. Delivery is in 2023.
• There are reports of a car/passenger ferry featuring a hydrogen fuel cell currently under construction for the Indian market. However, limited other details are available.
• Zulu06:French owner CFT is building a barge for inland transport that features 400 kW of fuel cells. And a 350-kilogram containerized hydrogen storage unit. Outfitting is currently ongoing in France.
• Silversea is planning to deliver the SilverRay and the SilverNovacruise ships in the 2023 to 2024 period. Both hybrid cruise vessels will be equipped with 4,000 kW of fuel cells, LNG powered internal combustion engines and battery energy storage systems.
• MSC subsidiary Explora plans to deliver the ExploraVand ExploraVIcruise ships by 2028. Both hybrid vessels will feature 6,000 kW of fuel cells, LNG powered internal combustion engines and battery energy storage systems.
• WithOrca : Heidelberg Cement, the agricultural cooperative Felleskjøpet and shipping company Egil Ulvan Rederi have secured Norwegian government funding to build a hydrogen powered bulk carrier to operate between Norwegian ports. The 88-meter-long vessel will feature both a hydrogen ICE and fuel cell, two large rotor sails for wind assisted propulsion and a battery energy storage
system. The vessel’s tentative delivery schedule is2024,althoughwedoexpectdelays on this date, due to an absence of reporting on the vessel design and construction.
• Loran:TheLoranisadesignunderdevelopment for a 229 feet long Norwegian longline fishing vessel. In a project subsidized by the Norwegian Ministry of Climate and the environment, Skipsteknisk designed a 370-kW hydrogen fuel cell and 2,000 kWh battery energy storage system to completement the vessel’s conventional diesel engineswhilst the vessel is at sea for four to six weeks.
Other hydrogen carriers in non-U.S. vessels Methanol is already being adopted in some segments of the deep-sea segment with many shipping companies eyeing the potential of ammonia as a long-term zero-emission solution. There are also several examples of projects featuring methanol and ammonia in the short-sea segment. These include:
• SOVs: In the European offshore wind space, therearecurrently eightnewbuildingsthatwill feature methanol capable dual fuels ICEsand a further 14 prepared for methanol operation. Many ofthemethanolfueledSOVshavechosen Liquid Organic Hydrogen Carrier (LOHC) tocarry the energy.
• PSV Viking Energy: Eidesvik Offshore and Wärtsila are retrofitting a 2,000 kW SOFC running on green ammonia to the PSV Viking Energy , working for Equinor in the Norwegian North Sea. The conversion will be completed in 2023/2024.
• Kotug Canada is building two dual-fuel methanol harbor tugs, SD Aisemaht and SD Qwii-Aan’cSarah , to enter service in 2025 for the Trans Mountain Westridge oil export terminal.
• GreenAmmonia : The design for the 120-meterlong ammonia tanker received an Approval in Principle in April 2022. The vessel will feature a Wärtsila dual fuel ICE powered by ammonia. Design and shipyard selection are underway. Construction is anticipated in 2025.
• In China, COSCO Shipping Heavy Industry has been awarded an ABS Approval in Principle for
their ammonia-fueled vessel design and ammonia supply system. The harbor tug will have a bollard pull of 60 tons
In addition to state-wide initiatives, such as those found in California, we discuss below some examples of local initiatives to promote zeroemission shipping.
NWPCAS is a collaboration between the ports of Seattle and Tacoma in Washington State, the Vancouver Fraser Port Authority in British Columbia, Canada, and the port operator Northwest Seaport Alliance.
The partners have collaborated with the U.S. EPA, the Washington State Department of Ecology, the Puget Sound Clean Air Agency, Environment Canada, the British Columbia Ministry of Environment and Climate Change Strategy, and Metro Vancouver.
Initially focused on diesel particulate matter and greenhouse gas emissions, NWPCAS has broadened its focus to include other pollutants such as NOx, volatile organic compounds and black carbon.
The partners “aim to phase out emissions from seaport-related activities throughout the Georgia Basin-Puget Sound airshed by 2050.” The strategy was updated and refined in 2020, the updated vision for which sets the target to “Phase out emissions from seaport-related activities by 2050, supporting cleaner air for our local communities and fulfilling our responsibility to help limit global temperature rise to 1.5 degrees Celsius.”
The strategy covers six port activities:
• Harbor vessels. The Port of Seattle and Tacoma plan to deploy at least one hybrid or zeroemission harbor tug within the ports by the end of 2025.
The ports (Seattle and Tacoma) host 14 largely
pre-1990s diesel-mechanical tugs operated by two companies.
The ports see their role as encouraging the operators through making shore connections and repowering funding available.
• Oceangoing vessels.
• Cargo handling equipment.
• Truck.
• Rail.
• Port administration and tenant facilities.
As part of a May 2022 presentation the EPA’s webinar on electrifying America’s ports, South Carolina Ports presented its vision “striving to be the greenest port in the Southeast.”
One element of the plan was an initiative to transport containers by barge between the Wando Welch and Hugh K. Letherman terminals on the Wando and Cooper rivers and in so doing reducing the number of truck movements.
The plan introduced the potential for two electric tug and barge spreads to transport the container. The electric tugs will be supported by a high capacity shoreside battery energy storage at both terminals. The battery system will source green electricity from 3.3 MW of solar photovoltaic array capacity located at both terminals.
Potential partners for the project include Crowley and Shell Marine.
At the time of writing, no further project updates are available.
In addition to hydrogen, short-sea shipping is also suited to pure electric power options, the power for which can be provided from shore or by portlocated power barges similar to those discussed earlier in this chapter Examples of electric vessels in the U.S. include:
• eWolftug:eWolfisa 25-meter-long tug, 70 tons of bollard pull harbor tug, equipped with
Corvus 6.2 MWh battery energy storage system and 600 kW of conventional diesel generators for emergency use and longer voyages. The tug will be operated by Crowley in the Port of San Diego. The vessel replaces a conventional tug consuming around 30,000 gallons of diesel annually. Over the first 10 years of operation, Crowley estimates that that eWolfwill reduce NOx by 178 tons, PM by 2.5 tons and CO2 by 3,100 tons compared to a conventional tug. Delivery is planned for mid-2023.
• JamesV.Glynnand NikolaTesla : Maid of the Mist’s fully electric tour boats, operating at Niagara Falls, are recharged while docking between trips.
• The Gee’sBendferryistheUS ’sfirstall-electric vehicle ferry. The 2004-built ferry, which operates on the Alabama River, is owned by HMS (Hornblower Marine Services) Ferries and operates under contract for the Alabama Department of Transportation. Originally operating on diesel ICEs, the ferry conversion was completed in 2019. AC shore power is provided by charging stations at both ends of the ferry route. Power is converted to DC power and stored in two battery banks, each driving two 112 kW (150 hp) electric motors. Total power is 448 kW (600 hp).
• Olympic class ferries: Washington State selected ABB and Vigor Shipyards to design up to five diesel electric ferries. ABB and Vigor Shipyards were also initially selected to build the vessels, but the contract is currently being rebid which could result in a new builder and system integrator being selected.
The hybrid-electric ferries program aims to replace 13 existing diesel-powered ferries with hybrid-electric newbuilds and convert six others to plug-in hybrids by 2040. The plan is accompanied by a plan to invest in shoreside charging capacity at many ferry terminals. Funding is reported to be available for the first two vessels in the order, the first of which is to be named Wishkah and is expected to be delivered in 2027 Subsequent deliveries are expected every 14 months thereafter through late 2031.
• High-speed electric ferry, New York: Operated by New York Cruise Lines and Sweden’s Green
City Ferries (GSF) through New York Water Taxi, the ferry will operate on the Hudson River between Brooklyn and Manhattan. Featuring Toshiba batteries, the vessel is a Beluga24 catamaran with a capacity of 147 passengers and 28 bicycles. GSF will operate the first Beluga24 in Sweden from 2024.
In this chapter, we review the various vessel types that makeup our study of commercial harborcraft active in the U.S. and look at the U.S. port network and inland waterway system
For consistency, we have broadly aligned our vessel segmentdefinitionswiththoseoftheSouth Coast Air Quality Management District Technology Assessment: Commercial Harbor Craft (2015)xii .
We should note that we would traditionally maintain offshore support vessels as a separate category, we have allocated the various OSV segments among the following harbor craft headings.
Vessels used for the transport of personnel and equipment, consumables and stores to and from offshore and in-harbor locations.
Thiscategoryincludesvesselssupportingoffshore oil & gas exploration and production rigs and platforms, offshore wind farms and vessels at anchorage.
The offshore wind segment is currently in its infancy, and our database only includes three active offshore windfarm crew transfer vessels. However, as the segment develops, initially in the northeast of the USA, then to the mid-Atlantic, California, Oregon and the Gulf of Mexico, we anticipate a growing fleet of domestically owned, built and operated crew transfer vessels and service operation vessels.
There are currently at least 19 CTVs under construction in U.S yards, with options for five more. There are also three SOVs currently under construction in U.S. yards for deployment on Atlantic coast projects. The majority of new builds are installing EPA Tier 4 compliant engines,
although a handful have opted for more but lower horsepower EPA Tier 3 engines that do not currently require after treatment. Of note, there is no strong evidence that vessel owners are investing in CTVs that feature hybrid battery energy storage systems and/or dual fuel capabilities, although some of the new builds retain space for future addition of battery energy storage systems.
The three SOVs currently under construction all feature EPA Tier 4 engines and battery energy storage and shore power connectivity. This approach varies from the major European market where methanol and ammonia solutions figure in an increasing number of vessels.
Vessels deployed to transport people and/or vehicles within a public transportation system or for tourism and events, which includes sightseeing, whale watching and dinner cruises.
AccordingtotheDepartmentofTransport’sBureau of Statistics, over 112 million passengers and 26 million vehicles were transported by ferry during 2019. Washington (38.7 million passengers) and New York (30.5 million passengers) were identified as the states where the largest number of passengers boarded ferries, followed by California, Massachusetts, Texas and Louisiana. For vehicles, the leading boarding states were Washington which accounted for 15.2 million vehicle boardings alone, Texas, Louisiana and New York.
TheBTSfurtherreportedthatnearlyhalfoftheferry segments in the USA were concentrated in five states – Alaska, California, Michigan, New York and Washington. A ferry segment is defined by the BTS as “the direct route that the boat takes between two terminals with no intermediate stops. The assigned state of the segment is that of the origin terminal.”
Commercial fishing vessels are used to locate and catch fish for the purpose of commercial sale.
Charter fishing vessels are generally available for hire by the public for the purpose of locating and catching fish for personal consumption.
Based on the range of names and definitions applied to various sub-categories, we have refined our definition of the commercial fishing segment to include fishing vessels, charter fishing vessels, passenger fishing vessels, fish processing vessels and fishing tenders. Pure commercial vessels account forthemajority of vesselsin thissegment (over 85%).
Vessels used to carry pilots to and from ships.
Generally shallow draft vessels with a square bow deployed to push barges and pontoons.
Due to design, these vessels are more frequently deployed on inland waterways.
According to the U.S. Army Corps of Engineers, “Towboats push barges lashed together to form a “tow”. A tow may consist of four or six barges on smaller waterways up to over 40 barges on the mighty Mississippi below its confluence with the Ohio. A 15-barge tow iscommon on thelarger rivers with locks, such as the Ohio, Upper Mississippi, Illinois and Tennessee rivers. Such tows are an extremely efficient mode of transportation, moving about 22,500 tons of cargo as a single unit.”
The U.S. Army Corps of Engineers goes on to argue for the fuel efficiency and environmental benefits of transporting cargo by towboats, saying, “On average, a gallon of fuel allows one ton of cargo to beshipped59milesbytruck,202milesbyrail,and 514 miles by barge. Carbon Dioxide emission from water transportation were 10 million metric tons less in 1997 than if rail transportation had been used.”
According to the U.S. Army Corps of Engineers, the bulk commodities shipped on U.S. waterways include coal, petroleum, grain and other farm products, construction aggregates, chemicals and fertilizers, ores and finished metal products.
We have grouped the articulated tug and barge (ATB) and integrated tug-barge (ITB) systems within the towboat category. Many of the barge systems tank barges are designed to carry petroleum and chemical products, although ATBs also have been designed to carry other cargos, such as dry bulk cargo and containers. Many ATBs are designed to be seagoing and operate in U.S. coastal waters.
Vessels deployed to assist other vessels in maneuvering and to tow floating structures.
This category includes harbor and escort/ship assist tugs as well as oceangoing towing vessels and anchor handling and supply tugs deployed in the offshore oil & gas.
Offshore oil & gas anchor handlers generally operate in the Gulf of Mexico today. However, as commercial floating wind projects emerge offshore California,Oregon and alsoin the Atlantic, we anticipate a growing demand for domestically owned, operated and manned large anchor handlers.
Vessels deployed to undertake a wide variety of duties including fire & rescue, law enforcement, hydrographic surveys, spills & environmental response, research, training and marine construction support, for both coastal and harbor projects and well as offshore oil & gas and offshore wind. Some of these vessel types may be more suited to hybrid or zero-emission operations than others. Examples include research vessels deployed for scientific, oceanographic and/or environmental studies or training vessels for maritime academy and naval programs.
Vessels that do not fit any of the above categories.
This is a very diverse category of vessels registered in and operating in the U.S. Around 65% of the vessels within this category are coastal oil and chemical tankers and cargo vessels.
Earlierinthisreport,we reviewed theopportunities and challenges of adopting various hydrogenbased energy carriers. We have also looked at federal programs to support the adoption of low and zero-emission technologies. One conclusion thatcanbemadeisthatit ischallengingtoretrofit smaller and/or older vessels and in some cases a new vessel is the logical solution to replace an existing vessel.
In 2019, the California State University Maritime Academy prepared a report for CARB that addressed the feasibility of installing Tier 4 engines with inbuilt selective catalytic reduction systems (above 600 kW) and diesel particulate filters or retrofitting aftertreatment (DPF and SCR) systems to vessels with Tier 3 engines (below 600 kW) on in-use commercial harbor craftxiii .
In short, the study addressed the comparatively easier technical solution that would not impact the fuel tanks, vessel piping system and propulsion drives (mainly mechanical) – most of which will be required for retrofitting an existing vessel for zero-emission operations. Even within this comparatively limited impact, the repowering orretrofittingofmanyoftheharborcraftsegments was identified as either a major modification or not technically feasible, as shown in Exhibit 16.
Ofnote,theCalifornia studyfoundthat inallcases, the cost of repowering vessels with Tier 4 engines or retrofitting Tier 3 vessels with aftertreatment measures was below that of building a new vessel, which we believe is not always the case for retrofitting vessels for zero-emission operations.
The U.S. Army Corps of Engineers has produced a database and report summarizing the tonnage of waterborne cargo handled by the top 150 U.S. ports and for all 50 states The data filters tonnages by domestic cargo and foreign cargo. Domestic waterborne cargo amounted to around 1.1 billion tonnes in 2021.
Commercial fishing N/A No solution No solution
Charter fishing N/A No solution No solution
Excursion Minimal change Minimal change Minimal change
Slow speed ferry Minimal change Moderate change Moderate change
High speed ferry Major change Major change Major change
Tugs Minimal change No solution Moderate change
Towboat Moderate change Major change Moderate change
Crew and supply Moderate change Major change Major change
Pilot boat Major change Major change Major change
Workboat N/A Major change Major change
Source:IntelatusGlobalPartnersinterpretationCalifornia State University Maritime Academy data
The data does not tell us how many vessels call at ports but is a good indicator of a level of activity and by extension where the harbor assist tugs are concentrated.
Appendix 1 liststhetop30 ports, which accountfor 75% of the cargo handled by the top 150 ports. The top five ports are shown in Exhibit 17.
Source:IntelatusGlobalPartnersinterpretationofU.S.Army CorpsofEngineersDigitalLibrarydataxiv
California has 12 ports, 11 of which are publicly owned. Only the Port of Benicia is privately owned. An overview of the ports can be found in Appendix 2.
Collectively the Port of Long Beach and the Port of Los Angeles account for over 70% of total cargo transported in 2020.
CARB is the agency that regulates port emissions and enforces the state agenda for transitioning to zero-emission technologies within these ports.
Of interest, several of California’s ports are planning capabilities to support the future growth in offshore wind activity in California waters.
The California Energy Commission is currently reviewing two pilot arrays located at Vandenberg and federal agencies recently awarded leases for five commercial scale floating wind farms, three in Morro Bay and two in Humboldt, to be constructed around the end of the decade.
Under its Zero Emissions, Energy Resilient Operations Program, the Port of Long Beach is working on the design of a staging and integration facility for floating offshore wind turbines. The project is known as Pier Wind. Construction could begin as early as January 2027, with thefirst phase operational as early as 2031 followed by a second phase in 2032 and a final phase in 2035.
The Port of San Francisco has identified Piers 6870, 80, 92, 94/96 to support floating wind projects Hueneme is the preferred main port location to support the Vandenberg pilot projects.
Floating wind projects will bring a new category of vessels to California’s waters and ports:
• Large project cargo vessels for the import of components and completed substructures.
• Construction vessels including large anchor handling and subsea construction vessels
• Cable layers
• Construction and operations & maintenance support vessels including crew transfer
vessels and service operations vessels. Many of these offshore wind vessels will meet the definition of a harbor craft and will need to comply with California’s emissions regulations. Certain vessels will need to be built, owned, operated and manned by U.S citizens. This represents both an opportunity but, for technical and commercial reasons, is also a significant challenge.
Exhibit 18 summarizes the evolution of the U.S. waterborne transportation system.
Exhibit 18 Waterborne Transportation System
Source:IntelatusGlobalPartnersinterpretationofDOTBTS TransportationStatisticsAnnualReport2022xv
In Section 6, our analysis identifies around 10,100 harbor craft.
As we have discussed earlier, Title 33 of the Code of Federal Regulations (33 CFR) governs navigation and navigable waters within the United States and addresses the role of the USCG, the Army Corps of Engineers and the Saint Lawrence Seaway Development Corporation.
Exhibit 19 shows the U.S. inland waterway system.
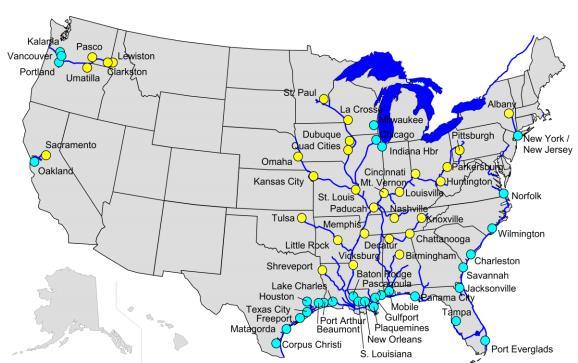
Source:U.S.ArmyCorpsofEngineers,InstituteofWaterResources
The roles of the leading federal agencies are:
• DOT: Acting through the USCG, the DOT has responsibility for vessel and navigation safety.
MARAD, the DOT’s Maritime Administration supports port development, intermodal systems and domestic shipping.
• The U.S. Army Corps of Engineers constructs and maintains navigation channels and harbors.
Out of 25,000 miles of U.S. waterways, around 12,000 miles are used for commercial traffic.
Most of the navigable rivers and canals in the U.S. are found in the eastern half of thecountry.
As seen in Exhibit 19.
Many of the rivers in the western half of the USA, such as the Colorado, feature steeper slopes grades, variable flows and dams which render them less suitable for navigation by larger vessels.
Domestic transport of cargo in the U.S. by all modes, whether intra- or inter-state amounted to close to 78 billion tons in 2021, of which waterborne transport accounted for 1.4% or 1.1 million tons However, for some states, waterborne transport accounts for a significantly larger proportion of domestic transportation within, into and out of a state. Examples using 2021 data extracted from Oakridge National Laboratory’s Freight Analysis Framework, produced for a partnership between BTS and the Federal Highway Administrationxvi include:
• Volume of cargo transported by water within a state: Louisiana (24%), Alaska (14%) and West Virginia (14%).
• Outbound cargo from a state by water as a proportion oftotalcargotransportation:Alaska (98%), Hawaii (27%), West Virginia (22%), Louisiana (19%) and Illinois (17%).
• Inbound cargo from a state by water as a
proportion of total cargo transportation: Louisiana (32%), Hawaii (22%), Alaska (20%) and West Virginia (20%).
Exhibit 20 ranks the top 15 states over four years on the 2021-2050 timeframe in descending order of total volume of cargo transported by water within, out of and into a state.
The share of the total volume of cargo transported by the top three states in all four analysis years, Louisiana, Texas and Illinois, rises from 54% in 2021to58%in 2030,62%by2040and65%by2050.
California accounted for around 3% of total U.S. intra and interstate waterborne cargo transport in 2022. Its share is forecast to rise to around 4% in 2030 and 2040 and fall back to 3% by 2050.
Details of all waterbornetransport volumes within, to and from states in 2021, 2030, 2040 and 2050 can be found in Appendix 3.
2021 2030 2040 2050
Louisiana Louisiana Louisiana Louisiana
Texas Texas Texas Texas
Illinois Illinois Illinois Illinois
West Virginia California California Michigan
Ohio Ohio Michigan California
Kentucky West Virginia Alaska Kentucky Michigan Michigan Ohio Ohio
California Kentucky Kentucky Indiana Indiana Alabama Mississippi Mississippi
Alaska Alaska Alabama Alabama Pennsylvania Mississippi Indiana Alaska
Mississippi Indiana Washington Washington Washington Washington West Virginia Missouri
Florida Pennsylvania Missouri Minnesota Alabama Missouri Pennsylvania Florida
Source:IntelatusGlobalPartnersinterpretationofdatafrom theFAF5SummaryStatisticsproducedbytheNational TransportationResearchCenter,OakRidgeNational Laboratory
BTS highlights that many major commodities are shipped at similar volumes all year round. These commodities include coal, chemicals and petroleum. DOT notes that downriver shipments and upriver fertilizer and cement tows were
delayed due to low water levels in the lower Mississippi in 2022.
The movement of grain and other farm products is seasonal – and BTS points out that drought conditionsresultinginlow waterlevelsinthelower Mississippi significantly impacted corn and soybean shipments in October 2022.
The Mississippi River System is an important transportation waterway interconnecting numerousinlandportsfordomestictradeandalso linking inland ports to the import and export gateway ports in the Gulf of Mexico. The system consists of around 250 tributaries and branches.
The DOT reported for 2020 that the Mississippi “carried more than half of the 165.5 million tons of freight that moved between the 12 states touching the Upper Mississippi System and Louisiana. The percentage of freight carried by the river to Louisiana is notably higher for some states: 92 percent for Indiana, 81 percent for Missouri, 80 percent for Illinois, and 75 percent for Kentucky.”
However, as discussed above, the DOT comments that drought caused low water conditions in 2022 on the Ohio and Upper Mississippi River systems and resulted in a significant drop in barge throughput, which we assume has a knock-on effect to towboat and push boat vessel utilization.
The Mississippi River System can be subdivided into four zones:
• Upper Mississippi: The Mississippi originates as an outlet stream from Lake Itasca in Minnesota and has a length of around 2,350 miles until emerging in the Gulf of Mexico.
The Upper Mississippi extends from Lake Itasca to the mouth of the Ohio River at Cario, Illinois.
The Upper Mississippi connects to the Illinois Waterway which feeds into the Great Lakes Waterway and eventually the Saint Lawrence Seaway, which allows oceangoing vessels arriving from the Atlantic to reach ports in all five of the Great Lakes.
• Missouri: The Mississippi is joined by a large number of river tributaries, including the Ohio and Missouri Rivers. The Missouri River is over 2,500 miles long, rising in western Montana and connecting with the Mississippi River north of St. Louis.
• The Ohio: The 980-mile-long Ohio rises in western Pennsylvania and flows to the mouth of the Mississippi in southern Illinois.
The largest tributary of the Ohio is the Tennessee River rising in Knoxville, Tennessee and joining the Ohio near Paducah, Kentucky
The Tennessee-Tombigbee Waterway joins the Tennessee River in northeastern Mississippi with the old Tombigbee River near Amory, Mississippi.
The northeastern extreme of the Ohio River extends to Pennsylvania and New York through the Allegheny River.
The Cumberland River rises in the Appalachian Mountains and joins the Ohio near Paducah, Kentucky.
• Lower Mississippi: The Lower Mississippi flows from the Ohio River to its mouth near New Orleans.
Connecting Baton Rouge to the Gulf of Mexico, the river allows deep sea vessels to connect with towboats and barges, whether for domestic or international trade.
Tributaries of the Mississippi River include the Red, Ouachita, Arkansas and White rivers.
The river joins the Gulf Intracoastal Waterway which connects ports in the Gulf of Mexico, such as Baton Rouge, Corpus Christi, Houston, Mobile and New Orleans, with major inland ports including, Chicago, Cincinnati, Kansas City, Memphis, Pittsburgh and St. Paul.
The Hudson River, flowing 315 miles north to south in New York, is connected to the Great Lakes by the Erie Canal and is a trade route from the Atlantic Ocean to the Great Lakes region.
The Columbia and Snake River system is a major transportation option for moving barges and containerized cargo for export including wheat, forest products, minerals and soybeans. The system also supports the imports and export of auto parts.
The navigation channel is maintained to Pasco on theColumbiaandtoLewiston,465 milesinland,on the Snake River.
The system connects the Ports of Astoria, Portland and St. Helens in Orgon, Camas-Washougal, Chinook, Kalama, Ilwaco, Ridgefield, Vancouver, Wahkiakum and Woodland in Washington and reaches the Port of Lewiston in Idaho, which at 465 miles from the Pacific Ocean is the most inland port on the west coast.
The Port of Sacramento is located around 90 miles from San Francisco and the San Pablo Bay. Direct access to Suisun Bay, east of San Francisco, is provided by the Deep Water Ship Channel. According to local authorities, the main export cargofrom Sacramentois rice, and importcargoto Sacramento is cement.
Fortheanalysis,wewillsegmentthedatabyvessel type. We will analyze the data by age, gross tonnage, and length.
Total fleet
Our database identifies 9,905 vessels. For clarification, pilot boats cannot be seen in Exhibit 21 as they account for 0.1% of the total harbor craft fleet.
Exhibit 21 U.S. Harbor Craft by Type
Work boats, 199 Other, 174
Tugboats, 1,477
respectively accounting for 15%, 13% and 11% of the harbor craft fleet.
What power output do these vessels have?
Exhibit 22 summarizes the minimum, maximum and average horsepower figures for each of the vessel categories in our analysis.
Exhibit 22 U.S. Harbor Craft by Horsepower
Towboat,


Source:IntelatusGlobalPartners
Exhibit 21 identifies that the towboat segment is the largest harborcraft segment in terms of vessel numbers, accounting for 36% of the total fleet.
Based on vessel numbers only, one can infer that thetowboatsegmenthasthegreatestpotentialfor zero-emission technologies.
The ferry and excursion segment is the second most numerous category, accounting for 20% of the fleet
Tugboat, commercial fishing vessel and crew and supply vessels all enjoy similar fleet sizes,
Source:IntelatusGlobalPartners
While our analysis starts at vessels with 600 KWof total power output, Exhibit 22 shows that the average harbor craft vessel size within our database can best be described as small to medium.
Whereas the California Air Resources Board harbor craft database allows us to analyze the number of engines per vessel, this is not the case with the Coast Guard or other databases. As a result, our database only identifies the number of engines for around 10% of the vessels.
Our database segments data into four categories to reflect activity:
• In Service: Active with AIS signal received within the last three months reflecting movement. We have 5,562 vessels or 56% of all the vessels in the database.
• Idle:Last AIS signal received between threeand six months. This indicates that vessel could be temporarily idle for commercial or technical reasons, under repair or upgrade, or trading outside the coverage of AIS.
There are not may Idle harbor craft – the total for the U.S. at the time of analysis was 204 or 2% of the vessel dataset
Idle vessels may return to service once commercial or technical issues are addressed.
• Inactive and Laid-up: Last AIS signal received six months or more ago and categorized as inactive or laid-up in the USCG database. Traditionally, for vessels required to transmit AIS signals one would group these vessels as inactive or scrapped in place. We have identified 1,071 such vessels, or around 11% of the fleet.
• Unknown: Last AIS signal received six months or more ago. At 31% or 3,068 vessels, this is a statistically significant number of vessels.
As we have established, not all harbor craft require AIS ClassA systems, for which thereare several possible scenarios regarding the status of the vessel. The vessel could be, on long-term lay-up or scrapped in place, trading outside of the USA or simply does not need to feature AIS Class A system
Around 0.25% of the vessels registered in U.S. statesarecurrentlyactiveoutsideoftheUnited States, most of which are classed as having an Unknown operational status. Three quarters of these vessels are offshore support vessels.
Exhibit 23 presents a breakdown of the total harbor craft segment by activity.
Exhibit 23 U.S. Harbor Craft in Service
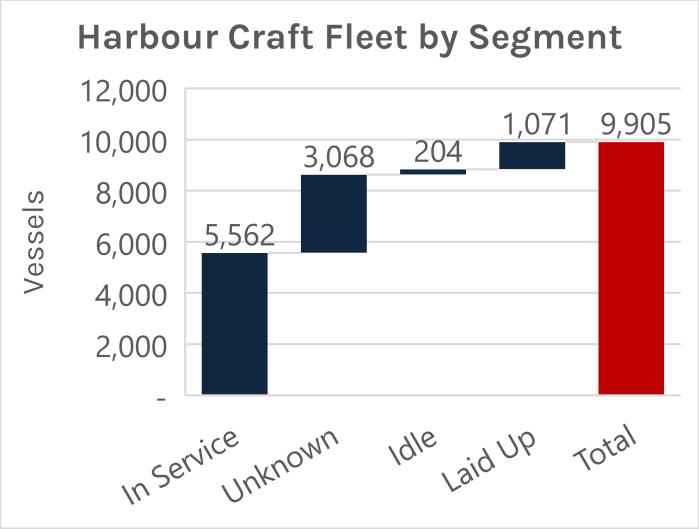
Source:IntelatusGlobalPartners
Exhibit 24 presents the breakdown of the U.S. harbor craft segment by status and allows us to understand why our database includes some 3,068 vessels with an unknown status. Many do notrequirean AISClassA systemthatwouldmake tracking and status identification significantly easier.
The analysis does confirm the high level of AIS tracked activity for the towboat segment and confirms that this segment merits further review for technical and commercial feasibility for zeroemission operations in the future.
Exhibit 24 U.S. Harbor Craft by Activity
Source:IntelatusGlobalPartners
Exhibit 25 presents the same core data as used in Exhibit 24 but presents the proportion of fleet that isIn Service,Unknown,Idle and Laid-up &Inactive.
We obviously have the highest degree of certainty for vessels that are classed as In Service, Idle or Laid-up.Andthisisclearlyachievedforthetugboat and towboat segments.
It is the Unknown vessels that are the grey area between In Service and Laid-Up.
Source:IntelatusGlobalPartners
Focusing purely on the In Service category, Exhibit 26 reviews the 5,562 vessels for which we have identified an AIS signal within the last three months.
From Exhibit 26, we note that the Towboat segment is home to both the highest absolute number and proportion of vessels in a segment that are confirmed to be In Service.
When we segment the entire 9,905 vessel population by delivery date, we note that there are many older vessels, many of which have undergone one or multiple repowering operations over their lifetime.
Exhibit 27profilestheharbor craft segmentby age. There are close to 250 vessels currently still in the database that were delivered in or before 1950.
We also note the building boom in the 1970s, a decade in which over 2,100 vessels that are still in the database were delivered.
From 1990 to 2020, vessel deliveries (for vessels still in the database) generally fluctuated in a range of around 100-200 vessels delivered per year, with only two years of around 75 deliveries
Source:IntelatusGlobalPartners
Source:IntelatusGlobalPartners
Around two-thirds of the total harbor craft fleet is over 25 years old, which is relatively old in the context of international maritime operations.
Barely 2,000 or 21% of vessels are 15 years old or younger.


WhenwelookattheInServiceharborcraft,wenote a slightly younger age profile than the overall fleet.
Around 27% of the 5,562 active harbor craft are 15 years or younger.
The proportion of vessels of 25 years of age or older is 54%.
Exhibit 29 segments the total In Service harbor craft population by age group.
The ferry and excursion vessel segment, accounting for 863 active vessels, also has a high proportion of older vessels.


Drilling down into the individual segments, we establish that each different vessel category has a different age profile.
We start with the 519 In Service crew and supply boats, where we see a more even distribution than seen for commercial fishing vessels. That said, vessels of 25 years and older still account for close to 30% of the segment.


Source:IntelatusGlobalPartners
Looking at the 436 In Service fishing vessels in Exhibit 32 and note that close to three-quarters of the active vessels are 25 years or older. The indications are that there has been limited new building activity in the last 20 years.


Source:IntelatusGlobalPartners
The smallest harbor craft segment, pilot vessels, has six vessels confirmed In Service.
Exhibit 35 profiles the 981 In Service tugboats by ageand finds that less than 20% of tugboatsare15 years old or younger and that close to 60% are 25 years or older.
Exhibit 35 In Service Tugboats by Age Group


Source:IntelatusGlobalPartners
The largest In Service segment encompasses towboats and pushboats, where one third of the segment is 15 years or younger and around 54% is 25 years or older.


Source:IntelatusGlobalPartners
Like many segments, workboats have a high proportion of older vessels as seen in Exhibit 36.
Exhibit 36 In Service Workboats by Age Group


Source:IntelatusGlobalPartners


Source:IntelatusGlobalPartners
Given the variety of vessels covered by the definition of other vessels, one cannot draw too many conclusions with the exception of the general observation that this is a more evenly distributed segment.
Exhibit 37 In Service Other Vessels by Age Group
Other


Source:IntelatusGlobalPartners
Unknown operational status
As noted previously, vessels grouped in the Unknown category may not be inactive and may simply be outside of AIS range for an extended period, overseas or are not equipped with AIS Class A systems that allow for the analysis of vessel status.
Exhibit 38 establishes that over 70% of vessels with an unknown operational status are 25 years old or more and only 14% are 15 years of age or less. By comparison, the In Service vessel segment contains less than 55% of vessels of 25 years or older.
Exhibit 38 Vessels with an Unknown Operational Status by Age Group
Vessels With An Unknown Status By Age Group


Source:IntelatusGlobalPartners
As with the In Service vessels, we drill down into the individual segments below
We start with the crew and supply boats, where the operational status is unknown.
Exhibit 39 Crew and Supply Vessels with an Unknown Operational Status by Age Group
Crew And Supply With An Unknown Status By Age Group


Source:IntelatusGlobalPartners
We note that two thirds of the vessels in this segment are 25 years of age or older. When we compare to the In Service vessels, we note around 30% in this age group. This suggests that a large number of vessels in this segment may be scrapped in place.
Thereare938ferriesandexcursion vesselswithan unknown operational status. Interestingly, the age profile for this segment is similar to the In Service ferries.
Exhibit 40 Fishing Ferry and Excursion Vessels with an Unknown Operational Status by Age Group
Exhibit 41 Fishing Vessels with an Unknown Operational Status by Age Group
0-5


16-20 20-25 ≥25

Source:IntelatusGlobalPartners
There are a lot of fishing vessels where operational status is Unknown – 822 vessels, which is nearly twotimes thenumber of In Servicefishing vessels.
It is likely that many of these are active but are not equipped with the AIS Class A system that supports tracking and analysis.
It is interesting to note that 24% of the segment is 20 years of age or younger compared to only 9% of the In Service fishing vessels
Close to 70% of the fishing segment where the operational status is Unknown are 25 years of age or older, which the figure of close to three-quarters of the active fishing vessels. This supports the view that there has been limited new building activity in the last 20 years.
6-10

11-15
16-20

20-25 ≥25

Source:IntelatusGlobalPartners
All five pilot boats with an Unknown operational status are 25 years of age or older.
We record a comparatively small number of towboats (to the In Service Towboat segment) where the operational status is Unknown. We infer that a significant proportion of over 80% of towboats which are 25 years or older are effectively scrapped in place.
Exhibit 42 Towboats and Pushboats with an Unknown Operational Status by Age Group

11-15
16-20 20-25 ≥25
Exhibit 43 profiles tugboats by age and finds that 90% are 25 years or older. It is likely that many of these are active but are not equipped with the AIS Class A system that supports tracking and analysis or are scrapped in place
Exhibit 43 Tugboats by Age Group with an Unknown Operational Status by Age Group

Source:IntelatusGlobalPartners
It is likely that many workboats with Unknown status are not equipped with the AIS Class A system or are scrapped in place.
Exhibit 44 Workboats with an Unknown Operational Status by Age Group

Given the variety of vessels covered by the definition of other vessels, one cannot draw too many conclusions with the exception of the general observation that it is likely that many of these vessels are not equipped with the AIS Class A system or are scrapped in place.
Exhibit 45 Other Vessels with an Unknown Operational Status by Age Group

Source:IntelatusGlobalPartners
Idle vessels
There are just over 200 idle vessels, where an AIS signalhasnot been received between threeand six months. This could be because of dry docking and repair, lack of commercial opportunity or other factors. Forfishing vessels,inactivitycanbelinked to weather and fishing season limits.
Itispossiblethatthesevesselswillreturntoactive service. However, it is equally possible that they remain idle and move to the Inactive category.


Source:IntelatusGlobalPartners
Exhibit 46 establishes nearly three quarters of the vessels are 25 years of age or older.
Vessels at this age generally are more expensive to maintain in working order, which indicates that someare morelikely toentertheInactiveand Laidup category.
Source:IntelatusGlobalPartners
Vesselsinthissegmentareeitherin declaredlongterm lay-up or are effectively laid-up through lack of activity
In some shipping segments, for example the offshore support vessel segment, this activity is often taken to mean that the vessels have effectively been abandoned or scrapped in place. It is unlikely that these vessels will return to the active fleet.
Exhibit 47 establishes that the majority of Laid-up and Inactive vessels (83%) are 25 years of age or older.
We believe that vessels in this category are very unlikely to return to active service.
Most IMO regulations, including MARPOL and SOLAS are based on gross tonnage. Gross tonnage is also an important numberwhen considering the requirement for vessels of 300 gross tons and abovetodeployAIS ClassA systemswhen engaged in international voyages
However, given that the majority of vessels within this dataset are not engaged on international voyages, this distinction is not so important for our harbor craft population.
Whereas net tonnage measures the volume of only the cargo-carrying space on a vessel, gross tonnage measures the volume of all enclosed spaces on a vessel – including the engine room and other non-cargo spaces
Gross tonnage should not be confused with gross registered tonnage, which measures the space available for cargo, fuel, passengers and crew within the hull and enclosed space above the deck of a merchant ship.
The average for all harbor craft in our vessel dataset is 485 gross tons.
ItisnotsurprisingthattheOthercategoryhashigh average and maximum GT, given that the segment includes tankers and cargo vessels trading in the USA, but are also capable of international travel.
Exhibit 47 presents the average, minimum and maximum GT by vessel category.
Exhibit 48 Harbor Craft by GT
Vessels whose operational status is Unknown
The 3,100 or so vessels with Unknown operational status have a comparatively low average GT of 220 tons.
Exhibit 50 Harbor Craft with Unknown Operational Status by GT
Source:IntelatusGlobalPartners
Vessels In Service
Our population of around 5,500 In Service harbor craft has an average GT of 609 tons. Exhibit 49 establishes that the average GT in all categories, with the exception of tugboats, is higher for In Service Vessels than for the whole harbor craft population.
Exhibit 49 In Service Harbor Craft by GT
Source:IntelatusGlobalPartners
Idle
Our population of Idle harbor craft has an average GT of 341 tons.
Exhibit 51 Idle Harbor Craft by GT
Source:IntelatusGlobalPartners
Laid-up and Inactive vessels
Theaverage GTfor the Laid-up and Inactive vessels is 532 tons.
Source:IntelatusGlobalPartners
Exhibit 54 presents length characteristics by vessel segment.
There are several commonly used measurements to indicate a vessel’s length, including:
• Loaded waterline length or LWL: Measuring a vessel’s length at the waterline.
• Length overall or LOA: maximum length of a vessel’s hull parallel to the waterline.
• Length of hull or LOH: used for small boats, this measures the length of the hull without attachments.
Our database relies on the USCG data for vessel lengths which often does not specify which length category has been applied
To give an example of the issue, we refer to McAllister Towing’s A. J. McAlister, a tugboat and firefighting vessel. The vessel holds an ABS classification certificate. Exhibit 53 presents severalfiguresforlength sourcedfromwidelyused data sources.
We start by looking at the length of the vessels in the crew and supply segment and compare length against breadth, gross tons and horsepower, to establish the correlation between the factors.
The first graph shows a comparatively linear correlation of length and breadth increase for crew and supply vessels. The average In Service crew and supply vessel length is 172 feet and breadth is 44 feet.
In the second graph, as vessel length increases, gross tonnage remains around the 500 tons level. However, beyond around 180 feet, gross tonnage begins to increase steadily in an almost linear fashion. The average In Service crew and supply vessel gross tonnage is 1,061 tons.
For length and horsepower, there appear to be two general relationship pathways once a vessel reaches around 140 feet – a shallower growth curve which covers a larger proportion of the vessels and a steepercurveforagroup of vesselsupto200feet in length. The average In Service crew and supply vessel length is close to 4,050 horsepower.
Exhibit 55 In Service Crew and Supply
Vessels by Length, Breadth, Gross Tons and Horsepower
Source:IntelatusGlobalPartners
Looking at the Ferry segment, we note a concentration of vessels below 185 feet and different correlations between length, breadth, gross tons and horsepower than seen in the crew and supply segment.
Exhibit 56 In Service Ferries by Length,
Source:IntelatusGlobalPartners
The average In Service ferry has a length of 114 feet and breadth of 30 feet. Average gross tonnage is 302 tons and horsepower 2,505.
Exhibit 57 profiles the fishing fleet in the context of vessel breadth, gross tonnage and horsepower.
The average fishing vessel In Service has a length of 106 feet and breadth of 28 feet, with a gross tonnage of close to 380 tons and an average of 1,522 horsepower.
Exhibit 57 In Service Fishing Vessels by Length, Breadth, Gross Tons and Horsepower
In Service Fishing Vessels -
Source:IntelatusGlobalPartners
There are not so many pilot vessels above 600 kW and as such the trend data for the correlation of length, breadth, gross tonnage and horsepower is somewhat limited.
In Service pilot boats have the shortest average length of all of the vessel categories at 77 feet. Average breadth is 23 feet, gross tonnage 135 tons and 1,676 horsepower.
Exhibit 58 In Service Pilot Boats by Length, Breadth, Gross Tons and Horsepower Source:IntelatusGlobalPartners
The towboat segment has a relatively close correlation of length, breadth, gross tons and horsepower as seen in Exhibit 59
The average In Service towboat has a length of 110 feet and breadth of 36 feet. The average gross tonnage of this segment is around 443 tons and horsepower around 2,232
Exhibit
Source:IntelatusGlobalPartners
Like the towboat segment, tugboats have a relatively close correlation of length and breadth. The impact of offshore tugs can be seen in the dataset for vessels over 140 feet
Theaveragelength of In Service tugboats is 90 feet and breadth 31 feet (average breadth is same as towboat segment). Average gross tonnage is 217 tons and horsepower slightly above 3,325.
Exhibit 60 In Service Tugboats by
In Service workboats generally show a strong correlation for length and breadth, gross tons and horsepower, although there is one larger vessel seen in thecharts – a largenaval auxiliary research vessel.
In Service workboats have an average length of 181 feet and breadth of 43 feet. Average gross tonnage is 1,859 and horsepower close to 4,128
Exhibit 61 In Service Workboats by Length, Breadth, Gross Tons and Horsepower
In Service Workboats - Length and Horsepower
Source:IntelatusGlobalPartners
Given the variety of vessel types with the category of Other, it is surprising to see, at least for breadth and gross tons, the close correlation to length growth.
With an average In Service vessel length of 390 feet, breadth of 74 feet, 14,272 gross tons and 8,199 horsepower, it is clear that this segment features some larger oceangoing vessels that are still classed as harbor craft.
Exhibit 62 In Service Other Vessels by Length, Breadth, Gross Tons and Horsepower
In Service Other VesselsLength and Breadth
In Service Other VesselsLength and
In Service Other Vessels -
Source:IntelatusGlobalPartnersAs with the In Service segment, we start our analysis with the crew and supply boats where the operational status is Unknown. The graphs in Exhibit 63believe generally follow the same trends as seen for the In Service crew and supply boats.
Crew and supply boats with an Unknown operational status have lower average values of length (147 feet), breadth (36 feet), gross tons (494 tons)andhorsepower(2,902)thanthevesselsthat are confirmed to be In Service. This may have something to do with the older age profile of vessels in this category.
Exhibit 63 Crew and Supply Vessels with an Unknown Status by Length, Breadth, GT and Horsepower
Crew and Supply Vessels with Unknown Status -
and
Crew and Supply Vessels with Unknown Status - Length and Gross Tons
Source:IntelatusGlobalPartners
We see similar trends in the Unknown status Ferry segment as with the In Service vessels, although average values for length (67 feet), breadth (21 feet), gross tons (115 tons) and horsepower (1,338) are lower than the In Service Vessels.
Exhibit 64 Ferries with an Unknown status by Length, Breadth, GT and Horsepower
Source:IntelatusGlobalPartners
Exhibit 65 profiles the fishing fleet in the context of vessel breadth, gross tonnage and horsepower.
Average values for length (68 feet), breadth (21 feet), gross tons (142 tons) and horsepower (1,205) are lower than the In Service Vessels.
Exhibit 65 Fishing Vessels with an Unknown Status by Length, Breadth, GT and Horsepower
Fishing Vessels with Unknown Status -
Fishing Vessels with Unknown
Fishing Vessels with Unknown Status - Length and Horsepower
Source:IntelatusGlobalPartners
As with In Service vessels, there are not so many pilot vessels above 600 kW and as such the trend data for the correlation of length, breadth, gross tonnage and horsepower is somewhat limited.
Pilot boats continue the trend of other segments with an Unknown status in terms of lower average values compared to In Service vessels breadth (20 feet), gross tonnage (110 tons) and horsepower (1,336). Average length is the same (77 feet)
Exhibit 66 Pilot Boats with an Unknown Status by Length, Breadth, GT and Horsepower
Pilot Boats with Unknown Status - Length and Breadth
Source:IntelatusGlobalPartners
The towboat segment has a relatively close correlation of length, breadth and gross tons as seen in Exhibit 67.
As we have generally seen with all other categories of vessels where the operational status is Unknown, the average length (71 feet), breadth (26) grosstonnage(149tons)andhorsepower(1,751)are all lower than for In Service Towboats. Given that 83% of this segment is 25 years in age or older, it seems logical to conclude that the older and small vesselsmaybetrendingtolongertermidleperiods and even lay-up.
Exhibit 67 Towboats with an Unknown Operational Status by Length, Breadth, GT and Horsepower
Towboats with Unknown Status - Length and Horsepower
The analysis of the tugboats with an Unknown operational status closely mirrors that of the In Service vessels.
Looking at the tugboats with an Unknown operationalstatus,wenotethatthe averagelength of vessels in this category is the same (90 feet) than the average length of In Service tugboats.
All other average values are lower than the In Service Vessels. Average breadth is 28 feet, gross tonnage is 212 tons and horsepower 2,615
Exhibit 68 Tugboats with an Unknown Operational Status by Length, Breadth, GT and Horsepower
Towboats with Unknown Status - Length and Horsepower
Tugboats with Unknown Status - Length and Gross Tons
Tugboats with Unknown Stauts - Length and Horsepower
Source:IntelatusGlobalPartners
Exhibit 69 profiles the Workboats with an Unknown operational status.
The average length (104 feet) and breadth (27 feet) of workboats with an Unknown operational status is 42% and 38% lower respectively than the values for the In Service vessels.
The average gross tonnage (566 tons) is 70% lower than the In Service workboats and horsepower 51% less.
Exhibit 69 Workboats with an Unknown Operational Status by Length, Breadth, GT and Horsepower
Workboats with an Unknown Status -
Workboats with an Unknown Status - Length and Gross Tons
Source:IntelatusGlobalPartners
We finish our review of other vessels with an Unknown operational status by presenting the length analysis of Other vessels again breadth, gross tons and horsepower.
Exhibit 70 Other Vessels with an Unknown Operational Status by Length, Breadth, GT and Horsepower
Other Vessels with an Unknown Status - Length and Gross Tons
Other Vessel with an Unknown Status -
Source:IntelatusGlobalPartners
Idle vessels
Given that there are only slightly over 200 Idle vessels, we have combined all eight categories of harbor craft into one graph for each correlation analysis in Exhibit 71.
In Exhibit 71, we start with summarizing the average values for length, breadth, gross tonnage and horsepower for all the Idle vessel segments. Again, it is only the tugboat segment of the Idle vessels where the category average length is slightly higher than for the In Service vessels.
For all other parameters, the values for the In Service vessels are higher than for the Idle vessels.
Crew & Supply
Ferries
Fishing
Pilot
Towboats
Tugboats
Workboats
Other
Crew & Supply
Ferries
Fishing Pilot
Towboat
Tugboat
Workboat
Other
Crew & Supply
Ferries
Fishing Pilot
Towboat
Tugboat
Workboat
Other
In terms of the harbor craft segment that is most suited for zero-emission solution, Laid-up and Inactivevesselsdonot represent themost obvious candidates as our understanding is that it is highly unlikely that these vessels will return to active service and their length characteristics are a driver to understanding the new building opportunity – we therefore provide only a simple length analysis of this category in Exhibit 72.
We have grouped the U.S harbor craft by operational status (In Service, Idle, Unknown and Laid-up) and category reflecting suitability for zero-emission technology. This is a high-level subjective grouping and is subject to further technical review:
• Cat 1: the most suitable for zero-emission operations. This group of 4,405 vessels covers ferries, pilot boats, towboats and tugboats. These vessels are grouped as Cat 1 all operate in segments that are characterized by local operations to a fixed operation base or trade routes that can be readily supported by refueling infrastructure.
• Cat 2: medium suitability for zero-emission operations due to operational patterns or vessel architecture. This segment covers crew and supply vessels and workboats.
• Cat 3: Lower suitability for zero-emission operations and includes fishing vessels and other vessels, not categorized in the other seven core segments.
Zero-Emission Vessel Potential

Source:IntelatusGlobalPartnersinterpretationofEPAinformation
Exhibit 73 identifies the 4,405 In Service ferries, pilot boats, towboats and tugboats with the highest attractiveness for zero-emission technologies such as HyZET.
The chart also presents the possibility for this group to be increased to over 6,250 vessels if Idle and Unknown vessels are also included.
Drilling down in to the 4,405 In Service Cat 1 vessels, we see that towboats account for around 58% of the vessels.
Exhibit 74alsoallowsus tounderstand that 56% of In Service Cat 1 vessels are 25 years of age or older. The 2,462 older vessels represent the lower hanging fruit in terms of suitability for replacement.
Source:IntelatusGlobalPartners
However, even though the In Service Cat 1 vessels are most suited to zero-emission operations, it is to be kept in mind that, other than hydrogen, there areseveraltechnical solutionsavailabletoachieve zero-emission operations. The options include fully electric vessels and vessels featuring other hydrogen carriers, such as methanol.
As we discussed in Chapter 5, harbor craft serve both the coastal ports on the Atlantic, Gulf of Mexico and Pacific coasts as well as a large inland waterway system, the majority of which is deployed on the Mississippi River System. In addition to the ports and inland cargo transport, harbor craft are also present in states with fishing, oil & gas and passenger transport demand.
Exhibit 75 examines the top 10 states by total number of harbor craft (all operational statuses), which accounts for 73% of the total harbor craft population. The full list of 50 states where a harbor craft has a registered home port is shown in Appendix 4.
Exhibit 75 Top 10 States by Harbor Craft Number
Source:IntelatusGlobalPartners
California, the third largest state in terms of vessel home port is reviewed in depth in the next chapter.
We profile the remaining Top 10 states below.
7.1. Louisiana
Exhibit 73 shows the importance of Louisiana, as 33% of all In Service harbor craft in the USA have a home port in Louisiana. In fact, the In Service harborCraft withahomeport in Louisiana account for 18% of the total U.S. harbor craft fleet.
Exhibit 76 confirms that Louisiana is an important state in the towboat segment, where Louisiana registered towboats account for a third of the U.S. registered towboats. With close to 80% of Louisiana registered towboats confirmed In Service, In Service towboats with a home port in the state account for 27% of the total U.S. towboat fleet (all statuses).
Exhibit 76 Louisiana Harbor Craft by Type and Status
Source:IntelatusGlobalPartners
A large proportion of Louisiana’s crew and supply vessels are active in the oil & gas segment. The higher number of vessels with an Unknown status
reflects those boats not needing an AIS Class A system, some deployed overseas and some that are in long-term lay-up.
Of note, according to the latest U.S. Energy Information Administration data, only 17% of Louisiana’s electricity is produced from zero or very low emission sources (nuclear, hydroelectric and other renewables). However, there are several plans to produce blue and green fuels using wind and solar technology coupled with, in the case of blue fuels, carbon capture from on- and offshore sources.ThestatehasyettoestablishaRenewable Portfolio Standard to mandate a target for renewable energy generation, although the city of New Orleans has established its own standard.
Of note, the U.S. Economic Development Administration awarded the Greater New Orleans Development Foundation, a 25-partner organization, with $50 million in 2022 to “transition the regional hydrogen energy sector by closing the cost gap between green hydrogen, produced from renewable energy sources, and other forms of hydrogen used today, which rely on fossil fuels.” The team plans to develop solutions to source offshore wind power, either from state or federal waters, to produce green hydrogen that supplies industrial users, including coastal and river vessels. The project also aims to develop a methanol refueling barge at the Port of South Louisiana through a public-private partnership which will supply methanol to towboats operating on the lower Mississippi River
According to the governor of Louisiana, Arkansas, Louisiana and Oklahoma are seeking federal funding to develop a $1.25 billion clean hydrogen hub as part of a DOE administered process. The project is called Hydrogen, Arkansas, Louisiana and Oklahoma (HALO). HALO is competing with 32 other clean hydrogen hub proposals submitted to DOE.
The HALO proposal envisages the production of both blue and green hydrogen for the use in petrochemical manufacturing and the production of transport fuels forboth vehiclesand vessels. We anticipate that, at least in the short- to mid-term, these fuels will be supplied to the international
shipping segment, leaving limited locally produced zero-emission fuel supply for harbor craft. As such, zero-emission vessel harbor craft operations in Louisiana will require a significant amount of imported energy and/or a ramp-up of local clean hydrogen production capacity.
Alaska registered harbor craft fleet is dominated by fishing vessels and ferries.
Alaska records a relatively low number for confirmed In Service vessels, which is not surprising, given the proportion of fishing vessels that are not required to feature an AIS Class A system, that facilities utilization analysis.
Exhibit 77 Alaska Harbor Craft by Type and Status Source:IntelatusGlobalPartners
Further, only 35% of the states’ 201 registered ferries and excursion vessels are confirmed In Service, which indicates that these vessels are generally also not equipped with AIS Type A systems.
According to EIA data, around 21% of Alaska’s electricity is produced from renewables. The governor has introduced a bill to establish a Renewable Portfolio Standard of 30% sustainable power by 2030 and 80% by 2040 – the bill has yet to become law.
Like many states, Alaska is seeking to secure a slice of the $7-8 billion DOE funding for clean hydrogen hubs. Alaska’s project seeks to leverage carbon capture technology associated with the Alaska LNG project.
However,wesee Alaska more asan exporterofblue hydrogen than a producer for its own internal demand, especially in terms of fueling fishing vessels. This results in a potentially limited shortto med-term opportunity for zero-emission vessel technology in the state.
Exhibit 78 Texas Harbor Craft by Type and Status
Louisiana records an In Service figure of over 75% of the category.
Towboats account for close to half of registered Texas harbor craft.
Around 44% of electricityin Texasisproducedfrom zero-emission sources.
The Leading in Gulf Coast Hydrogen Transition (LIGH2T) consortium is one of the 33 regional hydrogen hubs to submit final proposals to secure DOE funding in February of this year. It is understood that the hub mainly features blue hydrogen production.
If successful, LIGH2T could conceivably fuel low emission harbor craft. However, given that the fuel source will be blue hydrogen, we argue that this will be zero-emission on a well-to-wake basis.
Exhibit 78 shows that the fishing fleet is the largest harborcraft segment in terms of registered harbor craft in Washington State.
Exhibit 79 Washington State Harbor Craft by Type and Status
Washington
Source:IntelatusGlobalPartners
Like Louisiana and reflecting its importance in the internal transportation of petroleum products and chemicals, Texas is a leading state for registered towboats, ranked third in the USA, and like
Source:IntelatusGlobalPartners
We are not surprised that only around 37% of the fishing vessel category is confirmed In Service, given that many fishing vessels do not carry AIS Type A systems.
According to the latest published figures from the U.S. Energy Information Administration, around 73%ofWashingtonState’selectricityproductionis classed as zero or very low carbon, with three sources dominating: hydroelectric, other renewables and nuclear. Through its Renewable Portfolio Standard, Washington targets 100% renewable power supplied from utilities by 2045.
Washington is participating the Pacific Northwest Hydrogen Association (PNWH2) along with the states of Orgon and Montana. PNWH2 aims to leverage renewable energy capacity to produce clean hydrogen.
Exhibit 80 New York Harbor Craft by Type and Status
in the state. We find this of interest, given that these two vessel segments are particularly suited to zero-emission operations, whether from electricity, hydrogen or other hydrogen carriers. New York
Given the population density close to water, it is not surprising to see that New York features 10% of the registered ferries in the U.S.
Further, given the large ports in the state, a large number of tugboats is to be expected.
New York’s electricity production is around 56% from zero-emission nuclear, hydroelectric and other renewable resources, and the state seeks to boost its renewable capacity with large offshore wind farms that will come onstream in the second of this decade and during the next decade.
The state has a Renewable Portfolio Standard of 70% utility power by 2030 and 100% by 2040.
NewYorkisoneofsevenstatesparticipatingin the $3.62 billion Northeast Regional Clean Hydrogen Hub project that is seeking $1.25 billion of DOE funding. The other partner states are New Jersey, Maine, Rhode Island, Connecticut, Vermont and the Commonwealth of Massachusetts.
The project seeks to produce clean hydrogen for transportation, high temperature industries, district heating and hard-to-decarbonize sectors.
Given that the three largest harbor craft segments registered in New York are ferries, towboats and tugboats, we see New York as having significant opportunities for zero-emission harbor craft technologies.
Excursion vessels and ferries account for around 45%ofFlorida’sregisteredharborcraft. Manyofthe vessels are not equipped with AIS Class A systems that will aid activity analysis.
Source:IntelatusGlobalPartners
After fishing vessels, tugboats and ferries account for the next largest amounts of registered vessels
Given that many of the vessels will be excursion vessels rather than ferries, we see these as lower probability candidates for short- to mid-term replacement with zero-emission vessels.
Exhibit
Florida Harbor Craft by Type and Status
Workboat
Tugboat
Towboat
Fishing
Ferry
Crew and supply
Other Vessels
In Service
- 100 200 300
Source:IntelatusGlobalPartners
In 2020, Canaveral Pilots Association announced a plan to collaborate with Glosten and Ray Hunt Design to develop a demonstration project for the design, construction and operation of an electric pilot boat.
Only around 19% of Florida’s electricity is currently produced from zero-emission sources. Further, it does not appear that Florida is participating in a regional clean hydrogen hub currently under review by DOE. As such, to support zero-emission harbor craft, the state will either need to ramp up local clean hydrogen production and/or import clean hydrogen from other states.
Given its position in the Mississippi River System, it is not surprising to see Missouri in the Top 10 states for harbor craft registrations and that towboats account for over 90% of Missouri’s registered harbor craft.
Exhibit 82 Missouri Harbor Craft by Type and Status
Missouri Harbor Craft by Type and Status
Towboat
Ferry
- 200 400 600
In Service
Unknown Idle Laid Up & Inactive
Source:IntelatusGlobalPartners
Missouri produces around 34% of its electricity from clean energy sources, but coal still accounts for 55% of electricity generation.
Missouri is a partner in the Mid-Continent Clean Hydrogen Hub (MCH2) along with Iowa and Nebraska. If successful, MCH2 could produce zeroemission fuel suitable for towboats and this makes Missouri a state of interest for zeroemission technology development.
Delaware’s registered harbor craft has the highest overall proportion of In Service vessels in the USA at 80%.
81% of Delaware’s 332 registered harbor craft are either towboats or tugboats and these have respective In Service status us 84% and 75%.
These segments are particularly well suited for zero-emission technologies.
Source:IntelatusGlobalPartners
Delaware’s electricity production is currently predominantly fueled by natural gas, although the state has established a Renewable Portfolio Standard of 25% by 2026.
Delaware is participating in the Mid-Atlantic Clean Hydrogen Hub proposal currently under review by DOE. Partners in the proposal include Southeastern Pennsylvania and Southern New Jersey.
It appears that the hydrogen hub proposal aims to support manufacturing and transport infrastructure built around the I-95 corridor, suggesting there is limited opportunity for zeroemission harbor craft fuels.
The Commonwealth of Massachusetts’ harbor craft segment is dominated by ferries and fishing vessels, the former of which are generally more suited for zero-emission operations.
Exhibit 84 Massachusetts Harbor Craft by Type and Status
Source:IntelatusGlobalPartners
75% of electricity produced in Massachusetts is from natural gas.
Through its Renewable Portfolio Standard, Massachusetts is seeking to increase the quantity of renewableswithin itsenergy mix,whereit hopes to bring offshore wind farm capacity on stream through the decade. The renewable targets for the Commonwealth are 40% by 2030 and 80% by 2050.
As we reported earlier in this chapter, Massachusetts is one of seven states participating in the $3.62 billion Northeast Regional Clean Hydrogen Hub project that is seeking $1.25 billion of DOE funding. The other partner states are New York, New Jersey, Maine, Rhode Island, Connecticut and Vermont.
Although there is potential demand for zeroemission solutions for the 39 towboats and tugboats registered in Massachusetts, the real opportunity appears to be for the ferry segment.
Returning to the theme addressed in the last section of Chapter 6, there are 4,400 In Service harbor craft in the U.S. that are identified as most suited for zero-emission operations.
Three quarters of the 4,405 In Service harbor craft are active in ten states, nine of which are reviewed in this chapter and the next. The only state reviewed in this chapter that is not addressed in Exhibit 85 is Massachusetts, which has been replaced by Kentucky. Exhibit 85
In this section, we drill down to vessels that have a homeport in California.As such,wedonot address vessels registered in other states that trade in Californian waters and need to meet the reporting requirements of the state. However, our datasets have been supplemented by data from the Air Resources Board.
Whereas California does have comparatively small inland waterway and offshore oil & gas segments, the state is home to large international ports and large fishing and ferry/excursion segments.
Exhibit 86 presents an overview of the 676 vessels with a registered home port in California by type and status
Source:IntelatusGlobalPartners
According to the latest EIA data, two thirds of net electricity generation in California is from renewable, hydroelectric and nuclear sources. Further, the state has a Renewable Portfolio Standards of 100% renewable power by 2045.
The Port of Long Beach and the Port of Los Angeles have submitted a joint proposal for federal funding to demonstrate the benefits of using hydrogen to power trucks and terminal equipment under the DOE’s $7-8 billion regional clean hydrogen hub program.
One can only assumethat if successful, expansion of the capabilities will only benefit the adoption of the HyZET concept and potentially support the transition to zero-emission operations of over 370 ferries, pilot boats, towboats and tugboats with a total power output of over 600 kW
The average age of the California registered harbor craft fleet is 38 years old.
We will now dive into each of the eight segments where vessels have a registered home port in California.
California’s Commercial Harbor Craft Regulation amendments drive the potential eventual upgrade or replacement of a high proportion of the 46 crew and supply vessels with a home port in California. However, commercial drivers and technical challenges associated with the smaller vessels in thesegmentarelikelytopresent abarriertovessel upgrades in the near term.
The crew and supply segment of California registered vessels numbers 46 vessels, of which 87% are 25 years or older.
74% of the segment is confirmed as In Service and a further 13% have an Unknown operational status
72% of California’s registered crew and supply vessels are 65 feet or more in length, indicating a requirement to be equipped with an AIS Class A device that allows activity to be monitored. This infers that the vessels with an Unknown operational status are either trading outside of AIS range or are laid-up in place.
The crew and supply segment is concentrated below 150 feet in length, and the average length for the category is 91 feet. It should be noted that our analysis excludes one vessel from our database, picked up from CALSTART data, which we understand may have been moved from California to a demolition yard after the cut-off off date for data collection.
Exhibit 89 Crew and Supply Vessels by Length and Breadth
Source:IntelatusGlobalPartners
Vessels in this segment are generally small when measured by gross tons, with a category average of 274 tons.
Exhibit 90 Crew and Supply Vessels by Length and GT
Source:IntelatusGlobalPartners
The average horsepower of vessels in the segment is slightly above 1,900.
Exhibit 91 Crew and Supply Vessels by Length and Horsepower
Source:IntelatusGlobalPartners
As we discussed earlier in this report, federal Tier 4 emission regulations for Category 1 vessels apply
to new engines with a power output of 600 kW or 800 hp and above.
We have individual engine output for 51 out of the 66 crew and supply vessels in this segment. The average vessel has an average engine size of 769 horsepower. 40 (78%) of theidentified vesselshave individual engines of 800 horsepower or generally below federal Tier 4 requirements.
Exhibit 92 Crew and Supply Vessels by Horsepower
2,000
Total Installed Horsepower Indivudual Engine (horsepower)
1,500
1,000
2,500 - 2,000 4,000 6,000 8,000
Source:IntelatusGlobalPartners
However, California’s Commercial Harbor Craft Regulation amendments promote zero-emission options where feasible and Tier 3 (mainly limited to the commercial fishing and new excursion vessels) and Tier 4 engines with diesel particulate filters on all other vessels.
As a result, there is opportunity for existing older vessels to be eventually replaced by lower or zeroemission replacements.
cruises) have specific emission compliance requirements:
• Short run ferries, including those with a single voyage of less than three nautical miles will be required tobe fully-zero-emission by the end of 2025.
• New excursion vessels are required to be able to operate with a minimum of 30% zeroemission power source.
Likethecrewand supplysegment,the 175 ferryand excursion vessel segment features a high proportion (70%) of vessels of 25 years and older.
Close to 60% of the vessels in this category are confirmed In Service, and a further 36% have an Unknown Status. Given than the USCG allows vessels to be equipped with AIS Class B systems if they are carrying less than 150 passengers and operating below 14 knots, the high proportion of vessels with an Unknown operational status may be active but simply do not need to feature a system that allows for activity analysis.
Exhibit 93 California Harbor Craft by Age Group and Status
Ferry and Excursion Vessels by Status and Age Group
120
100
80
60
40
20
Crew and Supply BoatsHorsepower 0
140 0-5 6-10 11-15 16-20 20-25 ≥25
Under California’s revised harborcraft regulations, short run ferries and new excursion vessels (such as those used for whale watching and dinner
Vessels Age Group (years)
In Service Unknown Laid Up & Inactive
Theaveragelength of ferriesand excursion vessels is around 89 feet.
Exhibit 94 Ferry and Excursion Vessels by Length and Breadth
Source:IntelatusGlobalPartners
Vessels in this category average 106 gross tons.
Exhibit 95 Ferry and Excursion Vessels by Length and GT
Source:IntelatusGlobalPartners
168 out of 175 crew and supply boats are 100 gross tonsorless.Thereare seven largerboats,including dinner cruise vessels, included in this category.
The average vessel has an average engine size of 2,030 horsepower.
Exhibit 96 Ferry and Excursion Vessels by Length and Horsepower
Source:IntelatusGlobalPartners
We have individual engine output for 118 out of the 175 ferry and excursion vessels in this segment. 67 (57%) of the identified vessels have individual engines of 800 and below horsepower and generally fall below federal Tier 4 requirements.
Despite this, and based on amended CARB regulations, this segment presents an opportunity for zero-emission technologies.
Thereare171registeredfishingvesselsinCalifornia of 600 kW and above.
89% of these vessels are 25 years or older.
The U.S. Coast Guard allows all commercial fishing vessels to operate with a Class B system and therefore these vessels are less easy to track include. That said, 29% of the registered fishing vessels produce AIS signals that allow us to confirm their status as In Service.
It is anticipated that many of the 117 vessels with an Unknown operational status do not feature an AIS Class A system that facilitated tracking.
The operational patterns of commercial fishing vessels often make these less suited to zeroemission operations.
CARB also recognizes some of the compliance challenges for the fishing sector with the revised harbor craft regulations and, if vessels are equipped with a Tier 3 engine by the end of 2024, may grant a one-timeten-yearextension optionfor compliance to 2035.
Exhibit 98 Fishing Vessels by Age Group and Status
Source:IntelatusGlobalPartners
The average length of fishing vessels registered in California is relatively short at 59 feet.
Exhibit 99 Fishing Vessels by Length and Breadth
The fleet average gross tonnage is 72 gross tons.
Exhibit 100 Fishing Vessels by Length and GT
Source:IntelatusGlobalPartners
The average fishing vessel horsepower is around 1,132
Exhibit 101 Fishing Vessels by Length and Horsepower
We have individual engine output for 142 out of the 171 fishing vessels in this segment. 124 (87%) of the identified vessels have individual engines of 800 horsepower.
Exhibit 102 Fishing Vessels by Horsepower
Source:IntelatusGlobalPartners
Source:IntelatusGlobalPartners
The are just nine pilot vessels registered in California with a total installed power of 600 kW or more.
Five of the vessels are operated by San Francisco Bar Pilots, whose operations cover San Francisco and Monterey Bays, which includes the ports of San Francisco, Oakland, Richmond, Benicia, Redwood City, Stockton and Sacramento.
TocomplywiththeCARB’s emission requirements, San FranciscoBarPilotsand Glostenaredesigning new pilot boats, the first two of which are planned to be in service in 2024 and a third in 2025.
TheotherfourpilotvesselsareoperatedbythePort of Los Angeles.
The pilot boat segment has a comparatively young age profile when compared to crew and supply,
ferry and excursion and fishing vessels. Only 44% are 25 years of age and older.
56% are confirmed In Service with the remaining 44% classed as Unknown, indicating either no AIS Class A system or the vessels are laid up.
Exhibit 103 Pilot Vessels by Age Group and Status
Exhibit 104 Pilot Vessels by Length and Breadth
The average length of pilot boats registered in California is 72 feet.
Source:IntelatusGlobalPartners
The fleet average gross tonnage is 112 gross tons.
Exhibit 105 Pilot Vessels by Length and GT
Source:IntelatusGlobalPartners
The average pilot boat horsepower is around 1,593.
Exhibit 106 Pilot Vessels by Length and Horsepower
Source:IntelatusGlobalPartners
Exhibit 107 Pilot Vessels by Horsepower
vesselshaveindividualenginesof800horsepower or more. All vessels are equipped with two main engines.
The 96 towboats registered in California feature a number of oceangoing ATBs, many of which transport petroleum products and chemicals along the West Coast
All vessels in this segment are above 26 feet, indicating that they are required to be equipped with a Class A AIS system.
The proportion of confirmed In Service vessels is relatively high at 73% and the 17% of vessels with an Unknown status are likely either out of AIS range or laid up.
Like most of the other California segments that we review, a high proportion of tugboats are 25 years of age or older – two thirds.
Exhibit 108 Towboats and Pushboats by Age Group and Status
Towboats by Status and Age Group
Vessels
Source:IntelatusGlobalPartners
Wehaveindividualengineoutputforallofthepilot boats in this segment. Four of the identified
In Service Unknown
Idle Laid Up & Inactive
Source:IntelatusGlobalPartners
The average length of towboats registered in California is 81 feet.
Exhibit 109 Towboats by Length and Breadth
Source:IntelatusGlobalPartners
The fleet average gross tonnage is 193 gross tons.
Exhibit 110 Towboats by Length and GT
Source:IntelatusGlobalPartners
The average towboat horsepower is around 3,240.
Exhibit 111 Towboats by Length and Horsepower
Towboats - Length and
Source:IntelatusGlobalPartners
We have individual engine output for 71% of the vessels in this segment.
Slightly over 40% of the vessels in this category have individual engines of 800 horsepower or more.
Most vessels are equipped with two main engines.
Source:IntelatusGlobalPartners
Like towboats, nearly two thirds of the vessels in the 94-strong tugboat segment are 25 years of age or older.
As with the tugboats, all vessels in this segment are above 26 feet, indicating that they are required to be equipped with a Class A AIS system.
The proportion of confirmed In Service tugboats is relatively high at 69%, and the 13% of vessels with an Unknown status are likely either out of AIS range or laid up.
The 65 In Service tugboats, and particularly the 35 vessels of 25 years of age or older, are logically the best candidates for eventual upgrade to zeroemission operations or replacement by zeroemission tugs.
Exhibit 113 Tugboats by Age Group and Status
Tugboats by Status and age Group In Service
Source:IntelatusGlobalPartners
The average length of towboats registered in California is 91 feet.
Exhibit 114 Tugboats by Length and Breadth
Source:IntelatusGlobalPartners
The fleet average gross tonnage is 181 gross tons.
Exhibit 115 Tugboats by Length and GT
We have individual engine output for 73% of the vessels in this segment.
More than 88% of the vessels in this category have individual engines of 800 horsepower or more. Many tugboats are equipped with two main engines, although some feature just one engine.
Exhibit 117 Tugboats by Horsepower
Source:IntelatusGlobalPartners
The average towboat horsepower is around 3,879.
Exhibit 116 Tugboats by Length and Horsepower
Source:IntelatusGlobalPartners
Over 55% of the 70 registered Californian workboats are 25 years of age or older.
A relatively low figure of 37% of the workboats are confirmed to be In Service. The reason for 42 workboats having an Unknown operational status indicated either no AIS Class A system is fitted, or the vessels are laid up.
Source:IntelatusGlobalPartners
Exhibit 118 Workboats by Age Group and Status Source:IntelatusGlobalPartners
The average length of towboats registered in California is 94 feet.
Exhibit 119 Workboats by Length and Breadth
Source:IntelatusGlobalPartners
The segment average gross tonnage is 402 gross tons.
Exhibit 120 Workboats by Length and GT
Source:IntelatusGlobalPartners
The average towboat horsepower is around 1,748.
Exhibit 121 Workboats by Length and
Source:IntelatusGlobalPartners
We have individual engine output for 97% of the vessels in this segment.
Only 24% of the vessels in this category have individual engines of 800 horsepower or more. Most workboats are equipped with two main engines.
Exhibit 122 Workboats by Horsepower
Source:IntelatusGlobalPartners
73% of the Other harbor craft of 600 kW and above 25 years of age or older. Close to 50% are In Service. The eight harbor craft with an Unknown status are likely either out of AIS range,donot feature and AIS Class A system or are laid up.
Exhibit 123 Other Harbor Craft by Age Group and Status
Other Vessels by Status and Age Group
Source:IntelatusGlobalPartners
The average length of towboats registered in California is 285 feet.
Exhibit 124 Other Vessels by Length and Breadth
Other Vessels - Length and
Source:IntelatusGlobalPartners
The segment average gross tonnage is 7,212 gross tons, an average that is strongly influenced by the cargo vessels in the dataset.
Exhibit 125 Other Vessels by Length and GT
Other Vessels - Length and GT
We have individual engine output for a quarter of the vessels in this segment. All the engines for which we have data outputs of 800 horsepower or more.
Exhibit 127 Other by Horsepower
Other Vessels - Horsepower
Source:IntelatusGlobalPartners
The average towboat horsepower is around 3,928.
Exhibit 126 Other Vessels by Length and Horsepower
Source:IntelatusGlobalPartners
As we have established earlier in this chapter, there are 676 registered harbor craft in California.
Ofthesevessels,53%or360areInService,ofwhich two thirds are classed as Cat 1 vessels.
Source:IntelatusGlobalPartners
Exhibit 128 In Service Cat 1 California Harbor Craft
Source:IntelatusGlobalPartners
The 65 tugboats are the closest segment technically for the adoption of the HyZET technology.
As the towboat segment in California also features a number of oceangoing ATBs, this segment may prove less ready for the HyZET concept as, for example, towboats operating on the Mississippi River System.
The ferry and excursion vessels, especially those operating on the routine ferry routes, as well as pilot boats are generally well suited for zeroemission technologies, such as hydrogen and electricity. That said, some of the excursion vessels that venture further offshore may be less suited for short- and medium-term transition to hydrogen or fully electric technology.
We have performed an analysis on the CHC CARB Reported Vessel Dataxvii dated June 20, 2023, to
better understand the types of engines installed on harbor craft.
We note the following major differences between the CARB dataset and our own databases used in the main analysis of this report:
• Our database groups vessels by port and state of registry and not based on where they operate.
• The CARB dataset registers vessels active withing California’s waters.
• Our database examines vessels of 600 kW and above, whereas the CARD dataset also includes all vessels below 600 kW. Nearly all vessels are classed as “Active” which we infer to mean In Service.
As of June 2023, the CARD CHC vessel report included 1,379 individual engines, of which around half are below EPA Tier 3 compliance.
Exhibit 129 CARB CHC Engine Reporting
Source:IntelatusGlobalPartners
In Service Cat 1 Vessels
The CARB dataset includes 770 engines
Ferries and excursion vessels account for 405 main, auxiliary, harbor, pump and thruster engines.
53% of the engines in this segment are Tier 3 and just 1% are Tier 4, indicating significant potential for emissions’ reduction.
46% of the 26 engines reported for In Service pilot boats are Tier 3 compliant and there are not Tier 4 engines reported, which again confirms the potential for emissions’ reduction through zeroemission technologies.
–
The towboat segment reports the second largest number of recorded engines in California, after the ferry and excursion segment with 204 engines.
More than 50% of the recorded engines are below Tier3compliancelevels.Only 2% of theenginesare Tier 4.
Given that this segment differs from the towboats active in the eastern half of the country as many are ocean going ATBs,this segment may proveless readyfortheHyZETconcept.However,thepotential from emission reduction is evident.
Exhibit
There are 135 tugboat engines.
Two thirds of tugboat engines are Tier 3 or 4 compliant and once again the opportunity for transition to zero-emission technology is clear.
In all, there are 348 In Service Cat 2 vessel engines recorded in the CARB CHC dataset.
The Crew and Supply segment records no Tier 4 compliant engines. Exhibit
Two thirds of recorded workboat engines are below Tier 3 compliance.
Only 4% of workboat engines are Tier 4 compliant.
It is not surprising to see that a significant proportion of fishing vessels feature engines of Tier
We finish our analysis by looking at the vessels categorized as Other. Exhibit
This report aims to determine the size of the harbor craft sector in the United States and in California. This study found that there are approximately 10,000 harbor craft above 600 kWor 805 hp registered in theUnited Statesand 4,405 of these have been identified as highly suitable for zero-emission technology. These 4,405 vessels are ferries, pilot boats, towboats, and tugboats.
676 above 600 kW or 805 hp harbor craft are registeredinCaliforniawith244ofthesehavebeen identified as highly suitable for zero-emission technology.
Ranked in descending order from largest to smallest market, Louisiana, Alaska, California, Texas, Washington, New York, Florida, Missouri, Delaware, and Massachusetts are the top 10 states for harbor craft registrations. These ten states combined represent 73% of the U.S. harbor craft population. Louisiana alone accounts for a third of all U.S. harbor craft in our survey, reflecting the importance of the Mississippi River System and the Gulf of Mexico ports. Advances in adopting zero-emission technology in these states can have a major impact on transforming the harbor craft sector.
Zero-emission harbor craft deployments will not succeed without access to electrical charging and hydrogen production and distribution infrastructure. While the top ten states have high concentrations of harbor craft, the transition to zero-emission will not happen at scale until there is sufficient charging infrastructure and hydrogen supply. Current hydrogen production levels are not sufficient to serve these vessels. Since marine vessels consume large amounts of energy, both electricity and hydrogen (and hydrogen-based energy carrier) production will need to increase to meet the future demand from these vessels.
Well-to-wake emissions are important when discussing zero-emission vessels. Vessels powered by electricity or hydrogen-based fuels can be zero-emission on a tank-to-wake basis but not zero-emission on a well-to-tank basis. Expanding the production of low or zero carbon sources of electricity and hydrogen is vital to low and zeroemission vessels, reducing greenhouse gas emissions and getting the most environmental benefit from this technology.
The global, national, and local regulatory and certification environment needs to mature further to support the wider adoption of hydrogen as a marine fuel.
Based on our conclusions, we recommend the following future areas of research:
• A follow-up report to assess the potential for the zero-emission technology in both the UnitedStatesandspecificallywithinCalifornia for harbor craft of below 600 kW or 805 hp
• A road map addressing the development of certified zero-emission electricity and hydrogen-based fuel production and distributioninfrastructuretosupportthewider uptake of zero-emission technology in,at least, Cat 1 vessels in California.
• A technical and commercial assessment of the benefits of extending zero-emission requirements to Cat 2 and Cat 3 vessels in California.
• Market research to identify specific ports throughouttheUnitedStatesthat arewillingto invest in the HyZET tug concept.
Source:IntelatusGlobalPartnersinterpretationofoutputfromtheFAF5SummaryStatisticsproducedbytheNational TransportationResearchCenter,OakRidgeNationalLaboratory
Long Beach 79.2
Los Angeles 59.5
Richmond 21.1
Oakland 19.4
Stockton 4.6
San Francisco 2.2
Petroleum coke, wastepaper, chemicals, scrap metal
Wastepaper, animal feeds, scrap metal, fabric, soybeans
Vegetable oils, scrap metal, coke, coal
Fruits and nuts, meats, machinery, wine and spirits
Crude oil, electronics, plastics, furniture
Furniture, clothing, automobile parts, electronic products
Autos, petroleum, minerals, vegetable oils
Machinery, electronics, furniture, plastics
Iron ore, sulfur, coal, wheat, rice Liquid fertilizer, molasses, bulk fertilizer, cement
Tallow, vegetable oil
Redwood City 1.9 Iron Scrap
Hueneme 1.8
San Diego 1.5
West Sacramento 1.2
Humboldt
Steel products, boats, wind turbines, aggregate
Aggregates, sand, gypsum
Autos, produce, general cargo Autos, produce, liquid fertilizer, bulk liquid
Machinery, metals, autos, heavy equipment
Agricultural and industrial products
Vehicles, perishables, construction materials, heavy equipment
Agricultural and industrial products
Bay Unknown Logs, wood chips Logs, petroleum, wood chips
Benicia Unknown Petroleum coke Automobiles
Source:IntelatusGlobalPartnersinterpretationofdatafromtheCaliforniaLegislativeOffice
Source:IntelatusGlobalPartnersinterpretationofoutputfromtheFAF5SummaryStatisticsproducedbytheNational TransportationResearchCenter,OakRidgeNationalLaboratory
i Fourth IMO Greenhouse Gas Studyhttps://wwwcdn.imo.org/localresources/en/OurWork/Environment/Documents/Fourth%20IMO%20GHG%20 Study%202020%20-%20Full%20report%20and%20annexes.pdf
ii Sustainability Whitepaper, Hydrogen as a Marine Fuel, June 2021, ABShttps://absinfo.eagle.org/acton/attachment/16130/f-bd25832f-8a70-4cc9-b75f-3aadf5d5f259/1/-/-/-//hydrogen-as-marine-fuel-whitepaper-21111.pdf
iii Global Hydrogen Market – Certification to Enable Trade, 2023, IRENA and RMI Colorado - https://mccd8320d4-36a1-40ac-83cc-3389-cdn-endpoint.azureedge.net//media/Files/IRENA/Agency/Publication/2023/Jan/IRENA_Creating_a_global_hydrogen_market_2023.p df?rev=cad6962f55454a46af87dec5f2e6c6e8
iv Global Hydrogen Review 2022, September 2022, IEA - https://iea.blob.core.windows.net/assets/c5bc75b19e4d-460d-9056-6e8e626a11c4/GlobalHydrogenReview2022.pdf
v U.S. National Clean Hydrogen Strategy and Roadmap, June 2023https://www.hydrogen.energy.gov/pdfs/us-national-clean-hydrogen-strategy-roadmap.pdf
vi SF Waterfront Maritime Hydrogen Demonstration Project, June 2022, Pal –https://www.hydrogen.energy.gov/pdfs/review22/ta045_pal_2022_o.pdf
vii SANDIA REPORT SAND2017-5751, May 2017, Pratt and Chanhttps://www.maritime.dot.gov/sites/marad.dot.gov/files/docs/innovation/meta/9846/sandia-fuel-cellreport-2.pdf
viii SANDIA REPORT SAND2016-9719, September 2016, Pratt and Klebanoffhttps://www.maritime.dot.gov/sites/marad.dot.gov/files/docs/innovation/meta/9841/sf-breeze-ferryfeasibility-study-report-sandia-national-laboratory-2.pdf
ix SANDIA REPORT SAND2016-9719, September 2020, Klebanoff, Madsen, Conard, Caughlan, Leach, Applegate Jr. - https://www.maritime.dot.gov/sites/marad.dot.gov/files/202107/Final%20Report%20Study%20of%20Replacing%20the%20Robert%20Gordon%20Sproul%20with%20a%20 Hybrid%20Vessel%20Employing%20Zero-emission%20Propulsion%20Technology.pdf
x Integrated Flow-way Fuel Cell Report (2018): https://www.maritime.dot.gov/innovation/meta/integratedalgal-flow-way-digester-and-fuel-cell-demonstration-project-0, and https://www.maritime.dot.gov/sites/marad.dot.gov/files/202006/maradalgaetoenergysummaryreport200520.pdf
xi Hydrogen Gas Dispersion Studies for a Fuel Cell Vessel, January 2022, Blaylock, Gitushi and Klebanoffhttps://www.maritime.dot.gov/sites/marad.dot.gov/files/202202/Final%20Version%20of%20Gas%20Dispersion%20Final%20Report.pdf
xii South Coast Air Quality Management District Technology Assessment: Commercial Harbor Craft (2015)Technology Assessment: Commercial Harbor Craft (ca.gov)
xiii Evaluation of the Feasibility and Costs of Installing Tier 4 Engines and Retrofit Exhaust Aftertreatment on In-Use Commercial Harbor Craft Report prepared for the California Air Resources Board by: Keir Moorhead
Ryan Storz Dinesh Pinisetty Of the California State University Maritime Academy September 30, 2019https://ww2.arb.ca.gov/sites/default/files/2019-10/cmafeasibilityreport09302019.pdf
xiv Waterborne Tonnage for Principal U.S. Ports and all 50 States and U.S. Territories. Waterborne Tonnages for Domestic, Foreign, Imports, Exports and Intra- State waterborne traffic, U.S. Army Corps of Engineershttps://usace.contentdm.oclc.org/digital/collection/p16021coll2/id/1474
xv Transportation Statistics Annual Report 2022. Created by Hu, Patricia; Schmitt, Rolf R.; Robinson, Ramond; Nguyen, Long; Moore, William H.; Baunee, Aaron; Culotta, Kalle; Hocevar, Hannah; Kimmel, Sari; and Mikki; Wingfield, Alpha of the United States. Department of Transportation. Bureau of Transportation Statistics. Contributor(s): Bronzini, Michael; Fang, Bingsong; Firestine, Theresa; Fletcher, Wendell; Fuller, John; Greene, David; Paul; Pisarski, Alan; Polzin, Steve; Rick, Christopher; and Sedor, Joanne. Published Date 2022-12-01. https://doi.org/10.21949/1528354
xvi FAF Summary Statistics, Oakridge National Laboratory’s Freight Analysis Framework, produced for a partnership between BTS and the Federal Highway Administrationhttps://faf.ornl.gov/faf5/SummaryTable.aspx
xvii CHC CARD Reported Vessel Data (June 20, 2023 - https://ww2.arb.ca.gov/ourwork/programs/commercial-harbor-craft/chc-vessel-and-engine-data-reported-carb