Survey on Internationally Trained Professionals


Like many states nationwide, Utah faces talent shortages, from essential workers in food and hospitality to highly skilled professionals in education, healthcare, and manufacturing. According to the U.S. Chamber of Commerce, there are even fewer available workers today than in 2020, with only 44 available workers for every 100 jobs in Utah1. Along with many states in the U.S., Utah faces challenges from changing demographics with an aging population and lower fertility rates, which will create even further gaps in the workforce shortage for years to come. Immigrants, or New Americans, are vital to sustaining Utah’s fast-growing and robust economy.2
Utah is home to over 278,000 New Americans, or foreignborn individuals, including immigrants, refugees and other members of the international community, equivalent to 8.4% of the population3. In the United States, immigrants are more likely to be working-age than their counterparts born in the U.S. This means they are more likely to be active in the labor force, allowing them to contribute to the economy. In 2019, they accounted for 11% of the workforce in Utah4. However, many New Americans are underemployed; for example 43.6% of college-educated immigrants worked jobs that didn’t require a bachelor’s degree5. New Americans are key to closing this gap in Utah’s workforce and there are opportunities for us to bridge barriers to obtaining employment in sectors related to their education and experience.
This report is the product of the New Americans Task Force, an initiative of the Governor’s Office of Economic Opportunity in partnership with the Center for Economic Opportunity and Belonging. The New Americans Task Force convenes statewide stakeholders representing nonprofits, businesses, industry associations, state and local government, faith-based communities, and individuals to provide input and recommend immigrant integration and belonging opportunities, emphasizing workforce and economic opportunities for all. In early 2023, the New Americans Task Force produced a report where
recommendations to conduct this survey were highlighted to help identify the education, skills, and experience internationally trained professionals bring to the U.S. and the barriers they may face when seeking professional licenses in Utah and returning to work in their sectors.6
Thank you to the Department of Commerce for its partnership and collaboration with the survey, World Education Services in designing the survey, and the numerous community-based organizations for supporting the dissemination of the survey, resulting in an incredible response.

Ze Min Xao
President & CEO of The Center for Economic Opportunity & Belonging zxiao@belonginutah.org
Natalie El-Deiry
Director of Immigration & New American Integration natlieeldeiry@utah.gov
1 Makinizi Hoover, Stephanie Ferguson, & Isabella Lucy, “Understanding Utah’s Labor Market,” U.S. Chamber of Commerce, November 1, 2023, https://www.uschamber.com/workforce/ understanding-utah-labor-market.
2 Justis Antonioli & Jack Malde, “The Demographic Transition: An Overview of America’s Aging Population and Immigration’s Mediating Role,” Bipartisan Policy Center, September 2023, https:// bipartisanpolicy.org/wp-content/uploads/2023/09/BPC_LIT-Review.pdf.
3 “Immigrants in Utah,” American Immigration Council, 2023, https://map.americanimmigrationcouncil.org/locations/utah/#.
4 “Immigrants in Utah,” American Immigration Council.
5 “New Americans in Utah,” American Immigration Council, May 2022, https://www.americanimmigrationcouncil.org/sites/default/files/research/new_americans_in_utah.pdf.
6 “New American Task Force Progress Report & Recommendations,” Utah’s Governor’s Office of Economic Opportunity, January 20, 2023, https://issuu.com/go-utah/docs/new_american_task_ force_recommendations.
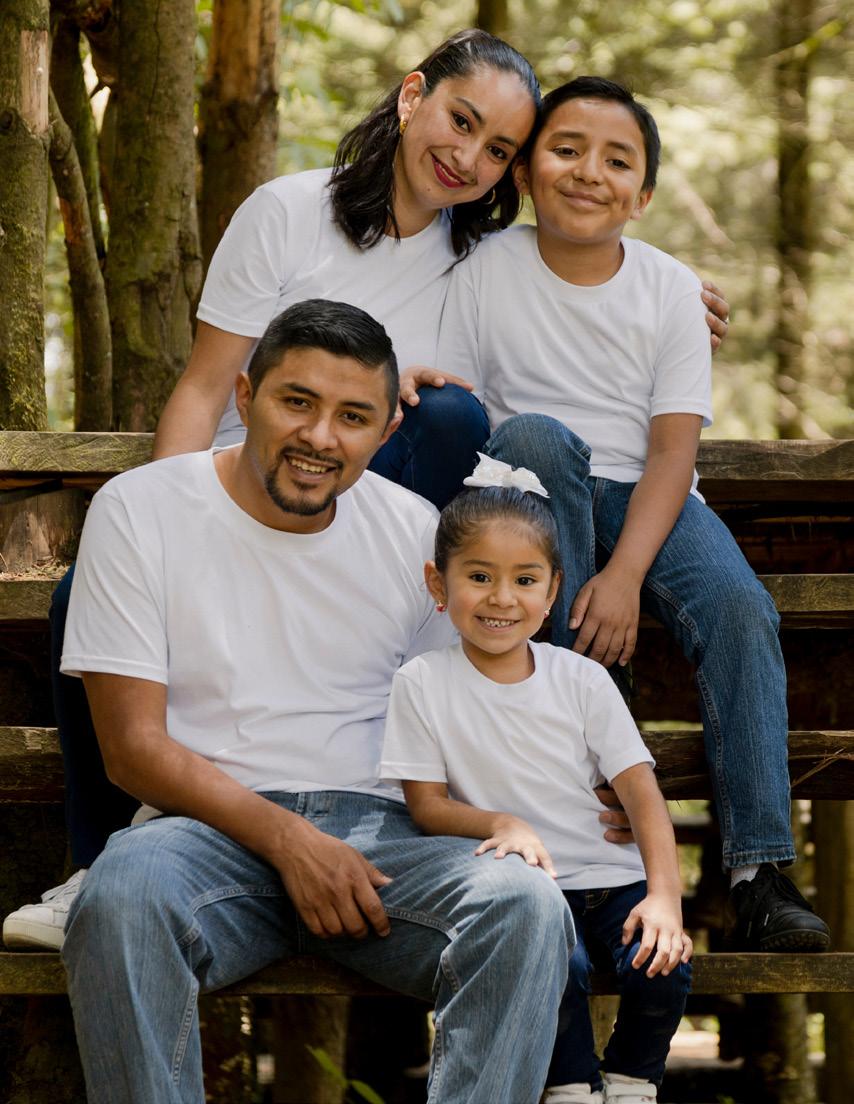
New Americans, or any foreign-born individual, arrive in Utah for various reasons, such as refugees fleeing conflict, families reuniting after years of separation, parents seeking a better life for their children, students pursuing their education, or workers seeking to fill an occupation or profession.
This executive summary provides an overview of the key findings from a survey disseminated to New Americans residing in Utah; however, respondents represented those in Utah and in other locations. The purpose of the survey was to explore the experiences of these individuals regarding their education, their professional licenses or credentials, and the barriers to getting back to work in their sectors. The sample comprised 6,051 respondents who identified as New Americans. Most respondents (70%) held or had a license to practice their occupation or profession outside the United States. On average, respondents had 11 years of experience in their profession, predominantly obtained in their country of origin.
While respondents demonstrated high levels of education, many were not working in their field of expertise due to language or licensing barriers. Only 35% of respondents were currently employed full-time. Interestingly, only 2% of respondents had applied for a license specifically in Utah. Among those who applied, 32% needed clarification on the status of their application, 29% were still waiting for a response, and 9% had received a denial. A significant proportion (26%) had successfully obtained their license, while a small percentage (3%) withdrew their application.
Language barriers posed a significant administrative barrier for 59% of respondents, ranging from applications not being available in their native language to a confusing application process. Additionally, 31% of respondents were required to demonstrate English proficiency, with 41% failing the test. Of all respondents, 46% identified language as a barrier to obtaining an occupational license in Utah. Miscommunication between licensing agencies and individuals is another barrier identified. Respondents who faced a denial for their application (22%) often did not receive a reason for the denial. The need for more transparency in denial reasons further exacerbates the difficulties faced.
Overall, the findings suggest that New Americans in Utah face significant challenges in obtaining occupational licenses. Language barriers, lack of clarity in the application process, and limited access to application materials in their native language contribute to these challenges. The lack of transparency in denial reasons further exacerbates the difficulties faced by these individuals. To ensure that the talents and expertise of New Americans are fully utilized, it is crucial to address and overcome these barriers through targeted support measures, building networks with industry and business for talent pathways, and improved access to language resources.
“We need to be more open to look at the skill sets that immigrants bring with them instead of creating more barriers.”
-
Survey Response 312
Since the survey was administered, Utah has implemented S.B. 43 and S.B. 35 to help foreign-trained professionals obtain a license as qualified professionals with international training or education issued by the Utah Division of Professional Licensing and other state agencies. The state of Utah’s Department of Commerce has made significant efforts to build pathways for internationally trained professionals needing a license to practice their profession in Utah. As this work continues to grow in understanding and addressing the barriers internationally trained professionals face and creating more accessible pathways for workers to apply their education and experience to Utah’s most in-demand sectors, it will strengthen Utah’s workforce and economy while building communities that value the contributions of New Americans in Utah.


The survey was designed in collaboration with World Education Services, an international credential evaluation service organization, and the Utah Department of Commerce to gather responses from Utah’s internationally trained professionals to inform the assistance and resources needed to assist those with a desire to return to their professions the ability to do so. The survey consisted of 36 close-ended questions and seven open-ended questions (plus additional open-ended options in some of the close-ended questions) available to respondents on Qualtrics in Spanish and English. Over 73% of responses were in Spanish. The survey was disseminated through various stakeholders, including the New Americans Task Force members, community-based organizations, industry and business partners, and through social and earned media shared through state and local networks. While the initial response period was slated for two weeks, to get a better response rate, the survey was open for 18 weeks.
THE
• The occupational licenses of sought by internationally trained professionals sought
• The barriers internationally trained professionals faced in Utah when applying for occupational or professional licenses
• The general basic demographics of internationally trained professionals
• Feedback on the policies and resources provided by the state of Utah
The survey also aimed to identify partnerships and investment opportunities in the public and private sectors. The following section summarizes the qualitative data points. The survey acquired 6,051 qualitative responses. This report includes selected qualitative responses highlighting internationally trained professionals' sentiments and desire to put their skills and talents to work.
Respondents to this survey come from 49 different countries with current residences in 47 states, plus Washington D.C. and Puerto Rico. Half the respondents currently live in Utah, with 41% originating from Venezuela and 17% from Columbia. Many respondents also live in Florida (20%), and additional respondents in Mexico (9%), Cuba (8%), and Ecuador (5%). Of the non-Spanish-
speaking countries, the survey received responses from individuals originating in China (0.5%). Over the past several years, Utah has seen an increase in immigrants from Venezuela, Colombia, and other Latin American nations, which has largely been reflected in the countries of origin for those who participated in the survey.

Nearly half the respondents have lived in the U.S. for less than one year, and 84% have lived in the U.S. for less than five years. About one-third are younger than 34 years old, and overall 87% are considered of prime working age. The gender of respondents was roughly evenly split between men and women.
Respondents of all immigration statuses are represented in this study, with many who are here permanently and many who are here temporarily, such as for work or school. The “Other” category consisted generally of a combination of all categories, including those with immigration filings in process and those without an authorized immigration status. Distinguishing individuals without authorized immigration status proved challenging when disaggregating this survey, as we lacked without the means to control for this specific demographic group.
“I work in a medical setting as MA (medical assistant) for one of the largest Hospital in Florida but would love to be able to relocate to Utah if I can get to work in the medical field once again given this huge opportunity you're offering. “
- Survey Respondent 199
Other
Temporary humanitarian status with work authorization (for example, Temporary Protected Status (TPS) or Humanitarian Parolees)
Prefer not to answer
Temporary humanitarian status without work authorization (for example, asylum applicants)
Permanent Resident or Green Card Holder
Refugee of asylum grantee
International Student
United States Citizen
Non-Immigrant status (for example, employment-based visa holders like H1-B, H-2 A/B or J-1)
(for example, spouse, child of a United States Citizen of permanent resident)
Dependent(for example, spouse or child of a non-immigrant visa holder like a temporary worker of international student)
Respondents are generally well-educated, with 82% holding at least a bachelor’s degree and 99% with a high school diploma or equivalent.
"In addition to my degree in Mechanical Engineering, I also have a certificate in automotive mechanics and a certificate in refrigeration systems. I am also doing a postgraduate degree in renewable energy and energy projects online in Spain." - Survey Respondent
“Health Science & Technologies” and “Engineering” comprise most respondents’ educational backgrounds. “Other” tended to be a combination of the other fields listed, such as “Architecture & Engineering,” or “Communications & Social Sciences.”
Field of employment outside the U.S. largely aligns with respondents' educational background, with “Health Services” and “Construction/Engineering” topping the list.
Employment titles outside the U.S. vary greatly. Some are very specific such as those in the health profession or engineering, while others are very general, such as business administrator or social service provider. The majority of similar titles include physicians, dentists, psychologists, and nurses.
"I am a petroleum administrator with 15 years of experience. In Venezuela I worked with American oil companies such as Weatherford and Hot Hed."
-
Survey Respondent 2049
Most respondents have significant work experience outside the U.S., with 50% having at least 10 years of experience. 70% of these individuals held a license in their occupation outside of the U.S.

Most respondents still need to complete education in the U.S., as most were already well-educated in their country of origin. 19% of respondents have completed a degree or certificate in the U.S., and 13% were currently enrolled in a U.S. educational institution at the time of the survey.
Of those respondents who have completed education in the U.S., the largest category (39%) were in a trade or other technical training.
Survey Respondent 61
"I am an Argentinian person with a technical degree but in Utah I am working in a bakery/bakery since I can't get a job in my field because my Argentinian license doesn't work here." -
Of those respondents who have completed education in the U.S. or are currently enrolled, most are in healthcare or engineering. Most of the “Other” category included more specific areas of healthcare, such as “dental hygienist,” “applied health,” or “nursing assistant,” or combinations of other fields on the list, such as “health and dental,” or “architecture and engineering”.
English & Foreign Languages
Health Sciences & Technology
Health Administration & Assisting Engineering Education Business
Social Sciences & Law
Repair, Production & Construction
Community, Family & Personal Services
Computer Science & Mathematics
Agriculture & Natural Resources Conservation
The largest employment category among respondents is “employed full-time” (35%). 43% of respondents are currently unemployed for many reasons, including lacking work authorization, looking for employment or they are currently in school or studying.
Employed full-time
Unable to work (no work authorization)
Awaiting employment authorization
Unemployed, looking for a job
Self-employed full-time
Unemployed, studying/training to advance career
Employed part-time
Self-employed part-time
Other
Full-time caregiving
Unemployed, not looking for a job or studying
Retired
Many respondents currently work in a field aligning with their field of work in their country of origin. The “Other” category includes other specific occupations like driver, server, or customer service.
Construction/Engineering/Architecture
Manufacturing
Transportation/Warehousing
Retail/Wholesale Trade
Education
Professional/Business Services
Information Systems/Tech
Financial Services
Arts, Entertainment, and Recreation
Utilities/Energy/Natural Resources
Public Administration
“I'm
a 28 years old medical doctor, graduated in Venezuela, with a good education and experience, working in the construction field because is the only good opportunity i have found. I'd love to practice medicine again, that's my passion. Thanks for trying to help us. “
- Survey Respondent 460
“I
got my MD (Medical Doctor) degree almost 11 years ago, I worked in multiple hospitals and clinics as a resident doctor for 6 years before coming to Utah. Now I have only dedicated myself to work in restaurants and I would love to resume my professional career”
- Survey Respondent 597

Only 8% of respondents held a license in a state other than Utah before coming to Utah, with most (59%) in Florida.
“I am a nurse graduated in El Salvador but I emigrated almost 7 years ago to the United States and the only license I could get was CNA but that is not an equivalent to everything I know according to my professional training abroad.”
- Survey Respondent

Only 2% of respondents have applied for a license in Utah. Of those who have applied, 61% either don’t know the current status of their application or are still waiting for a response.
I don’t know I am still waiting for a response I am now licensed to practice in Utah I was denied a license I withdrew my application
3%
Of those who received a denial to their application, most (55%) received the denial within 2 months of application, with some (11%) taking as long as 6-9 months. 78% received a reason for their denial, while 22% did not.
Most respondents were not required to take an English proficiency test, with 31% required. Of those who took the test, 41% passed it on their first try, and 58% passed it eventually. 47% of respondents were required to take other tests besides an English proficiency test.
Yes, on my first try
Yes, on my second try
Yes, after three or more tries No
Most respondents were not required to complete additional work experience or education in the U.S. to fulfill Utah licensing requirements but 25% had to acquire additional education, and 16% had to acquire additional work experience.


“Utah requires for nurses to work through CGFNS and this organization is expensive and complicated. Utah is one of the few states that required more to be licensed than other states, and the pathway gets complicated through CGFNS.”
- Survey Respondent 515
59% of respondents experienced an administrative barrier of some type, with application instructions needing to be available in their preferred language being the number one barrier (23%). Respondents who faced a language barrier comprised 46%, with the number one barrier being not having the option to take the exam in their native language (22%).
“I
would like to know how to apply for a license. I was searching about how to but it's difficult to find that information. I'm a doctor in the geriatrics field and want to know how this would work.”
- Survey Respondent
I did not encounter any administrative barriers
Applications and institutions were not available in my preferred language
The application process was confusing
Other
I experienced issues receiving customer support while completing the process
I was not able to pay the licensure fees and related expenses
I faced technological difficulties while applying for licensure (for example, issues with the licensing website)
I did not encounter any language barriers
I was not given the option to take a licensing exam in my native language or have an interpreter help me
Other
There were problems with the translation or interpretation services provided by the licensing authority
I did not understand the licensing requirements
I did not encounter any barriers related to application requirements
Other
My prior work experience and/or education were not accepted by the licensing board
I was not able to complete the additional education required for a license
I was not able to gain the work experience required when applying for licensure
I was unable to pass the required licensing exam
Beyond administrative and/or language barriers, 54% of respondents did not face any additional barriers.


“It
has been very difficult to get the information to have a license in my career. Also the process is very long. To get a license to practice here I have to translate my transcripts, then give an exam to prove that I have the skills to get the license. I also need a master degree to work in this state. It has been difficult, long and disappointing.”
- Survey Respondent 841
There are seven ideas that were selected by at least 36% of respondents as ways to help them get an occupational license. Number one is having access to training or coaching to help immigrants navigate the licensing process.
A training or coaching program that helps immigrants navigate the licensing process
More opportunities to gain required job experience in my field, for example through apprenticeship or residency programs
A specified office or staff role dedicated to helping immigrants navigate the process for getting a license
The ability to take my licensing exam in my native language or have an interpreter with me
English language classes or training for specific industries
More acceptance of training, education, and experience in other countries
A guide or handbook in my native language(s) that explains how to get a license
More translation or interpretation services provided by the licensing authority
Fee waivers, or not having to pay certain fees
Improvements to licensing website to enhance user experience
More ethnic or racial diversity among agency staff members
Other
Among the qualitative responses, additional insight into how the state can facilitate occupational licensing includes:
“Create a guide career wise to obtain occupational license according to your occupation and academic degrees.”
-Survey Respondent 278
“I wish there were offices with bilingual people who could advise us on the steps and process to obtain the license.”
-Survey Respondent 308
“The possibility to present the re-accreditation of my studies in my native language.”
-Survey Respondent 428
“More available information to know the process and affordable prices to get the license.”
-Survey Respondent 587
In conclusion, the report highlights the significant issue of language proficiency among internationally trained professionals, which serves as a barrier to accessing talent from New Americans during the licensing application process as well as other professional pathways. Many respondents are well-educated but need assistance to become proficient in English. Language continues to be a barrier to accessing talent and connections to industry for New Americans, specifically through the licensing application process. The top five recommendations provided by respondents to improve the licensing process in Utah are:
1. 54% of respondents suggested implementing a training or coaching program to assist immigrants in navigating the process
2. 50% of respondents suggested increasing opportunities for gaining necessary job experience
3. 48% of respondents suggested establishing a dedicated office or staff role to aid immigrants in the licensing process
4. 46% of respondents suggested allowing licensing exams to be taken in native languages or with the assistance of interpreters
5. 45% of respondents suggested providing English language classes for industry-specific training
These measures are crucial in facilitating the licensing process for internationally trained professionals and in tapping into the valuable talent pool of New Americans. Since the survey was administered, the Department of Commerce has increased staff capacity significantly, including a bilingual team to assist individuals who inquire for assistance with timely information on occupation licensing. The Utah Center for Immigration & Integration works with industry partners to build bridges between internationally trained professionals and the most in-demand sectors. While there is more work to be done to better integrate New Americans with education, experience, and credentials into Utah’s workforce, the data gathered from the survey for internationally trained professionals has been instrumental in guiding the state and other partners on how to maximize the talents of New Americans and the contributions they make to the fabric of our economy and communities.
“I would like to be able to develop better and help this country to move forward because we came here to progress but we cannot work without a work permit as immigrants.”
- Survey Respondent 248
“I would like to get a certification to be able to have a better job and better opportunities.”
- Survey Respondent 295
“I would like to see it if I can make my dream come true."
- Survey Respondent 412
“Having the opportunity to be recognized for my talents and my willingness to make this state a better place to live means a lot to me. I feel like a new North American and I love being recognized as well!”
- Survey Respondent 425
“It is excellent news to know that there is a consideration in UTAH to validate the professions studied by us immigrants. Thank you.”
- Survey Respondent 741
“I have never been able to apply for a job in my profession here in the United States, but this opportunity would be excellent to demonstrate the abilities we have as professionals and help the growth of this nation."
- Survey Respondent 860