BUFFALO BAYOU MASTER PLAN
EXISTING CONDITIONS AND CONCERNS The Master Plan s primary focus extends 10 miles, west to east, along the course of Buffalo Bayou, reaching from Shepherd Drive to the Turning Basin. The corridor stretches approximately one half-mile into each north and south bank, and includes a number of existing neighborhoods.
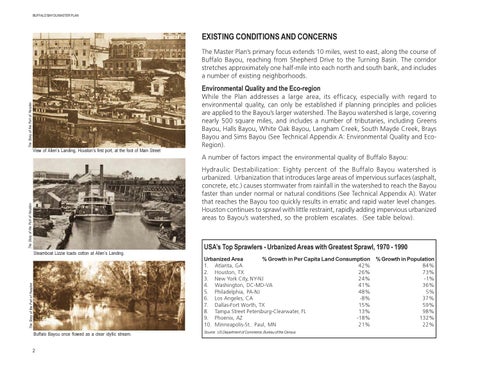
View of Allen s Landing, Houston s first port, at the foot of Main Street
While the Plan addresses a large area, its efficacy, especially with regard to environmental quality, can only be established if planning principles and policies are applied to the Bayou s larger watershed. The Bayou watershed is large, covering nearly 500 square miles, and includes a number of tributaries, including Greens Bayou, Halls Bayou, White Oak Bayou, Langham Creek, South Mayde Creek, Brays Bayou and Sims Bayou (See Technical Appendix A: Environmental Quality and EcoRegion). A number of factors impact the environmental quality of Buffalo Bayou: Hydraulic Destabilization: Eighty percent of the Buffalo Bayou watershed is urbanized. Urbanization that introduces large areas of impervious surfaces (asphalt, concrete, etc.) causes stormwater from rainfall in the watershed to reach the Bayou faster than under normal or natural conditions (See Technical Appendix A). Water that reaches the Bayou too quickly results in erratic and rapid water level changes. Houston continues to sprawl with little restraint, rapidly adding impervious urbanized areas to Bayou s watershed, so the problem escalates. (See table below).
The Story of the Port of Houston
The Story of the Port of Houston
Environmental Quality and the Eco-region
The Story of the Port of Houston
Steamboat Lizzie loads cotton at Allen s Landing.
Buffalo Bayou once flowed as a clear idyllic stream. 2
USA s Top Sprawlers - Urbanized Areas with Greatest Sprawl, 1970 - 1990 Urbanized Area % Growth in Per Capita Land Consumption % Growth in Population 1. Atlanta, GA 42% 84% 2. Houston, TX 26% 73% 3. New York City, NY-NJ 24% -1% 4. Washington, DC-MD-VA 41% 36% 5. Philadelphia, PA-NJ 48% 5% 6. Los Angeles, CA -8% 37% 7. Dallas-Fort Worth, TX 15% 59% 8. Tampa Street Petersburg-Clearwater, FL 13% 98% 9. Phoenix, AZ -18% 132% 10. Minneapolis-St.. Paul, MN 21% 22% Source: US Department of Commerce, Bureau of the Census