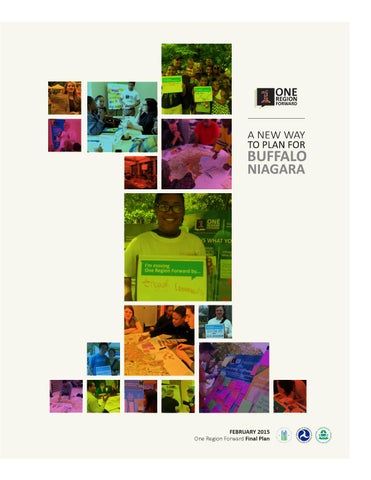
One Region Forward: A New Way to Plan for Buffalo Niagara - Final Plan

Page 1

FEBRUARY 2015 One Region Forward Final Plan


A NEW WAY TO PLAN

The parties that shaped this plan do not, individually, have the power and authority to direct actions beyond their distinct borders or missions. With that in mind, this document is designed as a tool to measure progress against shared community values and recognizes that there are multiple approaches to achieve the regional performance to which we aspire.

The work that provided the basis for this publication was supported by a U.S. Department of Housing and Urban Development (HUD) Sustainable Communities Regional Planning Grant. The author and publisher are solely responsible for the accuracy of the statements and interpretations contained in the publication. Such interpretations do not necessarily reflect the views of the Federal Government.

2

One Region Forward: A New Way to Plan for Buffalo Niagara


Support for this effort was provided by a $2 million grant from the Federal Department of Housing and Urban Development through its Partnership for Sustainable Communities, an interagency collaboration also involving the Federal Department of Transportation and the Environmental Protection Agency. This document will help the region coordinate how it invests federal, state and local dollars and will give Buffalo Niagara priority status for funding opportunities today and into the future. One Region Forward Steering Committee A cross-sectional partnership of public, private, and nonprofit organizations providing project oversight throughout the 3-year planning and engagement process. Greater Buffalo-Niagara Regional Transportation Council (GBNRTC), Niagara Frontier Transportation Authority (NFTA), New York State Department of Transportation (NYSDOT), Erie County, Niagara County, City of Buffalo, City of Niagara Falls, Association of Erie County Governments, Niagara County Supervisors Association, University at Buffalo Regional Institute and Urban Design Project (UBRI/UDP), Daemen College Center for Sustainable Communities and Civic Engagement (CSCCE), VOICE Buffalo, Local Initiatives Support Corporation Buffalo (LISC), Western New York Environmental Alliance (WNYEA), Buffalo Niagara Riverkeeper, The John R. Oishei Foundation, Buffalo Niagara Medical Campus (BNMC), Belmont Housing Resources for WNY, Inc. (Belmont), Buffalo Niagara Partnership (BNP), Empire State Development, New York State Department of State, Division of Smart Growth, and Niagara Falls Housing Authority.

Project leadership providing program administration, management, and governance oversight. Greater Buffalo-Niagara Regional Transportation Council Project leadership providing program administration, management, and governance oversight.

ISBN-10: 1-931612-26-9 ISBN-13: 978-1-931612-26-5

Niagara Frontier Transportation Authority Fiscal administrator ensuring project meets the fiscal and administrative requirements of the Sustainable Communities Regional Planning program.

School of Architecture and Planning, University at Buffalo Regional Sustainability Team conducting the research, planning, community engagement, writing and technical analysis for One Region Forward.

Buffalo Niagara Partnership Overseeing private sector engagement programming to bring business stakeholders into the planning process.

Recommended Citation: University at Buffalo Regional Institute, State University of New York at Buffalo, School of Architecture and Planning. 2014. “One Region Forward: A New Way to Plan for Buffalo Niagara.�

One Region Forward: A New Way to Plan for Buffalo Niagara

3


A NEW WAY TO PLAN

Additional Resources and Documents The Work So Far & The Work Ahead First Draft Report for One Region Forward Released in July 2014 for public feedback and input, “The Work So Far & The Work Ahead” was the first major public report of One Region Forward. The document details dozens of strategies and actions developed by our Working Team subject matter experts as well as other research and community engagement findings. While a building block for the final plan, this document also is a resource that includes greater contextual detail on One Region Forward and the region. Growing Together Food Access and Justice Strategy Document Growing Together offers further detail on recommended strategies and information regarding food access and food justice for Buffalo Niagara. It echoes community concerns over weaknesses in the region’s food system and seeks to make fresh food more equitably accessible, to ensure that sustainable food production remains a viable career, and to strengthen the connections between the region’s food producers and residents. The document was created by a team from the University at Buffalo School of Architecture and Planning’s Food Systems Planning and Healthy Communities Lab, led by Dr. Samina Raja. Resilient Buffalo Niagara Climate Change Strategy Document Resilient Buffalo Niagara is a research-driven strategy document that offers guidance on how the region can better prepare for the predictable -- and many unpredictable -- impacts of climate change here in Buffalo Niagara. It focuses on building community resilience to minimize losses from climatic changes, and at the same time support sustainable development of the region. Faculty and students from the University at Buffalo School of Architecture and Planning authored this document under the direction of Dr. Himanshu Grover. Complete Communities for a Changing Region Housing and Neighborhoods Strategy Document Complete Communities is a planning and policy document that provides greater detail on housing-related recommendations and outlines best practices to consider in Buffalo Niagara. The document embodies the principles of One Region Forward by fostering neighborhoods that are great places to live while providing housing choices for a changing population – choices that are affordable, accessible, well-served, energy efficient, and suited to the needs of a diversity of residents. The plan was created by UB Regional Institute in partnership with Make Communities, LLC.

4

One Region Forward: A New Way to Plan for Buffalo Niagara


Fair Housing Equity Assessment A team of equity stakeholders worked with One Region Forward to craft the Fair Housing Equity Assessment (FHEA), a document intended to advise how issues of equity and opportunity should be considered comprehensively in regional decision-making. The Fair Housing Equity Assessment examines the roots of Buffalo-Niagara’s racial, ethnic and geographic segregation and exclusion, obstacles to solving these issues, and strategies for overcoming these barriers through One Region Forward’s regional planning process. The research, analysis and community engagement around the FHEA have helped shape the focus of equity and opportunity that are woven through many of this plan’s implementation strategies. UB Regional Institute authored this document in partnership with Make Communities, LLC. 1RF Citizen Planning School Idea Summit Booklet One Region Forward and the UB School of Architecture and Planning celebrated the first year of the Citizen Planning School and the “Champions for Change” program at the Idea Summit on October 4, 2014. This booklet features the work of the “Champions for Change” and how these dedicated citizen planners are working to advance sustainable development in their own communities. The Idea Summit was a fun, celebratory event that featured the work of the first class of Citizen Planners and Champions for Change, explored what it means to translate ideas into action, and provided opportunities for community members to network with local experts, the citizen planners, funders and other attendees. THE DOLLARS & $ENSE OF DEVELOPMENT PATTERNS The Buffalo Niagara Regional Report Property taxes are the backbone of local government revenue. What we choose to build or allow to be built in our communities has a direct impact on our ability to repair roads, provide quality education, and pay our bills. This is a driving consideration for One Region Forward. To help understand how productive various forms of development in Buffalo Niagara are regarding tax production, the Buffalo Niagara Partnership invited Joe Minicozzi and Urban3 to perform this study for our region. It looks at the tax production and value per acre of various geographies – downtowns, village centers, shopping malls, main streets, suburban strip corridors, and others, to demonstrate that when land consumption is considered, sustainable forms of development are often the best bet for the local tax base and revenue stream. OneRegionForward.org One Region Forward is supported by an information rich, interactive website. A tool unto itself, the site documents and facilitates the broad base of community engagement and learning for the initiative, features best practices locally and from around the world, catalogs tools and resources for implementation, offers online mapping resources, and shows how citizens, communities, businesses, and others from across Buffalo Niagara are defining sustainability for the region.

One Region Forward: A New Way to Plan for Buffalo Niagara

5


A NEW WAY TO PLAN

What You’ll Find Inside This document represents the culmination of three years of research, community engagement, partnership building and planning under the banner of One Region Forward. Within the pages of this plan, you will find the major research findings of what the data tells us about where the region is today and expressions of thousands of citizen voices on the direction people in the region want to see Buffalo Niagara go. Proposed strategies and actions, built by a team of 100+ subject matter experts, are detailed and provide the basic framework for moving the region toward a more sustainable, resilient, prosperous and opportunity-rich future. Finally, the plan sets out a path to measure and guide implementation.

WHERE WE ARE MATTERS

8

WHERE WE’RE GOING ALREADY HAS TRACTION

16

BUILDING ON THE HISTORY OF PLANNING & BUILDING THE FUTURE OF PLANNING

18

WHAT DO WE SAY WE VALUE?

22

WHAT HAVE WE BEEN DOING?

23

Putting the region in context.

A preface.

The planning framework for One Region Forward.

Value statements culled from 160+ local plans.

Snapshot of trends over the past 40 years.

6

One Region Forward: A New Way to Plan for Buffalo Niagara


WHERE CAN WE GO FROM HERE?

24 WHAT COULD WE

WHAT COULD OUR REGION LOOK LIKE?

28

DO DIFFERENTLY?

Thinking about preservation and change.

52

Recommended strategies and actions.

Mapping the region with the Buffalo Niagara community.

HOW SHOULD WE MOVE FORWARD?

32

WHERE SHOULD WE GO FROM HERE?

34

HOW DO OUR CHOICES PLAY OUT?

36

HOW CAN WE MOVE OUR VALUES FORWARD?

108

HOW WILL WE KNOW WE’RE MAKING PROGRESS?

116

APPENDIX

126

Indicators to measure over time.

Moving the Network forward into implementation.

Major takeaways from community engagement.

Exploring alternative scenarios.

Measuring the likely impacts of development scenarios.

Data sources and other details.

One Region Forward: A New Way to Plan for Buffalo Niagara

7


A NEW WAY TO PLAN | WHERE ARE WE?

Located in Western New York, the Buffalo Niagara region—Erie and Niagara counties—constitutes 64 cities, towns and villages. The region is bounded on the south by Chautauqua, Cattaraugus and Allegany counties, and on the east by Orleans, Genesee and Wyoming counties.

8

One Region Forward: A New Way to Plan for Buffalo Niagara


The Buffalo Niagara region is defined by its unique geographic location. It lays at the confluence of two Great Lakes, linked by one of the wonders of the natural world, the Niagara River and Falls. It occupies a strategic position on the US-Canadian border and on the southern edge of a bi-national region of nearly 9 million people. Its geographic proximity to the Midwest and Northeast make it 500 miles from 41 percent of the US population. The region is also defined by its natural and human-made assets, its landscape and climate, its cultural heritage, and its people. International renowned Niagara Falls is undoubtedly the region’s most recognizable asset, but Buffalo Niagara is abundant in key resources such as incomparable art and architecture, a rich history as a center of manufacturing, prime agricultural land, and natural assets ideal for active and passive outdoor recreation. Diversity is embedded in who we are and where we’ve been. We see it in our many ethnic festivals, the influence of the Seneca Nation of Indians on our heritage and future, and in the important contributions our region has made to both the Abolitionist and Civil Rights movements. Great colleges and universities provide a foundation for a growing knowledge economy. The growth potential of key industry sectors such as advanced manufacturing, health and life sciences, and professional services has begun to stabilize the economy. Other livability indicators such as unique neighborhoods and affordability make the region an attractive place to run a business, start a career or raise a family. Woven throughout the planning framework are two critical issues that define where we’ve been and where we want to go – our relationship to our fresh water resources and our desire to grow our economy in a way that is more equitable and locally rooted. One Region Forward is not an economic development plan. Buffalo Niagara already has one in the “Strategy for Prosperity” created by the Western New York Regional Economic Development Council. Nor is it a plan to restore and protect our local waterways, as this is being addressed through local planning and clean-up efforts led by Buffalo Niagara Riverkeeper. But the plan for moving One Region Forward was developed with our economic sustainability and dependence on fresh water squarely in

One Region Forward: A New Way to Plan for Buffalo Niagara

9


A NEW WAY TO PLAN | WHERE ARE WE?

mind. It is intended to be a resource to guide the coordination of land use and transportation across the region in a way that supports our economic goals and the value water has to Buffalo Niagara. In other words, these issues – water and equity - are not addressed head-on throughout this plan; but rather they are embedded deeply in each of the five focus areas of One Region Forward—designed to always either directly or indirectly have a positive impact on these two issues. Shared prosperity and opportunity for all Our society is riven by increasing inequality – in opportunity and conditions – and thus, so too is our region. Of all the aforementioned great things our region has to offer, many in our region lack access to decent affordable housing, have limited options for getting around, inhabit environments that are unsafe or unhealthy, find it hard to find and purchase fresh, healthy food and lack access to quality health care, education and employment. This is not just a burden on them. The degradation and disuse of this precious human capital is a burden on everyone, not just because of the cost of maintaining an increasingly threadbare “social safety net,” but also because of the contribution to our commonwealth that they do not make. As we consider the future of our region, we must keep in mind that a more equitable society is in the self-interest of all and our decision making must reflect our aspirations for a more equitable and opportunity filled region. An economy that is forward looking and creates wealth locally Working to build community wealth is another promise we make to each other. Whether we are producing goods and services for sale, building the places where we will make a life, or raising the next generation of citizens, we owe it to each other to ensure that the fruits of our labor stay here. Growing local and buying local are fundamental values for our work. Creating jobs that stay here and growing wealth that stays here are also fundamental commitments that are woven throughout this plan. Water has shaped our past and will shape our future A great deal of North America’s fresh surface water flows past our region’s front door. Buffalo and Niagara Falls were settled because of the access to and abundance of fresh water. The Niagara River, its eleven major tributaries, and the Erie Canal have shaped the development and growth of our region for almost two centuries. Hydropower, a key natural resource that fueled our industrial past remains an asset to our economy. Strategies to protect our waterways such as implementing green stormwater management, protecting and rebuilding wetlands, reducing agricultural and nutrient run-off into waterways, and prioritizing universal access to and along all waterways are critical to each of our five focus areas. Investing in strategies, policies and regulations that identify and prioritize measurable improvements in water quality, access, and ecosystem health will create opportunities to transform the image of our region from that of a “rust belt” city to one rooted in its blue economy, enabling and catalyzing revitalization through the restoration of the health and integrity of our freshwater systems. In an ever changing world, water will only grow in importance to Buffalo Niagara, and strategies that protect and leverage our water resources are critical to moving One Region Forward. 10

One Region Forward: A New Way to Plan for Buffalo Niagara


A new story for Buffalo Niagara

Buffalo Niagara is writing a new story about itself – a story about how an old “rust belt” region is retooling itself in the 21st century to meet the real challenge of how to live more sustainably in an era of economic change, demographic upheaval and environmental uncertainty. It is a story of old places but new people, fresh ideas, and new ways for working together to use our land more wisely, get around more efficiently, create great places to live, ensure a healthy food supply, and meet the challenges of climate change and a transforming energy economy. We are also familiar with the story of how soldiers returning from the wars got in their cars and moved their families to the suburbs on federally financed highways to homes with federally guaranteed mortgages. We know how Tonawanda and Cheektowaga and the Town of Niagara, later Amherst, Hamburg, Pendleton and other communities grew as the populations of Buffalo and Niagara Falls dwindled. We also know how in the post-industrial era starting in the early 1970s the population of the entire region – not just the cities – began to shrink.

We are all too familiar with the old story of Buffalo Niagara – how the Erie Canal and later the railroads turned a fur-trading outpost into a great commercial center; how iron and coal and hydro-electricity turned the region into an industrial giant; and, sadly, how the post-industrial era shuttered the plants, laid off the workers, sent people away, and left places to decay. These stories are true, more or less. There is even some truth to the oft-repeated litany about mistakes we have made as a community – highways that blocked waterfronts, historic buildings demolished, public facilities mis-located. But maybe – just maybe – these stories aren’t so relevant anymore to what we as a regional community need to do next. History can be a teacher, but it can also blind us to the possibilities of the future. This plan reflects the resolve of thousands who contributed to its creation to learn from the past, but to lean forward into the future. Demographic transformation. It is undeniable that Buffalo Niagara as a region has lost population continuously over the past 40 years or more. We reached our peak population of more than 1.3 million at the census of 1970. By 2010 that figure had dropped to 1,135,509i. However, it is worth noting that half of the total decline occurred during the 1970s and three quarters of the decline before 1990 – almost a quarter century agoii. Indeed, recent population estimates suggest that Buffalo Niagara may have actually grown slightly since the 2010 censusiii. Like the national population overall and most regions in the country, our population is older; partly because people are living longer; partly because people are having fewer children. Yet, recent evidence suggests that Buffalo Niagara’s growth in the 20 to 34 year age group actually exceeds the national averageiv. We also see an influx of immigrants from around the world with new energy to contribute to the region’s revival.

One Region Forward: A New Way to Plan for Buffalo Niagara

11


A NEW WAY TO PLAN | WHERE ARE WE?

It’s partial, preliminary evidence that things might be changing, and that our population decline is by now an old, old story. Maybe it’s time to make some room in our imaginations for a new one.

Our population has declined, but three quarters of the loss occurred before 1990 – almost a quarter century ago. Recent estimates suggest we have grown since 2010.

Economic change. It is also undeniable that Buffalo Niagara has been through wrenching economic contraction and change. The manufacturing economy that dominated the region through the first three quarters of the 20th century has been transformed. In 1970, one of every three jobs in Buffalo Niagara was in manufacturing. Today it is only one in ten. Meanwhile, the share of jobs in health care, education, finance and professional services has more than doubledv. The factory jobs have largely gone away, and our regional economy is more like the nation as a whole and more balanced than ever before.

Population Change, 1970-2010 PERCENTAGE CHANGE IN POPULATION BY CENSUS TRACT

LOSS

50-100% 25-50% 0-25%

GAIN

0-25% 25-50% 50-100% >100%

Source: US Census, 1970 and 2010; Logan, Xu & Stults, 2012, Longitudinal Tract Database.

Percent of Population by Age, 1970, 2010 and 2040 PERCENT OF TOTAL POPULATION

45%

1970

40%

2010

2040

1970 2010(PROJECTED) 2040

35%

(PROJECTED)

30% 25% 20% 15% 10% 5% 0%

0-19

20-39

40-59

60+

AGE COHORT Source: U.S. Census, 1970 and 2010; Cornell Program for Applied Demographics, “New York Population Projection Data by County, 2010-2040”, 2011.

12

One Region Forward: A New Way to Plan for Buffalo Niagara

The prospects for the future are better than in a very long time. Buffalo Niagara enjoys an unprecedented consensus among business, political and community leaders about how to pursue our regional prosperity. We have a new way of working together in the Western New York Regional Economic Development Council (WNYREDC). And we have a clear strategy that emphasizes our strengths in health and life sciences, advanced manufacturing and tourism and focuses investments in workforce development, entrepreneurship, and “smart growth.” Stories in the paper about companies picking up and leaving have been replaced with stories about companies starting up, adding jobs, and investing in facilities. The word-of-mouth about young people pulling up stakes and moving elsewhere to find opportunity are more


than balanced by stories about native Buffalonians coming home to make their futures. There remains very large pockets of entrenched and concentrated poverty in our community. But there is more opportunity now that might be shared. Employment by Sector

The industrial legacy. Education Information

Construction & Mining Other Services 4% Finance and Insurance

4%

3% 1%

Trade, Transportation 19% & Utilities

5%

6%

Administrative & Waste Services

16%

8%

Government

Professional, Real Estate & Business Services

10%

Manufacturing

14% 10%

Health Care & Social Assistance

Leisure & Hospitality Source: New York State Department of Labor, Quarterly Census of Employment and Wages, 2012.

Our industrial past has left us with a legacy of damaged land, discarded buildings, and poisoned water. Buffalo Niagara has an extraordinary concentration of the wasted industrial assets known as “brownfields.” However, we have also been working steadily to reclaim these assets, cleaning up our land and waterways and finding new uses for old buildings. Two high-tech companies from California are preparing to move into a new building on the former site of the Republic Steel plant in South Buffalo. The reinvention of the Remington Rand building into the mixed-use “Remington Lofts” has been a catalyst in revitalizing North Tonawanda’s waterfront along the Erie Canal. The pending redevelopment of the third Trico Building on the Buffalo Niagara Medical Campus doesn’t seem so unusual after the reuse of two others like it or the emergence of Larkinville.

The remains of the industrial era look more like opportunities than ever before. We understand more clearly, too, just how central our water resources will be to the future of our community and economy. We are cleaning up our waterways, safeguarding our watersheds and addressing the problems of storm water management. Even more, we are learning how important water and environment can be to the future of a “blue/green economy.”

Jobs in health care, education, finance and professional services have more than doubled. The factory jobs have largely gone away, but our regional economy is more like the nation as a whole and more balanced than ever before.

We still mourn the loss of the region’s architectural treasures – Frank Lloyd Wright’s Larkin Administration Building, the old Erie County Savings Bank, the Buffalo Public Library and the Niagara Falls Museum. But the fact is that we have saved more of our great architecture than we have lost – Sullivan’s Guaranty Building, Wright’s Martin House complex, Richardson’s magisterial Buffalo State Hospital, the old Customs House and the United Office Building in Niagara Falls – contributing not only to our quality of life but our strength as a visitor destination. With the important continuation of state preservation tax credits on top of federal tax credits more successes like the restoration of the Hotel Lafayette are in the offing.

One Region Forward: A New Way to Plan for Buffalo Niagara

13


A NEW WAY TO PLAN | WHERE ARE WE?

The challenge of sprawl. The challenge of sprawl remains to be met. Throughout the 20th century and especially since the widespread adoption of the automobile after 1920, Buffalo Niagara grew outward. Until 1970 our sprawl was pushed by growth. After 1970 we suffered from sprawl without growth. During four decades of population decline the urbanized area in Buffalo Niagara grew by 166 square milesvi. We now drive more than twice as much as we did in 1970vii. We are much less likely to take transit, ride a bike or walkviii. And the cost to taxpayers of providing public infrastructure and public services continues to riseix.

Old industrial facilities and former office buildings are being transformed into apartments and condos. City housing prices are rising. Young do-it-yourselfers are renovating old homes in neighborhoods we thought were lost.

Change in Population and Urbanized Land Area, 1970-2010 Population decreased by

-16%

The basic problem is that our dependence on the automobile led us to create an urban pattern that can only be served well by the automobile. Low density housing, shops and offices in seas of parking, discontinuous street systems, roads and highways hostile to pedestrians, all mean it is harder and harder to get around by walking, bicycle, bus or light rail. With all that, we have seen transit ridership grow modestly since 2004x and the emergence of a vibrant bicycle culture is visible on the street. Scientists argue we need to wean ourselves from fossil-fueled vehicles to cut greenhouse gas emissions. Public health experts say this sprawl leads to obesity and other dangerous health outcomes. Economic development specialists suggest we need to work toward greater “spatial efficiency” if we are to fully regain our prosperity. Community activists would point out that an urban region where it is so hard to get around without a car disadvantages everyone, but especially the poor, older adults, and persons with disabilities. The process of sprawl without growth has also left us with a housing market that is badly distorted. During the period of “sprawl without growth” we built far more housing than we had new householdsxi. The result was massive housing vacancy, abandonment and demolition in our central cities, a continuous extension of suburban development out into farm country, and more recently a weakening of housing values in our first ring suburbsxii.

Urbanized land increased by

78%

160 SQ. MILES of natural land

Source: U.S. Census Bureau, 1970 and 2010.

Even here, there is hope on the horizon. Some of the most creative work in housing development is taking place in our central cities. Old industrial facilities and former office buildings are being transformed into apartments and condos. City housing prices are risingxiii. Young do-it-yourselfers are renovating old homes in neighborhoods we thought were lost. Homebuilding on the periphery of the region continues, but there is also development at the center.

Sprawl – with or without growth – has put pressure on another crucial element of regional sustainability. Farms have gone out of businessxiv and farmland has been converted to residential uses at an alarming ratexv. In the long run, our regional food security will be determined by how much of our own food we are able to grow right here. That won’t be possible if we continue to grow houses where crops once grew. At the very least, the issue of sprawl is on the public agenda now. The Erie Niagara Regional Framework for Growth put it there in 2006. The Western New York Regional Economic Development Council has highlighted the economic as well as environmental imperative to promote “smart growth.” One Region Forward has worked hard to

14

One Region Forward: A New Way to Plan for Buffalo Niagara


advance the conversation. Awareness has grown. All we need is the resolve to act. What it will take to succeed as a region in the 21st century will not be what it took to succeed in the 19th or 20th century. Of course, it will take jobs, great neighborhoods and housing choices, public investments in transportation infrastructure and urban services, good schools and parks and more, just like it did in the first two centuries of our history. But our challenges today are different. The idea of sustainability.

Sustainability is not a new concept. The Senecas and other Haudenosaunee people have long embraced and promoted a philosophy that incorporates seven generations into its approach to providing for the welfare of its people. This generational approach includes making decisions that take in account the past, the present, and the future.

SEVEN GENERATIONS THOSE WHO HAVE PASSED GRANDPARENTS PARENTS YOU CHILDREN GRANDCHILDREN THOSE YET TO BE BORN

Sustainability is an indispensable concept for the 21st century. It draws our attention to the interconnections among our economy, our community and our environment. To achieve the “good life” we need a productive economy. But our economic health is rooted in the health of our environment. And we need both to create real social justice. The “bottom line” is far less abstract. The economic costs of environmental degradation and climate disruption can be enormous. The costs of mitigating global climate change will be minor when compared with the cost of repairing the damage from extreme storms, floods, and heat waves or the cost of storm proofing our communities. The rewards for making a creative transition to a post-carbon economy will likely be substantial. We will be a great and successful region if we can repair and reuse the great urban fabric that Ellicott, Olmsted and our awesome waterfronts have given us. Likewise, we will succeed if we can better manage the armature of streets and utilities on which a wealth of housing rests. Success will also require that we continue to make great neighborhoods that give our residents choices about where and how to live. We will succeed if we can continue to work together to build an economy in an environment of continuous technological and organizational change. We will succeed if we can transform our pattern of urban development to use land more wisely, conserve energy, and leave room to grow the food we will need in a more tumultuous world. We will succeed if we can take seriously the concept of sustainability in an age of global climate change. We will succeed if we can find a way to meet our own needs without compromising the ability of future generations to meet their needs. That means, in part, planning for and making the difficult transition to a post-carbon energy economy. It also means preparing for the impacts of climate change that are already determined by past emissions of greenhouse gases. The work ahead. We have an extraordinary amount of work to do. Yet, we are better prepared to do it now than any other time that many of us can remember. There is a new energy in the people of our region. There is a new attitude. We see it in the willingness of community leaders of all types to work together to meet the future. We saw it in the eagerness with which citizens engaged the work of making this plan. We see it in the momentum of work already under way. And now we see it in a plan that outlines a path to travel and describes a way to move “One Region Forward.”

One Region Forward: A New Way to Plan for Buffalo Niagara

15


A NEW WAY TO PLAN | WHERE ARE WE?

16

One Region Forward: A New Way to Plan for Buffalo Niagara


Pioneering new ways of planning and working together This is not a new enterprise. Thousands of citizens in

Buffalo Niagara in a variety of organizations – governments, companies, advocacy groups, neighborhood associations and more – have been working on these issues for years. This plan is simply to bring those efforts into sharper focus and make better, faster progress on all that needs to be done. This plan does not replace any other plans. Indeed, it builds on them. And our careful review and analysis of more than 160 plans by local and regional governments, special purpose agencies, advocacy groups and others, revealed how closely aligned are the values and goals of people throughout our region. Yet, while we build on the history of planning, we believe One Region Forward represents a new way to plan for Buffalo Niagara. This plan was designed to serve as a decision-making tool. It does not tell anyone what to think or what to do, but rather how to think about serious issues facing our communities and the region as a whole. It recognizes the importance of building off the collaborations that set the stage for One Region Forward, most notably the Erie and Niagara County led 2006 Framework for Regional Growth. And even more recent, it works to support and leverage the regional planning documents and funding programs of the Western New York Regional Economic Development Council (WNYREDC). In fact, we already have some very serious resources for action: financial, organizational and otherwise. WNYREDC is focusing state investments toward supporting existing communities, Main Streets, downtowns, and former industrial sites. Governor Cuomo’s Buffalo Billion Investment Development Plan has established a $30 million fund targeted at transitoriented development and walkable neighborhood centers. The New York State Energy Research and Development Authority’s Cleaner, Greener Communities program offers significant funding for projects that support regional sustainability. Our Metropolitan Planning Organization, the Greater Buffalo Niagara Regional Transportation Council, is aligning its allocation of state and federal transportation funding along with the tenets of One Region Forward.

Perhaps even more important than the resources aligning for implementation is the incredible partnerships and capacity we have built through this planning process. More than ever before, we are working together towards a common vision for Buffalo Niagara. The time is now to keep moving forward.

One Region Forward: A New Way to Plan for Buffalo Niagara

17


A NEW WAY TO PLAN | WHERE ARE WE?

Building on the history of planning DATA THROUGH RESEARCH examining plans, trends and actions

The Data

700+

Completed in 2006, the Framework for Regional Growth is the cornerstone for One Region Forward.

LOCAL ORGANIZATIONS

Working together to guide and shape the plan

160+ PLANS ACROSS

64

Tens of thousands of citizens have guided local plans in our region over many years.

Our Values

Community Values Drive Everything

MUNICIPALITIES

Values and investments align

COORDINATED PLANNING

Sharing data and collective problem-solving

Taken together, this work is coordinated with One Region Forward and gives clear direction to the ongoing work. Our Efforts

A Strategy for Prosperity and The Buffalo Billion

BUILDING ON COLLABORATIVE PROGRESS

Strengthening WNY’s Safety Net NIA

GAR

A

! !

RT

City of

!

! !

!

ERI

E

T D R A Fprepared forFoundation

!

Report R. Oishei ty at Buffalo The John Universi by the l Institute Regiona er 2013 Novemb

!

(East

!

WNY’s

ITY REPO

MUN ALO et) BUFFof Main Stre

A COM

G THENIN STRENGSafety Net

WNY Sustainability Plan

§ ¦ ¨ 190

!

!!

ty

Universi

Main

!

!

!

! !

!

! ! ! !

St.

n

LaSalle

Kensingto

Leroy Kenfield Hamlin Grider Park

Schiller Park

Cold Spring

M.L.K MastenKingsley Park Park Medical Park

Genesee Moselle Emerson y

Johnson Broadwa

Lovejoy

Fillmore

Willert Park

Emslie Babcock

First

wn

South Ellicott

Kaiserto Valley

Ward

Tifft

Seneca

Triangle

Perry

ia

! !

Cazenov Park Abbott McKinley

South Park

!

§ ¦ ¨ 90

South Abbott

! !

V U 400

N

!! !

2 0

0 .5

1

7,640 ERS of Main ing about (East E PROVID s. ers employ of Buffalo e provid the City human service in of 136 servic ees exist a range employ to provide Street) TY or near POVER s under NEAR IN OR on income ATION ts live POPUL 76-100% residenlevel 51-75% 78,809 poverty Over 26- 50% 10- 25% the federal poverty

SERVIC

near n in or Populatiogroup, 2010 by block

18

One Region Forward: A New Way to Plan for Buffalo Niagara

!

!

Miles

LS schools SCHOOCity School District: middle

ry and 18,000 Buffalo 29 elementa aboutBuffalo public schools, in 3 high ity enrolled studentsin this commun schools

MAJOR YERS EMPLO ! ! !

TRANS

TION PORTA

Hospital Institute General Buffalo Park Cancer Center Roswell Medical Erie County & STOPS ! BUS ROUTES ! NFTA

!! !

!! !!

!! !

Buffalo Green Code

Buffalo and Niagara County Brownfield Opportunity Areas


Building the future of planning NEW DATA DEVELOPMENT testing the data with the community, elected officials and the business community

100+

trained through the Citizen Planning School

27

workshops to “map our future”

50+

presentations to local organizations

5,000+ CITIZENS

DATA MEASUREMENT performance metrics to gauge progress in the future

Tabling at

30+ Community

Events, Fairs & Festivals

Engaged in a mutltude of ways to share their vision and add their voice to the conversation

5

Text It Forward surveys

900+ responses

BIG 5IDEAS

Developed to get us closer to realizing our values

COUNTLESS NUMBERS Who can see the work continue

Local Government Officials

Community Organizations Universities and Centers of Learning

Businesses Regional Transportation Agencies

Citizens

...continue to be expressed, sharpened and refined by many.

...shape and inform the ideas and strategies.

...will continue to guide how we move forward.

Nonprofit Organizations

THE NETWORK

will advance a coordinated strategic approach for the future based on research and community informed decision-making.

Buffalo Niagara 2040 Metropolitan Transportation Plan

We make investment decisions together that align our values and are based on objective data.

One Region Forward: A New Way to Plan for Buffalo Niagara

19


A NEW WAY TO PLAN | WHERE ARE WE?

Many have been a part of the network

( !

( !

( !

( !! (

( ! ! ( ! ( ( ! ( !

( !! ( ( !

( !

Values of many drive the conversation and the planning

A truly citizen-driven process, opportunities for our diverse citizenry to shape One Region Forward was provided at our “Community Congress� sessions. Outreach was designed to engage the broadest possible array of perspectives.

Shaping the vision, mapping our values, and providing feedback on concepts in development.

Community Congresses Local Government Council

THE NETWORK

A Seat for Everyone at the Table

Working Teams

Citizen Planners

100+

Translating community values into strategies and actions and progress metrics for evaluation.

22

Organizations from across Niagara and Erie represented on the Steering Committee

Building citizen capacity for grassroots implementation.

( !

! ( ( !

( !

( !

( !

( !

( ( ! !

! ( ( !

( ! ( ( ! ( ! ! ( (! ! ( ! ( ! (! ( ! ( ! ( ! ( ! (! ! ! ( (! ( ( ! ( ! ! ( (! ! ( ! ( ! (( ( ! (! ! (! ! (! ( ( (! ( ! (! ! ( (! ! (! ! ( ! ( ! ( ( ! (! ! (! ! ( (! ( ! (! ( ! ( ( ! ( ! ( ! ( ! ( ! (! ! ( ! ( ! ( ! ( ! ( ! ( ! ( ! ( ! ( ! ( ( ( ! ( (! (! (! (( ( ! ( ! ! ( (! ! ( ! (! ! ( ! (! ! (! ! ( ! ( ! ( ( ! ( ! ( (! (! ( (! ! (! ( ! (! ! ( (! (! ! ( ! ( ! (! ( ! ! (! (! (! ! ( (! ! (! (! ( ( ! ! ( ! (( ! ! (! ( ( ( ! ( ! ! ( ( (! ! ( ! (! ! ( !

Subject matter experts and stakeholders

Providing ongoing direction and guidance to ensure the work has broad-based support and representation.

! ( ! ( ! (( !

( ! ( !! (

Perspectives from business leaders and employers convened by the Buffalo Niagara Partnership.

( ! ( ! ( !! ( ( !

( !

( !

( ! ! (

( ! ( !

(! ! ( (! ! ( ( ( !! ( (! (! ! (! (! ! (

Mayors, supervisors, council members and legislators from our 64 cities, villages, and towns.

Private Sector Council

Steering Committee

( !

! ( ( !

( !

( !

( !

( !

(! ! (

( (! !

( ! ! ! ( ( ( ! ( !

( !

( ! ( !! (

( !

( !

( ! !! ( (

( !

! ( ( ! ( ! ( !

( ! ( ! ! ( ( ! ( !

(! ! (

( ! ( ! ( ! ! ! ( (

( ! ( ( ! (! ! (! ! ( ( ! ( ! ( ( ! ( ! !! !! ( (( ( ! (! ( ! ( ! ( ! ( ( ! ! ( ! ( ! ( ! ( ! ( ! (! ! (! ( ! ( ( ! ! ( ! ( (! (! (! ! ( ! ( (! ( ! ( ! ( ! ( ! ( ! (! ! ( ! ( ! ( ( ! ( (! ! ( ! ( (! ! ( ! (! ( (! ! (! ! ( ! (! ( ( ( ( ! ! (! ( ! ! ( ! ( ! (! ( ! (! ! ( ! ! (! ! ( ( ! ( ( ( ! ( ! ( ! ( ! ! ( ! (! ! ( ( (! ! ( ( ! ( ! (! ( ! ( ! ( ! ( ! ( ! ! ( ( ! ( ! ( ( ! ! (! (! ( ! (( ( ! ! (! ! ( (( ! (! ( ! ( ! ( ( ! (! (! (! (! ! ( (! ! (! ( ! ! (! (! ( ! ! (! ( ! ( ! (! ( ( ! ( ! (! (! ! ( ! ( ! (! ! ( ! ( ! ( ! ( ! ( ! ( ! ( ( ! ( ! ( ! ( ! ( ! ( ! ( ! (! ! (! ( ! ( ! (! (! (! ! ( ! (! ( (! ! (! ! ( ! (! (! ! ( ( ! ( (! ! ( ( ! (! ( ! (! ! (! ! (! (! ( ! ( ( ! ( (! ( (! ( ! (! ! ( ! (( ! ( ( ( ! ( ( ! ( ! ( ! (! (! ( ! ( (! ! ( ( ! ( ! (! ! ( ! (! (! ! (! ! (! ( ! ( ! (! (! ! ( ! (! ! ( ! ( ! ( ! ( ( ! ( ! ( ( ! ( ! ( ! ( ! ( ! ( ! ( ! ( ! ( ! ( ! (! ! (! (! ! ( (! ! (! ! ( ( ! (! ( ( (! ! ( ! (! ( ! ( ! (! ! (! ! ( ! ( ! ( (! ! ( ! (( ! ! ( ( ! (! (! ( ! (! ! (! ( ! (! ! (! (! ( ! ( ( ! ( ! ( (! ! (! ! ( (! ( ! ( ( ! (! ! ( ! (( ! (! ! ( ((! ! ( ( (! ! (! ! (! ! ( ( ! ( ! ( ! ( ! ( ( ! (! ( ! ( ((! ! ( ! ( ( ( ! ( ! (! ! ( (! ! ( ! (! (! ! ( ! ( ! ( ! ( ! ( ! (! ( ( ! ( ! ( ! (! ! ( ! (! ! ( ( ! ( ! ( ! (! ! ( (( ! (! ! ( ! ( ! ( ! ( ! (! (! ! ( ! ( ! ( ! ( ( ! ( (! ! (! ! ( ! ! ( ! (! ( ! ( ( ! ( (! (! ( (! ! (! ( ( ! (! ! ( ! ( ! (! ! ( ( ! ( ! ( ! ( ( ! ( ! ( ! (! (! (! ! (! ( ! ( ! ( ! ( ( ! ( ! ( ! ( ! (! ! ( ( ! (! ! (! ( ! ( ! ( ! ( ! ( ! ( ! (! ! (! ( ( ! (! (! (! ( ( ! ( ! (! ! (! ! ( ! ( ! ( ! ( ! ( ! ( (( ! ( ! ( ! ( ( ! ( ! (! (! (! ! ( ! (! ! ( ! (! ! (! ! ( ! ( ! ( ! ( ! ( ! ( ! ( ! ( ! ( ! ( ! ( ! ( ! ( ! ( ! ( ! ( ( ! ( ! ( ! ( ! ( ! ( ! ( ! ( ! ( ( ! ( ! ( ! ( ! ( ! ( ! ( ! (! ( ! (! ! ( ! ( ! (! ! ( ! ( ! (! ! ( ! ( ! ( ! ( ! (! ! ( ! ( ( ! ( ! ( ! ( ! ( ! ( ! ( ! ( ! ( ( ! ( ! ( ! ( ( ! ( ! ( ! ! ( ! ( ! ( ! ( ( ! ( ! ( ! ( ! ( ! ( ! ( ! ( ! (! ! ( (! ! ( ! (! ! (! ! ( (! ! ( ! ( ! ! ( ! ( ( ( ! ( ! ( ! (! ! (! ! ( ! ( ! ( ( ! ( ( ( ( ! ( ! ( ! ( ! ( ! ( ! ( ! ( ! ( ( ! ( ! ( ! ( ! ( ! ( ! ( ! ( ! ( ! ( ! ( ! ( ! ( ! ( ! ( ! (! ! ( ! ( ! ! ( ( ! ( ! ( ! ( ! ( ! ( ! ( ! ( ! ( ! ( ! ( ! ( ! (! ( ! ( ! ( ! ( (! ! ( ( ! ( ! ( ! (! (! (! ! ( ( ! ( ! ( ! ( ! ! ( ( ( ( ! ( ! ( ! ( ! ( ! (! ( ! (! ! ( ! ! ( ! ( ! ( ! ( ! ( ( ! ( ! ( ! ( ! ( ! ( ! ( ! ( ! (! ( (! ( ! ( ! ( ! ( ! ( ! ( ! ( ! ( ! ( ( ! ( ! ( ! ( ! ( ! (! ! ( ! (! ! ( ! ( ! ( ! ! ( ( ! ( ! ( ! ( ! ( ! ( ! ( ! ( ! ( ! ( ( ! (! ( ! ( ! ( ! ( ! ( ! ( ! ( ! ( ! ( ! (! ! ( ( ! ( ! ( ! ( ! ( ! ( ! ( ! ( ! (! ! ( ! (! ! (! ! ( ! ( ! ( ! ( ( ! ( ! (! ! ( ! ( ! ( ! ( ( ! ( ! ( ! ! (! ! ( ! ( ! ( ! ( ! (! ! ( ! ( ( ! ( ! ( ! ( ! ( ! (! ! ( ( ! ( (! (! ( ( ! ( ! (! ! ( ! ( ! ( ! ( ! ( ! ( ! ( ( ! ( ! ( ! ( ! ( ! (! ( ! ( ! ( ! ( ! ( ! ( ! ( ! ( ! (! ! (! ! ( ! ( ! (! ! ( ( ! (! ! ( ! ( ! ( ! ( ! ( ! ( ! ( ! ( ! ( ( ! ( ! ( ! ( ! ( ! ( ! (! ! ( ( ! (( ! ( ! ( ! ( ( ! ( ! ( ! ( ! ( ! ( ! ( ! ( ! ( ! ( ! ( ! ( ! ( ! ( ! ( ! ( ! ( ! ( ! ( ! ( ! ( ! ( ! ( ! ( ! ( ! ( ! ( ! (! ! ( ! ( ! ( ! (! ! ( ! ( ! ( ! ( ! ( ! ( ! (! ( ! ( ! (! ! ( ! ! ( (! ! ( ( ! ( ( ! ( ! ( ! ( ! ( ! ( ! ( ! ( ! ( ( ! ( ! ( ! ( ( ! ( ( ! ( ! ( ! ( ! ( ! ( ! ( ! (! ( (! ! ( ! ( ! ( ( ! (! ( ( ! ( ! (! ! (! ! ( ! ( ! ( ! (( ! (! ! ( ! ( ! ( ! (! ! ( ! (( ! ( ! ( ! ( ! ( (! ( ! (! ! ( ! (! ! (! ( ! ( ! (! ( ( (! ! ( ! (! ( ! (! ! (! ! ( ! ( ( ! (! ! ( ! ( ! ( ! ( ( ( ! ! (! ( ( ! ( ! ! ( (! ( ! (! ! ( ! ( ! ! ( ( ! ! ( (! (! ! ( ! (( ! ( ! ( ! ( ! ( ! ( ! ( ! (! ! ( ! ( ( ( ! ( (! ! (! ! ( ! ( ! (! ( ( ! ! ( ! (! ! (! ! ( (! (! ! (! ( ( ! ( (! ! ( (! ! ( ! ( ! ( ( ! ! (! ! ( ( (! (! ( ! ( ! ( ! ! ( ( ! ( ! ( (! ! ( ! ( ( ! ! ( ( ! ! ( ! ( ! ( ! ( ! ( ! ( ! ( ! ( ! ( ! ( ! ! ( (! ( ! ( ! ( ! ( ! (! ! ( ( ! ( ! ( ! ( ! ( ! ( ! ( ! ( ! ( ! ! ( ! ( ! ( (! ! (( ! ! ( ( ! ! ( ( ! ( ! ( ! ( ! ( ! ( ! ( ! ( ( ! ! ( ! ( ! ( ! ! ( ( ! ( ! ( ! ( ! ( ! ( ! ( ! ( ! ( ! ( ! ( ! ( ! ( ! ! ( ( ! ( ! ( ! ( !

! ( ( !

(! ! (

( !

(! ! (

20

One Region Forward: A New Way to Plan for Buffalo Niagara


Many voices from many parts of our region ( ! ( ! ( !

( !

( ! ( ! ( !

( !

Every successful plan is a reflection of the values the community shares.

( ! ! ( ( !

( !

( !! ( ( ! ( !

( ! ! ( ( !

( !

( !

( !

( !

! ( ( !

( !

! ( ( ! ( ! ! ( ( ! ! (

( ! ( !

( ( ! ! ( ! ( ! ( !

( ! ( !

( !

( ! ! ( ( !

( !

( !

( ! ( ! ( ! ! ! ( (! ( ( ! (! ! ( ! ( ! ( ( ! ! ( ( ! ( ( ( ! ( ! ! ! ( ! ( ! !! ( ! ( ( ! ( ! (( ! ( ! ( ! (( ! ( ! ( ( ! ! ( ! ! ! ( ! ( ( ! ( ! ( ! ( ! ( (! ! ( ! ( !

( ! ( ! (! ! ( ! ( ( ! (! ! ( ! ( ! ( ( ! ( ! ! ( ! ( ( ! ( ! (! ! ( ( ! ( ( ! (! ! (! ! ( ! (! ! ( ! ( ( ! ! ( ( ( ! (! ! (! ( ( (! ! (! ! ( ! ( ! ( (( ! ! ( ( ! (! ! ( ! ! ( ! (! ! ( (! ! (! ( (( ! ( ! ! ( ! ( ! ! (( ! ( ! ( ( ! ( ! ( ! ( (! ! ( ! ( ! ( ! ! ( ! ( ! ( ( ! ! ( ! ( ! ( (! ! ( ! ( ! ! (( ( ! ( ! ( ! ( ! ( ! ( ! ( ! ( ( ! (! ( ! (! ! ( ! ( ! ( ! ( ! ( ! ( ! ( ! ( ! (! ! ( ( ! ( ! (! (! ! (! ! ( ! ! ( ( ! (! (! ! ( ( ( ! ! ( ! ( ( ! ( ! (! ( ( ! ( ! ( ( ( ! (! ! ( ! ( ! (! ! ( (! ( ( ! (! ( ! (! ! (! ! (! ( (! ! ( ! ( ! (! ! (! ((! ! ( ! ( ! (! ! ( ! (! (! (! ( (( ! ! ( ! (! ( ! ( ( (! ! ( ! ( ! ( ! ! ( ! (! ! ( ( ! ! ( (! ! (! ( ( ! ( ( ! ( ! ( (! ! ( ! ! ( (! ! ( ( ! ! ( ( ! ( ! ( ! ( ! ( ! ! (( ! (( ! (! ! ( ! ( ( ! ( (! ! ( (! ! (! ! ( ! ( ! ( ! ! ( ! ( ! ( ( ! ( ! ( ! ( ! ( ! ! (! ! (! (( ( ! ( ! ( ( ! ( ! ( ! ! ( ! ( ! ! ( ! ! ( (! ! ( ! ( ( ( ( ( ! ! (! ! (! (! ( ! ( ! ( ( ! ( ! (! ! ( (! ( ! (! ! ( ! ( ! ( ! ( (! ! ( ( ! ! ( ! ( ( ! ( ! ( ! ! ( ! ( ! ( ! (! ! ( ! ( ! ( ! ( ( ! ( ! ( ! ( ! ( ! ( ! ( ! ( ! ! ( (! ! ( ! ( ! (! (! (! ( ! (! (! ! ( ! ( ( ! ( ! ( ( ! (( ! ! ( ! (! ( ! ( (! ! ( ( ! ( ! ! ( ! ( ! ( ! ( ! ! ( ! (! ( (! ! ( ! (( ! ( ! (! ! ( ! (! ! ( ! ( ! ( ( ( ! (! ! ( ! ( ! ( ! ( ! ( ! ( ! ( ( ! ( ! ( ! ( ! ( ! ( ! ( ! ( ! ( ( ! (! ! ( ! (! ! ( ( ! ( ( ! ! ( ( ! ! ( ! ( ! (! ( ! ( ! (! ! ( ( (! ! ( ! (! ( (! (! ! ( ! ( ! ( ! ( ! ( ! (! (! ( ! ! ( (! ! ( ( ! (! ! ( ( ! ! ( ! ! ( ( ( ! ( ! ( ( ! (! ! (! ! (! ! ( ( ! ( (! ( ! ( ! ( ! (! ! (! ( ! ( ! ( ! ( ( ( ! ( ! ( ! ! ( ! ( ! ! ( ( ! ( ! ( ! ( ! ( ! ( ! ( ! ( ! ( ! ( ! ( ! ( ! ( ! ( ! ( ! ! ( ! ( ! ( ! ( ! ( ! ( ( (! ! ( ! ( ! ( ! ( ! (( ! ( ! (! (! ! (! ! ( ( ( ! ! ( ! ( ! ( ! ( ! ( ! ( ! ( ! ( ! ( ! ( ! ( ! ! ( ( ! ( ! ( ! ( ! ( ! ( ! ( ! ( ! ( ! ( ! ( ! ( ! ( ! ( ! ! ( ( ! ( !

( !

Buffalo Niagara has been talking about where we want to go as a region for many years. One Region Forward has continued that dialogue, starting with the values embedded in over 160 plans and decades of planning in our region.

( !

( ! ( !

It’s a great place to start.

( !

( !

Our Values ! ( ( !

OUR VALUES CONNECT US

Many voices from many parts of our region expressed values about… OUR ECONOMY ( ! ( !

OUR INFRASTRUCTURE OUR TRANSPORTATION SYSTEM OUR HOMES AND NEIGHBORHOODS

( !

OUR FARMLAND OUR GREEN ENERGY

( !

( ! ( !

OUR NATURAL RESOURCES

( ! ( !

( ! ( ! ( !

( ! ( ! ( ! ( !

( !

( ! ( !

( !

! ( (! ! (

OUR HERITAGE OUR PARKS AND RECREATION OUR NEED TO COLLABORATE AND IMPLEMENT

One Region Forward: A New Way to Plan for Buffalo Niagara

21


A NEW WAY TO PLAN | WHERE ARE WE?

A Good Place to Start: 10 Broad Values We Share Build a more competitive, creative, prosperous, broadly shared, locally rooted, and sustainable 21st century regional economy. Manage infrastructure strategically, investing in existing areas and maintaining, removing, or extending urban systems to lower costs, improve efficiency and enhance quality of place.

Our Values

OUR VALUES CONNECT US

What do 160+ plans tell us about our values?

There is an ongoing public conversation in Buffalo Niagara about where we want to go as a region. The plans we have made in the recent past, and the tens of thousands of citizens who participated in their formation, are an important part of that conversation. As a starting point for One Region Forward, our research team collected, read, and analyzed more than 160 planning documents from the region, its cities and towns, its neighborhoods and districts. All of these plans contain statements about our vision, values, and goals. We’ve added these statements up, sorted them into categories, illustrated them in “word clouds� and translated them into draft value statements for public review in early 2013. The result of that engagement process, which consulted local government leaders, the business community, and the public at large, yielded a revised set of value statements which are outlined to the right.

22

One Region Forward: A New Way to Plan for Buffalo Niagara

Expand transportation options to improve access to jobs, services, and recreation; meet the needs of students, seniors, persons with disabilities, and the transit dependent; move goods to market; and promote energy efficiency and safety. Repair, renew, redesign and preserve our housing stock and to provide healthy, affordable, and efficient choices to a changing population in neighborhoods that are great places, safe, accessible, well-served and distinctive. Protect farmland and forests, support farmers, promote sustainable farming, encourage urban agriculture, connect farms to local markets, foster value-added processing, cultivate agri-tourism, and ensure access to healthy, affordable, locally-sourced food. Use less energy, promote green energy through direct incentives, technology development and pricing policy, to reduce greenhouse gas emissions while we prepare to cope with the impacts of climate change. Restore and protect our water, air, soil, wildlife habitat and other natural resources to promote a healthy ecology, economy and community. Protect and develop cultural, heritage, and architectural resources to preserve community identity, enrich daily life, create great places, attract visitors, and build our economy. Maintain, improve, expand and connect our parks, trails and greenways, waterfronts, recreation areas, and open spaces for a wide range of users, to protect the environment, attract visitors, and grow the economy. Foster collaboration, coordination, and strong implementation, share information widely, educate broadly, and plan with a diverse and engaged public including not-for-profit and community-based organizations, public bodies, and citizens in general.


We have less people, but use more land.

-16%

CHANGE IN POPULATION AND DEVELOPED LAND, 1970-2010

78%

We commute to work by car more and take COMMUTING MODES, 1970 VS 2010 transit less. 1970 2010 Drive Alone

VEHICLE MILES TRAVELLED DAILY PER CAPITA, 1970 VS 2010

1970

vs.

82%

10%

vs.

4%

We drive more than twice as far. 8 miles

2010

67%

vs.

18 miles

We build new homes and roads, empty our cities, lose farmland, increase our infrastructure costs and tax burden.

204%

ACRES OF FARMLAND 1969 VS 2007

394,152 291,992

160

OVER SQ. MILES OF FARMLAND LOST % CHANGE IN TOTAL HOUSING UNITS VS. % CHANGE IN VACANT HOUSING UNITS, 1970-2010

1969

IN JUST THE PAST TWENTY YEARS, WE’VE ADDED... ...COSTING US

525 MILES

$26 MILLION

OF NEW ROADS

PER YEAR TO MAINTAIN

OUR LOCAL GOVERNMENTS SPEND AN AVERAGE OF

20% TOTAL HOMES

2007

VACANT UNITS

$0.75

1

1

1

1

IN DEBT SERVICE FOR EVERY DOLLAR THEY COLLECT IN REVENUE

What’s changed over the past 40 years? Development across our region has continued to spread outward even as our population has shrunk. We’ve lost nearly 214,000 people over the past forty years, yet we have expanded our development footprint by 166 square miles. This outward development pressure has contributed to the loss of 160 square miles of agricultural land since 1970, as farms give way to residential subdivisions, commercial plazas, and business parks. This dispersed development pattern has also affected the way we get around. On average, we drive more than twice as many miles a day as we did in 1970. People live further from their jobs, and errands that were once accomplished on foot, now require us to drive. Over 525 miles of new roads have been built in just the past twenty years to serve these far flung developments, costing us an estimated $26 million each year in maintenance costs. Low density development also makes public transportation a less viable option. Consequently, the number of individuals commuting to work by car has increased significantly since 1970, while the share of commuters relying on public transportation has decreased by more than half. The region’s oldest urban neighborhoods and housing stock were some of the first causalities of sprawl. Since 1970, we built over 150,000 new housing units, far outstripping the formation of new households. This imbalance has contributed to the emptying out of our central cities, with the number of vacant homes tripling over the same period.

See Data Sources and Notes.

One Region Forward: A New Way to Plan for Buffalo Niagara

23


A NEW WAY TO PLAN | WHERE ARE WE GOING?

Our Values

If our actions don’t match our values, what can we do about it? We can think about the land, open space and natural areas we should protect and maintain.

How important is it to protect farms and farmland and preserve natural land and waterways?

We can think about preserving the character of communities.

How important is it to maintain the character of the places we like best?

24

One Region Forward: A New Way to Plan for Buffalo Niagara


We can think about what type of places we create. DIFFERENT PLACES FOR DIFFERENT PURPOSES

Urban Center

Village Center

Traditional Neighborhood

Suburban Strip

Office/Industrial

Single Family Residential

Exurban Residential

Think of: Downtown areas of big or mediumsized cities

Think of: Smaller commerce centers you might see in bustling village Main St. areas, small city downtowns or mixed-use neighborhoods

Think of: Neighborhoods with mostly residential streets, homes near each other, and within walking distance to a commercial street with activities, parks and services

Think of: Strip malls with retail and other establishments concentrated in areas with large parking lots in front

Think of: Low-rise office complexes with limited services on site and large parking lots surrounding buildings

Think of: Newer neighborhoods made up of just homes that have attached garages and driveways, large yards, and a sense of privacy

Think of: Very large homes far apart from each other, typically in quiet rural areas and far from services, parks or activities

What’s in it for the region?

Consumes LESS land

Concentrates Employment MORE

What kind of places make sense to create in our region? Different choices will have different impacts on how much land we use. Houses MORE people

The places we make and invest in are reflections of what we value.

Consumes MORE land Concentrates Houses LESS Employment people LESS

We can think about how we connect our people and places.

How important is it to invest in transit, build trails and bikeways and invest in roads and highways?

One Region Forward: A New Way to Plan for Buffalo Niagara

25


A NEW WAY TO PLAN | WHERE ARE WE GOING?

Our Values

We can think about how and where we make those changes.

Should we REVITALIZE PLACES? Should we bring new jobs and people to places that are not as bustling as they once were?

Would you revitalize our city downtowns, declining urban neighborhoods or village Main Street areas?

Should we RE-IMAGINE PLACES? Should we transform the character of developed places as something different than they are today? Would you want to see suburban strip areas transformed to become more walkable and transit-friendly?

Should we CREATE NEW? Should we focus development on land that is currently undeveloped or vacant?

Would you create a new, mixed-use town center on the rural periphery?

26

One Region Forward: A New Way to Plan for Buffalo Niagara


Would you encourage infill housing in neighborhoods suffering from vacancy and abandonment?

Would you want to see suburban strip developments retrofitted to create a more human-scaled environment?

Would you want to see a new residential subdivision built on farmland?

One Region Forward: A New Way to Plan for Buffalo Niagara

27


A NEW WAY TO PLAN | WHERE ARE WE GOING?

Our Values Mapping Workshops held all over the region gave citizens a chance to imagine what our region should look like. Using a series of markers and “place type� chips, citizens worked in small groups to discuss shared values and map the form and location of their ideal scenario for future regional growth and transportation connections.

The Workshops 4 Months were held in... 27 Workshops 770 Participants

church basements ...with... board rooms bar rooms historic Main Street theaters swanky downtown loft apartments suburban living rooms rural town halls school cafeterias

high school students college students immigrant groups private developers public housing residents block clubs nonprofit organizations local officials and planning board members

* A detailed list of the 27 workshops can be found in Appendix E: Community Engagement 28

One Region Forward: A New Way to Plan for Buffalo Niagara


Our Values

One Region Forward: A New Way to Plan for Buffalo Niagara

29


A NEW WAY TO PLAN | WHERE ARE WE GOING?

5

Text It Forward surveys

900+ responses

Tabling at

30+

Community Events, Fairs & Festivals

50+

presentations to local organizations

THE WORK OF THE NETWORK Over 18 months of asking members of our community where we want to go as a region.

30

Our Values

One Region Forward: A New Way to Plan for Buffalo Niagara

What Should We Keep?

What Should We Change?

How and Where Should We Make Change?


We Share Common Priorities Public participation has been critical in defining common priorities and framing a vision for our region. Whether it was making participation easier through Text It Forward, a text messagebased campaign, more accessible through online tools like PhotoVoice, providing a deeper level of engagement with the Citizen Planning School, or getting people to think about principles for a coordinated, regional approach to land use through hands-on mapping workshops, taken together, these engagement efforts have created a truly citizen-driven vision for our region. While there were many different visions for our region expressed throughout the public participation process, some distinct common priorities developed across the different tools and platforms available for citizen feedback.

Turning 115 maps into Alternative Scenarios for Our Future Three alternative scenarios were created directly from citizen input at the Mapping Workshops where participants from across the region worked together to map out a future vision for Buffalo Niagara.

40 44 MAPS 30+

MAPS

Sprawling Smarter

A Region of Villages

31

MAPS

Each citizen-created map was unique, but many showed similar tendencies and were used to form these three alternative scenarios.

Back to the City

One Region Forward: A New Way to Plan for Buffalo Niagara

31


A NEW WAY TO PLAN | WHERE ARE WE GOING?

What 115 Maps and Months of Community Feedback Tell Us About Our Values Our Values

At least

Citizens suggested we should place...

94%

maps

used “protecting farmland” as a guiding principle for future development.

OF NEW JOBS

and

87%

OF NEW HOMES ...in already

Nearly

developed areas of our region.

We need to be offering

more housing type choices especially in our urban centers.”

- Feedback from Private Sector Council member

1/3

of all maps

prioritized preserving, revitalizing and repurposing urban neighborhoods.

Rails-to-trails, particularly for

connecting rural areas with other

parts of our region, is a strategy we need to pursue.” - Feedback from Private Sector Council member

Participants placed

91% 9%

of new homes in mixed-use neighborhoods

but only

32

in places that would have single-family homes only.

out of 115 maps said that “increasing the ways we can “get around without a car” was a guiding principle.

One Region Forward: A New Way to Plan for Buffalo Niagara


Our Values

We Share Common Priorities

At the mapping workshops and at community events throughout the region, we asked people to express their vision for the type of region we should be building for future generations. Thousands of voices have shaped five common priorities that are important to a shared approach to land use.

Grow where we’ve already grown

Most of the maps expressed a strong desire to preserve, revitalize and re-purpose existing places rather than creating entirely new places. Many specifically wrote about “limiting sprawl”, “rebuilding infrastructure,” and “focusing development.”

out of emphasized the need to control sprawl.

On average, participants added

miles of transit lines per map.

More infrastructure=

We can’t afford new taxes

for new roads and infrastructure.” - Citizen feedback from Alternative Scenario Open House in Lockport

more maintenance= more taxes to maintain.” - Citizen feedback from Alternative Scenario Online Survey

On average, participants added

to capitalize on Niagara Falls tourism.”

Better connect our region by diversifying our transportation options

Making connections was one of the most predominant themes expressed across the 115 maps. Participants drew and wrote about making new connections or improving existing ones with specific suggestions about linking to universities, the airport to downtown, Buffalo to Niagara Falls, urban centers to one another, and doing it “without cars.”

Protect farm land, parks and natural areas Maintain fiscally sound local governments

- Citizen participant at a Mapping Workshop in Niagara Falls

miles of recreational/ bike trails per map.

In general, participants prioritized compact, mixed-use and walkable neighborhoods over more spread out, homogeneous places.

Farmland, open space, parks, waterfront, and other natural areas were themes woven into almost every map.

Use rails and transit

On average, participants added

Build and protect walkable communities

Take advantage of

existing infrastructure.

In conversations with the business community, elected leaders, and citizens at large, the issue of reducing our region’s tax burden while maintaining and improving quality public services was paramount. A close reading of many of the maps also revealed this intent, especially in the comments people wrote about where and how they imagined new development and infrastructure.

- Citizen feedback from Alternative Scenario Open House in Lockport

One Region Forward: A New Way to Plan for Buffalo Niagara

33


A NEW WAY TO PLAN | WHERE ARE WE GOING?

Over the past 40 years, our region has continued to spread out, even as we lost population.

By looking at different scenarios, we can understand the impacts of future choices.

1970

2010

What if we stay on our current path?

Business As Usual This scenario assumes an unaltered projection of the region’s development patterns from 1990 to 2010 out to the year 2050 in order to place the additional jobs and homes the region could hold by 2050. This is the unlikely “do-nothing” approach we can use as a starting point to measure the progress made in the alternative scenarios.

...or if we imagine our future differently? 3 Alternative Scenarios developed from 115 citizen-created maps

40

MAPS

44

MAPS

31

MAPS

Sprawling Smarter One group of citizens envisioned some reinvestment in existing communities, but also wanted to see future development spread out to new places. This group thought most new development should be compact and walkable, but largely disconnected from the urban cores.

A Region of Villages Another group of citizens expressed a vision to focus new development within existing neighborhoods across a renewed network of walkable communities in cities, villages and town centers throughout the region.

Back to the City This group of citizens imagined that nearly all new development would be used to reinvest in the urban cores of Buffalo and Niagara Falls, revitalizing virtually all the region’s urban neighborhoods.

See “Where Should We Go From Here” in Data Sources and Notes for a full description of how the extrapolation of past trends was used to construct the “Business As Usual” scenario and how the 115 citizendesigned maps were used to construct the three alternative scenarios.

34

One Region Forward: A New Way to Plan for Buffalo Niagara

WHAT HAPPENS IN THIS SCENARIO? The trends of the past continue. New jobs and homes would continue to grow on rural land while homes in first-ring suburbs as well as central cities would be abandoned. This sprawling development would be harder to serve by public transit.

WHAT HAPPENS IN THIS SCENARIO? Our region would see some outward growth of new jobs and homes, however, these would take on a much denser, mixed-use form. Abandonment would still be an issue for central cities and older suburbs. Less farmland and open space would be lost to development. Our region would see new jobs and homes concentrated in our city, town, and village centers. Neighborhoods would be more walkable, and improved transit would connect these places better. A great deal of farmland and open space would be protected for agriculture and “environmental services.” Our region would see nearly all new jobs and homes concentrated in our core cities. Transit would serve this denser development much better. More existing homes would be rehabbed than abandoned and our former industrial sites would be reused as employment centers.

2050


What our region looks like in 40 years depends on the actions we take collectively and individually. Our Values

How do the scenarios play out when tested against our values? Using a software modeling program called Envision Tomorrow, researchers from UB Regional Institute tested out how well each of the four development scenarios perform on a series of indicators tied to our shared values. The software doesn’t tell the future, but it helps us imagine it. In the “Business As Usual” scenario, where development trends of the past extend out into the future, we fall considerably short in achieving the regional performance to which we aspire. In the three alternative scenarios, each constructed from the 115 citizen-designed maps, we see varying degrees of outcomes, but the underlying actions driving these scenarios get us considerably closer to achieving our values.

Scenarios tell a story of how choices we make today will impact our region in the future.

How we choose to use our land, invest in our resources and communities will shape what Buffalo Niagara will look like in 40 years.

There is no “one size, fits all.” These scenarios aren’t meant to be either-or choices. The four scenarios tell a story of how our region may change over time based on where Buffalo Niagara is today and the choices we might make about how we use our land and how we invest our resources. They are not intended to be either-or choices, as we know land use decisions are made at the local level in our state and region. In essence, there is not one scenario or singular map that will define our future. Various actions and approaches can move us toward our values and certain approaches may work in some communities, but not in others. As each local community reflects on their own land use and zoning codes, they can look to our shared regional values, the four alternative scenarios, and how each aligns with where we want to go as a region to help inform how they implement planning and policy in their local jurisdiction.

One Region Forward: A New Way to Plan for Buffalo Niagara

35 35


A NEW WAY TO PLAN | WHERE ARE WE GOING?

What if we stay on our current path?

Business As Usual Sprawling Smarter A Region of Villages Back to the City

Business As Usual Will we grow where we’ve already grown?

0%

Will we build walkable, livable communities and preserve those that are vibrant and working? Will we better connect our region by diversifying transportation options?

Will we protect farmland, parks and natural areas?

20%

36

40%

60%

0%

20%

40%

60%

What would new development look like?

20%

40%

How should transit connect to development?

60%

20%

40%

60%

What would we protect from development?

-50%

-40%

-30%

-20%

-10%

0%

+10%

One Region Forward: A New Way to Plan for Buffalo Niagara

+20%

How well would we live within our means?

+30%

One-third of our current undeveloped, natural areas would remain as farmland and environmental services in rural areas would be replaced by large homes on large lots.

100%

80%

WHAT KIND OF FISCAL RETURN ON INVESTMENT WOULD NEW DEVELOPMENT HAVE?

We would drive even more than we do now. The sprawl of homes and jobs would make building and maintaining infrastructure more costly and providing transit service more difficult.

100%

80%

WHAT % OF FARMLAND AND OPEN SPACE WILL WE PRESERVE AND ENHANCE?

Over 75% of new jobs and homes would be added in low-density, single-use developments where most daily needs can only by accessed by automobile.

100%

80%

WHAT % OF NEW DEVELOPMENT WILL BE BUILT WITH ACCESS TO PUBLIC TRANSIT?

0%

About half of new development would fall within urbanized areas, adding more infrastructure while neglecting existing infrastructure in urban areas.

100%

80%

WHAT % OF ALL NEW DEVELOPMENT WOULD BE WALKABLE TO SERVICES AND AMENITIES?

0%

Will our local governments be more fiscally sound?

WHAT % OF ALL NEW DEVELOPMENT WOULD BE ON LAND ALREADY DEVEOPED?

Where does new development go?

+40%

+50%

Housing and jobs would grow revenue on undeveloped lands, but these additions to the tax base would not be enough to cover the costs of extending services to these sites.


What if we imagine our future differently?

Sprawling Smarter

A Region of Villages

Back to the City

About 75% of development would go in urbanized areas. Most development would be compact, limiting new infrastructure, adding a fair share of jobs to “brownfield” areas, and curbing abandonment in some neighborhoods.

Nearly 90% of new development would go in urbanized areas. Concentrating growth in the region’s treasured villages, hamlets and urban centers would significantly limit abandonment and development on “greenfield” sites.

Over 90% of new development would be within previously developed areas, mostly in cities and older suburbs, completely revitalizing many abandoned neighborhoods and adding a surge of jobs to “brownfields”.

Most development would be built with walkability in mind, but many new homes and jobs would be disconnected from communities that are already lively and walkable.

Focused development would place new homes by established communities with entertainment and services nearby, making “walkability” the new norm in places throughout the region.

New homes and jobs would grow closely together in cities and older suburbs, making these places even more vibrant and walkable than they are today.

New suburban development would be more pedestrian-friendly, but since access to jobs would mostly be by private automobile alone, we would drive about as much as we do today.

High frequency transit service would become feasible in outlying village centers leading to a “hub and spoke” transit network that would be accessible to half of new homes and jobs.

Though new transit stops would be limited, since 60% of new growth would focus around the existing transit network, this scenario would provide the best transit connections and the biggest drop in automobile travel.

“Smart growth” development in the suburbs would protect a great deal of undeveloped land even as it provided suburban housing choices on “greenfield” sites.

Focusing development in villages, hamlets and urban centers would protect 84% of the region’s prime farmland, natural areas and open space.

Concentrating development in central cities and older suburbs would preserve the lion’s share of existing open spaces, with 90% less farmland being developed compared to the “Business as Usual” scenario.

Though development would apply “smart growth” principles, new revenues would still not cover the costs of extending infrastructure to new developments, though it would come close.

Investing in existing communities in villages, hamlets and urban centers would keep municipal finances “in the black” as revenues would exceed costs by more than 20%.

Focusing new development on the revitalization of central cities and older suburbs would generate the best return on investment of all the scenarios, with revenues outstripping costs by nearly 50%.

One Region Forward: A New Way to Plan for Buffalo Niagara

37 37


A NEW WAY TO PLAN | WHERE ARE WE GOING?

Our Values

Business As Usual

To grow where we’ve already grown means to focus future development around areas that are already developed. This common priority would focus revitalization of older communities while protecting natural open spaces and curbing infrastructure costs.

DEVELOPED LAND NEW HOMES ABANDONED HOMES

In the Business As Usual Scenario, new homes, jobs, roads, utilities, parks and schools would be built on the suburban periphery. By continuing to focus development outward, our old urban and suburban neighborhoods would suffer from increased vacancy, abandonment, and neglect. Former industrial sites in these areas would sit idle, further compounding environmental and economic issues faced by residents and municipal leaders. In the three citizen-created scenarios, a majority of homes and jobs would be located in already developed areas. This would preserve open space and farmland while also avoiding the cost of building new infrastructure. By reinvesting in our existing communities - including housing rehabilitation – we would see fewer homes abandoned, avoid the high cost of demolition, preserve our tax base, and conserve embedded energy. Former industrial sites would see significant reinvestment and become new employment hubs well served by existing infrastructure and our public transportation system. Without the need for as many new impervious surfaces, such as roads, parking lots, and buildings, maintenance costs for municipalities would be much lower while the amount of polluted runoff making its way into our region’s watershed would be limited.

NEW JOBS

Percent of New Homes in Developed Area

37%

64%

Percent of New Jobs in Developed Area 60,668

Homes Left Abandoned

New Jobs Brought Back to Former Industrial Sites New Paved Surfaces (Acres)

1,551

15,785

See “How Do Our Choices Play Out” in Data Sources and Notes for detailed definitions of indicators and methodology for how they were measured.

38

One Region Forward: A New Way to Plan for Buffalo Niagara


Back to the City

A Region of Villages

Sprawling Smarter

66%

79%

40,776

86%

88%

92%

96%

38,783

15,778

17,087

15,996

21,700

8,482

6,578

3,356

One Region Forward: A New Way to Plan for Buffalo Niagara

39 39


A NEW WAY TO PLAN | WHERE ARE WE GOING?

Our Values

Walkable places are naturally created when homes and jobs are in close proximity to each other.

New Homes

New Jobs

Many A Few

Many A Few

New Walkable Places A lot more Walkable Somewhat more Walkable

Building walkable, livable communities means that places would get more compact with a variety of amenities located close to homes. Developing denser places limits outward growth, conserves land, curbs infrastructure costs, and makes it easier to get around without a car. Business As Usual

In the Business As Usual Scenario, a majority of homes would be built in low-density, single-use developments that separate out employment and shopping centers. Limited bicycle and pedestrian infrastructure, such as bike lanes and sidewalks would require the use of a car for most daily activities and also limit the effectiveness of transit service. In the three citizen-created scenarios, a majority of new homes would be built in walkable communities, using “smart growth” principles to create more walkable suburbs in the Sprawling Smarter Scenario, or focusing infill housing in our center cities, older suburbs, and village centers in the Region of Villages and Back to the City Scenarios. A mix of uses, higher densities, and transit oriented development would all contribute to a better pedestrian experience, making it easier and safer to walk to work, school, shopping, and recreation, while also conserving land and encouraging a healthier lifestyle.

Percent of New Homes in Walkable Communities

23%

100

Walkability Score (0-100)

22 0

See “How Do Our Choices Play Out” in Data Sources and Notes for detailed definitions of indicators and methodology for how they were measured.

40

One Region Forward: A New Way to Plan for Buffalo Niagara


A Region of Villages

Sprawling Smarter

Back to the City

69%

81%

77 67

82%

74

One Region Forward: A New Way to Plan for Buffalo Niagara

41 41


A NEW WAY TO PLAN | WHERE ARE WE GOING?

Our Values Access to Transit Frequent Access Some Access No Access

New Home Density Height of bar = Number of new homes

A Few New Homes

Vertical bars represent the number of new homes built and colors show accessibility to transit. 50 vertical feet = 1 new home. Access to transit defined as areas within one-half mile along a roadway of a bus or metro stop. Frequent access is shown in areas with access to stops made at least once every fifteen minutes during peak weekday hours. Quarter square mile cells with fewer than 5 homes added are excluded from the display.

To connect our region means development would be focused around the existing transit network while stops would be made more often and in more places across the region. This approach reduces our impact on the environment, reduces our reliance on cars, and concentrates development in existing communities. The continued sprawl of homes and jobs in the Business As Usual Scenario would require us to build over 1,500 miles of additional roads over the next forty years. This would greatly increase the maintenance cost incurred by municipalities, as well as the tax burden placed on residents. By living further from our jobs and other daily services, the amount we drive each day would continue to rise. Few jobs and even fewer homes would be built in close proximity to transit, furthering our reliance on cars to get around. In the three citizen-created scenarios, a larger percentage of new jobs and homes would be served by transit. We would be able to depend less on cars for our daily trips, conserve more energy, and emit less carbon into the environment. In the Region of Villages and Back to the City Scenarios, a majority of new job and housing growth would be in areas already well-served by transit. With more choices to get around we could save valuable time in our daily commutes, save household money, conserve energy, and reduce the size of our carbon footprint.

Business As Usual

Transit Proximity to New Homes

Transit Proximity to New Jobs

One Region Forward: A New Way to Plan for Buffalo Niagara

1%

4%

Daily Vehicle Miles Traveled (VMT) Per Capita Lane Miles of New Road See “How Do Our Choices Play Out� in Data Sources and Notes for detailed definitions of indicators and methodology for how they were measured.

42

Many New Homes

22.7

1,553 miles


A Region of Villages

Back to the City

Sprawling Smarter

50%

45% 20%

72%

63% 39%

18.1

729 miles

17.7

496 miles

16.8

261 miles

One Region Forward: A New Way to Plan for Buffalo Niagara

43 43


A NEW WAY TO PLAN | WHERE ARE WE GOING?

Our Values

Business As Usual

To protect farms, parks and natural areas means that development would be avoided on woodlands, wetlands, farmland and other open space. This approach would instead concentrate development within urbanized areas to protect the environment, strengthen our local food system, and conserve energy. In the Business As Usual Scenario, outward development pressures would consume nearly 94 square miles of current and potential prime farmland over the next forty years. New homes in outlying areas would also consume natural habitats, like woodlands, wetlands, and other environmentally sensitive areas. Large homes that require a long commute to work would mean that the average household would use even more energy than is used at present. In the three citizen-created scenarios, a majority of new jobs and homes would be located in areas that are already developed, lowering the pressure on outlying rural land and drastically decreasing the amount of farmland and environmentally sensitive areas lost to development. Protecting open space, prime farmland and environmentallysensitive lands has multiple benefits, including preserving scenic values, making our food system more secure and selfsufficient, making fresh, healthy local food more readily available, and maintaining the “environmental services” and habitat that wetlands, stream corridors, woodlands and other open spaces provide.

Developed by 2050 Floodplains & Stream Buffers Wetlands Forestlands Prime Farmland

Percent of Open Space Conserved from Development

58,093

Current and Potential Prime Farmland Lost to Development (Acres) 71,411

Acres of Development on Environmentally-Sensitive Areas

Energy Savings Per Household (Compared to Existing Conditions) See “How Do Our Choices Play Out” in Data Sources and Notes for detailed definitions of indicators and methodology for how they were measured.

44

33%

One Region Forward: A New Way to Plan for Buffalo Niagara

-2.4%


Back to the City

A Region of Villages

Sprawling Smarter

79%

12,548

84%

84%

4,591

5,311

11,755 4,108

+1.2%

+2.7%

3,992

+3.3%

One Region Forward: A New Way to Plan for Buffalo Niagara

45 45


A NEW WAY TO PLAN | WHERE ARE WE GOING?

Total Property Value per Acre

Our Values

0 $1 - $50,000 $50,000 - $100,000 $100,000 - $200,000 $200,000 - $500,000 $500,000 - $1,000,000 $1,000,000 - $2,000,000 $2,000,000 - $3,000,000 $3,000,000 - $4,000,000 $4,000,000 - $5,000,000 $5,000,000 - $10,000,000 > $10,000,000

To have fiscally sound local governments means that any new development would eventually be able to pay for associated infrastructure costs through newly generated tax revenue. By focusing development in areas that are already well served by infrastructure, governments can limit their costs and focus investments in other critical areas. Business As Usual

In the Business As Usual Scenario, the continued outward growth of homes and jobs would require huge investments in new infrastructure. Because lots are larger and homes are farther apart, infrastructure like roads, sewers and water would have further to go and cost more. While there would be an increase in new tax revenue generated, the cost to build and maintain the new infrastructure would be far greater, meaning municipalities would saddle future generations with large, unfunded liabilities.

Total Tax Revenue of New Development

In two of the three citizen-created scenarios, tax revenues from new development would be greater than the cost of infrastructure. By investing in our central cities, as well as town and village centers, costs are kept down, while tax revenue is generally higher. Even though the Back to the City Scenario generates the least amount of new tax revenue due to some urban areas having a lower assessed values, cost of infrastructure is drastically lower, meaning that surplus funds can be invested in other public amenities. There is also a greater chance that remediated industrial sites would be put back on the tax roll.

Total Cost to Build and Maintain Infrastructure of New Development

Cost to Revenue Ratio

$18.8 Billion

1

1

1

1

-36.9% See “How Do Our Choices Play Out� in Data Sources and Notes for detailed definitions of indicators and methodology for how they were measured.

46

$11.9 Billion

One Region Forward: A New Way to Plan for Buffalo Niagara


A Region of Villages

Back to the City

Sprawling Smarter

$11.0 Billion

$12.2 Billion

$10.3 Billion

$11.9 Billion

$10.0 Billion

$7.0 Billion

1

1

1

1

1

1

1

1

1

1

1

1

1 1

-7.7%

+22.5%

+48.3%

One Region Forward: A New Way to Plan for Buffalo Niagara

47 47


A NEW WAY TO PLAN | WHERE ARE WE GOING?

48

One Region Forward: A New Way to Plan for Buffalo Niagara


on our current path?

Can we imagine a future where new development continues to sprawl out as it has in our past?

One Region Forward: A New Way to Plan for Buffalo Niagara

49 49


A NEW WAY TO PLAN | WHERE ARE WE GOING?

50

One Region Forward: A New Way to Plan for Buffalo Niagara


aligned closer with our values?

Can we imagine a future where our built environment truly matches what we say we value?

One Region Forward: A New Way to Plan for Buffalo Niagara

51 51


A NEW WAY TO PLAN | HOW DO WE GET THERE?

100+

Subject matter experts and stakeholders

Our Values

Working Teams

Working Teams focused on defining performance metrics, establishing goals for the future and developing strategies aimed at reaching those goals.

52

One Region Forward: A New Way to Plan for Buffalo Niagara

TRANSLATING COMMUNITY VALUES INTO STRATEGIES AND ACTIONS


Create Great Places and a

Thriving

Economy through Efficient

Connect Our Places by Expanding and Diversifying Our

Land Use Transportation Options

Our Values

Big

Ideas

and dozens of potential strategies and actions to get us there

Provide

Housing Choices

in Neighborhoods that are Great Places to Live

Conserve Our

Energy

Strengthen Our

Food Systems

for a Healthier Population and Economy

Promote Renewables and Prepare for the Impacts of

Climate Change

One Region Forward: A New Way to Plan for Buffalo Niagara

53


A NEW WAY TO PLAN | HOW DO WE GET THERE?

Great Create Great Create Places and a Thriving Places and a Land Use Economy through Efficient Big

Ideas

Thriving

Economy through Efficient Land Use

54

One Region Forward: A New Way to Plan for Buffalo Niagara


How we use our land and how that impacts the quality of housing and neighborhoods, the efficiency of transportation, energy consumption, and even our food system are at the heart of sustainability for Buffalo Niagara.

Since 1970 the population of Buffalo Niagara has declined steadily even as the area of land that is built-up has grown rapidly. Even before we had “sprawl without growth” we sprawled. From 1940 to 1970 land consumption far outstripped population increase. Then we sprawled some more as population shrank. Today, the conversion of rural land into subdivisions continues. How we have developed has resulted in more driving, more energy consumed, longer commutes, housing abandonment in our central cities, slumping housing values in our first-ring suburbs, greater investments in public infrastructure, higher taxes, pressure to transform farmland into subdivisions, loss of other natural resources, and a mismatch between land use and public transit that makes it harder for all, but especially low income residents, seniors and individuals with disabilities, to get to work, school, shopping, or health care. How we use our land and how it impacts the quality of housing and neighborhoods, the efficiency of transportation, energy consumption, and even our food system are at the heart of sustainability for Buffalo Niagara. Why did we sprawl? Federal policies to subsidize mortgages on suburban homes and to pay for roads and highways to get us there played a role. The widespread adoption of the automobile – once a status

symbol, now a necessity for most – also played a role. Now it seems like the costs might be greater than the benefits. The bad news is that land use patterns change slowly. The good news is that they do change. All we have to do is look at how different our city and region looked forty years ago to imagine how much different it might look forty years into the future. We have an opportunity to start working now for the kind of region we want tomorrow. There are also profound effects of our land use pattern on how we get around. As a region, we are driving more, commuting longer, and using more gasoline. Those who can’t afford a car are limited in employment, shopping, access to vital services like health care, and more. Even as destinations and job centers have become more spread out, public transit service has become more limited. Many suburban environments are unfriendly or dangerous to pedestrians. We are walking less and getting more obese. We discuss these impacts in greater depth in the section on Transportation and Mobility. Similarly, there are connections between land use and all the other major elements of the plan. Land use patterns influence the quality of neighborhoods, our ability to grow food in our region, how we manage both production and consumption of energy, and how we might mitigate the impacts of climate change.

WHAT DOES THE DATA TELL US ABOUT WHAT WE ARE DOING? We are consuming much more land per person. We are rapidly depleting vital natural resources. We are further polluting our waterways. We are building a housing surplus, creating vacancy and abandonment. We are building more infrastructure with fewer people to pay to maintain it.

TOOLS FOR GREATER UNDERSTANDING “The Dollars & $ense of Development Patterns” is a special report looking at the fiscal and tax revenue impacts of various approaches to land use. Prepared for the region by Joe Minicozzi and Urban3, this report looks at various places in our region - downtowns, village centers, towns, shopping malls, main streets, suburban strip corridors, and others, and analyzes how productive they are to local and regional tax revenues when land consumption is considered.

One Region Forward: A New Way to Plan for Buffalo Niagara

55


A NEW WAY TO PLAN | HOW DO WE GET THERE?

WHAT THE COMMUNITY SAID THEY VALUE

WHAT THE DATA TELLS US From 1970 to 2010 while population fell by 213,000 people, the area of urbanized land increased by 166 square miles. 1970

What 115 Maps Tell Us -------------

Nearly

1/3

of all maps

1990

2010

1,349,211 1,189,288

Population

1,135,509

prioritized preserving, revitalizing and repurposing urban neighborhoods. Urbanized Land

Source: US Census, 1970, 1990, 2010.

On average, participants added

.

out of emphasized the need to control sprawl.

What Else We Heard ----------------

Protect farmers and our farmland

and reclaim where possible.” - Citizen participant at a Mapping Workshop in East Aurora

Prevent suburban sprawl from eating up more green space.” - Citizen participant at a Mapping Workshop in Niagara Falls

Rivers and canals are an important part of our green infrastructure.”

Source: UBRI Analysis, 2014. Based on housing density found from historical parcel data (NYS Dept. Of Taxation and Finance, Real Property Services, 2010) and a derivation of developed land from satellite imagery (US Geological Survey, 1992 National Land Cover Dataset, 1997; USGS, 2011 NLCD, 2014; and USGS and NASA, 1975 Global Land Survey)i

We consume 30% more developed land per person than 20 years ago.

HOMES BUILT SINCE 1970 ON IMPORTANT NATURAL AREAS

Homes built since 1970 on Important Natural Areas LAND COVERAGE PER CAPITA 1992

2011

25,754

on Prime Farmland

11,616

on Forests & Wetlands

5,301 sq ft per person

6,880 sq ft per person

Source: UBRI Analysis using US Geological Survey, National Land Cover Data, 1992 and 2011.ii

- Citizen participant at a Mapping Workshop held at Starpoint High School

56

We build homes on land we could protect.

One Region Forward: A New Way to Plan for Buffalo Niagara

2,290

on Floodplains

Source: UBRI Analysis using data from New York State Office of Real Property Services (2010), USGS (2012) and FEMA (2012).iii


We are building a housing surplus. CHANGE IN NUMBER OF HOUSEHOLDS AND NEW HOMES BUILT, 1970 TO 2010

55,465

184,956

We have 55,000 more households today than in 1970…

…but we’ve built more than 150,000 new homes.

Source: U.S. Census, 1970, 1980, 1990, 2000, 2010; American Community Survey, 2012 1-year Estimates.

Sprawling development patterns have forced us to build more infrastructure…

ROADS BUILT SINCE 1990

In just the past twenty years,

525 miles

of new roads have been built...

...costing us

$26 million

Roads Built Since 1990

per year to maintain.

Source: U.S. Census Bureau. (1990; 2010). TIGER/Line Shapefile, New York, Roads. Source: UBRI analysis using data from the U.S. Census Bureau (1990 and 2010), and the NYS Office of the State Comptroller (2011).iv

We’ve cleaned up 631 legacy sites over the past thirty-five years. FEDERAL AND STATE REMEDIATION SITES, 1978-2013

Source: NYS Dept of Environmental Conservation, 2014; US Environmental Protection Agency, 2011.

We’re protecting some land and open spaces. Over

37,000 acres of land and open space are protected in Erie and Niagara Counties, equating to

4%

of our land area.

Source: Erie County Department of Environment & Planning (2012); Niagara County Department of Economic Development (2012); NYS Office of Cyber Security (2010); WNY Land Conservancy (2013).v

WHAT WE COULD DO DIFFERENTLY Develop a land use pattern that supports what our region values.

p 58

Manage the cost of public services.

p 60

Redesign revenue-raising structures to promote land use goals.

p 61

Establish mechanisms to manage brownfields and declining neighborhoods.

p 62

Promote a more compact pattern of development.

p 63

Protect and restore natural places and farmland.

p 64

Protect and restore water quality and quantity.

p 65

One Region Forward: A New Way to Plan for Buffalo Niagara

57


A NEW WAY TO PLAN | HOW DO WE GET THERE?

WHAT WE COULD DO DIFFERENTLY RECOMMENDED STRATEGIES AND ACTIONS

Develop a land use pattern that supports what our region values. Develop a land use pattern that will produce the “spatial efficiency” needed to support our continuing economic development; manage the long-term costs of roads, utilities, and other public infrastructure like schools, libraries, parks and recreational facilities; help us create a region in which jobs, education, health care, and shopping are readily accessible to all; provide the framework to create great neighborhoods with housing choices; and allow us to protect farmland, forests, and natural lands for the benefit of posterity. The first step in achieving the pattern is to sketch out where we want to go, to “paint the target,” and agree to work together to make it happen. In precedent plans, discussions in our steering committee, the work of our subject matter experts, and the deliberations of hundreds of citizens in a participatory scenario mapping exercise, we have identified some key land use approaches that support what the region values.

Concentrate most development within the existing urbanized area. Although already “developed,” there is a significant amount of undeveloped, under-developed, or vacant land within the urbanized area where new housing, offices, shops, and other facilities could be located. What doesn’t make sense, especially for municipal finances, is to continue the practice of abandoning land, buildings and supporting infrastructure near the center of the region and replacing it with the same on the periphery. We need to grow first where we have already grown. Those decisions remain a matter of municipal home rule, but we can encourage towns and villages to adopt smart growth principles to produce a better and more efficient pattern of development.

Focus development in existing urban centers and villages. Established downtowns like Buffalo, Niagara Falls, Lockport, Tonawanda, North Tonawanda and Lackawanna can accommodate significant additional growth in jobs and housing through the development of vacant sites and parking lots and redevelopment of existing sites to higher and better uses. So can village centers across the region – although

58

One Region Forward: A New Way to Plan for Buffalo Niagara

What if every municipality’s zoning code embraced walkability, transit connectivity, and efficient use of scarce land resources?

MOMENTUM TO BUILD ON The City of Buffalo’s soonto-be-adopted “Green Code” will replace a 60-year-old zoning ordinance with new rules to make it easier to build more sustainable types of development – energy-efficient, mixed use, walkable and in tune with the historic city. The “form-based” zoning code will be part of a new planning suite that will also include the city-wide comprehensive plan, Local Waterfront Revitalization Program, Brownfield Opportunity Areas, and reformed urban renewal areas. buffalogreencode.com


in those cases we need to take care to preserve what people see as great about those places and respect local home rule prerogatives.

Redevelop brownfields for job creation. The end of the era of heavy industry in Buffalo Niagara left thousands of acres of land and millions of square feet of buildings unused and, in many cases, damaged by pollution. With the help of federal and state programs and strong local planning and implementation, many of these sites are being cleaned up and readied for redevelopment. Citizens see these sites as ideal for job creation, especially for growth in advanced manufacturing, expansion in transportation and logistics, and growth in back office operations. Citizens at scenario mapping exercises concentrated office industrial development in former industrial areas in Lackawanna, South Buffalo, the Tonawandas, Niagara Falls and Lockport.

What if development decisions were made based on proximity to public transit?

Connect land use to transportation, especially public transit. We have developed a land use and transportation system that only serves people well when they travel by car. Promoting a more compact pattern of land use, denser development with a mix of uses, in walkable neighborhoods and districts along “complete streets” can bring destinations closer together to make walking, biking, and using transit more attractive, even as it allows those who choose to drive to continue doing so. Approximately six in ten adults in Buffalo Niagara are overweight or obese, so more active transportation options can bring added health benefits to our region as well. How this type of development can be accomplished will be addressed in many elements of the plan discussed below and links to a series of recommendations in the section on transportation.

Protect farmland, watersheds and natural areas. The sustainability of our way of life depends, ultimately, on the health of our environment. Protecting our farmland will give us greater food security in the years to come. Safeguarding our waterways and watersheds will ensure the health of both land and water. Natural areas both within the urbanized area and in rural lands beyond provide “environmental services” – a technical way of saying they filter our water, recharge our aquifers, absorb storm water, provide shade to cool our cities, provide habitat for animals and more. Sections later will detail how we protect these areas, working in partnership with the many community and public sector stakeholders. This may include local cooperative extensions, soil and water conservation districts, environmental groups like the WNY Land Conservancy, Buffalo Niagara Riverkeeper, the WNY Environmental Alliance, and the WNY Stormwater Coalition, local and county governments, federal and state partners like the NYS Department of Environmental Conservation and US Army Corps of Engineers, among others. Our values and land use priorities expressed in the scenario planning exercise emphasize the desire to preserve these lands from development.

MOMENTUM TO BUILD ON The University at Buffalo School of Medicine and Biomedical Sciences building at Main and High Streets will be the largest transit oriented development project in the region to date, connecting directly to the Allen Medical Campus Metro Rail station to give employees, patients and visitors an attractive alternative to driving their car to the Buffalo Niagara Medical Campus. Encouraging travelers to shift travel modes will save energy, carbon emissions and space for parking.

One Region Forward: A New Way to Plan for Buffalo Niagara

59


A NEW WAY TO PLAN | HOW DO WE GET THERE?

Manage the cost of public services. One of the major features of “sprawl without growth” is the continuing extension of our public infrastructure – sewers, water and roads, but also schools, libraries, parks and more – to serve a smaller number of people. Each additional mile of infrastructure and each new square foot of building space is both a new capital cost and a new long-term maintenance obligation which falls directly on the shoulders of local taxpayers. Over time, we can reduce the costs of local government, utility service, public education and more by developing according to our values and working to make provision of a range of public services more efficient.

What if each and every rural town had the capacity and resources to preserve their agricultural lands and open spaces?

Pursue shared services agreements, public-private partnerships and consolidation. Create partnerships for provision of water, sewer, police, fire, parks, highway maintenance and other services to manage capital investments, manage operating costs and improve service quality. The possibilities require careful study to make sure they will achieve the stated goals and determine which approaches are likely to work best for which kinds of services. Decision-makers require reliable evidence-based policy advice before approving such structural changes. Partners in the region should consider sponsoring a comprehensive study of the opportunities.

Address education needs regionally. Enrollments are declining in many public and parochial schools. Some school facilities are new or recently renovated. Others are aging and some are empty. Meanwhile, there are great disparities in educational outcomes from one community to the next. At the same time, perceptions of school quality have a big impact on where people choose to live. Since these challenges impact a number of districts we need a regional strategy not only to control the cost of education but to ensure access to a high quality education for all. As a region, government, educational, and civic leaders should begin discussing a way forward together.

MOMENTUM TO BUILD ON Private donors to the Western New York Land Conservancy are investing in the permanent protection of scenic and environmentally sensitive lands around the region. The Mill Road Overlook in the Town of Aurora was preserved from development in perpetuity in 2013. The Stella Niagara Preserve in Lewiston will save for future generations 29 acres and a quarter mile of shoreline along the Niagara River, for which a $3.2 million capital campaign is underway. wnylc.org

60

One Region Forward: A New Way to Plan for Buffalo Niagara


Redesign revenue-raising structures to promote land use goals. Tax policy is part of the system that has promoted our sprawling and inefficient pattern of land use over recent decades. The structure of local property taxation, for example, prompts municipal leaders to pursue new development to generate new revenues only to see that development create more demand for service in response. We need a revenue structure that promotes our land use goals, fosters real economic development, and produces adequate revenue for operation of local governments and public education and infrastructure maintenance.

What if thousands of acres of old industrial lands were cleaned up and made ready for redevelopment?

Review local revenue-raising structures. The need to generate local revenue to fund vital public services is often at odds with the goal of promoting a more efficient pattern of development. A new study of the Buffalo Niagara Region by Joe Minicozzi at Urban3 demonstrates how “smart growth” projects contribute much more to the tax base of municipalities where they are located than conventional sprawl development. Further investigation should guide development of revised revenue-raising mechanisms to promote more efficient forms of development and discourage sprawl.

Consider tax increment financing. New investments generate new tax revenues. Tax increment financing through PIFs (PILOT payment Increment Financing) offers a way to capture these growing revenues. The PIF dedicates payments from projects that qualify for PILOT’s (payment in lieu of taxes), beyond what the municipality was already earning in taxes, to help finance site preparation and infrastructure development for transit oriented development, urban infill, and “smart growth” projects.

Align economic development incentives with “smart growth” policies. Economic development entities in the region typically provide incentives for job growth through provision of local tax abatements. As the Western New York Regional Economic Development Council has done, agencies should adopt decision-making criteria to make sure such incentives go to support projects consistent with “smart growth” policies in terms of location, design, connection to transportation networks, investments in green energy and energy efficiency, and focus on new rather than locally relocated jobs.

MOMENTUM TO BUILD ON Brownfield reclamation and redevelopment efforts are quickly becoming some of the region’s greatest smart growth success stories. We hear a lot about SolarCity building the largest solar manufacturing facility in the Western Hemisphere on the remediated Republic Steel site known as the Buffalo High-Tech Manufacturing Innovation Hub at RiverBend. But there are dozens of other success stories across the region, including the the Niagara County Brownfields Program which has secured millions in grant funding for cleanup efforts, completed 125 environmental site assessments, and created a local development corporation to manage and implement a revolving loan fund.

One Region Forward: A New Way to Plan for Buffalo Niagara

61


A NEW WAY TO PLAN | HOW DO WE GET THERE?

Establish mechanisms to manage brownfields and declining neighborhoods. Deindustrialization, population decline, and churn in regional housing markets have left a legacy of damaged industrial land and buildings and vacant and abandoned homes and lots. We need to improve our ability to bring these kinds of properties back to useful and taxable purposes and to encourage new infill development on these sites.

Strengthen the land bank.

What if every local land use decision considered the impacts it would have on our waterways?

Erie County took a big step forward recently in the creation of the Buffalo Erie Niagara Land Improvement Corporation – a land bank – with hopes to include Niagara County soon. The land bank will have the authority to acquire, hold, maintain, redevelop, and re-market abandoned homes and land. A $2 million allocation from the Office of the Attorney General in 2013 has made it possible to get the land bank up and running.

Redouble brownfields efforts. The City of Buffalo and Niagara County have both been aggressive in the use of the Brownfields Opportunity Area, Brownfield Clean-up, and Environmental Restoration programs to plan for the clean-up and reuse of old industrial sites. Niagara County, in particular, has developed a best-in-category program for these sites. However, enabling legislation is set to expire. Regional leaders should re-emphasize these programs and advocate to extend them.

Continue to promote “shovel ready sites.” State, county and local governments should collaborate to expand assessments, develop a regional inventory, and provide marketing strategies for vacant, under-utilized and brownfield properties within the framework of a region-wide land use concept and consistent with “smart growth” principles. This should include encouragement to municipalities to preserve and properly zone larger-scale sites with potential for research and development, technology, manufacturing or distribution activities.

Expand use of historic preservation tax credits. Adaptive re-use and preservation of historic buildings, including old industrial facilities, among others, can be an important part of smart redevelopment. Expand promotion and training for use of federal and state historic preservation tax credits and related programs.

MOMENTUM TO BUILD ON How and where we develop has far-reaching impacts on our rivers, streams and the two Great Lakes framing our region’s geography. Buffalo Niagara Riverkeeper has been working to bring issues of watershed restoration and land use to the forefront through their various educational and cleanup programming. Their Niagara River Habitat Conservation Strategy outlines the best opportunities to protect and restore our natural living infrastructure in the Niagara River Watershed. bnriverkeeper.org

62

One Region Forward: A New Way to Plan for Buffalo Niagara


Create a regional “Main Street” organization. The National Main Street Center has provided an extraordinarily successful model for strengthening the commercial centers of small towns and villages. A partner organization for Erie and Niagara Counties that all municipalities could access could help implement citizen visions for redevelopment of villages in the region to be like they are now only better. This could become a program of an existing organization, build on an existing program like the one in Lockport, or a new regional not for profit could be created.

Promote a more compact pattern of development. As noted throughout the plan, our current pattern of dispersed development carries costs in energy consumption, land use, transportation demand and otherwise that we need to contain. A more compact pattern of development can help us make land use and transportation more efficient and protect natural and agricultural lands.

Provide capacity for municipalities to revise zoning codes. Authority for land use controls remains with cities, villages and towns. All municipalities should be encouraged to update their zoning codes to promote mixed uses, allow more intensive development in hubs and corridors, and protect valuable natural and agricultural lands from development. With tight budgets and limited or no planning staff available in many municipalities, One Region Forward recognizes the need for technical assistance and capacity support to assist cities, towns and villages accomplish this important task.

Promote form-based codes. An increasingly popular approach to development regulation focuses on the control of the built form as much as land use. The City of Buffalo has pioneered the adoption of form-based code in Western New York – a new ordinance that will promote the redevelopment of the city as walkable, mixed use and dense while retaining the prevailing character of its great neighborhoods. Best practices in the One Region Forward “tool-kit” – including those from Buffalo – should encourage other municipalities to develop and adopt their own form-based codes.

Locate new public facilities strategically. Schools, university facilities, government buildings, cultural venues, sports facilities and entertainment centers can give density and vitality to urban places – or they can generate auto-oriented transportation demand on suburban sites. Encourage the sponsors of such facilities to choose locations that are well-served by bus, rail, bicycle and walking. Make sure they are also connected with restaurants, shops and housing that can benefit and be benefited by proximity to these facilities. One Region Forward: A New Way to Plan for Buffalo Niagara

63


A NEW WAY TO PLAN | HOW DO WE GET THERE?

Protect and restore natural places and farmland. Because streams and stream corridors, woodlands, wetlands, and farmland – in crops or fallow – encompass a wide range of environments and provide a variety of benefits, an array of strategies are also needed to protect them.

Complete the inventory of natural places and farmland. Making informed decisions about how to protect these resources requires complete and accurate information on what they are. A number of different agencies and not-for-profit organizations have undertaken some part of this task – or are working on it now. Partners working in land conservation and stewardship should convene a working group to create a single complete data base, assembling and coordinating the pieces that are already complete and filling in with additional survey work where gaps exist.

Quantify the economic impact of parks and open spaces. It is sometimes imagined that parks and open spaces are amenities without a discernible dollar value. But these lands support job-creation, enhance property values, or provide environmental services that would be expensive to provide otherwise. Build on the work of the Buffalo Olmsted Parks Conservancy and the Buffalo Niagara Riverkeeper to document the argument for investments in parks, trails, and preserved open spaces.

Update or create local protection plans. Many towns already have open space or farmland protection plans. These can bring the broader policies to ground in each jurisdiction. Where these exist they may need to be updated. Where they are missing, localities should work to create them, in part to identify lands for purchase.

Preserve land through purchase and conservation easement. There are two common and secure ways to protect land from development, conservation easements and the outright purchase of land. A range of programs that do this already exist, and land trusts are supporting these efforts, but more needs to be done. By passing open space bonds, municipalities like Clarence have used their own funds and a combination of these methods to protect natural and farm land. The Federal Natural Resources Conservation Service has an Agricultural Conservation Easement Program to support the purchase of development rights. New York State Department of Agriculture and Markets reinitiated its farmland protection grant program in 2014. And the Niagara River Greenway pays to protect open space. But we need advocacy to make permanent the federal tax incentive to donate conservation easements, to expand the farmland protection program in New York State and to raise revenue to purchase valuable lands for permanent preservation. 64

One Region Forward: A New Way to Plan for Buffalo Niagara


Protect and restore water quality and quantity. Water flows over and through the land. Thus, how we use land, design buildings and create infrastructure can have a big impact on the quality and quantity of water. We need to understand better what policies and practices degrade our waters and which protect them. However, there are some things we can do right away to improve the situation.

Remedy sewer overflows and stormwater pollution. In municipalities like Buffalo, one system handles both sanitary sewage and storm water. When heavy rains fall, the capacity of the water treatment plant is exceeded and a combination of sewage and runoff is discharged directly into regional waterways. Some combination of “gray infrastructure” and “green infrastructure” can make such events less frequent or severe while working toward meeting federal mandates to resolve the problem.

Address federal areas of concern. Polluted waters and underwater sediments are another part of Buffalo Niagara’s legacy of industrialism. The International Joint Commission has identified both the Buffalo and Niagara Rivers as Great Lakes Areas of Concern (AOC). Through the Federal Remedial Action Plans (RAP) program, significant progress has been made in resolving beneficial use impairments in support of de-listing the Rivers. Supporting implementation of the Buffalo and Niagara River Remedial Action Plans will be important for the region.

Promote green infrastructure development and green development practices. In the long run one of the most effective ways to address the Combined Sewer Overflow (CSO) issue, as well as water quality and quantity issues is to retain storm water on site. Rain barrels, rain gardens, bioswales, graywater recycling, detention areas, wetland preservation and related tactics can reduce storm water demands on waste water treatment plants, conserving energy and promoting groundwater recharge. New storm water regulations make much of this mandatory for new development.

Plan with the watershed in mind and review land use practices for water impacts. Our watersheds transcend municipal, county and even state and national boundaries. What happens in Lancaster and Cheektowaga, for example, determines, in part, the quality and quantity of water in the Scajaquada Creek as it flows into the Niagara River in Buffalo. The Buffalo River watershed encompasses lands in many towns and two counties – Erie and Wyoming. The Niagara River watershed also includes a significant area of land. As a guiding principle for all of our planning, we must keep in mind that land uses in natural areas, not political jurisdictions, affect the quality and quantity of our waters. One Region Forward: A New Way to Plan for Buffalo Niagara

65


A NEW WAY TO PLAN | HOW DO WE GET THERE?

Big

Ideas

Connect Our Places by Expanding and Diversifying Our

Transportation Options

66

One Region Forward: A New Way to Plan for Buffalo Niagara


Transportation is the thing that connects anything in our region with everything else. It is how we get to work, school, shopping, health care, recreational opportunities and more and it is how we get home again. To put it another way, transportation is the thing that opens up nearly every opportunity we enjoy, the thing that makes most of our choices real. For most people in region today, that means driving a car. The current average annual cost of owning and operating an automobile ranges from $8,000 a yeari on up depending on the value of the car and the amount of driving one does. But there are other costs as well – in time spent driving, the costs to government to maintain roads and highways, the carbon emitted into the atmosphere from burning gasoline, loss of life and limb for accidents involving motorists, cyclists and pedestrians, the health impacts of air pollution and more. For those who cannot drive, such as young people and some seniors and persons with disabilities, for those who choose not to drive, and those who simply can’t afford a car – the costs are far higher in terms of lost or limited access to job opportunities, education, recreation, health care, shopping and the simple loss of independence. The crux of the problem is that our long-term dependence on the automobile has promoted a land use and development pattern that can reasonably be served only by the automobile itself. Streets and roads designed for the car are unfriendly to people on bicycles or on foot. Distances that are easy for motorists to travel are difficult or impossible for those using other modes.

The dominance of the automobile has been especially devastating for public transit. As our cardependent region spread out, the transit system could not afford to follow. Longer suburban bus routes cost more to operate and drew fewer riders. Transit entered a vicious downward spiral of fewer riders, less revenue and cuts in service, which led to still fewer riders, less revenue and additional cuts.

WHAT DOES THE DATA TELL US ABOUT WHAT WE ARE DOING?

In addition to our public transit system, our current freight transport system faces efficiency challenges. Our regional competitiveness in the global marketplace depends on the roads, rails, airplanes, ships, and warehouses that allow local companies to get their products to market. According to IHS Global Insight forecasts, regional freight volume is projected to double as early as 2035.ii To ensure that our region can effectively meet current and future freight demands and be competitive, key infrastructure improvements are needed to better facilitate the movement of goods.

Our transit ridership is up recently, but way down over the long term.

Along with the opportunity freight holds for our region is the $1.4 billion industry in transportation and logistics that Buffalo Niagara is well-positioned to share. Logistics is an industry that helps our local companies reach their market. It is also an industry in itself that can provide jobs, income and wealth.

We have more cars on the roads and travel more miles, contributing more to pollution. We spend more time commuting. Our transit service in a sprawling region is often inconvenient and timeconsuming. Few of us live near transit service.

For many of us, public transit is a necessity, not a choice.

TOOLS FOR GREATER UNDERSTANDING The City of Buffalo’s Complete Streets policy and the Buffalo Green Code. The Niagara Frontier Transportation Authority’s Metro Amherst-Buffalo Corridor Alternatives Analysis. The Greater Buffalo Niagara Transportation Council Metropolitan Transportation Plan for 2050, now being developed in concert with One Region Forward.

One Region Forward: A New Way to Plan for Buffalo Niagara

67


A NEW WAY TO PLAN | HOW DO WE GET THERE?

WHAT THE COMMUNITY SAID THEY VALUE What 115 Maps Tell Us -------------

WHAT THE DATA TELLS US We drive more than twice as much as we did in 1970. DAILY VEHICLE MILES TRAVELED PER CAPITA, 1970 AND 2010

1970

8 miles

On average, participants added

2010

18 miles

miles of recreational/ bike trails per map.

106

Source: Greater Buffalo Niagara Regional Transportation Council, 2011.

out of 115 maps

said that “increasing the ways we can “get around without a car” was a guiding principle.

92%

of all maps listed the need to increase and extend public transit as a guiding principle.

We commute to work by car more and take transit less. COMMUTING MODES, 1970 AND 2010

In 1970,

1 out of 10 workers commuted via

82% 67%

public transportation.

1970

Today, less than

2010

1 out of 25 workers commute via public transportation.

12%

What Else We Heard ----------------

Use rails and transit

Drive Alone

to capitalize on Niagara Falls tourism.”

10%

8%

Car Pooling

frequencies to around 10 minutes for core bus routes.” - Citizen feedback through Text It Forward survey

Rails-to-trails, particularly for

connecting rural areas with other parts

of our region, are a strategy we need to pursue.” - Feedback from a member of

3%

2% 1%

2% 2%

All Other Means*

Worked at Home

Source: US Census Bureau, 1970; American Community Survey, 1-year Estimates, 2010.

How we commute in our region is a reflection of how much we earn. MEDIAN ANNUAL INCOME BY MEANS OF TRANSPORTATION TO WORK, 2006-2010 Buffalo Niagara Workers US Workers All Workers Drive Alone Public Transportation $0

$5K

$10K

$15K

$20K

Source: US Census Bureau, American Community Survey, 2006-2010 5-year Estimates.

the Private Sector Council

68

7%

Public Walking Transportation

- Citizen participant at a Mapping Workshop in Niagara Falls

Increase peak hour service

4%

One Region Forward: A New Way to Plan for Buffalo Niagara

$25K

$30K

$35K

Across the US, workers who use public transit earn almost as much as workers who drive alone, but in Buffalo Niagara, workers who use public transit earn only half as much as those who drive alone.


WHAT WE COULD DO DIFFERENTLY Public bus routes are extensive, but stops are often infrequent. For tens of thousands of people who do not have a car, travel is often inconvenient and timeconsuming. Workers who take public transit are eight times more likely than those who drive alone to spend two hours or more in their daily commute. BUS FREQUENCY IN BUFFALO NIAGARA

< 15 min 15 - 30 min 30 - 45 min > 45 min

Develop a regional “hub and corridor” transportation system.

p 70

Create innovative financing mechanisms.

p 73

Create a Buffalo Niagara International Trade Gateway.

p 74

Notes: Bus frequency is calculated as the average time between all NFTA bus route stops (2013) during peak hours (6-9am and 3-6pm on weekdays) for each street segment with bus service.

Public transportation is not an option for many in the region. PEOPLE

1/2 mile

Buffalo Niagara’s 26% ofpopulation lives

within easy access to public transportation.

JOBS

1/2 mile Source: UBRI Analysis using data from US Census, 2010, and NFTA, 2012.iii

Niagara’s 31% ofjobsBuffalo are located within easy access of public transportation.

One Region Forward: A New Way to Plan for Buffalo Niagara

69


A NEW WAY TO PLAN | HOW DO WE GET THERE?

WHAT WE COULD DO DIFFERENTLY RECOMMENDED STRATEGIES AND ACTIONS

Develop a regional “hub and corridor” transportation system. Although decades of “sprawl without growth” have created a land use pattern for which it is increasingly difficult to provide convenient and energy efficient transportation service, the historic pattern of development in our region still offers an opportunity to match transportation – and transit – to land use. The region grew up along the major arteries emanating from Buffalo and Niagara Falls and in outlying villages connected to them, creating a system of hubs and corridors (e.g. Broadway as a corridor with hubs at Fillmore Avenue, and the villages of Depew, Lancaster and Alden). If we concentrate development of jobs, housing and infrastructure in these hubs and corridors, we can create a pattern that is more efficient and can be better served by transportation.

What if public transit was extended where there is demand?

High quality transit. The past decade has seen steady growth in transit ridership after decades of declining ridership, falling revenues, and service cuts. Elimination of federal operating subsidies and constraints on state support have compounded the loss of farebox revenues. Previous service cuts continue to limit ridership growth and the revenues that would come with it. All of this has occurred during decades of sprawl without growth and rising automobile use. Recent growth in ridership, however, combined with developments in the Metro Rail corridor and future plans by the Seneca Nation of Indians to establish a Transit Center in the Irving, NY area of the Cattaraugus Territory and incorporate additional routes to better link the Territories and the Southern Tier to the Buffalo Niagara urban area, offer a ray of hope that the situation can be significantly improved. A program of targeted service improvements, partnerships with major institutional destinations (e.g. the Buffalo Niagara Medical Campus), and well-designed incentives and promotions could shift the momentum in favor of transit. None of this, however, can happen without additional funding. The region should make transit funding and system improvement a top priority for advocacy and action. Additionally, concentrated development patterns that promote walking and may effectively be served by transit can reduce transportation costs for users as well as the costs of public services and infrastructure. This in turn can increase the return on investment as the result of land development used at its best and highest value, resulting in an increase in sales and property tax receipts.

Transit Oriented Development (TOD). Transit Oriented Development, in which new homes and apartments, offices and shops are built in close proximity to high quality transit service – especially rail transit – has proven in many cases around the nation to be a good way to improve land use, neighborhood quality, and

70

One Region Forward: A New Way to Plan for Buffalo Niagara

MOMENTUM TO BUILD ON The Niagara Frontier Transportation Authority has planning under way with an analysis of alternatives for transportation improvements in the “Buffalo-Amherst Corridor.” Because of growth in the Buffalo Niagara Medical Campus and in Amherst the area has been identified as most likely to draw ridership needed to support high quality transit improvements. That might include an extension of Metro Rail, new Bus Rapid Transit, enhanced bus service, or other investments. The corridor also has high potential for promoting dense mixed use development that will further promote access to transit and growing ridership. to.nfta.com


transportation access. The University at Buffalo’s forthcoming School of Medicine building atop the Allen-Medical Campus Metro Rail station is a good example of TOD. The NFTA, Buffalo Urban Development Corporation and private developers should work together on other pilot projects along the light rail line. Pilot projects and other TOD planning efforts should include ways in which affordable housing may be incorporated in these development efforts to provide people of all ages and incomes with improved access to transportation, jobs and housing choices.

Joint development as a value capture strategy. The concept of joint development opens the possibility of coordinating investments in transit infrastructure with investments in new buildings to reinforce the relationship between transportation and land use. Aligning public and private investments helps ensure that both will enjoy a suitable return.

What if we made it easier to drive less?

Complete streets. If we want to promote alternative modes of travel – walking, cycling, transit, etc. – we need to provide the environment and infrastructure to make it safe, comfortable, and interesting for those travelers. A comprehensive concept has been developed to accomplish this – commonly called “complete streets” – which provides for ample sidewalks, street trees, on-street parking, bike lanes and other aspects of street infrastructure design to make pedaling, walking or waiting for a bus more attractive. The good news is complete streets can often be achieved within existing budgets. Incorporating bike lanes or crosswalk treatments into routine tasks such as paving and restriping provides opportunities to implement complete streets across the region. Many small, low-cost improvements can, when thoughtfully implemented over time, create a much friendlier and safer environment for everyone.

Corridor makeovers. Part of the difficulty in promoting alternative modes of travel can be seen in the character of many suburban “main drags,” where multi-lane roadways without sidewalks serve retail establishments with big set backs and big parking lots. These environments make walking, waiting for a bus, or riding a bicycle not only unpleasant, but often downright dangerous. Developers in many places, however, have shown how such environments can be transformed, step by step, by bringing activities to the building line, tucking parking in back, creating pleasant sidewalk paths, and throwing in a bit of complete streets to boot. Work to remake the Village of Williamsville is headed in this direction. A pilot project on Transit Road, Niagara Falls Boulevard or McKinley Parkway could show the public what might be possible in the transformation of our least pedestrian friendly environments.

Bicycle infrastructure and incentives. A crucial element in promoting travel by bicycle – not just for recreation, but for getting from here to there – is to provide the appropriate infrastructure to make it safe and convenient – on the way to and at the destination. Regional and municipal officials should work with bicycle advocacy groups to promote development of bike lanes on streets and

MOMENTUM TO BUILD ON Buffalo CarShare provides a great option for people who can’t afford or don’t want to own a car. Members pay a low annual fee and reasonable hourly and daily rates to use vehicles stationed conveniently around Buffalo neighborhoods. CarShare helps reduce energy consumption by promoting less driving. It helps household economics where automobile ownership is not in the budget. It also provides a locally-owned alternative to national corporate car-share companies. CarShare has 500 members 15 cars – and a pick-up truck – with plans to grow to 30. buffalocarshare.org

One Region Forward: A New Way to Plan for Buffalo Niagara

71


A NEW WAY TO PLAN | HOW DO WE GET THERE?

“sharrows” where pavement widths are inadequate for bike lanes. The partnership between the City of Buffalo and GO Bike Buffalo to create a bicycle master plan for Buffalo is a great example and may serve as a resource for other communities in the region in how to become more bike friendly. Major employers should also be encouraged to offer financial incentives to promote biking and other non-motorized commute options to work, such as a parking cash out program. A significant number of employers provide free or reduced price parking for their employees as a fringe benefit. Under a parking cash out requirement, employers are allowed to continue this practice on the condition that they offer the cash value of the parking subsidy to any employee who does not drive to work.

What if more employers offered alternatives to driving?

Innovative parking programs and management. Performance-based pricing is a parking management system that is responsive to fluctuations in demand and compatible with existing parking technologies (primarily parking pay stations). Performance prices for curb and other parking locations can yield ample public revenue as demonstrated by performance based programs implemented in Seattle, WA, Pasadena, CA, Washington, DC and others. In turn, many communities and districts have dedicated these funds to help pay to clean and maintain sidewalks, plant trees, improve lighting and provide other public improvements. The implementation of performance-based parking pilot programs in strategic locations in the Buffalo Niagara region could help address needed infrastructure improvements and ongoing maintenance of public facilities.

Establish transportation management associations. The Buffalo Niagara Medical Campus Inc. has been a local pioneer in bringing together multiple organizations to promote alternative transportation options collaboratively. This includes managing parking options, installing alternative fuel vehicle infrastructure, making accommodations for bicycle commuters, and promoting the use of public transit by employees and visitors to partner organization workplaces. This approach could be scaled up for an even larger district, such as an entire downtown, or the entire region.

Embrace emerging technologies. We can’t know exactly how new technologies may change our world, but emerging technologies such as vehicle automation and semi-automation, solar freeways and parking lots, smart transportation cards and others may help us get the most out of our existing infrastructure, improving safety and reducing emissions in the region. Incorporating these technologies will be necessary for a robust regional hub and corridor system going forward.

MOMENTUM TO BUILD ON The Buffalo Niagara Medical Campus has made a strong commitment to providing alternative ways to commute to the growing downtown hub. Its Transportation Demand Management programs include bicycle sharing, secure bicycle storage, and charging stations for electric cars. Their parking lot also features “green” elements such as solar and wind-powered lighting and on-site storm-water management.

bnmc.org

72

One Region Forward: A New Way to Plan for Buffalo Niagara


Create innovative financing mechanisms. The stark reality is that the improvements we seek in transportation are largely not possible without new sources of revenue. The Federal Highway Trust Fund, fed by a fixed 18.4 cent per gallon gasoline tax, produces less revenue (in inflation adjusted dollars) today than twenty or thirty years ago and is on the verge of bankruptcy. Support for public transit continues to be inadequate, with NFTA farebox revenues combined for metro bus, rail and paratransit service less than 30 percent of operating costs.iv

Advocate for highway trust fund reform.

What if all our village centers were more pedestrian friendly?

Leaders in business, government, health care, higher education and other sectors should work together to advocate for reform in the Federal financing system for transportation. As vehicle miles traveled declines and fuel economy improves the per-gallon (not a percentage) tax on gasoline generates less and less revenue. At the same time many infrastructure needs go unmet and construction costs soar. Reform of the highway trust fund needs to ensure significant increases in revenue for transportation and to carve out a larger proportion of revenue raised for transit, cycling, and redesign of transportation corridors.

Advocate for increased state investment. New York State provides capital funding for transportation projects and operating assistance for transit, as well as matching funds for a range of federal transportation programs. Unfortunately, these sources of funding are proving inadequate in the long run to meet regional needs. While we’re waiting for Congress to act on the Federal Highway Trust Fund, the regional planning network also needs to press state leaders for greater funding for transportation projects. According to a recent report by the American Petroleum Institute, New York States collects 49.86 cents/gallon in gasoline taxes. This rate does not include the additional 18.4 cent federal excise tax.v The original purpose of this fund was to assure reliable, predictable investment in the future of the State’s transportation infrastructure to keep our roads and bridges in good repair. However, three quarters of the dollars from New York’s motor fuel tax are now being used to pay for borrowing and operating costs of state agencies, leaving only 22% for capital construction to improve our infrastructure in State Fiscal Year (SFY) 2012-2013.vi

Develop options for regional financing. We need the federal and state governments as active partners. Ultimately, however, if we hope to build a modern transportation system to support our 21st century economic growth, we may have to raise some of the money to do so in our own backyard. Despite presumed public antipathy to taxes, a referendum on specified tax and fee increases for clearly-targeted and well-explained projects supported by community leadership could pass. There are many options for financing, such as

MOMENTUM TO BUILD ON The Village of Williamsville is working to transform its Main Street business district with strategic improvements to the streetscape infrastructure – new street tree plantings in “structural soil” that makes trees healthier, new pedestrian scale street lighting, sidewalk rain gardens to capture and filter stormwater, sidewalk bumpouts that making crossing safer – and host of other investments in making the village safer and more attractive.

picturemainst.com

One Region Forward: A New Way to Plan for Buffalo Niagara

73


A NEW WAY TO PLAN | HOW DO WE GET THERE?

San Diego’s TransNet program. Currently, there are over ten different transportation financing related ballots in counties around the country to be voted upon in the November 2014 election.vii But, the first step in Buffalo Niagara is to put revenue raising for transportation on the public agenda. Success would mean, not only being able to finance projects that are consistent with regional goals and plans, but bring efficiencies in project delivery not possible under federal rules and procedures.

Create a Buffalo Niagara International Trade Gateway. The Buffalo Niagara region is well positioned for Cargo-Oriented Development (COD). COD may be defined as the development of places that are both multi-modal nodes of freight transportation and centers of employment in logistics and manufacturing. The region has powerful assets to help it take a more prominent role in the global trade, transportation, logistics and supply chain industry. These assets include a strong advanced manufacturing base, proximity to the Greater Golden Horseshoe Region of Toronto, providing access to the 4th fastest growing market in North America, strong physical infrastructure in road, rail, air and short sea shipping capabilities and unmatched “soft infrastructure� of import/export expertise, including customs brokers, third-party logistics, legal and financial specialists and others. Logistics is a $1.4 trillion industry annually in the US and Buffalo Niagara is wellpositioned to claim more than its share. Just as important, the resurgence of manufacturing in our region will get a major boost from close connections to improved logistics services. Production of goods and their delivery to market are more time sensitive than ever before. To grasp this opportunity, Buffalo Niagara should create an integrated center for transhipment, storage, collection and distribution of goods, regionallycentered around a convergence point of rail lines, truck routes, water shipping routes and air transport modes and facilities. Some elements of the work include:

Advance the International Trade Gateway Organization. In June 2014, International Trade Gateway Organization, Inc. (ITGO) was officially created to implement the ITGO Strategic Plan. Immediate next steps including securing resources to support the hiring of an executive director and a marketing campaign which experience from other regions suggests are necessary elements required to develop and implement the gateway initiative. Other early ITGO steps are also focused on expanding relationships with the Western New York Regional Economic Development Council (WNYREDC), inclusion of logistics into ongoing regional planning efforts, building communications and government relations capacities and forging a connection with the Port Authority of New York and New Jersey to gain status as a designated inland port.

Build the physical infrastructure for trade. While the two Class 1 rail lines and other existing transportation infrastructure in the region is robust, certain strategic capital projects need to be undertaken to strengthen the network. These include

74

One Region Forward: A New Way to Plan for Buffalo Niagara


improvements to plaza renovations at both the Peace Bridge and Lewiston-Queenston Bridge, taking advantage of excess capacity at the Niagara Falls International Airport, and replacement of the Portageville, NY railway bridge – a very weak link in rail connections between port facilities in New York/New Jersey and Buffalo Niagara which is entering the final stages of the environmental review process.

Advance key policy initiatives. Border crossing procedures, the workforce “pipeline� for logistics specialists, and overall federal funding for transportation infrastructure are all key issues for continued development of the Buffalo Niagara International Trade Gateway and require timely action on policy. A pilot project is underway by the US Department of Homeland Security and the Canadian Ministry of Defense on procedures for pre-clearance for trucks and to facilitate legitimate border crossings in general. Broader application of new procedures is needed. Coordination with WNYREDC and the regional workforce development system is needed to beef up training programs for logistics professionals.

Research key issues in logistics. Advancing the development of the Buffalo Niagara International Trade Gateway will require better answers to key questions about the regional logistics system. This will require research and analysis on current rail usage and bottlenecks, the potential for increased water-borne transport on the Great Lakes, assets and needs for warehouse space and sites, supply and demand for personnel in key specializations, and outreach to international shippers to better understand the market and its needs.

One Region Forward: A New Way to Plan for Buffalo Niagara

75


A NEW WAY TO PLAN | HOW DO WE GET THERE?

Big

Ideas

Provide

Housing Choices

in Neighborhoods that are Great Places to Live

76

One Region Forward: A New Way to Plan for Buffalo Niagara


Creating and maintaining quality housing and great neighborhoods are central to making Buffalo Niagara better for everyone. Where we live impacts how we live and respecting our history, embracing existing neighborhoods while preparing for communities of tomorrow will ensure all residents have access to housing choices throughout the region.

Our homes are essential to our identities as individuals and vital to the lives of our families. Our homes and neighborhoods influence our health and shape our opportunities. They frame our access to school, work, shopping, recreation and more. For some, a home is their biggest investment; for others it is their largest monthly expenditure. Housing and neighborhoods are also crucial to our work toward a more sustainable regional way of life. Our homes influence how much energy we use for heating, cooling, and, increasingly, for appliances from stove and refrigerator to air conditioner and dishwasher to computer and big screen television. Our neighborhoods – where they are and how they are connected – have a lot to do with how much energy we use for transportation and how we use the land in our region. The good news is that Buffalo Niagara, in general, has strong housing resources and a variety of great neighborhoods. The rest of the story is that much of the housing in our central cities – Buffalo, Lackawanna and Niagara Falls – has become vacant, dilapidated, and in many cases, demolished. The value of much of our housing in our first-ring suburbs has stagnatedi because of shifts in demand and the aging of the stock. Many suburban homes are slow to sell and some are also vacant.

Meanwhile, much housing has been built on the periphery of the region, often disconnected from the framework of neighborhoods, and generating new energy demand in the form of long commutes and larger interior spaces to heat and cool. Put together, sprawl without growth has meant we are abandoning centrally located houses to build rural houses and the new infrastructure that goes along with them.

WHAT DOES THE DATA TELL US ABOUT WHAT WE ARE DOING?

The future will be a challenge. Housing demand is shifting dramatically – as our current population continues to age, younger generations seek new forms of housing, more people choose to live alone, and families with children decline as a proportion of all households. At the same time, housing supply – and the neighborhoods that support housing – doesn’t always fit the demand.

Vacancy rates are particularly problematic in our central cities and first-ring suburbs.

We build bigger homes but have smaller households. Our new housing units don’t accommodate a changing population. Renters in our region are more likely to be burdened by housing costs. Our housing supply continues to far outpace demand. Communities in our region are plagued by vacant homes.

Our aging population and preferences of millenials don’t mix with sprawling neighborhoods.

TOOLS FOR GREATER UNDERSTANDING Housing for Complete Communities and the Fair Housing Equity Assessment Housing and Neighborhoods Strategy Document

Equity and Opportunity Strategy Document

Fair Housing Equity Assessment Expanding Opportunity in Buffalo Niagara Fair Housing Equity Assessment was prepared by the University at Buffalo Regional Institute in partnership with Make Communities, LLC DECEMBER 2014

Housing and Neighborhoods Strategy Document

Complete Communities for a Changing Region Housing and Neighborhood Strategies to Move One Region Forward Complete Communities for a Changing Region was prepared by the University at Buffalo Regional Institute in partnership with Make Communities, LLC DECEMBER 2014

One Region Forward: A New Way to Plan for Buffalo Niagara

77


A NEW WAY TO PLAN | HOW DO WE GET THERE?

WHAT THE COMMUNITY SAID THEY VALUE

WHAT THE DATA TELLS US Homes are bigger but households are smaller.

What 115 Maps Tell Us ------------Participants placed

91% 9%

of new homes in mixed-use neighborhoods,

but only

in places that would have single-family homes only.

1970

AVERAGE SIZE OF HOUSEHOLD

2010

We keep building bigger homes… even though fewer people of building issued from live permits in them.

1,755 SQ FT

AVERAGE SIZE OF HOMES

3.2

2,301 SQ FT

2.3

people28% per household2000 to 2010 were for single-family homes

people per household

Source: NYS Department of Taxation and Finance, Office of Real Property Tax Services, 2010. Source: US Census Bureau, 1970, 2010.

maps listed ‘Revitalizing Urban Neighborhoods’ as a guiding principle.

75% of building permits issued from

2000 to 2010 were for We are building the same types of homes, but single-family homes households are changing…

BUILDING PERMITS 2002-2010, SINGLE FAMILY HOMES WITH CHILDREN 2012

building permits issued from 2000 to 75% of2010 were for single-family homes.

28% of households are families with children.

What Else We Heard ----------------

People working

Source: U.S. Census Bureau, Building Permits Survey, 2012; American Community Survey, 2012 1-year estimates.

closer to where they live.”

- Citizen participant at a Mapping Workshop held in Niagara Falls

We do have great buildings with great bones, and we have great neighborhoods but we also have some that have come back (e.g. West Village, Grant Street). We have some other neighborhoods that can be great again.” - Citizen feedback from Community Congress #1

HOMES BUILT VS NEW HOUSEHOLDS

1990s

2000s

our urban centers.”

- Feedback from Private Sector Council member

78

55,202 5,001

Source: U.S. Census, 1970, 1980, 1990, 2000, 2010; American Community Survey, 2012 1-year estimates.

Housing is affordable for homeowners in Buffalo Niagara, but often not for renters. PROPORTION OF HOUSEHOLDS SPENDING LESS THAN 30% OF THEIR INCOME ON HOUSING COSTS FOR

We need to be offering

more housing type choices especially in

56,066 Homes Built

1970s

From 1970 to 27,220 New Households 2010, we built 1980s three homesProportion of households spending less than for every new 30% of their income on housing costs household…

FOR

SALE

RENT

For RENTERS

For HOMEOWNERS

77%

Bflo/Niagara NYS US

65% 69%

Source: American Community Survey, 2010 1-yr estimates.ii

One Region Forward: A New Way to Plan for Buffalo Niagara

50%

49% 50%

Half of those who rent in the Buffalo Niagara region are burdened by housing costs deemed unaffordable.


We build new homes while abandoning others.

HOMES BUILT AFTER 1970 AND ABANDONED HOMES IN 2010

WHAT WE COULD DO DIFFERENTLY

Today, while urban areas still have the highest vacancy rates, first-ring suburbs and some outlying areas are experiencing signs of decline. The number of abandoned homes in our first-ring suburbs nearly tripled from 1990 to 2010.iii

Homes we’ve built since 1970 Homes we’ve abandoned

Source: NYS Department of Taxation and Finance, Office of Real Property Tax Services (2010), US Census (2010), Erie County Dept. of Env. & Planning (2012) and Niagara County iv Dept. of Economic Development (2012).(2010), Property Tax Services (2010), US Census

Source: NYS Department of Taxation and Finance, Office of Real Erie County Dept. of Env. & Planning (2012) and Niagara County Dept. of Economic Development (2012). See data notes.

Provide data and analytical resources for informed decisionmaking for housing and neighborhoods

p 80

Anticipate, accommodate and embrace demographic shifts

p 81

Pursue neighborhoodspecific asset-based strategies for redevelopment

p 82

Improve the housing support delivery system

p 83

Vacant dwellings more than tripled in forty years. 1970

15,214 Over 30,000 more homes sit vacant today than in 1970 with more spreading outside our cities than ever before.

2010

45,475

Source: U.S. Census Bureau, 1970, 2010.

One Region Forward: A New Way to Plan for Buffalo Niagara

79


A NEW WAY TO PLAN | HOW DO WE GET THERE?

WHAT WE COULD DO DIFFERENTLY RECOMMENDED STRATEGIES AND ACTIONS

Provide data and analytical resources for informed decision-making for housing and neighborhoods. A strategic approach to preserving and modernizing our housing stock and neighborhood environments will require a clear picture of where we are and where we are headed.

What if more neighborhoods had the organizing capacity of PUSH?

Develop a Regional Property Information System. Accurate, current data is essential to good decision making. This resource should include open source data on housing, land, neighborhoods and municipalities to support ongoing planning and policy-making around housing and neighborhoods. The need is for a system that will be continually refreshed rather than provide a single point-in-time analysis; encompass a breadth and depth of data from neighborhood level indicators on assets and needs to parcel level data; and provide data for use by the public in general, although some categories of data might be private and password-protected. Key questions include what local organization or institution might host such a system and how it would be sustained financially over time. Finally, a Regional Property Information System might be part of a larger data and analysis capacity to serve the overall planning and implementation effort behind One Region Forward.

Conduct a current analysis of housing supply and demand. A current market study is an essential starting point for discussion of planning and development strategies for neighborhoods. No comprehensive assessment of housing and neighborhoods has been conducted in recent memory. But one would provide the basis for the informed decision-making we seek. It should address market and neighborhood dynamics on both a broad regional and hyper-local basis. This might be a first use of the developing Regional Property Information System and a step toward implementing other recommendations in this plan.

MOMENTUM TO BUILD ON For nearly a decade, PUSH Buffalo (People United for Sustainable Housing) has been combining community participation, housing renovation and green energy to push neighborhood regeneration on Buffalo’s West Side. PUSH pioneered the “Net-Zero Energy House,” runs a state-funded weatherization program, and recently announced a 46 unit rehab and infill housing project to provide affordable, energyefficient housing to low-income Buffalo residents in its 25-block “Green Development Zone.” pushbuffalo.org

80

One Region Forward: A New Way to Plan for Buffalo Niagara


Anticipate, accommodate and embrace demographic shifts in housing development and neighborhood revitalization. As noted above, the impacts of an aging population, an influx of ‘New Americans’ through immigration, and changing lifestyle preferences by younger generations all promise to put a strain on existing housing resources and provide incentives for new designs, forms of tenure and neighborhood environments. We need to deploy information, promote proto-type projects, and provide tangible supports for development of new housing types and forms of tenure in mixed use neighborhoods.

What if more people lived in our downtowns?

Develop a housing toolbox. Municipalities, developers, non-profits and residents need models and precedents for designing and producing sustainable housing types and neighborhoods. This would include an on-line repository of best practices and case study information about a range of housing types (townhouses, lofts, “granny flats,” etc.) and forms of tenure (co-ops, condos, co-housing, etc.). In addition, information should also be supported by in-person technical assistance.

Deploy new housing models. New housing models to meet the changing needs and preferences of residents require local proof of concept. It has to work here. Partners involved with One Region Forward should organize a coalition of local governments, not-for-profit community development companies, developers and others to pioneer a range of new housing types and forms of tenure to meet the increasingly diverse needs of the regional housing market and to develop the neighborhoods that support these housing types. This would include housing tailored to the needs or preferences of senior citizens, persons with disabilities, artists, immigrants, students, young professionals, empty-nesters, and others. Requirements include a lead agency for advocacy and education, a market analysis for housing types not currently in production, technical assistance to help communities implement new housing types, and new funding mechanisms for development types not supported by conventional lending products.

Relieve regulatory roadblocks to housing innovation. In many cases zoning codes or other housing regulations may need to be amended to allow some new types of housing or forms of tenure. This is particularly true of suburban communities that grew up around a model of single-family households with children – a demographic segment that has decreased dramatically in recent decades. To lead the effort, partners involved with One Region Forward could advance technical assistance for zoning and planning regulation reform to work with the coalition of municipalities, CDCs, and developers engaged in this effort.

MOMENTUM TO BUILD ON Twenty-five years ago housing in Downtown Buffalo was still just a hope. But the publication of “A New Neighborhood in Downtown Buffalo” documented the opportunity. Citizens at the Downtown Summit in 1994 prioritized it. And early projects like the Ansonia Center and Theater Place began to prove the market. Since then, the idea of Downtown as a great place to live has continued to gather steam as the supply and value of housing has grown. Since 2006, more than 1,000 new housing units have come on line, with an additional 350 units in progress. Meanwhile, we are seeing downtown living catch on in Niagara Falls, North Tonawanda and other urban centers.

One Region Forward: A New Way to Plan for Buffalo Niagara

81


A NEW WAY TO PLAN | HOW DO WE GET THERE?

Pursue neighborhood-specific asset-based strategies for redevelopment. Public and private resources for housing and neighborhood redevelopment need to be strategically targeted where new investments can build on strong neighborhoods nearby, leverage existing assets, engage active residents and help neighborhood-scale housing markets work again. Municipal leadership and collaboration with community based organizations and residents is key to set strategy, conduct participatory planning, and align capital investments with neighborhood plans.

What if we had robust tools to address vacancy and abandonment?

Emphasize community based planning. Planning with residents and stakeholders can maximize participation, leverage diffuse resources and focus on quality of life improvements. Working closely with residents and stakeholders is essential because so much of the knowledge, energy and money that is needed to regenerate neighborhoods exists at that local scale. Success will depend as much on investments by home owners and small scale entrepreneurs as it does on municipal government, developers, or banks. The active engagement of all is needed to produce plans that work for specific neighborhoods and have the active support of those who stand to benefit. But neighborhood planning can be resource intensive. A strong commitment from local government, philanthropy and business will be needed to provide the support structure for local planning that lasts.

Focus and coordinate public investments in neighborhoods with strategic assets. It’s crucial to coordinate public policy and capital investment priorities with local plans to create complete neighborhoods. Even mundane capital projects like street paving, curbs, sidewalks and street lighting can buoy resident efforts at regeneration. Larger investments in parks, transit, schools, community centers, business districts and the like can have an even greater impact – but only if all of these are coordinated with local planning initiatives. Participatory budgeting and crowd-sourced project financing can support these strategic investments. But alignment of local, county, state and federal investments with local plans is the key. Also important is treating neighborhoods holistically where “complete streets,” local services and neighborhood retail are part of the mixed use environment that supports diverse, accessible, quality housing. For some communities, this means repairing or restoring existing fabric. For other communities, this may mean retrofitting or repurposing dated and underutilized commercial stock, or creating town centers where none currently exist.

82

One Region Forward: A New Way to Plan for Buffalo Niagara

MOMENTUM TO BUILD ON The Buffalo Erie Niagara Land Improvement Corporation – Buffalo Niagara’s new land bank – is now up and running. Equipped with new powers from the New York State Legislature, the agency is beginning to acquire distressed properties, preparing them for redevelopment, and putting these properties in the hands of responsible new owners. The new land bank is an essential element in addressing 77,000 tax delinquent leans in Erie County alone and promoting neighborhood redevelopment and infill projects in both counties. benlic.org


Leverage the energy of new demographic groups. Urban neighborhoods have long been identified with specific ethnic groups, industrial specializations or cultural tendencies. Neighborhood planning should embrace the potential for immigrant communities, artists, or other groups to lead regeneration efforts and use unique ethnic, cultural or occupational identities to leverage investment and customer traffic. Changes already underway throughout the region can be leveraged to enhance these opportunities. These approaches can help create stronger neighborhoods if the initiatives are authentic, are supported by neighborhood input, and backed by reliable market information.

What if we created more traditional neighborhoods?

Design alternative long-term strategies. Design alternative long-term strategies for areas where disinvestment has left few of the assets, anchors and actors that are needed to power successful neighborhood revitalization. For such neighborhoods the time for conventional neighborhood redevelopment may be decades away. Where housing stock and commercial fabric have mostly been eroded and anchor institutions have departed, scarce public resources in conventional approaches cannot be expected to overcome immense private disinvestment. Both interim and long-term strategies are needed to support the redevelopment process and provide options for those who call those neighborhoods home. Far from the “benign neglect� of decades past, however, these neighborhoods need active management of community change, driven by local residents and a firm understanding of the existing market potential.

Improve the housing support delivery system. The network of community-based organizations providing services for housing and neighborhood revitalization needs to achieve significantly greater productivity while retaining its responsiveness to local conditions and contexts. Partners involved with One Region Forward should identify a trusted institutional funder and trusted convener to lead a patient and broad-based collaborative effort to reform the system.

Reconsider the scope and scale of the system. It should be possible to increase region-wide capacity and share expertise across the system while remaining responsive to local constituencies. Small neighborhood-based organizations can serve as a conduit for high quality regional services for their communities even as they provide local knowledge and input on community needs to a high-capacity support organization or network. This model would allow for opportunities to enhance services to traditionally underserved communities in cities, suburbs and rural areas alike. But redesigning long-term arrangements will not be easy. It will require skilled facilitation supported with patient resources and encouraged by state- and federal-level funders of housing services to bring such a process to a successful conclusion.

MOMENTUM TO BUILD ON One of the emerging approaches to fighting sprawl is known as TND or traditional neighborhood development. The Gardens at Oxbow in Lewiston, NY is a noteworthy local example of the concept. TND features compact homes with front porches that face the street and close-by connections to neighborhood amenities like shopping, restaurants, parks and transportation. They’re designed not only to be more walkable but more sociable as well. thegardensatoxbow.com

One Region Forward: A New Way to Plan for Buffalo Niagara

83


A NEW WAY TO PLAN | HOW DO WE GET THERE?

Better protect renters and home buyers. Develop better opportunities, supports and protections for renters and home buyers, particularly from traditionally vulnerable groups. Persons of color, those of low-income, seniors, immigrants, limited-English proficiency speakers and non-traditional families are among the groups that typically have been marginalized by the conventional housing and finance industries. The current housing support system attempts to break down barriers to quality housing for these – and all – demographic groups, but housing discrimination, public opposition and individual and institutional discrimination present tremendous challenges. Increased resources, focus and options need to be directed toward providing quality affordable housing near transit as a precursor and support for broader opportunity for these populations.

Cultivate a positive image of housing aid to improve participation. A stigma often attaches to programs designed to provide assistance to households struggling to get or keep affordable housing. In some cases, the stigma is perceived by residents of neighborhoods where officials seek to locate affordable housing resources. In other cases, those who need and qualify for such assistance see the stigma in accepting help. Housing providers should launch a broad-based effort to rebrand affordable housing and educate the public on its benefits. This should include an extensive outreach effort to identify barriers to participation and to involve civic leaders and officials in a marketing and advocacy program.

Improve the code enforcement system. Municipalities and housing providers should work together to develop new policies and tools to address slumlords and vacant properties more effectively. The code enforcement system should also be linked to education and support programs. Better use of information technology and focused prosecution through a dedicated housing court are both possibilities. But homeowners in violation of housing codes and in need of assistance should be able to get help through the enforcement system. Therefore, work to integrate financial and technical assistance programs for homeowners with the code enforcement mechanism.

84

One Region Forward: A New Way to Plan for Buffalo Niagara


One Region Forward: A New Way to Plan for Buffalo Niagara

85


A NEW WAY TO PLAN | HOW DO WE GET THERE?

Strengthen Our Big

Ideas

86

Food Systems

for a Healthier Population and Economy

One Region Forward: A New Way to Plan for Buffalo Niagara


Food is a self-evidently central element in making a sustainable way of life – in our region, not to mention the nation and the entire planet. Food is basic to human health. But how we grow, process and distribute food also has profound implications for land use, transportation, energy and environmental quality.

For Buffalo Niagara the challenges come at several levels. Many of our citizens lack easy access to fresh, healthy, affordable food because of where they live, a lack of transportation, or lack of money. Our population in general suffers from high rates of chronic diseases such as obesity, diabetes and heart disease because of poor diet rooted in our culture, but also in our food system. Most troubling, perhaps, is that our food supply is facing a period of severe instability because of climate change. While agriculture is an important part of our regional economy, very little of the food we eat comes from Western New York. Instead, our food comes through a far-flung network across the

nation and the world. We should expect the cost of food to increase and its availability to decline as the energy costs of transportation grow and droughts, severe weather and other aspects of climate change disrupt crops in other places. One response must be to grow more food locally. Sprawl is a problem from a transportation, infrastructure, land use, and public finance perspective, but it has also been an important contributor to the decline of agriculture in our region. Some farms have gone out of business because of the difficult economics of farming in our region. However, many have disappeared because it was simply more lucrative to “grow” houses than to grow crops on rural land.

WHAT DOES THE DATA TELL US ABOUT WHAT WE ARE DOING? We consume large quantities of food grown outside our region. We have vanishing or underutilized prime agricultural land. Farmers across our region are quickly approaching retirement. The majority of our farmland is producing animal feed. Our residents aren’t eating a healthy diet. Our poor diets have real impacts on our health. Local farms don’t produce the food we need for a healthy lifestyle. Many residents are suffering from food insecurity. For many, healthy foods are inaccessible. The cost of farming is high, relative to revenue generated.

TOOLS FOR GREATER UNDERSTANDING Growing Together Food Access and Justice Strategy Document

Food Access and Justice Strategy Document

Growing Together Ensuring healthy food, viable farms, and a prosperous Buffalo Niagara Growing Together was prepared by the University at Buffalo Food Systems Planning and Healthy Communities Lab DECEMBER 2014

One Region Forward: A New Way to Plan for Buffalo Niagara

87


A NEW WAY TO PLAN | HOW DO WE GET THERE?

WHAT THE COMMUNITY SAID THEY VALUE

WHAT THE DATA TELLS US

What 115 Maps Tell Us ------------Participants protected an average of

106,000 acres

Since 1992, our two counties have seen nearly 21 square miles of cropland go out of production* – an area roughly double the size of North Tonawanda.

of farmland per map (about 42% of all current farmland in the region). At least

We continue to lose cropland every year.

maps

used “protecting farmland” as a guiding principle for future development.

Cropland converted to homes since 1992

What Else We Heard ----------------

Preserve and expand sustainable farming

The map shows residential construction over the past twenty years within areas that were previously identified as cropland (by satellite imagery).

in urban, rural and suburban areas. Produce more local food in all communities.” - Citizen feedback from the Mapping Workshops

Use farmland as an economic development tool such as the

food related industries Batavia has attracted.” - Feedback from Private Sector Council member

*Source: USDA-National Agricultural Statistics Service, Census of Agriculture, 1994, 2009. Map Source: U.S. Geological Survey. (1997). 1992 New York Land Cover Dataset; U.S.D.A., National Agricultural Statistics Service, Research and Development Division, Geospatial Information Branch, Spatial Analysis Research Section. (2012). Cropland Data Layer; Erie County Department of Environment and Planning. (2012). Parcel Data; Niagara County Department of Economic Development. (2011). Parcel Data.

We are losing farms at an alarming rate.

33 Farms out of business every year.

Support urban agriculture — not

community gardens — as part of food production. We have the land to do it. We need the policies.

Farms lost since 1969 #1,254 of Farms in Buffalo Niagara

# of Farms in Buffalo Niagara 1969 1969 # of Farms in Buffalo Niagara 1969 1969

2007

2007

3,334

2,080

2007

2007

2,080

2,080 3,334 - Citizen feedback from Community Source: Agricultural Statistics Agricultural Service, Census of Agriculture, 1976,1976). 2009. Source: USDA-National Census of Agriculture, USDA-National Statistical Service. (2009, Congress #1 in Erie County Source: Census of Agriculture,3,334 USDA-National Agricultural Statistical Service. (2009, 1976). Source: Census of Agriculture, USDA-National Agricultural Statistical Service. (2009, 1976).

88

One Region Forward: A New Way to Plan for Buffalo Niagara

1,254 operating farms out of business since 1969, including 789 in Niagara County alone.


Much of the land in Buffalo Niagara that could be used for farming today is not. 315 square miles of Buffalo Niagara is classified as “Prime Farmland” but only 25% is used for agriculture.

Make the region’s food system a Buffalo Niagara policy priority.

p 90

Improve access to healthy food for disadvantaged residents.

p 91

Promote urban farming and community gardens.

p 92

Ensure a reliable supply of labor for food production and processing.

p 93

Strengthen regional farm to table links.

p 93

Residents in many areas find it hard to find fresh, healthy food.

Preserve agricultural land.

p 94

55,954

Promote sustainable agricultural methods.

p 95

Promote a culture of healthier eating.

p 96

Source: Calculation by UB Regional Institute. Data Sources: US Department of Agriculture (USDA), Natural Resource Conservation Service (2013); USDA, National Agricultural Statistical Survey, Research and Development Division, Geospatial Information Branch, Spatial Analysis Research Section. (2011),Erie County Department of Environment and Planning (2012) and Niagara County Department of Economic Development (2011).ii

We don’t grow enough healthy food for ourselves. Today, the region only grows

38%of the fruits and vegetables we’d need to eat in order to follow USDA healthy-eating guidelines.

Source: Calculations by the Food Systems Planning and Healthy Communities Lab. Data Sources: United States Department of Agriculture: National Agricultural Statistics Service and Economic Research Service; Department of Commerce: United States Census.

Our poor diets have real impacts on our health. Of Adults in Buffalo Niagara... ...less than 3 out of 10 consume five servings of fruits and vegetables a day ...about 6 out of 10 are overweight or obese ...and 1 out of 10 live with diabetes. Source: Erie County Department of Health, 2010-2013 Community Health Assessment, 2009; Niagara County Department of Health, 2010-2013 Community Health Assessment, 2009.

The food industry is an important part of our economy. About out of every

1

5

people lack access to a car and live beyond walking distance to a grocery store.

JOBS

in the region is food-related

Source: U.S. Bureau of Labor Statistics, Quarterly Census of Employment and Wages, 2010.iii

WHAT WE COULD DO DIFFERENTLY

Source: Calculations by the Food Systems Planning and Healthy Communities Lab. Data Sources: Reference USA, 2012; US Census, ACS 2011 5-year estimates; Bureau of Labor Statistics Consumer Expenditure Survey, 2011.

One Region Forward: A New Way to Plan for Buffalo Niagara

89


A NEW WAY TO PLAN | HOW DO WE GET THERE?

WHAT WE COULD DO DIFFERENTLY RECOMMENDED STRATEGIES AND ACTIONS

Make the region’s food system a Buffalo Niagara policy priority. It should go without saying that food is one of the building blocks of regional sustainability. But in an era of looming climate change disruptions and a challenging energy economy, it makes sense for each region to take stock of its own capacity to produce and process food and for residents to get access to healthful foods.

What if more local farmers were able to sell directly to consumers?

Create the structure for developing and advancing food policy. The Erie County Food Policy Council was recently created. We should establish a Niagara County counterpart with broad-based participation, whose early agenda would include an update to the Niagara County Farmland Protection Plan to increase farmer buy-in and promote a shared vision with other plans in the region.

Establish a regional food policy board to coordinate planning for food in WNY. Convene a board with members of food policy councils and other local food advocates. Develop an online food system database resource for the Buffalo-Niagara region that would serve to: (1) identify organizations and foundations that can help get healthy food to households in need; (2) use feedback from food banks, block clubs and other groups to inform farmers about the foods that are culturally-appropriate in our region; (3) link local growers to local retailers to get local foods into local markets; and, (4) create a resource whereby consumers can shop from a local Farm Stand, Community Supported Agriculture arrangement or Farmers’ Market.

Build the pipeline of food system projects that align with available funding opportunities. Cultivate projects that seek support from resources such as the New York State Consolidated Funding Application and work with funders to prioritize projects which seek to improve food justice, food access, agricultural viability, and a sustainable food system.

90

One Region Forward: A New Way to Plan for Buffalo Niagara

MOMENTUM TO BUILD ON Buffalo Niagara has seen a profusion of farmers markets in recent years with more than two dozen in Erie and Niagara counties operating at least one day a week. Farmers markets make the idea of buying local food a practical reality for thousands of households and they provide area farmers with a major outlet for their produce. From the long-running ClintonBailey market to the popular Elmwood Bidwell farmers market to operations in Hamburg, North Tonawanda, Niagara Falls and elsewhere, homegrown produce is more and more widely available.


Increase awareness about food system issues across the board. Educate local and state elected representatives on challenges and opportunities in food production and food access. Bring together food service and sustainability directors of local universities, school districts, correctional and health care facilities. Develop a collaborative network of colleges, universities and their students to support, strengthen and spur innovation in the local agriculture and food distribution industries. Undertake a regional education campaign at existing events to increase public recognition of the benefits and opportunities in local agriculture and to improve residents’ knowledge about local farmers. Launch a consumer education campaign that enlists existing media networks including broadcast television, radio, 211, and public service announcements to promote the benefits of local, healthy food to the local public.

Improve access to healthy food for disadvantaged residents. Help those who lack income, transportation, or proximity to stores. A range of both urban and rural neighborhoods suffer from a lack of accessible outlets for fresh and healthy food so that residents who are isolated, lack transportation or have very low incomes may not be able to get such food. A range of strategies might be employed.

Develop and implement a Healthy Corner Store program. Start a pilot program with five corner stores in areas underserved for healthy food. Provide technical assistance to help store owners market fresh fruits and vegetables, and later provide capital assistance for equipment and store improvements. Or provide subsidies to food stores locating within low-vehicle ownership or low-healthy food access areas and selling fresh food, and to ones already located in those areas that begin to sell fresh food in place of other foods.

What if farmers had better access to local markets?

MOMENTUM TO BUILD ON Our region has seen a flowering of community supported agriculture (CSA) – or farm share – programs. Typically, CSA subscribers pay a flat fee at the beginning of the year and receive a box of produce weekly throughout the growing season. The contents of the share vary depending on the time of season, as well as the range of products produced. However, every share brings fresh, affordable local food to local tables. There are now more than a dozen CSAs close enough for residents of Buffalo Niagara to take advantage.

One Region Forward: A New Way to Plan for Buffalo Niagara

91


A NEW WAY TO PLAN | HOW DO WE GET THERE?

Encourage the use of mobile food trucks. Mobile entrepreneurs can be a good vehicle for delivering healthy, locally-produced foods to neighborhoods and local schools lacking healthy food options nearby. Reduce licensing requirements or vary rates based on serving healthy foods.

Improve transportation access. Review and modify transit routing and schedules to improve access to food providers, especially in areas where vehicle ownership is low. Or provide free rides home from healthy-food retailers to customers living in neighborhoods with low-vehicle ownership. Provide free rides to customers who spend more than a baseline amount of money at the store. Fund vouchers for free transit or taxi rides to and from healthy food stores.

What if we thought of our food as medicine?

Support and enhance public food assistance. Promote, create new, and increase participation in existing “double-up bucks” programs used to increase value of public assistance dollars at fresh market retail options like farmers’ markets, and for purchases of locally-grown products at any retail destination, including convenience stores. Work with public officials to educate and facilitate enrollment in public assistance programs at public institutions (libraries, schools, colleges) and food retail destinations, from corner stores to supermarkets.

Promote urban farming and community gardens. While it is important to differentiate urban farming from community gardening, both practices can help improve access to healthy food for residents, improve city economies, and strengthen neighborhoods. A range of supports should be provided for these activities.

Provide security of tenure to farmers and gardeners. Urban farmers and community gardeners both invest significant time, energy and resources in building soil and creating garden infrastructure. The threat of displacement provides a strong disincentive to such investments. Therefore, institute long-term leases for community gardens on publicly-owned lands in Buffalo and Niagara Falls.

Facilitate access to land for urban agriculture. Develop a database of vacant urban parcels and their soil quality. Work with the Cities of Buffalo and Niagara Falls to identify and test the soil on the Cities’ vacant parcels. Prioritize parcels for remediation and inform the public which parcels are most suitable for agricultural use.

92

One Region Forward: A New Way to Plan for Buffalo Niagara

MOMENTUM TO BUILD ON In response to the crisis of diabetes and related health issues among its members, the Seneca Nation of Indians and the Seneca Diabetes Foundation established the Food Is Our Medicine (FIOM) project to restore the health and wellbeing of the Seneca Community. The initiative reintroduces Native American food systems, Native models of nutrition, indigenous land management, and sustainable food production practices through a range of programs including the Elders’ Sharing Circle, community gardens for Seneca children, FIOM 5K Run/ Walk, the Seneca Nation Native Planting Policy, the Seneca Nation Farmers Market, and the FIOM documentary film series. www.foodisourmedicine.org


Ensure a reliable supply of labor for food production and processing. One of the most challenging issues for area farmers is how to ensure that they have workers to tend, harvest, package, and process their crops and produce.

Develop the food system workforce. Promote workforce development in all food systems sectors and create fair-wage food jobs. Develop training programs that are built around food processing, preservation, distribution and preparation to limit food waste and reduce hunger locally. Establish a business incubator for food processing which leverages a network of food kitchens, culinary schools and other actors interested in business development.

What if local governments created or updated farmland protection plans?

Address farm worker immigration issues. Create pathways to legal residence for immigrant agricultural workers. In the meantime, advocate to modify the constraints of the H-2A visa program. Enable immigrant farm workers to work at multiple farms in the same year and to return to the same sponsor farm for multiple years.

Promote fair wages for farm workers. Analyze the impact of a federal Fair Labor Standards Act in Agriculture on American competitiveness in the global agricultural market. Ultimately, create a federal farm worker fair wage law applicable to all states.

Strengthen regional farm to table links. Buying locally-produced goods will make our food healthier, less energy-intensive and more secure. But sustaining farms in our region will require that farmers have better access to local markets. A range of strategies are available to make this happen including:

Prioritize New York State goods in State purchasing. Revise State purchasing policy and regulation to require State agencies to purchase foods produced in New York State and, more specifically, from within the regional food shed of the purchasing agency, when competing products are within a stipulated price differential.

MOMENTUM TO BUILD ON Erie County updated its Agriculture and Farmland Protection Plan in 2012 and the Niagara Communities Comprehensive Plan 2030 (produced in 2009) includes a follow up to the 1999 Niagara County Agricultural and Farmland Protection Plan. Both documents underscore the importance of agriculture to both regional economy and community health. Both outline strategies for preserving farmland, strengthening farm economies, and improving the connections between local farms and local tables. www2.erie.gov/environment/ index.php?q=AgPlan

One Region Forward: A New Way to Plan for Buffalo Niagara

93


A NEW WAY TO PLAN | HOW DO WE GET THERE?

Make CSAs more affordable and accessible. Create and fund a revolving loan fund to help low-income people obtain shares in Community Supported Agriculture arrangements. Encourage volunteer support where members could buy shares through sweat equity. Establish refrigeration and freezer shares at CSA drop-off sites.

Create a brand for specialty products from each County. Brand and market Niagara County fruit as a County specialty. Determine a brand for Erie County agricultural specialties and use this to promote our products in the broader marketplace.

Promote links between local farmers and ethnic food markets.

What if we cleaned our waters so that our local fish were safer to eat?

Develop partnerships between refugee and immigrant organizations and farm groups to ensure farms to grow food that meets the needs of Buffalo-Niagara’s diverse cultures.

Create a regional “food hub.” A food hub is both a facility and an organization that can help farmers share resources and aggregate products for more efficient sale to the market. Support the “Ready to Grow Food Hub Planning Project” by providing input on challenges and opportunities in the food system. More generally, support the development of programs and policies that increase the marketability of locally-grown food, including food hubs and farmer cooperatives.

Preserve agricultural land. Some of the region’s best farmland is vulnerable to conversion to new housing. Some of the best farmland has already been lost. Sustaining local agriculture in Buffalo Niagara will require preserving land for crops and livestock. Some of the means for achieving this goal will come to ground in the urban areas of the region. These are addressed in the section on Land Use and Development. But other direct means of preserving farmland need to be implemented.

Identify farmable soils. Identify parcels not currently used for farming that could be made ready for agriculture. Determine parcel owners’ interest in having the land farmed and find farmers looking to rent land. Connect interested parcel owners with farmers interested in farming more land. Identify farmable soils currently used for farming.

94

One Region Forward: A New Way to Plan for Buffalo Niagara

MOMENTUM TO BUILD ON Clean water and healthy ecosystems grow fish, which is a potential local sustainable food source for Buffalo Niagara. However, historical contamination, storm water run-off, pollution, among other things severely limit our ability to eat healthy fish from our own Great Lake and rivers. Buffalo Niagara Riverkeeper’s efforts to improve water quality are aiming to clean up our waters and restore our fishing potential through the $70 million dollar clean-up of legacy pollution in the Buffalo River. bnriverkeeper.org/can-i-eatthe-fish


Protect valuable farmland through purchase and transfer of development rights programs. Finance Transfer of Development Rights with revolving fund accounts used to pay farmers for development rights on their land. The municipalities’ or counties’ funds are later repaid by developers buying the development rights from the municipality or county. Developers use those rights to gain approval for development in other locations.

Offer low-cost retirement planning services to farmers. Our ability to keep farmland in agricultural production depends in large part on our ability to meet the needs of farmers who are retiring and have expected to retire on the proceeds from the sale of farmland.

What if there was a structure for advancing food policy?

Promote sustainable agricultural methods. Farming can have significant impacts on the environment, in both the food produced and in the by-products of production. More sustainable agricultural methods can help farmers use less water, energy, pesticides, protect streams and watersheds from farm pollution, and prepare for the impacts of climate change on farming. Although our region is blessed by plentiful water, there is still a cost to treat and transport it. However, there are limits to the supply. It remains important to conserve the resource. Start by installing water meters on unmetered water delivery systems. Then build the capacity of farms to harvest and use rainwater on site.

Protect streams and watersheds. Educate farmers about the environmental importance of stream buffers between agricultural land and waterways. Tie the education program to incentives for creating stream buffers. State or private funding agencies would reward farmers for creating stream buffers.

Facilitate Good Agricultural Practices. Support (GAP) certification for local farmers through grants and funding mechanisms, especially for small-scale farms. Encourage farmers to minimize the use of pesticides.

Prepare for climate change. Provide farmers with information on the effects of climate change on crop production to encourage them to grow products that will thrive in a changing climate. Educate farmers about implementing long-term plans on their farms to diversify production.

MOMENTUM TO BUILD ON If towns and cities are going to take food into account as part of the ongoing operation of government, elected officials need good information and advice about how public policy can shape the food system for the better. The Food Policy Council of Buffalo and Erie County was created in 2013 to fulfill exactly that need. It exists as a subentity of the Erie County Board of Health and will provide consultation on ways to improve access to healthy, locally grown food and build regional farm economies. Participants hope to establish a partner organization for Niagara County soon. hkhcbuffalo.org

One Region Forward: A New Way to Plan for Buffalo Niagara

95


A NEW WAY TO PLAN | HOW DO WE GET THERE?

Promote a culture of healthier eating. American eating habits have led to an epidemic of diabetes, heart disease, and obesity. Promoting healthier eating habits can help individuals live better lives and reduce the social costs of health care related to these diseases.

Transform the food environment in K-12 schools. Launch a nutrition education program for local public schools that uses the classroom and the cafeteria to increase students’ understanding of healthy and local food through local food purchasing and farmer demonstrations. Reward school districts financially for each locallysourced meal they serve to students. Local funding agencies can promote procurement of the regionally-grown foods by paying school districts a fraction of the cost of each locally-sourced meal served.

What if all school cafeterias had salad bars?

Increase the consumption of fruits and vegetables. One of the most important ways to promote good health is to ensure that individuals meet the benchmark of five servings of fresh fruits and vegetables on a daily basis. The combination of educational programs and food access measures described throughout this plan can help achieve that goal.

Encourage breast-feeding. Infant breast-feeding is one of the strongest predictors of adult health. Therefore, promote breast-feeding for the youngest members of the region’s population. Modify building codes to mandate private areas specifically designated for breast-feeding mothers to feed their babies or pump breast milk.

96

One Region Forward: A New Way to Plan for Buffalo Niagara

MOMENTUM TO BUILD ON The Youth Advisory Council for the Healthy Kids Healthy Communities partnership in Buffalo has made improving school meals in Buffalo Public Schools their top agenda item for 2015. Specifically, the group brought a campaign to the Board of Education calling for every school in the district to offer a salad bar. Moving forward, the group hopes cafeterias will offer a variety of fresh and local food options that are made from non-genetically modified ingredients, and prepared on the spot for lunch.


What if no children arrived to school hungry?

MOMENTUM TO BUILD ON The “snack pack� program of the Rural Outreach Center empowers families toward selfsufficiency. The program sends backpacks home with students filled with nutritious snacks and meals. To promote interaction and reinforce learning, an educational activity is included in the backpacks designed for children and their families to do together. The activity covers topics such as reading food labels, smart shopping, nutritious and fun recipes using the usual snack pack food items. Both child and parent are empowered to make better nutrition decisions, while also helping to stretch food budgets. theroc.co

One Region Forward: A New Way to Plan for Buffalo Niagara

97


A NEW WAY TO PLAN | HOW DO WE GET THERE?

Conserve Our

Big

Ideas

Energy

Promote Renewables and Prepare for the Impacts of

Climate Change

98

One Region Forward: A New Way to Plan for Buffalo Niagara


Global climate change will be the dominant local issue of the 21st century.

We already know that changes in the earth’s atmosphere are caused in large part by the burning of fossil fuels. We know that the resulting warming in air and water will lead to shifts in weather patterns, increases in extreme storms, more frequent floods and droughts. This will also lead to disruptions to our food system, stresses on ecosystems, rising sea levels, migrations of people, increasing likelihood of conflict over resources, damage to oceans and more. There is great practical urgency to mitigate the extent of climate change by reducing emissions of greenhouse gases. We can do this by making buildings and vehicles more efficient; by driving less -- which depends both on available alternatives and land use patterns; and expanding the use of renewable energy sources. We also need to prepare for transitions likely to result from climate change already assured by dramatic increases in atmospheric carbon dioxide over the past 200 years. Climate change is a global problem. Globally, average annual surface temperatures have risen by 1.5 degrees Fahrenheit since 1900 – and the pace of this heating has increased over recent decades.i Climate scientists agree that

carbon dioxide and other GHGs (Green House Gases) already emitted into the atmosphere are enough to cause an increase in mean global temperatures of 2C – about 3.6F – by the middle of the century – enough to cause a chain of damaging disruptions in global ecological systems.ii

WHAT DOES THE DATA TELL US ABOUT WHAT WE ARE DOING?

But the planet isn’t just getting warmer. Weather is less predictable. Storms are stronger and more frequent. Patterns of rainfall are shifting, leaving some areas in drought, others newly prone to flooding. As global population increases, carbon emissions continue and climate change intensifies, the impact around the globe will only be greater.

More homes are being threatened by flooding.

In the U.S., we contribute to these changes more than most others across the globe. Energy consumption per capita in the U.S. is nearly four times the global average. So even though we have less than five percent of the world’s population, we release roughly 20 percent of the greenhouse gases emitted throughout the worldiii. And the global rate of GHG emissions is still rising at a pace that exceeds the rate on which the most pessimistic forecasts of global temperature increase and sea level rise are based.

Our environment is changing. The region has increasing temperatures and rainfall. We are seeing more extreme weather events.

The region is consuming fossil fuels at high rates. Our consumption habits are slow to change. We are producing more clean energy here. We see increased demand for fresh water and potential pressure on the Great Lakes.

TOOLS FOR GREATER UNDERSTANDING Resilient Buffalo Niagara Climate Change Strategy Document

One Region Forward: A New Way to Plan for Buffalo Niagara

Climate Change Action Strategy Document

Resilient Buffalo Niagara Strategies to Respond to Climate Change Date 2014 Resilient Buffalo Niagara was prepared by Dr. Himanshu Grover, University at Buffalo School of Architecture and Planning

99


A NEW WAY TO PLAN | HOW DO WE GET THERE?

WHAT THE COMMUNITY SAID THEY VALUE

WHAT THE DATA TELLS US

Projected Increase in Annual Average Projected Increase in Annual Average Temperatures (degrees Farenheit) Rainfall The region is projected to get warmer and(inches/year) wetter. PROJECTED INCREASE IN ANNUAL AVERAGE TEMPERATURES (DEGREES FARENHEIT)

PROJECTED INCREASE IN ANNUAL AVERAGE RAINFALL (INCHES/YEAR)

What the Community Said --------

Over

100people

said the best way to make Buffalo Niagara more sustainable would be to limit our consumption of fossil fuels.

Minimum Maximum

Minimum Maximum 2.9

3.2

1.6

2050

2080

2.2

2030

3.0

3.5

4.5

2.1

2050

2080

Source: National Center for Atmospheric Research, Community Climate System Model, 2012. Notes: Based on the IPCC’s 4th Assessment A2 Scenario which assumes: high population growth, medium economic growth, high energy use, low resource availability, medium-high land use changes slow pace of adopting technological changes to reduce emissions.

What Else We Heard ----------------

“renewable energy and conservation” “expand recycling in general by eliminating disposable products”

8.7

4.6

4.2

2030

When asked what they would like to see changed in their community...

7.9

100+

By the90end of the century, we could experience...

36 days over 90°

100°+ 90°

14 days over 100°

Over

$6.6 billion

of residential property in Buffalo Niagara lies within floodplains.

“ban hydraulic fracking”

Climate change is the number one issue

facing our planet, including the US. We need to do all we can NOW. Alternative energy through clean Feed In Tariffs would be a great start.” - Citizen feedback from Community Congress

Source: Frumhoff, et al. 2007. “Confronting climate change in the US Northeast.” Union of Concerned Scientists.

We generate renewable energy, but most of it isn’t consumed here. Electricity we generate

66%

Focus on energy conservation —

comes from renewables.

not just efficiency.

- Citizen feedback from Community Congress

100

Source: Analysis is based on GIS overlay of NYS Office of Real Property System (RPS) parcel center points (2010) with FEMA Q3 Digital Floodplains (1996).

Source: U.S. Energy Information Administration, Department of Energy, 2012; The New York Independent System Operator, 2013.

One Region Forward: A New Way to Plan for Buffalo Niagara

Electricity we use

40%

comes from renewables.


What we use our energy for What we use our energy for...

WHAT WE COULD DO DIFFERENTLY

ENERGY CONSUMPTION BY USAGE, 2010

Commercial

21%

Residential

33% 7% Nearly three-quarters of the energy we consume is used to power our homes and cars.

Industrial

39% Transportation

Source: Ecology and Environment, Inc. Cleaner, Greener Communities Western New York Regional Tier II Greenhouse Gas Inventory, 2012. Calculations are for the five-county area of Western New York which includes Allegany, Cattaraugus and Chautauqua counties. For a complete list of data sources used for calculations, refer to CGC WNY Regional Tier II GHG Inventory.

We are responsible for most of the greenhouse gas emissions in our region.

80%

come from our homes, transportation and businesses.

Greenhouse Gas Emissions BY SOURCE

Source: Ecology and Environment, Inc. Cleaner, Greener Communities Western New York Regional Tier II Greenhouse Gas Inventory, 2012. Calculations are for the five-county area of Western New York which includes Allegany, Cattaraugus and Chautauqua counties. For a complete list of data sources used for calculations, refer to CGC WNY Regional Tier II GHG Inventory.

HOMES 25%

TRANSPORTATION BUSINESSES 38% 17%

Our environment can be used to help us manage climate change. Urban trees in Buffalo Niagara absorb over

245,000 metric tons of CO2

...which is equivalent to taking 40,788 passenger vehicles off the road.

Work for greater energy efficiency and conservation in our buildings and transportation system.

p 102

Promote renewables locally.

p 104

Make renewable energy growth an economic development priority.

p 105

As a region, we need to focus on renewable sources of energy.

p 106

We need to plan now to prepare the region for climate change impacts and anticipate adaptive responses.

p 106

Source: Ecology and Environment, Inc. Cleaner, Greener Communities Western New York Regional Tier II Greenhouse Gas Inventory, 2012; carbonfootprint360.com, “Greenhouse Gas Equivalencies Calculator”, 2013.

One Region Forward: A New Way to Plan for Buffalo Niagara

101


A NEW WAY TO PLAN | HOW DO WE GET THERE?

WHAT WE COULD DO DIFFERENTLY RECOMMENDED STRATEGIES AND ACTIONS

Work for greater energy efficiency and conservation in our buildings and transportation system. The biggest impact we can make now and in the near term is to work for greater energy efficiency and conservation in our buildings and transportation systems (understanding that efficiency and conservation are not the same thing; one uses technology to reduce the energy demand of our current behavior while the other requires that people behave differently to use less energy). Some of the things we can do to make this happen include:

What if we adopted innovative approaches to solar energy?

Make homes more efficient. Mount a broad-based program to provide energy audits for homes region-wide as the basis to install energy efficient technology (lighting controls, heating and air conditioning) and weatherize more than 400,000 homes. We can save money and avoid significant carbon emissions if we do. PUSH Buffalo is pioneering such a program with capital improvements financed directly by immediate savings by the consumer.

Government, lead the way. Encourage local governments, major institutions, and companies to lead the way by conducting organizational climate action plans that will help our largest energy users manage down fossil fuel use through performance contracting, adoption of renewable technologies, and transportation demand management programs. The University at Buffalo is implementing the climate action plan they adopted in 2011 with dramatic results.

Develop alternative energy infrastructure. Work with hospitals, universities, companies, business improvement districts, parking garage operators and others to expand the electric vehicle recharging infrastructure throughout the region. Compressed natural gas vehicles emit lower levels GHGs than gasoline engines, but still contribute to atmospheric carbon levels. Continued diversification of our energy sources and adoption of energy alternatives is necessary to reduce GHGs.

102

One Region Forward: A New Way to Plan for Buffalo Niagara

MOMENTUM TO BUILD ON Photo-voltaic solar energy technology is sometimes deployed at scale in utilitarian “farms” with a rack-and-stack architecture. When the New York Power Authority offered the University at Buffalo 750 kilowatts of solar capacity, leaders knew that wouldn’t be appropriate for their campus. They engaged Walter Hood, a nationally-celebrated landscape architect and artist, to design a solar energy facility that is also landscape art. “The Solar Strand” is demonstrating how renewable energy infrastructure can become a part of our day to day environment. buffalo.edu/sustainability/ solar-strand


Update building codes for efficiency. Regional leaders should help lead a coalition to advocate for improvements in the New York State building code to enforce contemporary energy efficiency standards, encourage the use of renewable energy in new and retrofitted buildings, and incorporate passive solar design in all buildings.

Implement energy efficient lighting. In addition to alternative fuels, more efficient light sources should be considered including traffic signal lights, street lights and lights in facilities such as parking garages. Replacing older less-efficient high-intensity discharge (HID) or metal halide technologies with more efficient options, such as light-emitting diode (LED) and induction lamps, represents a real opportunity for reducing costs and energy use. Municipalities including Buffalo have already taken steps to replace incandescent traffic signal bulbs with Light Emitting Diodes (LEDs) on traffic signals citywide.iv In addition to LED traffic signals, municipalities should also consider LED street lighting programs.

What if all homes were more energy efficient?

Traffic signal retiming and optimization. Signal optimization is one of the most cost effective measures that can significantly help with traffic flow on arterial roads and minimize points of congestion. Within the City of Buffalo four traffic corridors have undergone signal retiming and optimization (Delaware, Jefferson and Hertel Avenues and Seneca Street) and four more corridors are underway or nearing implementation for retiming and optimization (Niagara, Clinton and Main Streets and Elmwood Avenue). Retiming and Optimization is also slated to take place on Niagara Falls Blvd. and Sheridan Drive. Additional corridors and areas of opportunity for signal retiming should be pursued to lessen emissions that negatively impact our air quality.

Green infrastructure & stormwater management. Effective stormwater and stream/river management can reduce the risk of flooding for transportation infrastructure. Stream and river management can reduce conditions that exacerbate flooding impacts on transportation. In turn, green infrastructure can be incorporated into existing and new transportation infrastructure in terms of both design and materials used to lessen the amount of impermeable surfaces that create run off which add to some of our sewer overflows and stormwater pollution issues in the region.

And across the board... Other energy saving strategies are incorporated in sections of this plan dealing with land use (promote compact development), transportation (reduce vehicle miles traveled), housing and neighborhoods (reuse existing building stock), and food access and justice (promote locallysourced produce and reduce energy inputs to farming).

MOMENTUM TO BUILD ON The New York State Energy Research and Development Authority (NYSERDA) is partnering with 18 communitybased not-for-profits across the state, including PUSH Buffalo, to install home weatherization and energy efficiency upgrades. The goals are two-fold: to help households reduce their monthly energy bills and to create living wage employment in the green jobs sector. Recommended improvements are financed with the energy savings reflected on the consumer’s energy bill. Meanwhile, installation contractors hire dozens of new workers. nyserda.ny.gov/All-Programs/ Programs/On-Bill-RecoveryFinancing-Program

One Region Forward: A New Way to Plan for Buffalo Niagara

103


A NEW WAY TO PLAN | HOW DO WE GET THERE?

Promote renewables locally. Promoting the spread of renewable energy production requires a challenging mixture of local initiatives with actions not immediately under the control of actors in Buffalo Niagara. Together, however, these actions – policy changes, market innovations, and capital investments – can create the system that will quicken our transition to renewable sources of energy.

What if all new buildings were sustainably designed?

Create infrastructure for renewables. Develop power infrastructure to promote the proliferation of distributed renewable energy production, upgrading energy and storage capacity, improving the operations of the New York State Independent System Operators A, and promote the development of micro-grids to facilitate renewable generation at the local scale.

Extend renewable portfolio standard. Encourage New York State Public Service Commission to extend the coverage of the state’s Renewable Portfolio Standard and continue to increase the proportion of total energy that utilities are required to produce as renewables, that customers are allowed to produce as renewables, and that certain state entities are required to consume as renewables. This will continue to build both demand and supply for green energy.

Create the market for distributed energy production. Support creation of pricing mechanisms for sale of power from distributed renewable generators to grid operators (often known as a Feed-in Tariff), net metering to facilitate the same, and programs to finance conservation and renewable energy investments such as on bill financing and Property Assessed Clean Energy (PACE) in which repayment obligation attaches to the property, not the original borrower.

More state funded solar and wind. State initiatives have gone a long way toward jump-starting markets in renewable energy, but more can be done. Expand programs by New York State Energy Research and Development Authority to fund solar energy projects and create similar programs to fund wind power projects.

Streamline permitting for renewables. Rationalize the process for permitting for wind, solar, geothermal, and other renewable installations supported by strong educational programs about the benefits of such investments for household economics, business success, and community resilience.

104

One Region Forward: A New Way to Plan for Buffalo Niagara

MOMENTUM TO BUILD ON Leadership in Energy and Environmental Design (LEED) building standards are increasingly the rule in architecture in Buffalo Niagara, especially in public sector buildings. The Educational Opportunity Center, UB School of Medicine, UB’s Davis Hall, and the new US Federal Courthouse among many others have earned or are applying for LEED certification. In the private sector, The Planing Mill, Bethune Lofts, and the Elmwood Village Condominiums are incorporating LEED’s comprehensive sustainability principles in their designs. For residential properties, Niagara County is leading the way with a 2014 law providing property tax incentives to homeowners building and renovating to LEED standards.


Public buildings, lead the way. Convert public buildings to renewable energy sources to increase demand and save public dollars, keeping in mind that while prices for fossil fuels are likely to fluctuate, costs for renewable infrastructure will predictably decline over time and the “fuels” in question are free. Consider a target date of 2025 for total conversion.

Expand collaboration between NYPA and Ontario Power. The future of the Niagara region as the “energy hub” of the Great Lakes will depend in large part on the ability of the New York Power Authority and Ontario Power to trade electricity – much of it wind power from the Midwest and Ontario – to manage and balance the flow of power. New York and Ontario are both currently working on investments in transmission capacity. NYPA and Ontario Power should collaborate to ensure these investments work together.

What if we expanded wind power projects?

Make renewable energy growth an economic development priority. The development of renewable energy – part of what is known as the “blue/green” economy – can help create local community jobs, income and wealth – in the installation of renewable technology, the management of energy and carbon emissions at the organizational scale, and even for the research and development of new efficiency and renewable production technologies.

Support Research and Development. Engage area universities to tap research and development resources on renewable energy production, distribution, storage, and conservation toward creation of a “green” energy industrial sector centered in Buffalo Niagara.

Grow an energy manufacturing sector. Promote the development of renewable energy manufacturing for renewables through an expansion of the industrial supply chain of materials and products made in Buffalo Niagara.

Train workers for clean energy jobs. Work with companies, unions, and educational institutions to establish a training and placement pipeline for the manufacture, installation, maintenance of renewable energy and efficiency technology.

Teach carbon accounting. Expand education and training for carbon accounting such as the green building certificates offered through the UB Educational Opportunity Center, as well as programs to educate professionals in the application of LEED standards.

MOMENTUM TO BUILD ON With the construction of the Steel Winds project on the former Bethlehem Steel property in Lackawanna several years ago, electricity generated by wind power has become a visible part of regional energy solutions. The ensemble of tall turbines generates 35 megawatts of power and joins “wind farms” in Wyoming, Chautauqua, Cattaraugus and Allegany County as facilities generating nearly three percent of all upstate electricity needs. On a local level, the Seneca Nation of Indians is leading the way supported by its strategic energy plan focused on renewable energy. In 2014, the Nation received a $1.5 million grant from the US Department of Energy to design and install infrastructure that will deliver wind power to tribal buildings and 5.5 kWh on the Cattaraugus Territory. wind.sunedison.com/projects/ steel-winds

One Region Forward: A New Way to Plan for Buffalo Niagara

105


A NEW WAY TO PLAN | HOW DO WE GET THERE?

Target public investments. Provide preferential scoring for investments in renewable energy infrastructure in the New York State Consolidated Funding Application process through the Regional Economic Development Council and through industrial development agencies in the region.

Grow co-op power. Develop distributive energy systems in which a large number of owner/ producers contribute electric power to the grid; coordinate with the creation of energy cooperatives which serve member-owners. Both schemes help create local wealth as they serve communities.

What if our communities became more resilient to more severe and frequent storm events?

As a region, we need to focus on renewable sources of energy. Even as efforts to exploit reserves of oil, gas, coal and tar sands continue, demand is outstripping the supply of fossil fuel energy, raising prices across the board. Worse yet are the costs of actually burning these fuels. We need to move to renewable energy sources for all of our needs and sooner rather than later. Local leaders need to join the global debate.

Advocate for a green energy future. Many of the crucial decisions about our next energy economy will be made at state, federal or international levels. But Buffalo Niagara can speak to its interests for a green energy future. The national policy debate about whether to tax carbon emissions or regulate them needs to be resolved to avoid the “do nothing� option. Meanwhile, adoption of hydraulic fracturing methods in natural gas extraction is being fought on a state by state basis. Regional leaders should continue to advocate for a concerted transition to safe and green energy sources.

We need to plan now to prepare the region for climate change impacts and anticipate adaptive responses. Even if we reduced carbon emissions suddenly and dramatically, our climate would continue to change before it stabilizes again. We need to develop the ability to withstand shocks to regional systems and learn how to bounce back after they hit.

MOMENTUM TO BUILD ON In addition to providing water quality benefits, protecting and expanding naturalized areas along our lakes, rivers, creeks, and streams will protect our homes, roadways, and businesses from flooding and storm surges caused by climate change. Active River Areas and Coastal Shorezones are much more than the floodway or beach, they include floodplains, wetlands, dunes, marshes, and for rivers, naturally occurring meander belts, all of which slow and store floodwaters and wave surges, buffering uplands from extreme storm events. The West Seneca Oxbow, a former meander from Buffalo Creek, is an example of this natural infrastructure. Through a donation by the Jacobs Family, the Town of West Seneca has preserved the Oxbow and restored its function and ecology, providing flood resiliency to this area in perpetuity. bnriverkeeper.org/oxbowwest-seneca

106

One Region Forward: A New Way to Plan for Buffalo Niagara


Design and manage infrastructure to meet new threats. A range of new threats mean that standard designs for public infrastructure may no longer be adequate to withstand the effects of climate change. Local officials should work together to anticipate changing environmental and operational conditions and update design standards, including pavement requirements and maintenance protocols accordingly. Climate change-induced design factors include temperature change, precipitation and water levels, wind loads, and storm surges and wave heights which have both short-term and long-term implications. These factors may require the retrofit of existing facilities as well as the redesign of new, replacement, or renovated capital items.v

Develop community risk assessments.

What if we “greened” all our streets and impervious surfaces?

Counties and municipalities should develop community risk assessments to guide planning and investment in climate-related preventive measures. This should include the identification of vulnerable facilities and systems, an assessment of likely consequences due to projected events, and preparatory measures that can be taken.

Improve preparations. Local and regional officials should review, expand and maintain disaster and emergency preparedness plans and programs, anticipating an increase in the number of events – blizzards, flooding, heat emergencies, high winds, water shortages, and disruptions in power and data – that may be caused by aspects of climate change. Agencies should also assess where emergency response capacity needs to be enhanced -- and act on those assessments in advance of emergent events. Localities that understand the likely consequences and prepare for them will be more “resilient” in the long run.

Don’t put development in harm’s way. Review and revise land use policies (e.g. flood insurance, zoning, riparian buffers) to address foreseeable climate impacts. A range of actions can serve to mitigate the worst damage from climate-related events. Reducing the incentive to build in flood-prone areas provided by the National Flood Insurance Program would be one step, although not within our control regionally. Zoning to limit building in flood plains and regulation to protect stream corridors from development would also help.

Update flood maps. Update and use the 500-year flood plane maps for site planning review. As extreme weather events become more common the notions of 100and 500-year floods become less useful. Just as a light-year is a measure of time, not distance, a 500-year flood is a measure of extent of flooding not frequency. Ultimately – an ounce of prevention being worth a pound of cure – the point is simply to discourage or prohibit building in areas that are likely to flood. This will require accurate information and acting on it appropriately.

MOMENTUM TO BUILD ON In March 2014, the US Environmental Protection Agency and NYS Department of Environmental Conservation approved the Buffalo Sewer Authority’s $430 million combined sewer overflow 20year control plan. A balance of traditional grey storage and sewage treatment plan updates with roughly $100 million in innovative green infrastructure urban storm water retrofits, the program funds green street construction projects across the city including ones on Elmwood, Claremont, Parkdale, Windsor, Ardmore, Fillmore, Carlton, the Niagara Street Great Lakes National Scenic Byway, and others. Additional green street work will continue and is capitalizing upon the reduction of between 240 and 400 acres of impervious surfaces associated with demolition activity in the City. bsacsoimprovements.org

One Region Forward: A New Way to Plan for Buffalo Niagara

107


A NEW WAY TO PLAN | HOW DO WE GET THERE?

MOVING ONE REGION FORWARD BUILDS ON THE EXISTING NETWORK A STRONG NETWORK ALREADY WORKING ACROSS OUR REGION

Local Government Officials

ONE REGION FORWARD TAPS INTO THE NETWORK

Community Organizations

Coordinating Planning & Policies Universities and Centers of Learning

Businesses Regional Transportation Agencies

Citizens

Making Smart Investments Facilitating broadbased conversations with the network to reflect on where we are and where we want to go.

Nonprofit Organizations

This network is already finding better ways to work more collaboratively and contributing to our region’s momentum

Fostering Collaborative Partnerships Community Learning and Action Building Capacity & Tools

Informing the conversation with accurate data and objective analysis Engaging the community and those who aren’t typically at the table Utilizing new tools and ways to reach the community

108

WHAT WE’LL NEED TO MOVE FORWARD

One Region Forward: A New Way to Plan for Buffalo Niagara


Implementation of this plan will not fall on the shoulders of one organization or body. Many actors, ranging from nonprofits, local governments, citizens, county and regional entities, the business community, and academic institutions can and must play a part in moving One Region Forward. CONTINUING THE WORK THAT THOUSANDS HAVE BEEN A PART OF IN BUILDING THE FUTURE OF PLANNING TOGETHER

Implementation Council

We know implementation is already in motion. The question is, can we better support and coordinate efforts that point toward key regional values to advance those initiatives and measure progress of implementation? The networked approach to implementation seeks to do just that, by aligning and coordinating local planning, targeting how we make public and private investments across the region, promoting collaborative partnerships, informing and engaging citizens and decision-makers, and finding ways to build capacity and technical support to assist efforts at the local level. And finally, we know implementation must be results-driven.

The Implementation Council will advance a coordinated strategic approach for the future based on research and community-informed decision-making. Guiding future collaboration and participation Measuring our future progress

The One Region Forward performance base has been developed to gauge if our collective efforts are successful in creating the prosperous and sustainable 21st century region we want. A critical piece of implementation involves a commitment to measure these metrics over time and recognize local actions, project and policy changes that move the region forward. A collaborative organization will be established to guide this process and measure our region’s collective progress toward implementation. Called the One Region Forward Implementation Council, this group will be an off-shoot of the steering committee that guided the planning phase and will develop a charter to make clear its mission and ensure that partner organizations will actively contribute over the long haul.

Led by members of organizations across Buffalo Niagara

One Region Forward: A New Way to Plan for Buffalo Niagara

109


A NEW WAY TO PLAN | HOW DO WE GET THERE?

WHAT WE’LL NEED TO MOVE FORWARD

Coordinating Planning & Policies

Our Values

Some examples of what’s already happening in our region and how it aligns with our values

How the Implementation Council will support what we need to move forward

Transportation planning will draw from community input and values culled from One Region Forward

Partners of the One Region Forward Implementation Council will work collaboratively, as well as within their own organizations’ powers and authorities, to assist local planning and policy measures that support our shared community values. This will come in a variety of forms and may include: individual partners exercising their powers and authority to influence planning and development decisions, such as through the county 239-m and 239-l development application process; working collaboratively to support local communities with planning capacity as they look to update their comprehensive plans and zoning codes; connecting local communities with organizations that have expertise in certain planning or policy issues, such as complete streets ordinances; and making available shared tools that make planning easier, more transparent and focused on advancing the performance we seek to achieve for the region.

Greater Buffalo Niagara Regional Transportation Council’s (GBNRTC) Long Range Transportation Plan will strongly integrate the regional values and priorities established through One Region Forward to ensure that transportation planning responds to regional goals for how we develop our land and our transportation system. Zoning codes are being developed to create places that embrace the key values of One Region Forward Buffalo Green Code has created a land use plan and zoning code strongly built on sustainability. It will make it easier to build more sustainable types of development energy-efficient, mixed use, and walkable environments.

110

Implementation Council

One Region Forward: A New Way to Plan for Buffalo Niagara


WHAT WE’LL NEED TO MOVE FORWARD

Making Smart Investments

Our Values

Some examples of what’s already happening in our region and how it aligns with our values Leveraging state funding for the region The WNY Regional Economic Development Council is redefining the way state investments are made in our region. Coordinated strongly with One Region Forward, WNYREDC’s “Smart Growth” decision-making process mirrors the One Region Forward value base. Leverage federal funding for the region Through its Preferred Sustainability Status program, the U.S. Department of Housing and Urban Development offers bonus points for competitive grant funding to projects that align with One Region Forward. Other federal departments are paying close attention to regional plans developed through this process, showing the value of what One Region Forward can mean as we think about how federal dollars support investment locally.

Implementation Council

How the Implementation Council will support what we need to move forward The One Region Forward Implementation Council will work to expand opportunities for aligning public and private investments with regional values. Some of the ways it will support this approach include: educational programs, like continuing the Economics of Sustainability lecture series launched by the Buffalo Niagara Partnership; offering project advisement to local communities or organizations seeking funding through the Western New York Regional Economic Development Council; and continuing conversations with local economic development organizations, industrial development agencies, and municipalities about ways they can focus their investments (capital budgets, community development block grants, tax incentives, etc.) to reach the collective performance our values indicate we want out of our region.

Prioritizing transportation investments in the region Our region’s metropolitan planning organization, the GBNRTC coordinates how federal dollars for transportation projects get prioritized. GBNRTC is committed to leverage the performance base of One Region Forward to help prioritize projects that best support what our region values.

One Region Forward: A New Way to Plan for Buffalo Niagara

111


A NEW WAY TO PLAN | HOW DO WE GET THERE?

WHAT WE’LL NEED TO MOVE FORWARD

Fostering Collaborative Partnerships

Our Values

Some examples of what’s already happening in our region and how it aligns with our values A public-private partnership working to improve streetscapes and public spaces The Buffalo Building Reuse initiative was sparked by a joint recognition between the City of Buffalo and the Buffalo Niagara Partnership that the public and private sectors each bear responsibility for the ultimate revitalization of the city’s urban core. It consists of a public-private partnership that pools resources and capacity to revitalize the downtown Buffalo real estate market. Leveraging both public and private dollars, the project has created a downtown revolving loan fund to support projects that would not otherwise break ground, and allocated more than $6 million in public and private dollars to improving streetscapes and public spaces throughout downtown. Getting food to the policy table Established to offer guidance to local governments on food policy issues, this group is helping to redefine the landscape of how food is thought about by local and county governments and other institutions. Bringing together farmers, academic experts, health professionals, and passionate citizens, this group is pooling together disparate expertise to fill a policy knowledge base seen in many of our local governments. A forum to advance justice and equity Supported by the Open Society Foundation, Open Buffalo is a civic initiative to activate long-term improvements in justice and equity throughout Buffalo and the region. It is an unprecedented collaboration among a diverse group of partners that includes Coalition for Economic Justice, Partnership for the Public Good, PUSH Buffalo, VOICEBuffalo, and many others. 112

One Region Forward: A New Way to Plan for Buffalo Niagara

Implementation Council

How the Implementation Council will support what we need to move forward Collaboration is the fundamental building block for One Region Forward. Through the threeyear planning process, the initiative has helped to facilitate the formation of new partnerships and supported strengthening existing ones. Facilitating and partnering with collaborations that can support actions that get us toward our values will be an ongoing focus for the Implementation Council, especially for efforts that strongly aligned with recommended strategies and actions within this plan.


WHAT WE’LL NEED TO MOVE FORWARD

Capacity Support for Implementation

Our Values

Some examples of what’s already happening in our region and how it aligns with our values Community values guide decisions The participatory scenario planning process used to sharpen common regional land use values and assess the “full cost” of various forms of development is being scaled down to smaller geographies. Technical staff from UB Regional Institute and GBNRTC have been testing this level of assistance with two small scale planning processes in the region: Vision Niagara, a public-private partnership focused on reinventing Niagara Street in Buffalo as a more walkable, multi-modal and vibrant corridor and a second project that evaluates the impacts on the surrounding neighborhood from new Intermodal Transportation Center in Niagara Falls coupled with the removal of the northern section of the Robert Moses Parkway from Main Street to Findley Drive.

Implementation Council

How the Implementation Council will support what we need to move forward In the short term, the Implementation Council will work within its collective bandwidth to offer support for local implementation where needed. Recognizing that local assistance may require more advanced support, the Implementation Council will seek funding to launch more comprehensive support that may include online data-sharing platforms, hands-on assistance to local municipalities as they update their comprehensive plans, zoning codes, and other innovative ways to support local communities.

One Region Forward: A New Way to Plan for Buffalo Niagara

113


A NEW WAY TO PLAN | HOW DO WE GET THERE?

WHAT WE’LL NEED TO MOVE FORWARD

Community Learning and Action

Our Values

Some examples of what’s already happening in our region and how it aligns with our values Investing in Citizen Champions Launched in 2014, the Citizen Planning School “teaches” about the One Region Forward initiative and what implementing the region’s values for sustainability can look like at the grassroots, community-level. The program, and its accompanying service learning program “Champions for Change” where citizen participants cultivate plans for change in their community, will continue and be supported by a graduate level course at the University at Buffalo School of Architecture and Planning. Learning from best practices Through its Economics of Sustainability Series, the Buffalo Niagara Partnership has brought in speakers from across the country to talk about how sustainable approaches to development make sense for businesses and our region’s quality of life. The Partnership will continue to host this series as a way to engage the business community and public sector around best practices they can consider for integrating in their operations and practices. Civic entrepreneurship for food access Issues of poverty and inequality are felt in communities across the region. Niagara University EntrepreNU social enterprise competition challenges students to develop business plan solutions. In the first year of the program, food access, nutrition and hunger will be the focus of the program. 114

One Region Forward: A New Way to Plan for Buffalo Niagara

Implementation Council

How the Implementation Council will support what we need to move forward In addition to continuing the Citizen Planning School and the Economics of Sustainability series, the Implementation Council will explore all sorts of ways to continue informing our region about critical issues to One Region Forward. This could include: strengthening relationships with academic and educational institutions around how their curriculum and research programs can align with One Region Forward; extending partnerships with other citizen leadership programs like Leadership Buffalo, Leadership Niagara, Buffalo Niagara River Academy, Open Buffalo, etc.; and on a broader basis, ongoing engagement of the community through online conversations via the communications and social media vehicles launched through the initiative.


WHAT WE’VE MOVED FORWARD IN 2014 Citizens drive change on the ground demonstrating sustainability in action at the community level

195

register as Citizen Planners to get practical tools and knowledge in planning for sustainable communities

17

become Champions for Change who received additional hands-on training and technical assistance to develop a community-based project Workshops and Technical Assistance Champions receive additional training from staff at UB School of Architecture & Planning to create a plan for change. Learning Sessions Citizens learn from the network, experts working in the private, public and nonprofit sectors. Panel discussions focus on two-way learning. Citizens Planners and Champions meet others who are active in their communities. Toolkits offer additional resources, funding opportunities, and related planning efforts.

The Program The program provides citizens of Erie and Niagara counties with tools to increase the sustainability of their communities and ultimately, the Buffalo Niagara region at large. All participants attend issuebased lectures, have access to online tool kits, receive a Certificate of Completion, and attend a Sustainability Idea Summit that celebrates the work of all program participants.

In 2014 The Citizen Planning School Universities & Research Centers invited members of the County Governments community to become a Citizen Planner and also offered an Business Community additional level of training called Champions for Change. Nonprofits Champions for Change are Local Governments Citizen Planners that want to take their Local Foundations engagement one step further by creating a micro-plan for a sustainability project in their community, attending technical assistance hours to create this plan, and presenting it at a Sustainability Idea Summit.

Moving Our Values Forward The community, as an integral part of the network, is directly involved in implementing change. New projects are ripe for implementation building a baseline for scaling up for greater impacts across our region. New data is created out of the program to measure our future progress. Learning from this program will guide future collaboration and participation.

SUMMIT One Region Forward: A New Way to Plan for Buffalo Niagara

115


A NEW WAY TO PLAN | HOW WILL WE KNOW WE’RE GETTING THERE?

OUR VALUES TELL US WHERE WE WANT TO GO

Our Values

116

One Region Forward: A New Way to Plan for Buffalo Niagara

OUR IDEAS OFFER MANY WAYS WE CAN GET THERE

BIG IDEAS


INDICATORS WILL TELL US IF WE’RE GETTING THERE

Measuring our progress will tell us if our actions are moving us towards our values TODAY

Are we building less new infrastructure...

FUTURE

...conserving more natural open space... ...driving less... ...creating a healthier environment... ...saving more taxpayer money...

One Region Forward: A New Way to Plan for Buffalo Niagara

117


A NEW WAY TO PLAN | HOW WILL WE KNOW WE’RE GETTING THERE?

The Performance Base of One Region Forward

Are we concentrating new development where we already have infrastructure?

One Region Forward was built on an extensive, inclusive and far reaching community engagement process. It brought together the voices of thousands from across the region - citizens, business leaders, developers, community stakeholders, local government officials, and others – all who shaped this plan and its direction. Starting with the value statements culled from our 160+ local plans, refreshed and sharpened through countless conversations across the region, and imagined through citizen-designed maps crafted by a diverse group of nearly 800 residents, we have a clear sense of the direction the community would like to see the region go.

HOW IT ALIGNS WITH OUR VALUES

Increasing density in urbanized areas reduces infrastructure costs and preserves natural, open space.

That direction is markedly different from the predominant development patterns of the past several decades. It embraces reusing our existing infrastructure, creating walkable, livable places, investing in diverse transportation options, and stewardship A series of indicators for our farms, open spaces, and natural were derived from the habitat. In essence, it is a clear rejection planning process. As a of the “Business As Usual” future growth group, these metrics are scenario.

intended to help gauge if

Yet, even with a strong sense of where we the region is collectively want to go (or where we don’t want to go), moving in the direction One Region Forward recognizes there is no outlined in the plan. singular path or map that can tell us how to get there. Strategies for action are not “one size, fits all,” and the most promising way to create a sustainable region for future generations is to work together and support locally and organizationally appropriate ways that get us moving toward the performance we want. How will we know if our collective efforts are working? Again, there is no single barometer that can tell us that, but if we commit to asking the question, we can reflect on our performance as a region. Through its partnership with the UB Regional Institute, One Region Forward will commit to measuring the indicators on the following pages over time. The numbers aren’t the only way we will measure progress, but they offer an objective way for us to continue the conversation about the future we seek to create for Buffalo Niagara.

Implementation Council

WHERE WE ARE TODAY

WHERE WE WANT TO GO

68% of all developed land is within the urbanized area and serviced by a sewer district.

We’ll be making progress if we increase the share of new development serviced by existing infrastructure.

Definition: % of development within Urbanized Areas serviced by a sewer district. Source: Parcel Data (Erie Co. DEP, 2012 Niagara Co. DED, 2011); Urbanized Land Area (US Census, 2010); Sewer District Boundaries (various county and municipal sources, ca. 2013). Methods: Select from parcels classified as vacant in the previous year those that change to residential, commercial and industrial properties. Then select the parcels that are within sewer districts that also intersect developed land classified by parcel data, and divide the acreage of these parcels by the total area of all newly developed parcels to calculate a percentage. Frequency: Measured annually.

118

One Region Forward: A New Way to Plan for Buffalo Niagara


Are we focusing job growth around our main streets, downtowns and former industrial areas?

Are we conserving natural, open spaces?

Are we increasing public access to our waterfronts?

HOW IT ALIGNS WITH OUR VALUES

HOW IT ALIGNS WITH OUR VALUES

HOW IT ALIGNS WITH OUR VALUES

Growing employment opportunities in strategic areas maximizes revenues and limits new costs.

WHERE WE ARE TODAY

WHERE WE WANT TO GO

26% of all regional jobs are in downtowns, Brownfield Opportunity Areas, or near main streets.

Protecting open space enhances ecosystems vital to a clean and healthy environment.

WHERE WE ARE TODAY

WHERE WE WANT TO GO

693 We’ll be making progress if we increase the share of jobs in strategic locations.

square miles of open space are conserved from development.

We’ll be making progress if we increase the amount of conserved open space.

Definition: % of open space (as of 2011) Conserved from Development.

Source: LODES Census Block Data from OnTheMap (2011); BOA Boundaries, Downtowns, “Main Streets” (2012).

Source: Parcel Data (Erie Co. DEP, 2012 Niagara Co. DED, 2011); WNY Land Conservancy (2013); National Conservation Easement Database (2012).

Frequency: Measured annually. 2-year lag due to data availability.

Methods: Calculate the total acreage of parcels that are classified as vacant, public open space or conservation areas that lie outside of areas classified as developed by land cover data. Frequency: Measured annually.

WHERE WE ARE TODAY

WHERE WE WANT TO GO

83.5

Definition: % of jobs within identified “Main Street” areas, downtowns, or Brownfield Opportunity Areas.

Methods: Using GIS, clip the census block data to the shapes of “Main Streets”, downtowns, BOAs. Using the calculated job density per block and the area of the clipped blocks, estimate the number of jobs within these areas and divide by the total number of jobs in the region as given by the OnTheMap data.

The more accessible our shores are, the more opportunity for all to enjoy clean waterways.

linear miles of shoreline with public access.

We’ll be making progress if we increase the amount of shoreline with public access.

Definition: Linear miles of shoreline with public access. Source: Parcel Data (Erie Co. DEP, 2012, Niagara Co. DED, 2011); US Geological Survey, National Hydrography Dataset (2012). Methods: Select all publicly-owned parcels by property class from parcel data. Extract public lands which intersect any major water body. Calculate the length of public shoreline, as well as the total length of major shorelines, using GIS software. Frequency: Measured annually.

One Region Forward: A New Way to Plan for Buffalo Niagara

119


A NEW WAY TO PLAN | HOW WILL WE KNOW WE’RE GETTING THERE?

Are we reducing the miles we travel in cars?

Are more workers commuting via alternative modes of transportation?

Are we building new homes and job centers that are connected by public transit?

HOW IT ALIGNS WITH OUR VALUES

HOW IT ALIGNS WITH OUR VALUES

HOW IT ALIGNS WITH OUR VALUES

By driving less, we save time, money and contribute to a cleaner environment.

WHERE WE ARE TODAY

WHERE WE WANT TO GO

17.9 daily vehicle miles traveled per person.

Travel to work by walking, biking, public transit, and carpooling makes our communities and our environment healthier.

WHERE WE ARE TODAY

WHERE WE WANT TO GO

Definition: Vehicle miles traveled per capita. Source: Greater Buffalo Niagara Regional Transportation Council (2011); ACS 5-year estimates (2011). Methods: Find the total regional vehicle miles traveled from GBNRTC data; divide by the total regional population as given by ACS estimates. Frequency: Measured annually, 1 or 2-year lag due to data availability.

of the region’s workers commute via alternative modes of transportation.

WHERE WE ARE TODAY

region’s homes

We’ll be making progress if we increase the share of workers commuting via alternative modes of transportation.

32% region’s jobs

are within areas accessible to transit stops.

We’ll be making progress if we increase the share of homes and jobs accessible to transit.

Definition: % of workers commuting via alternative modes of transportation.

Definition: % of new development sites built within areas accessible to transit stops.

Source: U.S. Census Bureau, American Community Survey 1-year estimates (2010).

Source: US Census Bureau (2010); LODES Census Block Data from OnTheMap (2011); NFTA Transit Stops (2013).

Methods: Find from ACS’ “Means of transportation to work” (T128) for the Buffalo Niagara Falls metro.

Methods: Select from parcels classified as vacant in the previous year those that change to residential, commercial and industrial properties. Divide the number of these parcels that fall within ½ mile of a transit stop (metro or bus) by total number of parcels that were developed.

Frequency: Measured annually, 2-year lag due to data availability.

Frequency: Measured annually.

120

WHERE WE WANT TO GO

26%

18% We’ll be making progress if we decrease the daily miles we travel by car.

Energy is conserved and our communities become more walkable if we don’t have to depend on cars for travel.

One Region Forward: A New Way to Plan for Buffalo Niagara


Are we becoming more bike-friendly?

Are we reducing the number of vacant homes and businesses in our region?

Is the new housing we build walkable to services and amenities?

HOW IT ALIGNS WITH OUR VALUES

HOW IT ALIGNS WITH OUR VALUES

HOW IT ALIGNS WITH OUR VALUES

More bike lanes make a betterconnected and healthier region.

WHERE WE ARE TODAY

WHERE WE WANT TO GO

WHERE WE WANT TO GO

We’ll be making progress if we increase the amount of land dedicated to bike travel.

Source: Greater Buffalo Niagara Regional Transportation Council (2014). Methods: The length of bike lanes, bike routes and shared road lanes, calculated using GIS software.

5,796

commercial vacancies

Building more homes in walkable places creates healthier communities and makes amenities more accessible.

WHERE WE ARE TODAY

WHERE WE WANT TO GO

5%

residential vacancies

Definition: Linear miles of bike lanes.

Frequency: Measured annually.

WHERE WE ARE TODAY

23,924

153 linear miles of dedicated bike paths, shared bike lanes and multi-use/ recreational trails.

Reducing vacant structures preserves our tax base, conserves embedded energy and strengthens our communities.

We’ll be making progress if we decrease the number of vacant residential and commercial properties.

of new homes built since 2000 were built within walking distance to a main street, downtown or transit corridor.

We’ll be making progress if we increase the share of new homes built in walkable places.

Definition: # of residential addresses determined “undeliverable” by US Postal Service.

Definition: % of homes built within walking distance to a “Main Street,” downtown or commercial corridor.

Source: HUD and US Postal Service, Vacancy Data (2013).

Source: Parcel Data (NYS ORPS, 2010); Downtowns, “Main Streets” (2012); NFTA Transit Stops (2013).

Methods: Download data from http://www.huduser.org/portal/ usps/login.php for the final quarter of the year being measured. Sum the total number of business addresses and residential addresses within Erie and Niagara county classified as vacant. Frequency: Measured annually.

Methods: Percentage of new homes (found comparing parcel data from two consecutive years) built within walking distance (half-mile) of walkable communities (defined as areas with more than 8 housing units and at least 2 jobs per acre), “main streets”, downtowns, and central business districts. Frequency: Measured annually.

One Region Forward: A New Way to Plan for Buffalo Niagara

121


A NEW WAY TO PLAN | HOW WILL WE KNOW WE’RE GETTING THERE?

Are we less burdened by the costs of housing and transportation?

Are we increasing access to healthy food for those most in need?

Are we preserving our farmland?

HOW IT ALIGNS WITH OUR VALUES

HOW IT ALIGNS WITH OUR VALUES

HOW IT ALIGNS WITH OUR VALUES

The less we have to spend on basic living expenses, the more opportunity we have.

WHERE WE ARE TODAY

WHERE WE WANT TO GO

On average

53%

of household We’ll be income (for making medianprogress if income we decrease families) the share of is spent on household housing and income spent transportation on housing and costs. transportation.

The more people have access to healthful food, the healthier our communities become.

WHERE WE ARE TODAY

WHERE WE WANT TO GO

We’ll be making progress if we decrease the number of households that can’t easily access a supermarket.

Definition: The percentage of income the average family spends on housing and transportation costs.

Definition: # of households without a vehicle and beyond walking distance to a supermarket.

Source: HUD Locational Affordability Portal (2014).

Source: Reference USA (2012); US Census, ACS 5-year estimates (2011).

Methods: Using the Location Affordability Portal provided by HUD, find the percentage of income spent by the median-income family on housing and transportation. Frequency: Measured annually.

Methods: Extract supermarkets and grocery stores from RefUSA by NAICS code. Map vehicle availability by block group using ACS data. Sum the total number of people living in households without a vehicle in block groups that do not lie within 0.4 miles (using network analyst) of a supermarket. Frequency: Measured annually, with a 2-year lag due to data availability.

122

One Region Forward: A New Way to Plan for Buffalo Niagara

WHERE WE ARE TODAY

WHERE WE WANT TO GO

397.1

55,954 households without a vehicle and beyond walking distance to a supermarket.

The more farmland we keep, the more resilient our food systems become.

square miles of land dedicated to farming.

We’ll be making progress if we increase the amount of land dedicated to farming.

Definition: Acres of land dedicated to farming Source: Parcel data (Erie Co. DEP, 2012 Niagara Co. DED, 2011) and USDA, National Resource Conservation Service (2013) Methods: The area of land in farms includes all land parcels classified as agricultural for tax assessment purposes. Frequency: Measured annually


Are we growing our agricultural economy?

Are we conserving energy in our buildings?

Are we increasing generation of renewable energy?

HOW IT ALIGNS WITH OUR VALUES

HOW IT ALIGNS WITH OUR VALUES

HOW IT ALIGNS WITH OUR VALUES

More profitable food production and processing helps create healthier communities.

WHERE WE ARE TODAY

WHERE WE WANT TO GO

$292.3 million

Making buildings more efficient lowers carbon emissions and energy costs.

WHERE WE ARE TODAY

WHERE WE WANT TO GO

3.942

The more energy from renewables, the less harmful emissions we produce.

WHERE WE ARE TODAY

WHERE WE WANT TO GO

84.7%

million

in total annual We’ll be making earnings for progress if jobs in food we increase production and earnings for manufacturing. jobs in food production and manufacturing.

square feet of projects in the region are LEED-Certified.

Definition: Annual earnings for jobs in food production sectors.

Definition: Square footage of LEED-Certified projects.

Definition: Electricity generated from renewable sources.

Source: NYS Department of Labor, Quarterly Census of Employment and Wages (2013).

Source: U.S. Green Building Council, Green Building Information Gateway (2014).

Source: U.S. Energy Information Administration, Department of Energy (2012).

Methods: The total annual wages for all jobs held in the following employment sectors: “Crop Production”, “Animal Production and Aquaculture”, “Support Services for Animal Production”.

Methods: Download report by metro area from http://www.gbig.org

Methods: Retrieve data from EIA database for all Erie and Niagara counties. Total all energy production (kWh) of renewable sources, and divide this by total of all energy produced in the two counties.

Frequency: Measured annually.

Frequency: Measured annually.

We’ll be making progress if we increase the square footage of LEEDCertified projects.

of all locallygenerated energy comes from renewable sources.

We’ll be making progress if we increase the share of locallygenerated energy from renewable sources.

Frequency: Measured annually.

One Region Forward: A New Way to Plan for Buffalo Niagara

123


A NEW WAY TO PLAN | HOW WILL WE KNOW WE’RE GETTING THERE?

Are we planning for climate change?

Are we building in a way that best prepares for climate change?

Are we reducing concentrated poverty?

HOW IT ALIGNS WITH OUR VALUES

HOW IT ALIGNS WITH OUR VALUES

HOW IT ALIGNS WITH OUR VALUES

The more we prepare for climate change, the better we’ll be able to handle its impacts.

WHERE WE ARE TODAY

WHERE WE WANT TO GO

9 Climate Smart We’ll be Communities making (e.g. progress if we municipalities increase the and counties number of with a Climate Climate Smart Action Plan) Communities. exist in the region.

The less development on environmentally-sensitive areas, the better we can sustain an erratic climate.

WHERE WE ARE TODAY

WHERE WE WANT TO GO

43.6%

The fewer people living in impoverished neighborhoods, the more opportunity there will be for all.

WHERE WE ARE TODAY

WHERE WE WANT TO GO

23.8%

of all developed We’ll be making land is progress if we currently on decrease the environmentally share of new sensitive areas. development on environmentallysensitive areas.

of the region’s residents live in neighborhoods with concentrated poverty.

Definition: Climate Smart Communities (Communities with a Climate Action Plan).

Definition: Percent of new development on environmentallysensitive areas.

Definition: Percent of regional population residing in census tracts with poverty rates above 20%.

Source: NYS Department of Environmental Conservation (2014).

Source: US Geological Survey, 2011 National Land Cover Dataset (2014); FEMA, Q3 Flood Zone Data (1996); USGS, National Hydrography Dataset (2012).

Source: US Census Bureau, 5-year estimates (2012).

Methods: Surveying local municipalities. Retrieving records from NYS DEC database. Frequency: Measured annually.

Methods: This indicator estimates the percentage of all new development (by area) occurring on lands with an intrinsicallyhigh ecological value, such as wetlands, floodplains, riparian areas and forestland. The numbers are calculated by totaling the area of land developed under each scenario that falls inside of wetlands, floodplains, forests, or within 100 feet of streams. Frequency: Measured annually.

124

One Region Forward: A New Way to Plan for Buffalo Niagara

We’ll be making progress if we decrease the share of residents living in neighborhoods with concentrated poverty.

Methods: This indicator estimates the percentage of the region living in areas of concentrated poverty by dividing the total population of census tracts where the poverty rate is greater than 20% by the total regional population. Frequency: Measured annually, 2-year lag due to data availability.


Is our regional economy becoming more competitive?

Are we keeping the finances of local governments in balance?

HOW IT ALIGNS WITH OUR VALUES

HOW IT ALIGNS WITH OUR VALUES

More businesses established in our region means more opportunity for jobs and a stronger tax base.

Keeping costs and revenues aligned indicates we are living within our means.

COMMITMENTS OF THE ONE REGION FORWARD IMPLEMENTATION COUNCIL Establish an annual working agenda that outlines major Implementation objectives and Council areas of focus for a given year. Setting annual goals and identifying initiatives to focus on will help keep the network’s focus squarely on action. Issue Annual Progress Reports that measure indicator trends and recognizes local actions, project and policy changes that move the region forward.

WHERE WE ARE TODAY

WHERE WE WANT TO GO

WHERE WE WANT TO GO

Total revenues are

28,128 firms are located in the region.

WHERE WE ARE TODAY

0.3%

We’ll be making progress if we increase the number of firms in the region.

less than total costs for all local governments.

We’ll be making progress if our total governmental revenues and costs are in balance.

Definition: Number of business establishments in the region.

Definition: Cost-to-revenue ratio.

Source: NYS Department of Labor, Quarterly Census of Employment and Wages (2013).

Source: NYS Office of Comptroller, Municipal Government Finance Data for Fiscal Year 2011 (2012).

Methods: This indicator shows the number of firms in the region. For firms operating at more than one location, each individual establishment is counted, unless the payrolls are jointly maintained.

Methods: This indicator shows the number of firms in the region. For firms operating at more than one location, each individual establishment is counted, unless the payrolls are jointly maintained.

Frequency: Measured annually, 1-year lag due to data availability.

Frequency: Measured annually, 1 or 2-year lag due to data availability.

Extend the bandwidth of “networked implementation” by continuing programs launched through this process (i.e. Citizen Planning School); identifying pilot projects to launch, adopt and support; and exploring creative, collaborative ways to gain traction on these broad implementation approaches (coordinating planning, smart investments, collaborative partnerships, capacity support, and community learning) as well as specific recommendations outlined under the “5 Big Ideas.” Revisit this plan every five years to make sure it remains relevant and useful to local implementation. Plan updates will respond to changing circumstances including shifts in key trends, progress (or regress) on major indicators, items checked off the network to-do list, evolving community attitudes, and so forth.

One Region Forward: A New Way to Plan for Buffalo Niagara

125


A NEW WAY TO PLAN | APPENDIX

Appendix A Recommended Citation: University at Buffalo Regional Institute, State University of New York at Buffalo, School of Architecture and Planning. 2014. “One Region Forward: A New Way to Plan for Buffalo Niagara.”

Acknowledgements A New Way to Plan for Buffalo Niagara drew on the capabilities and dedication of countless individuals and organizations from across the region. The effort was overseen by our region’s metropolitan planning organization – the Greater Buffalo Niagara Regional Transportation Council; a team from the University at Buffalo School of Architecture and Planning conducted the writing, research, planning and community engagement that shaped this plan; more than 100 subject matter experts from area community-based organizations, governments, businesses, and academic institutions worked to develop specific implementation strategies; and a cross-sectional steering committee guided the process along the way.

Project Leadership and Administration

Greater Buffalo-Niagara Regional Transportation Council One Region Forward has been administered and managed by the Greater BuffaloNiagara Regional Transportation Council (GBNRTC), the region’s Metropolitan Planning Organization. GBNRTC staff also has been coordinating the work of 1RF with their own ongoing transportation planning to ensure that all these efforts align in a way that advances regional mobility and access goals — like connecting quality affordable housing with good jobs. Leadership: Hal Morse Executive Director One Region Forward Steering Committee Chairperson Kelly Dixon, AICP Transportation Analyst One Region Forward Manager

Plan Authorship, Planning, Research, and Engagement

University at Buffalo Regional Institute This document is a product of extensive research, planning, and community engagement conducted by the University at Buffalo Regional Institute (UBRI) in conjunction with faculty, students and staff from UB’s School of Architecture and Planning. Working with partners from around the region, UBRI designed a process that brought together research and technical expertise with innovative approaches to planning and engaging the community. Leadership: Robert G. Shibley, FAIA, AICP Professor and Dean, School of Architecture and Planning Director, UB Regional Institute; Campus Architect Principal Investigator Bart J. Roberts, AICP Research Assistant Professor One Region Forward Manager

126

One Region Forward: A New Way to Plan for Buffalo Niagara


UB Regional Institute Team: Bradshaw Hovey (editorial leadership and public process

design), Brenda Stynes (creative direction and graphic design), Brian Conley (scenario planning leadership, data analysis and mapping), Darren Cotton (community engagement leadership, graphic support), Teresa Bosch de Celis (logistics management and graphic support), Cristina Delgado (Citizen Planning School management), Anthony Armstrong (housing and neighborhood analysis leadership), Matt Wattles (research, mapping and scenario planning support), Laura Quebral (project management support), Kathryn Friedman (legal and policy analysis support), Christina Farrell (editorial support), Jajean Rose Burney (land use working team facilitation), Paul Ray (transportation working team facilitation), Beverly McLean (housing analysis support), Sharon Ana Entress (general research support), Heather Warner (editorial and administrative support).

Faculty Research Support: Dr. Samina Raja (Associate Professor, Department of Urban and

Regional Planning), with support from the Food Systems Planning and Healthy Communities Lab; Dr. Himansh Grover (Assistant Professor, Department of Urban and Regional Planning), Lynda Schneekloth (Professor Emeritus, Department of Architecture); Hiro Hata (Associate Professor, Department of Architecture).

Graduate Student: Bianca Acevedo; Brendan Anderson; Matthew Austin; Rushikesh Umesh Bhadane; Andrew Dearing; Tanveer Singh Dhillon; Andrea Doyle; Moath Mahmoud Falah Rababah; Emily Gibson; Xiyu Huang; Jessica Hall; Yoonhee Jung; Kiersten Minnick; Travis Norton; Daryl Ryan; Seyed Saeid Saadatmand; Zhitong Su; Chenxi Ye.

Steering Committee

One Region Forward has been directed by a steering committee composed of government, nonprofit, and academic organizations with capacity and experience in transportation, housing, economic development, community health, public engagement, and regional planning. The group met monthly through the planning process to oversee all activities.

Association of Erie County Governments Represented by Supervisor Glen Nellis of the Town of Eden and Supervisor Dennis Powers of the Town of Elma

Belmont Housing Resources of WNY Represented by Mike Riegel (Vice President of Housing Development)

Buffalo Niagara Medical Campus Represented by William Smith (Director of Campus Access)

Buffalo Niagara Partnership Represented by Laura St. Pierre Smith (Vice President) and Steve Ricca (Chairman of Development Advisory Council)

Buffalo Niagara Riverkeeper Represented by Jill Jedlicka (Executive Director)

City of Buffalo Represented by Brendan Mehaffy (Executive Director) and Bill Parke (Community Planner) of the Mayor’s Office of Strategic Planning

City of Niagara Falls Represented by Tom DeSantis (Senior Planner) and James Bragg (Planner)

Daemen College Center for Sustainable Communities and Civic Engagement Represented by Tyra Johnson (Advisory Board member)

Empire State Development, WNY Region Represented by Mike Ball (Deputy Director) and Jennifer Gregory (title needed)

Erie County Represented by Maria Whyte (Commissioner) and Tom Dearing (Deputy Commissioner) of the Department of Environment and Planning

Greater Buffalo Niagara Regional Transportation Council (GBNRTC)* Represented by Hal Morse (Executive Director) and Kelly Dixon (Transportation Analyst)

Local Initiative Support Corporation, Buffalo Represented by Mike Clarke (Executive Director)

New York State Department of State, Division of Smart Growth Represented by Paul Beyer (Director)

One Region Forward: A New Way to Plan for Buffalo Niagara

127


A NEW WAY TO PLAN | APPENDIX

New York State Department of Transportation Represented by Frank Billittier (Assistant Regional Design Engineer)

Niagara Falls Housing Authority Represented by Willie Dunn (Service Coordinator)

Niagara County Represented by Benjamin Bidell (Senior Planner, Department of Economic Development)

Niagara County Supervisors Association Represented by Supervisor Ross Annable of the Town of Hartland

Niagara Frontier Transportation Authority (NFTA)* Represented by Darren Kempner (Manager of Grants)

The John R. Oishei Foundation Represented by Larry Cook (Program Officer)

University at Buffalo Regional Institute Represented by Robert G. Shibley (Director), Bart Roberts (Research Assistant Professor) and Bradshaw Hovey (Senior Fellow)

VOICE Buffalo Represented by Duane Diggs (President)

Western New York Environmental Alliance Represented by Ryan McPherson (Chairperson)

Working Teams

Over 100 regional experts and citizen advocates worked together to develop the implementation strategies outlined in this plan. Their work was shared with our Working Team Contributors, citizens who enrolled to provide detailed feedback on the work in progress through the two-year process.

Climate Change Action Working Team: Aliesa Aldelman, Wendel Companies; Nate Drag,

Alliance for the Great Lakes; Erin Heaney, Clean Air Coalition of WNY; Thomas Hersey, Erie County; Padma Kasthurirangan, Niagara Wind & Solar; Michael Licata, TM Montante Solar; Sean Myers, NBT Solutions LLC; Bill Nowak, Consultant to Buffalo Geothermal Heating and Cooling; Lou Paonessa, Niagara Power Project, New York Power Authority; Jonathan Schultz, Niagara County Emergency Services Office; Jim Simon, UB Office of Sustainability; Bill Smith, Buffalo Niagara Medical Campus; Kelly Tyler, NYSERDA; Terry Yonker, Marine Services Diversified, LLC; WNY Sustainable Energy Association Trust; WNY Environmental Alliance.

Food Access and Justice Working Team: Susannah Barton, Grassroots Gardens of Buffalo;

Jen Bieber, Town of Royalton; Jim Bittner, Singer Farms; Natalie Cook, Cornell University Cooperative Extension - Niagara County; Andrea Fadel, City of Buffalo; Phil Haberstro Wellness Institute of Greater Buffalo; Fred Heinle, Alden Chamber of Commerce; Diane Held, American Farmland Trust; Sara Jablonski, Food for All; Cathy Lovejoy Maloney, Cornell Cooperative Extension of Niagara County; Sean Mulligan, Food Policy Council of Buffalo and Erie County; Derek Nichols, Grassroots Gardens of Buffalo; Phil Perna, Supermarket Management, Inc.; Diane Picard, The Massachusetts Avenue Project; Mark Rountree, Erie County Department of Environment and Planning; Mary Stottele, Americorps VISTA Health Coordinator; Cheryl Thayer, Cornell Cooperative Extension; Lisa Tucker, Field & Fork Network; Mike Van Der Puy, American Chemical Society; Bob Watkins, Community Beer Works; Pat Watson, AARP

Housing and Neighborhoods Working Team: Grace Andriette, Neighborhood Legal

Services, Inc.; Catherine Braniecki, Community Development Manager - KeyBank; Roxanne Button,Design Synergies; Michael Clarke, Buffalo LISC; Brandi Collins, Oshei Mobile Safety Net Team;Richard Greenberg, Home Buyers Marketing II; Cyndie Huynh, Oshei Mobile Safety Net Team; Tod Kniazuk, Arts Services Initiative of Western New York; Shannon Koehn, Housing Opportunities Made Equal; Carla Kosmerl, Town of Cheektowaga - Office of Community Development; Robyn Krueger, Community Missions of Niagara Frontier; Cara Matteliano, Community Foundation for Greater Buffalo; Ellary Mori, Erie County Department of Environment and Planning; Christie Nelson, City of Buffalo Director of Real Estate; Christopher Ollinick, Jaeckle Fleischmann & Mugel, LLP; Michael Riegel, Belmont Housing Resources for WNY, Inc.; David Rodriguez, BMHA/Hispanics United; Stephanie Simeon, Heart of the City Neighborhoods, Inc.; Dale Zuchlewski, HAWNY; Lori Borowiak, NYSERDA; Jenifer Kaminsky, PUSH Buffalo; Tom Lowe, ReNU Niagara; Jill Shuey, ReNU Niagara; Roseann Scibilia, University District Community Development Association. 128

One Region Forward: A New Way to Plan for Buffalo Niagara


Land Use and Development Working Team: Anthony Armstrong, Buffalo LISC; Dan

Castle, Village of East Aurora/Planning Commission; Brian Dold, Buffalo Olmsted Parks Conservancy; Wesley Dust, Erie County Water Authority; Jessie Fisher, Buffalo Niagara Riverkeeper; Amy Fisk, Niagara County Dept. of Economic Development; Eric Gillert, Town of Amherst Planning Department; Anthony Hahn, Niagara County Sewer District; Dan Howard, Town of Amherst Planning Department; Kellena Kane, Uniland Development Company; Jason Knight, Buffalo State College Department of Geography and Planning; Mayor William Krebs, Village of Springville; Keith Lucas, City of Buffalo; Joshua Mumm, WNY Area Labor Federation, AFL-CIO; Julie O’Neill, Buffalo Sewer Authority/ Office of Strategic Planning; Matthew Pelkey, Anspach Meeks Ellenberger LLP; Robert Pidanick, Nussbaumer and Clarke, Inc.; Steve Ricca, Jaeckle Fleischmann & Mugel, LLP; Laurence Rubin, Kavinoky Cook, LLP; Micaela Shapiro-Shellaby, Coalition for Economic Justice; Laura Smith, Buffalo Niagara Partnership; Nancy Smith, Western New York Land Conservancy; David Stebbins, Buffalo Urban Development Corporation; Laurie Stillwell, Buffalo Niagara Riverkeeper; Richard Tindell, City of North Tonawanda Community Development Department.

Transportation and Mobility Working Team: Jack Ampuja, Supply Chain Optimizers;

James Bender, Hearts and Hands: Faith in Action; Justin Booth, Go Bike Buffalo; Duane Diggs, VOICE Buffalo; Gladys Gifford, Citizens for Regional Transit; Jamie Hamann-Burney, Buffalo Niagara Medical Campus, Inc.; Matt Hartrich, Buffalo Niagara Partnership; Darren Kempner, NFTA; Mayor Brian Kulpa, Village of Williamsville; Dan Leonard, Buffalo Niagara Partnership; Mike Leydecker, WENDEL Companies; Jordana Maisel, UB Inclusive Design EA Center; Brenda O’Neill, Southtowns Rural Transit Corporation Inc.; Leonard Pero, Town of Brant; Creighton Randall, Buffalo CarShare; Eric Schmarder, City of Buffalo; Annie Todd, Oishei Mobile Safety Net Team; Paul Tronolone, USA Niagara.

Fair Housing Equity Advisory Committee: Beverly Mclean, UB Architecture and Planning;

Bill Parke, City of Buffalo Planning; Brenda McDuffie, Urban League; Brian Planty, Evergreen Health Services of WNY; Carla Kosmerl, Cheektowaga Community Development; Crystal J. Rodriguez, City of Buffalo Commission on Citizen’s Rights and Community Relations; Diane Cadle, Erie County Planning; Eva Hassett, International Institute; Gino Russi, Hispanos Unidos de Buffalo; Grace Andriette, Neighborhood Legal Services; James Bragg, City of Niagara Falls; Jim Hartz, Tonawanda Planning Dept; Joe Butch, Community Advocate; Joe Kellemen, WNY Law Center; Michael Helman, Learning Disability Association; Mike Reigel, Belmont Housing Services; Richard Tindell, Director, North Tonawanda Community Development; Rosanne Scabilia, Erie County Fair Housing Partnership; Sam Magavern, Partnership for Public Good; Scott Gehl, HOME; Seth Picarello, City of Niagara Fals Community Development; Stephanie Simmeon, Heart of the City Neighborhoods; Sue Divita, Town of Amherst; Tod Kniazuk, Community Advocate; Willie Dunn, Niagara Falls Housing Authority.

Working Team Contributors: Lorrie Abounader, Buffalo Niagara Enterprise; Harvey

Albond, President Niagara Falls Rotary Club; Lou Battaglia, concern citizen; Bonnie Benton, concern citizen; Meredith Bilsky, UB Dietetic Intem; David Bradley, Buffalo Wind Action Group, also United Steelworkers, Sierra Club; Jay Bumey, WNYEA; Erin Carmina, 500 Block Association of Main Street in Downtown Buffalo; Julie Carter, Rusty Nickel Coop (food buying club); Christine Chiriboga, concern citizen; Joseph Garguilo, concern citizen; Steven Gates, Seneca Nation of Indians; Jeff Goodwin, concern citizen; Mary Haefner, Preservation Buffalo Niagara; Heather Helman, concern citizen; Justin Imiola, University at Buffalo; Derik Kane, concern citizen; Lari Komiczky, Sweet Home Central School District; Meg Lauerman, Continental 1; Jerry Malczewski, concern citizen; Joy McDuffie, concern citizen; Richard Mrugala, concern citizen; Mathew Nagowski, Board Member, Partnership for the Public Good, Cornell Club of Greater Buffalo; Jerome Nagy, concern citizen; David Paoletta, concern citizen; Lori Riker, Benchmark Engineering & Science; Suzie Rivo Solender, Amherst Youth Board; Jill Rohring, Village of Wilson, Planning Board; Douglas Scheider, concern citizen; Ted Schmidt, concern citizen; Alison Schweichler, WNY Drilling Defense; Anne Smith, concern citizen; Christopher Snyder, University at Buffalo; Marilyn Sozanski, Board - Family Promise of WNY, People’s Park, TriMain Development, Artfarms; Michael Spong, WKBW-TV; Mary St. Mary, Binational Alliance, WNY Public Health Alliance; John Szalasny, concern citizen; Dan Ulatowski, Town of Cheektowaga Planning Department; Tim Van Oss, concern citizen; Steve White, concern citizen; Christopher Willett, concern citizen; Jennifer Yuhnke, Heart of the City Neighborhoods, Inc.

One Region Forward: A New Way to Plan for Buffalo Niagara

129


A NEW WAY TO PLAN | APPENDIX

Appendix B

Data Sources and Notes WHERE ARE WE?

Where We Are Matters p8

130

U.S. Census Bureau, 1970, 2010. Ibid. iii. U.S. Census Bureau, 2010-2012. iv. US Census Bureau, American Community Survey, 5-year estimates, 2006 and 2012. v. U.S. Department of Labor: Bureau of Labor Statistics, Quarterly Census of Employment and Wages, 2010; US Census Bureau, 1970, 1980, 1990 & 2000. vi. U.S. Census Bureau, 1970, 2010. vii. Greater Buffalo Niagara Regional Transportation Council, 2011. viii. US Census Bureau, 1970; US Census Bureau, American Community Survey, 1-Year Estimate, 2010. ix. The aggregate direct expenditures per capita for all local governments in Erie and Niagara County grew by 6.74% from 1972 to 2011 (adjusting for inflation). Sources: New York State Office of the State Comptroller, Local Government and School Accountability: Financial Data: Data for Local Governments, 2011. Accessed January 3, 2013 at http://www. osc.state.ny.us/localgov/datanstat/findata/index_choice.htm; US Census Bureau, 1970, and 2010; U.S. Department of Commerce: Social and Economic Statistics Administration: Bureau of the Census, 1972 Census of Governments Volume 5: Local Government in Metropolitan Areas, 1975. Accessed January 3, 2013 at http://www.census.gov/govs/pubs/year. html#1970-1979; U.S. Department of Labor: Bureau of Labor Statistics, Databases, Tables & Calculators by Subject: CPI Inflation Calculator, 2013. Accessed January 3, 2013 at http:// www.bls.gov/data/inflation_calculator.htm NOTES: For 2011, expenditures listed as “Charges to Other Governments” were subtracted from total expenditures (not including interfund transfers) from the NYSOC municipal finance data. Data was aggregated to derive region-wide figures before being divided by the regional population given by the 2010 US Census to yield the amount of local government spending per capita. For 1972, expenditures of school districts and special districts were subtracted from total direct general expenditure for each county given by the Census of Governments data. These figures were aggregated for the region and divided by the total population of the region as given by the 1970 US Census to produce the amount of local government spending per capita. After these calculations, dollar amounts were adjusted for inflation to represent a value equivalent to USD in 2012. x. Niagara Frontier Transportation Authority, 1992-2012 Annual Ridership Data, 2013. xi. U.S. Census Bureau, Building Permits Survey, 2012; American Community Survey, 2012 1-year estimates. xii. In 1990, the median home value in first-ring suburbs of Buffalo Niagara was $136,735 (after adjusting for inflation) - about $10,000 more than in 2012 ($126,988). Sources: U.S. Census Bureau, 1990; American Community Survey, 5-year estimates (2008-2012). NOTE: First-ring suburbs of Buffalo and Niagara Falls include the towns of Amherst, Cheektowaga, Hamburg, Niagara, Orchard Park, Tonawanda, and West Seneca. xiii. Epstein, Jonathan D. “Region Leads the Nation In Real Estate Appreciation.” The Buffalo New, December 14, 2013. xiv. USDA-National Agricultural Statistical Service, Census of Agriculture, 1976, 2009. xv. Source: U.S. Geological Survey. (1997). 1992 New York Land Cover Dataset; U.S.D.A., National Agricultural Statistics Service, Research and Development Division, Geospatial Information Branch, Spatial Analysis Research Section. (2012). Cropland Data Layer; Erie County Department of Environment and Planning. (2012). Parcel Data; Niagara County Department of Economic Development. (2011). Parcel Data. NOTES: GIS analysis overlaying parcel data with land cover data found over 55 square miles within Buffalo Niagara of former cropland (as identified by satellite imagery in 1992) not within current cropland and within residential lots where homes were built after 1992. i.

ii.

One Region Forward: A New Way to Plan for Buffalo Niagara


What Have We Been Doing? p 21

Change in Population and Developed Land, 1970-2010: US Census Bureau, 1970, 2010. Commuting Modes, 1970 vs. 2010: US Census Bureau, 1970; US Census Bureau, American Community Survey, 1-Year Estimate, 2010. Daily Vehicle Miles Traveled per Capita, 1970 vs. 2010: Greater Buffalo Niagara Regional Transportation Council, 2011. Percent Change in New Homes and Vacant Housing Units, 1970-2010: US Census Bureau, 1970, 2010. Acres of Farmland, 1969 vs. 2007: USDA-National Agricultural Statistical Service, US Census of Agriculture, 1976, 2009. New Roads Built, 1990-2010: University at Buffalo Regional Institute, Independent analysis using U.S. Census Bureau TIGER\Line Roads Data, 1990 and 2010. Cost estimate from NYS Office of the State Comptroller, 2011, Local Government Snapshot: Local Government Spending on Highways. Accessed January, 2013 from www.osc.state.ny.us/localgov/pubs/ research/snapshot/highwayspending.pdf NOTES: Spatial roads data for the years 1990 and 2010 was retrieved from the U.S. Census Bureau in geographic information systems (GIS) format for the Buffalo-Niagara region. All line segments from the 2010 roads file that fell outside 100 feet of 1990 roads were selected. These road segments were compared with the 1990 roads layer, on a segment by segment basis, ensuring that all previously existing roads were excluded from the estimate of new roads. The aggregate length of roads constructed since 1990 within the two-county region was then calculated using ArcGIS software. Local Government Debt-to-Revenue Ratio: NYS Office of the State Comptroller, 2012. Local Government Municipal Finance Data, Level One, FY 2011. Accessed February 2013 at http:// www.osc.state.ny.us/localgov/datanstat/findata/index_choice.htm

WHERE ARE WE GOING?

Where Should We Go From Here? p 34

How the Business as Usual scenario was constructed: The spatial projection of new homes assumes that over the next forty years each municipality will absorb the same proportion of the regional increase in new housing units that it did from 1990 to 2010, based off of trends from US Census data. The exact placement of new housing units within each municipality is based on the conditions that have been associated with new home construction from 1990 to 2010, such as more open green space, newer homes, lower vacancy rates, higher home values and lower property tax rates, as revealed through a spatial regression analysis that found these conditions to be correlated to an increase in the number of homes within census tracts from 1990 to 2010. New homes were placed according to land use data (from Erie County Department of Environment & Planning, 2012 and the Niagara County Department of Economic Development, 2011) and current zoning information (obtained from counties and municipalities), which was used to make an assumption on the type of home built at each parcel using allowable lot sizes of municipal zoning regulations. The number of abandoned homes in the region was found by subtracting the 150,000 new homes projected to be built by 2050 from the number of total households projected to live in the region in 2050 (574,320) to find the number of households that would occupy homes that already exist (424,320). The remainder of the 473,720 housing units that are currently occupied (44,399) would be vacant. 7% of units were assumed to be vacant to allow for functional turnover rate in the local residential market, meaning 41,219 would be abandoned. The spatial projection of abandoned homes assumes that over the next forty years each municipality will absorb the same proportion of the regional increase in abandoned units that it did from 1990 to 2010, based on trends from US Census data. The exact placement of abandoned units within each municipality is based off of the conditions that have been associated with intensifying abandonment in the past, such as lower home values, older housing, the number of non-white residents, and high vacancy rates, as found through a spatial regression analysis that revealed a correlation between these factors and an increase in the number of abandoned units (classified as vacant, not for rent or sale) at the census tract level from 1990 to 2010. The number of new jobs within each type of municipality pivots off of the build-out of residential units. A ratio of jobs per housing unit is found using 2010 block-level Census data for each municipality type. The projection assumes that these ratios will be preserved in 2050. The number of new housing units within each type of municipality given by the residential build-out is multiplied by the current ratio of jobs to housing units within each

One Region Forward: A New Way to Plan for Buffalo Niagara

131


A NEW WAY TO PLAN | APPENDIX

municipality type to estimate the number of new jobs to be located in each type of municipality in 2050. Jobs are then distributed amongst the three major industry sectors (industrial, office and retail) to preserve the current sector composition of jobs within each type of municipality (eg, if 50% of the jobs within first-ring suburbs in 2010 were retail jobs, 50% of the new jobs projected to be within first-ring suburbs in 2050 will also be retail). The number of jobs per new commercial building within each generalized building type is found for the three broad industry sectors and multiplied by the projected number of jobs in each sector for each type of municipality to derive an estimate of the number of buildings holding jobs for each industry sector within each type of municipality. Projected locations of new commercial buildings follow zoning regulations. The placement of new commercial buildings within currently vacant lots favors parcels with lower property values, located near major commercial corridors, within existing sewer districts, in areas with a higher concentration of new homes, and in areas with a lower vacancy rates. How the Three Alternative Scenarios were constructed: All 115 citizen-created maps were digitized using ArcGIS software by geo-referencing high-resolution images of each map and recording the mapping activity elements (“place type” chips and markers) using a polygrid file of one-quarter square mile cells covering the region. All maps were grouped into one of the three alternative scenarios based on common tendencies and aggregated to give the collective arrangement of all mapping activity elements for each scenario. From this, the number of jobs and homes within each “place type” within different types of municipalities (e.g., cities, villages, first ring suburbs, outer suburbs and rural towns) was found for each scenario. This information was used to determine where projected new homes and jobs were placed in each scenario, and what development pattern they assumed. Using Envision Tomorrow Plus (ET+) software (developed by Fregonese Associates of Portland, Oregon and the Metropolitan Research Center, available for download at http:// www.arch.utah.edu/cgi-bin/wordpress-etplus/), building type models were designed using a variety of local data and aggregated up to prototypical development type models which corresponded to the “place type” pieces used by citizens in the mapping workshops. These locally-calibrated development types were “painted” in different configurations throughout the region for each scenario based on this literal interpretation of the aggregated placement of “place types” for each scenario. For more information on ET+ software, the local inputs used and the modeled indicators see “How Do Our Choices Play Out?” below.

How Do Our Choices Play Out? p 36

132

Percent of New Homes in Developed Area: This is the percentage of new homes, or jobs located within currently developed areas (USGS, 2011 National Land Cover Dataset, 2014). The number was calculated by multiplying the area of new development within developed areas by the housing density of the type of development built. This was divided by the total housing growth in each scenario to give a percentage. Percent of New Jobs in Developed Area: Ibid. Homes Left Abandoned: These estimates show the number of currently abandoned homes, along with homes projected to be abandoned under the “Business as usual” scenario that remain abandoned, or in other words, are not rebuilt, rehabilitated or re-occupied, under each scenario. Homes projected to be left abandoned in the “Business as usual” scenario were rebuilt or redeveloped in each alternative scenario based on the placement of new housing per scenario which was determined by participant feedback in the scenario mapping workshops. New Jobs Brought Back to Former Industrial Sites:The number of jobs added to Brownfield Opportunity Areas [BOA’s] (registered under the New York State, Department of State’s BOA Program) was found based on the area of new development within these zones and the job density of the development types built within BOA’s under each scenario. New paved surfaces: The area of new paved (or impervious) surfaces, including roads, sidewalks, and parking lots, was found by multiplying the land area of undeveloped “greenfield” land developed under each scenario by an estimate of percentage impervious cover for each type of development built on “greenfields” in each scenario. Percent of new homes in walkable communities: This is the percent of new homes built in mixed-use forms of development where homes are in close proximity to jobs and amenities as opposed to neighborhoods with mostly just homes. For the “Business as usual” scenario, the type of home built assumes the allowable lot size given by municipal zoning regulations of each developed parcel. For the alternative scenarios, the type of home built at each lo-

One Region Forward: A New Way to Plan for Buffalo Niagara


cation was based on the type of development constructed in each scenario and the general types of homes within that form of development. The number of homes built in walkable communities was divided by the total number of new homes constructed to give a percentage. Walkability: This shows a region-wide index of the “walkability” of new development on a 0 to 100 scale, with 100 representing the most “walkable” score possible. The calculation uses intersection density and the average distance of homes to amenities, such as retail, offices, schools, parks, as proxies for walkability. Transit Proximity to New Homes: The number of new homes, or jobs added within ½ mile along a road of metro stops and bus stops where the wait between stops during peak weekday hours averages less than 15 minutes (NFTA, 2012). Using ArcGIS’ Network Analyst, areas experiencing new development that lie within ½ mile buffers along roads that connect to frequent transit stops were constructed for each scenario. The number of homes with transit access was calculated by multiplying the area of development within these buffers by the average density of each type of development. A number of existing, infrequent bus stops were converted into frequent bus stops under each alternative scenario based on the average extent of new transit connections made across the Scenario Planning Workshops’ citizen-created maps grouped under each scenario. Transit Proximity to New Jobs: Ibid. Daily Vehicle Miles Traveled (VMT) Per Capita: The total distance traveled by all vehicles across the region in one day divided by the total regional population. Number was found using the Envision Tomorrow Household 7D model which accounts for future changes in land use, transit service and road network. It estimates VMT using a set of land use and demographic variables, including average household size, employees per household, income, jobs accessible by transit and intersection density, that research has shown can be used to help predict the distance and number of trips taken by automobiles within a given area. Lane Miles of New Road: The length of new roads constructed, in miles, multiplied by the number of lanes in new roads (for example, one mile of a new road that has two lanes would equal two new lane miles). The number of lane miles under each scenario was calculated based on the area of currently undeveloped, open land experiencing new development under each scenario and an estimate of the number of lane miles per unit area within the type of development built on undeveloped land. An estimate of lane miles per acre within each development type was found by manually calculating the number of road lane miles within existing local examples of development types using ArcGIS software. Percent of Open Space Conserved from Development: Found by adding up the area of new development under each scenario within vacant parcels (Erie County Department of Environment and Planning, 2012, and Niagara County Department of Economic Development, 2011) that fall outside of the developed land area (USGS, 2011 National Land Cover Dataset, 2014) and dividing this value by the total area of existing vacant parcels in undeveloped areas. Current and Potential Prime Farmland Lost to Development: The total area of new development under each scenario that takes place on top of either current farmland (US Department of Agriculture, Natural Resource Conservation Service, “Common Land Unit and Farm Service Areas for Erie and Niagara County, NY, Restricted Use”, 2012) or on soils classified as “prime farmland”, or “prime farmland if drained” (US Department of Agriculture, Natural Resource Conservation Service, “Soil Survey Geographic Database for Erie and Niagara County, NY”, 2011). Acres of Development on Environmentally-Sensitive Areas: An estimate of the number of acres of new development on lands with an intrinsically-high ecological value, such as wetlands, floodplains, riparian areas and forestland. Calculated by totaling the area of land developed under each scenario that falls inside of wetlands (USGS, 2011 National Land Cover Dataset, 2014), floodplains (100-year floodplains delineated by Federal Emergency Management Agency, Digital Q3 Flood Zone Data, 1996), within 100 feet of streams (NYS Department of Environmental Conservation, National Hydrography Dataset, 2012) , or forests (USGS, 2011 National Land Cover Dataset, 2014). Energy Savings per Household (Compared to Existing Conditions): This is based on the types of homes built in each scenario and general characteristics of housing, such as square footage, and proximity to services and transit, that have knowable impacts on energy consumption. Assumptions were based on regional averages for residential energy use per household from the US Energy Information Administration’s Residential Energy Consumption Survey. These were applied to building types, and then aggregated to development types before being summated at the regional level for each scenario. The total residential energy usage was divided by the number of households and compared to the model output of existing conditions to give the overall percent change in energy use per household.

One Region Forward: A New Way to Plan for Buffalo Niagara

133


A NEW WAY TO PLAN | APPENDIX

Local government cost to revenue ratio: Calculated using the Envision Tomorrow software’s Fiscal Impact Tool extension which bases its methods on the Federal Reserve Fiscal Impact Tool. It is a regional analysis that aggregates all incorporated jurisdictions and provides a standardized method for conducting planning-based fiscal assessments. The FIT estimates of local revenues and cost come from the Census of Government finance data (2010). Other local inputs include the county population, annual taxable sales, property and sales tax rates (weighted average), property assessment ratios (weighted average), the new population and employment added to the region by 2050 from the scenario assumptions, and the monetary value of new development by land use type (from ET+). Future revenue of local governments: Regional weighted averages for property tax, sales tax, income tax and non-tax revenue (sewerage, utilities, intergovernmental funds, etc….) were applied to the new population, employment and building values added in each scenario. Future sales tax revenue is projected by multiplying an estimate of the total payroll (given by Bureau of Labor Statistics, Quarterly Census of Employment and Wages, 2012) of regional employees by an estimate of the percent of consumer dollars spent that are subject to sales tax (US Census Bureau, County Business Patterns, 2010). Property tax revenue was calculated by multiplying an estimate of the market value of the property constructed (using regional average construction costs per square foot from rsmeans.com and assessed land value from parcel data) in each scenario by the property tax rate (using regional weighted averages found from NYS Office of the Comptroller data on Property Tax Levies (2012)) by a regionally-averaged assessment ratio (74% for residential properties, and 54% for commercial properties). Income tax revenue was projected by multiplying the average annual wage of new employment by the number of employees by a weighted average of income tax rate. Non-tax revenue was projected by multiplying the current non-tax revenue per capita by the projected regional population in 2050. All projections assume a constant rate of increase in employment and sales tax revenue from the present until the year 2050. Future expenditures of local governments: These include both one-time expenditures on new infrastructure as well as on-going expenditures on infrastructure maintenance and government operations. Capital outlay costs for new infrastructure were calculated using assumptions of construction costs for new roadway ($1,700,000 per lane mile, Arkansas DOT), sewerage ($162 per lineal foot, Department of Public Works, Ipswich, MD and costhelper.com) utilities ($600,000 per mile, Western Massachusetts Electric Company), and water lines ($208 per lineal foot, homewyse.com). Operations and maintenance costs track the costs of education, hospitals, roads, police, fire, parks, sewerage, solid waste and utilities (US Census Bureau, Census of Local Governments, 2010). To estimate increases in the future costs of operations and maintenance, the current operation and maintenance costs per capita were multiplied by the percent change in average annual capital outlay. The level of service is fixed and assumes a constant rate of increase in population and operations and maintenance costs until the year 2050.

HOW DO WE GET THERE?

Big Ideas: Create Great Places and a Thriving Economy through Efficient Land Use p 54

134

“Urbanized Land” Map Notes: 1970: A raw satellite image of the region from 1975 (obtained from the USGS/NASA Global Land Survey program) was used to estimate the extent of developed land. “Ground-truth” points known to have been developed in 1975 were used as training samples to inform a Maximum Likelihood Classification of the image derived through an Image Classification function of ArcGIS Desktop Software (Release 10, Earth Systems Research Institute). This method was found to classify developed areas with 84% accuracy. The estimate of developed land extent was merged with an approximation of the US Census’ designation of urbanized land which defines urbanized areas as places with population densities of 1,000 people per square mile. Using the Kernel Density function of ArcGIS Software, areas with more 370 residential parcels built before 1970 (as given by NYS Real Property Tax Data) per square mile were found and extracted as an approximation of areas with population densities above 1,000 people per square mile (based on the average household size in 2010, or 2.7 persons per household, which was used for consistency with the accompanying maps).

i

One Region Forward: A New Way to Plan for Buffalo Niagara


These two layers were combined and scrubbed to produce the visual shown. 1990: Areas classified as developed (including developed open space) by USGS’ 1992 NLCD (published in 2000) were merged with an approximation of the US Census’ designation of urbanized land (defined as areas with more than 1,000 people per square mile). Using the Kernel Density function of ArcGIS Software, areas with more 370 residential parcels built before 1990 (as given by NYS Real Property Tax Data) per square mile were found and extracted as an approximation of areas with population densities above 1,000 people per square mile (based on the average household size in 2010, or 2.7 persons per household, which was used for consistency with the accompanying maps). These two layers were combined and scrubbed to produce the visual shown. 2010: This visual was produced through the same methods as the 1990 graphic using the USGS’ 2012 NLCD (published in 2014) and the density of all residential parcels built before 2010 (as given by NYS Real Property Tax Data). ii. USGS National Land Cover Data classifies all areas of the conterminous US into distinct categories of land cover. Versions of this data set for 1992 (published 2000) and 2011 (published 2014) were analyzed in GIS to summate the total land area classified as developed within Buffalo Niagara. This area was divided by the population estimates of the two counties taken by the US Census Bureau during July of each year. iii. Residential structures built after 1970 were selected by attribute information in the Real Property Data. GIS was used to count the number of these parcels that intersected: (1) areas classified as “Prime Farmland” or “Prime Farmland if Drained” by USGS, SSURGO data, (2) 100-year flood plains delineated by FEMA (1996), and (3) areas classified as being forests or wetlands in 1992 by the USGS’ NLCD (2000). iv. Spatial roads data for the years 1990 and 2010 was retrieved from the U.S. Census Bureau in geographic information systems (GIS) format for the Buffalo-Niagara region. All line segments from the 2010 roads file that fell outside 100 feet of 1990 roads were selected. These road segments, representing roads likely to have been constructed since 1990, were compared with the 1990 roads layer, on a segment by segment basis, ensuring that all previously existing roads were excluded from the estimate of new roads. The aggregate length of roads constructed since 1990 within the two-county region was then calculated using ArcGIS software. v. GIS analysis was used to sum the acreage of all public land protected by local, state or federal government, and land under conservation easements given by the National Conservation Easements Database and the WNY Land Conservancy.

Big Ideas: Connect Our Places by Expanding and Diversifying Our Transportation Options p 66

American Automobile Association Newsroom, “Your Driving Costs: How much are you really paying to drive?”, 2013. Accessed October, 2014 at http://newsroom.aaa.com/wp-content/uploads/2013/04/YourDrivingCosts2013.PDF Estimated total annual cost of owning a small sedan is given as $7,962, and includes costs for fuel, maintenance, tires, insurance, fees, depreciation and financing. ii. Niagara Frontier Urban Area Freight Transportation Study Final Report, 2010. Accessed October , 2014 at www.gbnrtc.org/files/6213/2769/5475/Final_Report.pdf iii. The Network Analyst extension of ArcGIS Software was used to delineate areas within one half mile of a NFTA Bus or Metro stops along a road. The percentage of the region’s residents and employment within these areas was estimated using spatial data on population (US Census Bureau, TIGER\Line Shapefiles, 2010) and jobs (US Census Bureau, Location Employment Dynamics, 2011) both given at the census block-level. The population density and employment density were calculated for each census block. The percentage of each block that fell within one-half mile of NFTA stops was multiplied by the calculated density to estimate the number of people and jobs within access to transit. iv. Niagara Frontier Transportation Authority, 2013-2014 Annual Performance Report, Evaluating Key Performance Indicators. Accessed October, 2014 at http://metro.nfta.com/ pdfs/2014AnnualReport.pdf v. American Petroleum Institute, State Gasoline and Tax Report, 2014. Accessed October, 2014 at http://www.api.org/oil-and-natural-gas-overview/industry-economics/fuel-taxes vi. New York State Office of the Comptroller, The Dedicated Highway and Bridge Trust Fund: A Shrinking Investment in New York’s Future, Accessed February 2014 at http://www.osc. state.ny.us/reports/trans/dhbtf020413.pdf vii. Center for Transportation Excellence, “Transportation Ballot Measures”, 2014. Accessed October, 2014 at http://www.cfte.org/elections i.

One Region Forward: A New Way to Plan for Buffalo Niagara

135


A NEW WAY TO PLAN | APPENDIX

Big Ideas: Provide Housing Choices in Neighborhoods that are Great Places to Live p 76

Big Ideas: Strengthen Our Food Systems for a Healthier Population and Economy p 86

136

In 1990, the median home value in first-ring suburbs of Buffalo Niagara was $136,735 (after adjusting for inflation) - about $10,000 more than in 2012 ($126,988). Sources: U.S. Census Bureau, 1990; American Community Survey, 5-year estimates (2008-2012). NOTE: First-ring suburbs of Buffalo and Niagara Falls include the towns of Amherst, Cheektowaga, Hamburg, Niagara, Orchard Park, Tonawanda, and West Seneca. ii. The proportion of homeowners with affordable housing costs excludes households whose housing costs as a percentage of income were “not computed” or listed as having “zero or negative income” by the US Census Bureau. Additionally, those rental households listed as having “No Cash Rent” (these are housing units likely owned by family or friends of the occupants who provide their tenants with housing free of charge) were counted as affordable housing units on the basis that, if one is not required to pay rent, their housing is affordable regardless of income. iii. The number of “other” vacant units in first-ring suburbs increased from 1,053 in 1990 to 2,812 in 2010. Calculation totals the number of vacant units not listed as for rent or sale and intended for year-round occupancy within the towns of Amherst, Cheektowaga, Hamburg, Orchard Park, Lewiston, Lockport, Niagara, Tonawanda, West Seneca and Wheatfield (not including villages and cities within these towns) using census tract-level data. iv. “Homes Built After 1970 and Abandoned Homes” Map Notes Homes built after 1970 were found using the “property class code” and “year built” attribute information of the real property tax parcel data from the NYS Dept. of Taxation and Finance (2010). The approximate location of current abandoned homes shown on the map is based on the number of housing units classified as “other vacant” (i.e., not for rent or sale but intended for yearround occupancy) given by the US Census (2010) at the census-tract level. The abandoned homes shown within each census tract on the map is equal to the number given by the US Census (2010) for the corresponding census tract. Using real property tax parcel data from the NYS Dept. of Taxation and Finance (2010) and census data at the block group level, individual residential parcels were scored for their likelihood of being abandoned based on the conditions that have been correlated with intensifying abandoned in the past (such as lower home values, older housing, and high vacancy rates) which were determined by an exploratory spatial regression analysis at the census tract level that found which variables correlated most strongly with increases in the number of “other vacant” units from 1990 to 2010. Parcels most likely to be abandoned within each census tract based on these scores are shown. i.

Areas classified as “Pasture/Hay” or “Row Crops” in the 1992 National Land Cover Dataset that fell outside of areas labeled as cropland in the 2012 Cropland Data Layer, parcels classified as agricultural for tax purposes (Erie County Dept. of Environment and Planning, 2012; Niagara County Dept. of Economic Development, 2011), and additional areas registered under the USDA Farm Service Agency program (USDA, NRCS, 2012), were extracted and clipped to resdenial parcels constructed since 1992 found by selecting by propoerty class codes and year built attributes, rfrom parcel data (Niagara Co (2011), Erie County (2012). ii. GIS analysis calculated the area of soils classified as “Prime Farmland” within Buffalo Niagara by the USDA, NRCS SSURGO Data, and the percentage of this land that fell within parcels classified as agricultural for tax purposes [Property Codes 100-199 and 241] and additional areas registered under the USDA Farm Service Agency. iii. Jobs in food production include the following employment sectors: “Crop Production”, “Animal Production and Aquaculture”, “Support Services for Animal Production”, “Agricultural Implement Manufacturing”, “Farm and Garden Machinery and Equipment Merchant Wholesalers”, “Farm Supplies Merchant Wholesalers”. Jobs in food processing include the following employment sectors: “Food Manufacturing”, “Beverage Manufacturing”. Jobs in food retail include the following employment sectors: “Food and Beverage Stores”, “Food Services and Drinking Places”, “Grocery and Related Product Merchant Wholesalers”, “Beer, Wine, and Distilled Alcoholic Beverage Merchant Wholesalers”, “Gasoline Stations with Convenience Stores”, “Community Food Services”, “Other Miscellaneous Nondurable Goods Merchant Wholesalers”, and “Food (Health) Supplement Stores”. i.

One Region Forward: A New Way to Plan for Buffalo Niagara


Big Ideas: Conserve Our Energy and Natural Resources to Prepare for Changes to Our Economy and Climate p 98

National Oceanic and Atmospheric Administration, National Climate Data Center, 2013. Accessed April, 2014 at www.ncdc.noaa.gov/oa/ncdc.html. ii. Collins, M., R. Knutti, J. Arblaster, J.-L. Dufresne, T. Fichefet, P. Friedlingstein, X. Gao, W.J. Gutowski, T. Johns, G. Krinner, M. Shongwe, C. Tebaldi, A.J. Weaver and M. Wehner, 2013: Long-term Climate Change: Projections, Commitments and Irreversibility. In: Climate Change 2013: The Physical Science Basis. Contribution of Working Group I to the Fifth Assessment Report of the Intergovernmental Panel on Climate Change [Stocker, T.F., D. Qin, G.-K. Plattner, M. Tignor, S.K. Allen, J. Boschung, A. Nauels, Y. Xia, V. Bex and P.M. Midgley (eds.)]. Cambridge University Press, Cambridge, United Kingdom and New York, NY, USA. iii. U.S. Energy Information Administration, Department of Energy, International Energy Statistics, Total Carbon Dioxide Emissions from the Consumption of Energy (Million Metric Tons), 2013. Notes: The average percent of world emissions originating from the US between 2000 and 2011 was calculated as 20.8%. iv. City of Buffao, “Traffic Signal Synchronization Project Timeline”, 2011. Accessed October, 2014 at https://www.ci.buffalo.ny.us/Home/City_Departments/Public_Works_Parks_ Streets/TrafficSignalTimeline v. Meyer, Michael D., 2008. “Design standards for US transportation infrastructure: the implications of climate change.” Washington, DC: Transportation Research Board. i.

HOW WILL WE KNOW WE’RE GETTING THERE?

How Will We Know if We’re Making Progress? p 116

Percent of Development within Urbanized Areas serviced by a sewer district: 68% represents the total proportion of the regional land area of all developed parcels (not classified as vacant, agricultural or environmentally-protected land by parcel data from Erie Co. DEP, 2012 and Niagara Co. DED, 2011) that falls within urbanized areas (US Census, 2010) that are also serviced by sewer districts (obtained from a variety of county and municipal sources). Moving forward, this indicator will measure the percentage of all newly developed area (found by overlaying parcels classified as vacant in the previous year with those that change to a form of development in the following year) that falls within the current urbanized, sewered area. Percent of jobs in downtowns, Bronwfield Opportunity Areas or near Main streets: Using ArcGIS Software, census block-level employment data (US Census Bureau, Location Employment Dynamics, 2011) was clipped to the shapes of downtowns (various sources, 2012), BOAs (NYS Dept. of State, 2012) and within quarter-mile buffer of “Main Streets” (defined by local stakeholders, 2012). The number of jobs within these areas was estimated by multiplying job density per block by the area of the clipped blocks. This was divided by the total number of jobs in the region. Open Spaces Conserved from Development: Using ArcGIS software, all parcels classified as vacant, agricultural or protected in parcel data were merged with other conserved and protected lands (The Conservation Registry, National Conservation Easement Database, Conservation Easements, 2012 and WNY Land Conservancy Property Boundaries, 2013). Moving forward, this area will be recalculated and compared with the 2014 benchmark. Linear Miles of Shoreline with Public Access: All publicly-owned parcels were selected by property class from county parcel data (Erie Co. DEP, 2012 and Niagara Co. DED, 2011). Public parcels which intersect any major water body were extracted. The length of public shorelines, as well as the total length of major shorelines (USGS, NHD, 2012), was calculated using GIS software. Daily Vehicle Miles Traveled per Capita: The total regional vehicle miles traveled given by GBNRTC data (2011) was divided by the total regional population as given by US Census, ACS, 5-year estimates (2011). Percent of Workers Commuting via Alternative Modes of Transportation: U.S. Census Bureau. American Community Survey 1-year estimates (2010). Found from ACS’ “Means of transportation to work” (T128) for the Buffalo-Niagara Falls metropolitan region. Percent of homes and jobs within areas accessible to transit stops: The Network Analyst extension of ArcGIS Software was used to delineate areas within one half mile of a NFTA Bus or Metro stops (2013) along a road. The percentage of the region’s residents and employment within these areas was estimated using spatial data on population (US Census Bureau, TIGER\Line Shapefiles, 2010) and jobs (US Census Bureau, Location Employment

One Region Forward: A New Way to Plan for Buffalo Niagara

137


A NEW WAY TO PLAN | APPENDIX

Dynamics, 2011) both given at the census block-level. The population density (people per acre) and employment density (jobs per acre) was calculated for each census block. The percentage of each census block that fell within one half mile of NFTA stops was multiplied by the calculated density to estimate the number of people and jobs within access to transit. Linear Miles of Dedicated Bike Paths, Shared Bike Lanes and Multi-use/Recreational Trails: Greater Buffalo Niagara Transportation Council (2014). All dedicated bike lanes, shared bike paths and multi-use/recreational trails were digitized and the length, in miles, was calculated using ArcGIS software. Number of residential and commercial addresses determined “undeliverable” by US Postal Service: Data from http://www.huduser.org/portal/usps/login.php for the fourth quarter of 2013 was downloaded. Census tracts within Buffalo Niagara were extracted and the total number of business addresses and residential addresses within classified as vacant were totaled. Percent of Homes built within walking distance to a “Main Street,” downtown or commercial corridor: Percentage of new homes (found using the year built attribute of parcel data from NYS Office of Real Property Services) built within a quarter-mile of town and village “main streets” (defined through stakeholder input, 2012), downtowns (various sources, 2012), and transit access areas (within half mile along a roadway of frequent metro rail and bus stops given by NFTA, 2013). Percentage of income the average household spends on housing and transportation costs: HUD Locational Affordability Portal, 2014 (incorporating data from ACS 5-yr estimates; LODES Census Block Data from OnTheMap; National Transit Database; Consumer Expenditure Survey. Using the Location Affordability Portal provided by HUD (at http://www. locationaffordability.info/lai.aspx), the percentage of income spent by the median-income family on housing and transportation was found. Number of Households without a vehicle and beyond walking distance to a supermarket: Reference USA (2012); US Census, ACS 5-year estimates (2011). Supermarkets and grocery stores were extracted from the RefUSA database by NAICS code. Vehicle availability by block group using ACS data was mapped. The total number of people living in households without a vehicle in block groups that do not lie within 0.4 miles of a supermarket was estimated using ArcGIS Network Analyst. Land dedicated to farming: Parcel data and USDA, National Resource Conservation Service. Using ArcGIS software, the area of land in farms, including all land parcels classified as agricultural for tax purposes and additional areas registered under the USDA Farm Service Agency program was calculated. Annual earnings for jobs in food production and manufacturing: New York State, Department of Labor, Quarterly Census of Employment and Wages, 2013 (p). Using annual QCEW records for the Buffalo-Niagara Falls metropolitan region (at http://labor.ny.gov/stats/ lsqcew.shtm), the “Total Wages” was summed for the following sectors: “Crop Production”, “Animal Production and Aquaculture” and “Food Production”. Square Footage of LEED-Certified projects: U.S. Green Building Council, Green Building Information Gateway (2014). According to report for the Buffalo-Niagara Falls metropolitan region from http://www.gbig.org Percentage of Locally-Generated Energy from Renewable Sources: U.S. Energy Information Administration, Department of Energy. (2012). Reporting programs (Form 923) for all electricity generators. Data was retrieved for all commercial energy providers in Erie and Niagara counties. All energy production (kWh) of renewable sources (wind, solar, geothermal and hydroelectric) was totaled, and divided by total energy generation for all facilities in Buffalo Niagara. Climate Smart Communities (Municipalities and Counties with a Climate Action Plan): NYS DEC (2014) List of Climate Smart Communities: New York State’s Climate Partners. Accessed October, 2014 from http://www.dec.ny.gov/energy/56876.html Percent of new development on environmentally-sensitive area: Calculated by totaling the area of developed land (parcels that are not vacant, agricultural or protected) that falls inside of wetlands (USGS, 2011 National Land Cover Dataset, 2014), floodplains (100-year floodplains delineated by Federal Emergency Management Agency, Digital Q3 Flood Zone Data, 1996), within 100 feet of streams (NYS Department of Environmental Conservation, National Hydrography Dataset, 2012) , or forests (USGS, 2011 National Land Cover Dataset, 2014). Moving forward, this metric will show the percent area of all new development on environmentally-sensitive land.

138

One Region Forward: A New Way to Plan for Buffalo Niagara


Percent of the region’s population living in neighborhoods with concentrated poverty: ACS 5-year estimates, 2007-2012, Social Explorer Tables, US Census Bureau. The total population residing in census tracts where over 20% of the population lives under the federal poverty level. Number of firms in the region: NYS Department of Labor, Quarterly Census of Employment and Wages, 2013 (p). This indicator shows the total number of business establishments in the region. For firms operating at more than one location, each individual establishment was counted, unless the payrolls are jointly maintained. Combined cost-to-revenue ration for all local governments: NYS Office of the State Comptroller, 2012. Local Government Municipal Finance Data, Level One, FY 2011. Accessed February 2013 at http://www.osc.state.ny.us/localgov/datanstat/findata/index_choice. htm. Total expenditures (including debt payments and other uses) for all local and county governments divided by total revenues (including state and federal aid) for all local and county governments. Use negative values to indicate when costs exceed revenues.

One Region Forward: A New Way to Plan for Buffalo Niagara

139


A NEW WAY TO PLAN | APPENDIX

Appendix C Acronyms

140

AOC

Area of Concern

BNMC

Buffalo Niagara Medical Campus

BNP

Buffalo Niagara Partnership

BOA

Brownfield Opportunity Areas

CDC

Community Development Corporations

GBNRTC

Greater Buffalo Niagara Regional Transportation Council

GHG

Greenhouse gases

HUD

US Department of Housing and Urban Development

LISC

Local Initiatives Support Corporation

NFTA

Niagara Frontier Transportation Authority

NYPA

New York Power Authority

NYSDOT

New York State Departent of Transportation

PUSH - Buffalo

People United for Sustainable Housing - Buffalo

RAP

Remedial Action Plan

RPSD

Regional Plan for Sustainable Development

TDR

Transfer of Development Rights

UBRI/ UDP

University at Buffalo Regional Institute and Urban Design Project

WNY REDC

Western New York Regional Economic Development Council

WNYEA

Western New York Environmental Alliance

One Region Forward: A New Way to Plan for Buffalo Niagara


Appendix D

Glossary of Terms 100 year flood

The magnitude of a flood which has a one percent chance of occurring in any given year. The term can be misleading. It describes the probability of such a flood, not its actual frequency. A 100 year flood can happen two years in a row. UNDERSTANDING THE BASICS Of LAND USE AND PLANNING: Glossary of Land Use and Planning Terms© 2010 by The Institute for Local Government

500 year flood

The magnitude of a flood that has a 0.2 percent chance of occuring in any given year. The term is potentially misleading in the same way as the 100 year flood. http://www.fema.gov/floodplain-management/flood-zones#0

Abandoned Housing

A building that has no identifiable owner. This could be due to the owner not being able to maintain or pay for the building and deciding to walk away, or due to the owner dying with no known inheritors. http://chicagobuildings.org/faq.html#difference-between-abandoned-and-vacant

Adaptive Re-use

"Converting obsolete or historic buildings from their original or most recent use to a new use. For example, an old manufacturing site could be converted into apartments or retail space." “UNDERSTANDING THE BASICS Of LAND USE AND PLANNING: Glossary of Land Use and Planning Terms© 2010 by The Institute for Local Government”

Agri-tourism

Agricultural tourism is a commercial enterprise at a working farm, ranch or agricultural plant conducted for the enjoyment or education of visitors, and that generates supplemental income for the owner. Agritourism can include farm stands or shops, U-pick, farm stays, tours, on-farm classes, fairs, festivals, pumpkin patches, Christmas tree farms, winery weddings, orchard dinners, youth camps, barn dances, hunting or fishing, guest ranches, and more. http://sfp.ucdavis.edu/agritourism/

Anchor Institution

Institutions such as hospitals, universities and other organizations that have long-term commitments to place and are often central participants in community and economic development. http://www.icic.org/ee_uploads/publications/ICIC_RESEARCH_anchor_institutions_r2.pdf

Bioswales

Low-lying landscape features designed to collect water and retain it in place while it seeps into the ground as a means to filter out pollution and silt, minimize flooding, and protect critical infrastructure. http://buildgreen.ufl.edu/Fact_sheet_Bioswales_Vegetated_Swales.pdf

Blue/green economy "An important part of the response to global climate change that refers to redesigning our economy to use less energy, produce less waste, protect natural resources, especially water, and produce products that also help us produce green energy or reduce consumption of energy." http://uploads.oneregionforward.org/content/uploads/2014/05/Session2ToolKit_final.pdf

Brownfield

"An area with abandoned, idle, or under-used industrial and commercial facilities where expansion, redevelopment, or reuse is complicated by real or perceived environmental contamination." “UNDERSTANDING THE BASICS Of LAND USE AND PLANNING: Glossary of Land Use and Planning Terms© 2010 by The Institute for Local Government”

Carbon

Shorthand for carbon dioxide (CO2), which is the primary greenhouse gas and is emitted through human activities, mainly by the combustion of fossil fuels for energy. http://www.epa.gov/climatechange/ghgemissions/gases/co2.html

Carbon Accounting

Methods and processes by which organizations account for and report on their greenhouse gas emissions. http://www.vercoglobal.com/sustainability-services/carbon-accounting-and-reporting

Carbon Footprint

The total amount of greenhouse gases that are emitted into the atmosphere each year by a person, family, building, organization, or company. A person’s carbon footprint includes greenhouse gas emissions from fuel that an individual burns directly, such as by heating a home or riding in a car. It also includes greenhouse gases that come from producing the goods or services that the individual uses, including emissions from power plants that make electricity, factories that make products, and landfills where trash gets sent. http://www.epa.gov/climatechange/glossary.html

One Region Forward: A New Way to Plan for Buffalo Niagara

141


A NEW WAY TO PLAN | APPENDIX

Climate Change

"Refers to any significant change in the measures of climate lasting for an extended period of time. In other words, climate change includes major changes in temperature, precipitation, or wind patterns, among other effects, that occur over several decades or longer. Current concern about climate change focuses on changes caused in large part by emission of greenhouse gases leading to an overall warming and instability of the climate." U.S. Environmental Protection Agency. (2014, March 18). Climate change: Basic information. Retrieved from http://www.epa.gov/climatechange/basics/

Community Garden

"Places where neighbors and residents can gather to cultivate plants, vegetables, and fruits and, depending on local laws, keep bees and raise chickens or other livestock and poultry." “UNDERSTANDING THE BASICS Of LAND USE AND PLANNING: Glossary of Land Use and Planning Terms© 2010 by The Institute for Local Government”

Community Risk Assessments

A participatory process for assessing hazards, vulnerabilities, risks and ability to cope toward preparing coping strategies and finally a risk reduction options implementation plan by the local community. http://r4d.dfid.gov.uk/Output/191151/

Complete Streets

Streets that are designed and operated to enable safe access for all users, including pedestrians, bicyclists, motorists and transit riders of all ages and abilities. Complete Streets make it easy to cross the street, walk to shops, and bicycle to work. They allow buses to run on time and make it safe for people to walk to and from train stations. http://www.smartgrowthamerica.org/complete-streets/complete-streets-fundamentals/complete-streets-faq

Conservation Easement

A means to conserve natural lands whereby a property owner may cede development rights to a land conservancy or government while continuing to own and use the property. Typically, the easement is perpetuity and runs with the property, not the owner. http://landtrust.org/ProtectingLand/EasementInfo.htm

e-Vehicle

Electric car

Emissions

The release of a substance (usually a gas when referring to the subject of climate change) into the atmosphere. http://www.epa.gov/climatechange/glossary.html

First Ring Suburb

A term used to describe suburban communities that share a border with a central city. Local examples include Kenmore, Cheektowaga, and West Seneca.

Floodplains

"The relatively level land area on either side of the banks of a stream regularly subject to flooding. That part of the floodplain subject to a one percent chance of flooding in any given year is designated as an “area of special flood hazard” by the Federal Insurance Administration." “UNDERSTANDING THE BASICS Of LAND USE AND PLANNING: Glossary of Land Use and Planning Terms© 2010 by The Institute for Local Government”

Food Security

The ability of people to have access to sufficient, safe, nutritious food to maintain a healthy and active life http://www.who.int/trade/glossary/story028/en/

Food System

Refers to the interlinked network of processes, actors, resources, policies, and regulatory tools required to produce, process, distribute, access, consume, and dispose of food—and its connection to other urban systems (such as land, housing, transportation, parks and recreation, etc.) Hodgson, Kimberley. (2013) Planning for Food Access and Community-Based Food Systems: A National Scan and Evaluation of Local Comprehensive and Sustainability Plans. Executive Summary American Planning Association. Retrieved from http://www.planning.org/research/foodaccess/pdf/foodaccessreport.pdf

Form based codes

"A method of regulating development to achieve a specific urban form by controlling physical form primarily, with a lesser focus on land use. Form-based codes address the relationship between building facades and the public realm, the form and mass of buildings in relation to one another, and the scale and types of streets and blocks." “UNDERSTANDING THE BASICS Of LAND USE AND PLANNING: Glossary of Land Use and Planning Terms© 2010 by The Institute for Local Government”

Fossil Fuels

"Carbon-rich deposits in the earth, such as petroleum (oil), coal, or natural gas, derived from the remains of ancient plants and animals and used for fuel." “UNDERSTANDING THE BASICS Of LAND USE AND PLANNING: Glossary of Land Use and Planning Terms© 2010 by The Institute for Local Government”

Gray Infrastructure

"The system of constructed “hard” infrastructure elements. They include the traditional infrastructure components that improve safety, health, and quality of life. They facilitate economic activity and connect us to other communities. Examples include roads, and storm and sanitary sewers. " http://www.cityofbondurant.com/webres/File/Comprehensive%20Plan/Bondurant-FY13%20CCP%20Grant%20Application%20Strategic%20Plan.pdf

142

One Region Forward: A New Way to Plan for Buffalo Niagara


Graywater

The relatively clean waste water from baths, sinks, washing machines, and other kitchen appliances that can often be used for irrigation or treated on site, saving water, energy or both. http://www.oxforddictionaries.com/us/definition/american_english/gray-water

Green Code

An historic update of Buffalo’s development framework that will target investments, facilitate job creation, restore the environment, and improve quality of life for residents. http://uploads.oneregionforward.org/content/uploads/2014/05/Session3ToolKit_FINAL_5_561.pdf

Green Infrastructure

A stormwater management tool that takes advantage of the natural processes of soils and plants in order to slow down and clean stormwater and keep it from overwhelming the City's sewer system. Examples include Rain Gardens, permeable paving, and green roofs. http://sfwater.org/index.aspx?page=667

Greenhouse Gases

"Gases that trap heat in the atmosphere. These include carbon dioxide (CO2), Methane (CH4), Nitrous oxide (N2O), and Fluorinated gases. Human activity contributes to the production of these gases. The gases in turn make the planet warmer and ""thicken the Earth's blanket." U.S. Environmental Protection Agency. (2013, September 09). Overview of greenhouse gases. Retrieved from http://www.epa.gov/climatechange/ghgemissions/gases.html

Home Rule

The legal authority given by states to cities, municipalities, and/or counties to pass laws and govern themselves as they see fit -- especially in regard to this plan for land use regulation -- so long as they obey the state and federal constitutions. http://www.nattleboro.com/sites/nattleboroma/files/file/file/zoning_planning_0101.pdf

Hydraulic Fracturing

A process in which fractures in rocks below the earth's surface are opened and widened by injecting chemicals and liquids at high pressure: used especially to extract natural gas or oil. http://dictionary.reference.com/browse/hydraulic+fracturing

Infill

New development in existing urban areas, typically homes or other buildings constructed on vacant lots where other structures were previously demolished. http://www.nattleboro.com/sites/nattleboroma/files/file/file/zoning_planning_0101.pdf

Land Bank

An entity, typically an agency of local government, established to purchase, hold, prepare and resell land and abandoned property in support of neighborhood redevelopment efforts. “UNDERSTANDING THE BASICS Of LAND USE AND PLANNING: Glossary of Land Use and Planning Terms © 2010 by The Institute for Local Government”

LEED Standards

LEED (Leadership in Energy and Environmental Design) is an internationally recognized green building certification system, providing third-party verification that a building or community was designed and built using strategies aimed at improving performance across all the metrics that matter most: energy savings, water efficiency, CO2 emissions reduction, improved indoor environmental quality, and stewardship of resources and sensitivity to their impacts. http://www.bu.edu/sustainability/what-were-doing/green-buildings/leed/

Metropolitan Area

"The term metropolitan area refers to a region consisting of a densely populated urban core and its lesspopulated surrounding territories, sharing industry, infrastructure, and housing." http://pubs.usgs.gov/circ/1373/pdf/Circular1373.pdf

Micro-grids

A localized grouping of electricity sources and loads that normally operates connected to the traditional centralized grid (macrogrid), but can disconnect and function autonomously as an electrical island. http://building-microgrid.lbl.gov/about-microgrids

Mixed-use Development

Development that blends residential, retail, commercial office, institutional, cultural and where appropriate, industrial uses. It is a commonly used approach to creating urban districts that are both busy round the clock (because different uses are active at different times of day) and efficient (because they connect uses people need on a daily basis and reduce the need for transportation). American Planning Association. (2013). Mixed use development. Retrieved from http://www.planning.org/nationalcenters/health/mixedusedevelopment.htm

MMBtu

One million British thermal units (Btu). One Btu is the heat required to raise the temperature of one pound of water by one degree Fahrenheit. http://www.eia.gov/tools/faqs/faq.cfm?id=45&t=8

Natural Gas

Underground deposits of gases consisting of 50 to 90 percent methane (CH4) and small amounts of heavier gaseous hydrocarbon compounds such as propane (C3H8) and butane (C4H10). http://www.epa.gov/climatechange/glossary.html

One Region Forward: A New Way to Plan for Buffalo Niagara

143


A NEW WAY TO PLAN | APPENDIX

Ozone

"The protective layer of the earth’s atmosphere, about 15 miles above the ground that absorbs some of the sun’s ultraviolet rays, thereby reducing the amount of potentially harmful radiation that reaches the earth’s surface." “UNDERSTANDING THE BASICS Of LAND USE AND PLANNING: Glossary of Land Use and Planning Terms© 2010 by The Institute for Local Government”

Rain Barrel

"A system that collects and stores rainwater from your roof that would otherwise be lost to runoff and diverted to storm drains and streams." http://www.epa.gov/region03/p2/what-is-rainbarrel.pdf

Rain gardens

A planted depression or a hole that allows rainwater runoff from impervious urban areas like roofs, driveways, walkways, parking lots, and compacted lawn areas the opportunity to be absorbed. This reduces rain runoff by allowing stormwater to soak into the ground (as opposed to flowing into storm drains and surface waters which causes erosion, water pollution, flooding, and diminished groundwater). http://www.el-cerrito.org/index.aspx?NID=772

Renewable and/or Green Energy

Energy generated from solar, wind, geothermal and hyrdo-electric sources that are effectively unlimited and produce no greenhouse gases (as compared with energy from coal, oil, gas and uranium whose supply is finite and produce greenhouse gases or other dangerous wastes). “UNDERSTANDING THE BASICS Of LAND USE AND PLANNING: Glossary of Land Use and Planning Terms© 2010 by The Institute for Local Government”

Riparian Buffers

Vegetated land areas next to rivers and streams that protect water resources from nonpoint source pollution and provide bank stabilization and aquatic and wildlife habitat. http://www.soil.ncsu.edu/publications/BMPs/buffers.html

shared service agreements

Shared services agreements, also known as inter-municipal cooperation and consolidation, are when governments from different municipalities consolidate overlapping layers of government into a single service in order to gain economies of scale, lower costs and eliminate inefficiencies. Agreements are intended to assist local governments deal with fiscal stress, declining or static tax bases, stagnant levels of state aid, and escalating healthcare and employee benefit costs all while facing demands for continued services and pressures on the local property tax base. http://www.osc.state.ny.us/localgov/pubs/research/cooperation1.pdf

Sharrow

Is shorthand "shared lane bicycle marking." This pavement marking includes a bicycle symbol and two white chevrons and is used to remind motorists that bicyclists are permitted to use the full lane. http://ttm.osu.edu/bike-sharrows

Smart Growth

A placed-based approach to planning and design for communities which encourages mixed use of land, transportation and housing, compact development, and strengthening existing qualities of communities which improve the quality of life. “Environmental Protection Agency. (2013) About Smart Growth. Retrieved from http://www.epa.gov/smartgrowth/about_sg.htm”

Sprawl

"A common term used to described the dispersed pattern of development associated with low-density housing, highway-oriented commercial development, and growth away from urban centers into rural areas. In some cases, suburban sprawl is accompanied by disinvestment or decline in urban centers." “Cornell University Department of Development Sociology. (2010). The definition of sprawl. Retrieved from http://cardi.cornell.edu/cals/devsoc/outreach/cardi/programs/land-use/ sprawl/definition_sprawl.cfm”

Tax Increment Financing

A public financing method that captures all or part of the future increase in property tax revenue expected from new development to help pay for the development itself, its infrastructure or other communityimprovement projects. http://www.co.weber.ut.us/commission/redevelopment_agency.php

Transit Oriented Development

Forms of development that concentrate housing and jobs in close proximity to transit service -- most notably rail transit stations -- both to provide service to residents and employees and to build transit ridership. TOD typically includes a mix of higher density housing, office and retail in a walkable neighborhood environment. http://www.ctod.org/faqs.php

Urban Farming

The practice of producing food in a city or heavily populated town or municipality as a commercial enterprise -- as distinguished from community gardening. http://www.greensgrow.org/urban-farm/what-is-urban-farming/

144

One Region Forward: A New Way to Plan for Buffalo Niagara


Urbanized area

According to the 2010 Decennial census the term urbanized areas or UAs refer to urban areas that contain 50,000 or more people. http://www.gpo.gov/fdsys/pkg/FR-2011-08-24/pdf/2011-21647.pdf

Vacant Housing

An empty building that is not in use, but the owner is known. In most cases the building is foreclosed or owned by a bank. http://chicagobuildings.org/faq.html#difference-between-abandoned-and-vacant

Watersheds

"The total area above a given point on a watercourse that contributes water to its flow; the entire region drained by a waterway or watercourse that drains into a reservoir, lake, or sea" “UNDERSTANDING THE BASICS Of LAND USE AND PLANNING: Glossary of Land Use and Planning Terms© 2010 by The Institute for Local Government”

One Region Forward: A New Way to Plan for Buffalo Niagara

145


A NEW WAY TO PLAN | APPENDIX

Appendix E Plan Library

The process and plan reconnaissance for coming to an initial set of “Vision and Value” statements for One Region Forward: In 2012, research staff from the UB Regional Institute conducted a comprehensive search and review of public planning documents in the Buffalo Niagara region. A content analysis was performed for more than 160 plans for counties, cities and towns, districts, neighborhoods, waterfronts and watersheds, the region as a whole. The analysis process included: read and summarize each plan (summaries for each can be found on www.oneregionforward.org/ planning-library); identify fundamental visions and goals which are prominent in the existing planning documents; identify key sites and sectors which are common throughout the existing plans and proposals; and highlight key concepts and identify how these concepts serve a Regional goal. Based on that analysis, a series of themes were generated and “word clouds” were produced to represent the frequency of terms or themes that existed across these statements. In turn, each word cloud was synthesized into brief statements of core values and presented to the community for feedback. People were asked to read, rate, and comment on the statements – which they did, during the Community Congresses held in January 2013, as well as during meetings of the One Region Forward Local Government Council and Private Sector Council, and Online through July 2013. Through “clicker” voting during the four in-person sessions and online voting afterwards about 300 participants rated the statements on a five-point scale from “right on the mark” to “totally missing the mark.” Overall all ten statements were affirmed as “right on the mark” or “mostly on the mark” by strong majorities. Small minorities –generally less than one in ten participants – rated the statements as “mostly missing the mark” or “totally missing the mark.” During discussions and an online comment period, individuals made a total of 466 specific comments, offering additions, corrections, suggestions, and objections. We used both the ratings and comments to revise the statements. The revised statements, with documentation on how they were changed can be found at A Report on the Regional Vision and Values: What We’ve Heard through Year One of One Region Forward at www.oneregionforward. org/regional-vision-values. A detailed list of the plans that went into this analysis can be found below.

Regional Plans Regional - The WNY Regional Economic Development Strategic Plan (2011) Regional - Niagara Region Transportation Strategy Update (2011) Regional - Revealing Niagara: A Citizen Vision for Heritage and Cultural Tourism in the Bi-National Niagara Region (2002) Regional - Rethinking the Niagara Frontier: A Report on the Continuing Bi-National Forum (2001) Regional - The Great Lakes Restoration Initiative Action Plan (2009) Regional - The International Watersheds Initiative: Implementing a New Paradigm for Trans-boundary Basins (2009) Regional - Impact of Urban Areas on Great Lakes Water Quality (2009) Regional - The 14th Biennial Report on Great Lakes Water Quality (2009) Regional - The NYS Park System: An Economic Asset to the Empire State (2009) Regional - The 2009 New York State Rail Plan (2009) Regional - Strategic Plan for State Forest Management (SPSFM)/Generic Environmental Impact Statement (2011) Regional - Coordinated Human Services Transportation Plan (2011) Regional - Transportation Improvement Program 2011-2015 and Long Range Transportation Plan (2010) Regional - Buffalo Niagara: Where Industry Creates Energy (2009) Regional - The WNY Environmental Alliance - Our Shared Agenda for Action (2009) Regional - 2008 Bicycle & Pedestrian Master Plan (2008) Regional - The Western New York Southtowns Scenic Byway (2007) Regional - Revisioning Brownfields: A Regional Strategic Approach (2007) Regional - The Niagara River Greenway Plan and Final Environmental Impact Statement (2007) Regional - The Framework for Regional Growth (2006) Regional - Building UB: The Comprehensive Physical Plan (2006) Regional - The Buffalo Niagara Cultural Tourism Initiative (2005) 146

One Region Forward: A New Way to Plan for Buffalo Niagara


Erie County Plans Erie County - The Community Development Block Grant Final 2012 Action Plan (2012) Erie County - The Comprehensive Economic Development Strategy (2011) Erie County - The Comprehensive Three Year Local Plan 2005-2008 (2005) Erie County - The Consolidated Annual Performance and Evaluation Report (2012) Erie County - The Erie County Agricultural and Farmland Protection Plan (2012) Erie County - The Erie County Parks System Master Plan (2003) Erie County - Erie County’s Road to a Bright Future (2009) Erie County - The Consolidated Plan for the Amherst, Cheektowaga, and Tonawanda (2010) Erie County - The Draft Regional Comprehensive Plan and Draft Generic Environmental Impact Statement for the Towns of Aurora, Elma, Holland, Wales and the Village of East Aurora (2002) Erie County - Sowing the Seeds for Southtowns Agribusiness (March 2009) Erie County - Tourism Toolkit for the Southtowns (October 2007) Alden (Town) - The Town of Alden Comprehensive Plan (2009) Alden (Town) - The Town of Alden Water District Number 5 Plan (2009) Alden (Village) - The Village of Alden Comprehensive Plan (2000) Amherst (Town) - The Town of Amherst (2012-2017) Capital Improvement Program (2011) Amherst (Town) - The Town of Amherst Bicentennial Comprehensive Plan (2007) Amherst (Town) - The Town of Amherst Recreation & Parks Master Plan (2004) Amherst (Town) - The Master Plan and Final Environmental Impact Statement for Amherst State Park (2003) Angola (Village) - The Village of Angola Comprehensive Plan (2003) Aurora (Town) - The Aurora Open Space Plan (2010) Boston (Town) - The Town of Boston Comprehensive Plan: A Vision for the Year 2020 (2002) Brant (Town) - The Town of Brant and Village of Farnham Master Plan (2003) Buffalo (City) - Queen City in the 21st Century: Comprehensive Plan (2006) Buffalo (City) - Queen City Waterfront (2007) Buffalo (City) - Queen City Hub: A Strategic Regional Action Plan for Downtown Buffalo. (2003) Buffalo (City) - Buffalo Niagara Medical Campus Master Plan Update (2010) Buffalo (City) - The Black Rock Canal Park Feasibility Analysis (2010) Buffalo (City) - The Buffalo Building Reuse Project Report (2012) Buffalo (City) - The Buffalo Green Code Draft Land Use Plan (2012) Buffalo (City) - The Buffalo Harbor Bridge Final Scoping Report (2010) Buffalo (City) - The Buffalo Harbor Bridge Placemaking Report (2011) Buffalo (City) - The Buffalo Municipal Housing Authority Perry Choice Neighborhood Planning Initiative (2011) Buffalo (City) - Buffalo Olmsted Park System: Plan for the 21st Century (2008) Buffalo (City) - The Buffalo Promise Neighborhood Needs Assessment Study (2011) Buffalo (City) - The Buffalo River Restoration Feasibility Study (2011) Buffalo (City) - Updated Addendum to Stage 2 Remedial Action Plan Report Buffalo River AOC (2011) Buffalo (City) - Proposed Remedial Action Plan—Buffalo Lakeside Commerce Park, Parcel 4 Site (2009) Buffalo (City) - Queen City Gardens Plan (2009) Buffalo (City) - South Buffalo Brownfield Opportunity Area—Nomination Document (2009) Buffalo (City) - “Building a Neighborhood of Choice: A Neighborhood Plan for the Riverside Planning Community” (2007) Buffalo (City) - Celebrating Buffalo’s Cultural Diversity: A Vision for the Michigan Street Heritage Corridor (2011) Buffalo (City) - Green Infrastructure Solutions to Buffalo’s Sewer Overflow Challenge Draft Feasibility Study (2011) Buffalo (City) - Groundwork Buffalo – Feasibility Study (2009) Buffalo (City) - “Preserving Our Heritage and Planning Our Future” (2007) Buffalo (City) - The Larkin District Plan (2006) Buffalo (City) - The Lower West Side: Strategies for Neighborhood and Community Development (1994) Buffalo (City) - The Lower West Side Neighborhood Stabilization Demonstration Project: Housing Design Review Guidelines (2002)

One Region Forward: A New Way to Plan for Buffalo Niagara

147


A NEW WAY TO PLAN | APPENDIX

Cheektowaga (Town) - The Town of Cheektowaga Comprehensive Plan and Generic Environmental Impact Statement (2010) Clarence (Town) - The Town of Clarence Agricultural and Farmland Protection Plan (2012) Clarence (Town) - The Town of Clarence Master Plan 2015 (2001) Clarence (Town) - Town of Clarence Parks & Recreation Master Plan (2005) Clarence (Town) - The Supplemental Draft Generic Environmental Impact Statement for Clarence Hollow Pollution Abatement Project (2007) Colden (Town) - The Town of Colden Master Plan 2002 (1992) Concord (Town) - The Town of Concord and Village of Springville Joint Comprehensive Plan (1999) Depew (Village) - The Proposed Remedial Action Plan for Depew Village Landfill (2008) East Aurora (Village) - The Village of East Aurora Community Forestry Management Plan () Eden (Town) - The Town of Eden 2015 Comprehensive Plan (2000) Evans (Town) - The Town of Evans Comprehensive Plan (1999) Evans (Town) - The Town of Evans Local Waterfront Revitalization Program (1986) Evans (Town) - The Town of Evans Stormwater Management Program Plan (2007) Evans (Town) - The Lake Erie Beach Neighborhood Revitalization Strategy (2010) Grand Island (Town) - The Town of Grand Island Local Waterfront Revitalization Program (2006) Hamburg (Town) - The Town of Hamburg 2007 Comprehensive Plan Update (2007) Hamburg (Town) - The Town of Hamburg Five Year Consolidated Plan (2010) Hamburg (Town) - The Town of Hamburg Local Waterfront Revitalization Program (2011) Hamburg (Village) - The Village of Hamburg Comprehensive Plan Update (2010) Hamburg (Village) - The Village of Hamburg Strategic Plan (2002) Holland (Town) - The Town of Holland Town Park Master Plan (1994) Kenmore (Village) - The Comprehensive Plan for the Village of Kenmore Business District (2003) Lackawanna (City) - The City of Lackawanna Comprehensive Plan 2020 (2001) Lackawanna (City) - RESTORE III - Lackawanna Redevelopment Plan (2010) Lackawanna (City) - City of Lackawanna Local Waterfront Revitalization Program (1989) Lancaster (Town) - The Town of Lancaster Stormwater Management Plan (2010) Lancaster (Town) - The Town of Lancaster, Village of Lancaster, and Village of Depew Comprehensive Plan (2000) Marilla (Town) - The Town of Marilla Comprehensive Plan (1998) Newstead (Town) - The Town of Newstead and Village of Akron Combined Comprehensive Plan (2001) North Collins (Town) - The Town of North Collins Comprehensive Plan (1996) Orchard Park (Town) - The Town of Orchard Park Comprehensive Plan (2007) Orchard Park (Town) - Orchard Park Economic Development Committee Strategic Plan (2008) Orchard Park (Town) - Town and Village of Orchard Park, New York Land Use Study: The Orchard Park Plan (2002) Sardinia (Town) - The Town of Sardinia Comprehensive Plan (2003) Tonawanda (City) - City of Tonawanda Comprehensive Plan and Final Generic Environmental Impact Statement (2002) Tonawanda (Town) - The Town of Tonawanda Old Town Neighborhood Plan (2009) Tonawanda (Town) - Tonawanda Brownfield Opportunity Area Program, Pre-Nomination Study (2011) Tonawanda (Town) - The Tonawanda Waterfront Rezoning Study and Land Use Plan (2002) Tonawanda (Town) - The Town of Tonawanda Comprehensive Plan (2005) Tonawanda (Town) - The Town of Tonawanda Local Waterfront Revitalization Program (1993) Tonawanda (Town) - The Town of Tonawanda Sheridan Parkside Village Courts Development Plan (2003) Tonawanda (Town) - The Town of Tonawanda’s Proposed Third Program Year Action Plan (2012) West Seneca (Town) - The Town of West Seneca Comprehensive Plan (2005) Williamsville (Village) - Village of Williamsville Community Plan and Draft Generic Environmental Impact Statement (2008) Williamsville (Village) - Village of Williamsville Water Mill Final Re-use Report (2009)

148

One Region Forward: A New Way to Plan for Buffalo Niagara


Niagara County Plans Niagara County - Niagara Communities Comprehensive Plan 2030 (2009) Niagara County - The Comprehensive Economic Development Strategy for Niagara County (2010) Niagara County - 2012 Niagara County Economic Development Address (2012) Niagara County - The Niagara County Agricultural & Farmland Protection Plan (1999) Niagara County - Niagara Falls International Airport Bi-National Air Cargo Gateway Study (2006) Niagara County - The Niagara National Heritage Area Study Act (2005) Niagara County - Transit North Historic Canalway Corridor Plan (2008) Niagara County - The Niagara County Business Development & Commercial Revitalization Study (2005) Niagara County - The Niagara County Comprehensive Emergency Management Plan (2007) Niagara County - The Niagara County Stormwater Management Program Plan (2010) Niagara County - The Eighteenmile Creek Restoration Project Plan (Phase II Restoration) (2011) Barker (Village) - The Village of Barker Capital Improvement Plan (2011) Cambria (Town) - Town of Cambria Comprehensive Plan (1997) Hartland (Town) - The Comprehensive Plan for the Town of Hartland (1998) Lewiston (Town) - Town of Lewiston Comprehensive Plan Update (2011) Lewiston (Town) - Town of Lewiston Comprehensive Plan and Draft Generic Environmental Impact Statement (2000) Lewiston (Village) - The Village of Lewiston Master Plan (2004) Lewiston (Village) - The Village of Lewiston Local Waterfront Revitalization Program (2011) Lockport (City) - The City of Lockport Comprehensive Plan (1998) Lockport (City) - The City of Lockport Brownfield Opportunity Area Draft Pre-Nomination Study (2008) Lockport (City) - Proposed Remedial Action Plan for Eighteenmile Creek Corridor Site (2010) Lockport (Town) - The Canalside Wine Emporium Project (2009) Lockport (Town) - The Town of Lockport Southwest Sector Plan (1992) Lockport (Town) - The Town of Lockport Design Guidelines for Commercial Site Plans (2009) Middleport (Village) - The Village of Middleport Local Waterfront Revitalization Program (2002) Newfane (Town) - Town of Newfane 2015 Master Plan (1998) Newfane (Town) - The Town of Newfane Local Waterfront Revitalization Program (1997) Niagara Falls (City) - The Comprehensive Plan for City of Niagara Falls (2009) Niagara Falls (City) - The Buffalo Avenue Heritage District Revitalization Strategy (2009) Niagara Falls (City) - The Highland Community Area BOA Nomination Document (2011) Niagara Falls (City) - Proposed Remedial Action Plan for Frontier Chemical – Royal Avenue (2011) Niagara Falls (City) - The Buffalo Avenue Industrial Corridor Proposed Brownfield Opportunity Area (2008) Niagara Falls (City) - The Highland Avenue BOA Community Participation Plan (2009) Niagara Falls (City) - The City of Niagara Falls USA Niagara River Greenway Vision and Project Proposals (2006) Niagara Falls (City) - Achieving Niagara Falls’ Future: An Assessment of Niagara Falls’ Waterfront Planning (2002) Niagara Falls (Town) - Town of Niagara Comprehensive Plan (1972) North Tonawanda (City) - The City of North Tonawanda Comprehensive Plan (2008) North Tonawanda (City) - The Local Waterfront Revitalization Program for North Tonawanda (1988) Pendleton (Town) - The Town of Pendleton Comprehensive Plan for 2025 (2008) Porter (Town) - The Comprehensive Plan for the Town of Porter (2004) Porter (Town) - The Management Action Plan for the Former Lake Ontario Ordnance Works (2009) Royalton (Town) - The Town of Royalton Comprehensive Plan (2007) Somerset (Town) - The Town of Somerset Comprehensive Plan (2003) Somerset (Town) - The Town of Somerset Local Waterfront Revitalization Program (2005) Wheatfield (Town) - The Town of Wheatfield Comprehensive Plan (2004) Wheatfield (Town) - The Town of Wheatfield Local Waterfront Revitalization Program (2012) Wilson (Town) - Town and Village of Wilson Comprehensive Plan (1966) Youngstown (Village) - The Village of Youngstown Local Waterfront Revitalization Program (1989) Youngstown (Village) - The Village of Youngstown Master Plan (1972)

One Region Forward: A New Way to Plan for Buffalo Niagara

149


A NEW WAY TO PLAN | APPENDIX

Appendix F

Community Engagement Empowering and engaging the people of Buffalo Niagara has been a critical part of the process to map a roadmap for driving positive, sustainable change in our region and its diverse communities. Through community presentations, tabling at local events, meetings large and small, and all sorts of other in-person engagement activities, we talked to over 5,000 citizens through this process. Below is a list of all engagement activities through the process.

October,2014 October 14, 2014 October 4, 2014

September 2014 September 27, 2014

Citizen Planning School, IDEA SUMMIT, Buffalo, NY Buffalo Civic App Symposium: “Opportunities in Open Data”

September 16, 2014

UB Sustainable Living Fair, Amherst, NY

September 13, 2014

Music is Art Festival, Buffalo, NY

September 6, 2014

Citizen Planning School, IDEA WORKSHOP, Buffalo, NY

August 2014 August 17, 2014

Hardline with Dave Debo, WBEN Radio, Airwaves of Buffalo Niagara

July 24, 2014

Vision Niagara, Buffalo, NY

July 23, 2014

NYS Council on Food Policy Annual Summer Meeting, Buffalo, NY

July 22, 2014

Community Congress Open House #2, Buffalo, NY

July 21, 2014

Community Congress Open House #1, Lockport, NY

June 2014 June 29, 2014

South Buffalo Farmer’s Market, Buffalo, NY

June 28, 2014

City of Night, Buffalo, NY

June 28, 2014

Taste of Diversity, Buffalo, NY

June 21, 2014

Party for the Planet, Buffalo, NY

June 7, 2014

Elmwood- Bidwell Farmer’s Market, Buffalo, NY

June 3, 2014

How To Measure Development - One Region Forward : Economics of Sustainability Series, Buffalo, NY

May 2014 May 22, 2014

Joint Meeting of Erie County Association of Governments and Niagara County Supervisors Association, Niagara Falls, NY

May 20, 2014

Orchard Park Economic Development Committee, Orchard Park, NY

May 17, 2014

Citizen Planning School Session #3, Buffalo, NY

May 3, 2014

Citizen Planning School Session #2, Buffalo, NY

April 2014 April 12, 2014 March 2014 March 25, 2014

150

C-SAAHN ‘IMAGINE’ Lecture Series

Citizen Planning School Session #1, Buffalo, NY Tools and Technology for Scenarios and Plans, Buffalo, NY

March 20, 2014

Scenario Planning Workshop on the Road hosted by Self Advocacy Association of NYS WNY Region, Buffalo, NY

March 20, 2014

Scenario Planning Workshop on the Road hosted by Southtowns Planning and Development Group and the Southtowns Coalition, Eden, NY

March 19, 2014

Scenario Planning Workshop on the Road hosted by WNY Environmental Alliance, Buffalo, NY

March 19, 2014

Scenario Planning Workshop on the Road hosted by UB Educational Opportunity Center, Buffalo, NY

One Region Forward: A New Way to Plan for Buffalo Niagara


March 17, 2014

Scenario Planning Workshop on the Road hosted by Niagara County Planning Board, Sanborn, NY

March 13, 2014

Scenario Planning Workshop on the Road hosted by Parkside Community Association, Buffalo, NY

March 11, 2014

Buffalo Rotary Club

March 11, 2014

Amherst Chamber of Commerce Emerging Business Leaders Coffee Connections

March 10, 2014

Scenario Planning Workshop on the Road hosted by United Way of Buffalo, Buffalo NY

March 10, 2014

Scenario Planning Workshop on the Road hosted by Lockport Main Street Association, Lockport, NY

March 7, 2014

Scenario Planning Workshop on the Road hosted by Tapestry Charter School, Buffalo, NY

March 7, 2014

Western New York Service Collaborative Presentation, Buffalo, NY

March 6, 2014

Scenario Planning Workshop on the Road hosted by hosted by the Hamlin Park Taxpayers Association, Buffalo, NY

March 3, 2014

Scenario Planning Workshop on the Road hosted by University at Buffalo’s Undergraduate Academies, Amherst, NY

February 2014 February 27, 2014

Scenario Planning Workshop on the Road hosted by Young Nonprofit Professional’s Network of Greater Buffalo, Buffalo, NY

February 26, 2014

People and Possibilities- Niagara Falls Public Access Television, Niagara Falls, NY

February 26, 2014

Scenario Planning Workshop on the Road hosted by Buffalo State College’s Geography Department, Buffalo, NY

February 25, 2014

Building Economic Resilience to Disasters in the Buffalo Niagara Region, Niagara Falls, NY

February 13, 2014

Fillmore Corridor Neighborhood Coalition, Buffalo, NY

February 11, 2014

Local Government Council and Private Sector Council Joint Event, Buffalo, NY

February 8, 2014

Scenario Planning Workshop on the Road hosted by Clarence IDA, Clarence, NY

January 2014 January 27, 2014

University at Buffalo Sustainability Academy, Amherst, NY

January 22, 2014

Smart Growth in Village Centers Forum, Williamsville, NY

January 22, 2014

Young Nonprofit Professional Network of Greater Buffalo, Buffalo, NY

January 21, 2013

Scenario Planning Workshops hosted by Junior League of Buffalo, Six locations across the region (3 in Buffalo, 2 in Clarence, 1 in Orchard Park)

January 15, 2014

Lockport Community Service Provider Coalition , Lockport, NY

January 8, 2014

GBNRTC Planning and Coordinating Committee, Buffalo, NY

December 2013 December 19, 2013

WNY Chapter of New York State Commercial Association of Realtors, Amherst, NY

December 16, 2013

Scenario Planning Workshop on the Road #1 hosted by Chris Miller, Buffalo, NY

December 12, 2013

A Curbside Chat with Chuck Marohn, Buffalo, NY

November 2013 November 16, 2013

Nov 2013 Community Congress: Scenario Planning Workshop #5, Lewiston, NY

November 15, 2013

Nov 2013 Community Congress: Scenario Planning Workshop #4, Lockport, NY

November 14, 2013

Nov 2013 Community Congress: Scenario Planning Workshop #3, East Aurora, NY

November 13, 2013

Nov 2013 Community Congress: Scenario Planning Workshop #2, Buffalo, NY

November 12, 2013

Nov 2013 Community Congress: Scenario Planning Workshop #1, Amherst, NY

November 6, 2013

League of Women Voters of Buffalo Niagara - Government Committee, Buffalo, NY

October 2013 October 30, 2013

Blasdell Farmer’s Market, Blasdell, NY

October 24, 2013

Buffalo Food Policy Summit - Policymakers Summit, Buffalo, NY

October 23, 2013

2nd Buffalo Food Policy Summit, Buffalo, NY

One Region Forward: A New Way to Plan for Buffalo Niagara

151


A NEW WAY TO PLAN | APPENDIX

October 12, 2013

Kenmore Farmer’s Market, Kenmore, NY

October 4, 2013

2013 Conference on the Environment: A Bi-National Sustainability Summit, Buffalo, NY

September 2013 September 28, 2013 September 26, 2013

Buffalo Board of Block Clubs, Buffalo, NY

September 26, 2013

Buffalo Niagara 360 Kickoff Celebration, Buffalo, NY

September 19, 2013

Erie County Village Mayors Association, Depew, NY

September 18, 2013

UB Sustainable Living Fair, Amherst, NY

September 14, 2013

Lockport Community Market, Lockport, NY

September 7, 2013

Elmwood-Bidwell Farmer’s Market, Buffalo, NY

August 2013 August 24, 2013

Elmwood Avenue Festival of the Arts, Buffalo, NY

August 21, 2013

Buffalo Promise Neighborhood Community Fun Day, Buffalo, NY

August 17, 2013

2nd Annual City of Night, Silo City, Buffalo, NY

August 14, 2013

Matt Urban Hope Center-Mobile Safety Net Team Outreach

August 10, 2013

47th Annual Lewiston Art Festival, Lewiston, NY

August 7, 2013

Open Buffalo Presents Young Invincibles, Buffalo, NY

July 2013 July 18, 2013

Leadership Niagara, Amherst, NY

July 15, 2013

WBNY 91.3 FM Environmental Show, Buffalo, NY

July 8, 2013

WNY Higher Education Network in Sustainability, Amherst, NY

June 2013 June 29, 2013

Taste of Diversity, Buffalo, NY

June 27, 2013

Resources for Proactive Preservation and Redevelopment, Buffalo, NY

June 22, 2013

Buffalo Zoo Party for the Planet, Buffalo, NY

June 20, 2013

Association of Erie County Governments, Brant, NY

June 20, 2013

The Foundry Community Meeting, Buffalo, NY

June 19, 2013

Funders Network for Smart Growth and Livable Communities Meeting, Buffalo, NY

June 15, 2013

Juneteenth Festival, Buffalo, NY

June 14, 2013

Amherst Chamber of Commerce Public Affairs Committee, Williamsville, NY

June 13, 2013

Business Alliance for Local Living Economies Conference, Buffalo, NY

June 1, 2013

Springville Dairy/Ag Festival, Springville, NY

May 2013 May 30, 2013

Alden Community Meeting, Alden, NY

May 23, 2013

Wheatfield Town Board and Planning Board, Wheatfield, NY

May 18, 2013

Designing to Live Sustainably: Imagine Buffalo, Buffalo, NY

May 10, 2013

University at Buffalo School of Architecture and Planning Commencement Luncheon, Buffalo, NY

April 2013 April 28, 2013

Relay for Renewables - A Renewable Energy Fair, Appelton, NY

April 24, 2013

Royalton Town Board and Zoning Board, Royalton, NY

April 22, 2013

Strand in the Place Where You Live - University at Buffalo Earth Day event, Amherst, NY

April 19, 2013

Niagara Business Associates, Buffalo, NY

April 16, 2013

Hilbert College, Corporate Social Responsibility and Sustainability Class, Hamburg, NY

March 2013 March 25, 2013 March 15, 2013

152

9th Annual Western New York Environmental Summit, Buffalo, NY

Urban Land Institute - Sustainable Infrastructure, Spotlight on Leadership, Buffalo, NY Village Center and Urban Core Revitalization, Buffalo, NY

One Region Forward: A New Way to Plan for Buffalo Niagara


March 14, 2013

February 2013 February 26, 2013

WNY Green Infrastructure Forum, Buffalo, NY WNY Grantmakers, Amherst, NY

February 12, 2013

Erie County Village and Town Clerks, Buffalo, NY

February 2, 2013

Community Congress meeting #2, Niagara Falls, NY

January 2013 January 29, 2013

Community Congress meeting #1, Buffalo, NY

January 29, 2013

Niagara Erie Regional Coalition, Buffalo, NY

January 25, 2013

Hamburg Development Corporation, Hamburg, NY

January 24, 2013

Air and Waste Management Association, Buffalo, NY

November 2012 November 20, 2012

Erie County Environmental Management Committee, West Seneca, NY

November 14, 2012

One Region Forward Private Sector Council, Buffalo, NY

November 13, 2012

One Region Forward Local Government Council, Buffalo, NY

November 10, 2012

Western New York Environmental Alliance Annual Congress, Buffalo, NY

October 2012 October 18, 2012

Niagara County Supervisors Association, Lockport, NY

October 16, 2012

Western New York Regional Economic Development Council Smart Growth Working Group, Buffalo, NY

October 11, 2012

International Council of Shopping Centers Buffalo Meeting, Buffalo, NY

September 2012 September 29, 2012

Daemen College Environmental Summit , Buffalo, NY

September 26, 2012

Preservation Plus Conference, Buffalo, NY

September 26, 2012

National Brownfields Workshop, Buffalo, NY

September 20, 2012

Upstate New York American Planning Association Conference, Cortland, NY

July 2012 July 11 2012

Joint Meeting of the Village of East Aurora Planning Commission and Town of Aurora Planning Board, East Aurora, NY

May 2012 May 16, 2012

Western New York Environmental Alliance Urban Regeneration Group, Buffalo, NY

April 2012 April 27, 2012

Western New York Regional Economic Development Council Smart Growth Working Group, Buffalo, NY

One Region Forward: A New Way to Plan for Buffalo Niagara

153


A NEW WAY TO PLAN | APPENDIX

Appendix G

List of Organizations Throughout the One Region Forward planning process a broad base of organizations were engaged to help guide the plan. At Community Congress sessions, our lecture series, Citizen Planning School, Local Government and Private Sector council meetings, working team meetings and more, over 700 organizations helped shape One Region Forward. We made an attempt to catalog all the organizations that helped shape the process.

Academic Institutions or Foundation American Chemical Society**

M&T Charitable Foundation

Trocaire College

Baird Foundation

Mandala School

University at Buffalo

Brock University

Niagara County Community College

University at Buffalo Academies

Buffalo Public Schools

Niagara Falls City School District

Castellani Art Museum of Niagara University

Niagara Falls High School

University at Buffalo Coalition for Leading Ethically in Academic Research University at Buffalo IDeA Center

City Honors School

Niagara Frontier Center- College Achievement Requires Engaged Students

City Vision College

Niagara University

University at Buffalo Liberty Partnerships

College Achievement Requires Engaged Students (CARES)

Oakmoss Education Open Buffalo

University at Buffalo Office of Sustainability **

Community Foundation for Greater Buffalo**

Orleans Niagara Boces

University at Buffalo Regional Institute * **

Paleontological Research Institution

University at Buffalo School of Architecture and Planning

Cornell University Daemen College Daemen College Center for Sustainable Communities and Civic Engagement (CSCCE)* Daemen Society Work Alliance Ecosystem Restoration Through Interdisciplinary Exchange (ERIE) Global Concept Charter School Lasalle Middle School Local Initiatives Support Corporation Buffalo (LISC)* ** Lockport School District

Partners for a Livable Western New York

University at Buffalo Law School

ReNU Niagara**

University at Buffalo School of Management

Small Business Development Center at SUNY Buffalo State

University at Buffalo Society of Feminists

Student Social Work Organization of Buffalo State College

University at Buffalo’s Department of History

SUNY Buffalo State

University at Buffalo’s Teacher Education Institute

SUNY Buffalo State, Volunteer and Service-Learning Center

University District Community Development Association**

Tapestry Charter School

Western New York Prosperity Scholars

The Baird Foundation

Williamsville School Board

The John R. Oishei Foundation-Mobile Safety Net * **

* Steering Committee Member ; ** Working Team Member 154

One Region Forward: A New Way to Plan for Buffalo Niagara


Business and Private Sector Organizations Greenman-Pedersen, Inc.

Adler Services

Cantor Fitzgerald

Advanced Business Connection

Carmina Wood Morris, P.C.

Akron Chamber of Commerce

Cascades Recovery - Buffalo Office

Akron Sports, Inc.

Cazenovia Recovery Systems, Inc.

All Communications Network

CBRE Buffalo Commercial Real State

Alternative Press

Century 21 Real Estate

American Egg Board

Charles Gordon Architecture

Anspach Meeks Ellenberger LLP**

Chuck Banas Consulting

Applied Sciences Group, Inc.

Ciminelli Real Estate Corporation

Architectural Resources Arden Hill Life Care Center

Cincinnati Center City Development Corporation (3CDC)

Ardent Commercial Real Estate Advisors

Citigroup

Arista Development & Real Estate

City Craft Ventures

Art’s Cafe

CL How Farm

Automatic Data Processing

Clarence Chamber of Commerce

AXA Advisors

Community Bank N.A.

International Imaging Materials, Inc. (IIMAK)

Barker Business and Professionals Association

Community Beer Works**

J. Fiorie & Company

Concept Construction Corporation

Jaeckle Fleischmann & Mugel, LLP**

Barone Architecture and Consulting, PLLC

Conestoga Rovers & Associates

James & Associates

Barone Building Company

James A. Rumsey Architect

Benchmark & Turnkey Companies

Cushman & Wakefield-Pyramid Brokerage Company

Benderson Development

David Homes

Bergmann Associates

DEL Resource

BHNT Architects, PC

Depew/Cheektowaga Taxpayers Association Inc.

Bison Contracting & Builders Supply Black Capital Network Black Chamber of Commerce

Hamlin Park Taxpayers Association

Design Synergies Architecture P.C.** Eastern Hospitality Advisors

Blue Sky Design Supply

Ecology & Environment, Inc.

Bohler Engineering

Ellicott Development Company

Buffalo Clean Energy

Evans Bank

Buffalo Geothermal Heating and Cooling**

Fairmount Properties

Buffalo Motor Works

First Niagara Bank

Buffalo Niagara 360

Flight of Five Winery

Buffalo Niagara Enterprise

Flynn Battaglia Architects

Buffalo Niagara Partnership Development Advisory Committee*

Foit-Albert Associates

Buffalo-Niagara Association of Realtors Building Controls & Services, Inc. C&S Companies Calamar Enterprises Caliber Commercial Brokerage, LLC Cannon Design

Hart Lyman Companies, LLC Hastings + Cohn Real Estate HDS Industrial Design & Drafting, Inc. Healthminds** Home Buyers Marketing II** Horn Companies, LLC Hylan Asset Management Ingram Micro International Council of Shopping Centers (ICSC)

Jazz Gas Joy Kuebler Landscape Architect, PC

eco_logic STUDIO, architecture & engineering, PLLC

Buffalo Tours

Hart Corporation

Innovative Realty Services, Inc.

Black Dog Strategy & Brand

Buffalo Rising

Harris Beach PLLC

Kavinoky Cook, LLP** Kean Wind Turbines, Inc. Key Bank** KHEOPS Architecture, Engineering and Survey, DPC Kideney Architects Kreher’s Farm Fresh Eggs LaBella Associates, D. P.C. Larkin Center of Commerce Larkin Development Group LEED Concepts - LEED AP Sustainability Consulting Life Work Transitions Lippes Mathias Wexler Friedman LLP LiRo Engineers, Inc.

Fully Forward

Lockport Main Street Association

G.S.M. Construction Corp. GAR Associates

Lougen, Valenti, Bookbinder & Weintraub, LLP

General Motors - Tonawanda Engine

M&T Bank

Gin-Sue Enterprises, LLC Goudy Real Estate Group

Main Street Business & Professional Association (Niagara Falls)

Grasser & Associates, LLC

Manguso Development Company, LLC

Grayline

Manzella Marketing Group

Greater Lockport Development Corporation*

Marie’s Sewing Center * Steering Committee Member ; ** Working Team Member

One Region Forward: A New Way to Plan for Buffalo Niagara

155


A NEW WAY TO PLAN | APPENDIX

Marine Services Diversified, LLC**

Ran Webber Design Studio

The DiMarco Group, LLC

McCollum Orchards

Realty USA

McCullagh Coffee

Residence Inn

The Economic Development Corporation for Erie County (ECIDA)

McGuire Group

Rich Products

The Howard Group

Merchants Insurance Group

Rite Aid

The Knoer Group, PLLC

Merrill Lynch - Bank of America Corporation

Royal Bank of Canada

The OSC Group

Royal Realty Development

The Pike Company

Militello Realty

The Rose Hill Group of WNY, Ltd.

Modern Corporation

Rupp, Baase, Pfalzgraf, Cunningham & Coppola LLC

MPS Architecture

Rycon Construction, Inc.

Tonawanda News

National Fuel Gas Distribution

Sanborn Farm Museum

TriMain Center

National Grid

Sandis Family Restaurant

Turner Construction

National Power Source

Sarah G. Carney LLC

Turnkey Environmental Restoration, LLC

NBT Solutions LLC**

Saratoga Associates

TVGA Consultants

New York Business Development Corporation

Savarino Companies

U.S. Energy Partners

Schneider Development

Uniland Development Company**

Niagara County Historical Society

Schuste Software

United Parcel Service

Niagara Gazette

Seneca One Realty, Buffalo Place

UNYSE Environmental Consultants

Niagara River Region Chamber of Commerce

Siemens Building Technologies, Inc.

Urban Land Institute of WNY

Singer Farms**

Urban3

Skeo Solutions

Watts Architecture and Engineering, P.C.

SolEpoxy

Wendel Companies**

Sunshine Xchange

Willdan Energy Solutions

Supermarket Management, Inc.**

Windsor Village

Supply Chain Optimizers**

Windsor Village boutique shopping, entertainment and accommodations development

Niagara Wind & Solar** NorthMarq Capital Northtown, Inc. Nussbaumer & Clarke, Inc.** O’Brien & Gere Old Time Roots Oz Central of New York, LLC Paint of WNY Parkitects, Inc. Parsons Brinckerhoff, Inc. Phillips Lytle, LLP Preservation Studios

TM Montante Development**

Sutton Real Estate Company, LLC T.Y. Lin International Group

WWS Planning

Tapecon, Inc.

Zamkro Development

Ten Thousand Villages The Black Chamber of Commerce of WNY The Buffalo News

Community Organizations (cultural, advocacy, or other nonprofits) 1415 Community Organization, Inc.

American Association of University Women ( AAUW )

AmeriCorps VISTA

21st Century Park on the Outer Harbor AARP**

American Cancer Society

Arden/Newburgh Block Club

Adirondack Mountain Club

American Farmland Trust**

Artfarms

Akron Newstead Rotary

American Federation of State, County and Municipal Employees

Arts Services Initiative of Western New York**

Allentown Association

American Planning Association - Western New York Upstate Chapter

Alliance for the Great Lakes**

Aurorans for Climate and Energy Sense (ACES)

American Red Cross

Alliance of Riverside Block Clubs

Bailey/Brinkman Block Club

AmeriCorps Builds Lives through Education (ABLE)

Baker Homes Tenant Council, Inc.

Albright-Knox Art Gallery

Alpha Kappa Chi

Anne Frank Project

* Steering Committee Member ; ** Working Team Member 156

One Region Forward: A New Way to Plan for Buffalo Niagara


Be Active

Child & Family Services

Belmont Housing Resources for WNY, Inc.* **

Citizen Action Organization

Fruit Belt-McCarley Gardens Housing Task Force

City of Night Coordination Committee

Garden Walk Buffalo

Bennett Village Block Club

Clean Air Coalition

Girl Scouts of WNY

Binational Alliance

Climate Reality Leadership Corps

Gloria J. Parks Community Center

Bi-national Niagara Greenway Marathon Event

Coalition for Economic Justice**

Go Bike Buffalo**

Coalition of Black Trade Unionists

Grace Episcopal Church

Coalition on West Valley Nuclear Wastes

Grace Guest House, Inc.

Colden Citizens for a Community Trail

Greater Buffalo Cultural Alliance (GBCA)

Brinton Street Block Club

Columbus Park Association

Broadway Fillmore Alive

Community Concepts

Greater Buffalo Sports & Entertainment Complex

Brush Up Buffalo

Community Missions of Niagara Frontier**

Bryant, Oakland Summer Street Association

Connelly Street Block Club

Buffalo Arts Studio

Courtland Avenue Block Club

Buffalo CarShare**

Creekwoods Association

Buffalo Citybration

Days Park Block Club

Buffalo ExPat Network Buffalo First

Delaware Park South Neighborhood Association

Buffalo Harbor Sailing Club

Designing to live sustainably (d2la)

Buffalo Hearing and Speech Center

Dorie Miller Rifle and Pistol Club

Buffalo Institute of Urban Ecology, Inc.

East Aurora Co-Op

Buffalo Neighborhood Alliance

East Lovejoy Coalition of Neighbors

Buffalo Niagara Riverkeeper* **

Economic Justice Action Group (EJAG)

Housing Opportunities Made Equal (HOME)**

Buffalo Olmsted Parks Conservancy**

ELIM Christian Fellowship

Hudson Street Revitalization Project

Buffalo Philharmonic Orchestra (BPO)

Elmwood Village Association

IBEW Local 41

Buffalo Place Inc.

Emerging Leaders in the Arts Buffalo (ELAB)

IBEW Local 97

Bissell Avenue Block Club #2 Board of Governors for the Network of Religious Communities

Buffalo Quaker Meeting Buffalo ReformED Buffalo Urban Development Corporation (BUDC)** Buffalo Urban League of Young Professionals

GrowWNY Guild Care Habitat for Humanity Hamburg Chamber of Commerce (town and village) Heart of the City Neighborhoods, Inc.** Hearts and Hands: Faith in Action** Hertel-North Buffalo Business Association Hooray for Decay Composting

Imagine: Hamburg

Emmanuel United Methodist Church

International Institute of Buffalo Refugee Resettlement Agency

Erie County Coalition for Restorative Justice

Isaiah 61 Project, Inc.

Evangelical Lutheran Church of America

It Takes A Village Action Organization

Family & Children’s Service of Niagara

Jericho Road Ministries

Family Promise of WNY

Buffalo Wind Action Group

Fannie Mae Upstate New York Community Business Center

Campaign for Greater Buffalo History, Architecture, and Culture Canopy of Neighbors Carnegie Art Center Castle Place Block Club Catholic Charities Multisystemic Therapy (MST) Catholic Charities of Buffalo Catholic Charities Women, Infants and Children (WIC) Program Center for the Study of Art, Architecture, History and Nature (C_SAAHN)

Green Team Committee Delaware Tower Greenprint Niagara

Continental 1

Buffalo Urban League, Inc. Buffalo’s Neighborhood Postcard Project

Green Buffalo Runner

Journey’s End Refugee Services Judges Raw Black Club

Field & Fork Network**

Junior League of Buffalo

Fillmore Corridor Neighborhood Coalition (FCNC)

Keep Western New York Beautiful (KWNYB)

Fillmore-Leroy Area Residents, Inc. (FLARE)

Labor Council for Latin American Advancement

Food & Water Watch and WNY Drilling Defense

Lakewood Ave Block Club

Food for All**

League of Women Voters

Freedom, Rights, Education & Empowerment (FREE)

Learning Sustainability Campaign

Friends of Mike’s Pond

Lexington Co-op

Friends of Night People

Linwood Preservation District and Friends Neighborhood Association

Friends Of Times Beach Nature Preserve

Leadership Niagara

Leroy Avenue Block Club

* Steering Committee Member ; ** Working Team Member One Region Forward: A New Way to Plan for Buffalo Niagara

157


A NEW WAY TO PLAN | APPENDIX

Literacy New York Buffalo-Niagara, Inc.

Roosevelt Block Club

VOICE Buffalo* **

Livingston Homeowners Association

Ruhland Avenue Block Club

Volunteer Lawyers Project

Manhart Street Block Club

Rusty Nickel Coop

Wade Avenue Block Club

Martha Avenue Block Club

Seneca-Babcock Community Association

Weinberg Campus

Martin Luther King Jr Community Development Corporation

Shea’s Performing Arts Center

Wellness Institute of Greater Buffalo**

Sierra Club

West Side Community Services

Massachusetts Avenue Project**

Silo City

West Side Neighborhood Housing Services

Memorial Park Block Club

Small Town Civics

Western New York Area Labor Federation**

Memorial Park Neighborhood

Soka Gakkai International USA

Western New York Drilling Defense

Merrimac Street Block Club

SOLE of Buffalo

Merry-Wood Block Club Association

South Fillmore Block Club

Western New York Environmental Alliance (WNYEA)* **

Mt. Olive Missionary Baptist Church, Inc.

Southtowns Community Enhancement Coalition

National Association for the Advancement of Colored People (NAACP)

Western New York Environmental Alliance Parks and Recreation Working Group

Springville Center for the Arts

Western New York Food Bank

National Garden Festival

Springville/Concord Elder Network

Nazarene Messianic Party

St. Johns Outreach Center

Neighborhood Legal Services, Inc.**

St. Mark Open Door

Niagara Community Forum

Street Synergy

Niagara Falls Block Club Council

Strengthening Families Program

Niagara Falls Rotary Club

Westminster Economic Development Initiative

Sugar City

Niagara Greenspace Consortium

Williamsville Lehigh Valley Depot

Sustainable Earth Solutions

Nickel City Housing Co-Op

Wind Action Group

The Belle Center

Nickel City Housing Cooperative

Young Men’s Christian Association

The Good Neighborhood

North Buffalo Community Organization (NorthBuffalo.org)

The Learning Sustainability Campaign

Young Nonprofit Professional’s Network of Greater Buffalo

The Neighbors Block Club

Youth Mentoring Services Niagara County

The Niagara Arts and Cultural Center

YWCA of Niagara County

North Lincoln Parkway Block Club Parkdale Community Garden Parkside Community Association Partnership for the Public Good

Western New York Land Conservancy** Western New York Peace Center Western New York STEM Hub

The Niagara Ministerial Council The Nickel City Housing Cooperative

Peace of the City

The Service Collaborative of Western New York

People Inc.

Theatre of Youth

People United for Sustainable Housing Buffalo (PUSH Buffalo)**

Tifft Nature Preserve

Planned Parenthood of Central and Western New York

Trinidad Neighborhood Association

Toastmasters International

Potomac “400” Block Club

U Community Health Organization, Inc.???

Preservation Buffalo Niagara

U.S. Green Building Council New York Upstate Chapter

Prince of Peace Lutheran Church Prospect Hill Neighborhood Alliance Queen City Rail Trails Rediscover Riverside Region 9 Re-leaf Planning Committee Re-tree WNY Richardson Center Corporation Ride for Roswell Riverside/Black Rock Good Neighbors Planning Alliance

United Way of Buffalo and Erie County University Community Farmers Market University Heights Baptist Church University Heights Collaborative Upstate New York Transplant Services Urban League Urban Roots Veterans Voices of WNY Vision Niagara

* Steering Committee Member ; ** Working Team Member 158

One Region Forward: A New Way to Plan for Buffalo Niagara


Government (local, state, county or federal) Akron (Village)

Buffalo Sewer Authority**

Erie County*

Akron Fire Company

Buffalo State Collage

Akron Planning Board (Village)

Buffalo Urban Renewal Agency (BURA)

Erie County Council for the Prevention of Alcohol and Substance Abuse (ECCPASA)

Akron Zoning Board of Appeals

Cambria (town)

Alden (Town)

Cattaraugus County

Alden (Village)

Cazenovia Community Resource Center

Alden Chamber of Commerce

Cheektowaga (Town)**

Alden Economic Development Committee

Cheektowaga Planning Board

AmeriCorps

Cheektowaga Town Committee

Amherst (Town)

Cheektowaga Zoning Board of Appeals

Amherst Chamber of Commerce

Citizens for Regional Transit**

Amherst Committee on Disabilities Amherst Democratic Committee

City of Buffalo - Division of Citizen Services

Amherst Energy Advisory Committee

Clarence (Town)

Amherst Industrial Development Agency

Clarence Democrats

Amherst Planning Board

Clarence Industrial Development Agency

Amherst Planning Department

Clarence Planning Board

Amherst Traffic Safety Board

Clarence Zoning Board of Appeals

Amherst Youth Board

Clean Air Coalition of WNY**

Amherst Zoning Board of Appeals

Clean Cities of WNY

Assemblyman Dennis Gabryszak’s Office

CNG for Upstate NY

Food Systems Planning and Healthy Communities Lab

Assemblyman John Ceretto’s Office

Colden (town)

Good Neighbors Planning Alliance

Association of Erie County Governments*

Colden Planning Board (town)

Gordon Strategic Planning

Aurora (Town)

Coldwell Banker Commercial

Grand Island (Town)

Aurora Planning & Conservation Board

Community Health Center of Buffalo (CHCB)

Grand Island Conservation Commission

Concord (Town)

Grand Island Zoning Board of Appeals

Concord Planning Board

Grassroots Gardens of Buffalo**

Congressman Brian Higgins’s Office

Greater Buffalo-Niagara Regional Transportation Council (GBNRTC)**

Aurora Zoning Board of Appeals B Team Buffalo Barker (Village) Brant (Town)**

Erie County Department of Environment and Planning** Erie County Division of Sewerage Management Erie County Environmental Education Institute Erie County Industrial Development Agency Erie County Legislature District 2 Erie County Legislature District 6 Erie County Office of Economic Development Erie County Water Authority** Evans (Town) Evans Planning Board Evans Planning Department Food Policy Council of Buffalo and Erie County**

Grand Island Town Council

Buffalo & Erie County Botanical Gardens

Cornell Cooperative Extension of Niagara County**

Buffalo (City)* **

East Aurora (Village)

Buffalo (City) Office of Strategic Planning

Hamburg (Town)

Buffalo (City) Planning Board

East Aurora Historic Preservation Commissions

Hamburg (Village)

Buffalo (City) Preservation Board

East Aurora Pedestrian Bicycle Board

Buffalo Audubon Society

East Aurora Planning Commission**

Buffalo Central Terminal Restoration Corporation

East Aurora Zoning Board of Appeals

Hamburg Preservation Commission (Village)

Buffalo Employment & Training Center

East Buffalo Neighbor Planning Association-Broadway Fillmore Alive

Hamburg Zoning Board of Appeals (Town)

Buffalo Municipal Housing Authority**

Eden (Town)*

Buffalo Museum of Science

Eden City Council

Highland Community Revitalization Committee, Inc.

Buffalo Niagara Builders Association

Eden Planning Board

Holland (Town)

Buffalo Niagara Medical Campus (BNMC)* **

Elbridge (Town)

Holland Zoning Board of Appeals

Elma (Town)

Buffalo Niagara Partnership (BNP)* **

Homeless Alliance of Western New York**

Empire State Development Corporation*

Horizon Performance Solutions, LLC

Buffalo Promise Neighborhood

Groundwork Buffalo

Hamburg Planning Board (Town) Hamburg Planning Commission***(Village)

Hartland (Town)

* Steering Committee Member ; ** Working Team Member One Region Forward: A New Way to Plan for Buffalo Niagara

159


A NEW WAY TO PLAN | APPENDIX

Hyde Park Business & Professional Assoc. Kaleida Health

New York State Homes and Community Renewal

North Tonawanda Community Development (City)**

Kenmore Planning Board (Village)

New York State Senate

NYS Agricultural Society

Kenmore Village Improvement Society (KVIS)

New York Sustainable Agriculture Working Group

NYS Documentary Heritage Program (DHP)

Kenmore Zoning Board (Village)

Newstead (Town)

Orchard Park (Town)

Ken-Ton Chamber of Commerce

Newstead Town Board

Orchard Park (Village)

Kleinhans Community Association

Niagara Beautification Commission

Lackawanna (City)

Niagara County*

Orchard Park Economic Development Committee

Lackawanna (City)

Niagara County Department of Economic Development**

Orchard Park Planning Board (Town)

Niagara County Department of Social Services*

Public Policy and Education Fund of New York

Niagara County Emergency Services Office**

Revitalize Springville

Lewiston (Village) Lewiston Council on the Arts

Niagara County Employment and Training

Sardinia Zoning Board of Appeals

Lewiston Historic Preservation and Planning Commission (Village)

Niagara County Industrial Development Agency

Senator Kirsten Gillibrand’s Office

Lockport (City)

Niagara County Legislature

Seneca Commission for Economic Development

Lockport (Town)

Niagara County Planning Board

Serve New York VISTA

Lockport (Town) Economic Development

Niagara County Sewer District**

Lockport Care Net

Niagara County Social Services

Southtowns Rural Transit Corporation Inc.**

Lockport Community Development (City)

Niagara County Supervisors Association*

Springville (Village)

Lockport Industrial Development Agency (Town)

Niagara County Veteran Services

Springville Area Chamber of Commerce**

Niagara Falls (City)*

Lockport Police Department (City and Town)

Niagara Falls (City) - Office of Planning

Springville Griffith Institute School District

Niagara Falls City Council

State Senator George Maziarz’s Office

Niagara Falls City Government

State Senator Patrick Gallivan’s Office

Niagara Falls Housing Authority*

The Wellness Institute of Greater Buffalo

Niagara Falls Memorial Health Home Director

Tonawanda (Town)

Lancaster Area Chamber-Commerce Learning Disabilities Association of WNY Lehigh Valley Depot Committee

Lockport Public Library Lovejoy Council District Marilla (Town) Marilla Zoning Board of Appeals (Town) Mayor’s Citizen’s Participation Academy

Pendleton Zoning Board of Appeals (Town)

Royalton (Town)**

Tonawanda Economic Development (Town)

Niagara Falls Memorial Medical Center (NFMMC)

Mental Health Association of Niagara County

Niagara Falls Planning Board

Tonawanda Environment Commission (Town)

Niagara Falls Planning Board (City)

Tonawanda Planning Board (Town)

Natural Resources Defense Council

Niagara Falls, NY Chamber of Commerce

Neighborhood Heal Center (St. Mary’s Hospital)

Niagara Frontier Transportation Authority (NFTA)* **

Tonawanda Zoning Board of Appeals (Town)

New York Power Authority**

Niagara Military Affairs Council (NIMAC)

USA Niagara Development Corporation**

New York State Association of Commercial Realtors - WNY Chapter

Niagara Organizing Alliance for Hope (NOAH)

Visit Buffalo Niagara

New York State Department of Environmental Conservation

Niagara Orleans Central Labor Council

West Seneca (Town)

Niagara Region State Parks Commissioner

West Seneca Environmental Commission (Town)

Medina Canal Task Force

New York State Department of State, Division of Smart Growth* New York State Department of the State New York State Department of Transportation (NYSDOT)* New York State Energy Research and Development Authority (NYSERDA)**

Niagara River Greenway Citizen’s Advisory Committee Niagara Science Museum Niagara Tourism & Convention Corporation North Castle (Town)

United States House of Representatives

Watch Wilson Grow

West Seneca Planning Board (Town) West Seneca Zoning Board of Appeals (town) Western New York Emerald Ash Borer Task Force

North Tonawanda (City) * Steering Committee Member ; ** Working Team Member 160

One Region Forward: A New Way to Plan for Buffalo Niagara


Western New York Regional Economic Development Council Western New York Restorative Justice Western New York Sustainable Energy Association Trust** Wheatfield (Town) Wheatfield Agriculture Focus Group (Town) Wheatfield Economic Development Committee (Town) Wheatfield Fire Advisory Board (Town) Wheatfield Greenspace Focus Group (Town) Wheatfield Planning Board (Town) Wheatfield Recreation Department (Town) Williamsville (Village)** Wilson (Village) Wilson Planning Board (Village)

* Steering Committee Member ; ** Working Team Member One Region Forward: A New Way to Plan for Buffalo Niagara

161


Appendix H

Seneca Nation & One Region Forward The Seneca Nation of Indians is a valued One Region Forward partner and is working on a number of sustainability initiatives in the Western New York region. The following background and project information submitted by the Seneca Nation of Indians served to inform the planning process and was incorporated into the Regional Plan for Sustainable Development document.

Seneca Nation of Indians: Brief History and Culture The Seneca were the largest of six Native American nations which comprised the Iroquois Confederacy, or Six Nations, a democratic government that pre-dates the U.S. Constitution. Once occupying vast territory beyond its current political boundaries, the historical Seneca occupied territory throughout the Finger Lakes area in Central New York, and in the Genesee Valley in Western New York, living in longhouses on the riversides. The Seneca Nation of Indians reorganized its tribal government structure in 1848 with the adoption of a formal written constitution that provides leadership by elected officials through a democratic process. Because they are the westernmost of the Six Nations, the Seneca are known as the “Keeper of the Western Door.” The Seneca Nation currently has a total enrolled population of 8,128 members, with 4,131 members residing on the Allegany and Cattaraugus Territories (Seneca Nation of Indians Tribal Enrollment, July 2014). Many Seneca members live off-territory, with a significant number residing in the Western New York Region and many in other parts of the country. Approximately 11,800 tribal people (non-enrolled Seneca and members of other Tribes) live on or near the Seneca territories and are within the Seneca’s operating service area, receiving health and other support services from Seneca programs. Today the Seneca Nation supports its own people and benefits surrounding communities with a variety of cultural, educational and economic efforts. Its varied enterprises include world-class casino gaming, hospitality and entertainment (which employ over 3,500 people), a chain of four convenience stores, construction management, and diverse business ventures. Language, song, art, dance, and sports are all vital aspects of Seneca culture. A Faithkeepers’ School supports and ensures the ongoing practice of traditional teachings, arts, knowledge and the living culture of the Longhouse ways. The vibrancy of the rich Seneca heritage is evident in the ongoing ceremonies, practices, and cultural events that are infused with dance, music and song, arts, crafts and traditional foods that honor and celebrate Seneca culture.

162

One Region Forward: A New Way to Plan for Buffalo Niagara


Seneca Nation Leading the Way to Build a Healthier, More Sustainable Future From an early age, Seneca and the other Haudenosaunee people recognize the importance of our surrounding environments, noting the delicate balance of every aspect. The Ganö:nyök or Thanksgiving address is recited regularly at any gathering of people as a reminder of all there is to be thankful for and to bring about a Good Mind encouraging responsible actions. It has been said that you can’t know where you’re going until you know where you’ve been. Through cultural teachings, the Seneca Nation adheres to a philosophy that incorporates seven generations into its approach to providing for the welfare of its people. This generational approach includes the past, the present and the future. The Nation is putting this philosophy into action with services, programs and projects aimed at encouraging healthy lifestyles, and promoting renewable uses of our precious resources.

SEVEN GENERATIONS THOSE WHO HAVE PASSED GRANDPARENTS PARENTS YOU CHILDREN GRANDCHILDREN THOSE YET TO BE BORN

1. Seneca Wind Project: Nearly ten years ago, the Seneca Nation initiated the process to establish and implement a strategic energy plan. Planning for the project involved three distinct phases: Phase 1 was the visioning process, Phase 2 involved an energy audit and resource assessment, and Phase 3 provided for organizational development. By completing all three of these planning components, the Seneca Nation has positioned itself to implement a comprehensive energy plan. The Nation is committed to fostering the efficient utilization of its renewable resources by improving energy infrastructure; minimizing environmental impacts; building and training an educated workforce in the energy sector; and supporting the development of a sustainable, diversified, and vibrant economy. In 2014, the Seneca Nation received a $1.5 million grant award (FY 2014 U.S. DOE Community-Scale Clean Energy Projects in Indian Country Grant Program) to design and install a 1.7 MW wind turbine to provide electricity to tribal buildings and generate approximately 5.5 kWh of power on the Cattaraugus Territory. Additionally, this project will formalize the role of providing electric distribution services by Seneca Energy, LLC, a newly formed tribally-chartered utility corporation.

2. Seneca Transit System: In June 2013, the Seneca Nation Council approved a supplemental Report to the Tribal Transit Service Study which was initiated in June 2009 with the approval of the Final Report for the SNI Transit Study. The Nation has participated with other Southerntier agencies to bring limited Transit service to the Allegany Territory since 2011, but began offering its own Seneca Transit System (STS) between the Allegany and Cattaraugus territories in July of 2012. Further expansion of 6 roundtrips per weekday and Saturday service will begin in February of 2014. Future plans include establishment of a Transit Center in the Irving area of the Cattaraugus Territory and additional routes to better link the Territories and the Southern-tier to the Buffalo Niagara urban area. 3. Food is our Medicine: In response to the crisis of diabetes and related health issues among its members, the Seneca Nation has joined with the Seneca Diabetes Foundation to establish the Food Is Our Medicine (FIOM) Project. The overall goal of FIOM is to restore the health and wellbeing of the Seneca Community by reintroducing Native American food systems, Native models of nutrition, indigenous land management, and sustainable food production practices. FIOM is a grassroots initiative rooted in Seneca tradition. The project’s goal is to have members of the Seneca community experience the gift of health by cultivating their own gardens, participating in ongoing community-based horticultural events, learning sacred traditions from the Elders, and fostering the cultural education of the children for seven generations. FIOM initiatives include the Elders’ Sharing Circle, community gardens for Seneca children, FIOM 5K Run/Walk, the Seneca Nation Native Planting Policy, the Seneca Nation Farmers Market, and the FIOM documentary film series. Collectively, these efforts are helping to improve the quality of life for Nation members and neighboring communities.

One Region Forward: A New Way to Plan for Buffalo Niagara

163


Learn more by visiting us online www.oneregionforward.org


Turn static files into dynamic content formats.

Create a flipbook
Issuu converts static files into: digital portfolios, online yearbooks, online catalogs, digital photo albums and more. Sign up and create your flipbook.