Samuel Olken
Senior Thesis | 2025

The Responses of Infauna and Epifauna to Nitrogen Loading in Shallow Water Seagrass Beds
Abstract
West Falmouth Harbor, an estuary located on Buzzards Bay near Cape Cod, is a site containing both seagrass ecosystems that are known to have suffered from nitrogen loading due to runoff from a now-abandoned wastewater treatment plant, as well as ecosystems that remain relatively untouched, protected from the effects of nitrogen loading (Hayn et al., 2014). In this study, data is presented to support the hypothesis that an increase of nutrient pollution in seagrass ecosystems will decrease the population of the local infauna and epifauna as well as the resident plant life. Previous data taken over the past 20 years from West Falmouth Harbor displayed higher than average levels of nitrogen, a sign that excessive nitrogen loading and nutrient pollution has occurred in the inner Snug Harbor as opposed to the more protected Outer Harbor which contained relatively normal amounts of nitrogen (Hayn et al., 2014). After data collection and analysis during the summer months of 2024, it is reported that the populations of various taxonomic groups of infauna (sediment dwelling) and epifauna (surface dwelling) organisms were drastically lower in areas where nitrogen pollution was known to be higher (Snug Harbor) as opposed to areas where nitrogen loading was known to be lower comparatively (Outer Harbor). These results suggest that nitrogen loading has an effect across all levels of seagrass ecosystems, rather than only affecting the photosynthetic organisms in these ecosystems.
Introduction
Marine plant life provides both a stable habitat as well as a vital food source for a vast number of marine species in our oceans, especially the primary producers found towards the bottom of most food chains. Many marine grazers and other small primary consumers are vulnerable to predators in higher trophic levels of the food chain or starvation without the protection that expansive marine plant life provides (Goering et al., 1972). These plants, however, face their own challenges surviving in a constantly changing ocean environment. Recent studies have revealed that many species of marine plants, including seagrass life as well as other species of marine plants, are often put under threat through various mechanisms caused by global climate change (Howarth et al., 2008). One such mechanism that is known to be a prominent cause behind the decline of marine seagrass populations, especially in shallow ecosystems, is nitrogen loading, a process in which excess nitrogen is induced into an ecosystem (Olsen et al., 2013). Especially potent in shallow water ecosystems, where there is less water mixing due to a lack of deepwater ocean currents (Ashikin et al., 2020), the process of nitrogen loading has been shown to devastate marine plant life. Known in many cases to be caused by human pollution (Driscoll et al., 2003), nitrogen loading through sewage runoff, waste dumping, or other pollution methods will cause excessive algal growth in an environment enriched with nitrogen and nutrients. Cyanobacteria, a common species of phytoplankton present in many shallow water ocean ecosystems, convert this excess nitrogen into energy in a process that depletes the surrounding water of oxygen, and use it to rapidly multiply (Ashikin et al., 2020). These tiny phytoplankton will form a thick layer of algae on the surface of the water, dense enough that it will block the marine plant life from accessing the proper amount of sunlight needed for these plants to perform photosynthesis and
keep themselves alive, thus killing these marine plants in droves (Driscoll et al., 2003).
While the decline in their habitats provides reason to believe that nitrogen loading negatively affects the populations growth of local infauna (organisms that dwell within the sediment) and epifauna (organisms that dwell on/above the sediment) taxa in the surrounding ecosystems, it is unknown to what extent these smaller organisms are dependent on the health of the seagrass meadows that make up their habitat. Furthermore, it is unclear if nitrogen loading will have a more negative effect on organisms such as mollusks, gastropods, arthropods, polychaetes, nemerteans, bivalves and other sediment dwelling organisms as opposed to crustaceans, amphipods, isopods, shrimp, brittle stars, or other surface dwelling organisms. Through a 7 week long data sampling and analysis period, we designed a study built to answer these questions surrounding the effects of nitrogen loading on the various populations of infaunal and epifaunal species present in both the polluted and unpolluted areas of West Falmouth Harbor.
Site Introduction
Situated off the coast of Cape Cod in Buzzards bay, West Falmouth Harbor, a harbor that served as the site where all of our data collection occurred, provides a unique opportunity to study the effects of nitrogen loading on species of infaunal and epifaunal organisms. While the northwestern half of the Harbor (Snug Harbor) is situated directly next to a wastewater treatment plant that remained active until 2014 (Duncan et al., 2007), the other half of the harbor (Outer Harbor) is situated at a significant distance from the plant (Fig 1). The result recorded in previous studies in 2008-2009 illustrate that the amount of nitrogen in the Snug Harbor water (17 mmol N ! 2 " 1 ) is almost four times that found in the Outer Harbor waters (4 mmol N ! 2 " 1 ), providing
a significant enough difference to study its effects (Reynolds et al., 2015). Other than their levels of nitrogen (caused by the runoff from the wastewater treatment plant), these two halves of the harbor share near identical baselines. The mean temperature during the summer period of 2008-2009 of Snug Harbor and Outer Harbor were 23.8 ± 0.8°C and 23.8 ± 0.9°C, respectively, the levels of phosphorus stayed relatively the same, allowing us to infer that nearly all environmental changes related to the loss of marine plant life in the polluted sites were caused due to an increase in nitrogen specifically, and the relative abundance of inorganic nutrients in the water column did not vary between the two sites (Reynolds et al., 2015). Every variable not related to nitrogen loading between the two sites remains virtually constant. Furthermore, the harbor itself is fairly enclosed (only being connected to the Bay via a single 3m deep inlet) (Hayn et al,. 2014), and the site is rarely affected by extreme weather or ocean currents due to being sheltered by its location (the Harbor is protected by both the Cape and the Bay). Because of these key factors, West Falmouth Harbor’s location provides an ideal situation to study to what extent the effect that the loss of seagrass has on the density of its residual infauna and epifauna populations, as well as which type of fauna is put more at risk from the effects of nitrogen loading.

Figure 1: Overhead map of West Falmouth Harbor, marking both subdivisions of the harbor being studied. Outer Harbor is represented by the larger area outlined in red which is connected to the rest of the Bay via a small inlet, While Snug Harbor is represented by the smaller area outlined in red closer to the more populated area surrounding the harbor. The Wastewater treatment plant responsible for the pollution of Snug Harbor is situated just onshore, close to the Snug Harbor area (McLenaghan et al., 2009).
Materials and Methods
In order to collect the data needed to draw an accurate conclusion, our team needed to take samples from both the heavily polluted Snug Harbor and the relatively clean Outer Harbor; this allows us to compare and contrast the populations of different species of Infauna and Epifauna that are present in each site. To accomplish this, our team made weekly site visits to both Snug Harbor and Outer Harbor, in order to make sure that we obtained a substantial enough amount of data to be able to draw conclusions. Site visits involved collecting samples both from directly in the water, as well as from a small boat throughout the Harbor. For infaunal data collection, two sites from both Outer Harbor and
inner harbor were used for sediment sampling. The two sites located in the Outer Harbor region (represented by the larger region outlined in red) (Fig 1) were site 217, a vegetated site located at 41°36.387 N, 70°38.941 W and an unvegetated site in Outer Harbor located at 41°36.464 N, 70°38.962 W. The two sites located in the Snug Harbor region (represented by the smaller region outlined in red) (Fig 1) were two unvegetated sites, located at 41°36.387 N, 70°38.941 W, and 41°36.402 N, 70°38.408 W. For epifaunal data collection, Grabs 2A, 3A, and 4A made up our Outer Harbor data set. Sites 2A and 3A represented vegetated Outer Harbor sites, being located within close proximity of each other at 41°36.463 N, 70°38.945 W. Site 4A represented the frequently sampled Outer Harbor site named Site 211, located at 41°36.409 N, 70°38.928 W. Snug Harbor epifaunal sites are represented by sites 1A, 1B, and 1C. All three of these sites were non vegetated due to the nitrogen loading in Snug Harbor, and were located within close proximity to each other at 41°36.402 N, 70°38.408 W.
In order to make sure that our data collection yielded accurate amounts of both Infauna and Epifauna for each site, we used two different methods of data collection for the Infauna and Epifauna, respectively. Infauna samples were collected via 10cm wide 20cm long sediment cores, which are cylindrical plastic tubes with stoppers, designed to collect sediment samples stretching 20cm down into the sediment in Snug Harbor and Outer Harbor (Olsen et al,. 2013). In order to collect these samples, a member of our team would snorkel at either Snug Harbor sampling sites or Outer Harbor sampling sites, and manually collect the sediment samples. Cores were collected from predetermined sampling locations throughout Snug Harbor and Outer Harbor in order to maintain consistency across replicates. In total, 6 sediment core
replicates were taken from Snug Harbor and Outer Harbor across the various sampling sites, with the sandier samples coming from the Outer Harbor Sites while the muddier samples came from the Snug Harbor sites. Sediment samples were taken to the lab and analyzed within 5 days of collection. Samples were refrigerated when not being analyzed. Each sediment core was drained of water, and sieved through a 250 micrometer sieve with seawater to break up the sediment. Any Infauna found were collected, classified, and stored in jars representative of their classification to be counted at a later date. Infauna that could not be classified by the naked eye were run under a microscope in order to determine their taxa. Each replica would have a separate jar for each separate taxa found in the replica. Fauna were not mixed between replicates in case of outliers. Jars that were used to store uncounted infaunal samples were refrigerated when not in use to prevent decay of samples.
Epifauna samples were collected using an Epifauna grab, a manually operated contraption designed to collect any seagrass, algae, or organisms that are laying on the surface of the sediment (Olsen et al,. 2013). In contrast to methods used to collect samples of infaunal organisms, the Epifauna grab was operated directly from the boat, without snorkelers in the water. This was done to prevent anyone or anything from potentially stirring up the surface of the sediment we were sampling, which could have disrupted our data and led to anomalies or outliers. Similarly to the Infauna collection methods, Epifauna samples were taken from predetermined sampling locations throughout Snug Harbor and Outer Harbor in order to maintain consistency across replicates. In total, 3 surface grab replicates each were taken from Snug Harbor and Outer Harbor across the various sampling sites. Replicates were stored in water-tight Ziploc bags, returned to the lab and analyzed within 5 days of collection. Samples were refrigerated
when not being analyzed. Each epifauna core was drained of water, and then separated into seagrass, algae, detritus, and organisms, all three of which being stored separately. In order to create a baseline to confirm our assumption that there was a significantly less amount of seagrass present in Snug Harbor that Outer Harbor, all seagrass, algae, and detritus collected through the epifauna grabs were weighed for a wet weight, dried in an oven, and then weighed for a dry weight in order to determine total seagrass, algae, and detritus biomass. Each replicate was weighed separately. Any Epifaunal organisms that were found were collected, classified into given taxa, and stored in jars representative of their classification to be counted at a later date. Epifauna that could not be classified by the naked eye were run under a microscope in order to determine their taxa. Each replica would have a separate jar for each separate taxa found in the replica. Fauna were not mixed between replicates in case of outliers. Jars that were used to store uncounted epifaunal samples were refrigerated when not in use to prevent decay of samples.
In total, 12 Infauna replicates and 6 Epifauna replicates were collected, with 9 total replicates from the Snug Harbor data sites and 9 total replicates from the Outer Harbor data sites. All replicates were carefully analyzed, all Infaunal and Epifaunal organisms were classified and averaged, and all seagrass, algae, and detritus was weighed (both wet and dry) and averaged, in order to create our complete data set.
Results
In all, 9 unique taxa were collected and analyzed across the two sites, including amphipods, isopods, crabs, shrimp, bivalves, polychaetes, nemerteans, brittle stars (represented as “other” in the following figures, as they were not one of the main taxa being analyzed), and gastropods. Roughly the same species were found
through both infaunal and epifaunal sampling, allowing for an easy comparison between the infaunal and epifaunal life of Outer and Snug Harbor.
For the total population of infaunal organisms in Outer Harbor, the largest contributors to the total organism population are gastropods, polychaetes, and bivalves, making up 55.0%, 15.9%, and 13.8%, respectively (Fig 2). The remaining percentage of the population is composed of amphipods, crabs, shrimp, and nemerteans, making up 10.8%, 2.2%, 1.4%, and 0.7% of the total population, respectively (Fig 2). For the total population of infaunal organisms in Snug Harbor, the largest contributors are amphipods, gastropods, and polychaetes, making up 35.8%, 25.6%, and 16.3%, respectively (Fig 2). The remaining percentage of the population is composed of bivalves and nemerteans, making up 14.0% and 9.3% of the total population, respectively.

Figure 2, Relative contribution to the general population of Infaunal taxa found in the seagrass ecosystems throughout West Falmouth Harbor, split into the relative contribution to the total Outer Harbor population (left) and the total Snug Harbor population (right). All species found throughout sampling are represented, even if not directly present on graph (representing a relative contribution of zero)
For epifaunal organisms in Outer Harbor, the largest contributors to the total population is the gastropod population, making up 94.0% of the total epifaunal organisms found (Fig 2). Other contributors to the Outer Harbor epifaunal population include crabs, shrimp, amphipods, polychaetes, and brittle stars (represented as “other” in Figure 3), making up 3.0%, 1.8%, 0.9%, 0.6%, and 0.6% of the total population, respectively (Fig 3). For the population of epifaunal organisms found in Snug Harbor, the largest contributors to the total population are bivalves and gastropods, making up 46.1% and 38.5% of the total population, respectively. Other contributors include shrimp and nemerteans, each accounting for 7.7% of the total population.
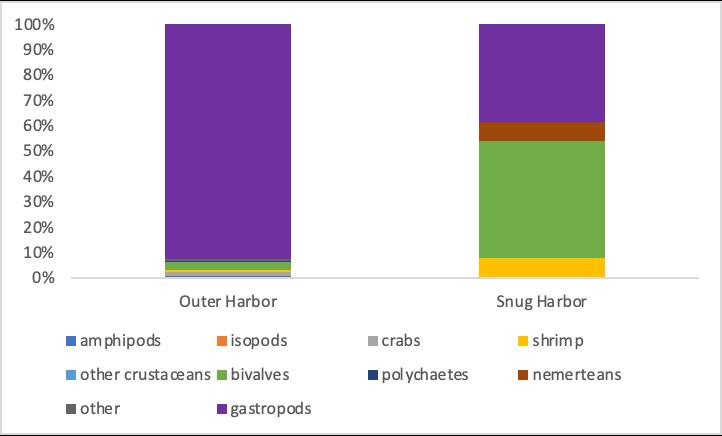
Figure 3, Relative contribution to the general population of Epifaunal taxa found in the seagrass ecosystems throughout West Falmouth Harbor, split into the relative contribution to the total Outer Harbor population (left) and the total Snug Harbor population (right). All species found throughout sampling are represented, even if not directly present on graph (representing a relative contribution of zero)
Through our data analysis, there was a significant difference in the populations of most infaunal and epifaunal taxa between the unpolluted Outer harbor and the nitrogen-loaded Snug harbor. For the various populations of infaunal taxa across Outer and Snug Harbor, the population of nemerteans was the only one with a greater area per ! 2 across the two sites (Fig 4). In the case of every other taxa studied (with the exception of the amphipod population being consistent across both sites (Fig 4)), all experience a significantly larger population average per ! 2 in the unpolluted areas. The average population per ! 2 of gastropods, bivalves, and polychaetes were 6.9, 3.2, and 3.1 times as large in the unpolluted sites compared to the polluted sites (Fig 4), while both crabs and shrimp were only found in the unpolluted areas (Fig 4).

Fig 4: Infauna Average Counts by Location in West Falmouth Harbor per " 2 , with the bars in blue representing infaunal counts from sampling sites in Outer harbor and the bars in orange representing infaunal counts from sampling sites in Snug harbor. Gastropod Counts for Infaunal averages for both Outer and Snug Harbor are represented using the scale set on the right horizontal axis, while all other infaunal taxa are represented using the scale set on the left horizontal axis. Error bars represent standard deviations across the three sampling sites.
For epifaunal life, the difference in populations across the two sites remains prevalent. For every single epifaunal taxa found in the two sites except for nemerteans, which had a higher population count in Snug Harbor relative to outer Harbor (Fig 5), the average population per ! 2 was significantly higher in Outer Harbor compared to Snug Harbor.The average population per ! 2 of gastropods, shrimp, and bivalves were 62.4, 3.0, and 1.7 times as large in the unpolluted areas compared to those that are polluted (Fig 5). Furthermore, significant amphipod, crab, polychaetes, and brittle star (represented by the “other” category in Figure 5) populations were only found to be present in the unpolluted sampling sites (Fig 5).

Fig 5: Epifauna Average Counts by Location in West Falmouth Harbor per " 2 , with the bars in blue representing Epifaunal counts from sampling sites in Outer harbor and the bars in orange representing Epifaunal counts from sampling sites in Snug harbor. Gastropod Counts for Epifaunal averages for both Outer and Snug Harbor are represented using the scale set on the right horizontal axis, while all other Epifaunal taxa are represented using the scale set on the left horizontal axis. Error bars represent standard deviations across the three sampling sites.
Finally, confirming both the previous data from 2008-2009 as well as our own observations, a count of the relative algal and seagrass biomass for Outer Harbor as well as Snug Harbor illustrated a higher count of both algal and seagrass life present in the unpolluted Outer Harbor compared to the polluted Snug Harbor. The average algal biomass per ! 2 is 1.3 times as high in Outer Harbor compared to Snug Harbor (Fig 6), and the average seagrass biomass per ! 2 was vastly higher in Outer Harbor than Snug Harbor, with the average seagrass biomass per ! 2 in Snug Harbor being approximately equal to 0 (Fig 6) (McLenaghan et al,. 2009).

Figure 6: Average counts of algae and seagrass biomass per " 2 by location in West Falmouth Harbor. White the blue bars representing the average counts of algae and seagrass biomass recorded in Outer Harbor, and with the orange bars representing the average counts of algae and seagrass biomass recorded in Snug Harbor.
Discussion
The data collected across the two-month long data collection period for our study illustrates both significantly larger populations of organisms as well as a larger species diversity per ! 2 being found in Outer Harbor as opposed to Snug Harbor. These patterns remain consistent throughout both infaunal and epifaunal data, with the only expectation to this pattern being the nemertean population across the two sites. Seagrass biomass also remained consistent with our understanding of the sites, with a larger total seagrass and algal biomass per ! 2 found throughout Outer Harbor compared to the total seagrass and algal biomass per ! 2 found in Snug Harbor. Overall, our results were consistent with our predictions prior to our data collection and analysis.
Previous studies conducted in these regions of West Falmouth Harbor found a difference in percent contribution of taxa in the two sites. In a report conducted in 2006, mollusks (the taxa to which gastropods belong) were found to make up just 7% of vegetated life, and 25% of non vegetated life, with polychaetes holding a significantly larger percent contribution to the population of total organisms than reported in our results, holding 43% for the vegetated sites and 29.6% for the non vegetated sites (McLenaghan et al., 2009). Peracarida (consisting mainly of amphipods and isopods) also held a significantly higher percent contribution to the total population of organisms than was reported in our study, accounting for 47.4% of the vegetated population and 36.8% of the non vegetated population across the two sites (McLenaghan et al., 2009).
Despite the difference in diversity index between previous studies and our own data collection, our data still supports general trends found in previous studies between life in the polluted sites
compared to the unpolluted sites. In a study conducted in 2009–while the waste treatment plant that was the dominant cause of nitrogen loading in Snug Harbor was still active–data collection and analysis found twice the amount of species diversity in Outer Harbor compared to Snug Harbor, consistent with our findings of greater species diversity in the vegetated regions of Outer Harbor (McLenaghan et al., 2009). These results were obtained through a similar method process to our own, with samples being collected via snorkelers and scuba divers, using the same core size as our own (20cm by 10cm), and temperatures taken during data collection were similar in number to the temperatures recorded in recent studies, including our own (McLenaghan et al., 2009).
Overall, despite varying diversity indexes from previous data collection and analysis, general trends found in our data collection remained consistent with those found in studies collected with the same methods at the same site 15 years ago. While general trends remain the same, future studies investigating the difference in infaunal and epifaunal populations in Snug Harbor over time will allow us to determine whether the ecosystem is healing from the damage caused by nitrogen loading, as the wastewater treatment plant responsible for the majority of the nitrogen loading occurring in Snug Harbor was shut down in 2014 and has remained inactive since (Reynolds et al,. 2015). Such a study would provide an effective measurement of the ability of seagrass ecosystems to recover from such byproducts of climate change, and allow us to further understand the methods and policies that must be put in place to protect and rehabilitate these crucial ecosystems.
Conclusion
Nitrogen loading in seagrass ecosystems present in shallow estuaries causes a significant decline in many species of infaunal and epifaunal primary consumers. As outlined above, the field surveys in West Falmouth Harbor were designed to answer the following question.
(1) To what extent are the populations of infaunal and epifaunal primary consumers in nitrogen loaded areas affected as compared to the populations of those present in the non-polluted region of the harbor.
Our data collection and analysis revealed a significant decrease in most taxa present in the polluted Snug Harbor sampling sites as compared to the unpolluted Outer Harbor sampling sites. In many cases, our results found that some species in the polluted sites had become virtually unfindable, yet the same species were thriving in relative abundance mere hundreds of meters away. And while there were a select number of species that reported similar population numbers throughout both the polluted and non-polluted sites, these were species (mainly nemerteans) that tended to rely less on the seagrass for protection or for a food source (Howarth et al,. 2014).
Overall, the trends found throughout our data illustrate an alarming truth about the devastation that nitrogen loading can have on local ecosystems. And while runoff, sewage, and polluted waste is no longer being dumped into West Falmouth Harbor at the same rate that it once was, many other estuaries throughout the world are still under threat from the dangers of too much nitrogen being loaded into fragile local ecosystems. Because of the threat that many primary consumers are also under, nitrogen loading poses a
legitimate threat to multiple, if not all trophic levels on many shallow water ecosystems. It is imperative that we engage in further research dedicated to mitigating these impacts, and eventually put in place effective measures to prevent nitrogen loading from forever lowering the diversity of species present in the shallow regions of our oceans.
Acknowledgement: I am grateful for the assistance and supervision of Dr. Mirta Teichberg and Sarah Merolla. All data analysis was conducted in Dr. Teichberg’s Lab at the Starr Ecosystems Center at the Marine Biological Laboratory in Woods Hole, Massachusetts.
References:
Reynolds, L. K., Marino, R., Muth, M. F., McLenaghan, N., Hayn, M., Tyler, A. C., ... & Howarth, R. W. (2015). Evidence of grazer control on nitrogen fixation by eelgrass epiphytes in a temperate coastal bay. Marine Ecology Progress Series, 526, 11-19.
Duncan, T. (2007). Seasonal & Spatial Fluctuations in Benthic Infaunal Community Structure in West Falmouth Harbor, Massachusetts. Unpublished report, Marine Biological Laboratory.
McLenaghan, N. A. (2009). Benthic macroinvertebrate diversity in a shallow estuary: controls on nutrient and algal dynamics. Rochester Institute of Technology.
Olsen, Y. S., Fox, S. E., Hofmann, L., & Valiela, I. (2013). Benthic community composition and faunal stable isotopic signatures differ across small spatial scales in a temperate estuary. Marine environmental research, 86, 12-20.
Goering, J. J., & Parker, P. L. (1972). NITROGEN FIXATION BY EPIPHYTES ON SEA GRASSES 1. Limnology and Oceanography, 17(2), 320-323.
Ashikin, C. N., Rozaimi, M., Arina, N., Fairoz, M., & Hidayah, N. (2020). Nitrogen dynamics within an estuarine seagrass meadow under heavy anthropogenic influence. Marine Pollution Bulletin, 150, 110628.
Hayn, M., Howarth, R., Marino, R., Ganju, N., Berg, P., Foreman, K. H., ... & McGlathery, K. (2014). Exchange of nitrogen and phosphorus between a shallow lagoon and coastal waters. Estuaries and coasts, 37, 63-73.
Howarth, R. W., Hayn, M., Marino, R. M., Ganju, N., Foreman, K., McGlathery, K., ... & Walker, J. D. (2014). Metabolism
of a nitrogen-enriched coastal marine lagoon during the summertime. Biogeochemistry, 118, 1-20.
Howarth, R. W. (2008). Coastal nitrogen pollution: a review of sources and trends globally and regionally. Harmful algae, 8(1), 14-20.
Driscoll, C. T., Whitall, D., Aber, J., Boyer, E., Castro, M., Cronan, C., ... & Ollinger, S. (2003). Nitrogen pollution in the northeastern United States: sources, effects, and management options. BioScience, 53(4), 357-374.