Rose Cairo
Senior Thesis | 2025


Senior Thesis | 2025
Rose Cairo
Abstract
A main project of the MIT Sea Grant lab is their Sea Perch program, which consists of DIY robots made so that middle and high school students can create them using common materials that are relatively inexpensive. The robots are used to help the student understand the basics of how some aspects of engineering work. Since this project was initially created in the 1990s, there has been a push to bring the Sea Perches into the 21st century. This was done by adding new “modules” that make the robot more intricate and give it the ability to do more tasks, for example adding whiskers based on seals to alarm when the robot hits something, or grippers made of silicone to grab items in the water. Since the Sea Perch is an educational tool, the leaders continuously reach out to different teachers and ask what they want to see next. A big common addition many educators wanted was water quality sensors, so the students could learn about water quality and how it is changing with climate change. Meeting with CBI (Cambridge Boating Institute), led to the discovery of people who were testing the Charles daily for months of the year, and beyond that, discovered they wanted to test more, as the water quality is prominent and important to sailors. Wiring, testing, and creating a tethered robot with motors and sensors that tested turbidity, depth, and temperature, were the important parts of the plan to use this machine to test the Charles river and get more information on how it changes day to day. This information not only is good in general to see the changes in the river, but could also help give necessary information on when it is safe to go out on the water.
The MIT Sea Perch program was started in the 1990s by the MIT Sea Grant Lab as a program to bring engineering concepts to middle and high school students to learn the basics of the field. It was used to demonstrate different parts of engineering and for students to get a hands-on understanding of such topics. Students are given instructions for this DIY robot and then can use the materials list of inexpensive and easily accessible materials (e.g. PVC pipe and balloons) to create their robot. The Sea Perch was very successful, and it became a national competition with many schools participating in this event. RoboNation picked up the Sea Perch and created a national competition for different schools to build individual robots and compete in challenges. While this event was very successful, the MIT Sea Grant lab wanted to bring the competition into the 21st century by modifying and adding to the instructions and the robots. This new project was called the Sea Perch II, and is not yet used for competitions but can be built in the classroom by students, focusing on the education part of the competition. Sea Perch IIs are also brought to the competitions to demonstrate the new modules. By doing this, students could get more out of the experience and learn more from the robots. The focus for the improvements are heavily based on the teacher and educator feedback, and what they want to see more of to teach their students. Some examples of the modules that were added recently include silicone grippers for students to be able to use hydraulics to grab items underwater. Another new module is the “whiskers”, created with Q-tips, silicone, and conductive grease for students to learn about interruptions to normally closed circuits. These whiskers were based on real seal whiskers and use similar principles, another area where a student can learn more about the world around them. This is an example of how the MIT Sea Grant lab uses the world and concepts that are easy to understand for the greatest benefits to the students using this program. The MIT Sea
Grant lab continues to find ways to improve the Sea Perch II by adding new modules and continuing to ask for feedback on how to better themselves. (Sea Perch II, 2024)
A main point of improvement or addition for the Sea Perch that kept coming up was water quality testing, specifically pH. As programs were using these robots in bodies of water near them, they wanted to be able to see how the water quality is changing, what is affecting it, and what they can do to improve the quality. This all starts with the testing of the water, and the Sea Perch is a great vessel to do this. Not only can the pH be tested, but other aspects of the water quality to get a greater understanding of what is happening in the water.
The body of water that was focused on specifically is the Charles River. This is close to MIT and has been known to be highly polluted and dangerous to swim in. It is also the main body of water in the Boston area, leads into the Atlantic ocean, and houses many recreational activities, such as rowing, sailing, and tourist attractions such as dragon boating and kayaking. In the 1960s, the river was incredibly polluted. It had large debris and a terrible smell, affecting the lives of Bostonians, especially ones who used or lived near the river. Today, there is still a ban on swimming, but there has been 500 million dollars contributed to the cleaning and it is much cleaner than it was (Harvard Gazette, 2010). On September 20, 2024, a health advisory was issued by the mayor of Massachusetts, Michelle Wu, which blocked the use of the river because of the harmful “blue-green algae”, as they call it, though it is named cyanobacteria and is not an algae but a phytoplankton. In the notice from the mayor, there is emphasis and mention on the negative effects of the blue green algae. The blue green algae comes and goes in waves, but in this particular circumstance they list the different symptoms, such as eye irritation, vomiting, diarrhea, and also there is mention of the effects on animals. Not only do the symptoms of the blue green algae affect humans, it also impacts animals, spanning from pets to
wild animals and could cause death (Health Advisory, 2024). Cyanobacteria is harmful not only directly with contact with humans or animals, it can also get transferred through animals in the water, then by humans eating the contaminated food. The pollutants come in many different forms, from human waste being brought in from runoff to harmful algal blooms.
Algal blooms occur with excess runoff from different sources. Two main sources are waste water and fertilizer runoff. Both of these contain high amounts of phosphorus and nitrate. As storms get larger and when it storms in general, a large quantity of water gets flushed into drain pipes, more than they can handle. The excess water spills over and flows into bodies of water that they are close to. Some of this runoff just comes from the rain washing away some of the fertilizer and also bringing it towards and into the bodies of water. The quantity of fertilizer and waste also continues to grow with a larger population of people, causing more overflow. Nitrate and phosphorus are used by some algae to grow, and are needed to do so. These nutrients are the limiting nutrients in the reaction of photosynthesis, and when there is a large amount of these nutrients it no longer limits the reaction, which creates the algal blooms. These algal blooms are dangerous, as they release toxins that are not only harmful to humans but also to animals who come into contact with the water. Since nitrate and phosphorus are the limiting nutrients in this reaction, when the excess of these nutrients enter the body of water, this mass production of the algae creates the algal bloom that could be harmful (US EPA).
There are different reasons these algal blooms are harmful. Some of the algal blooms create what is known as a dead zone. These dead zones take up a large amount of oxygen in these reactions. They also cover the sunlight for anything under the bloom, not allowing other life to get the sun they need to survive. Algal blooms can also be harmful because some of them release toxins and chemicals that are dangerous to both humans and animals alike. There has been an increase in harmful algal blooms
in the past 50 years, but it is unsure if this is because of the more attention that is being paid to this in the water, or if it is extra nutrients, coming from the runoff and human pollutants. There is currently some water quality testing going on by the United States Environmental Protection Agency (US EPA). This organization has a buoy located outside of the Museum of Science which tracks temperature, dissolved oxygen, pH, specific conductance, turbidity, chlorophyll, and phycocyanin every 15 minutes. The buoy is one meter below the surface of the Charles, and this tracks for cyanobacteria and other harmful blooms (US EPA). Although this is a good way of tracking water quality in the Charles, it is in a set location and depth, which limits the information that can be collected by this specific buoy. It is also known to not be updated as frequently as stated and delayed in its reports, leading to false information on when it is safe to go into the water.
One main partner in this water quality project is the Community Boating Institute (CBI) in Cambridge. CBI has been using Sea Perch in their youth program, and have also been testing the water quality of the Charles river. Specifically, they are testing pH, nitrogen, and are looking for a harmful bacteria, cyanobacteria, also known as blue green algae. Cyanobacteria grows very quickly in what are called blooms, and can be very dangerous as they contain neurotoxins (Moulin et al., 2024). While CBI is doing this testing, they do not access to the same materials MIT does, and uses simple and effective ways of testing the Charles, but they wish to test more extensively. To test, they use a clear PVC pipe and dip it into the water to collect a sample, then use materials in the lab to test the water every day. They also use test strips, which are dipped into the water and give the range of different aspects of the water. While this is effective and does give information on the Charles river and how it is changing day to day but also the trajectory through the year. Because this relates greatly to the highly requested water quality testing for the Sea Perch II
robot at MIT, MIT took suggestions from CBI about what sensors to use in a new water quality testing modified Sea Perch II that can be used by both CBI and educational institutions.
Many sensors were tested before the sensors chosen were decided as the best for education and data collection. The goal of the sensors was the get the best data collection with a broad variety of sensors to see how the different aspects of water quality change and to get the fullest picture of the water that was being tested, both for education of the many variables in the water, and to also understand the relationship in the different variables and to get the best information possible.
The first sensor that was tried was the pH sensor. PH is the acidity of a substance on a scale of 0 to 14, with 0 being extremely acidic and 14 being extremely basic. Stomach acid would be very low on the scale, bleach would be very basic, and a neutral substance, such as drinking water, is approximately 7 on the pH scale. The scale is logarithmic, so even a change of 0.1 is a tenfold increase or decrease. Acidification of water happens when excess CO2 is in the atmosphere, and this gets absorbed by the ocean and creates more hydrogen ions, causing the pH to lower and the acidity to get higher. The higher acidity changes the environment for some of the animals and plants, changing the entire ecosystem. (NOAA). The pH sensor was coded and tested and was successful, and once it was tried it was decided against it to use the sensor. The margin of error on this sensor was quite large, as it was portable and not too expensive, so it could be used for testing and in classrooms. The margin of error was 0.1, which is approximately the amount the ocean is changing. For this reason, the pH sensor was not used in the final version of the water quality sensor robot.
In the final product, there were four sensors used. These sensors were chosen because they were fairly accurate, easily accessible, and were not too expensive. A main goal of the Sea Perch II and the water quality testing robot is for students of all kinds to be educated and have a hands-on project that they can work on with a level of independence. Designing the robot using materials that are easily accessible and easily put together makes this possible. The four sensors on the final product were a depth, pressure, and temperature sensor, a turbidity sensor, a conductivity/salinity sensor, and an ORP sensor.
The first sensor used was a depth, pressure, and temperature sensor. This sensor is not waterproof, and this was a cause for concern, and there needed to be a way for it to go underwater. The solution was a balloon and electrician’s putty, which kept the sensor dry while also still allowing it to function. This sensor used hydrostatic pressure to measure the pressure and change that to depth, and also it uses the air in the balloon to measure the temperature. As the balloon and the sensor get lower and lower, the air in the slightly inflated balloon gets compressed and the sensor uses this pressure to tell how deep in the water it is. The water around the balloon changes the temperature of the air inside the balloon, allowing the sensor to detect the temperature of the surrounding water. This sensor was already part of one of the Sea Perch II modules, and therefore could easily be transferred to this project as well (Sea Perch II, 2024). Having the depth, pressure and temperature of the water you are testing is very helpful, as it allows for a better understanding of the location of the sample of water you are taking and the data that is being collected. Depth and temperature also might change the data that is being seen, as deep and shallow water have different properties.
The next sensor that was used on the water quality testing Sea Perch was a turbidity sensor. Turbidity is the murkiness in the water, and indicates how many particles are floating in the water. The turbidity sensor uses two electrodes to measure the particles.
The particles refract light in between the electrodes, and this refraction shows how many particles are between the two prongs of the sensor (DFRobot, 2024). This sensor was also not waterproofed, like the depth sensor. This posed another problem, but the solution was similar to the other waterproofing. Instead of putting the whole water sensor into the waterproof box, because there is not enough room for all the sensors, the screw holders were cut in the case of the turbidity sensor so it could fit in an old film canister. The bottom of the film canister was cut out and the sensor was fit in with a rubber o-ring, to keep the water out on that side. The film canister had a lot of empty space and therefore air. This makes the canister float, and does not allow the Sea Perch to measure turbidity at depth. To solve this problem, washers were strung through the wire of the sensor, and put them in the canister before sealing the top. To keep the water out of the top, where the wire is strung through the cap of the canister, electrician’s putty was placed and covered the connector of the wires and the cap. This made the canister and the turbidity sensor waterproof. Turbidity is important for measuring and for water quality because it tells us a lot about the water and the life around it. These particles come in many different forms, including waste and pollution. Turbidity can also tell you how much upwelling there is in a certain spot. Upwelling is when the current brings nutrients and dirt up from the bottom of a body of water to the top. Turbidity can help understand the ecosystem of a certain point, and can be used to see the difference in depths of a certain point as well.
The next sensor that was used in the final product was the conductivity/salinity sensor. The conductivity sensor is a wand that uses volts as a unit of measurement. Conductivity is a very important factor in water and life in the water. Conductivity is directly related to salinity. Salinity is the amount of salt in the water. Salinity greatly affects the habitat of many different animals. Salinity gets affected by runoff or waste, as salt gets pulled from the soil and moved into the water, the salinity rises,
changing the living environment of the plants and animals (DFRobot, 2024).
The ORP sensor is the final sensor that was on the final version of the water quality sea perch. This was also the latest edition. ORP is an acronym for Oxidation-Reduction Potential. This is the ability for a Redox reaction to happen in the water. A redox reaction is short for an oxidation-reduction reaction, which has two parts: oxidation and reduction. These two processes are both movements of electrons. The reduction part of the reaction is the gaining of electrons, while the other part, oxidation, is the loss of electrons (Module 2: Redox Reactions, 2024). Redox reactions are used in a lot of life in the water, and it is a big indicator of the health of the water. The ORP is similar to pH, but instead of being measured on a logarithmic scale, it is a linear scale. It is measured in both positive and negative scale, with negative is more of a reduction and positive is more of an oxidation. The higher the absolute value of the number is, the stronger the potential is (DFRobot, 2024).
These sensors are very important individually, but together they give a very good picture of the water that is being tested. The salinity of the water changes at different depths. The saltier the water, the more dense it is. This causes the water to sink deeper down than the water is less salty. This relates to the temperature of the water as well. The colder the water is, the deeper it sinks, as heat rises and the hot water would also therefore rise. These both are very important to bodies of water, and specifically circulation in the ocean. Water circulates in the ocean, with points where the water sinks down because of an increase in salinity and decrease in temperature. This is another example beyond the Charles where collecting this data can be beneficial to understand the broader picture of the body of water. The turbidity relates as well to the temperature and depth and salinity because there are more particles the closer you are to the ORP also is very important and gives information about how well the water can conduct reactions.
Designing the box itself was a challenge as well. Looking at different box models that first took a sample of the water helped with the discussion and planning for the Sear Pech model of the water testing. Having a testing box or machine that stayed on land was one of the models, but this ended up being different from the desired product. The Sea Perch model with a sensing box that goes to the specific area where testing was wanted is a more plausible and helpful design for the Sea Perch. This allows the use of sensors like depth, and allows more accurate real time readings. The sensing box on land was used mostly for food production such as rice, and was used to test the water that the plants were watered by. This is very useful for food and quality testing in that manner, but the body of water itself and the health of it is the main focus of this specific project. Many different types of boxes were tried for the water quality testing Sea Perch, and the sensors and wires were layed out in the beginning to get an idea of spacing (See Figure 1). In previous attempts of making different versions of sea perches, including the battery powered sea perch, the control box has been very important, and the most important thing was the waterproofing. To have the electronics in the box, and the equipment stemming out of the box, there needed to be holes drilled into the sides, compromising the waterproofing of the box. To solve this problem, cable glands were a simple solution, which screw into the box and close around the cables, along with the electrician's putty, which does a very good job as a supplement to the water proofing. There was also a glue that is used to waterproof, thoroughly securing the wires inside.
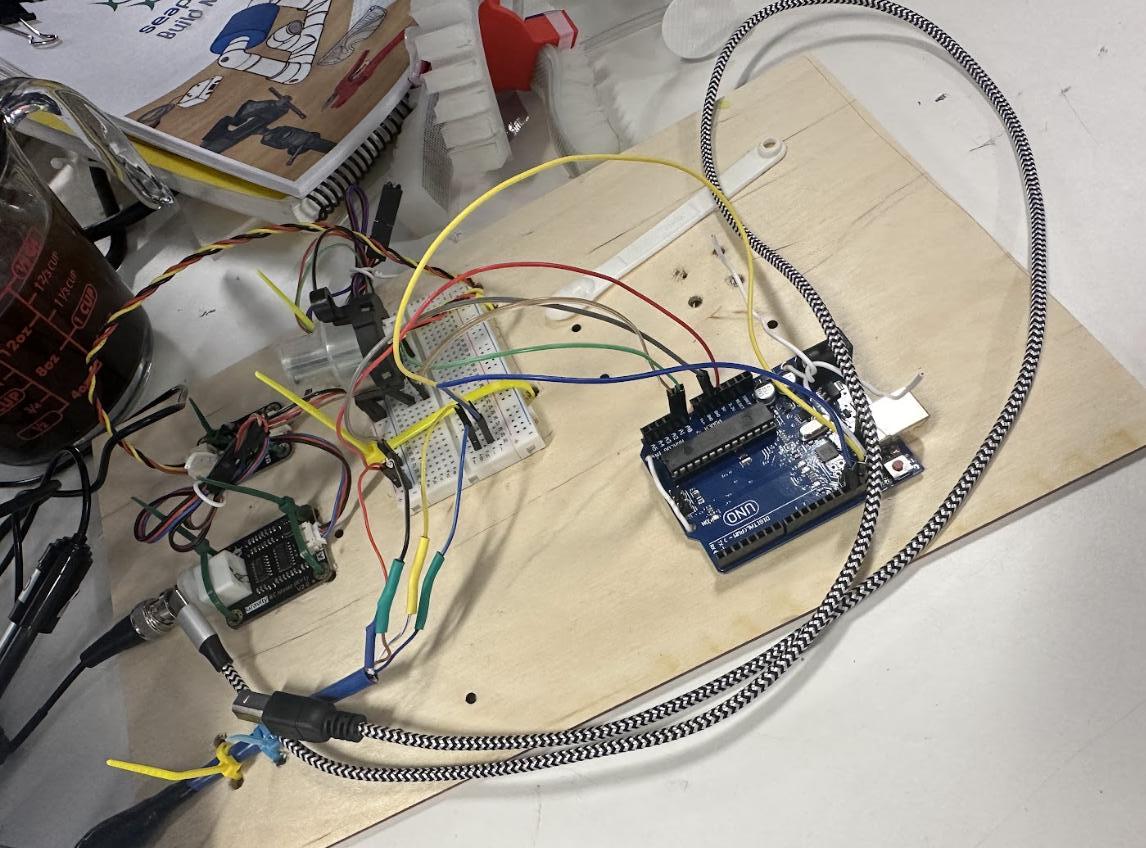
Figure 1. Initial wiring of the water quality testing Sea Perch.
To counterbalance the air inside the box, the Sea Perch, any verison, needed counterweights, another aspect that needed to be taken into account. Weights are easily attached to the PVC outside of the water tester with zip ties. The PVC outside, an integral part of the original sea perch, was at first disregarded for this type of the robot, as the goal was to make it as simple as possible. As consideration of the vulnerability of the sensors to the different variables and water conditions, including current, rocks or other unseen objects, the PVC pipe outline became an important part of the design once again. Motors, another part of the sea perch, were at first put on the water tester. The control over the machine given by motors is a big part of the appeal to students and engages them through the process of building and learning and after, during troubleshooting. In the end, the worry with motors was it could change the environment of the water, and furthermore could distract from the main purpose of this part of the Sea Perch, which is understanding and testing the water and observing change as a small section of the effect that climate change has on the water.
Once the final water quality testing box was completed and tested, there are next steps that could be taken. Using the water quality testing Sea Perch to test water in the Charles is the next step and collecting data from different sections of the river. Different sections of the Charles River are affected in different ways by pollution and runoff. For example, the Basin, a section of the Charles River right in the city of Boston, gets a lot of foot traffic on the sides, plus many tourists and sports teams such as rowers or sailors. This will most likely get more pollutants and trash than a small branch of the Chalres in a smaller town that gets less people. Quantifying these differences through data is important to show how different parts are changing and which sections of the river, or more broadly, any body of water, allows us to focus more on the problem sites and see what the water is being polluted by. If there are more changes in data and more pollutants in a certain section, more data can be found on what the pollutants are and sequentially the source can be found. Efforts around cleaning the water and improving the quality can then be focused more on those sections, being more accurate and effective in the improving of the quality of the Charles. The Sea Perch is very useful because it is relatively easy to use and is very portable, so can be used in many different places, plus it is easy and inexpensive to recreate, so there can be multiple uses at the same time. This is also very important for education and for students to see the impact of pollution and climate change. Overall, testing and awareness of water will help manage the increase of solutions and induce change in people who are more aware of the problem and how to solve it specifically. Harmful algal blooms are not the only problem that is human caused and is increasing as time moves forward. There are many other anthropological actions that are speeding up the warming of the planet, leading to less ice and habitats for ice dwelling
creatures, and rising sea level. Human waste and trash create problems for the environment, animals, and humans themselves. There are garbage patches in the ocean and plastics and microplastics are harmful to fish and animals, causing entanglement and disease, leading to death. In rivers, human waste and runoff, from agriculture, fertilizer, or day to day leads to unsafe drinking water and living environments. Testing and understanding how the human population affects the environment allows more movement towards change and a feasible understanding, which allows smaller steps towards a bigger change. This testing of the Charles and having an educational aspect allows more awareness. The next steps in this project is using the robot to test different areas of the Chalres and releasing a guide for building the machine.
SeaPerch II - MIT Sea Grant. (2024, June 12). MIT Sea Grant.
https://seagrant.mit.edu/seaperch2/ Moulin, G. du, Garza, E., Quigley, C., Leutiger, A. L., Norton, D., & Zechel, C. (2024). Microscopic Technique as a STEM Initiative Promotes Environmental Stewardship at a Community Sailing Program. Journal of STEM Education: Innovations and Research, 25(1).
https://www.jstem.org/jstem/index.php/JSTEM/article/view /2669
US EPA, R. 01. (2015, February 13). Live Water Quality Data for the Lower Charles River. US EPA.
https://www.epa.gov/charlesriver/live-water-quality-datalower-charles-river
National Oceanic and Atmospheric Administration. (2020, April 1). Ocean Acidification. National Oceanic and Atmospheric Administration; U.S. Department of Commerce.
https://www.noaa.gov/education/resourcecollections/ocean-coasts/ocean-acidification
US EPA, R. 01. (2014, August 22). Environmental Challenges for the Charles River. US EPA.
https://www.epa.gov/charlesriver/environmentalchallenges-charles-river
Environmental Protection Agency. (2024, January 3). The Effects: Dead Zones and Harmful Algal Blooms . US EPA.
https://www.epa.gov/nutrientpollution/effects-dead-zonesand-harmful-algal-blooms
dfrobot.com. (2025). Dfrobot.com.
https://www.dfrobot.com/product1394.html?srsltid=AfmBOoq8GKkuE9rMau1j-P86ZXWSid9q-A0gXKDEs3Rao8AGeOAWFXH
dfrobot.com. (2025). Dfrobot.com.
https://www.dfrobot.com/product1123.html?srsltid=AfmBOorocpLWaOMIQNye6PkReR8S yxWLEqKBtq32H2VSuWmesrRgq6Ns
Module 2: REDOX Reactions | Center for Green Chemistry & Green Engineering at Yale. (n.d.). Greenchemistry.yale.edu.
https://greenchemistry.yale.edu/modrnumodules/physicochemical-properties-modules/module-2redox-reactions
HEALTH ADVISORY: CYANOBACTERIA ALGAE BLOOM IN THE CHARLES RIVER. (2024, September 21). Boston.gov.
https://www.boston.gov/news/health-advisorycyanobacteria-algae-bloom-charles-river harvardgazette. (2010, October 20). A river runs through it. Harvard Gazette.
https://news.harvard.edu/gazette/story/2010/10/down-bythe-banks-of-the-river-charles/