Lukas Patten
Senior Thesis | 2025

Name: Lukas Patten
Thesis Advisor: Ilija Dukovski
BUA Thesis Advisor: Srdjan Divac
Modeling the growth and Gene Knockouts of Saccharomyces cerevisiae with COMETS
Introduction
A substantial amount of research has been done on the nature of the budding yeast Saccharomyces Cerevisiae and its ecological importance. The yeast has been strongly influential in the course of human development because of its importance in the fermentation process for wine and beer.1 The yeast has a strong symbiotic relationship with several species of social wasps and insects, it has been shown to boost cuticular hydrocarbon content in Drosophila (fruit fly) and improve reproduction rate in the wasp species Vespa Crabro. 2 These species of social wasps also rely on S. cerevisiae as a fuel source in their guts during periods of food scarcity. Insects have been observed sharing yeast between members of the colony. This behavior in turn spreads the yeast and grows the population. In fact, demographic expansion of these species of social wasps during the grape ripening process coincides with the dispersal of the yeast. The wasps act as vectors of the yeast’s expansion, which in turn benefits the yeast.3 These insects (social wasps) are pollinators and have a significant impact on a wide variety of plants and their reproductive cycles via spreading pollen. However, they have also faced significant population decline.4 Causes of this severe
1 D Cavalieri, PE McGovern, DL Hartl, R Mortimer, M Polsinelli, “Evidence for S. cerevisiae fermentation in ancient wine.” J Mol Evol 57, S226–S232 (2003).
2 Stefanini, Irene. "Yeast‐insect associations: It takes guts."
3 Stefanini, I.; Dapporto, L.; Legras, J.-L.; Calabretta, A.; Di Paola, M.; De Filippo, C.; Viola, R.; Capretti, P.; Polsinelli, M.; Turillazzi, S.; et al. Role of social wasps in Saccharomyces cerevisiae ecology and evolution. Proc. Natl. Acad. Sci. USA 2012, 109, 13398–13403.
4Stefanini, Irene. "Yeast‐insect associations: It takes guts."
population decline for these insects range from human intervention to the spread of Varroa spp. a mite which originated in Asia and spread across the world infecting adult bees.5 Simulating the growth of S. cerevisiae accurately will make running experiments much more efficient. Researching the metabolic pathways affected when S. cerevisiae is in the gut and how that in turn influences the neurological state of the wasp can help researchers better understand the connection between the gut microbiome in humans and mental health or behavioral disorders.
The project consisted of three main forms of analysis: The first was digitally recreating the experimentally obtained pattern of growth for the yeast in COMETS. To do this, the yeast was put in a digital test tube with the same nutrient quantities from the experiment. The second was recreating a two-dimensional model of the wasp gut that could act as a digital petri dish for S. cerevisiae. The third was attempting to verify whether the computer genome-scale model of the S. cerevisiae had an accurate list of the essential genes and non-essential genes. Essential genes are genes that, if removed, cause the organism to fail to grow at all. Likewise nonessential genes, if removed, may decrease the growth rate or may have no effect at all. The first process involved was using an experimental dataset of essential and nonessential genes provided by Irene Stefanini’s research, followed by knocking out specific genes and measuring the growth of the yeast.
5 Stefanini, Irene. "Yeast‐insect associations: It takes guts." Yeast 35.4 (2018): 315-330.
Methods
Employing COMETS for Simulations
COMETS, launched in 2021, stands for Computations Of Microbial Ecosystems In Time And Space. The computational framework is designed to model the growth of microbes under various preset conditions. In the context of this research, COMETS allows for simulation of growth of S. cerevisiae with specific nutrient quantities in digitally recreated petri dish or test tube environments. COMETS incorporates a method of analysis called dynamic flux balance analysis (dFBA), which expands on traditional flux balance analysis (FBA). Traditional flux balance analysis utilizes genome-scale reconstruction of metabolic networks and models the growth with a steady state, meaning that initial environmental variables remain constant. 6 To predict a set of fluxes for a metabolic network, FBA calculates a solution that minimizes or maximizes an objective function which is in the form of a linear combination of flux variables.7 A metabolic flux is the amount of a metabolite that is processed per a given unit time. It describes the rate at which the metabolite is moving through pathways. dFBA expands on traditional flux balance analysis by incorporating time-varying environmental and population factors. Dynamic flux balance analysis utilizes an iterative framework to adjust these environmental and population-based parameters.8 This means that the relevant environmental conditions are constantly being adjusted. Therefore, dFBA can predict both population changes and ecological interactions
6O’Brien, E. J., Monk, J. M., and B. O. Palsson. “Using Genome-Scale Models to Predict Biological Capabilities.” Cell, vol. 161, no. 5, 2015, pp. 971–987.
7 Dukovski, I., Bajić, D., Chacón, J. M., Quintin, M., Vila, J. C. C., Sulheim, S., Pacheco, A. R., Bernstein, D. B., Riehl, W. J., Korolev, K. S., Sanchez, A., Harcombe, W. R., and D. Segrè. “A Metabolic Modeling Platform for the Computation of Microbial Ecosystems in Time and Space (COMETS).” Nature Protocols, vol. 16, no. 11, Nov. 2021, pp. 5030–5082.
8 Mahadevan, R., Edwards, J. S., and F. J. Doyle III. “Dynamic Flux Balance Analysis of Diauxic Growth in Escherichia coli.” Biophysical Journal, vol. 83, no. 3, 2002, pp. 1331–1340.
simultaneously. So, at a specific time step, the variables update and for example the nutrient availability, waste product accumulation, and metabolic fluxes. Generally dynamic flux balance analysis is applied to a uniform distribution of organisms and nutrients, but it can also be applied with COMETS to a two-dimensional petri dish equivalent. Each unit of space is on a grid square that can contain metabolites or organisms. One primary limitation of COMETS is a limitation also inherent to flux balance analysis which is the lack of explicit gene regulation. This means that COMETS assumes that metabolic pathways are either “on” or “off” but doesn’t account for how an organism might upregulate or downregulate certain gene expressions in response to environmental stimuli. COMETS also forces users to use very small time steps to overcome numerical calculation errors and prevent instability in the diffusion equations. This results in longer simulations.
In the context of this research, COMETS allows for simulation of S. cerevisiae’s growth with specific nutrient quantities and in digitally recreated environments such as different petri dishes. COMETS is written in Java but is deployed through the COMETSPY python package. The COMETS interface takes information and compiles three different files, the model, layout, and parameters file.9 These files are then passed to the COMETS java and Gurobi optimization. (Gurobi Optimization is an optimizer which allows for more efficient flux balance analysis and objective function calculation). COMETS outputs are total biomass, biomass, media, and fluxes. Total biomass is a table output with a series of iterations over time related to the biomass in grams.10 The biomass output gives spatial data on the location of the microbial communities. The media output gives data on the concentrations of metabolites over time. Finally, the fluxes output provides information on all the fluxes for each genome-scale model in the grid. A typical runtime for COMETS simulations is thirty minutes to an hour, but this can widely vary depending on the simulation environment (whether the simulation is in a virtual petri dish or there is
9 Dukovski I, et. al
10 Dukovski I, et. al
no dimensional element and it’s a test tube)11, and how many different models are in the simulation. The runtime directly depends on the number of cycles that the simulation is run for.
Utilizing COBRApy for Simulations with Gene Knockouts
COBRApy (COnstraint Based Reconstruction and Analysis for Python) is a Python library designed for constraint-based modeling of biological systems, specifically metabolic networks.12 It is what provides the basis for creating these large genome-scale models that detail the reactions, genes, and metabolites for a specific organism as in the case of S. cerevisiae. It is only built in Python whereas COMETS is in Java with Python interface support. COBRApy is used to load the model for COMETS simulations like the one for the wasp gut growth and recreating the S. cerevisiae growth curve. COBRApy also allows for the gene deletion of essential and nonessential genes in the S. cerevisiae model.
COBRApy has multiple features, these include Gene Deletion Analysis, Reaction Deletion Analysis, Flux Balance Analysis, and Custom building or editing of Models. However the FBA here differs from the dynamic Flux Balance Analysis in COMETS and is instead steady-state and doesn’t adjust the conditions at timesteps. COBRApy differs from COMETS as it doesn’t involve any spatial analysis. Instead, it focuses more on single organisms instead of microbial communities.
Creating a Two-Dimensional Model of The Wasp Gut
In order to create an approximate model of the wasp gut, it was necessary to first take a side view of the wasp so as to capture a twodimensional image that could work for the purposes of further modeling of the gut. Next, we measured the pixel values and labeled them black or white. The code written generated a matrix of numbers with binary
11 Dukovski I, et. al
12 Ebrahim, A., Lerman, J.A., Palsson, B.O. et al. COBRApy: COnstraints-Based Reconstruction and Analysis for Python. BMC Syst Biol 7, 74 (2013). https://doi.org/10.1186/1752-0509-7-74
information in a petri dish of one or zero. A one in this case would represent the area that the microbial colonies couldn’t grow into (i.e. out of the wasp gut). And a zero would represent the available area that the microbial community could grow into. These values correspond to the side image of the gut as the black pixels were the wasp gut itself. With this matrix, COMETS was utilized to create barriers where the organisms could not grow. These barriers formed the shape of the actual wasp gut so that it functioned like a uniquely shaped digital petri dish. With this properly constructed matrix, we were able to run several different simulations each with an increasing number of cycles. As was mentioned before, COMETS generally needs a small timestep to prevent instability, so the timestep in this case was set to 0.001 hours. The space width, the variable responsible for the dimensions, was set to 0.02 cm. To simply create a visualization of what bacterial growth in the gut would look like, a simple bacterial model was used. For this case it was E. Coli, which has significantly fewer genes and reactions and is also one of the most studied species of bacteria in human history. Three colonies of E. Coli were placed in the top part of the gut. The number of cycles ranged from a couple hundred all the way up to eight thousand cycles. The output in the petri dish was then outputted as a visualization of the petri dish. This showed the possible growth pattern over an ever increasing time period. This illustrates as a proof of concept of growth inside a wasp gut shaped area.
Recreating the Experimental Growth Curve of S. cerevisiae in COMETS
During the exponential growth phase, Saccharomyces Cerevisiae cells produce ATP through fermentation and also through mitochondrial respiration. The concentration of fermentable carbon influences how many cells generate ATP. The purpose of the paper analyzed was to create a growth curve for the yeast through experimental data. Variation in carbohydrate levels is what dictates differences in metabolism in the yeast. Respiratory growth has low specific growth rates with higher doubling times whereas fermentative growth has high specific growth
rates with lower doubling times.13 They put yeast in shaken conical flasks and microplates and measured the growth over the course of fortyeight hours. The intention was to recreate the fermentation growth curve. In order to properly recreate the growth curve from the experimental data, it was necessary to first determine the proper quantities of available metabolites and then do the proper stoichiometric conversions for the units needed for COMETS. The research paper on kinetic growth curves for S. cerevisiae provided numerous methods for different environments, but the one that was most similar and most simple was a shaken conical flask. because that corresponded to the general COMETS simulation. Because COMETS operate in different units, one of the crucial steps in this process was converting from g/l to moles for specific metabolites from the research paper. Once the correct quantities and concentrations of the correct types of metabolites were obtained, they were added to the system. An appropriate Vmax and Km values were selected that would generally be observed in the real world. Vmax is the maximum rate of reaction and Km is concentration of a substrate where the velocity is exactly half of Vmax. Once the simulation was run, the output of the growth of S. cerevisiae over time was unfortunately in grams of biomass and not in the same units measured in the study, OD600nm. So using bionumbers as a source, the graphs were scaled to the appropriate levels via a conversion factor. The concentrations of the relevant metabolites of acetate and glucose were also tracked and graphed over time. All graphs were created with the Matplotlib Python Library.
Verifying If The Genes In The Model Are Essential Or Nonessential
The process first started by taking the csv file and splitting the genes up according to whether they were essential or nonessential. With these two lists, a series of gene knockouts that removed a specific gene
13 Olivares-Marin, Ivanna Karina et al. “Saccharomyces cerevisiae
Exponential Growth Kinetics in Batch Culture to Analyze Respiratory and Fermentative Metabolism.” Journal of visualized experiments : JoVE ,139 58192. 30 Sep. 2018, doi:10.3791/58192
and tried to find the optimal growth rate were performed. As mentioned previously, genes where the growth rate went to 0 would be considered essential as without them the organism ceased to function properly and replicate itself. Genes that when removed reduced the organism’s fitness (a.k.a. lowering its growth rate) but didn’t outright prevent the growth rate being designated as “nonessential.”
A major issue with properly calculating the real-world outcome with gene deletions is that with flux balance analysis, the model will reroute the metabolic pathways to again find the optimal solution or still grow optimally. The complexity of cellular components and interactions within the cell make simulating the function of a cell quite difficult.14 Thus, computer models often need to make shortcuts. This is why flux balance analysis is quite useful for generating quantitative testable outputs. However, lab created mutants aren’t subjected to the same evolutionary pressures as naturally occurring mutants of the wild type. (The wild type is the version of the organism that is found in nature.) Therefore, it is unlikely that the organism with a gene knockout will regulate its fluxes towards an optimal growth rate. 15 The mutant should be expected to grow at a rate somewhere between the optimum for the wild type and the mutant. The method to find this midpoint is called MOMA (method of minimization of metabolic adjustment).16
14D. Segrè, D. Vitkup, G.M. Church, Analysis of optimality in natural and perturbed metabolic networks, Proc. Natl. Acad. Sci. U.S.A.
15D. Segrè, et. al.
16 D. Segrè, et. al.

Source: D. Segrè, D. Vitkup, G.M. Church, Analysis of optimality in natural and perturbed metabolic networks, Proc. Natl. Acad. Sci. U.S.A.
In order to accommodate this, the bounds of the metabolic fluxes were limited so that the model wouldn’t be able to override the effects of the gene deletion completely. So, two gene deletion simulations were run, one that didn’t set upper and lower bounds for the fluxes and just performed normal flux balance analysis and one that set the bounds of the fluxes. If the flux value was greater than zero, the code would set the upper bound to that flux value and if the flux value was less than zero, the code would set the lower bound to the flux value.
Results:
Recreating the Wasp Gut:
1 Wasp Gut Petri Dish Generation Steps

The purple pixel values represent the available space that the yeast can possibly grow. The blue represents the added barriers in the shape of the wasp gut. The matrix had to be transposed through the function np.transpose() from Python’s numpy library so that the gut wouldn’t end up flipped. The x and y origin starts in the top right of the grid. There is a slight complication from the involvement of these small orienting red and green lines that bleed into the gut. The code that sorts the pixel color values doesn’t properly register these colored lines and in turn there is a slight mark present in the final petri dish. Despite this, the blue area on the grid was designated as a barrier where no cells could grow and no metabolites were present, which generally resembles the shape of the gut from a side view.
Figure
Figure 2 Progression of Growth in the Wasp Gut
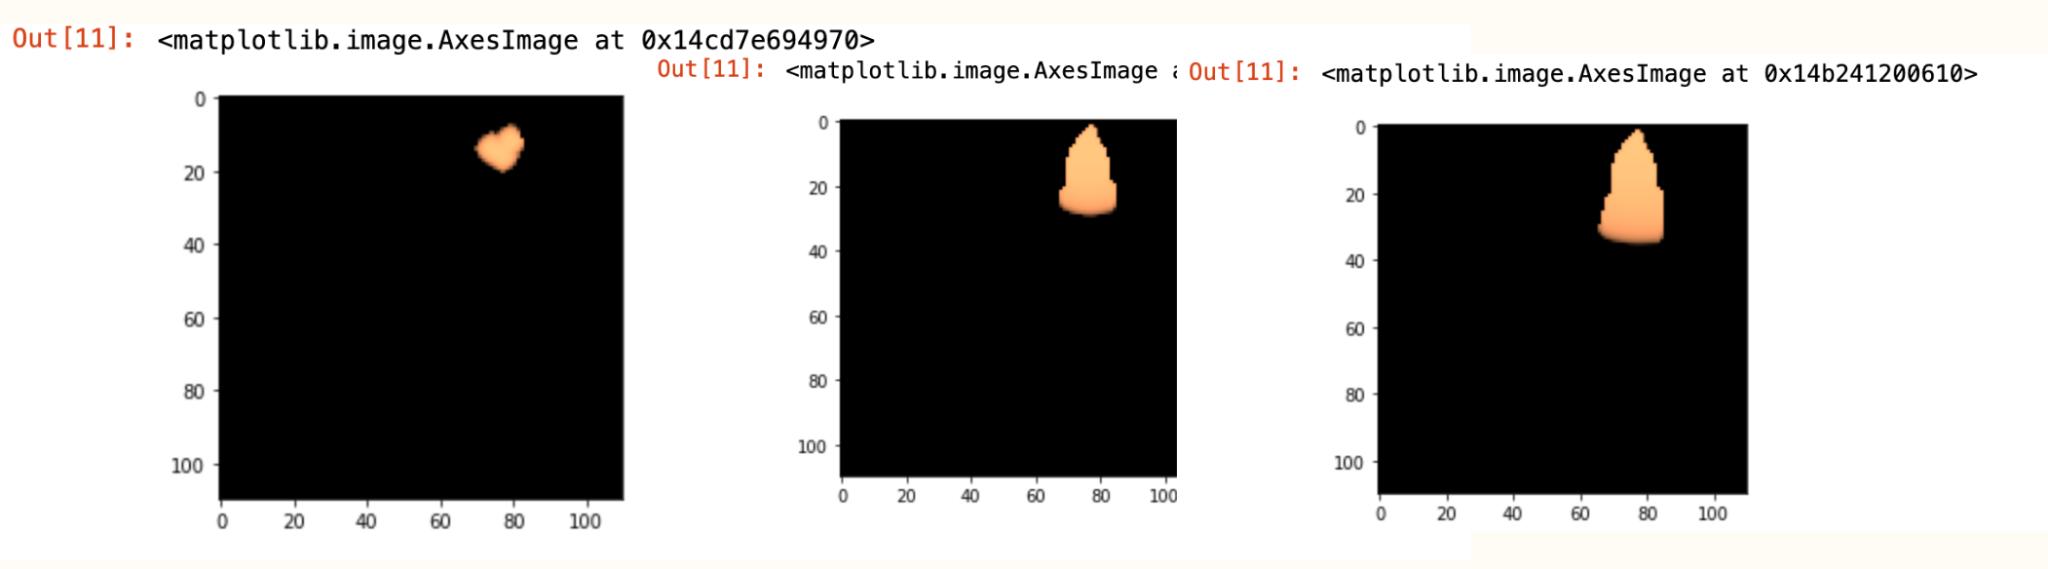
These images show the progression of E. Coli growth in the wasp gut over time. The bacteria grows into the shape of the gut. The initial conditions were set with an unlimited amount of metabolites like glucose so that there would be no limiting factors for the growth rate. As can be observed, the colonies initially planted in the upper right corner progressively fill out the frame and eventually take the shape of the gut. However, the growth isn’t completely linear over time as the progression from one thousand cycles in the middle image to five thousand cycles isn’t a five times factor increase in the size of the colony. This simulation could be replicated with S. cerevisiae and would yield the same expected type of growth results, albeit at a different rate.
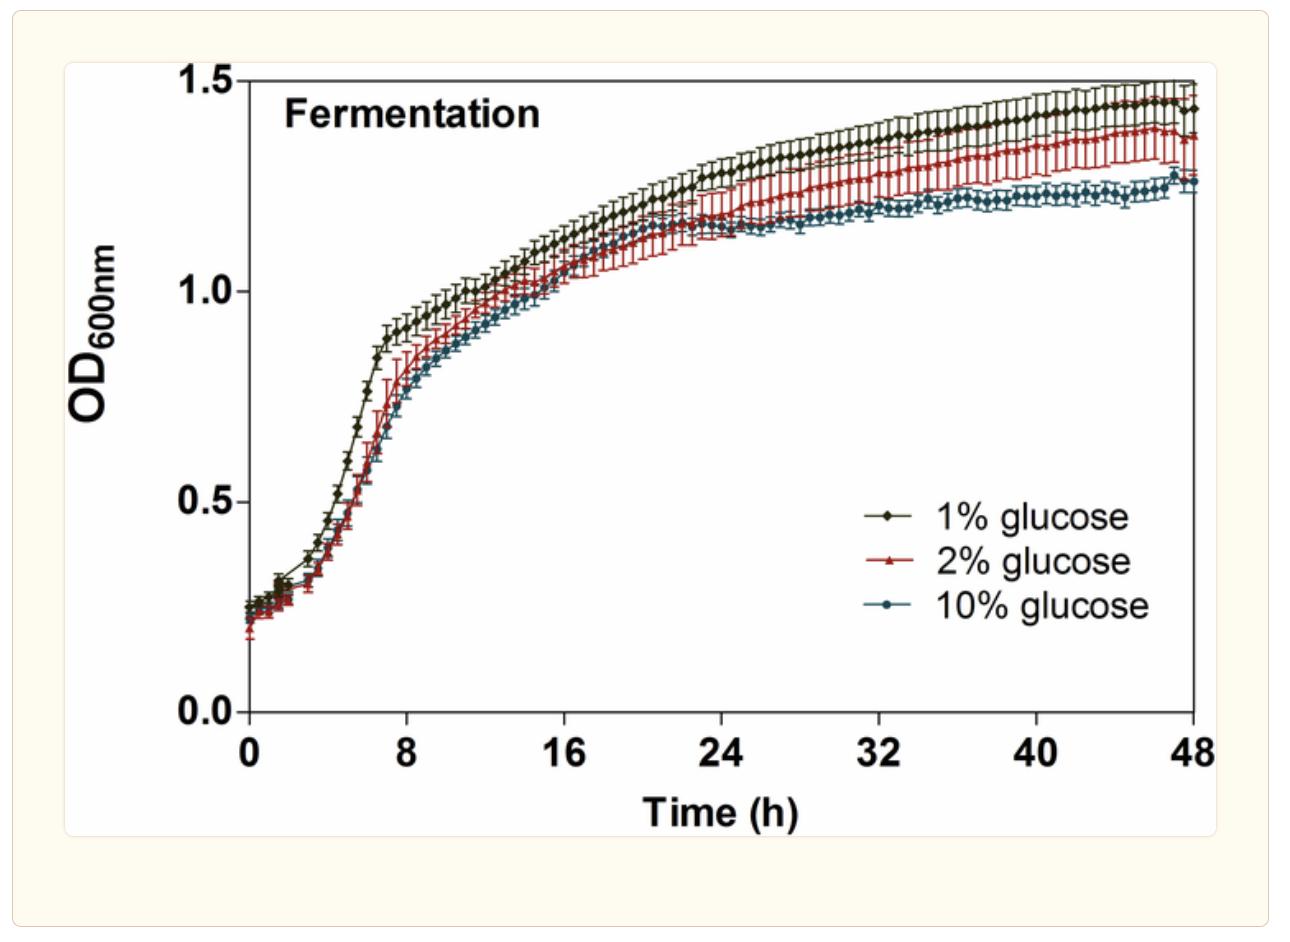
Figure 3 Experimental Growth Curve17
4 COMETS Growth Curve
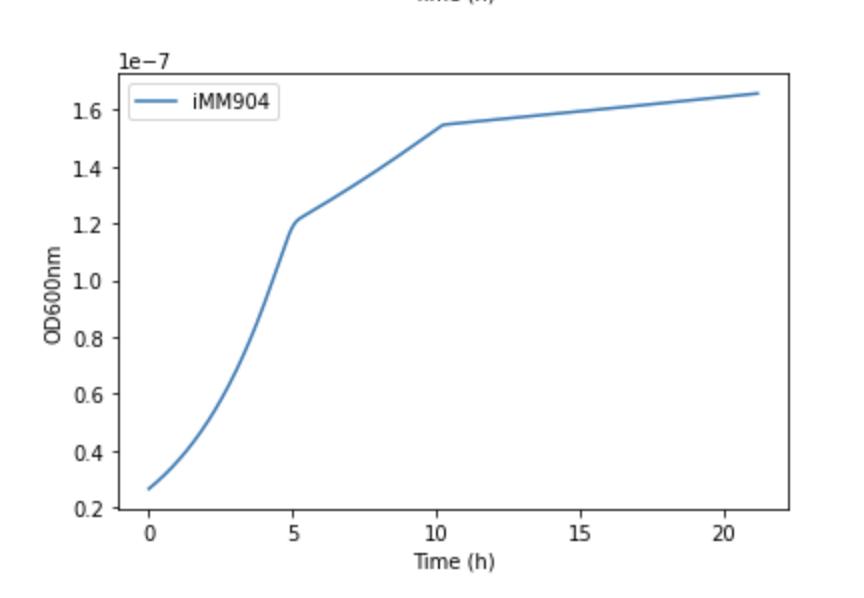
The growth of the yeast model over time in hours in the COMETS simulation.
17Olivares-Marin, Ivanna Karina et al.
Figure
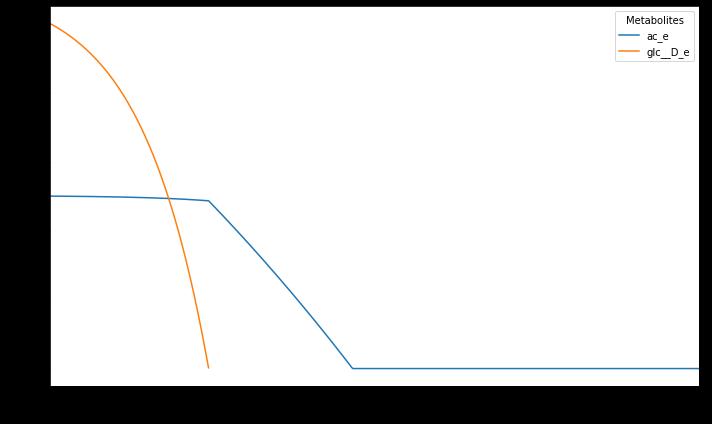
This graph showcases the quantity of specific metabolites acetate and glucose that the yeast uptakes vs time in hours.
The graphs produced were similar to that presented in the experimental data for fermentative growth. There was an initial loading phase, followed by an accelerated consumption of glucose that led into an exponentially increasing phase. Once the glucose runs out, the budding yeast starts to use its second choice of acetate as a source of fuel. As was mentioned before, the results for the biomass growth rate were converted to OD600nm. OD600nm is a measure of the optical density measured at a wavelength of 600nm. It basically measures the amount that the light is displaced when passed through a solution with bacteria in it, which is much easier to do than experimentally measuring the grams of biomass. But a computer simulation like COMETS could easily do that. This was a far more linear and slower growth pattern than the glucose consumption phase. Eventually, the secondary energy source of acetate runs out as well and the growth tapers off.
Figure 6 Growth Rates after Gene Deletion with Flux Balance Analysis:

This graph shows the output when each gene in the model is knocked out and the growth rate after the knockout is added to a bar graph.
Figure 7 Growth Rates after Gene Deletion with Fixed Fluxes:

This graph shows the output when each gene in the model is knocked out with fixed fluxes and the growth rate after the knockout is added to a bar graph.
As can be observed, when the fluxes were fixed we saw significantly more growth rates with reduced fitness but also where the growth rate wasn’t zero. These would be considered nonessential genes even though they were less than the optimal growth of approximately 0.86. This is the solution to the objective function. There is a significantly higher proportion of nonessential genes in this simulation. Again, this makes sense because having fixed bounds for the metabolic fluxes causes the model to not as easily find another pathway to keep its optimal growth. However, the outcomes of the gene deletion simulation revealed that the metabolic atlas model did not align with a large majority of the experimental data on which genes were essential or nonessential to the growth and development of yeast. The number of essentials was 160 and the number of nonessentials less than the optimal growth rate was 73. Whereas for the simulation without the set fluxes had had 181 essential genes and 43 nonessential genes with a growth rate less than the optimal rate. This is significantly less than the 711
experimentally derived essential genes that were expected to be knocked out and result in zero growth. This inaccuracy in the specific COBRApy model of the yeast may suggest that it may need further refinement and development or that a newer superior model should be used.
Conclusion
The goal of the thesis was to develop an applicable model for the wasp gut, to recreate the conditions and experimental results of measured growth curves of the budding yeast S. Cerevisiae, and verify which genes were essential or nonessential in the model. This was important because of the wide range of potential ecological impact that the yeast could have along with the relationship between the wasp gut and its mating behavior. The growth curve created in the COMETS simulation closely resembled the experimental growth of the S. cerevisiae. The initial loading phase followed by the exponential growth when the yeast consumes glucose and then the abrupt taper after the glucose runs out appear in the simulation just as it is described in the experimental data from the paper (Olivares-Marin, Ivanna Karina et al.). The outcomes of the gene deletion showed that the model used from the metabolic atlas did not align with a large majority of the experimental data on which genes were essential or nonessential to the growth and development of S. cerevisiae. The number of essentials was 160 and the number of nonessentials less than the optimal growth rate was 73. All the rest of the genes still maintained an optimal growth rate even after the upper or lower bounds of the metabolic fluxes were restricted. This may mean that the models aren’t complex enough to accurately reflect the real wild type or that the model is just inaccurate in representing the metabolic network of the organism.
The development of the two-dimensional wasp gut is also a stepping stone in further simulations for better understanding the connection between the microbiome of the gut and the wasp behavior. The successful recreation of the yeast’s growth curve further validates the computational modeling of COMETS and its utility for simulating complex microbial systems. Additionally, the findings from the COBRApy gene knockouts highlights gaps in current metabolic models that need to be addressed. Obtaining these results could lead to a better
understanding of the wasp-yeast relationship, via the 2-dimensional gut, the growth mechanism/curve of the yeast, and the underlying genetics of S. cerevisiae. With this better understanding, further research determining how the yeast affects the health and behavior of the wasp should be more attainable.
Possible Avenues For Future Research
Another step in the development of COMETS is the process of developing a method to simulate extracellular reactions in COMETSPY and not just the existing MATLAB COMETS interface. So future research and development should involve developing the Python interface for extracellular reactions and converting the preexisting MATLAB documentation into equivalent Python code. Extracellular reactions in metabolic models refer to reactions that involve metabolites outside of the cell or organism. These types of reactions are important modeling the uptake of nutrients along with removal of waste products. They are also important in modeling systems that have multiple organisms as they all interact with each other and exchange metabolites. Developing this capability for the python interface of COMETS would further increase its applicability in modeling more complex systems.
Another plan for future research is to develop not just a 2dimensional model of the wasp gut but instead a 3-dimensional model which can more accurately mimic the real wasp gut. Developing a 3dimensional model would require significantly more computational power for simulations as there isn't just a need to check the surrounding gridspace for metabolites and the presence of other organisms but instead COMETS would have to check surrounding cubic space for all these interactions. A more advanced model for simulations would also need to factor in the variety of other microorganisms present in the wasp gut, not just S. cerevisiae. It would need to factor in the organisms’ own metabolic pathways as well. Nevertheless the development of a 3dimensional wasp gut would allow for the most accurate rendition of the growth patterns of the yeast. It would be significantly more valuable than the gradual progression of a simple organism’s growth like E. Coli.
Experimental validation is also another important component of future research. While a lot of this research has sought to in principle
recreate and model experiments and real world mechanisms related to the yeast and wasp, it is important that once the COMETS and COBRApy outputs have theoretical accuracy (i.e. the genes in the model function in the same way as the real organism) that predictions made with COMETS are also tested experimentally. Integrating better visualization techniques and graphical representations of the yeast growth could further enhance the interpretability of the data. Current representations of growth show only static information about a particular time step or number of cycles. Developing a real time updating simulation, especially for a threedimensional model, could greatly enhance the presentation and analysis of the data from the simulation. Developing a multispecies simulation would also provide a more accurate rendition of the biological dynamics taking place in the wasp gut. This would take into account the competition for scarce resources taking place.
One final potential future research opportunity building on the gene knockouts would be to develop a better model of S. cerevisiae that more accurately reflects the experimentally obtained data on the essentiality of the genes of S. cerevisiae. So instead of only a couple hundred genes being flagged as essential, all of the suspected essential genes should produce a growth rate of zero when knocked out. This would be a particularly difficult path of future research however as the model of the yeast is quite complex and making adjustments to the genes requires changing their underlying functionality. There may be consideration of the fact that
Work Cited:
D Cavalieri, PE McGovern, DL Hartl, R Mortimer, M Polsinelli, “Evidence for S. cerevisiae fermentation in ancient wine.” J Mol Evol 57, S226–S232 (2003).
Di Paola, M., Gori, A., Stefanini, I. et al. Using wasps as a tool to restore a functioning vine grape mycobiota and preserve the mycobial “terroir”. Sci Rep 13, 16544 (2023). https://doi.org/10.1038/s41598-023-43541-9
Ebrahim, A., Lerman, J.A., Palsson, B.O. et al. COBRApy: COnstraints-Based Reconstruction and Analysis for Python. BMC Syst Biol 7, 74 (2013). https://doi.org/10.1186/1752-0509-7-74
Stefanini I, Dapporto L, Berná L, Polsinelli M, Turillazzi S, Cavalieri D. Social wasps are a Saccharomyces mating nest. Proceedings of the National Academy of Sciences. 2016;113(8):2247–51. Pmid:26787874
Stefanini, I.; Dapporto, L.; Legras, J.-L.; Calabretta, A.; Di Paola, M.; De Filippo, C.; Viola, R.; Capretti, P.; Polsinelli, M.; Turillazzi, S.; et al. Role of social wasps in Saccharomyces cerevisiae ecology and evolution. Proc. Natl. Acad. Sci. USA 2012, 109, 13398–13403.
Stefanini, Irene. "Yeast‐insect associations: It takes guts." Yeast 35.4 (2018): 315-330.
O’Brien, E. J., Monk, J. M., and B. O. Palsson. “Using GenomeScale Models to Predict Biological Capabilities.” Cell, vol. 161, no. 5, 2015, pp. 971–987.
Olivares-Marin, Ivanna Karina et al. “Saccharomyces cerevisiae
Exponential Growth Kinetics in Batch Culture to Analyze
Respiratory and Fermentative Metabolism.” Journal of visualized experiments : JoVE ,139 58192. 30 Sep. 2018, doi:10.3791/58192
Dukovski, I., Bajić, D., Chacón, J. M., Quintin, M., Vila, J. C. C., Sulheim, S., Pacheco, A. R., Bernstein, D. B., Riehl, W. J.,
Korolev, K. S., Sanchez, A., Harcombe, W. R., and D. Segrè. “A
Metabolic Modeling Platform for the Computation of Microbial Ecosystems in Time and Space (COMETS).” Nature Protocols, vol. 16, no. 11, Nov. 2021, pp. 5030–5082. doi:10.1038/s41596021-00593-3.
D. Segrè, D. Vitkup, G.M. Church, Analysis of optimality in natural and perturbed metabolic networks, Proc. Natl. Acad. Sci. U.S.A. 99 (23) 15112-15117, https://doi.org/10.1073/pnas.232349399 (2002).
Mahadevan, R., Edwards, J. S., and F. J. Doyle III. “Dynamic Flux
Balance Analysis of Diauxic Growth in Escherichia coli.” Biophysical Journal, vol. 83, no. 3, 2002, pp. 1331–1340.