Jin Choi
Senior Thesis | 2025

Piezo2 Activation on the Development of Mouse LTMRs
Jin Choi Senior Thesis
Mr. Divac
December 16, 2024
Abstract
The touch of a family member, a friend, a lover touch is a vital interface in both day to day life and interpersonal relationships, of bodily function and emotional regulation.9 Additionally, it is well established that physical touch is vital for the development of infants. The sense of touch is the first to begin developing in embryos,7 and studies of orphaned human infants raised in touchdeprived environments reveal that the deprivation of physical touch in infants can have potentially devastating psychological effects on their development.2 However, the neurophysiological mechanisms in which touch-evoked activity plays in the development of the nervous system remains poorly understood. Since its discovery in 2010, the Piezo2 protein (piezo-type mechanosensitive ion channel component 2) has been implicated in translating mechanical stimuli into electrical activity in fully matured touch-sensory neurons,15 but research into whether and how Piezo2 affects the development of the sense of touch has yet to be conducted. Through experiments genetically deleting Piezo2 in mice and observing changes in the gene expression of their touch-sensory neurons 15 days after inception (embryos) and 10 days after birth (infants), we found that Piezo2 is essential in regulating the development of touch sensory neurons. Accordingly, tactile experiences in-utero and during infancy may influence the physiological formation of the touch pathway by controlling the maturation of the body’s touch receptors.
Introduction
Gene Expression
In eukaryotes (including all animals), cells are largely divided into two parts: the nucleus, which houses DNA, and the cytoplasm, which consists of everything within the cell membrane that’s not the nucleus. Genes, which are segments of DNA, are housed in the nucleus and act as instructions for making specific proteins, the building blocks of any organism. The process of a protein being synthesized from a gene takes the following steps: a given DNA sequence (gene) is transcribed by an enzyme into mRNA inside a cell’s nucleus, then the mRNA is transported to the ribosomes (in the cytoplasm), where it is translated into a protein, which go on to carry out various cellular functions.

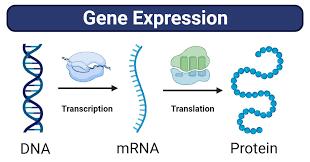
Figure 1: Cell structure diagram
Figure 2: Diagram of Gene Expression
All cells of an organism (barring anomalies such as gametes and mutations) in all multicellular eukaryotes carry the exact same copies of DNA and therefore genes, essentially carrying the exact same ‘instruction set’ in creating proteins. The way different types of cells (for example, a hair cell versus a skin cell versus a neuron) are differentiated is through their gene expression which genes are transcribed into mRNA, and go on to be translated into functional proteins. Cell differentiation is particularly critical during development, with the timing, location, and quantity of gene expression all having influence on the normal development of an organism. Consequently, gene expression is highly regulated throughout an organism’s lifespan, especially during the developmental stages. Gene expression is an incredibly complex system, with the expression of some genes producing proteins that upregulate or downregulate the transcription of other genes, which in turn can affect other genes, and even more genes downstream. Therefore, changes in gene expression are an important marker for detecting the abnormal development of an organism.
Neuron Anatomy and Action Potentials
A typical neuron is composed of four major parts: dendrites, which receive inputs from previous neurons; the cell body, which houses the nucleus and other typical cellular organelles; the axon, an elongated digit extending from the cell body; and the axon terminal, which sends outputs to downstream neurons. A connection between the axon terminal of one neuron and the dendrites of another is called a synapse, and neuron synapses are incredibly complex: there are approximately 86 billion neurons in an adult human,13 and a neuron makes an average of around 7,000 synapses, meaning the total synapse count in the adult human nervous system ranges around 600 trillion.16 It’s from this synaptic complexity of billions of neurons communicating with each other
that our senses, perception of the world, memories, emotion, and consciousness arise.

3: Simplified Anatomy of a Neuron.
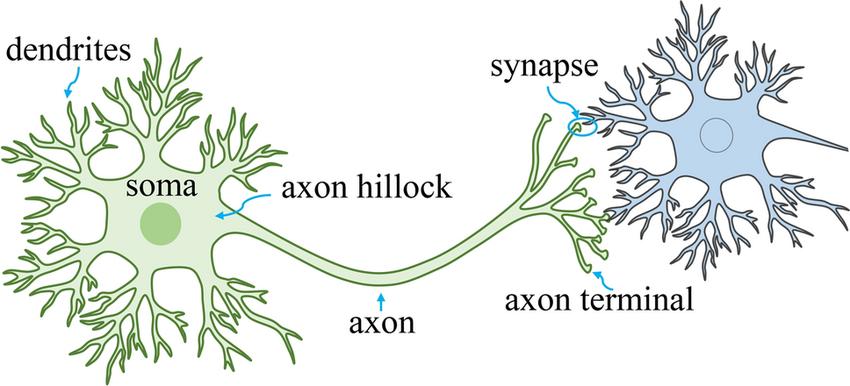
Figure 4: Simplified Diagram of a Neuronal Synapse. In actuality, neurons can make thousands of connections with downstream neurons, and take inputs from thousands more.
On a large scale, neurons operate through electrical conduction. All cells, including neurons, have a protective membrane called a
Figure
phospholipid bilayer separating the intracellular environment from the extracellular surrounding. Most molecules including positively or negatively charged ions, such as Na+ (sodium), Cl(Chloride), K+ (potassium) ions are unable to freely move across the bilayer on their own, requiring specialized ‘transport’ proteins to permeate across the membrane. This inability of various charged ions to move across the membrane can cause electrical charge imbalances between the intracellular and extracellular environments of a neuron and it is through these electrochemical differences that neurons send signals.

Figure 5: Diagram of the phospholipid bilayer. Various proteins help molecules that would otherwise be unable to cross the membrane to cross.
Neurons carefully maintain an ‘off state’ voltage around -70 millivolts compared to its extracellular surroundings, a condition which is called the neuron’s resting potential, as shown in figure 6. However, disturbances in this electrochemical difference an input from a previous neuron, for example can cause the intracellular environment to become more positively charged. If the membrane charge reaches around -55 mV, specialized voltagegated sodium channels a type of ion transport protein that only allows the passage of Na+ ions will open, allowing a massive influx of positively charged sodium ions to cross the membrane.
This will cause the charge of the intracellular environment to rapidly increase, ‘spiking’ the membrane voltage to +40 mV, before dropping back to the resting potential of -70 mV momentarily. However, this sudden influx of positively charged ions, called a ‘depolarization,’ in turn causes the adjacent intracellular environment to become more positive, causing a spike in the adjacent environment, which will in turn cause a spike in a further downstream area: this wave-like phenomenon, called an action potential propagation, will travel down the full length of the axon until reaching the axon terminal.

Figure 6: Diagram of a neuron’s resting potential. A typical neuron’s resting potential lies between -70mV and -65mV.


Figure 8: Diagram of an action potential propagating through the axon
Touch pathway
Biologically, it is well understood that in mammals, touch is perceived through various types of low threshold mechanoreceptors (LTMRs), which are specialized neurons that house their cell bodies in the dorsal root ganglion (DRG) peripheral to the spinal cord. Unlike more typical neurons, with their dendrites attached to the cell body, DRG neurons are unipolar, meaning their axon splits into two axon branches, with a terminal end in the spinal cord and a periphery end that extends to the skin and makes connections with various touch-sensing end organs. Additionally, the breakthrough discovery of the Piezo2 gene (in mice) and homologous gene PIEZO2 (in humans, 95% amino acid sequence homology with Piezo2 in mice) in 2010 revealed that the mechanically gated ion channel Piezo2/PIEZO2 protein functions as a ‘pressure plate’ on the cell membranes of these end organs, beginning the signal transduction in the touch pathway via the influx of various positively charged cations such as Ca2+ (calcium) and Na+ (sodium) when mechanical force is applied to the cellular membrane.15 Piezo2 has been found to be broadly expressed in touch sensory periphery end organs, as well as along the length of a DRG neuron.15
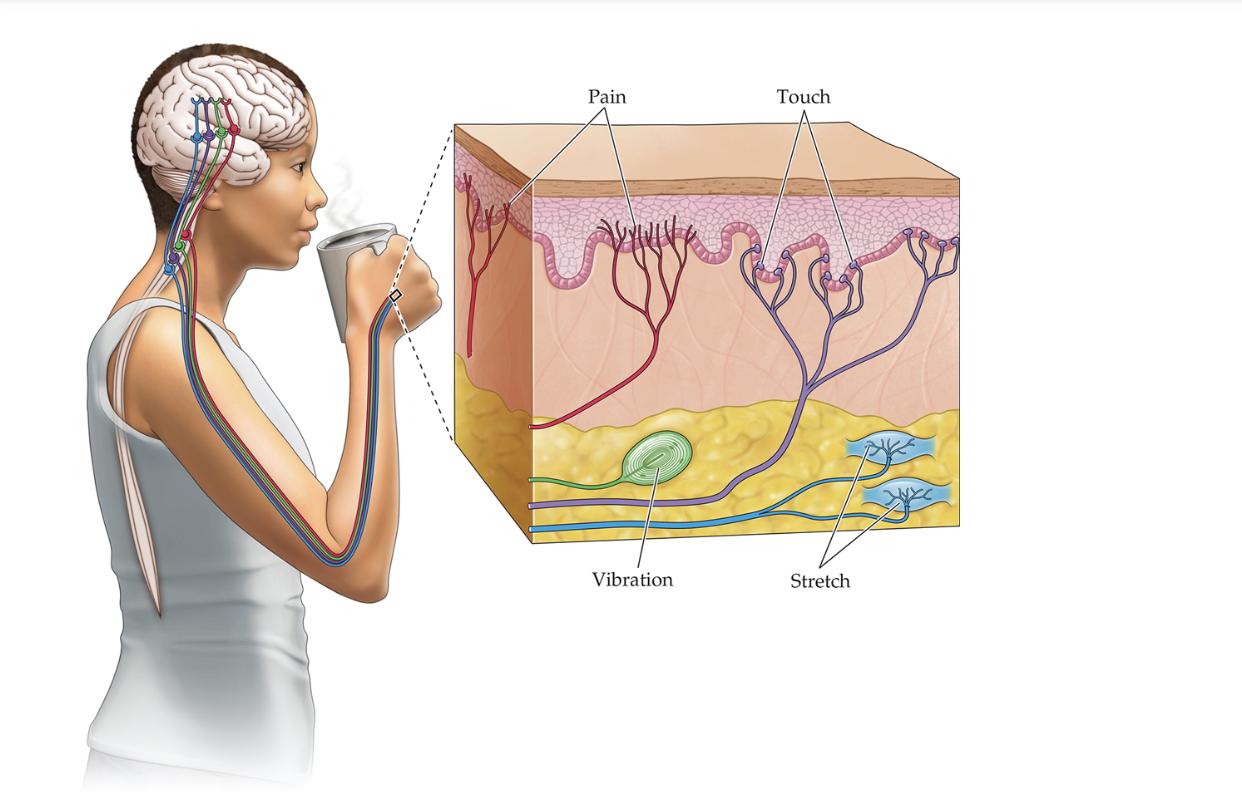
Figure 9: Diagram of LTMRs in the Touch Sensory Pathway. LTMRs house their cell bodies in the DRG, with one axon branch extending to peripheral end organs in the skin and the other end synapsing at the spinal cord.

Mouse Age Naming Conventions
By scientific convention, embryonic mouse age begins at fertilization and is generally counted in increments of 0.5 days. Because mouse breeding generally occurs during nighttime, while scientific research is typically conducted during the day, scientists generally add 0.5 to the age of the mice; likewise, the most common age of embryonic mice used in our experiment, E15.5 (embryonic day 15.5), denotes 15 days after confirmation of fertilization. After birth, mouse age is generally counted in increments of 1 day, with P0 (postnatal day 0) being the mouse’s date of birth. P10 mice, which we used for our primary postnatal time point, are roughly analogous to human infants in age.
Studies on the Psychological Effects of Touch Deprivation in Infants

Historically, much research has been conducted into the positive effects of touch, particularly from parents, on the sociopsychological development of infants,8 as well as the negative psychological effects of touch deprivation. Studies over the years conducted on infants raised in touch-deprived environments such as orphanages, foster care systems, and refugee camps have connected deprivation to various negative sequelae: a study by Chisholm in 2000 connected touch deprivation to insecure attachment patterns including indiscriminate friendly behavior, various behavioral issues, lower scores in the StanfordBinet intelligence scale;3 lower IQ and social adaptation according
to a study by Dennis in 1973;5 and deficits in attention, executive and social function, and in some cases syndromes that mimic autism according to a 2011 study by Nelson, Bos, Gunnar, & Sonuga-Barke.8
Autism Spectrum Disorder and the Sense of Touch
Nelson, Bos, Gunnar & Sonuga-Barke’s connection of touch deprivation to autism-like symptoms invokes an interesting connection to the developmental disorder. Some children living with autism spectrum disorder (ASD) are known to have various touch related developmental abnormalities, such as increased pain sensitivity and touch sensitivity compared to children without ASD (called hypersensitivity), as well as decreased pain and touch sensitivity compared to children without autism spectrum disorder (called hyposensitivity).11 Further research into the development of touch will be important in exploring and contributing to solutions for these aspects of children with autism spectrum disorder.
Methods
Conditional Knockout cKOs
We created mouse specimens that had Piezo2 conditionally knocked out (cKO’d, also known as tissue-specific knockout) using a Cdx2-Recombinase system, a method that deletes the Piezo2 gene in certain regions of the body while keeping it in others. The reason that conditional knockout was necessary for our experiment is that Piezo2 expression is important for certain sensory neurons that are necessary for the breathing reflex at birth, so the complete knockout of Piezo2 resulted in unviable mice. Therefore, we created cKOs of Piezo2 that remove the Piezo2 gene from select regions of the skin, DRGs, and bone-adjacent tissue, but leave them in areas that are vital for the mice to stay alive.
Overview of Methods

In our experiment, the gene expression of DRGs of mice with the PIEZO2 gene cKO’d were compared with control littermates at E15.5 and P10. Differences in gene expression were quantified in the DRGs via RNAScope imaging.
RNAScope Fluorescent In-Situ Hybridization (FISH)
The primary method by which we quantified gene expression differences in mice DRGs was through RNAScope, a version of fluorescent in-situ hybridization (FISH) developed by the company Advanced Cell Diagnostics.4 FISH is an imaging procedure where specialized probes are sent to attach to specific mRNA transcripts (a process called hybridization), intercepting cells at the transcriptional level. Fluorescent molecules are then attached to the probes, which are able to be detected by a confocal laser microscope. RNAScope is typically able to image 3 different genes at once, with different color probes attaching to different genes.
The advantages of RNAScope along with confocal microscopy is that the technique is able to produce accurate, high-fidelity images based off of transcripts of up to three different genes at a time. However, it is also a relatively costly and substantially time consuming procedure, with the RNAScope process itself spanning
three full days of near constant attention. But due to the high precision that DRG transcript imaging demands, RNAScope was used as our primary method for DRG imaging.
Preparation of Tissue for P10 mice
First, the experimental mice were anesthetized under isoflurane and sacrificed by cervical dislocation, as per animal welfare regulations from the Harvard Medical School and Institutional Animal Care and Use Committee (IACUC).10 Individual mouse DRGs from the lumbar and thoracic regions of the mouse’s spinal cord were dissected and frozen in 2-methylbutane (commonly known as isopentane) and cooled by dry ice (CO2) a method used to flash freeze tissue in order to preserve cellular integrity and stored at -80℃ until further processing. For P10 mice, DRGs are large enough to be dissected out from the spinal cord by hand, so the DRGs were separated from the spinal cord, and the spinal cord was discarded. The DRGs were then cut laterally into 20 micron (0.02 millimeter) sections using a Cryostat machine and placed onto Fisherbrand Superfrost Plus Microscope slides, and stored again in -80°C to preserve tissue for the RNAScope procedure.
Preparation of Tissue for E15.5 mice
First, the mothers of the E15.5 pups were anesthetized under 2% isoflurane and sacrificed by cervical dislocation. The pups were then removed from the uterine membrane, anesthetized with ice, and sacrificed by decapitation with dissection scissors. DRGs were dissected along with the spinal column, placed in OCT mounting medium, and stored at -80℃ until further processing. For E15.5 mice, DRGs are too small to be dissected out from the spinal cord by hand, so the DRGs were mounted alongside the spinal cord. The DRGs and spinal cords were then cut laterally into 20 micron (.02 millimeter) sections and placed onto Fisherbrand Superfrost Plus Microscope slides via cryosectioning, and stored again in80°C to preserve tissue for the RNAScope procedure.
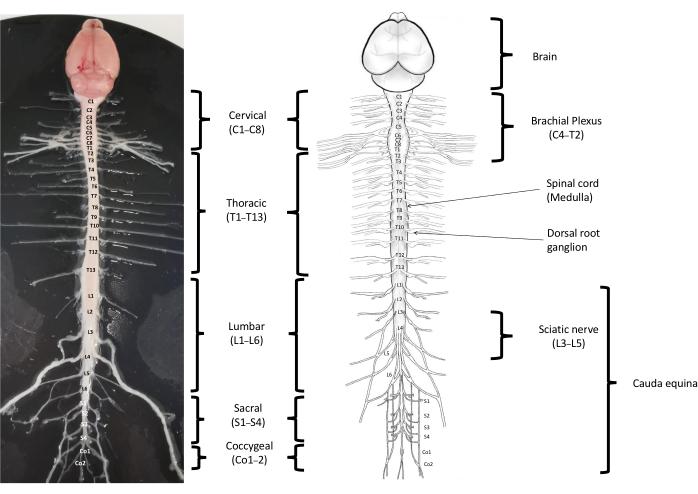
13: Mouse Spinal Cord Anatomy. Regions Used in experiments are thoracic T1 ~ T13 and Lumbar L1 ~ L6.
Figure

The RNAScope assay procedure was conducted in accordance with the manufacturer’s protocol. The first day of the RNAScope assay procedure included fixing the tissue in a 4% paraformaldehyde (PFA) solution in order to prevent cellular degradation, treatment with protease an enzyme that breaks down proteins in order to allow probes to permeate through the phospholipid membrane of the cell, incubation with probes in order for the probes to hybridize with RNA transcripts in the nucleus and cytoplasm, and overnight storage in salicylic acid (SSC). The second day included probe amplification steps and attachment of fluorescent molecules as per the manufacturer’s protocol, after which slides were stored in +4°C to preserve tissue for confocal microscopy.
The genes we targeted with our probes for the E15.5 mice were the Ntrk2, Calb1, Rem2, Pou4f1, and Pou4f2 genes, and the genes targeted for the P10 mice were the Calb1 and Rem2 genes. These genes were largely used as read-outs for LTMR neurons, and the exact functions of all of them are not yet fully understood. However, these genes are known to be associated with LTMR development: for example, Ntrk2 is well understood to play a crucial role in LTMR development by coding for the TrkB receptor an ion channel crucial for the growth of neurons and the Rem2 and Pou4f2 genes are known to code for LTMR transcription factors, which are proteins that affect gene expression. The reason that Piezo2 itself was not probed is because Piezo2 cKO mice have the Piezo2 gene removed in relevant tissue, and therefore no Piezo2 mRNA transcripts should exist in these cells. However, observation of changes in the expression of genes related to LTMR function, including some that have been shown to be misregulated in adult Piezo2 cKO animals, can reveal abnormalities in the development of LTMR neurons.
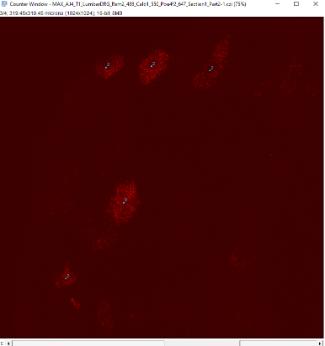
Figure 15: Example of RNAScope image of E15.5 mouse generated via confocal microscopy. Red patches indicate Calb1+ cells.
RNAScope quantification
For quantification of Ntrk2+ cells in E15.5 embryos, the total number of Ntrk2+ cells was counted using the Cell Counter plugin on FIJI/ImageJ software. For each animal, 3 or more images were analyzed, and the average values were recorded. For quantification of Calb1+ cells in E15.5 embryos, the total number of Calb1+ cells was counted using the Cell Counter plugin. For each animal, 4 or more images were analyzed, and the average values were recorded. For quantification of Calb1+/Rem2+ double-positive cells in E15.5 embryos, the total number of Calb1+ cells was counted using the Cell Counter plugin. Then, the number of Calb1+/Rem2+ cells was counted. For each animal, 3 or more images were analyzed, and
average values were recorded. For quantification of Pou4f1 and Pou4f2 fluorescence intensity in E15.5 embryos, the mean gray values of Pou4f1 and Pou4f2 fluorescence over the entire DRG section was obtained on FIJI/ImageJ. For each animal, 3 or more images were analyzed, and averages per tissue section were recorded. Identical imaging conditions were maintained for fluorescence quantification (DRGs stained in the same batch of RNAScope, and imaged using identical confocal microscopy settings).
For quantification of Calb1+ cells in P10 mice, the total number of Calb1+ cells was counted using the Cell Counter plugin. For each animal, 3 or more images were analyzed, and the average values were recorded. For quantification of Rem2+ cells in P10 mice, the total number of Rem2+ cells was counted using the Cell Counter plugin. For each animal, 4 or more images were analyzed, and the average values were recorded.
Statistical Analysis
For scientific research, scientists adhere to statistical standards, primarily the p value system, when analyzing data in order to minimize the chances that random chance or biases influence their findings. The p value represents the probability of obtaining a result as extreme as the difference observed in experimental data if the null hypothesis the hypothesis stating that there will be no significant difference between two populations were true. In the context of our experiments, the p value indicates whether or not a statistically significant difference was observed in control mice and Piezo2 mutant mice for a given quantification of gene expression.
In the biological sciences, a p value of .05 is generally used as the threshold value of statistical significance, and we used the same standard for our experiments. A p value less than .05 indicates that there is a statistically significant difference between two data sets,
while a p value greater than .05 indicates that there is not a statistically significant difference between two data sets.
Depending on certain characteristics of the data, different statistical tests are used. If the data is found to follow a normal distribution (as shown in figure 16) and also have equal variance, a statistical test called the unpaired t-test (also called the student’s ttest) is used to determine the p value, and therefore statistical significance. If the data is found to follow normal distribution but with unequal variance, Welch’s t-test is used, and if the data is found to not follow a normal distribution, the Mann-Whitney test is used. In order to determine if data conforms to a normal distribution, a method called the Shapiro-Wilk test is used, and in order to determine equal or unequal variances, a method called the f test is used.

For our experiments, we conducted all statistical analyses using the Graphpad Prism software in accordance with the methods stated
Figure 16: Definition of a normal distribution.
above. For the figures below, context of significance (indicated by n.s. for ‘not significant’ and asterisks * for significant data), methods used, and p values for significant data are provided.
Results
E15.5 animals
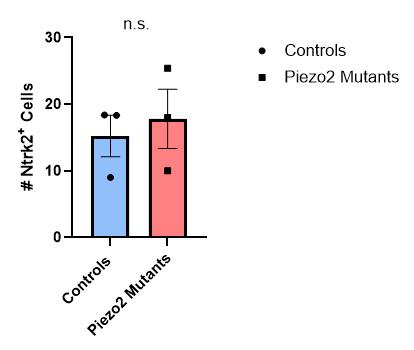
Figure 17: Quantification of the number of Ntrk2+ cells in thoracic and lumbar DRG sections for control or Piezo2 cKO E15.5 animals. There was no difference between the two groups (Mann-Whitney test). Each data point indicates one animal, averages are shown by horizontal bars, and error bars represent the standard error of mean (s.e.m.).

Figure 18: Quantification of the number of Calb1+ cells in thoracic and lumbar DRG sections for control or Piezo2 cKO E15.5 animals. There was no difference between the two groups (Welch’s t-test). Each data point indicates one animal, averages are shown by horizontal bars, and error bars represent the standard error of mean (s.e.m.).
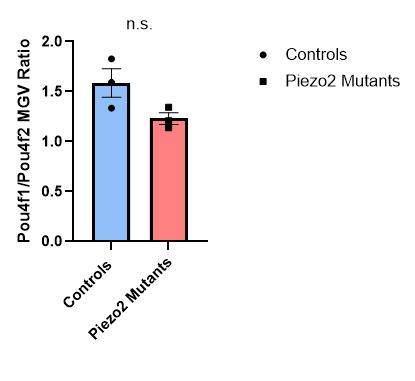
Figure 19: Quantification of the Pou4f1 over Pou4f2 mean gray value ratio in thoracic and lumbar DRG sections for control or Piezo2 cKO
E15.5 animals. There was no difference between the two groups (Welch’s t-test). Each data point indicates one animal, averages are shown by horizontal bars, and error bars represent the standard error of mean (s.e.m.).
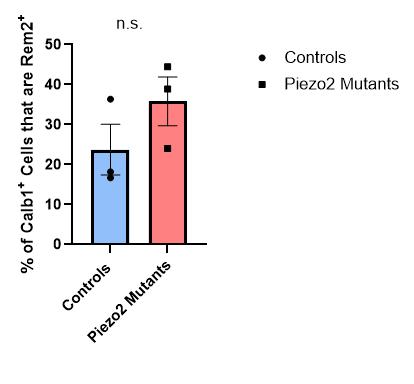
Figure 20: Quantification of the percentage of Calb1+ Cells that are double-positive for Rem2 in thoracic and lumbar DRG sections for control or Piezo2 cKO E15.5 animals. There was no difference between the two groups (Unpaired t-test). Each data point indicates one animal, averages are shown by horizontal bars, and error bars represent the standard error of mean (s.e.m.).
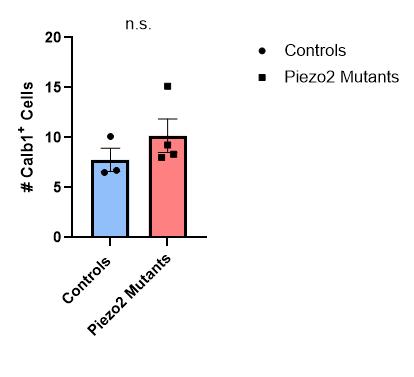
Figure 21: Quantification of the number of Calb1+ cells in thoracic and lumbar DRG sections for control or Piezo2 cKO P10 animals.
There was no difference between the two groups (Mann-Whitney test). Each data point indicates one animal, averages are shown by horizontal bars, and error bars represent the standard error of mean (s.e.m.).
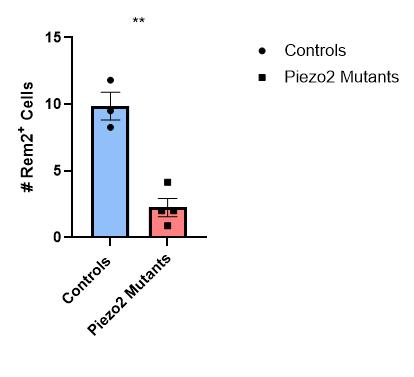
Figure 22: Quantification of the number of Rem2+ cells in thoracic and lumbar DRG sections for control or Piezo2 cKO animals. There was a statistically significant difference between the two groups (Welch’s t-test, **P = 0.0048). Each data point indicates one animal, averages are shown by horizontal bars, and error bars represent the standard error of mean (s.e.m.).
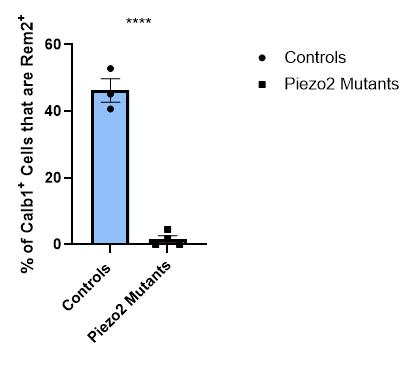
Figure 23: Quantification of the percentage of Calb1+ cells that are double-positive for Rem2 in thoracic and lumbar DRG sections for control or Piezo2 cKO animals. There was a statistically significant difference between the two groups (Unpaired t-test, ****P < 0.0001). Each data point indicates one animal, averages are shown by horizontal bars, and error bars represent the standard error of mean (s.e.m.).
Overview of Results
We identified that the activation of PIEZO2 between E15.5 (15.5 days after inception) and P10 (10 days after birth) is necessary for the normal development of mouse LTMRs. In the E15.5 mice, no statistically significant difference was observed in the gene expression of the DRGs of PIEZO2 cKO mice and control mice, as shown through the quantification comparisons of Ntrk2+ cell count, Calb1+ cell count, Calb1+/Rem2+ double-positive percentage, and Pou4f1/Pou4f2 fluorescence ratio. However, in the P10 mice, a statistically significant difference (p = 0.0048) in Rem2+ cell count between control mice and Piezo2 cKO mice was observed, suggesting that between the time points of E15.5 and P10, the activation of Piezo2 is required for the normal development of mouse LTMRs.
Discussion
Through our experiments, we’ve discovered that activation of the Piezo2 gene in mice is critical for the development of LTMRs in the touch pathway by examining the gene expression of LTMRspecific genes in the DRGs of control and Piezo2 mutant mice. With the Piezo2 mechanotransduction channel being essential in establishing the peripheral end organ and transcriptional maturation of touch sensory neurons, we propose that during the early stages of life, such as in-utero and during infancy, mechanical forces such as external touch play a crucial role in forming LTMRs, the first node underlying our sense of touch.
One possible mechanism through which this reliance occurs is that the removal of the Piezo2 protein which would typically cause a depolarization in neurons via the influx of various positively charged cations removes the ability of mechanical stimuli to result in the permeation of positively charged ions and therefore neural signalling; the absence of the mechanical transduction of
touch causing the developmental abnormalities. However, another possibility is that the Piezo2 mechanotransduction protein itself may also play a role in the structural development of LTMRs: in other words, the loss of the Piezo2 protein in the cellular membrane of DRG and peripheral end organs may cause the developmental deformities. But with Piezo2 being such a recent discovery, as well as ion channel imaging techniques with resolutions small enough such as electron cryo-microscopy only recently being introduced to the neuroscientific community,6 research on the exact structural mechanisms of the Piezo2 mechanotransduction protein is still being undergone. Further research into the structural and functional effects of Piezo2 will have to be conducted in order to elucidate the exact mechanism through which Piezo2 activation affects the development of LTMRs, but our Piezo2 cKO experiments suggest that through some physiological means, the Piezo2 protein plays a critical role in the normal development of touch–sensory neurons.
Additionally, although our data demonstrates a role for Piezo2 in first order DRG (skin-to-spinal-cord/brainstem) touch sensory neurons, there are still many open questions about how Piezo2 may affect downstream higher-order neurons found in the spinal cord, brainstem, and various brain regions. Future research into Piezo2’s effect on higher order neurons may shed light on how touch inputs impact brain development and the development of the perception of the sense of touch.
Furthermore, there are some differences between the touch system of mice and humans. For example, although Pacinian corpuscles are found broadly throughout the glabrous (non hairy) skin in primates and humans, they are typically not found in the skin of mice, instead appearing near certain bones. Additionally, human individuals who have been determined to have mutations in the PIEZO2 gene are found to have slightly less extreme phenotypic
effects of their mutation, being able to feel a few niche modes of touch, whereas Piezo2 mutant mice are believed to have nearly none. Further experiments clarifying certain differences in Piezo2 and PIEZO2 may be helpful in understanding the differences of the touch pathway in mouse models and the human population, but with the 95% homology between the two genes and the overall similarity of the phenotypic effects of the two genes, mouse models are a viable method of experimentation.
Conclusion
Through our experiments observing the changes in gene expression of DRGs in Piezo2 cKO and control mice, we found that the activation of Piezo2 is necessary for the normal development of the mouse touch pathway, suggesting that tactile stimulation may influence the development of touch sensory neurons in utero and during infancy in mammals. Consequently, touch deprivation may not just have psychological but physiological impacts on the development of infants. Further research into the gene and touchevoked activity will be important in determining the exact physiological risks of touch deprivation as well as differences in the neurodevelopment of children living with touch-related neurodisorders like ASD, in order to provide scientific backing for guidelines and support for childcare in communities around the world.
Bibliography
1) Albuerne M, De Lavallina J, Esteban I, Naves FJ, SilosSantiago I, Vega JA. Development of Meissner-like and Pacinian sensory corpuscles in the mouse demonstrated with specific markers for corpuscular constituents. Anat Rec. 2000 Mar 1;258(3):235-42. doi: 10.1002/(SICI)10970185(20000301)258:3<235::AID-AR2>3.0.CO;2-M. PMID: 10705343.
2) Bigelow AE, Williams LR. To have and to hold: Effects of physical contact on infants and their caregivers. Infant Behav Dev. 2020 Nov;61:101494. doi: 10.1016/j.infbeh.2020.101494. Epub 2020 Sep 20. PMID: 32966905; PMCID: PMC7502223.
3) Chisholm, K. (1998), A Three Year Follow-up of Attachment and Indiscriminate Friendliness in Children Adopted from Romanian Orphanages. Child Development, 69: 1092-1106. https://doi.org/10.1111/j.14678624.1998.tb06162.x
4) The Definitive Ish Guide. Advanced Cell Diagnostics. (n.d.). https://acdbio.com/referenceguide
5) Dennis, W. (1973). Children of the Creche. AppletonCentury-Crofts.
6) Liao M, Cao E, Julius D, Cheng Y. 2013. Structure of the TRPV1 ion channel determined by electron cryomicroscopy. Nature 504:107–12
7) Morgan, Jamie. (n.d.). Womb with a view: Sensory development in utero. Your Pregnancy Matters | UT Southwestern Medical Center.
https://utswmed.org/medblog/sensory-developmentutero/#:~:text=Touch,on%20the%20lips%20and%20nose.
8) Nelson C.A., Bos K., Gunnar M.R., Sonuga-Barke E.J.S. The neurobiological toll of early deprivation. Monographs of the Society for Research in Child Development.
2011;76(4, Serial No. 301):127–146. doi: 10.1111/j.15405834.2011.00630.x.
9) Norholt H. Revisiting the roots of attachment: A review of the biological and psychological effects of maternal skinto-skin contact and carrying of full-term infants. Infant Behavior & Development. 2020;60 doi: 10.1016/j.infbeh.2020.101441.
10) Office of the I.A.C.U.C. Harvard Medical School. (2023, February 23). https://iacuc.hms.harvard.edu/
11) Riquelme I, Hatem SM, Montoya P. Abnormal Pressure Pain, Touch Sensitivity, Proprioception, and Manual Dexterity in Children with Autism Spectrum Disorders. Neural Plast. 2016;2016:1723401. doi: 10.1155/2016/1723401. Epub 2016 Jan 5. PMID: 26881091; PMCID: PMC4736331.
12) Santiago C, Ginty D.D. et al. Activity-Dependent Development of the Body’s Touch Receptors.
13) Silbereis JC, Pochareddy S, Zhu Y, Li M, Sestan N. The Cellular and Molecular Landscapes of the Developing Human Central Nervous System. Neuron. 2016 Jan 20;89(2):248-68. doi: 10.1016/j.neuron.2015.12.008. PMID: 26796689; PMCID: PMC4959909.
14) Silvestri, V., Giraud, M., Macchi Cassia, V., & Nava, E. (2024). Touch me or touch me not: Emotion regulation by affective touch in human adults. Emotion, 24(4), 913–922. https://doi.org/10.1037/emo0001320
15) Szczot M, Nickolls AR, Lam RM, Chesler AT. The Form and Function of PIEZO2. Annu Rev Biochem. 2021 Jun 20;90:507-534. doi: 10.1146/annurev-biochem-081720023244. PMID: 34153212; PMCID: PMC8794004.
16) Wanner, M. (2024). 600 trillion synapses and alzheimers disease. The Jackson Laboratory. https://www.jax.org/news-and-insights/jaxblog/2018/december/600-trillion-synapses-and-alzheimers-
disease#:~:text=Each%20neuron%20has%2C%20on%20av erage,as%20high%20as%201%20quadrillion.