Eesha Sinha
Senior Thesis | 2025

Eesha Sinha
Senior Thesis
Mr. Ranney
2/3/2025
Factors Affecting Measurements Acquired by Remote Satellites using PLE/PLHR for Orbital Power Line Monitoring
I. Nomenclature
PLE = Power Line Emission
PLHR = Power Line Harmonic Radiation
RF = Radiofrequency
RGB = Red, Green, and Blue
LEO = Low Earth Orbit
VLF = Very Low Frequency
DEMETER = Detection of Electro-Magnetic Emissions
Transmitted from Earthquake Regions
CSES = China Seismo-Electromagnetic Satellite
UTC = Universal Time Coordinated
II. Introduction
With our world’s rapid urbanization, follows an increasing amount of power consumption. The growing use and dependence on power lines, the infrastructure providing this power, makes it even more important to effectively monitor the lines. Lines that aren’t properly monitored for malfunctions could result in blackouts and possibly wildfires. With the rise of power consumption, power line wildfires have increased even though they are very preventable. This is mainly because of current monitoring methods that are costly and not always accurate. A potential strategy would be to utilize satellites to pick up power line emissions (PLE) and Power Line Harmonic Radiation (PLHR). Power line emissions and power line harmonic radiation events have been noticed in several different satellite missions.
Power line emissions are electromagnetic waves at extremely low frequency (ELF) radiated by electric power systems at 50-60 Hz. Power line harmonic radiation events come from industrialized areas of the world and are transformed into low-frequency whistler range ionospheric waves. They refer to the harmonics of PLE, which are 50-60 Hz waves and that can penetrate into the ionosphere and magnetosphere, making them easily visible to LEO satellites. In fact, LEO satellites often pick up data to generate spectrograms, and looking at the 50-60 Hz lines when a satellite travels over a power line will reveal a horizontal line, and sometimes PLHR events occur and cause a horizontal line at the 100 or 120 Hz line to appear. DEMTER uses plasma wave spectrometers to carry out this task for the purpose of connecting electromagnetic emissions to earthquakes.
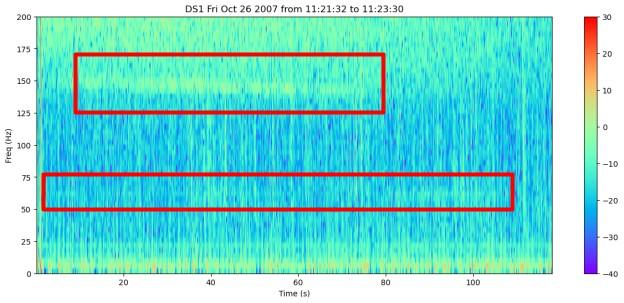
Figure 1: This what a PLE/PLHR events looks like on a spectrogram. At 50 Hz there is a clear horizontal line which indicates PLE and at around 150 Hz there is another which is at a harmonic of the 50-60 Hz reading and is therefore an example of a PLHR event. LEO satellites have the ability to read these waveforms and their data can be used to make spectrograms similar to Figure 1. LEO satellites traveling over any power line should have a PLE, PLHR events may vary, however.
Research has been done to analyze the usefulness of these events and how they can be applied to monitor power lines more effectively. One such example is work done on developing requirements for a predictive algorithm that can be used in low earth orbit satellites (LEO) to predict the occurrence of wildfires (Dahl et al., 2024). The use of PLE/PLHRevents were determined to be promising, as differences from nominal behavior may indicate the power line is faulting, which is a major factor in wildfires starting. Although satellite power line monitoring would be beneficial, the necessary factors for making PLE/PLHR measurements are poorly understood. This is because it is unknown what factors actually contribute to PLE/PLHR visibility. From previous work done on PLE/PLHR, there seems to be slight differences in measurements from just day to night (Zhao et al., 2022). Understanding the full extent of factors affecting PLE/PLHR visibility will reveal their viability in predictive algorithms as an indicator of power line damage. By performing statistical analyses between potential factors and PLE/PLHR visibility, we can improve our understanding of what makes PLE/PLHR measurements visible. This will in turn allow us to use them in algorithms to predict wildfires. This paper will start with examining longitude/latitude, specifically the electromagnetic field; this was chosen because of work proving a dayside-nightside ionosphere influence on the measurements. Additionally, this paper (inspired by the work of another paper) examines solar activity, which includes solar radio flux (F10.7 index) and the solar zenith angle (Zhao et al., 2022). Lastly, fire boundaries will be examined to see the ways anomalies to nature may also have effects on PLE/PLHR measurements.
III. Abstract
This paper seeks to answer whether factors such as longitude/latitude, solar activity, power outages, and fire
boundaries affect the visibility of PLE/PLHR measurements acquired by satellites. Data will be collected from the DEMETER satellite. We will look at data when the satellite orbited over power lines. This data will be used to analyze the potential correlations. This study will identify horizontal lines in spectrograms of this data, signaling a PLE/PLHR event, and after collecting an adequate sample size of around 85-100 events, several types of statistical analyses will determine which factors influence the presence of PLE/PLHR. Based on similar research done with other LEO satellites such as the CSES that traveled over China, it can be hypothesized that several of these factors, specifically the ones pertaining to solar activity, may have a significant effect on the PLE/PLHR visibility. This paper shows a slightly positive relationship between PLE/PLHR occurrence and some of the factors, such as latitude/longitude and solar flux, and later talks about how a larger sample size can elucidate the relationships more. This work will help shape future technological advancements in power line monitoring.
IV. Background
Several studies and publications explore topics closely related to the focus of this paper and provide a foundation for its further investigation. For example, past work was done on a possible predictive algorithm for power line maintenance. It examined if PLE/PLHR could be used to indicate anomalies (Dahl et al., 2024). The work hopes that the development of such algorithms could be implemented on small LEO satellites to help researchers further understand PLHR/PLE and how the ionosphere works. There seems to be a lack of understanding of which factors influence PLE/PLHR occurrence rates. Additionally, other work on these factors has determined that PLE/PLHR occurrence is affected by several different environmental conditions. A group of researchers from the National Institute of Natural Hazards and
Institute of Geophysics looked at the CSES satellite as it traveled over China and noticed overarching trends caused by solar activity.

Figure 2: This graph, obtained from Shufan Zhao and Hengxin Lu, summarizes their findings on dayside and nightside ionosphere fluctuation in PLE/PLHR occurrences. It depicts a clear difference between the night side and day side fluctuations. They also find the PLHR occurrence rate being affected by yearly electricity consumption, noticing an increasing PLHR occurrence
during the COVID-19 pandemic. They also saw a pattern with variation in PLHR occurrence rate, which they say could be attributed to the influence of several factors on the nightside lower ionosphere (Zhao et al., 2022). Other papers believe that factors such as electric pollution, which is undesirable static and alternating electric and magnetic fields resulting from pollution, may also affect this radiation (Viacheslav A. Pilipenko, E. N., 2021). So, while PLHR/PLE seems to follow patterns when isolated with different variables, there seem to be many factors that cause these variations. Many of these studies focus on a single country and therefore it is important to verify some of these findings as global trends (adding my datasets focus on the US to a larger dataset globally) while exploring them further. Because of the variations in the ionosphere, it helps to also focus on the magnetosphere by looking at latitude and longitude. Overall, this paper will further clarify and offer guidance towards the viability of PLHR/PLE’s importance and usefulness in power line wildfire predictive algorithms.
V. Methodology
a. Factors Examined
I chose several factors to examine that have either previously shown a correlation to PLE/PLHR occurrence rate. First, I examined latitude and longitude, theorizing that the variations in Earth’s electromagnetic field could have a similar effect as the nightside ionosphere and potentially cause a fluctuation in measurements. Second, I chose solar activity focusing on Solar radio flux (F10.7 index) and solar zenith angle. Solar zenith angle refers to the angle between the sun's rays and the vertical direction as shown in Figure 3. The F10.7 solar index refers to a measure of noise generated by the sun.

Figure 3: The diagram shows the solar zenith angle.
Next, I chose to examine fire boundaries checking to see if a fire was active at the point of time of a reading, hypothesizing that damage to power lines from active fires would also affect these measurements. Lastly, I looked at power outages to track what the readings appear to be in times of power line disturbance.
b. Data Collection (Method 1)
Data in this work was all gathered from the DEMETER satellite, a French satellite that collected data from 2004-2010. More specifically, I used the DEM_N1_1131 dataset, which contained data on the waveform of the VLF electric field. During the first round of obtaining data, I prioritized the collection of the data over accuracy and precision. I assumed that because of the US’s extremely dense amount of power lines, if any of the data featured latitudes and longitudes that went over the US, then they were most likely traveling over powerlines. However, as shown in Figure 4, this is only viable for points in the western and eastern coasts, and points further towards the midwest are very unlikely to be traveling over powerlines. This caused a big inconsistency while getting accurate results.

Figure 4: A picture of all the powerlines in the US. From the picture, there is a clear increase in power line density on the east and west coasts with a lesser density in the Midwest.
A mentor I worked closely with, who also did work in this field, was able to provide me with code that could generate spectrograms and parse the data from the DEMETER dataset. The use of spectrograms is essential to finding PLE/PLHR lines because on these graphs they appear as horizontal lines at the 50-60 Hz range and the harmonics of this frequency. Therefore, with the help of this algorithm, I could generate many spectrograms from this data and sort them based on PLE/PLHR occurrence. A single data point consists of one of DEMETER's 10-second (usually the snapshot is around this time) intervals. First, I tried to use STK to generate access reports to determine which packets were taken over the US. However, the access reports ended up being inconsistent with the DEMETER site containing the data, and I wasn’t able to generate the right data. I didn’t spend much time trying to discover the root of this issue because several of the intervals didn’t even exist when I mapped them (not over the US) and because there were other ways for me to optimally find US data. Instead, I examined the orbit of DEMETER and determined that most of the US points were in the interval between 18:00 and 19:00 UTC. Therefore, I
didn’t need STK to help me track data anymore. After I verified this method, I went back and began to improve the original code to increase efficiency, accuracy, and also allow me to examine factors beyond latitude and longitude. Another limitation of this method beyond inaccuracy is that most of the work was done manually. For example, calculating the fire perimeters required finding areas online and cross-referencing it with the average values of the points. Additionally, finding the solar flux for each day was done manually along with calculating the solar zenith angle. Because the angle was being calculated with an online calculator, it took a lot of time to generate different angles for several points. Together, the time and the inaccuracies and limitations made this method very inefficient.
c. Optimal Approach
To take a more accurate approach, I got rid of my assumption that all satellites traveling over the US are going over power lines. Instead, I accessed a shapefile from the USGS database that contained information on all US powerlines (CMRA, 2022). I created a code to parse through the data and return a list of all possible latitudes and longitudes that power lines were in. I then compared those to the extracted latitudes and longitudes from each DEMETER file. Although this was more accurate, I had to account for the fact that the satellites traveled a long distance in each file. At first, I was extracting a single (average) latitude and longitude from this distance. I had to adjust the ranges in order to truly see when the satellite traveled over the powerline. To do this, I added a buffer and extracted the quartiles and medians of the latitude and longitudes from each file.
After this, I obtained a shapefile that contained shape areas for all the US wildfires from the year 2000 - 2018. With this data, I created another algorithm that could parse through the files and create a file of all possible latitudes and longitudes in which US fires occurred. Here, I ran into a similar problem as I did before, so
I made necessary adjustments to ensure the code was able to produce viable results. The algorithm is able to parse through the data and verify whether the satellite travels through a range of data points around the center of previous fire areas and power lines in the US. For wildfire perimeters, the algorithm currently is true for points within 50 miles from the points. Additionally, points that are 10 meters away from any powerline are also included. It's important to note that this method may lead to a slight discrepancy because a few events that do travel over the line may cause an inaccurate dataset. A possible way to improve this is to get rid of the averaging method and replace it with a more accurate method, where every latitude and longitude point in the file is tested and verified. It's important to keep the range relatively small so that the assumption from the first method, that all points in the US are traveling over powerlines, is avoided. Because the averages are used to obtain the true or false (if it is over true or else false) it becomes necessary to account for this distance.
The algorithm also obtains the solar flux (F10.7) for each day the data occurs on. Solar flux data is obtained from the National Oceanic and Atmospheric Administration. The algorithm additionally calculates the solar zenith angle. Figure 6 displays a summary of the algorithms used in this project.
Figure 5 displays the formula used to calculate the angle for the certain data. In this formula, θe is the local zenith angle in degrees, β is arccos(cos(φ – φ0) * cos(λ - λ0)) in degrees, (φ0, λ0) is the satellite subpoint latitude and longitude on Earth in degrees, (φ, λ) are the viewpoint latitude and longitude on Earth in degrees, H is 42164.16, the satellite altitude from the center of the Earth, in kilometers, and req is 6378.137, the length of semi-major axis of the Earth, in kilometers, assuming a GRS80 ellipsoid for the Earth. We use the average longitudes and latitudes, calculated previously, as (φ, λ).

Figure 5: The equations used to calculate the solar zenith angle. The solar zenith angle is between the line from a viewpoint on the Earth’s surface to a satellite and the line from the same viewpoint that is perpendicular to the Earth’s horizontal surface at that point. The local zenith angle ranges from 0 to 90 degrees and is calculated using spherical geometry with the equation below. The Earth’s oblateness is ignored in the equation above.
Additionally, height (DEMETER altitude) is calculated from the original dataset and is the average of the heights over a certain time interval.
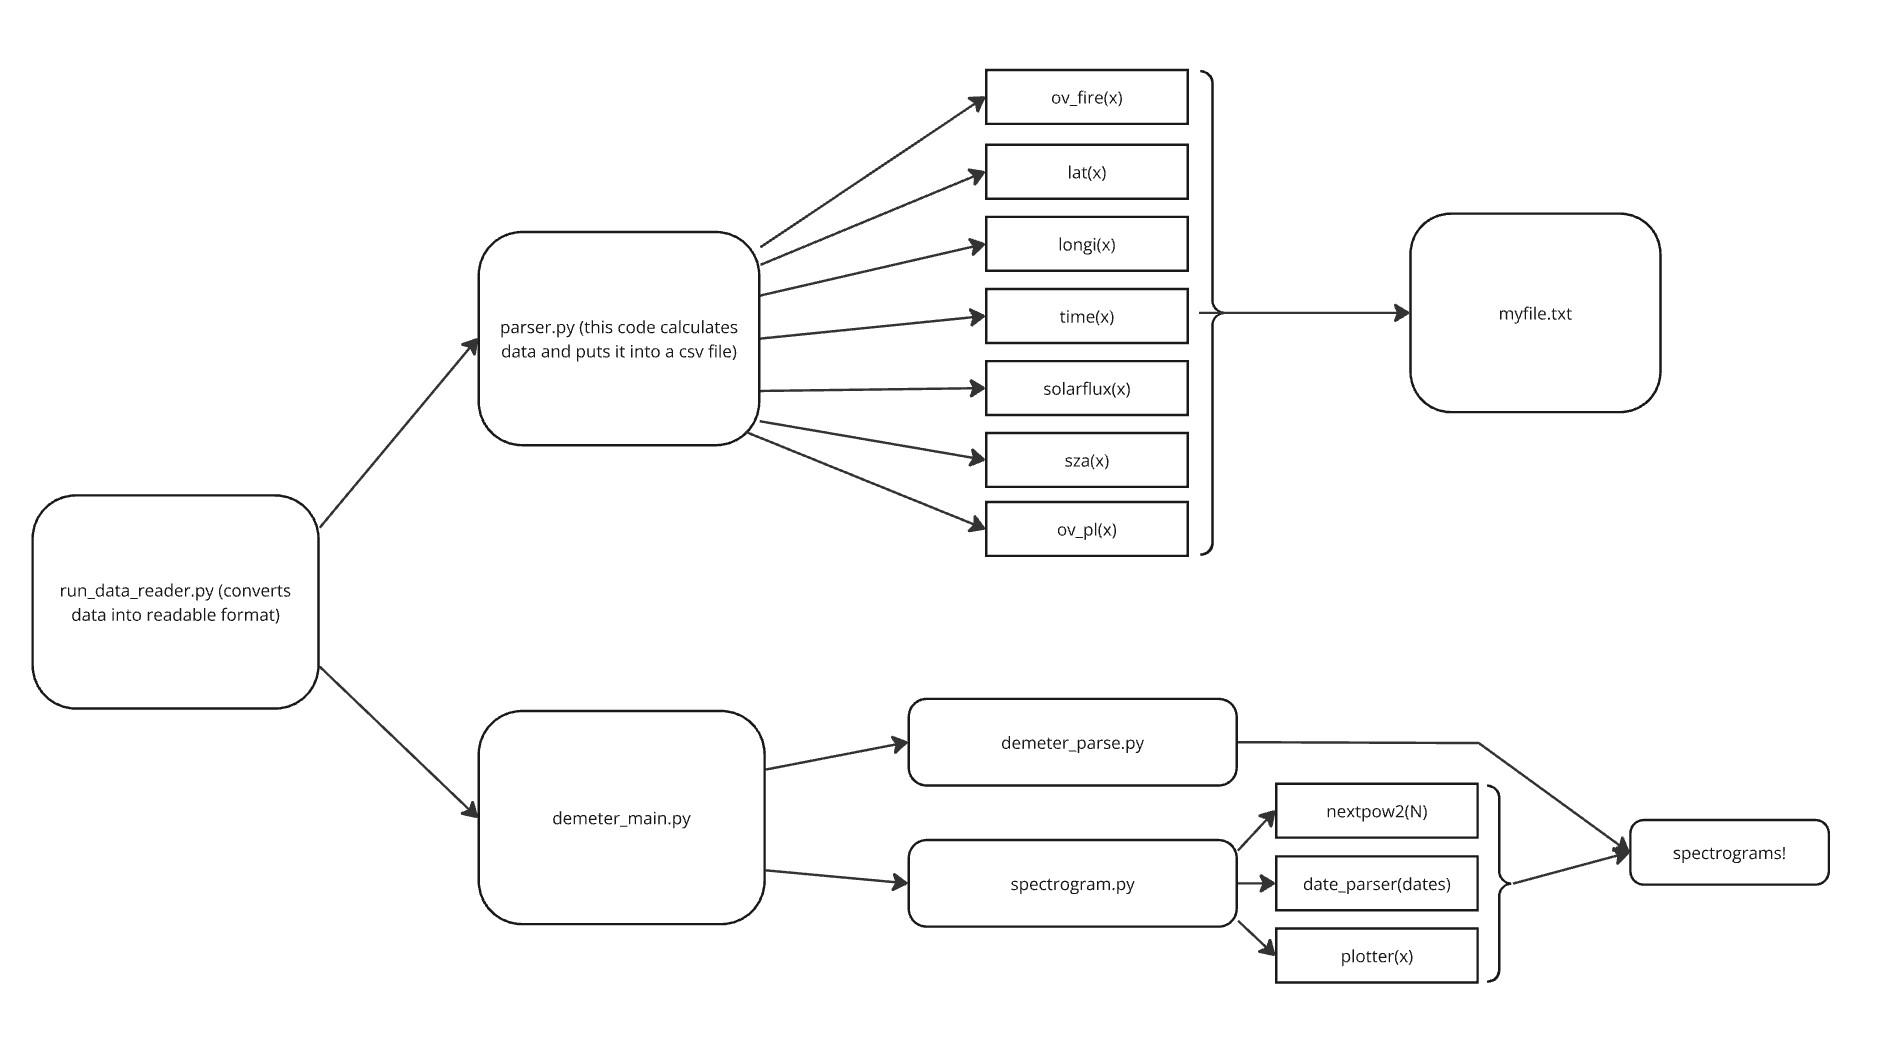
Figure 6: This is a map of the algorithms used in this project. The main run_data_reader.py converts the data into a readable formula. After this parser.py is in charge of parsing through all the data and extracting the necessary data. Within this code are 7 main functions that carry out these tasks: ov_fire, lat(x), long(x), time(x), solar flux(x), sza(x), and ov_pl(x). Each input is a different file and after the code parses through a whole
folder of different files, representing separate interval instances, it outputs all of the information into a csv file. The algorithm below, demeter_main.py, was obtained from my mentor. This code contains the functions demeter_parse.py and spectrogram.py. To summarize, demeter_parse.py functions similarly to the parser.py function, however, only obtains waveform data, the data necessary for spectrograms. Using this data, spectrogram.py creates graphs for each file using the nextpow2(N), date_parser(dates), and plotter(x) functions to do so. The final output of demeter_main.py is a spectrogram.
Currently, checking the visibility of PLE/PLHR lines is being done manually by checking visibly if there is a horizontal line. In future work, this process will be replaced with an autonomous method.
d. Statistical Approach
My final data set consisted of 105 points of data. The independent variables are the different factors: flux, zenith angle, power line locations, and fire perimeters. The dependent variable is the PLHR/PLE occurrence: either a Yes or No for if a PLE/PLHR event is occurring in that packet of data. Each data point consisted of one-time interval of data, which is the usually around 10-second interval DEMETER had readings for, and had the date that the packet occurred, the average latitude, the average longitude, the solar flux for that day, the solar zenith angle for the date, a True/False for if the data point is over or not over a powerline, and a True/False for if the data point is over or not over a fire perimeter. Additionally, spectrograms were calculated for each point and were used to verify power line emission events. For this project, the hypothesis is accepted if a correlation is found between PLE/PLHR occurrence rate and any of the factors. The null
hypothesis is accepted if there is no established correlation between PLE/PLHR occurrence rate and any of the factors.
First, I decided to calculate the P-value - a statistical measure useful for hypothesis tests - for the data set, using Matplotlib and the graphing tool. If the P-value is less than 0.05, I reject the null hypothesis, then the data is not normally distributed, and likely will not be proved through linear regression analysis. Because a limitation of this project was an adequate sample size, I also analyzed the regression coefficients and considered the 10% confidence interval when assessing whether these correlations were likely.
VI. Results
Figure 7: A table summarizing the statistical approach of this project and contains referenced data.
The first factor I examined was latitude and longitude, more specifically the electromagnetic field, using the binary variable of PLE/PLHR occurrence as my dependent variable. Because of the P-values, as shown in Figure 7, for latitude and
longitude, I concluded that although there seems to be a small effect or relationship between the two variables, and power line emission lines, it is not significant enough to confidently say there is a relationship. However, as the latitude for PLE and longitude for PLHR are close to being statistically significant, it would be best to repeat this experiment with a larger sample size to see if there is a stronger correlation. Next, I looked at the solar zenith angle. For the solar zenith angle, I was able to determine a very slight positive correlation between the solar zenith angle and PLE/PLHR occurrence. Lastly, I looked at the solar flux, where I observed a very similar relationship with PLE/PLHR as I did with the solar zenith angle. Although the relationship wasn’t statistically significant like the other data, there did seem to be a positive correlation trend between the flux and PLE/PLHR occurrence.
VII. Discussion
After seeing slight positive correlations from each independent variable, the idea that PLE/PLHR occurrence may be affected by several different factors seems much more likely. As the effects of global warming become more prevalent in our modern-day society, it is becoming increasingly necessary to find ways to mitigate the effects of these fires and prevent them from occurring. The California wildfires are the most significant current example of the increasing dangers of these fires. In particular, the Hurst Fire, Eaton Fire, Kenneth Fire, and Palisades Fire have been caused by power line fires and a lack of proper maintenance. Several acres of land and lives have been lost to these disasters, which are easily preventable with proper maintenance. One possible solution that has gained popularity for its potential in power line maintenance is the use of PLE/PLHR. The ability to monitor power lines from LEO satellites not only makes surveying much more efficient but will also be a much cheaper alternative to
deployed drones, which can be very costly. This paper shows that the use of this method may be worth looking into because it is able to signify monitoring, however, there are several factors beyond the ones discussed by other papers that seem to have an effect on the occurrence rates of PLE/PLHR. Therefore, it is crucial to consider the effects of other factors when implementing this method into any predictive algorithm.
This paper shows that although it may be difficult to implement PLE/PLHR as an algorithm, it is certainly possible. For applications of this work in different projects, it may be worthwhile to examine the effectiveness of a LEO satellite to predict power line maintenance and see to what extent the factors examined above cause inaccurate results. Additionally, it’s important to see what degree of accuracy it has (is maintenance needed or not at the spot predicted) and if it's even worth implementing compared to other known methods. Even if PLE/PLHR isn't viable for use in LEO satellites for predictive technology for wildfires caused by power lines, it could still help identify locations of possible power line maintenance. However, further investigation is needed to determine if this method outperforms alternatives. Additionally, it is worth noting that the results of this project do not have a large sample size. The data may also be inaccurate if the satellite is traveling over a power line or a fire. It would be worthwhile to verify these results with a larger sample size. Additionally, this project focuses on not only when the DEMETER satellite travels over the US. Other work has been done on CSES over China, so it would be good to verify if patterns are regional or unique to a certain satellite, and if they do differ in what ways and why.
Acknowledgments
I want to give a huge thank you to my mentor Mary Dahl for her mentorship and support for this project.
References
Canada. “Daily Flux Values.” Spaceweather.gc.ca, 2024, www.spaceweather.gc.ca/forecast-prevision/solarsolaire/solarflux/sx-5-flux-en.php. Accessed 24 Sept. 2024.
Dahl, Mary. Machine Learning Algorithm and Multi Sensor Suite for Orbital Power Line Management and Wildfire Prediction. 4 Jan. 2024, https://doi.org/10.2514/6.20242272. Accessed 24 Sept. 2024.
“Index of /Stp/Space-Weather/Solar-Data/Solar-Features/SolarRadio/Noontime-Flux/Penticton/Pen ticton_adjusted/Listings.” Noaa.gov, 2018, www.ngdc.noaa.gov/stp/space-weather/solar-data/solarfeatures/solar-radio/noontime-flu x/penticton/penticton_adjusted/listings/. Accessed 24 Sept. 2024.
Kandanaarachchi, Sevvandi, et al. “Early Detection of Vegetation Ignition due to Powerline Faults.” IEEE Transactions on Power Delivery, vol. 36, no. 3, 1 June 2021, pp. 1324–1334, ieeexplore.ieee.org/abstract/document/9132643?casa_token =YS1LoljfvnUAAAAA:eekJ NQVIc8m2dOxl6ulKSKujjgXCY60BSgqFB3jyciH1M67AhoOOJCvHKipH5EEW1b5gfTOl8d7, https://doi.org/10.1109/TPWRD.2020.3006553. Accessed 14 Aug. 2023.
Kostrov, A V, et al. “Generation and Radiation of High Power Line Harmonics.” Geomagnetism and Aeronomy, vol. 57, no. 4, 1 July 2017, pp. 482–490, https://doi.org/10.1134/s0016793217030094. Accessed 19 Aug. 2024.
“LISIRD.” Colorado.edu, 2024, lasp.colorado.edu/lisird/data/noaa_radio_flux. Accessed 24 Sept. 2024.
Nguyen, Van Nhan, et al. “Automatic Autonomous Vision-Based Power Line Inspection: A Review of Current Status and the Potential Role of Deep Learning.” International Journal of Electrical Power & Energy Systems, vol. 99, July 2018, pp. 107–120, https://doi.org/10.1016/j.ijepes.2017.12.016.
Pilipenko, Vyacheslav, et al. “Electromagnetic Pollution of NearEarth Space by Power Line Emission.” Solar-Terrestrial Physics, vol. 7, no. 3, 28 Sept. 2021, pp. 105–113, https://doi.org/10.12737/stp-73202107. Accessed 28 Jan. 2022.
Wong, K L, et al. “A Novel Autonomous Technique for Early Fault Detection on Overhead Power Lines.” IEEE Xplore, 1 Nov. 2019, ieeexplore.ieee.org/document/9079376. Accessed 24 Mar. 2023.
Zhang, Yong, et al. “Automatic Power Line Inspection Using UAV Images.” Remote Sensing, vol. 9, no. 8, 10 Aug. 2017, p. 824, https://doi.org/10.3390/rs9080824.
Zoko Ble, Frank, et al. “Detection and Localization of Arcing Fault Radiated Electromagnetic Using Antennas and Wavelet Analysis.” International Review of Electrical Engineering (IREE), vol. 9, no. 6, 31 Dec. 2014, p. 1128, https://doi.org/10.15866/iree.v9i6.4588. Accessed 9 Feb. 2023.
Zhao, S., Liao, L., Shen, X., Lu, H., Zhima, Z., Huang, J., & Zhou, C. (2022). CSES satellite observations of 50 Hz power line radiation over Mainland China and its response to COVID19. Journal of Geophysical Research: Space Physics, 127, e2022JA030693. https://doi. org/10.1029/2022JA030693.