Proviruses
to Model Variation of Transcription and Latency Across Different HIV Subtypes
Ally Tian
Senior Thesis | 2025

Generating HIV Proviruses to Model Variation of Transcription and Latency Across Different HIV Subtypes
Ally Tian
Andrew J. Henderson Lab on Boston University’s Medical Campus
Dr. Andrew J. Henderson and Dr. Daniel Bryant
Abstract
Since the development of antiretroviral therapies (ART), people living with human immunodeficiency virus (HIV) have been able to live longer and healthier lives. However, a cure for HIV still does not exist. ART treatments can prevent further viral replication within the host, but it remains unable to eradicate the virus from all infected cells. Among infected cells in the host, a subset becomes latently infected. If ART treatment is paused or discontinued, the latent reservoir immediately reactivates and supports the rebound of the virus and HIV progression. This latent reservoir of cells is what primarily contributes to the chronicity of HIV and needs to be resolved in order to develop an HIV cure. Most of what is understood about HIV latency comes from laboratory strains of HIV subtypes from the U.S. or Western Europe, which represent only a small percentage of HIV types. How regulatory sequences from other HIV clades regulate transcription and latency has not been carefully studied. The primary transcriptional element that regulates HIV transcription is the long terminal repeat (LTR), therefore understanding how different LTRs affect expression of the virus – especially generation of latent virus – is essential to discovering a cure. In this project, we generated proviral expression plasmids with LTRs from different clades. We were interested in the impact of the different LTRs on HIV’s transcriptional efficiency, latency establishment, and ability to be reactivated. Preliminary results demonstrated that the LTRs respond differently to latency reversing agents (LRAs), which once further investigated could inform targeted, subtype-specific latency reversal treatments of HIV.
Introduction
Human immunodeficiency virus (HIV) has been an extremely widespread and impactful epidemic since it was shown in 1981 to be the causative agent of Acquired Immunodeficiency Syndrome (AIDS), which leads to diminished CD4+ T cells, immune dysfunction, and death resulting from opportunistic infections. In 2023, over 40 million people were living with HIV around the world, and 1.3 million new cases were confirmed (1).
When HIV attacks the immune system, it targets cells with CD4 receptors (CD4+ cells). CD4+ helper T cells are the most susceptible to HIV infection, but macrophages, monocytes, and dendritic cells are also vulnerable. HIV uses these cells to replicate but causes cell death in T cells after, directly contributing to associated immune deficiency. HIV also alters the function of the other cells, including macrophages, in producing inflammatory molecules and antigen presentation. Since the main targets of HIV are vital to immune system activity, unrestricted HIV endangers the body by making it more susceptible to opportunistic infections and cancers that the immune system would otherwise be able to counter. Left untreated, HIV progresses to AIDS and death.
HIV is a retrovirus and requires a host cell in order to replicate and infect other cells. Its replication cycle consists of seven steps: binding, fusion, reverse transcription, integration, replication, assembly, and maturation (Figure 1). Infection is initiated when glycoprotein 120 on the virion envelope (Env) binds to the CD4 receptor and the CXCR4 or CCR5 chemokine coreceptors of a host cell. Once bound, fusion of the virion and host cell lipid
membranes is initiated and HIV enters the cell. The entering virus coated in a capsid structure is hypothesized to engage the host nucleus to carry out reverse transcription, a HIV-mediated process to generate double-stranded cDNA from the RNA genome of HIV. This viral cDNA is integrated into the host DNA by HIV integrase. After the viral DNA becomes permanently embedded in the host genome, it is transcribed and translated by the host cellular machinery. Some of the transcribed RNA remains as the genetic material of the soon-to-be-created virion, reflecting differential splicing mediated by viral protein Rev, while the remaining mRNA is translated into viral products such as proteins and enzymes. The transcribed and translated products then migrate towards the surface of the host cell for assembly. A viral capsid assembles around the genome of the virus, and the new virion buds from the membrane of the host cell. HIV-encoded protease targets the capsid, establishing a mature infectious HIV particle that infects other cells. As HIV continues to infect more CD4+ cells, it weakens the immune system of the host, mediating complications including but not limited to increased susceptibility to inflammation, aging, and cardiovascular disease (2).

Figure 1: Diagram depicting the HIV life cycle and replication steps. Figure provided by Dr. Daniel Bryant.
Antiretroviral therapies (ART) target the various steps of the HIV life cycle in order to block infection. Based on investigations into the functions of restriction factors, which are endogenous cellular inhibitors, useful targets for ART have been discovered, and the functions of these innate inhibitors can be manipulated or mimicked in ART (3). Drugs that inhibit viral attachment, membrane fusion, reverse transcription, integration, and maturation all exist. These treatments have proven to be effective in preventing active HIV replication and decreasing the viral load of a person, allowing people with HIV to live longer and healthier lives (4). However, some cells infected by HIV enter a latent state, in which the viral genome is incorporated into the host yet not
expressed due to multiple mechanisms that influence transcription, translation, and assembly (5). One of the largest pitfalls of current treatment options is that pausing treatment immediately allows latent virus to reactivate and support the rebound of HIV, causing a surge in a person’s viral load. Because of the impact that latency has on the chronicity of HIV, latently infected cells need to be eliminated in order to cure HIV.
The latent reservoir is formed when infected activated CD4+ T cells transition to a persistent long-lived resting memory state. In this form, proviral gene expression is limited by an abundance of repressive transcription factors such as NLF2 and NLF3, as well as a lack of positive transcriptional regulators such as preferentiallyactivating PLAGL1 (6). Because of this relationship between transcriptional factors and latency, understanding the events of HIV transcription is vital to developing a cure.
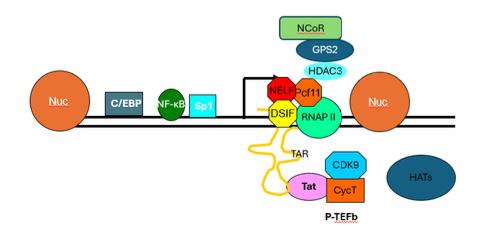
Figure 2: Diagram depicting the HIV transcriptional start site and main transcriptional machinery, including the two main nucleosomes (Nuc-0 on the left and Nuc-1 on the right), initiation factors such as NF-κB, RNA polymerase II, transcriptional repressors such as NELF and DSIF, and many other transcription factors. Figure provided by Dr. Andrew J. Henderson.
Long terminal repeats (LTRs) have been shown to be required for transcription regulation of HIV and may be a mediator of latency. The LTR is responsible for recruiting transcription factors that regulate RNA polymerase II (RNAP II) elongation (7). The random fluctuations in gene expression caused by the cis-acting LTR in HIV-1 are amplified by the trans-acting Tat positive feedback loop. Tat is a viral-encoded protein that enhances proviral transcription and transcription elongation (8). Both Tat (pink in Figure 2) and initiator protein NF-κB (dark green in Figure 2) play important roles in the transcriptional activation of LTRs. The negative elongation factor NELF (red in Figure 2) causes RNAP II to pause
directly after initiation of transcription, producing short and incomplete mRNA transcripts. These pauses cause build-up of RNAP II at the promoter 5’ LTR. Because it prevents full transcription of the integrated HIV proviral genome, NELF serves a major role in latency maintenance. This is typically overcome in transcriptionally active HIV by the combined activity of NF-κB and Tat. NF-κB first removes heterochromatin blocks and enhances the recruitment of RNAP II to the LTR promoter, which then allows Tat to facilitate synthesis of full-length transcripts by recruiting P-TEFb and the superelongation complex to hyperphosphorylate the RNAP II carboxyl-terminal domain (CTD). This process also removes NELF to dramatically enhance LTR transcriptional elongation. Tat strongly affects both elongation restriction when absent and elongation efficiency when present (7). Direct correlations between NF-κB binding sites in LTRs and the transcriptional strength of HIV have also been noted (8). Additionally, enhanced transcriptional strength of the LTR has been demonstrated to cause faster latency establishment (8).
Chromatin structure and epigenetic regulation also impact the transcriptional efficiency of HIV. Decreasing NELF has been correlated with displacement of positioned nucleosomes and increased acetylation of histone H4, which suggests a relationship between transcription elongation and chromatin remodeling (9). When nucleosomes are loosely positioned as in euchromatin, transcription is able to proceed normally. However, if they are more tightly wound into heterochromatin, it is more difficult for transcriptional factors and polymerases to access and transcribe the DNA. In HIV, there are two main nucleosomes positioned around
the transcriptional start site (TSS), referred to as Nuc-0 and Nuc-1. Nuc-0 is positioned before the TSS, while Nuc-1 is within the transcribed region. When Nuc-1 harbors epigenetic marks associated with “closed” chromatin such as methylation, this creates a barrier for efficient RNAP II activity. When the structure is loosened by epigenetic marks including histone acetylation, Nuc-1 opens up, allowing RNAP II to efficiently transcribe HIV. When Nuc-1 is closed, HIV DNA is present in the structure yet not capable of being expressed because RNA polymerase activity is blocked. The dynamic regulation of Nuc-1 has made this a prominent target for the “shock-and-kill” treatment to purge the latent reservoir (10). In these treatments, latently infected viruses are reactivated through various methods so that other existing drugs are able to target and eliminate the virus.
In a recent massively parallel reporter assay (MPRA) performed in collaboration with Drs. Fuxman Bass (BU Dept of Biology) and Tewhey, a library consisting of over 6000 promoter DNA sequences corresponding to multiple HIV-1 clades was screened to determine and rank their abilities to support transcription. MPRAs are an effective tool for identifying, localizing, and validating sites modulating gene expression in the human genome (11). The MPRA tested the activity of cis-regulatory elements (CREs) like the HIV LTRs by introducing the sequences upstream of a minimal promoter and a reporter gene carrying 3’UTR barcodes. The barcodes were then sequenced and normalized to identify CREs affecting transcription. The LTRs we cloned into HIV plasmids were chosen from the results of this MPRA, because they represented a range of transcriptional activity. Since these
sequences expressed at varying levels when tested in the MPRA, we expected them to affect HIV expression in a similar way.

Figure 3: The MPRA results showed peaks in transcriptional activity in the LTR regions, as shown in the graph in the top left. The graphs on the bottom left depict the levels of activity measured in four different regions of the sequences including part of the modulatory, the enhancer, promoter, and leader regions, with the most promotional activity occurring in Regions 1 (251-450 bp) and 2 (376-575 bp) for all tested clades. The sequence alignment on the right compares the original NL43 LTR sequence (top) to the 5 LTRs to be cloned in our experiment, with the most active regions – Region 1 and 2 – of the LTRs underlined in black and red, respectively. The NL43-ΔEnv-GFP, KF7, and MH7 LTRs that are discussed in this report are listed 1st, 2nd, and 6th respectively.
Figure provided by Drs. Daniel Bryant and Juan FuxmanBass.
We validated the MPRA results by building HIV viruses with five LTR regions from different clades that reflect a range of activity (Figure 3) with the end goal of determining how various LTRs affect expression of the virus and latency after infection. This report specifically discusses the processes used to generate cloned plasmids with the KF766540 LTR (KF7 LTR), a 766 bp-long sequence belonging to HIV clade C. We employed two experimental strategies to obtain the clones, the second of which was successful. After cloning with the LTRs, we transfected human embryonic kidney (HEK) cells with the plasmid viruses to package infectious virions. These particles were then used to infect CD4+ T cells, and we monitored LTR expression level through measuring and comparing Green Fluorescent Protein (GFP) fluorescence. After, latent infections established in cells were reactivated using various latency reversing agents (LRAs) to test how strongly each LTR virus responded to different methods of reactivation. This report focuses on the data collected from the cloned clade-C KF7 and clade-A2 MH705163 (MH7) LTR viruses, as well as the original clade-B NL43-ΔEnv-GFP virus. We predict that these studies will help model and inform strategies to target LTRs from different HIV subtypes that have evolved in order to improve HIV treatment options.
Methods
1. Cloning Viruses
LTRs were cloned into NL43-ΔEnv-GFP plasmids, an HIV reporter plasmid that contains a sequence expressing the GFP gene.
Overview
We designed a method to generate a complete final plasmid containing the desired KF7 LTR sequence by first generating a backbone vector (referred to as Vector) using a dual restriction enzyme digestion (Figure 4). A set of nested PCRs were utilized to amplify the remaining piece of backbone DNA preceding the original 3’ LTR, before an overlap extension procedure was used to combine the last piece of backbone with the amplified LTR insert; the complete piece is referred to as the Insert (Figure 4). HiFi Plasmid Assembly was used to join the Vector and Insert, creating the complete plasmid containing the desired KF7 LTR.

Figure 4: Visual representation of the steps and methods used in cloning for Experiment 2. Q5 PCR was first used to amplify an extra CspCI cutsite (yellow) from the original NL43-ΔEnv-GFP because the CspCI 6 restriction endonuclease needs two cutsites present in a reaction to perform a cut. Then, a dual restriction enzyme digestion reaction was performed on the original NL43-ΔEnv-GFP using the enzymes CspCI and XhoI, cutting out the Vector (green). The nested PCR and overlap extension PCR processes were used to create the Insert (blue and purple) containing a backbone piece (blue) and the KF7 LTR (purple). The Vector and Insert were finally joined together by HiFi plasmid assembly to create the new recombinant plasmid containing the desired KF7 LTR (purple). Figure created by student researcher.

Figure 5: Table listing the names and sequences of all primers used in the KF7 cloning method. Each reaction used both a forward (fwd) and reverse (rev) primer. Figure created by student researcher.
Q5 Polymerase Chain Reactions (PCRs)
25 μL Q5 PCR reactions were used to amplify two fragments, one being a CspCI cutsite generating a restriction enzyme target for the dual restriction digestion, and the other being the KF7 LTR. 12.5 μL of Q5Ⓡ High-Fidelity 2X Master Mix, 9 μL of nuclease-free water, and 1μL of 1 ng/μL template DNA were used in both reactions. The remaining 2.5 μL were filled with 2.5 μL of the respective primers for each fragment. In the CspCI cutsite reaction,
NL43-ΔEnv-GFP plasmid was used as the template and “CspCI cutsite fwd” and “CspCI cutsite rev” were the primers (Figure 5). In the KF7 LTR reaction, the 7
LTR was used as the template and “KF7 LTR fwd” and “KF7 LTR rev” were the primers (Figure 5). Each set of primers was diluted with nuclease-free water in a 1:5 ratio.
The CspCI cutsite fragment reaction was run in the thermocycler using the following procedure: the process was initiated at 98℃ for 30 seconds, then denaturation occurred at 98℃ for 10 seconds followed by annealing and extension at 72℃ for 10 seconds, cycled 35 times. Final extension was completed at 72℃ for 2 minutes.
The KF7 reaction was run in the thermocycler using the following procedure: the process was initiated at 98℃ for 30 seconds, then denatured at 98℃ for 10 seconds, annealed at 67.7℃ for 20 seconds, and extended at 72℃ for 3.5 minutes a total of 35 times. After the cycles were completed, final extension was done at 72℃ for 3 minutes.
Nested Polymerase Chain Reactions
Q5 Master Mix was used to run the nested PCRs for the backbone of the Insert in order to work around the polypurine tract (PPT), a short and highly-repetitive sequence of DNA important to the HIV viral genome yet prone to mutation when directly added to a PCR as part of the template DNA. The first section of the fragment –Nested 1 – was amplified directly from the original template plasmid NL43-ΔEnv-GFP, stopping right before the PPT using the
primers “Nested 1 fwd” and “Nested 1 rev” (Figure 5). Nested 2 used the Nested 1 product as the DNA template and the primers “Nested 2 fwd” and “Nested 2 rev” (Figure 5). The primers for the Nested 2 procedure contained the PPT sequence as an overhang not bound to the template (Figure 6). This allowed the PPT to be incorporated into the amplified DNA with minimal mutation. All primers used in these reactions were diluted with nuclease-free water in a 1:5 ratio, and the same 25 μL reactions as for the Q5 PCRs were run.
Nested 1 was run in the thermocycler using the following procedure: heat to 98℃ for 30 seconds, then denature at 98℃ for 10 seconds, anneal and extend at 72℃ for 20 seconds, cycled 35 times. Final extension was completed at 72℃ for 3 minutes.
Nested 2 was run in the thermocycler using the following procedure: heat to 98℃ for 30 seconds, denature at 98℃ for 10 seconds, anneal and extend at 72℃ for 20 seconds, cycled 30 times. Final extension was completed at 72℃ for 3 minutes.

Figure 6: Diagram showing the process for the nested 2 PCR, using the double-stranded nested 1 product (red) as the template for the nested 2 primers (dashed orange, containing PPT overhang) to synthesize whole doublestranded nested 2 (solid orange). Figure created by student researcher.
Overlap Extension PCR
The backbone of the Insert amplified through nested PCR was merged with the Q5 PCR-amplified KF7 LTR using an overlap extension PCR. Using a DNA sequence present in the ends of both the backbone and the KF7 LTR to overlap the two fragments, complementary sequences between the fragments were annealed and served as primers to initiate elongation.
First, the normal Q5 PCR protocol was followed using 1 ng of the nested PCR product and 5 ng of the KF7 LTR, but with no added primers. This reaction was run in the thermocycler using an
annealing step at 62℃ for 20 seconds and an extension step at 72℃ for 30 seconds cycled 15 times. A final extension was completed at 72℃ for 2 minutes. The “KF7 Insert fwd” and “KF7 Insert rev” primers (Figure 5) were added to the reaction mixture and a regular Q5 PCR was run for 30 cycles using an annealing and extension step at 72℃ for 30 seconds. This process produced the final completed Insert to be used in plasmid assembly.
Dual Restriction Digestion
A dual restriction digestion was performed to obtain the Vector from the original plasmid NL43-ΔEnv-GFP. The restriction enzymes used were CspCI and XhoI, which each cut the plasmid at their respective cutsites during the reaction. The mixture for the reaction had a volume of 50 μL and consisted of 1.4 μL of the original plasmid NL43-ΔEnv-GFP at a dilution of 727.2 ng/μL, 5 μL of 10X CutSmart NEBufferⓇ, 36.6 μL of nuclease-free water, 5 μL of the extra CspCI cutsite PCR, and 1 μL each of the two restriction enzymes CspCI and XhoI. This mixture was incubated at 37℃ for 30 minutes, then heat-inactivated at 65℃ for 20 minutes, which cut the original NL43-ΔEnv-GFP at the CspCI and XhoI restriction enzyme cutsites on NL43-ΔEnv-GFP to produce the Vector.
Agarose Gel Electrophoresis and Extraction
Agarose gel electrophoresis confirmed the identities of the dual restriction digestion product (the Vector) and the overlap extension PCR product (the Insert). The gel for the Vector was a 0.75% gel, and the gel for the Insert was a 1% gel. The gels were prepared with and ran in a Tris base, acetic acid, and EDTA buffer solution
(TAE). Gels were run at 100V for about 25 minutes before imaging with the Gel Doc XR+ Gel Documentation System and Image Lab Image Capture software. Comparing the bands below the wells filled with Q5 PCR products to the bands resulting from the flanking DNA Ladders, the lengths and therefore identities of both the Vector and Insert could be confirmed. Gel extractions were performed to obtain both DNA fragments. The agarose gels were placed over a UV light tray, and the portions of the gels containing the visible DNA bands were cut out using a sterile scalpel. The DNA extraction followed the instructions from the New England Biolabs MonarchⓇ DNA Gel Extraction kit to obtain purified DNA for both the Vector and the Insert fragments.
Plasmid Assembly
The NEBuilderⓇ HiFi DNA Assembly Protocol was used to combine the individual fragments of DNA into a complete plasmid. For the reaction, 100 ng of the Vector (serving as the vector) and 27 ng of the Insert (serving as the insert) were combined with 10 μL of NEBuilder HiFi DNA Assembly Master Mix and deionized water until the total volume of the reaction was 20 μL. The mixture was then incubated in the thermocycler at 50℃ for 15 minutes. A HiFi Positive Control mixture consisting of 10 μL of HiFi Master Mix and 10 μL of NEBuilder Positive Control was used to ensure that the HiFi was working.
Heat-shock Transformation
Heat-shock transformations were used to transform the newlyassembled plasmid containing the KF7 LTR into chemically
competent K12 E. coli in order to clone the plasmid DNA. 2 μL of the HiFi Assembly reaction were added to the E. coli in a transfer tube and placed on ice for 30 minutes. Then, the tubes were moved to submerge the E. coli and HiFi mixture in a 42℃ water bath for 30 seconds. Immediately after, the tube was returned to ice for 2 more minutes. After icing, 350 μL of Super Optimal Broth with Catabolite Repression (SOC) medium was added to the tube and mixed by shaking for 1 hour at 30℃/225 rpm. This helped the E. coli recover after the transformation and increased transformation efficiency for the plasmids.
The transformed E. coli containing the desired plasmid were then grown up to colonies in plates. 200 μL of the transformation mixture were added dropwise and evenly spread across the base of the plate using sterile beads. These steps were done by a Bunsen burner to maintain sterility. Once the E. coli were spread across the plate, the sterile beads were removed, and the plate was placed in a 30℃ incubator to grow colonies overnight. A control was also performed with pUC19 plasmids to ensure that the transformation process worked.
Colony PCR and Agarose Gel Electrophoresis
After the transformed E. coli colonies were grown, colony PCR was performed to amplify the DNA contained within them. Twenty-five colonies were labeled and selected from the incubated plate to be amplified, and one KF7 LTR positive control was used. First, a mastermix for all of the reactions was made by combining 65 μL of 10X Buffer R, 13 μL of DNTP, 26 μL of the NL43-ΔEnvGFP primers “NL43-ΔEnv-GFP fwd” and “NL43-ΔEnv-GFP rev”
(Figure 5) diluted in a 1:5 ratio with nuclease-free water, 3.25 μL of Taq polymerase, and 542.75 μL of nuclease-free water in a 1 mL microcentrifuge tube. This mastermix was then divided equally into 26 PCR tubes (25 μL per tube). A selected colony was then sampled and added to each of the first twenty-five tubes, one tube per colony, and mixed well. One μL of the KF7 LTR was added to the twenty-sixth tube to serve as the positive control.
The colony PCR was run in a thermocycler using the following procedure: first, the process was initiated at 95℃ for 10 minutes. Then, denaturation occurred at 95℃ for 20 seconds followed by annealing and extension at 68℃ for 1 minute 20 seconds, repeated for 35℃ cycles. Final extension happened at 68℃ for 5 minutes.
After colony PCR, agarose gel electrophoresis using a 1% gel was run to determine whether the LTR insertion was successful. Samples were prepared with 5 μL from 6 μL mixes consisting of 1 μL 6X Purple Loading Dye and 5 μL of a colony PCR product. The gel was run at 120V for about 20 minutes before imaging with the Gel Doc XR+ Gel Documentation System and Image Lab Image Capture software. All wells filled with colony PCR products displayed bands at the same length as the KF7 LTR positive control around 766 bp, indicating that the cloning was successful.
Sequencing
PureLink™ HiPure Plasmid DNA Purification Miniprep Kit and procedure was used to prepare four of the tested colonies for sequencing to confirm our clones. The colony mixtures were sent to Plasmidsaurus for sequencing, and found that our clone had
consistent 100% pairwise identity to the KF7 LTR, thus proving that our cloning was successful.
Plasmid DNA Isolation and Purification
An overnight culture and Maxiprep were performed to isolate and purify the plasmid DNA from the E. coli colonies. For the overnight culture, 10 g of LB broth was mixed with 500 mL nanopure water, then autoclaved using the LIQ30 preset for 1 hour. Then, the PureLink™ HiPure Plasmid DNA Purification Maxiprep Kit and procedure followed by the PureLink™ HiPure Precipitator Module Kit and procedure were used to obtain the purified plasmid DNA.
2. Transfections and Infections
Overview
Once cloning was successful for both the KF7 virus and the MH7 virus (obtained by Dr. Daniel Bryant), they – along with the original NL43-ΔEnv-GFP virus – were used to transfect HEK293T cells to grow infectious virions containing each of the three LTRs. Once those particles were harvested, they were used to infect activated CD4+ T cells.
Cell Culture
HEK293T cells used for transfections were maintained in Dulbecco’s Modified Eagle Medium (DMEM) supplemented with 10% fetal bovine serum (FBS), 1% Pen Strep, and 1% L-
Glutamine. All cells were incubated at 37℃ in the presence of 5% CO2.
On average, cells were passaged every two to three days, or when they reached about 70-80% confluency. To passage the cells, the used media was first carefully aspirated. Then, the cells were washed of any remaining media with 3-5 mL of room temperature phosphate-buffered saline (PBS), which was gently swirled around the flask before being aspirated. Next, 3 mL of room temperature 0.25% Trypsin-EDTA was added to the cells to dislodge them from the flask. The Trypsin-cell mixture was incubated at 37℃, 5% CO2 for several minutes. Once all cells were dislodged, fresh room temperature DMEM was added to the flask at a total volume of 10 mL. All 10 mL were then moved to a 15 mL conical tube, and centrifuged at 300 x g for 5 minutes to form a cell pellet at the base of the tube. The supernatant was removed carefully without disturbing the pellet, and the cells were resuspended in 10 mL of fresh room temperature DMEM. The cells were then diluted in a 1:20 ratio (0.5 mL resuspended cells, 9.5 mL media) and moved to a flask, which was kept incubated at 37℃ and 5% carbon dioxide until the next passage.
Transfection
The cultured HEK293T cells were transfected with cloned viruses to package the viruses into mature infectious virions. First, following the same steps as for passaging the cells, the used media was removed from the flask, PBS was used to gently wash the cells, Trypsin-EDTA was used to dislodge cells from the surfaces of the flask, media was used to inactivate the Trypsin, and the cells
were centrifuged to form a cell pellet. Once the cells were resuspended in 10 mL of DMEM, the cells were mixed with Trypan Blue Stain, a stain that colors dead cells blue, in an Eppendorf tube in a 1:10 ratio (10 μL cells, 90 μL stain). The mixture was added to slides with hemacytometers to be counted; the cells were seeded in plates of 2 million cells each, with the rest of the plate filled up to 10 mL with media.
The next day, transfection was carried out by combining 25 μg of each virus with 3.5 μ of VSV-G plasmid and 3.5 mL of Opti-MEM media with PEI. This mixture was incubated at room temperature for 20 minutes, before 1 mL was added dropwise to the respective seeded plates for each virus. All plates were then returned to the incubator. The media on all transfected cells was changed the next day by washing the plates with 5 mL of PBS then adding 10 mL of new Opti-MEM.
The following steps were completed by Dr. Daniel Bryant because of safety restrictions and equipment usage qualifications. First, the grown viruses were harvested and used to infect activated CD4+ T cells from three donors. Peripheral blood mononuclear cells (PBMCs) were isolated from donated whole blood using lymphoprep and centrifugation, from which CD4+ T cells were then isolated using a negative selection kit. CD4+ T cells were activated using 50 nM PMA and 100 ng/mL PHA for 48 hours for Donor 1, or CD3/CD28 beads for 48 hours and then an additional 36-48 hours prior to infection with beads removed and medium replaced for Donors 2 and 3. All isolated CD4+ T cells were cultured in RPMI supplemented with 10% FBS, Penicillin/streptomycin, L-glutamine, and IL-7. IL-2 was also
added after activation. For the infections, each virus was titered, using TZM-bl cells for Donor 1 and p24 ELISAs for Donors 2 and 3. Then, equivalent amounts of virus (MOI = 0.2 [Donor 1] or 1.5 x 10 viral particles [Donors 2 and 3]) were added to 6 million (Donor 1) or 3 million (Donors 2 and 3) activated CD4+ T cells. After, the cells were spinoculated with the virus using centrifugation at 1200 xg for 1.5 hours. Cells were then washed one time with PBS and resuspended in the supplemented RPMI.
Starting from three days post-infection, ⅙ of the cells were harvested each day for flow cytometry, which was used to measure GFP expression across the infected cells. The Donor 1 cells were resuspended in PBS supplemented with 2% FBS and 1mM EDTA. Donor 2 cells were fixed using 3.7% PFA and eventually resuspended in FACS buffer with 1x Calcein Blue. Donor 3 was fixed and resuspended in the same way as Donor 2, but with a Live/Dead Blue instead of Calcein. The remaining cells from day 7 post-infection were split into fifths, with ⅕ getting reactivated with each of Bryostatin (50nM), PMA (50nM)/PHA (100 ng/mL), SAHA (10μM), and JQ1 (10μM), with the final ⅕ left unstimulated. After reactivation, their GFP expression levels were measured again and compared.
Results
Different LTRs did not significantly alter transcriptional efficiency or viral progression after infection
Starting from three days following the initial infections, the GFP expression for the samples of harvested cells infected with each virus (⅙ of each) were measured in terms of mean fluorescence intensity (MFI) of the GFP-positive (GFP+) cells using flow cytometry (Figure 7). A higher MFI indicates that cells under that condition had stronger expression of the virus.

Figure 7: Graph displaying the mean fluorescence intensity (MFI) of each virus measured by flow cytometry over different days post-infection (P.I.). Means are represented
by horizontal lines, while error bars indicate standard deviations. Three replicates were done for each condition, represented by the plotted points. Figure provided by Dr. Daniel Bryant.
Figure 7 shows the progression of the infections over time in terms of MFI of the GFP+ cells. The transcriptional activities as measured by MFI of GFP were not very different across the viruses. Over the course of 9 days post-infection (P.I.), the average MFI of GFP+ cells ranged from 120417 to 155303 in KF7, 124180 to 139214 in MH7, and 146047 to 154938 in NL43-ΔEnv-GFP. A two-way ANOVA (across days P.I. and across viruses) also displayed no significant statistical differences for any of the samples. However, KF7 did exhibit a pattern of decrease in mean MFI from Day 3 P.I. to Day 4 P.I. (131899 to 120417), followed by a gradual increase in the following days P.I. (increasing from 120417 to 155303), whereas the mean MFI of both MH7 and NL43-ΔEnv-GFP stayed relatively constant over the course of infection in the previously-mentioned ranges. KF7 also displayed smaller standard deviations (ranging from 3141 to 16606), while the standard deviations of MH7 (ranging from 13450 to 44853) and NL43-ΔEnv-GFP (ranging from 12566 to 51063) showed more variation over time P.I.. These observations suggest that LTR differences could impact expression levels of different viruses over time P.I.. More replicates should be done to establish these differences.

Figure 8: Graph depicting the normalized percentage of GFP-positive (GFP+) cells at progressing days postinfection (P.I.) of the 3 LTR viruses (KF7, MH7, and NL43-ΔEnv-GFP). Three replicates were used for each virus, with the points representing the means and the error bars showing standard deviation. The data was normalized to the percent of GFP+ cells at Day 3 P.I., as the focus was on the rate at which infected cells entered latency. Figure provided by Dr. Daniel Bryant.
Figure 8 above shows the rate of decrease in GFP+ cells normalized to Day 3 post-infection (P.I.), meaning that 100% GFP+ cells equals the total number of GFP+ cells present on Day 3
P.I. for each individual virus. Normalized to the same original percent of infection, the viruses appear to enter a latent state or cause cell death at similar rates. This is indicated by the matching drops in GFP+ cell percentages following each day P.I., as dead cells and latently-infected cells can no longer express GFP. Notably, MH7 and NL43-ΔEnv-GFP displayed extremely similar rates of decrease in normalized percentages of GFP+ cells. Approximately 51.3% were initially infected in MH7 and this decreased to approximately 2.3% over the 9 days, while about 52.5% were initially infected in NL43-ΔEnv-GFP which decreased to around 2.7% over 9 days. It can also be seen that their average normalized percentages of GFP+ cells at each Day P.I. were nearly the same, with a less than 2% difference on all observed days. KF7 displayed a slightly slower rate of decrease, as a higher normalized percentage of GFP+ cells remained at each Day P.I. compared to the other two viruses; initial infection displayed 57.7% of GFP+ cells, which decreased to 4.5% over 9 days P.I.. However, a twoway ANOVA (across Days P.I. and across LTR viruses) showed no significant statistical differences in the normalized percent of GFP+ cells over time, indicating that all three viruses enter latency or cause cell death at approximately the same rate over time.
LTRs influence reactivation in response to different latency reversal agents
Infections were carried out for 7 days P.I. until there was minimal detectable virus present in order to establish the latent pools. Latent infections in the 3 viruses were each treated 5 different ways. Four latency reversing agents (LRAs) – Bryostatin, PMA/PHA, JQ1, and SAHA – and 1 unstimulated control were
used. The percent increase in GFP expression from the parent gate was then measured. The MFIs of the reactivated infections under different latency reversing conditions are shown and compared to one another (Figures 9 and 10).

Figure 9: Graph showing the relative MFI change resulting from the use of each LRA in each virus compared to the MFI of the unstimulated control (represented by the dashed line at 1.0) as measured by flow cytometry. Means are plotted by the shapes, while error bars indicate standard deviations. Two trials were done under each condition.
Figure provided by Dr. Daniel Bryant.
Some LRAs had a positive impact on MFI relative to the unstimulated condition, while some had negative effects, as shown in Figure 9. Bryostatin caused an unexpected decrease in average MFI as compared to the unstimulated condition when used to
reactivate all three viruses, resulting in average MFIs ranging from about 64% to 90% of the unstimulated control MFI. JQ1 and SAHA both showed consistent increases in average MFI compared to the untreated control, spanning from around 1.5 to 2-fold increases in expression from the unstimulated replicate. The effects of PMA/PHA (KF7: 0.70 ± 0.14, MH7: 0.94 ± 0.60, NL43-ΔEnvGFP: 1.03 ± 0.73) had large standard deviations, so more data is needed in order to draw conclusions about its reactivation ability.
It can be seen that certain LRAs appear to be more impactful than others in reactivation. For instance, Bryostatin did not appear to be an efficient latency reactivator for any of these viruses. On the other hand, PMA/PHA, JQ1, and SAHA displayed greater relative increase in GFP expression from the unstimulated control for all the viruses. Different LRAs also seem to be the strongest reactivators for different viruses. For example, JQ1 appeared to be the most efficient LRA for KF7, and SAHA induced the strongest reactivation for NL43-ΔEnv-GFP. For MH7, JQ1 and SAHA both caused the greatest reactivation. These experiments and data provide preliminary evidence that latency induced by certain LTRs could react very differently to various latency reactivation methods.
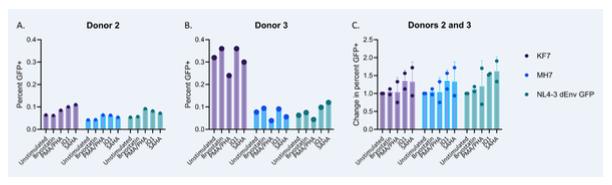
Figure 10: Graph A displays the percentage of GFP+ cells measured using flow cytometry following stimulation by four different LRAs or no stimulation in Donor 2. Graph B displays the percentage of GFP+ cells measured using flow cytometry following stimulation by four different LRAs or no stimulation in Donor 3. Graph C uses the combined data from Donors 2 and 3 to show the change in percent of GFP+ cells following reactivation when normalized to the unstimulated replicate at 1.0 (values greater than 1.0 indicate an increase in the number of GFP+ cells following reactivation as compared to the unstimulated replicate, whereas values less than 1.0 indicate a decrease). Means are represented by points and standard deviations are shown by the error bars. Figure provided by Dr. Daniel Bryant.
From Graph A and Graph B in Figure 10, it can be seen that variability also exists between donors in terms of the percentage of GFP+ cells following different reactivation methods. Most notably, reactivation of the KF7 virus in Donor 3 resulted in a greater percentage of GFP+ cells than in Donor 2. Different patterns in percentages of GFP+ cells between the two donors in reactivations of MH7 and NL43-ΔEnv-GFP existed but were less prominent.
These findings suggest that latency reactivation efficiency depends on the host as well as the virus. However, only one replicate was completed under each reactivation condition on each donor. Because of this, no means or standard deviations are reported in Graphs A and B, and the experiment should be replicated to observe whether the trends seen here are generalizable. Overall, the reactivations did not seem to be robust, as the percent of GFP+ cells found in any replicate across the two donors was never greater than 0.4%.
Looking at the data individually from different donors such as Donor 2 in Graph A and Donor 3 in Graph B, it can be seen that the same LTR virus and LRA conditions perform differently in each donor, which complicates the conclusions that could be drawn from our data regarding whether the different LTRs are the factor impacting different levels of reactivation.
Graph C in Figure 10 shows the change in percentage of GFP+ cells when each virus is reactivated with each LRA in Donor 2 and Donor 3 combined, with all data normalized to the unstimulated replicates. It can be seen that Bryostatin did not affect the percent of GFP+ cells much for any of the viruses. PMA/PHA had more variable results, with some increasing the percentage and some decreasing. JQ1 had the overall greatest positive average changes in percentage of GFP+ cells across all the viruses. SAHA also showed potential in positively increasing the percent of GFP+ cells, but had larger standard deviations than JQ1.
Discussion
It is known that HIV replication and latency are highly influenced by transcriptional regulation. However, the variation between different virus subtypes across the world is still poorly understood. One of the goals of this study was to determine how LTR variation across clades may contribute to differences in virus replication and the establishment and reversal of latency. We first infected cells with our LTR viruses to observe their transcriptional strength as indicated by GFP fluorescence, then reactivated latent infections in the cells with a variety of different LRAs to determine whether latency induced by different LTR promoters would have varying responses to the different LRAs, as LTRs are related to transcription factor recruitment, RNAP II activity, and chromatin alterations.
Our preliminary data has shown that some differences do exist across different LTRs in terms of transcriptional activity as well as response to latency reactivation methods. Our flow cytometry results have shown variation in the viruses in terms of both reactivation strength as well as levels of expression over days P.I., which indicates that different LTRs likely affect progression of the infection and effectiveness of reactivation. LTR sequences may be able to do this by influencing chromatin structure and enhancing or inhibiting transcription factor binding in various ways. Initially, we did not see differences with our viruses; this could be attributed to the presence of a strong transcriptional activator like Tat which, when expressed, can override LTR deficiencies and mask the impact of LTR sequence variations within the virus. We had expected to see stronger GFP expression indicating more
transcription of GFP as well as clearer trends in GFP expression and percent change in MFI following infection and reactivation across viruses containing LTRs from the same clade, but this did not happen. More replicates should be done to obtain stronger GFP signals. The trends that can be seen across different clades but under the same experimental conditions may be hypothesized to correlate with specific LTR sequences and transcription factor binding sites. Another complication in developing our understanding of the roles of LTRs on infection and reactivation is the difference in reactions observed between the different donors, as this indicates that the reactions of the viruses to our experiments may depend on the donor as well as the LTR. This finding supports previous research suggesting that HIV-positive cells are very diverse on both the inter- and intrapersonal levels, so cells from each patient may need to be evaluated individually (12). The presence of the donor variable makes it difficult to draw conclusions based solely on the LTR viruses.
A variable that has not been explored in this study is cell typespecific effects. Our experiments were done solely on T cells, so further observations should be made on other CD4+ cells such as macrophages in order to determine whether our findings can be generalized. One other interesting observation to note is that the LRA Bryostatin actually lowered the MFI of multiple tested viruses when compared to the unstimulated condition done using the same viruses. This could be a reactivation response specific to the viruses tested here, supporting the hypothesis that LRAs have different effects on different subtypes, or this could indicate the use
of an improper amount or concentration of the LRA. More experimentation should be done to further investigate this.
The long-term goal of these experiments in investigating LTRs representing a range of activity from the MPRA is to be able to use the results of the MPRA to successfully predict which reactivation methods are most suitable for reversing latency in viruses containing different LTR sequences. Since the MPRA alignment shows similarities across the sequences for different LTR, our goal is to be able to correlate the regional activity displayed through the MPRA to the most effective latency reversing agents to target LTRs varying in clade or subtype found in HIV. Our results are not yet conclusive, so more work remains to be done in the investigation of the wide variety of LTRs present in HIV.
Conclusion
Latency is a barrier to a HIV cure, so developing a better understanding of the variation and properties influencing HIV transcription and latency establishment may be able to inform the design of new therapeutics to target the latent reservoir. Pathogenesis of the virus appears to be affected by LTRs, as the progression of viral expression over time post infection was shown to vary across the different cloned viruses. Latency establishment also displayed subtle differences across different LTRs. Furthermore, latency reversal agents show varying levels of efficiency when reactivating latency in T cells infected with viruses of different subtype LTRs. Latency establishment and reversal in T cells also varied between individuals, indicating that the cellular machinery of the host of the virus may have an impact on its activity. Further studies could be conducted to investigate the effects of LTR viruses and LRAs on different cell types and different hosts in order to gain a more comprehensive understanding of the relationship between latency and HIV subtypes.
Acknowledgements
I would like to thank Dr. Andrew J. Henderson for giving me the opportunity to work at his lab and helping me understand the field of HIV research, and Dr. Daniel Bryant for teaching me all laboratory procedures, associated safety rules, and providing data that I could not collect myself.
References
1. HIV data and statistics. WHO.int. Published July 22, 2024. Accessed September 30, 2024. https://www.who.int/teams/globalhiv-hepatitis-and-stis-programmes/hiv/strategic-information/hivdata-and-statistics
2. Kilroy, Jonathan M., Andrew A. Leal, and Andrew J. Henderson. 2024. "Chronic HIV Transcription, Translation, and Persistent Inflammation" Viruses 16, no. 5: 751. https://doi.org/10.3390/v16050751
3. Bieniasz PD. Restriction factors: a defense against retroviral infection. Trends Microbiol. 2003 Jun;11(6):286-91. doi: 10.1016/s0966-842x(03)00123-9. PMID: 12823946.
4. The HIV Life Cycle. HIVinfo.NIH.gov. Published August 4, 2021. Accessed October 8, 2024.
https://hivinfo.nih.gov/understanding-hiv/fact-sheets/hiv-life-cycle
5. What is a Latent HIV Reservoir?. HIVinfo.NIH.gov. Reviewed May 14, 2024. Accessed October 8, 2024. https://hivinfo.nih.gov/understanding-hiv/fact-sheets/what-latenthiv-reservoir
6. Pedro KD, Agosto LM, Sewell JA, Eberenz KA, He X, Fuxman Bass JI, Henderson AJ. A functional screen identifies transcriptional networks that regulate HIV-1 and HIV-2. Proc Natl Acad Sci U S A. 2021 Mar 16;118(11):e2012835118. doi: 10.1073/pnas.2012835118. PMID: 33836568; PMCID: PMC7980386.
7. Jadlowsky JK, Wong JY, Graham AC, Dobrowolski C, Devor RL, Adams MD, Fujinaga K, Karn J. Negative elongation factor is required for the maintenance of proviral latency but does not induce promoter-proximal pausing of RNA polymerase II on the HIV long terminal repeat. Mol Cell Biol. 2014 Jun;34(11):1911-28.
doi: 10.1128/MCB.01013-13. Epub 2014 Mar 17. PMID: 24636995; PMCID: PMC4019061.
8. Pal S, Jaiswal V, Nala N, Ranga U. 2023. Enhanced Transcriptional Strength of HIV-1 Subtype C Minimizes Gene Expression Noise and Confers Stability to the Viral Latent State. J Virol 97:e01376-22. https://doi.org/10.1128/jvi.01376-22
9. Zhang Z, Klatt A, Gilmour DS, Henderson AJ. Negative elongation factor NELF represses human immunodeficiency virus transcription by pausing the RNA polymerase II complex. J Biol Chem. 2007 Jun 8;282(23):16981-8. doi: 10.1074/jbc.M610688200. Epub 2007 Apr 18. PMID: 17442680.
10. Agosto LM, Gagne M, Henderson AJ. Impact of Chromatin on HIV Replication. Genes (Basel). 2015 Sep 30;6(4):957-76. doi: 10.3390/genes6040957. PMID: 26437430; PMCID: PMC4690024.
11. Tewhey R, Kotliar D, Park DS, Liu B, Winnicki S, Reilly SK, Andersen KG, Mikkelsen TS, Lander ES, Schaffner SF, Sabeti PC. Direct Identification of Hundreds of Expression-Modulating Variants using a Multiplexed Reporter Assay. Cell. 2016 Jun 2;165(6):1519-1529. doi: 10.1016/j.cell.2016.04.027. Erratum in: Cell. 2018 Feb 22;172(5):1132-1134. doi: 10.1016/j.cell.2018.02.021. PMID: 27259153; PMCID: PMC4957403.
12. Wu, V.H., Nordin, J.M.L., Nguyen, S. et al. Profound phenotypic and epigenetic heterogeneity of the HIV-1-infected CD4+ T cell reservoir. Nat Immunol 24, 359–370 (2023). https://doi.org/10.1038/s41590-022-01371-3