Alex Furman
Senior Thesis | 2025

Abstract
Accurate DNA quantification is essential for studying aging and longevity, particularly in generating induced pluripotent stem cells (iPSCs) and direct conversion (DC) models. This paper evaluates the NanoDrop Lite, NanoDrop 2000 C, and Qubit Fluorometer for DNA quantification, highlighting their strengths and limitations. The NanoDrop Lite offers convenience but lacks precision at low concentrations. The NanoDrop 2000 C improves accuracy for DNA dilutions highly concentrated with DNA but remains limited in detecting contaminants. The Qubit Fluorometer provides superior sensitivity but requires longer processing times and has a hard time measuring high concentrations. Findings suggest that combining these tools optimizes DNA quantification for aging research, ensuring more reliable genetic data. Specifically, the NanoDrop 2000 C should be used for initial concentration assessments and high-concentration samples, while the Qubit Fluorometer is best for highly diluted DNA. Regular calibration and cleaning of all the instruments enhance reliability. This approach ensures reproducible genetic data, advancing research on aging, resilience, and longevity, with implications for medical diagnostics, regenerative medicine, and age-related disease prevention.
Introduction
A major challenge in understanding aging and its various resulting diseases, including Alzheimer’s Disease or Parkinson’s Disease, is the lack of human models that accurately represent the biological processes that play a role in aging, resilience, and longevity. This gap limits the ability to test potential interventions for age–related conditions. Induced pluripotent stem cells, or iPSCs, offer a promising solution. Derived from donated blood or skin cells of adults, iPSCs can be reprogrammed into an embryonic cell–like state and differentiated towards any type of cell that the body may need, like neurons, astrocytes, cardiomyocytes, endothelial cells, red and white blood cells, hepatocytes, fibroblasts and more. The remarkable versatility of iPSCs allows them to be used to model diseases and advance regenerative medicine. In addition to being used as a framework to understand and support healthy aging, iPSCs are a less ethically controversial alternative to embryonic stem cells (ESCs). The ethical concerns surrounding research using ESCs primarily stem from the process of obtaining these cells. Human embryo destruction is a vital step in the use of ESCs, which raises significant moral objections, particularly among those who believe that human life begins at conception. In contrast, iPSCs use reprogramming techniques that circumvent such ethical issues, making iPSCs more widely accepted for research and medical applications (Zacharias et al., 2011). Direct conversion or DC has also emerged as a powerful tool to create cells that model in vitro aging–associated signatures and function. DC, like iPSCs, reprogram cells and induce epigenetic changes to remodel a cell to another cell type, but DCs bypass a pluripotent intermediate stage, preserving original cell characteristics, avoiding epigenetic programming issues, and providing a more efficient alternative. Unlike iPSCs, DC retains aspects of donor cell–specific epigenetic marks, enabling more stability and specialization of function as seen in the generation of
dendritic cells with enhanced antigen presenting capabilities (Flosdorf & Zenke, 2022). Overlapping DC–induced cells with iPSC–induced cell strategies is helpful to capture epigenetic drivers of longevity, resilience, or decline while also using the flexible and unlimited iPSC cell source. Profiling resilience or decline in longevity–specific cell types was developed by combining different techniques like functional assays, transcriptomics, and single–cell RNA sequencing, building on recent innovations that link cellular phenotypes to transcriptomic diversity (Camunas–Soler, 2023). These techniques help pinpoint longevity–influencing functional shifts and molecular changes in iPSCs. Nucleic acid quantification is critical for ensuring the accuracy and reliability of transcriptomic data. Without proper quantification or quality assessment, faulty RNA or DNA input can compromise gene expression analysis, resulting in misleading conclusions about cellular resilience or decline, involved in aging diseases. This study investigates the strengths and limitations of DNA quantification tools, the NanoDrop Lite, the NanoDrop 2000 C, and the Qubit Fluorometer. The results identify the optimal combination of such tools to accurately measure DNA, which is important for advancing research on aging, resilience, and disease modeling using iPSCs and DC.
Methods
Optimizing a lab’s DNA extraction protocol is critical to ensuring high–quality, reproducible genetic data, enhancing pluripotency and differentiation, and reducing labor times and expenses (Neal et al., 2024). Popular DNA quantification tools in the Center for Regenerative Medicine (CReM) lab include spectrometers and fluorometers: the L Lite, the NanoDrop 2000C, and the Qubit Fluorometer. The NanoDrop Lite uses UV absorbance at 260 nm for DNA concentration estimation. Both NanoDrop tools use photometric measurements of nucleic acids, meaning they measure concentration based on the intrinsic absorptivity properties of DNA and RNA. Figure 1 shows the absorbance spectrum for nucleic acids.

Figure 1. When an absorption spectrum is measured, nucleic acids absorb light with a characteristic peak at 260 nm (RNA/DNA Quantification – US, n.d.).
Although the NanoDrop Lite is suitable for assessing the concentration and purity of a broad range of DNA samples, it can also be contaminated by residues on the measurement pedestal such as nucleic acids, proteins, or chemical reagents. Since the instrument is reliant on absorbance readings at specific wavelengths (260 nm for nucleic acids) the presence of contaminants can skew the results, leading to inaccurate
quantification. Additionally, improper cleaning between measurements can result in sample carryover (RNA/DNA Quantification – US, n.d.).

Figure 2. Wavelength separation, isolating light at specific wavelengths to measure properties, can occur before or after the light passes through the sample, with the optical path oriented either horizontally or vertically.
The NanoDrop 2000 C is similar to the NanoDrop Lite, except with more precise concentration measurements, as it is able to identify possible contaminants, leading to a better DNA purity assessment. It measures a signal by detecting the attenuation of light as it passes through the sample. The decrease in light intensity reaching the detector, compared to the initial incident light, is quantified and expressed as the sample’s absorbance values in the solution. The Qubit Fluorometer uses fluorescent dyes that bind to DNA, creating a slightly longer process that’s relatively free from contaminants, although no method completely identifies all possible contaminants (RNA/DNA Quantification – US, n.d.).

Figure 3. The Qubit Fluorometer uses a fluorometric measurement of nucleic acids, which is based upon the use of fluorogenic dyes that bind selectively to DNA or RNA. The dyes only emit light signals when they are bound to the target.
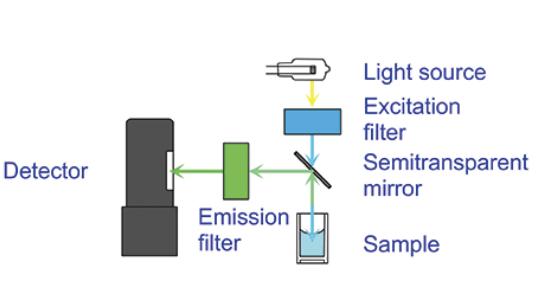
Figure 4. Fluorometers measure the signal by exciting the sample with filtered light at the excitation wavelength and detecting the emitted light at the emission wavelength (RNA/DNA Quantification – US, n.d.).
The Qubit’s detection range is designed to be sensitive to low concentrations of DNA, typically in the range of 1 ng/µl to 1000 ng/µl, meaning that the system is more accurate for lower concentrations (Thermo Fisher Scientific, n.d.). Like most fluorometers, the concentrations are measured using the fluorescence signal of the sample (Mardis & McCombie, 2016). A calibration curve is calculated from standards with established concentrations. They can be used in regression models. Comparing
these three machines is valuable to identify the ideal approach to extracting and quantifying DNA for the purpose of DC.
In order to compare the accuracy of each machine’s concentration assessments, a uniform control DNA standard must be identified and tested on. Lambda DNA, a well-studied research model often used in experiments, refers to a virus that infects E. coli bacteria. Thermo Scientific Lambda DNA is a well–characterized, linear, double–stranded DNA molecule (48,502 bp) with 12 bp single–stranded cohesive ends that circularizes upon entering a host cell, making it an ideal uniform control standard for comparing machine concentration assessments (Joint Research Centre et al., 2015). Its consistent molecular structure, known size, and versatility as a substrate for restriction endonucleases or DNA size markers ensure reproducibility and accuracy in testing. Additionally, its large–scale availability and inclusion of mutations allow for reliable and repeated experiments, helping validate machine performance in detecting DNA concentration, purity, and integrity.
In a study done by Monserrat García–Alegría et al on validating the NanoDrop spectrophotometer for DNA quantification, researchers validated the analytical method using standard reference material and DNA from Sprague Dawley rats and human donors (García–Alegría et al., 2023). Testing DNA concentration and purity with absorbance–based methods, such as using the NanoDrop, enabled a similar quantification optimization protocol. The concentrations (ng/ul) of the DNA dilution samples –undiluted, 1:10, 1:50, 1:100, and 1:500 – were chosen based on the need to evaluate the analytical method’s performance across a dynamic range of DNA concentrations, allowing for the assessment of linearity, sensitivity, accuracy, precision, and recovery. This range ensures that the method can handle varying DNA concentrations, from highly concentrated stock solutions to
low–concentration working samples, mimicking real scenarios outside of the lab and validating its reliability.
Expected concentration values for each dilution were calculated using the equation:
!!"#$%&! (#$/&' ) = !(%)*+ × ,(%)*+ /,%)%,#
The concentration pertaining to a specific dilution (!!"#$%&! ) is equal to the product of the concentration of the stock solution (!(%)*+ ) and the volume of that stock (,(%)*+ ) out of the total volume of the solution (,%)%,# ). For this procedure, it was decided that in order to be considered accurate, the concentration of the analytical tools must be within 15 ng/! l of the estimated expected value. The expected average concentration value for each tool, NanoDrop Lite, NanoDrop 2000C, and Qubit Fluorometer, was between 315 ng/! l and 285 ng/! l, with an average expected value of 300 ng/! l. DNA quantification methods, like using the NanoDrop or the Qubit, are designed for downstream applications like PCR, cloning, or sequencing (Versmessen et al., 2024). For these procedures, a deviation within 15 ng/! l of the target value is unlikely to impact results significantly, making it a sensible threshold (AOAC International, 2019).
Results
A total of 10 experiments were performed, two done on each analytical tool for 5 different dilution ratios to evaluate accuracy across a range of concentrations. Calculating quantification accuracy before and after cleaning (e.g., bleach, ethanol) and calibrating the tools, allows for assessment of how maintenance affects their reliability and accuracy. The following graphs illustrate the measured DNA concentrations at each dilution, highlighting the differences in accuracy influenced by
tool and calibration. Average Expected Values are represented with green bars, Pre-Cleaning concentration measurements are represented with blue bars, and Post-Cleaning concentration measurements are represented with red bars (when present). More diluted samples appear darker on the graphs.

Figure 5. The actual concentration of undiluted Lambda DNA samples across the NanoDrop Lite, the NanoDrop 2000 C, and the Qubit Fluorometer, including average expected values, pre–cleaning values, and post–cleaning values. Error bars adjusted for average expected values between 315 and 285 ng/! l.

Figure 6. The actual concentration of 1:10 samples (1 ng of Lambda DNA to 10 ! l of buffer) across the NanoDrop Lite, the NanoDrop 2000 C, and the Qubit Fluorometer, including average expected values, pre–cleaning values, and post–cleaning values. Error bars adjusted for average expected values between 315 and 285 ng/! l.

Figure 7. The actual concentration of 1:50 samples (1 ng of Lambda DNA to 50 ! l of buffer) across the NanoDrop Lite, the NanoDrop 2000 C, and the Qubit Fluorometer, including average expected values, pre–cleaning values, and post–cleaning values. Error bars adjusted for average expected values between 315 and 285 ng/! l.

Figure 8. The actual concentration of 1:100 samples (1 ng of Lambda DNA to 100 ! l of buffer) across the NanoDrop Lite, the NanoDrop 2000 C, and the Qubit Fluorometer, including average expected values, pre–cleaning values, and post–cleaning values. Error bars adjusted for average expected values between 315 and 285 ng/! l.

Figure 9. The actual concentration of 1:500 samples (1 ng of Lambda DNA to 500 ! l of buffer) across the NanoDrop Lite, the NanoDrop 2000 C, and the Qubit Fluorometer, including average expected values, pre–cleaning values, and post–cleaning values. Error bars adjusted for average expected values between 315 and 285 ng/! l.
Reinforcing the importance of calibrating and maintaining nucleic acid analysis tools, the concentrations of dilutions were measured before and after “cleaning.” Pre–cleaning concentration values, across different dilutions, were inconsistent with predicted patterns. At undiluted concentration pre-cleaning, the NanoDrop Lite measured 283.5 ng/! l, the NanoDrop 2000 C 298.8 ng/! l, and the Qubit 64.8 ng/! l, far from the expected value and inconsistent with its reported inability to detect low dilutions (Figure 1) (Nakayama et al., 2016). At 1:10 ng/! l dilution, the NanoDrop lite and NanoDrop 2000 measured 31.3 ng/! l and 31.4 ng/! l, respectively, aligning with the expected value range with an average of 30 ng/! l, while the Qubit, at 38.4 ng/! l, remained inconsistent (Figure 6). At 1:50 ng/! l dilution, the NanoDrop Lite (7.0 ng/! l) and Qubit (9.1 ng/! l) deviated from the expected 6.0 ng/! l, whereas the NanoDrop 2000 C (6.1 ng/! l) was nearly accurate (Figure 7). At 1:100 ng/! l dilution, the NanoDrop Lite, NanoDrop 2000 C, and Qubit detected 4.3 ng/! l, 3.2 ng/! l, and 4.7 ng/! l, respectively (Figure 8). At 1:500 ng/! l dilution, they detected 2.6 ng/! l, 1.5 ng/! l, 2.7 ng/! l, respectively (Figure 9).
The NanoDrop Lite and NanoDrop 2000 C were often close to the expected values at pre–cleaning measurements. In some cases they were closer to the expected concentration values than post–cleaning measurements. For three of five sets of dilution measurements, the NanoDrop Lite was more accurate pre–cleaning than post. For all five sets of dilution measurements, the NanoDrop 2000 C was more accurate pre–cleaning than post. The NanoDrop Lite deviated 1.3 ng/! l from expected 30 ng/! l pre–cleaning, increasing to 2.3 ng/! l post-cleaning (Figure 6). For the expected 6.0 ng/! l, its deviation was 1.0 pre-cleaning and 1.6 post-cleaning (Figure 7). This trend continued for the expected 3.0, with deviations of 1.3 pre-cleaning and 3.6 post-cleaning (Figure 8). The NanoDrop 2000 C deviated 1.2 from the expected 300 ng/! l
pre-cleaning, rising to 2.1 post-cleaning (Figure 5). For the expected 30 ng/! ;, its deviation was 1.4 pre-cleaning and 2.2 postcleaning (Figure 6). At 6.0 ng/! l, it deviated 0.1 pre-cleaning and 0.7 post-cleaning (Figure 7). For the expected 3.0 ng/! l, it deviated 0.2 pre-cleaning and 3.8 post-cleaning (Figure 8). At an expected value of 0.6 ng/! l, pre–cleaning deviation was 0.9, increasing to 1.9 post-cleaning (Figure 9).
The Qubit Fluorometer’s pre–cleaning concentration values were continuously less accurate and inconsistent with Qubit’s known calculation patterns (Figure 5–9) (Robin et al., 2016).
Post-cleaning, the NanoDrop Lite and NanoDrop 2000 C measured concentrations closer to expected values in less diluted samples up to 1ng of Lambda DNA per 10 ! l of buffer (Figure 1, Figure 2) (Milavec et al., 2021). At undiluted concentration (expected ± 15 ng/! l), the NanoDrop Lite measured 301.2 ng/! l, and the NanoDrop 2000 C measured 297.9 ng/! l, both similarly accurate, while the Qubit failed to detect a concentration. At 1:10 ng/! l dilution (expected 30 ng/! l), the NanoDrop Lite and NanoDrop 2000 C measured 32.3 and 32.2 ng/! l, respectively, remaining relatively accurate, while the Qubit, at 18.2 ng/! l was significantly inaccurate. At higher dilutions, the Qubit’s accuracy improved (Figure 3, Figure 4, Figure 5). At 1:50 ng/! l dilution (expected 6 ng/! l), the NanoDrop Lite measured 4.4 ng/! l (inaccurate), while the NanoDrop 2000 C was closer at 5.3 ng/! l. The Qubit was closest to accuracy at 5.5 ng/! l. At 1:100 ng/! l dilution (expected 3ng/! l), both NanoDrops became significantly inaccurate, measuring 6.6 ng/! l (NanoDrop Lite) and 6.8 ng/! l (NanoDrop 2000 C), whereas the Qubit, at 2.5 ng/! l, was closer to the expected value. At 1:500 ng/! l dilution (expected 0.6 ng/! l), the NanoDrop Lite and NanoDrop 2000 C were inaccurate at 1.7 and 2.5 ng/! l, respectively, while the Qubit was exact at 0.6 ng/! l. Dilutions beyond 1:500 ng/! l were not tested. It is predicted that the Qubit would continue being accurate until around the 1:500
point, given that its detection range for double stranded DNA is between 0.2 and 100 ng and 1:500 dilution would bring the concentration to around 0.2 ng (Liu et al., 2015).
Discussion
The study presents a comprehensive comparison of the NanoDrop Lite, NanoDrop 2000 C, and Qubit Fluorometer for DNA quantification, providing valuable insights into the strengths and limitations of each tool. With optimized DNA extraction protocols and using assays with distinct strengths, researchers are able to achieve high–quality, reproducible genetic data. These results are necessary for applications such as direct conversion (DC) and induced pluripotent stem cell (iPSC) research (D’Antonio–Chronowska et al., 2019). The NanoDrop Lite is a convenient and accessible tool for measuring DNA concentration. It is effective for a broad range of DNA samples, but since its precision weakens at lower concentrations and higher dilutions, it may not be the most reliable instrument for accurate DNA quantification. It is, however, a practical option for routine measurements (García Alegría et al., 2023). The NanoDrop 2000 C is more capable than the NanoDrop Lite, which is generally recognized as a significant advantage (NanoDrop Microvolume Spectrophotometers – US, n.d.). Its enhanced precision makes it a more reliable choice for experiments requiring higher accuracy, such as quantifying DNA for sequencing or cloning. As demonstrated in this study, its performance at higher dilutions (1:100, 1:500 – Figure 8, 9) may still be affected by inherent limitations of absorbance–based methods, such as a weakness in contaminant detection. The Qubit Fluorometer’s fluorescence–based detection method offers superior sensitivity and specificity, but is limited to DNA concentrations lower than 6 ng or 1:50 ng/! l (Figure 7). By binding selective dyes to DNA, the Qubit minimizes interference from contaminants and accurately measures when
DNA samples are highly diluted by buffer. This makes it the tool of choice for experiments involving DNA samples with low concentrations, such as aging-associated signatures studied through DC. However, its more complicated procedure, limited utility for high–concentration samples, and longer processing time are a significant consideration for researchers (Nakayama et al., 2016). The study underscores the importance of identifying and using a uniform control DNA standard, in this case Thermo Scientific Lambda DNA. Lambda DNA’s consistent molecular structure and availability are vital in validating the performance of these tools and ensuring reproducibility for other experiments (Chung et al., n.d.). The use of a range of ng/! l dilutions – undiluted, 1:10, 1:50, 1:100, 1:500 – (Figure 5–9) further enabled a dynamic assessment of each tool’s accuracy, sensitivity, and precision. The expected concentration range of 315–285 ng/! l, with an average of 300 ng/! l, provided a strong benchmark for assessing performance, with a 15 ng/! l error range considered reasonable for most downstream applications (Koetsier et al., n.d.). The findings of the study suggest that each tool serves a specific function in the lab. For high–throughput and routine measurements, the NanoDrop lite offers accessibility and functionality, but can be untrustworthy in terms of calibration and contamination. For applications requiring accuracy and purity assessments at high concentration samples, the NanoDrop 2000 C provides improved precision but may still require supplemental tools. For low–concentration DNA quantification, the Qubit Fluorometer is the most reliable option, and must be cleaned thoroughly. The combination of these tools can help researchers to address a wide range of DNA quantification needs, from routine measurements to highly sensitive applications. In terms of optimizing DNA quantification to study extracted DNA from the blood of centenarians to study aging, it is most reliable to clean and calibrate the tools, use the NanoDrop 2000 C for higher concentrations (dilutions above 1:10
ng/! l), and use the Qubit Fluorometer for lower concentrations (dilutions 1:50 ng/! l and lower). Intermediate concentrations were not measured because the selected concentrations already provide a representative range for evaluating the performance of each tool, providing assessment without unhelpful redundancy given the inherent variability in DNA quantification.
To further improve DNA quantification methods, studies could explore automated cleaning and calibration protocols to minimize variability introduced during manual processes. Other studies could pursue the integration of hybrid methods that combine absorbance and fluorescence dyes with broader detection ranges to enhance the versatility of tools like the qubit fluorometer. It is crucial to recognize that, although the NanoDrop Lite and NanoDrop 2000 C concentration outcomes appeared to be more accurate “pre–cleaning” than “post–cleaning” (Figure 5–9), this is not a realistic result for NanoDrop measurements detecting highly diluted DNA samples. The NanoDrop Lite has a generally narrow detection range of 4 to 1500 ng/! l for double stranded DNA (dsDNA). As concentrations approach or fall below 4 ng/! l, the accuracy should diminish (NanoDrop Micro–UV
Spectrophotometer NanoDrop Lite plus User Guide S120
NanoDrop Lite plus UG Revision Date, 2022). The NanoDrop 2000 C is slightly more versatile, but still less reliable at lower concentrations, with a dsDNA concentration detection limit of around 2 ng/! l (NanoDrop 2000/2000c Spectrophotometer V1.0
User Manual, n.d.). For example, it is unreasonable for the NanoDrop Lite to yield 4.3 ng/! l and the NanoDrop to yield 3.2 ng/! l with an expected value of 3.0 ng/! l at a 1:100 dilution. These values are more accurate pre–cleaning than post–cleaning, but since the NanoDrop Lite and NanoDrop 2000 C are expected to have compromised accuracy at 1:100 ng/! l dilutions, post–cleaning outcomes being inaccurate supports the observed behavior of these assays. As a result, it can be sensibly concluded
that, despite seemingly more accurate measurements performed by the NanoDrop Lite and NanoDrop 2000 C pre–cleaning, both machines have more reliable and authentic detection abilities, when recently cleaned and calibrated.
Conclusion
High–precision DNA quantification enhances the reliability of genetic data. An accurate understanding of DNA, like DNA derived from centenarian blood for aging and longevity research, is crucial for generating iPSCs. A study entitled, “A longevity specific bank of induced pluripotent stem cells from centenarians and their offspring” provides a valuable resource for investigating human longevity and resilience. The researchers obtained and characterized peripheral centenarian and offspring blood samples. Targeted methylation arrays were used to compare biological and chronological ages in these subjects. Peripheral blood mononuclear cells (PBMCs) from 20 individuals were successfully reprogrammed into quality iPSCs. The establishment of this unique iPSC bank emphasizes the importance of accurate DNA quantification in validating the analytical tools and ensuring reproducibility, especially when working with low–concentration DNA samples derived from aged individuals (Dowrey et al., 2024). For DC, retaining the original cell’s epigenetic signatures, especially those having to do with aging, requires precise DNA handling to prevent compromising the integrity of the DNA (Samoylova & Baklaushev, 2020). Optimized protocols allow researchers to explore the molecular and epigenetic drivers of aging, resilience, and longevity with ideally low risk and high accuracy. Studying aging and longevity efficiently and with accuracy has a variety of positive impacts. Aging research can be useful in extending the years of life lived in good health. By extending the health span of older adults, the burden and risk of chronic diseases can be reduced and their quality of life can be
increased. Studies on cellular senescence, a stress–induced irreversible growth arrest which is speculated to play a role in aging, and drugs targeting senescent cells have shown promise in delaying age–related diseases and improving physical function of several organs (Baker et al., 2016). Understanding the mechanisms of aging can help lead to advanced treatments for diseases like Alzheimer’s, Parkinson’s, diabetes, heart failure, and cardiomyopathies. For example, research on Alzheimer’s disease provides applications for disease modeling and cell–replacement therapy. Preventing or delaying the onset of age–related diseases can also alleviate the financial burden on healthcare systems and families, particularly in societies with aging populations. For example, Japan’s demographic landscape is changing quickly, leading to an increasing population of older people. This shift presents challenges for the Japanese healthcare system in terms of rising healthcare costs. Aging research can combat these issues. By driving diagnostic tool development, like biomarkers for dementia, understanding and optimizing the aging experience enables timely intervention while reducing long–term treatment costs (Jack et al., 2010). With increased life expectancy, aging research helps ensure older individuals to remain healthy and productive in the workforce, contributing to economic stability. Aging research also points out disparities in aging outcomes across socioeconomic, racial, and geographic lines, informing policies, accompanying biological and medical research, to promote equity in aging (Ehni & Marckmann, 2009).
Acknowledgements
Thank you to The CReM Lab and The Murphy Lab for hosting this research. This work was supported and guided by Samuel Cranston and George Murphy of The Murphy Lab at Boston Medical Center and Boston University Medical School.
References
1. Zacharias, D. G., Nelson, T. J., Mueller, P. S., & Hook, C. C. (2011). The Science and Ethics of Induced Pluripotency: What Will Become of Embryonic Stem Cells? Mayo Clinic Proceedings, 86(7), 634–640. https://doi.org/10.4065/mcp.2011.0054
2. Flosdorf, N., & Zenke, M. (2022). Dendritic cells generated from induced pluripotent stem cells and by direct reprogramming of somatic cells. European journal of immunology, 52(12), 1880–1888. https://doi.org/10.1002/eji.202149550
3. Camunas–Soler, J. (2023). Integrating single–cell transcriptomics with cellular phenotypes: cell morphology, Ca2+ imaging and electrophysiology. Biophysical Reviews, 16(1), 89–107. https://doi.org/10.1007/s12551–023–01174–2
4. Neal, C. J., Zbinden, Z. D., Douglas, M. E., & Douglas, M. R. (2024). Reducing DNA extraction costs through factorial design for the DNAdvance Kit. BMC research notes, 17(1), 397. https://doi.org/10.1186/s13104-02407063-5
5. RNA/DNA Quantification – US. (n.d.). Www.thermofisher.com. https://www.thermofisher.com/us/en/home/life–science/dna–rna–purification–analysis/nucleic–acid–quantitation.html
6. Thermo Fisher Scientific. (n.d.). Comparison of fluorescence-based quantitation with UV absorbance measurements. Thermo Fisher Scientific. https://assets.thermofisher.com/TFSAssets/LSG/Technical-Notes/fluorescence-UVquantitation-comparison-tech-note.pdf
7. Mardis, E., & McCombie, W. R. (2016). Library Quantification: Fluorometric Quantitation of Double–Stranded or Single–Stranded DNA Samples Using the Qubit System. Cold Spring Harbor Protocols, 2017(6), pdb.prot094730. https://doi.org/10.1101/pdb.prot094730
8. Joint Research Centre: Institute for Reference Materials and Measurements, Mazoua, S., Emons, H., Chung, P., Trapmann, S., Auclair, G., Zegers, I., & Corbisier, P. (2015). The certification of the mass of lambda DNA in a solution certified reference material: ERM-AD442k, Publications Office. https://data.europa.eu/doi/10.2787/58344
9. AOAC International. (2019). AOAC official method 2019.01: Gluten in foods, quantitative enzyme-linked immunosorbent assay (ELISA). https://www.aoac.org/wpcontent/uploads/2019/08/app_f.pdf
10. García Alegría, A. M., Anduro–Corona, I., Perez–Martinez, C. J., Quizan–Plata, T., Armenta–Villegas, L., Rascon–Duran, M. L., & Astiazaran–Garcia, H. (2023). DNA quantification by nanodrop spectrophotometer: estimation of method uncertainty using DNA from standard reference materials, sprague dawley rats, and humans. Journal of Chemical Metrology, 2, 1–17. https://doi.org/10.25135/jcm.83.2301.2676
11. Versmessen, N., Leen Van Simaey, Abel Abera Negash, Marjolein Vandekerckhove, Paco Hulpiau, Vaneechoutte, M., & Cools, P. (2024). Comparison of DeNovix, NanoDrop and Qubit for DNA quantification and impurity detection of bacterial DNA extracts. PLoS ONE, 19(6), e0305650–e0305650.
https://doi.org/10.1371/journal.pone.0305650
12. Nakayama, Y., Yamaguchi, H., Einaga, N., & Esumi, M. (2016). Pitfalls of DNA Quantification Using DNA–
Binding Fluorescent Dyes and Suggested Solutions. PLOS ONE, 11(3), e0150528.
https://doi.org/10.1371/journal.pone.0150528
13. Robin, J. D., Ludlow, A. T., LaRanger, R., Wright, W. E., & Shay, J. W. (2016). Comparison of DNA Quantification Methods for Next Generation Sequencing. Scientific Reports, 6(1). https://doi.org/10.1038/srep24067
14. Milavec, M., Cleveland, M. H., Bae, Y.–K., Wielgosz, R. I., Vonsky, M., & Huggett, J. F. (2021). Metrological framework to support accurate, reliable, and reproducible nucleic acid measurements. Analytical and Bioanalytical Chemistry, 414(2), 791–806.
https://doi.org/10.1007/s00216–021–03712–x
15. Liu, L., Xie, J., Li, T., & Wu, H.–C. (2015). Fabrication of nanopores with ultrashort single–walled carbon nanotubes inserted in a lipid bilayer. Nature Protocols, 10(11), 1670–1678. https://doi.org/10.1038/nprot.2015.112
16. D’Antonio–Chronowska, A., D’Antonio, M., & Frazer, K. (2019). In vitro Differentiation of Human iPSC–derived Retinal Pigment Epithelium Cells (iPSC–RPE). BIO–PROTOCOL, 9(24).
https://doi.org/10.21769/bioprotoc.3469
17. NanoDrop Microvolume Spectrophotometers – US. (n.d.). Www.thermofisher.com.
https://www.thermofisher.com/us/en/home/industrial/spectr oscopy–elemental–isotope–analysis/molecular–spectroscopy/uv–vis–spectrophotometry/instruments/nanodrop.html
18. Koetsier, G., Cantor, E., & Biolabs, E. (n.d.). A Practical Guide to Analyzing Nucleic Acid Concentration and Purity with Microvolume Spectrophotometers. Retrieved January 19, 2025, from https://www.neb.com/en/–/media/nebus/files/application–
notes/technote_mvs_analysis_of_nucleic_acid_concentratio n_and_purity.pdf?rev=c24cea043416420d84fb6bf7b554db bb&hash=09004EB6A516A960025243A057F9B7FB&srsl tid=AfmBOorGLMdRvRpnpmkmg0ryZKf_Gwa–pDYM_q5lUpMKeAR8I4Vz–eVD
19. Chung, P. Y. J., Corbisier, P., Mazoua, S., Zegers, I., Auclair, G., Trapmann, S., & Emons, H. (n.d.). The certification of the mass of lambda DNA in a solution [Review of The certification of the mass of lambda DNA in a solution]. European Commission.
20. NanoDrop Micro–UV Spectrophotometer NanoDrop Lite Plus User Guide S120 NanoDrop Lite Plus UG Revision Date. (2022). https://assets.thermofisher.com/TFS–Assets/MSD/Product–Guides/nanodrop–lite–plus–user–guide–en–s120.pdf
21. NanoDrop 2000/2000c Spectrophotometer V1.0 User Manual. (n.d.). https://assets.thermofisher.com/TFS–Assets/CAD/manuals/NanoDrop–2000–User–Manual–EN.pdf
22. Dowrey, T. W., Cranston, S. F., Skvir, N., Lok, Y., Gould, B., Petrowitz, B., Villar, D., Shan, J., James, M., Dodge, M., Belkina, A. C., Giadone, R. M., Milman, S., Sebastiani, P., Perls, T. T., Andersen, S. L., & Murphy, G. J. (2024). A longevity‐specific bank of induced pluripotent stem cells from centenarians and their offspring. Aging Cell, 24(1). https://doi.org/10.1111/acel.14351
23. Samoylova, E. M., & Baklaushev, V. P. (2020). Cell Reprogramming Preserving Epigenetic Age: Advantages and Limitations. Biochemistry (Moscow), 85(9), 1035–1047. https://doi.org/10.1134/s0006297920090047
24. Baker, D. J., Childs, B. G., Durik, M., Wijers, M. E., Sieben, C. J., Zhong, J., A. Saltness, R., Jeganathan, K. B., Verzosa, G. C., Pezeshki, A., Khazaie, K., Miller, J. D., &
van Deursen, J. M. (2016). Naturally occurring p16Ink4a–positive cells shorten healthy lifespan. Nature, 530(7589), 184–189. https://doi.org/10.1038/nature16932
25. Ehni, H.–J., & Marckmann, G. (2009). Social Justice, Health Inequities, and Access to New Age–Related Interventions. Medicine Studies, 1(3), 281–295. https://doi.org/10.1007/s12376–009–0027–3