Senior Thesis | 2025

Senior Thesis | 2025
In product development, shelf-life testing is used to track degradation over time, ensuring quality and stability prior to commercialization. Shelf-life testing entails both quantitative and qualitative measurements, the latter including taste comparisons between a product’s initial sensory profile and its sensory profile after several weeks. However, a problem arises with this particular measurement; scientists cannot ensure that their memory of the initial sensory profile is accurate, which can lead to an unreliable comparison. At HP Hood, a solution to this problem was proposed involving freezing and subsequently thawing a portion of the fresh product sample in order to replicate the initial conditions. This approach sought to provide a reliable reference point in comparative assessments, with a focus on almond milk and nondairy coffee creamer (NDC).
Both almond milk and NDC contain oil-in-water emulsions, which are prone to separation upon freezing and thawing.1-2 Separation primarily occurs due to slow freezing, which forms large ice crystals and can lead to sedimentation, creaming, or gravitational separation.2 Sedimentation occurs when particles have a higher density than the fluid around them and migrate towards the bottom of the solution.2 Creaming occurs when particles are less dense than the particles around them and move towards the top of the sample.2 Gravitational separation results from the oil
migrating towards the top of the product.2 Separation can be counteracted with fast freezing rates, which leads to a faster nucleation rate, and forms more nuclei and smaller ice crystals.2
The primary focus of this project was to identify the optimal conditions for maintaining homogenization and replicating initial conditions of almond milk and NDC upon freezing and thawing. Our findings seek to improve shelf-life testing methods of non-dairy products and provide a basis for continued research in shelf-life testing of dairy products.
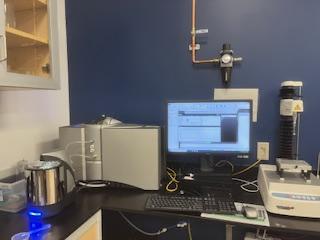
The first test was conducted to determine the optimal conditions for maintaining homogenization in almond milk after freezing and thawing. A commercially available unsweetened almond milk was used for all samples. This test sought to explore both the optimal packaging size and freeze-thaw methods. The packaging sizes included five 50 mL centrifuge tubes, five 8 oz plastic milk bottles, and two ½ gallon plastic milk bottles. Prefreeze data collection included measurement of the milk’s temperature (with a thermometer), freezing point (with an Advanced Instruments Model 4250 cryoscope), and pH (with a pH meter). The viscosity was measured with a viscometer (AMETEK Brookfield instrument) at 40 and 60 revolutions per minute (RPM) using the ULA (0) spindle; subsequently, the shear rate and shear viscosity were measured. Shear rate refers to the speed at which fluid layers flow relative to one another and shear viscosity measures the fluid resistance under shear stress. The top and
bottom solids were collected using a moisture analyzer. Particle size was measured using a light scattering method with three metrics: the mean particle size (denoted by Dx(50)), the volume containing 90% of the particle size or less (denoted by Dx(90)), and the De Broucker mean, representing the mean particle size weighted by the volume (denoted by Dx(4,3)) (Figure 1).3 Finally, the carton sediment was obtained by calculating the difference between the mass of the carton after the milk had been poured out and the mass once the carton was washed.
All tubes and bottles were frozen and then thawed. A ZPlus freezing chamber was used in order to set steps with controlled freezing temperatures and times. Three of the 50 mL centrifuge tubes and three of the 8 oz milk bottles were frozen in the freezing chamber at 11.7℉ for 60 minutes, and subsequently at 5℉ for 30 minutes (Figure 2A). All six of the tubes and bottles
were thawed in the freezing chamber at 40℉ for 30 minutes (Figure 2A). The remaining two 50 mL centrifuge tubes and two 8 oz milk bottles were frozen in the laboratory's walk-in freezer at14.0℉ for 30 minutes (Figure 2B). The four tubes and bottles were initially thawed in the laboratory's walk-in refrigerator at 36℉ for 60 minutes, then placed at room temperature to fully thaw (Figure 2B). These four tubes and four bottles were put back in the walk-in fridge once thawed. Both ½ gallon milk bottles were frozen in the freezing chamber in the same conditions as one another. The temperature was brought to 5℉ for five minutes, then was brought to 5℉ for 30 minutes, and then dropped to 0℉ for 60 minutes (Figure 2C). The first ½ gallon bottle was thawed in the freezing chamber: the temperature was brought to 40℉ for five minutes, then was brought to 40℉ for 45 minutes, set to 50℉ for 90 minutes, brought once again to 60℉ for 90 minutes, and was finally placed out at room temperature to completely thaw (Figure 4). The second ½ gallon bottle was thawed at room temperature the entire time (Figure 2C).
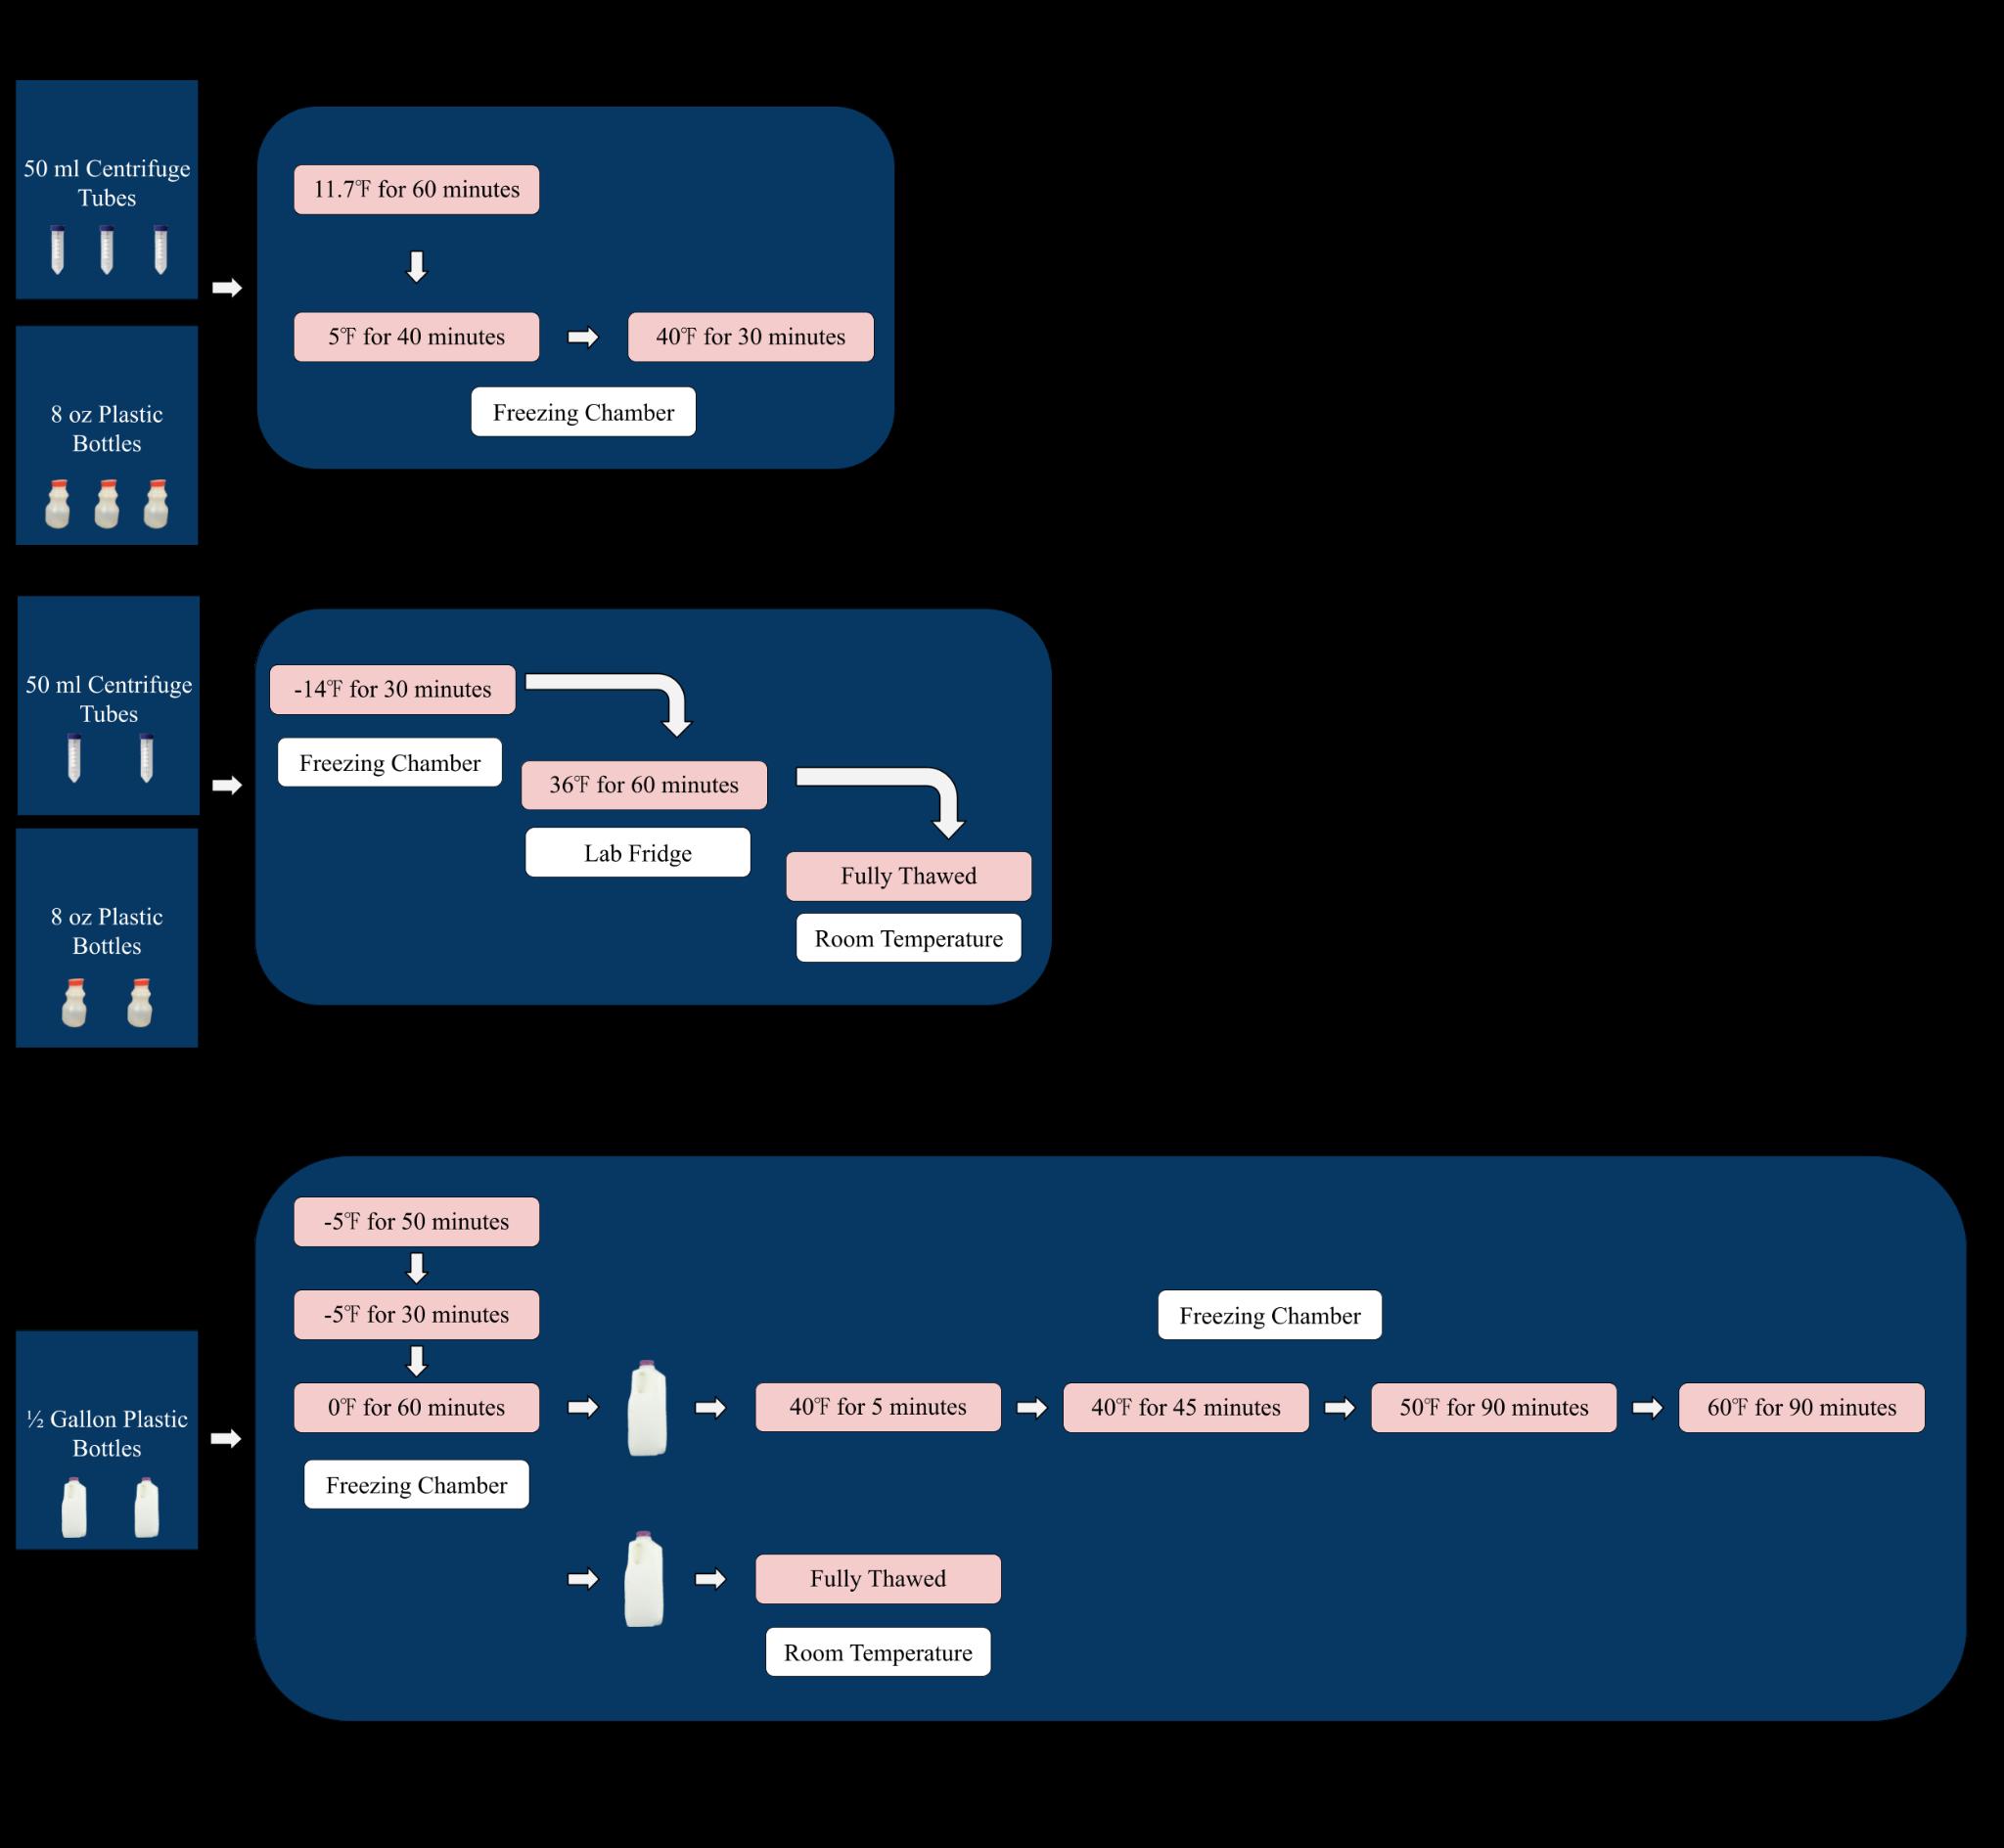
Figure 2. Freeze-thaw steps for the packaging size and freeze-thaw methods almond milk test. Freezing and thawing steps for three 50 mL centrifuge tubes and three 8 oz plastic bottles (Figure 2A). Freezing and thawing steps for two 50 mL centrifuge tubes and two plastic 8 oz bottles (Figure 2B). Freezing and thawing steps for two ½ gallon plastic bottles (Figure 2C).
Once all milk samples were frozen and thawed, quantitative measurements were made for comparison with pre-freeze results. pH, viscosity, top and bottom solids, particle size, and carton sediment were measured using the same methods as pre-freeze data collection. Viscosity was only measured with the rheometer for 50 mL and 8 oz samples. Viscosity of ½ gallon samples was measured with the viscometer.
A sensory test was conducted to determine whether there was a significant difference in sensory attributes between almond milk stored in the fridge and almond milk frozen and then thawed. These new test samples were 8 oz bottles frozen in the freezing chamber, in which they spent five minutes rising to 0℉, froze at 0℉ for 75 minutes, and then at -5℉ for 60 minutes. They were thawed at 40℉ for 30 minutes in the freezing chamber, put in the 40℉ lab fridge overnight, and then back in the freezing chamber at 55℉ for 30 minutes the following day. Samples were shaken well, poured into 2-oz cups, and stored in the sensory room refrigerator. Six samples were placed on trays, and then participants were asked to remove one sample at random. The test was a blind two-out-offive test, in which the 14 participants were asked to select the two samples different from the other three samples on their trays and provide reasoning if correct.
The second test was conducted to explore the conditions essential to maintaining homogenization in NDC. Controlled experimental designs were based on the conditions in a lab fridge malfunction where NDC was frozen and thawed without separation. A commercially available oat-based French Vanilla
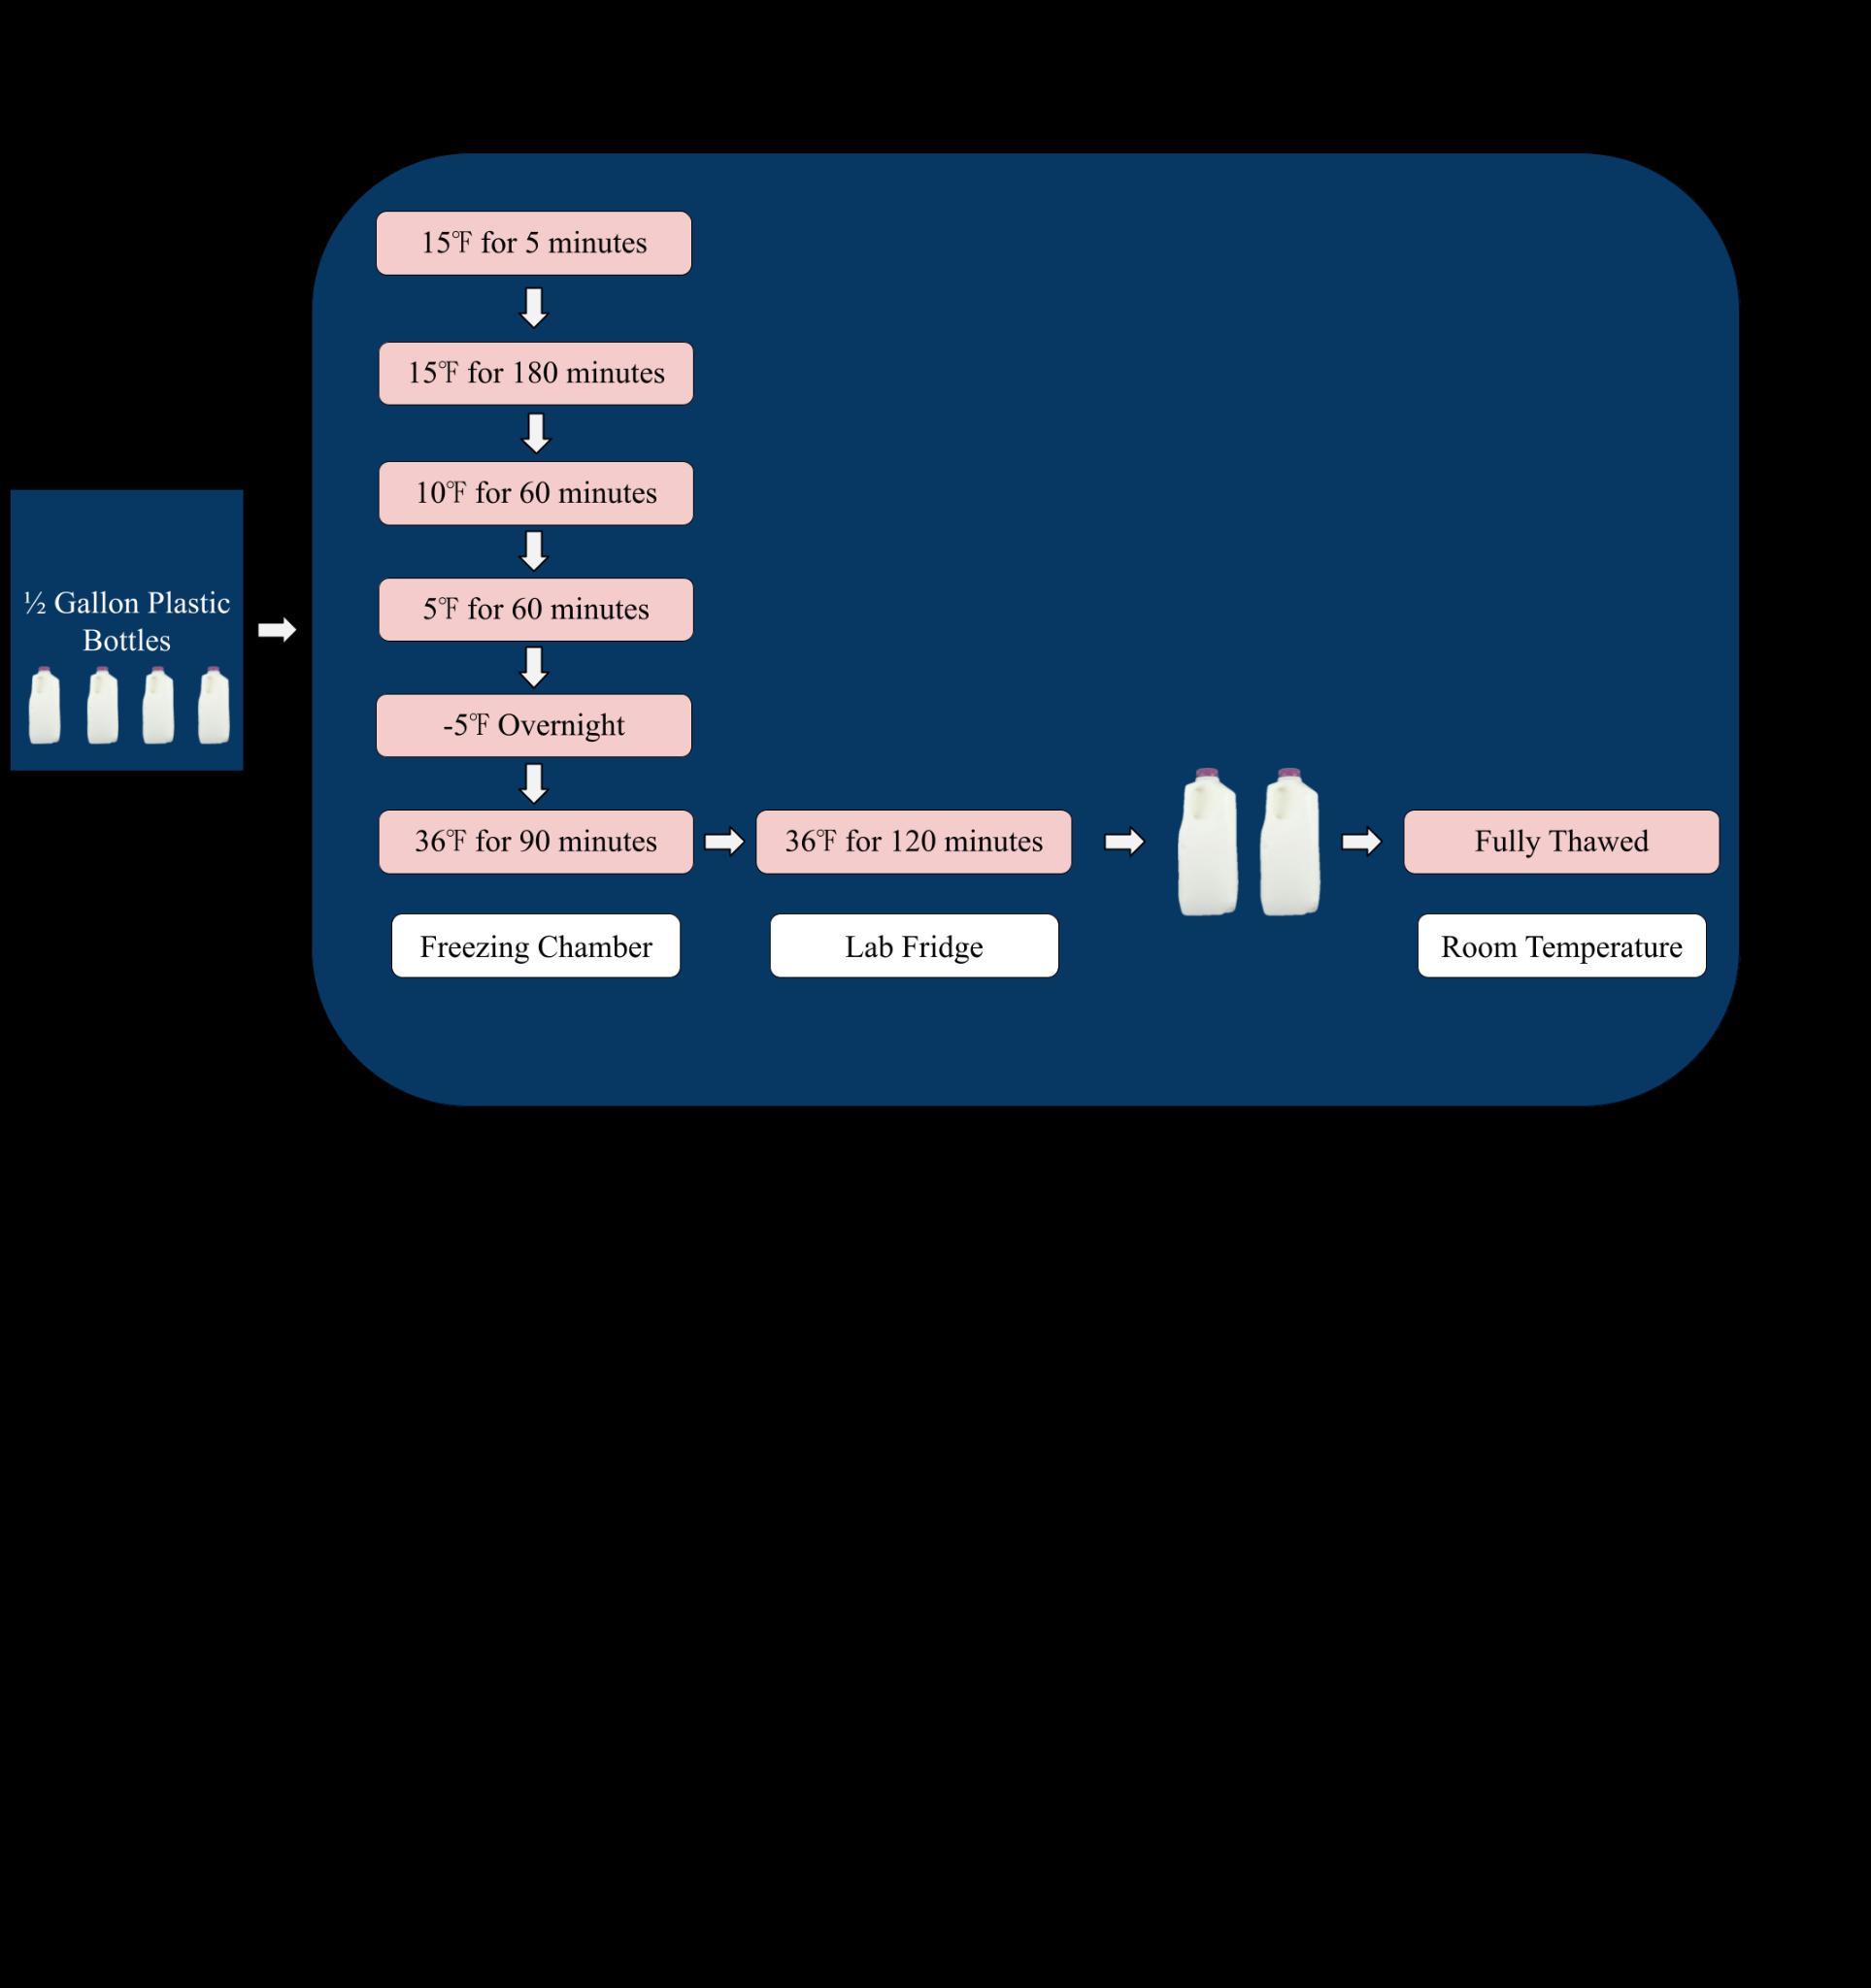
creamer was used for the test, with four ½ gallon plastic bottle samples. Pre-freeze data was collected using the methods for the almond milk test, as described above, but using only the viscometer with 30 RPM and Spindle 61 to collect viscosity. A supplemental measurement was added as well, with top and bottom fat percentages being collected using a moisture analyzer. All four samples were frozen in the freezing chamber, initially being brought to 15℉ for five minutes, then being set to 15℉ for 180 minutes, brought to 10℉ for 60 minutes, and once again to 5℉ for 60 minutes, and then staying at -5℉ overnight (Figure 3). Samples were thawed in the freezing chamber at 36℉ for 90 minutes and then placed in the 36℉ laboratory fridge for two hours (Figure 3). Two of the four samples were put out at room temperature to finish thawing (Figure 3). Post-freeze data was collected with the same measurements as pre-freeze data.
laboratory fridge overnight and fully thawed in the freezing chamber the following day. Samples were poured into 2 oz cups and stored in the sensory room refrigerator. The test was a blind two-out-of-five test, in which participants were tasked with distinguishing the two samples different from the remaining three on their trays, with 15 respondents.
Almond Milk
Both quantitative and visual data were collected for the packaging size and freeze-thaw methods tests. Pre- and post-freeze data show that after freezing and thawing, pH generally decreased across all packaging volumes (Table 1). In the 50 mL centrifuge tubes, pH was maintained in two samples and slightly decreased in value for the other three samples. For the 8 oz plastic bottles, pH increased for one sample, decreased for two samples, was held constant for one sample, and was not obtained for one sample. pH decreased for both samples in the ½ gallon bottles.
Top solids also generally decreased for all samples across the experiment (Table 1). All top solids decreased for the 50 mL centrifuge tubes, except for one sample, although the values by which it decreased varied considerably. The same pattern was maintained for the 8 oz plastic bottles. Top solids increased considerably for one of the ½ gallon bottle samples and decreased considerably for the other. Conversely, bottom solids increased for nearly all samples. They increased for all five 50 mL centrifuge tube samples. They increased in value for four of the five 8 oz plastic bottle samples, although notably less than the centrifuge tubes. Bottom solids increased for both ½ gallon plastic bottles.
Each packaging volume exhibited a distinct pattern in the fluctuation of carton sediment values from pre-freeze to postfreeze (Table 1). The carton sediment for the 50 mL centrifuge tube decreased for all samples after freezing and thawing. It increased for three of the 8 oz plastic bottles, while data was not obtained for the other two samples. It increased for both ½ gallon
bottles, although it increased considerably more for the second one.
Table 1. Pre- and post-freeze data for pH, top and bottom solids, and carton sediment for 50 mL centrifuge tubes, 8 oz plastic bottles, and ½ gallon plastic bottles in packaging size and freezethaw methods almond milk experiment. Gray boxes indicate data that was not collected.
1/2 Gallon Plastic
1/2 Gallon
Plastic
Particle sizes for all three packaging types show that the mean particle size, represented by Dx(50), generally decreased for the 50 mL centrifuge tubes and 8 oz bottles, while it increased for the ½ gallon bottles (Table 2). Dx(90), the volume containing 90% of the particle size or less, generally increased for the 50 mL centrifuge tubes and 8 oz bottles, although not considerably in value. It stayed constant for one of the ½ gallon bottle samples and decreased slightly for the other. The De Broucker mean, represented by Dx(4,3), also generally increased for the 50 mL centrifuge tubes and 8 oz bottles while it decreased for the ½ gallon bottles.
Table 2. Pre- and post-freeze data for particle sizes of 50 mL centrifuge tubes, 8 oz plastic bottles, and ½ gallon plastic bottles in packaging size and freeze-thaw methods almond milk experiment. Metrics include the mean particle size, denoted by Dx(50), the volume containing 90% of the particle size or less, denoted by Dx(90), and the De Broucker mean, representing the mean particle size weighted by the volume, denoted by Dx(4,3).3
The particle size graphs reach similar peaks from pre-freeze to post-freeze in the 50 mL centrifuge tubes and 8 oz bottles, with 2.2% of the volume containing 0.52 μm at the first peak and 9.86% of the volume containing 11.2 μm at the second peak (Figures 4-6). More deviation appears between the pre-freeze and post-freeze particle size graphs for the ½ gallon bottles (Figures 7-8). While the pre-freeze graph hits two peaks at 0.405 μm and 11.2 μm, containing 2.6% and 3.04% of the volume, respectively, the postfreeze graph hit one small peak at 0.594 μm containing 1.53% of the volume and a larger peak at 11.2 μm containing 4.18% of the volume (Figures 7-8).
The relationship between pre-freeze and post-freeze shear viscosity and shear rate for both 50 mL centrifuge tubes and 8 oz bottles show a considerable decrease in viscosity after freezing (Figures 9-11). Viscosity for the ½ gallon bottles was measured using a viscometer (Table 3). Similar to the other two packaging volumes, the ½ gallon bottles decreased in viscosity after freezing and thawing, with the first sample decreasing in value considerably more than the second sample.
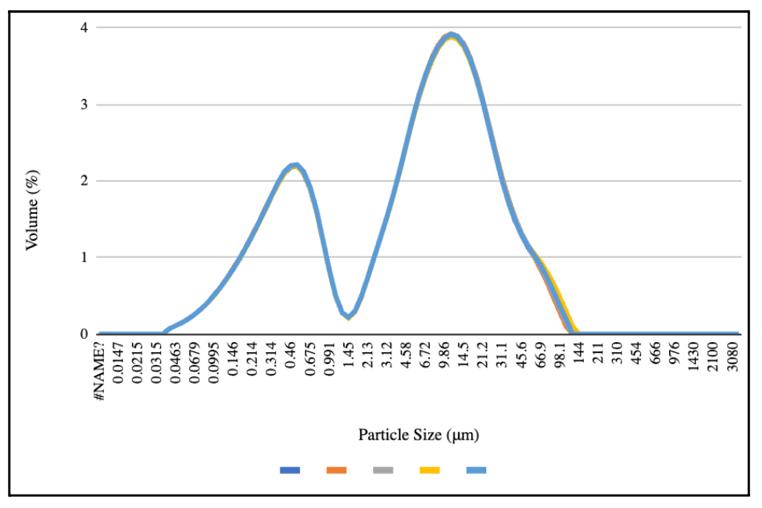
Figure 4. Pre-freeze particle size for the 50 mL centrifuge tubes and 8 oz plastic bottles.
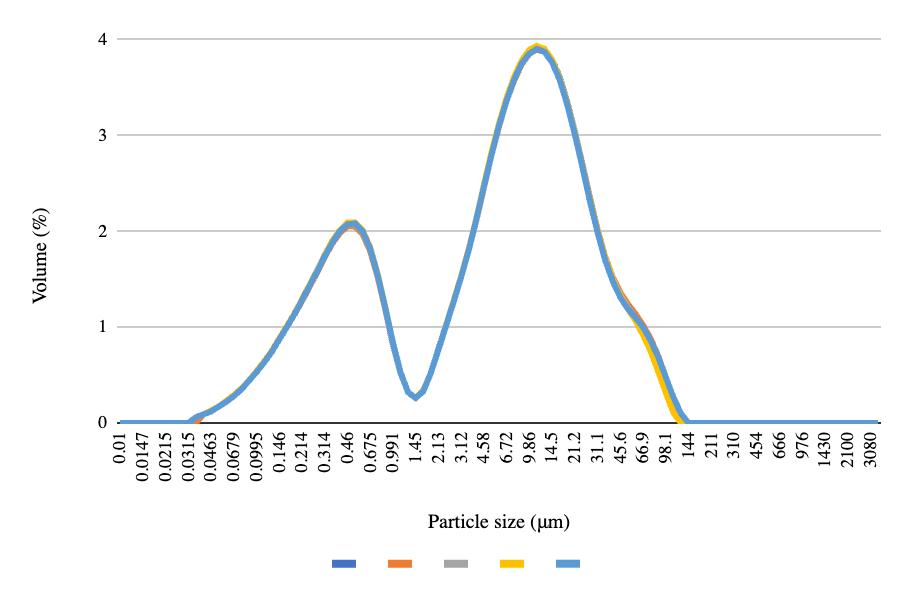
Figure 5. Post-freeze particle size for the 50 mL centrifuge tubes.
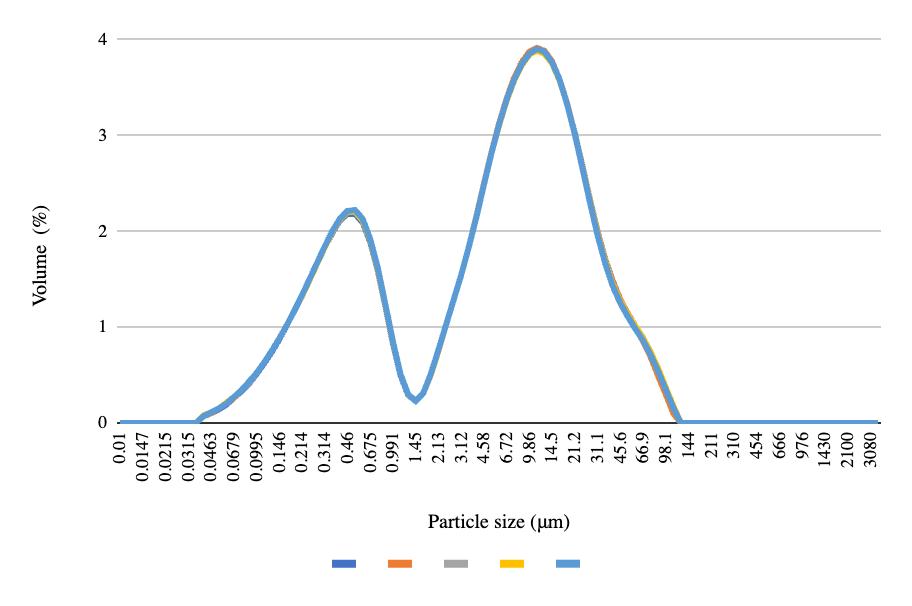
Figure 6. Post-freeze particle size for the 8 oz bottles
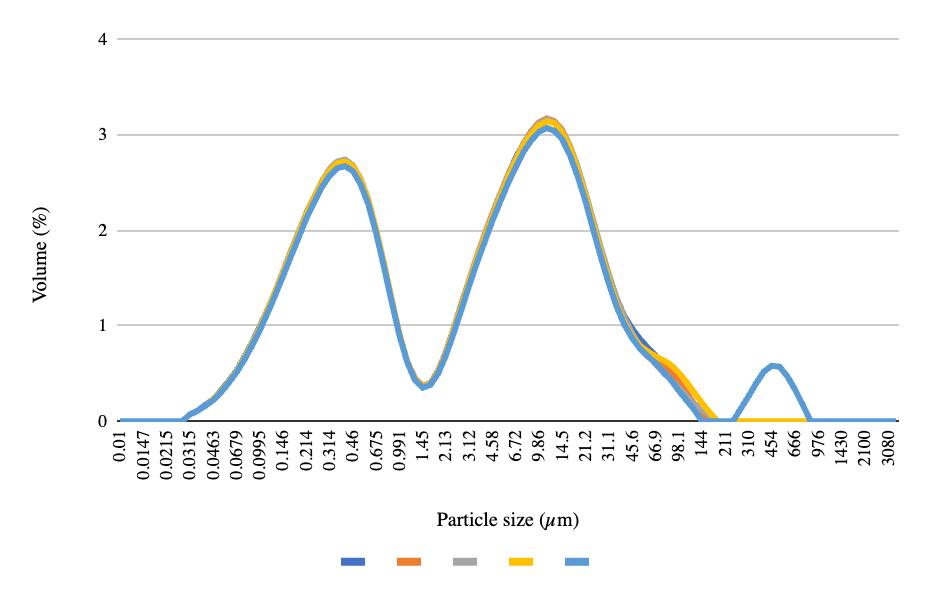
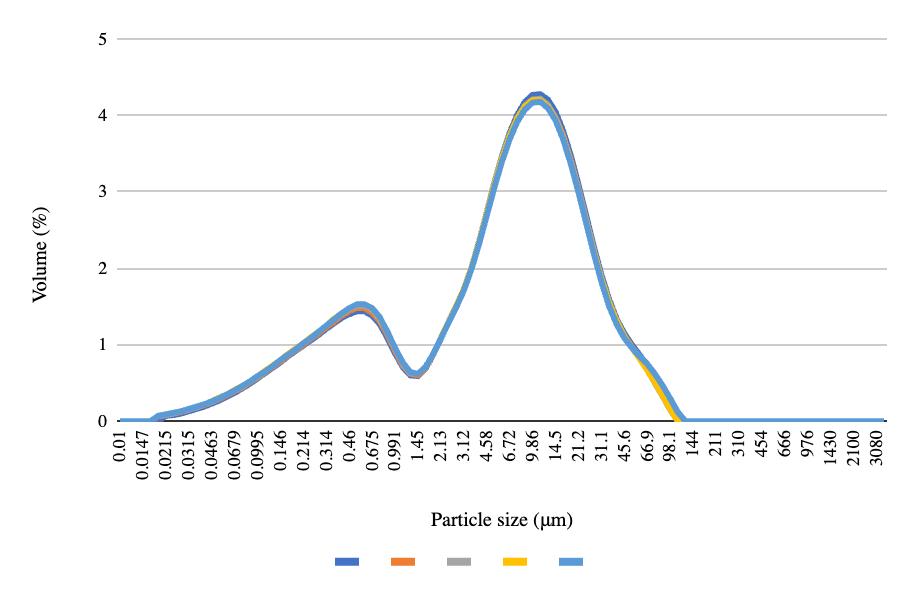
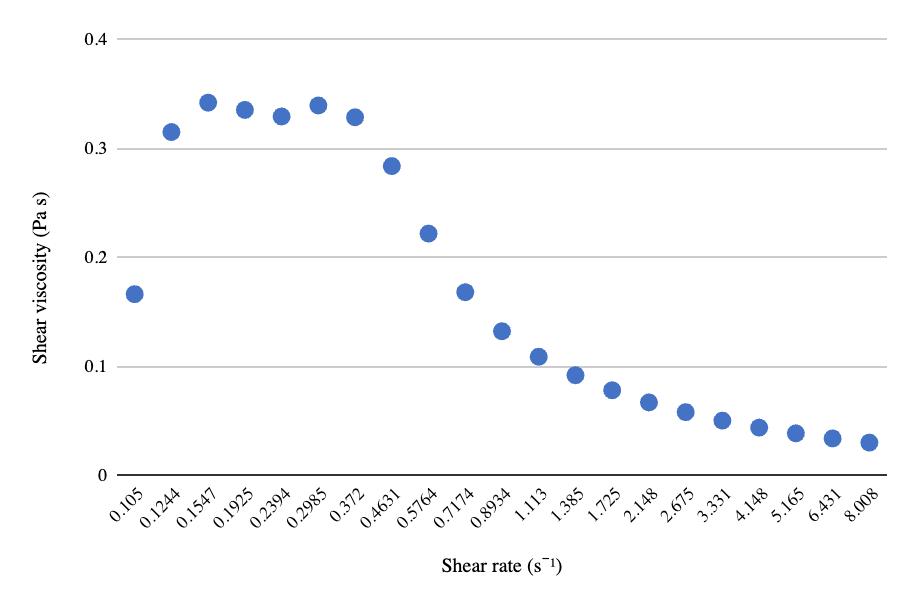
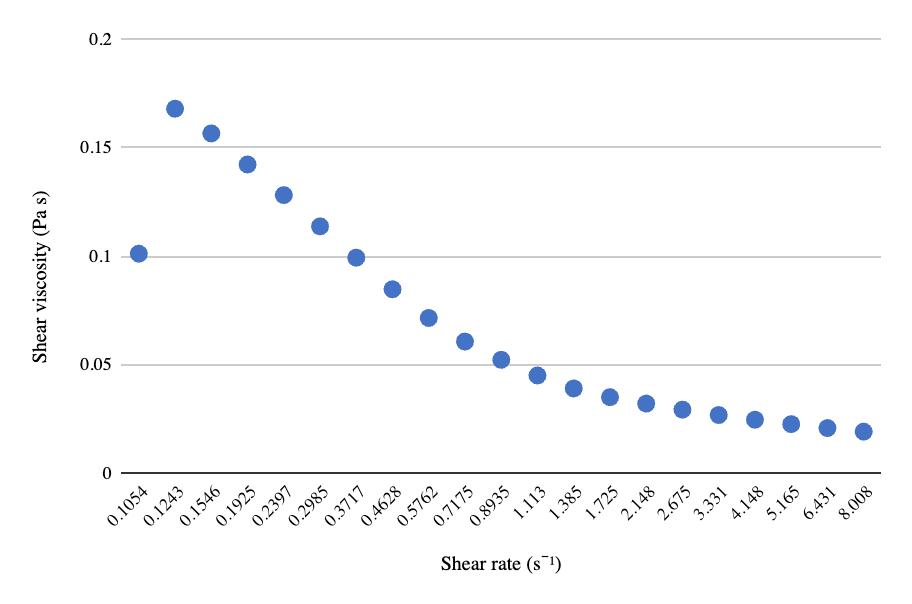
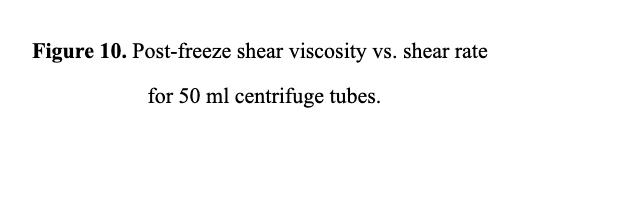
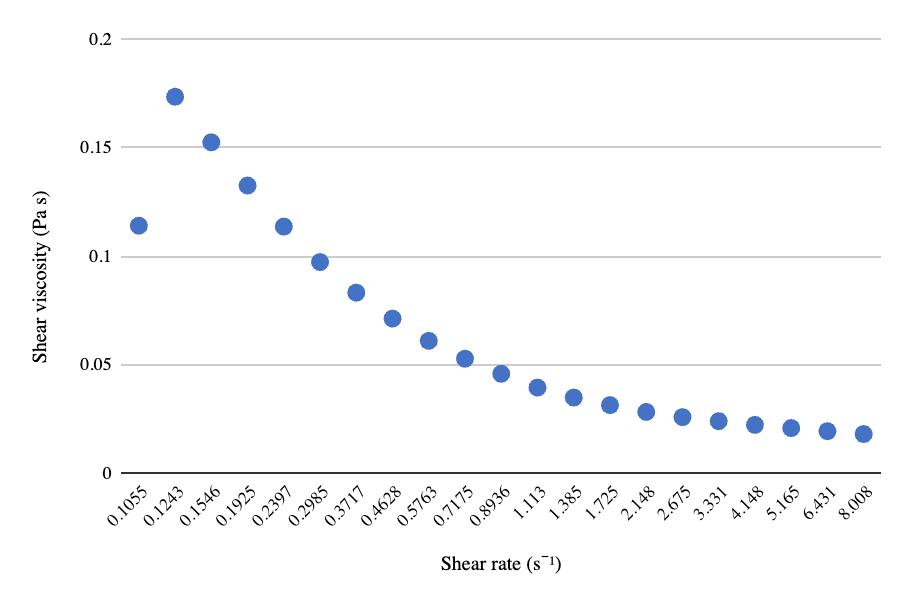
Table 3. Pre- and post-freeze viscosity at 40 and 60 RPM measured on viscometer with spindle ULA (0) for ½ gallon milk bottles in packaging size and freeze-thaw methods almond milk experiment.
Viscosity 40
Viscosity 40
Sample
RPM with Spindle ULA (0) Pre-Freeze
RPM with Spindle ULA (0) PostFreeze
Viscosity 60
RPM with Spindle ULA (0) Pre-Freeze
Viscosity 60 RPM with Spindle ULA (0) Post-Freeze
The freezing point charts obtained using the freezing chamber’s probe for the 50 mL centrifuge tubes and ½ gallon plastic bottles show a faster freezing rate for the centrifuge tubes (Figures 12-13). The centrifuge tubes reached the freezing point of 32°F within the first minute of freezing and continued decreasing relatively steadily in temperature until 76 minutes, after which it started decreasing more rapidly (Figure 12). The average freezing rate was 0.18°F/minute. The ½ gallon bottle initially appeared at the freezing point, briefly increased, then reached the freezing point again after four minutes (Figure 13). It also decreased steadily in temperature until 90 minutes, after which it began fluctuating between 19°F and 23°F (Figure 13). The average freezing rate was 0.1°F/minute. The trajectories of both products’ temperatures generally followed the freezing chamber’s temperature throughout the 120 minutes, including the overall downward trend and the occasional peaks.
Figure 12. Chamber temperature, product temperature, and freezing point for 50 mL centrifuge tubes across 120 minutes in packaging size and freeze-thaw methods almond milk experiment.

Figure 13. Chamber temperature, product temperature, and freezing point for 8 oz bottles across 120 minutes in packaging size and freeze-thaw methods almond milk experiment.
Pictures were taken after each sample was thawed to capture the degree of separation in relation to the packaging type and the freeze-thaw methods. There was more visible separation in a centrifuge tube frozen and thawed in the freezing chamber (Figure 14, left) than the adjacent tube frozen in the freezing chamber and then thawed in the lab fridge and at room temperature (Figure 14, right). The tube to the left has a more transparent portion that has migrated towards the top of the sample, with a solid portion collecting at the bottom, while the tube to the right has a slightly more homogenized appearance, although slight separation is still visible. The 8 oz bottle frozen and thawed in the freezing chamber
showed slightly more separation than the bottle thawed in the lab fridge and at room temperature as well (Figures 15A, 15B). Figure 15A depicts a slightly more transparent portion at the top of the sample, although there is notably less separation than both centrifuge tubes. Figure 15B shows no apparent separation.
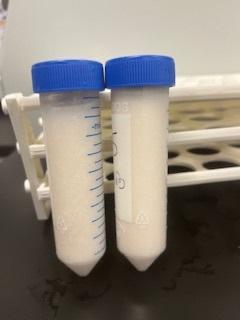
Figure 14. Comparison between one 50 mL centrifuge tube frozen and thawed in the freezing chamber (left) and one tube frozen in the freezing chamber, and subsequently thawed in the lab fridge and at room temperature (right).
15A
15B
Figure 15. Comparison between one 8 oz bottle frozen and thawed in the freezing chamber (Figure 15A) and one tube frozen in the freezing chamber, and subsequently thawed in the lab fridge and at room temperature (Figure 15B).
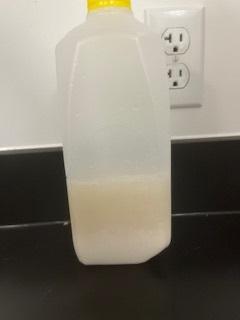
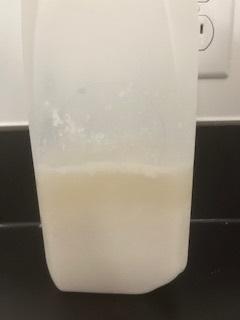
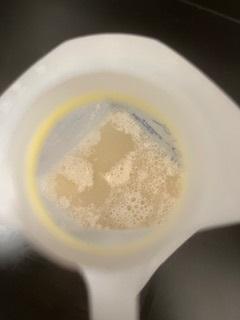
Consistent with the two previous packaging types, more separation appeared in the ½ gallon milk bottles thawed in the freezing chamber than in the bottles thawed at room temperature (Figures 16-17). Notably, there was still visible separation in the bottle thawed at room temperature, particularly apparent with the particle clusters presented from a bird’s eye view (Figure 17B). Both samples appeared fully homogenized after shaken well (Figures 16B, 17C, 17D).
16A

16B
Figure 16. ½ gallon milk bottle thawed in the freezing chamber before (Figure 16A) and after shaking (Figure 16B).
17A Figure 17B
17D
Figure 17. ½ gallon milk bottle thawed at room temperature before (Figures 17A, 17B) and after shaking (Figures 17C, 17D).
The sensory test determined that there is no evidence of a significant difference between the control non-frozen almond milk and the frozen and thawed almond milk, with a P-value of .0.4154. 2 out of 14 participants correctly distinguished the test sample from the control. Those that identified the test sample commented that it tasted slightly more bitter, had particles sticking to the side of the sample cups, and had more oil residue at the surface.
Pre- and post-freeze quantitative data for the NDC experiment show that pH decreased across all four samples after freezing and thawing (Table 4). Top solids and top fats increased, while bottom solids and fats decreased. Carton sediment increased for all samples except the fourth one. The mean particle size, the volume containing 90% of the particle size or less, and the De Broucker mean all increased across each sample after freezing and thawing (Table 5). The pre-freeze graph had its largest peak with 11.07% of the volume containing 2.13 μm, and the post-freeze graph had its largest peak with 8.97% of the volume containing 3.55 μm (Figures 18-19). Viscosity decreased for all samples after freezing (Table 6).
Table 4. Pre- and post-freeze data for pH, top and bottom solids, top and bottom fats, and carton sediment in NDC experiment.
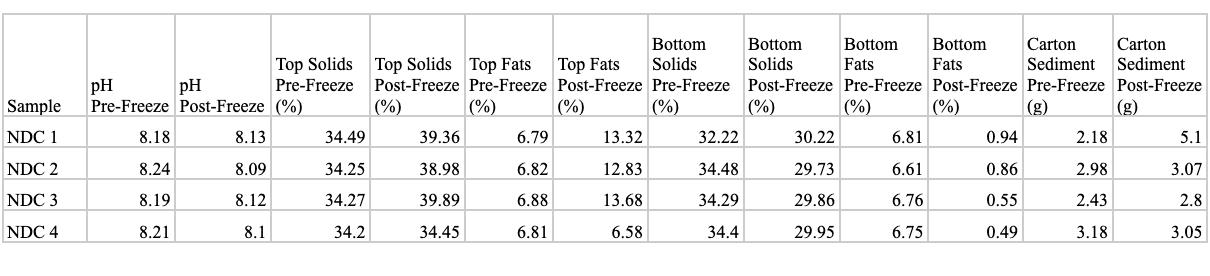
Table 5. Pre- and post-freeze data for particle sizes in NDC experiment. Metrics include the mean particle size, denoted by Dx(50), the volume containing 90% of the particle size or less, denoted by Dx(90), and the De Broucker mean, representing the mean particle size weighted by the volume, denoted by Dx(4,3).3
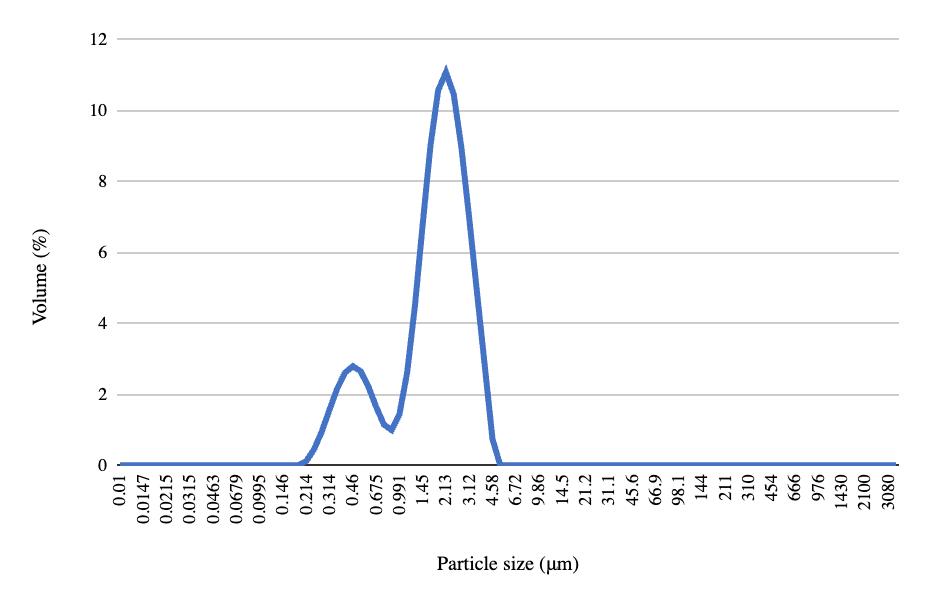

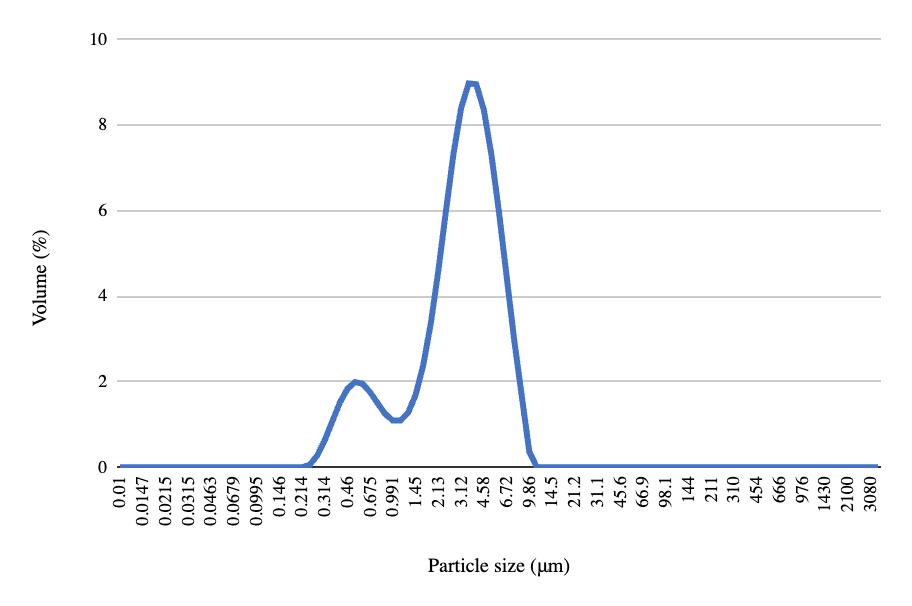
Table 6. Pre- and post-freeze viscosity at 30 RPM measured on viscometer with spindle 61 for NDC experiment.
Figure 20 presents the relationship between the NDC’s temperature and the time spent in the freezing chamber across 280 minutes. The NDC was initially below the freezing point at 15.2°F, likely due to an error with the freezing probe. The product’s temperature declined steeply for the first 50 minutes, then began Declining less steeply, and eventually plateauing at around -5°F. The average freezing rate was 0.07°F/minute.
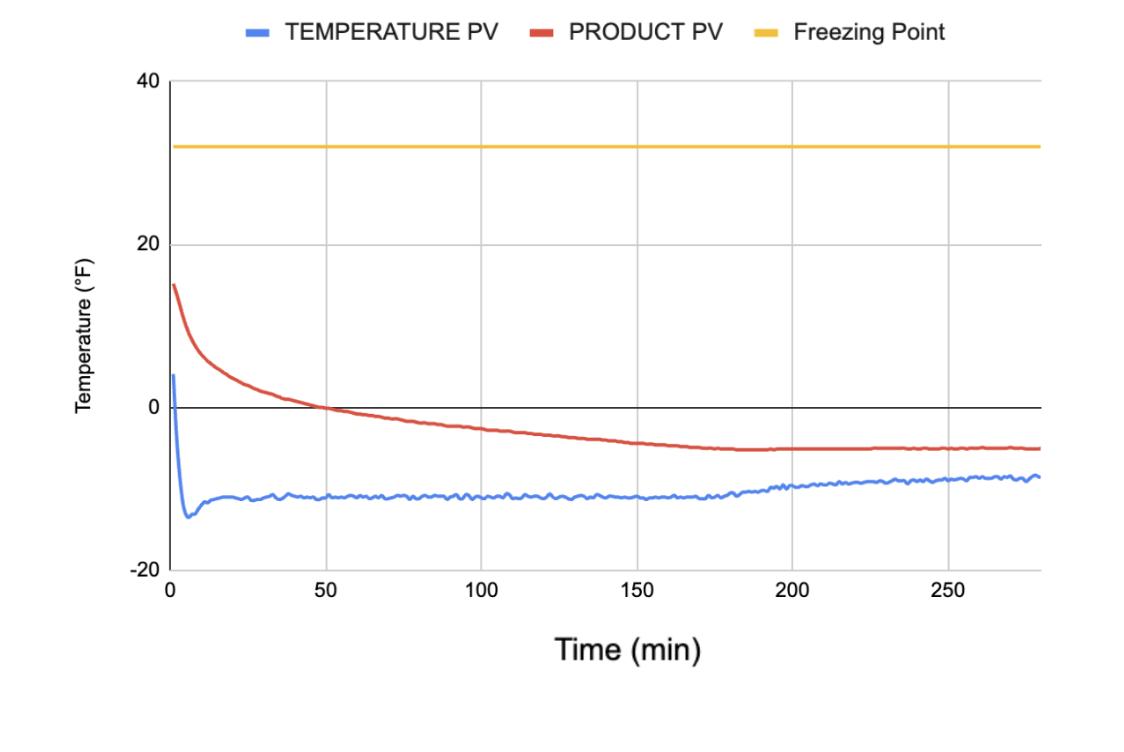
Figure 20. Chamber temperature, product temperature, and freezing point across 280 minutes in NDC experiment.
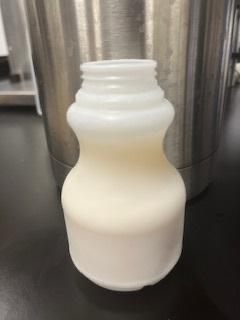
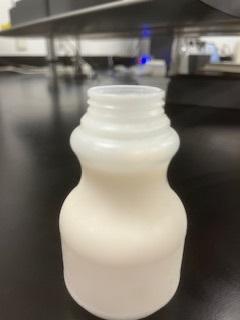
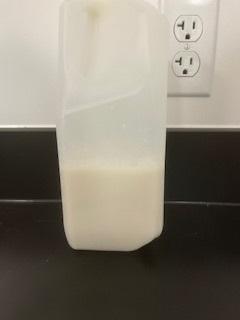
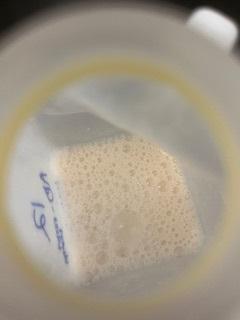
Figure 21 presents pictures of the NDC before and after thawing. The NDC thawed only in the freezing chamber and lab fridge (Figure 21B) shows more apparent separation than the NDC thawed subsequently at room temperature (Figure 21D). Figure 21D still presents clear separation; however, the liquid portion at the bottom of the sample appears closer in color to the cream portion sitting at the top, suggesting less disruption of the emulsion. All samples appear completely homogenized after shaking (Figures 21C, 21E).
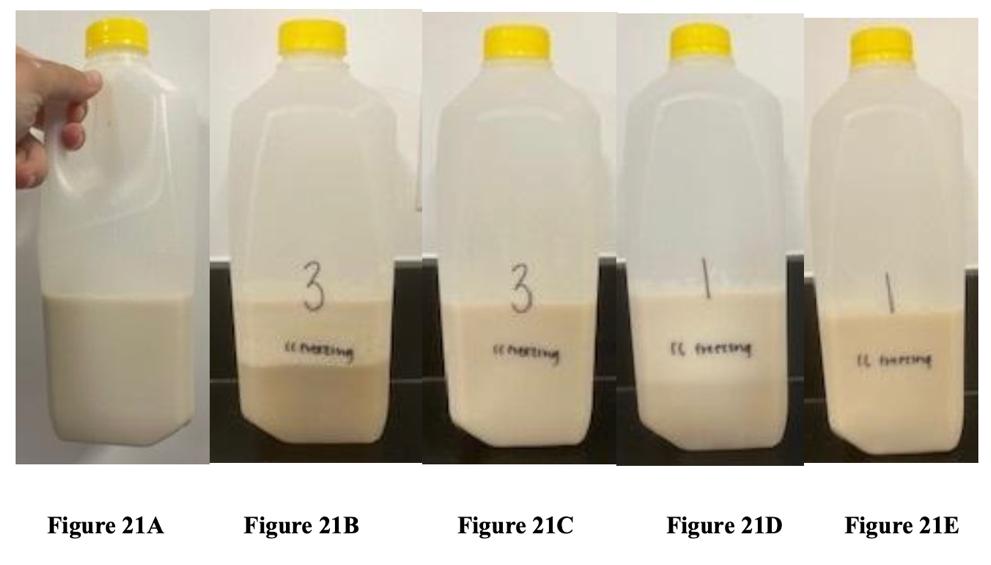
Figure 21. Pre- and post-freeze pictures of NDC in ½ gallon bottles. Pre-freeze NDC (Figure 21A). Post-freeze NDC thawed only in the freezing chamber and lab fridge before shaking (Figure 21B). Post-freeze NDC thawed only in the freezing chamber and lab fridge after shaking (Figure 21C). Post-freeze NDC thawed in the freezing chamber, lab fridge, and at room temperature before shaking (Figure 21D). Post-freeze NDC thawed in the freezing chamber, lab fridge, and at room temperature after shaking (Figure 21E).
The sensory test determined that there is no evidence of a significant difference between the control plain NDC and the frozen and thawed plain NDC with a P-value of 0.4510. 2 out of 15 participants correctly distinguished the two samples, one commenting that the frozen NDC tasted less sweet than the control sample, and the other attributing their guess to luck.
Almond Milk
The packaging volume and freeze-thaw methods test determined that the 8 oz bottles were most effective in maintaining homogeneity due to the optimal combination of a smaller volume and thinner packaging material, as well as the successful sensory test.
Quantitative data obtained from the experiment followed similar trends from pre- to post-freeze data for all packaging volumes. Because of the consistent trends across all packaging volumes, a particular volume could not be recommended from the quantitative data alone. The decrease in pH may have primarily affected the unfrozen region, in turn changing colloidal interactions between droplets.4 As reflected by the migration of particles toward the bottom portion of the samples (Figures 14-17), the top solids decreased after freezing while the bottom solids increased. This is likely a result of sedimentation, in which the particles had a higher density than the fluid around them.5 Although previous studies have indicated that particle size increases after freezing, the mean particle size only increased for the ½ gallon bottles, while it decreased for the 50 mL centrifuge tubes and the 8 oz plastic bottles.5 This may be because the ½ gallon bottles spent longer freezing and thawing, and a slower freezing rate has been shown to result in a larger increase in mean particle size, whereas faster freezing has only shown a slight increase in particle size.4 Consistent with previous work, the particle size distribution graphs were almost entirely bimodal, in which the two peaks corresponded to the fat droplets and starch
granules, respectively, as the light scattering instrument is more sensitive to the starch granules’ higher refractive index.6
Previous studies have shown viscosity to increase in samples after freezing and thawing, as the formation of ice crystals increases the solute concentration in unfrozen regions, and in turn increases the viscosity in those regions.4 While the considerable decrease in viscosity in this study is not consistent with the previous work, an alternate explanation is that small samples of the almond milk were extracted to place into the rheometer and gather viscosity values (for the 50 mL centrifuge tubes and 8 oz bottles). These samples were extracted from the top of the tubes and bottles, where the majority of the liquid had migrated as a result of sedimentation, and in turn, resulted in a much lower viscosity value. Similarly, the spindle used for the viscometer when measuring viscosity for the ½ gallon bottles may have only reached the liquid portion of the almond milk.
While the 50 mL centrifuge tubes decreased in carton sediment after freezing, the 8 oz and ½ gallon bottles increased after freezing. This was likely a result of the packaging material, as the centrifuge tubes were made of thicker plastic, which had a smoother surface than the paper milk carton, while the 8 oz bottles and ½ gallon bottles were made of thinner plastic, which the particles stuck to more than the carton.
The 50 mL centrifuge tubes reached their freezing point faster and had a faster freezing rate than the 8 oz plastic bottles (Figures 12-13). The smaller volume likely froze the almond milk faster because of a faster crystallization process.7 With fast cooling, a lower free energy must be reached to trigger nucleation.7 Nucleation thus happens instantaneously, forming a larger number
of nuclei, and smaller crystals.7 With slower cooling, nucleation takes a longer time to occur and forms larger ice crystals.7 Normally, smaller ice crystals maintain oil-in-water emulsions while larger ice crystals disrupt them.2 However, in practice, the 8 oz bottles maintained the emulsion best out of all packaging volumes, likely due to the optimal combination of their volume and packaging material (Figures 14-17). Their smaller volume allowed the milk to freeze faster than the ½ gallon bottles, while their thin plastic material enabled cooling to enter the product at a faster rate than the thicker plastic centrifuge tubes, with respect to their volumes.8
Across all packaging volumes, less sedimentation was observed with bottles thawed at room temperature than bottles thawed in the freezing chamber (Figures 14, 15, 17). Previous studies have shown that milk stored at constant temperatures show less separation, which may offer an explanation as to why almond milk thawed at room temperature maintained homogeneity more than the milk that underwent multiple steps at different temperatures in the freezing chamber.9
There was no significant difference between non-frozen almond milk and the frozen and thawed almond milk, likely because emulsion was restored after vigorous shaking. Thus, the 8 oz bottles can be recommended for future shelf life testing of almond milk products. The oil residue reported by one participant may be a result of gravitational separation that occurred particularly in one frozen and thawed sample.2
The NDC test determined that NDC frozen in ½ gallon bottles in the freezing chamber then thawed in the freezing chamber, laboratory fridge, or at room temperature may be used in comparison tests for shelf life testing. The NDC only required one trial to determine the optimal freeze-thaw conditions because the higher sucrose concentration led to a more stable emulsion.10 In high-sucrose products such as NDC, the freezing point is depressed, leading to less ice formation.10 In turn, the unfrozen volume of the product increases, protecting concentrated lipid droplets from interface damage normally caused by ice crystal expansion.10
The quantitative data followed similar trends to the almond milk overall; pH and viscosity both decreased across all samples. Once again, the decrease in viscosity was inconsistent with previous studies, likely due to data collection errors. The shear rate was also expected to increase, as its passing of a threshold value would normally disrupt the system, releasing free oil, and decreasing resistance to flow.6 Conversely to the almond milk, top solids and fats increased, while bottom solids and fats decreased. This was likely a result of creaming and gravitational separation, in which the particles and oil had a lower density than the fluid around them, and migrated towards the top of the sample.5 The increase in carton sediment after freezing for three of the four bottles is likely because of the packaging material, once again, being more adhesive than the milk carton. All four samples increased in mean particle size, consistent with previous studies that have found particle size increases as gravitational separation increases.2
Although the NDC was initially below the freezing point, the average freezing rate was considerably slower than the almond milk samples. The NDC froze slower as a result of the sugar acting as a solute, in which the system had to release more heat to form a crystal lattice.4 Identical to the almond milk, samples thawed at room temperature showed less separation due to the reduction of steps in freezing and thawing.
The successful sensory test suggested that ½ gallon bottles are approved to be used during comparison tests for shelf life testing of NDC. One participant commented that the frozen NDC may have tasted less sweet than the control NDC either because they tasted a slightly colder sample, in which the flavor had been muted, or because the sucrose was concentrated in one area of the sample they tasted.
The goal of this project was to identify the optimal conditions for maintaining homogeneity in almond milk and NDC upon freezing and thawing. Once established, HP Hood sought to use these parameters in taste comparisons for new products by freezing a portion of the fresh product to serve as a reference for its initial conditions. This technique aimed to improve accuracy and consistency during shelf life testing for products prior to commercialization.
After quantitative and qualitative analysis, final freezethaw guidelines for almond milk and NDC were determined. For all products, it is generally recommended that they be frozen as fast as possible in the freezing chamber and in the thinnest packaging type available. If testing occurs on the day of freezing, products should initially be thawed in the freezing chamber, then fully at room temperature and in the laboratory fridge, with shaking before tasting. If testing occurs over the following days, they should be thawed for two hours at room temperature and then placed in the laboratory fridge.
It is recommended that almond milk is frozen and thawed in 8 oz plastic bottles at -15℉ for 30-60 minutes in the freezing chamber. If testing must take place within two hours or less of freezing and thawing, they should be initially thawed in the freezing chamber at 40℉ for 30 minutes and then fully thawed at room temperature, with vigorous shaking afterward. If testing occurs after more than two hours, they should be thawed at room temperature for two hours and then placed in the 36℉ laboratory fridge to thaw fully. These conditions are optimal in preventing
sedimentation of almond milk, in which particles migrate towards the bottom of the solution. In order to freeze larger samples, a sensory test should be performed to determine if almond milk can also be frozen and thawed in ½ gallon plastic bottles with no significant difference from non-frozen almond milk.
For NDC, it is recommended that samples are frozen in the freezing chamber at -20℉ to -15℉ for at least 120 minutes. If testing must take place within eight hours or less of freezing and thawing, they should be thawed in the freezing chamber at 50℉ for up to 120 minutes, placed out at room temperature for two hours, and then in the laboratory fridge to thaw fully. Identical to the almond milk, vigorous shaking must take place afterwards. If testing is happening after more than eight hours, they should be thawed at room temperature for two hours and then placed in the 36℉ laboratory fridge to thaw fully. These parameters are optimal in preventing creaming and gravitational separation of NDC, leading to a more stable emulsion.
While there were clear changes in the quantitative data for both products from pre-freeze to post-freeze, the successful sensory tests emphasize that these conditions are adequate in their practical applications. In the future, both quantitative and sensory tests should be conducted to understand the impact of packaging thickness and headspace on freeze-thaw stability. Going forward, HP Hood aims to develop freezing protocols for dairy-equivalents of almond milk and NDC, and high-fat dairy products such as yogurt and cottage cheese.
Thank you to Curtis Park and the entire HP Hood Research and Development Team for guiding me in this research.
1. Webb, B. H.; Hall, S. A. Some Physical Effects of Freezing Upon Milk and Cream. Journal of Dairy Science. 1935, XVIII(5), 275-286.
2. Degner, B. M.; Chung, C.; Schlegel, V.; Hutkins, R.; McClements, D. J. Factors Influencing the Freeze‐Thaw Stability of Emulsion‐Based Foods. Comprehensive Reviews in Food Science and Food Safety. 2014, 13 (2), 98-113. https://doi.org/10.1111/1541-4337.12050.
3. Thakur, P.; Sonawane, S. S.; Gongloves, C. Synthesis and Characterization of Nanofluids. In Nanofluid Applications for Advanced Thermal Solutions; Sonawane, S. S., Sharifpur, M., Eds.; Elsevier, 2023; pp 21–41.
4. Degner, B. M.; Olson, K. M.; Rose, D.; Schlegel, V.; Hutkins, R.; McClements, D. J. Influence of Freezing Rate Variation on the Microstructure and Physicochemical Properties of Food Emulsions. Journal of Food Engineering. 2013, 119 (2), 244–253. https://doi.org/10.1016/j.jfoodeng.2013.05.034.
5. McClements, D.J.; Newman, E; McClements, I.F. Plantbased Milks: A Review of the Science Underpinning Their Design, Fabrication, and Performance. Comprehensive
Reviews in Food Science and Food Safety. 2019, 18, 20472067. https://doi.org/10.1111/1541-4337.12505
6. Chung, C; Degner, B; McClements, D. J. Rheology and microstructure of bimodal particulate dispersions: Model for foods containing fat droplets and starch granules. Food Research International. 2012, 48 (2), 641-649. https://doi.org/10.1016/j.foodres.2012.06.011.
7. Campos, R.; Narine, S. S.; Marangoni, A. G. Effect of Cooling Rate on the Structure and Mechanical Properties of Milk Fat and Lard. Food Research International. 2002, 35 (10), 971–981. https://doi.org/10.1016/S09639969(02)00159-X.
8. Holden, N. M., Wolfe, M. L., Ogejo, J. A. & Commins, E. J. (Eds.) Introduction to Biosystems Engineering. ASABE in association with Virginia Tech Publishing, Blacksburg, Virginia. 2020, Available from https://doi.org/10.21061/IntroBiosystemsEngineering
9. Babcock, C. J.; Roerig, R. N.; Stabile, J. N.; Dunlap, W. A.; Randall, R. Frozen Homogenized Milk. 1. Effect of Freezing and Storage Temperature on the Physical Characteristics of Homogenized Milk. Journal of Dairy Science. 1946, 29 (10), 699–706. https://doi.org/10.3168/jds.S0022-0302(46)92527-1.
10. Cornacchia, L; Roos, Y. H. Lipid and water crystallization in protein-stabilised oil-in-water emulsions. Food Hydrocolloids. 2011, 25 (7), 1726-1736. https://doi.org/10.1016/j.foodhyd.2011.03.014.