MHEC POLICY BRIEF
State Higher Education Financing Models Sandy Baum MARCH 2017
I
n most states and in the nation as a whole, the
such as New Jersey and Maine, avoided such fluctuations. Many
combination of constrained resources and rapid
factors contribute to these funding patterns. Some states have
enrollment growth during the Great Recession left a
had more stable revenue flows than others; some have had less
legacy of significantly diminished per-student funding for
pressure from their Medicaid, correctional, and K-12 education
higher education. Adequate funding is a necessary component
systems; and some may place a higher priority than others on
of supporting college access and success and meeting state
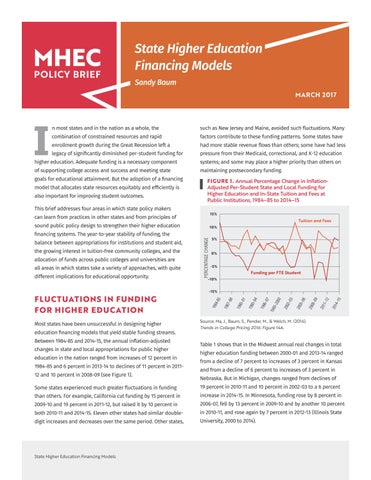
maintaining postsecondary funding. FIGURE 1. Annual Percentage Change in InflationAdjusted Per-Student State and Local Funding for Higher Education and In-State Tuition and Fees at Public Institutions, 1984–85 to 2014–15
This brief addresses four areas in which state policy makers
15%
can learn from practices in other states and from principles of
Tuition and Fees
sound public policy design to strengthen their higher education
FLUCTUATIONS IN FUNDING FOR HIGHER EDUCATION Most states have been unsuccessful in designing higher education financing models that yield stable funding streams. Between 1984-85 and 2014-15, the annual inflation-adjusted changes in state and local appropriations for public higher education in the nation ranged from increases of 12 percent in 1984-85 and 6 percent in 2013-14 to declines of 11 percent in 201112 and 10 percent in 2008-09 (see Figure 1).
Funding per FTE Student
-10% -15%
201 4–1 5
different implications for educational opportunity.
-5%
200 8–0 9 201 1–1 2
all areas in which states take a variety of approaches, with quite
0%
200 5–0 6
allocation of funds across public colleges and universities are
5%
200 2–0 3
the growing interest in tuition-free community colleges, and the
PERCENTAGE CHANGE
balance between appropriations for institutions and student aid,
198 4-8 5
financing systems. The year-to-year stability of funding, the
10%
199 6–9 7 199 9–2 000
also important for improving student outcomes.
I
199 0–9 1 199 0–9 4
model that allocates state resources equitably and efficiently is
198 7–8 8
goals for educational attainment. But the adoption of a financing
Source: Ma, J., Baum, S., Pender, M., & Welch, M. (2016). Trends in College Pricing 2016: Figure 14A.
Table 1 shows that in the Midwest annual real changes in total higher education funding between 2000-01 and 2013-14 ranged from a decline of 7 percent to increases of 3 percent in Kansas and from a decline of 6 percent to increases of 3 percent in Nebraska. But in Michigan, changes ranged from declines of
Some states experienced much greater fluctuations in funding
19 percent in 2010-11 and 10 percent in 2002-03 to a 6 percent
than others. For example, California cut funding by 15 percent in
increase in 2014-15. In Minnesota, funding rose by 8 percent in
2009-10 and 19 percent in 2011-12, but raised it by 10 percent in
2006-07, fell by 13 percent in 2009-10 and by another 10 percent
both 2010-11 and 2014-15. Eleven other states had similar double-
in 2010-11, and rose again by 7 percent in 2012-13 (Illinois State
digit increases and decreases over the same period. Other states,
University, 2000 to 2014).
State Higher Education Financing Models