Britain’s Changing Flora

A Summary of the Results of Plant Atlas 2020
Kevin Walker, Peter Stroh, Tom Humphrey, David Roy, Richard Burkmar & Oliver Pescott


Kevin Walker, Peter Stroh, Tom Humphrey, David Roy, Richard Burkmar & Oliver Pescott
Kevin Walker1, Peter Stroh1, Tom Humphrey1, David Roy2, Richard Burkmar2 & Oliver Pescott2
1 - Botanical Society of Britain and Ireland

2 - UK Centre for Ecology and Hydrology
Suggested citation: Walker, K.J., Stroh, P.A., Humphrey, T.A., Roy, D.B., Burkmar, R.J. & Pescott, O.L. 2023. Britain’s Changing Flora. A Summary of the Results of Plant Atlas 2020. Durham: Botanical Society of Britain and Ireland.
front cover: Urban wild-flower lawn including Bee Orchids, Ophrys apifera, Norfolk, June. Gary K Smith / Alamy Stock PhotoPlants are crucial for human survival, but we often take them for granted. Thankfully, in Britain we have a thriving community of botanists who not only appreciate wild-flowers but spend time recording where they grow. This tradition extends back to the 16th century and thanks to their efforts, Britain has one of the best studied floras in the world.
Since the 1950s, the Botanical Society of Britain and Ireland (BSBI) has been the driving force in botany in our area. It pioneered the use of dot-distribution mapping and coordinated hugely influential nationwide surveys of flowering plants and ferns in the 1950s and 1990s. Fieldwork for Plant Atlas 2020, the third such survey, took place between 2000 and 2019 and is the most comprehensive ever undertaken, involving over 8,500 volunteers who went out in all weathers to record the flowering plants, ferns and charophytes present in almost all of the 3,893 10 × 10 km grid squares (hectads) that cover Britain and Ireland. The results have been published on a website (plantatlas2020.org) and as a twovolume book.
This report provides a summary of the Plant Atlas 2020 survey for Britain1; a separate report is available for Ireland. Over the course of this survey volunteers completed a staggering 178,000 recording days2 and submitted over 26 million records. In doing so they recorded 3,445 different plant species including 1,692 that are native to Britain and, notably, 1,753 non-natives that have been deliberately or accidentally introduced into the wild by humans. This startling finding means that there are now more introduced plants growing in the wild in Britain than natives, with many originating from gardens and then spreading to establish selfsustaining populations.
Comparison of the results of Plant Atlas 2020 with its predecessors indicates how species’ distributions have changed since the 1950s; most strikingly, the known ranges of 53% of all native plants and 62% of ancient introductions (known as archaeophytes)3 are estimated to have declined, whereas the known ranges of 58% of modern introductions (known as neophytes) are estimated to have increased. The reasons for these changes are complex, but the most important driver for species estimated to have declined since the 1950s has been loss and conversion of semi-natural habitats caused by changes in land use. Chief amongst these has been the intensification of arable cultivation, which has led to substantial declines of many plants associated with arable crops. Likewise, grassland and heathland plants
1 Including the Isle of Man and the Channel Islands.
that grow on infertile soils have suffered marked declines due to the conversion of their habitats to arable or more productive agricultural grasslands, and many have also been lost following the reduction or removal of livestock and the subsequent succession to tall grassland, scrub or woodland. Drainage of wetland habitats, such as damp hay meadows and grazing marshes, bogs and mires, has also impacted many species, especially in the lowlands where the pressures from agriculture and a growing human population have been the greatest. Many plants of water-bodies, rivers and canals have also declined, mainly due to eutrophication caused by the run-off of nutrients from agricultural land but also because of increased disturbance caused by human activities.
In comparison, the distributions of plants associated with woodlands have remained relatively unchanged, although some specialists of more open areas have declined due to a cessation of traditional management such as coppicing. Species of coniferous woodland have increased due to the huge expansion of commercial forestry, which has in turn led to declines of specialist plants of heathlands and bogs, especially in upland regions in the north and west of Britain.
In general terms, plants of upland habitats have experienced less severe changes in distribution than in the lowlands, although crucially many heathland and bog specialists have declined due to burning, drainage, overgrazing and afforestation. Species that grow at high altitudes in the mountains have mostly maintained their distributions, although overgrazing by sheep and deer has restricted many arctic-alpine plants to inaccessible ledges; the decline of some montane plants associated with snow patches suggests that some species are also responding to ecological changes brought about by climate change, most notably reduced snow cover and increased competition.
Overall, three key trends have emerged from the changes described above:
● Native plants adapted to infertile conditions and low competition, and ancient introductions (known as archaeophytes) associated with cultivated land, have shown the greatest declines since the 1950s. This is largely because of changes to agricultural practices, although eutrophication from other human sources, such as atmospheric pollution, must have also played a part.
● Some southern species have expanded their ranges northwards over recent decades, whereas some northern species at the southern limits of their global
2 A ‘recording day’ is a standardised measure of recording activity and is defined as a visit to a 2 × 2 km grid square (tetrad) when 40 or more species are recorded.
3 Ancient introductions (known as archaeophytes) are species that were introduced by humans from the start of the Neolithic period until the discovery of the New World by European explorers around 1500. Modern introductions (known as neophytes) are species that were introduced by humans after 1500.
ranges in Britain have retreated. Both these trends correlate with our warming climate, most notably milder winters; southerly distributed plants are surviving further north due to the reduced frequency and severity of winter frosts, whilst some northerly distributed plants are retreating to higher ground due to reduced snow cover and increased competition with more warmth-loving plants at lower altitudes.
● An increasing number of modern introductions (known as neophytes) are becoming established in the wild in Britain, in some cases aided by climate change. Although the majority are benign additions to local floras, a small number have become invasive, disrupting ecosystem function and outcompeting native species.
Whilst these overall trends for Britain are clear, there are clear differences in how plant distributions have changed in England, Wales and Scotland. Unsurprisingly, the most marked changes have occurred in England, where pressures from human activities have been greatest, especially in lowland regions. These pressures have been less keenly felt in Wales due to the greater relative extent of extensively managed upland habitats. Consequently, many of the declines are less pronounced and, in some instances, increases in species’ distributions have been noted that run contrary to the trends in other parts of Britain. In Scotland the results were more mixed, less
Plants are all around us. They are amazing organisms that provide us with food and oxygen, and the carbon they store has powered some of our greatest technological advances. Their beauty transforms our surroundings, inspires our creativity, and improves our physical and mental well-being. But despite their importance to us, plants are often over-looked. Plant blindness – a tendency amongst humans to neither notice nor value plants in the environment – is all pervasive in modern society4 The root cause of this blindness is a lack of exposure to and connection with the natural world. This has been accentuated by the virtual extinction of botany from formal education5, so much so that many children cannot name even our commonest plants6. Regrettably, this decline in interest has happened just when plants need
severe than in England but more pronounced than in Wales, reflecting the presence of large areas of intensively managed lowlands counterbalanced by the vast extent of largely unpopulated uplands.
Plant Atlas 2020 is an astonishing achievement and highlights the crucial role that volunteers play in furthering our knowledge and understanding of the British flora. The overall message is clear – our native flora is much diminished relative to the situation recorded by our predecessors in the 1950s. We need a holistic plan of action to reverse this decline so that our flora can be restored and flourish for the benefit of this and future generations. The evidence presented here will be vital in helping shape this plan for plant conservation, which should focus on strengthening the protection of species-rich areas, extending the area of high-quality habitat available to plants and other wildlife, and reducing damaging land use practices. But most important is the need to put plants at the heart of conservation initiatives. Planning and managing all conservation measures with plants in mind will not only help to reverse declines, but also provide wider benefits for other wildlife and nature recovery more generally. These measures need to run in parallel with more effective monitoring and research and, crucially, work to raise awareness of the vital role that plants play in our everyday lives.
our attention the most. Globally, we know that 40% of plant species are threatened with extinction7 and even in Britain, where wildlife is better protected by legislation than in most parts of the world, one in every five species is listed as threatened, mainly because of the degradation of their habitats by human activities8
Although Britain has a long tradition of botanical recording stretching back to the 16th century, it was the publication of John Ray’s Flora of Cambridge in 16609 that really marked the start of recording as we recognise it today (i.e. attempts to produce a complete checklist of plants growing in a defined area). Since then, botanists have been documenting the locations of wild plants in county Floras, and this tradition has never been stronger
4 Balding, M. & Wiliams, K.J.H. 2016. Plant blindness and the implications for plant conservation. Conservation Biology, 30: 1192-1199.
5 Stroud, S., Fennell, M., Mitchley, J., Lydon, S., Peacock, J. & Bacon, K.L. 2022. The botanical education extinction and the fall of plant awareness. Ecology and Evolution, 12: e9019.
6 McFarlane, R. & Morris, J. 2017. The Lost Words. London: Hamish Hamilton.
7 Antonelli, A. et al. 2020. State of the World’s Plants and Fungi 2020. Kew: Royal Botanic Gardens.
8 Stroh, P.A., Leach, S.J., August, T.A., Walker, K.J., Pearman, D.A., Rumsey, F.J., Harrower, C.A., Fay, M.F., Martin, J.P., Pankhurst, T., Preston, C.D. & Taylor, I. 2014. A Vascular Plant Red List for England. Bristol: Botanical Society of Britain and Ireland.
9 John Ray’s Flora of Cambridge (Catalogus plantarum circa Cantabrigianum nascientum or A catalogue of plants growing around Cambridge) was published in 1660 and is credited as Britain’s first county Flora.
than it is today (Fig. 1)10. Since 1947, plant recording in these islands has been mainly carried out by thousands of dedicated volunteer members of the Botanical Society of Britain and Ireland (BSBI; formerly the Botanical Society of the British Isles)11, who go out in all weathers to record where plants grow. Thanks to their efforts, Britain has one of the best studied floras in the world.
The BSBI has undertaken three national surveys of the British and Irish flora. The most recent, Plant Atlas 2020, was based on fieldwork between 2000 and 2019 and is the focus of this report. Plant Atlas 2020 provides updated distribution maps for 3,495 plant species found growing in the wild in Britain and Ireland. The results of this survey are available on a website (plantatlas2020. org) and in a two-volume book12. Comparison with the previous surveys have revealed substantial changes in the distribution of many plant species. The main results for Britain, including the Isle of Man and the Channel Islands, are summarised here; a separate report has been produced for Ireland. We also outline here the main changes that have taken place since fieldwork was undertaken for the first atlas and its supplement in the period 1930–1969 (“long-term trends”) and, more importantly, what we need to do to restore Britain’s changing flora. Throughout this report we have used the “1950s” as a shorthand for this baseline period, as this was when the bulk of fieldwork was undertaken for the first atlas; hence we have also frequently referred to changes that have occurred “over the last 70 years”.
10 Local or county Floras provide details of all the plants known to occur in the wild in a particular area; increasingly they also include maps showing the distribution of species at 1 km or 2 km scale. Most Floras use the system of vice-counties devised by Hewell Cottrell Watson for recording purposes in the late 19th century. There are 113 in Britain (and 40 in Ireland) and most are similar to administrative counties although some of the largest are divided into two or more vice-counties (e.g. Cornwall, Lincolnshire, Yorkshire). In each vicecounty there is a BSBI ‘vice-county recorder’ who is responsible for collating, checking and submitting botanical records.
11 The BSBI can trace its roots back to 1836 as the Botanical Society of London which later became better known as the Botanical Exchange Club. The Botanical Society of the British Isles was formerly constituted in 1947 and in 2013 changed its name to the Botanical Society of Britain and Ireland.
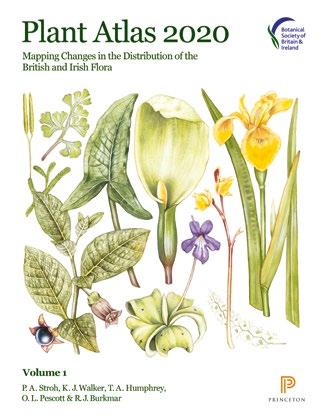
12 Stroh, P.A., Walker, K.J., Humphrey, T.A., Pescott, O.L & Burkmar, R.J. eds 2023. Plant Atlas 2020. Mapping Changes in the Distribution of the British and Irish Flora. 2 Volumes. Princeton: Botanical Society of Britain and Ireland & Princeton University Press.
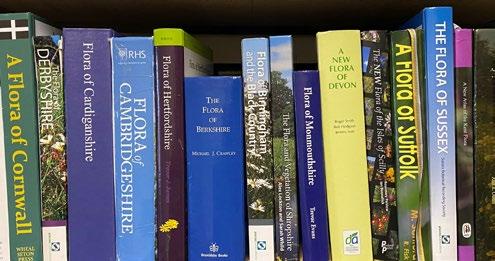
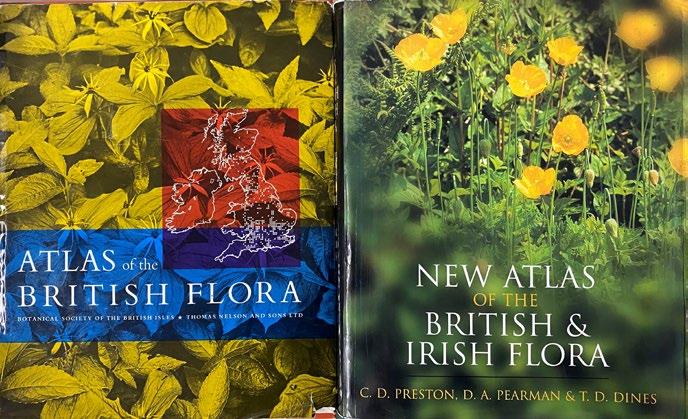
Although British botanists have been documenting the locations of plants since at least the 16th century, it was Victorian naturalists who popularised this activity, leading to the publication of many county Floras in the second half of the 19th century (Fig. 1). By the mid-20th century, rising prosperity and growing environmental concerns resulted in a significant rise in voluntary participation in biological recording, most notably of plants and birds13 The BSBI has been the driving force in British and Irish botanical recording during this period, pioneering the use of dot-distribution maps14 and co-ordinating nationwide surveys in the 1950s15, 1990s16 and between 2000 and 2019. This third national survey – Plant Atlas 2020 –
involved over 8,500 volunteers who visited over 99% of the 3,893 10 × 10 km squares (hectads) of the national grids used for mapping in Britain and Ireland17, recording all the flowering plants, ferns and charophytes identified within each hectad18. Most of these 10 km squares were visited multiple times, often at different seasons to ensure that they were recorded as thoroughly as possible, even in areas remote from human population centres. Figure 2 provides a map of the coverage achieved between 2000 and 2019. During visits to these hectads, all native and non-native plants found growing in the wild were recorded, including planted trees and shrubs, but plants grown in gardens or as crops were excluded19. In Britain,
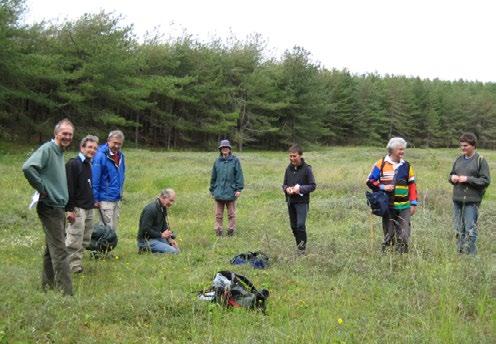
Figure
shows the number of recording days undertaken within each 10 × 10 km square (hectad) in Britain and Ireland during fieldwork for Plant Atlas 2020 (2000–2019). These surveys were undertaken by volunteers such as the Anglesey Recording Group shown here examining Yellow Bird’s-nest Hypopitys monotropa in a dune slack at Newborough Warren, North Wales. Photo
13 Pescott, O.L., Walker, K.J., Pocock, M.J.O., Jitlal, M., Outhwaite, C.L., Cheffings, C.M., Harris, F. & Roy, D.B. 2015. Ecological monitoring with citizen science: the design and implementation of schemes for recording plants in Britain and Ireland. Biological Journal of the Linnean Society, 115: 505-521.
14 Preston, C.D. 2013. Following the BSBI’s lead: the influence of the Atlas of the British flora, 1962-2012. New Journal of Botany, 3: 2-14.
15 Perring, F. & Walters, S.M. eds 1962. Atlas of the British Flora. London: Thomas Nelson & Sons.
16 Preston, C.D., Pearman, D.A. & Dines, T.D. eds. 2002. New Atlas of the British and Irish Flora. Oxford: Oxford University Press.
17 All three BSBI atlas surveys utilised the Ordnance Survey national grid in order to allow plant distributions to be plotted as ‘dotdistribution maps’, an approach pioneered in the first Atlas of the British Flora published in 1962. For all three atlases records were assigned to 10 × 10 km grid squares (hectads), although the underlying records were often recorded at 2 × 2 km (tetrad), 1 × 1 km (monad) or finer resolutions. Since the early 2000s many records have also been submitted at 10 × 10 m precision due to the availability of affordable hand-held GPS and smartphones.
18 The aim of each BSBI atlas survey was to record all the flowering plants and ferns growing in the wild in the 3,893 10 × 10 km grid squares (hectads) that make up Britain and Ireland, including the Isle of Man and the Channel Islands. Plant Atlas 2020 also included charophytes, plant-like multicellular algae that have traditionally been recorded by BSBI recorders. All three surveys were organised and coordinated by the BSBI, with support from the Biological Records Centre at Monks Wood, Huntingdonshire and latterly at UK Centre for Ecology and Hydrology at Wallingford in Oxfordshire. In each survey, BSBI vice-county recorders were responsible for coordinating surveys of hectads within their own vice-counties, checking and submitting records and indicating whether a species was native or introduced (see Chapter 3 in the Plant Atlas 2020 book for more details).
19 For Plant Atlas 2020, growing ‘in the wild’ was defined as any plant found outside of private gardens (but including plants growing on boundary walls), whether intentionally or unintentionally introduced by humans. Exceptions included species planted as food or biofuel crops (e.g. Miscanthus, willows), except where growing as escapes or ‘volunteers’ (i.e. amongst other crops in subsequent years). In general, native plants were not recorded from within gardens although some recorders noted the presence of scarce species. However, there was much variation in what volunteers recorded, especially regarding planted trees, shrubs and ornamental plants in wild locations such as daffodils and crocuses.
this survey, contributing a total of 26 million records. This staggering achievement highlights the crucial role that BSBI volunteers play in furthering our knowledge and understanding of the British flora.
The nature of recording over such a large area means that, despite the huge efforts involved, an exhaustive list of plants for each hectad will always be impractical. Not every square metre of ground can be covered, the timing of the visit might mean that some species are not visible or
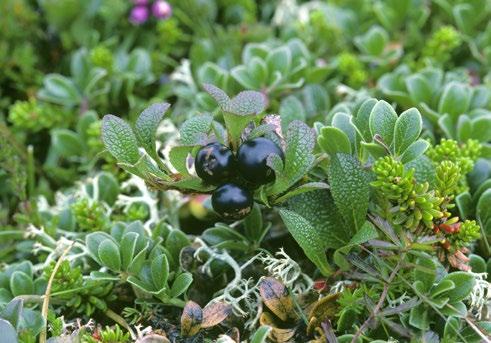
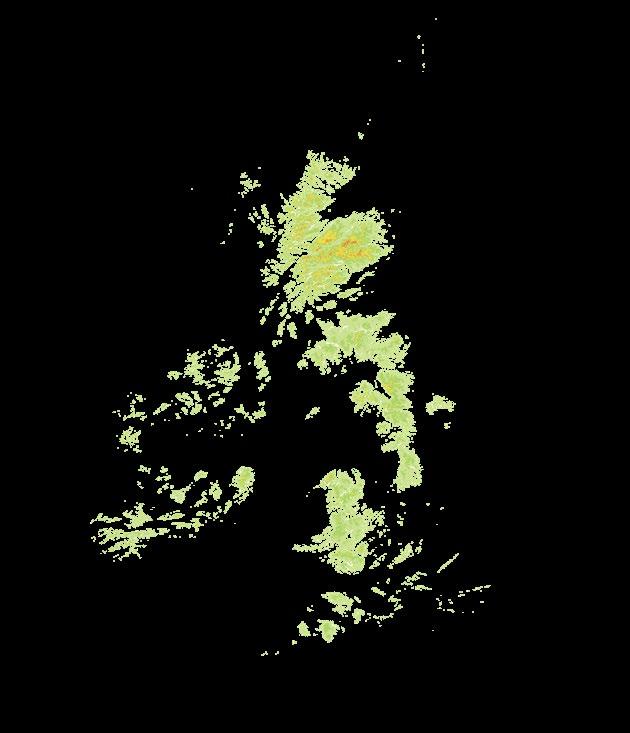
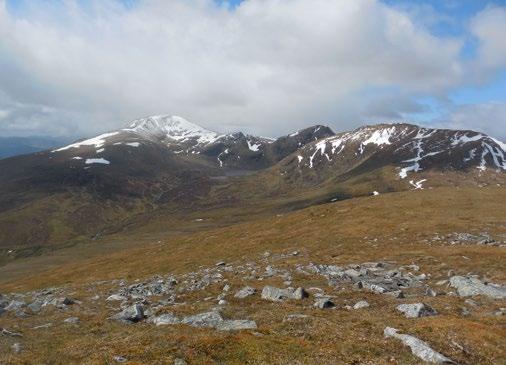
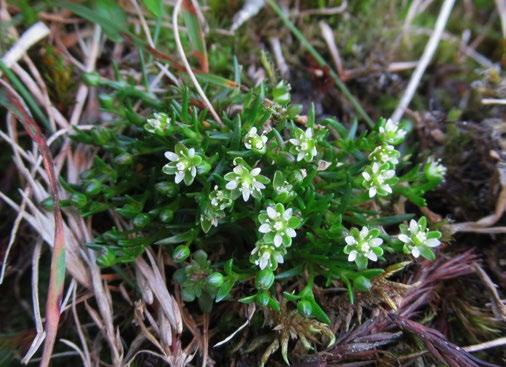
the change in the 10 km square distribution of Alpine Bearberry Arctostaphylos alpinus between 1987–1999 and 2000–2019. The orange triangles indicate 10 km squares where it was discovered during fieldwork for Plant Atlas 2020 including the re-discovery of historic sites known from before 1987. The photograph shows Alpine Bearberry growing with Bearberry A. uva-ursi and Crowberry
identifiable above ground and, contrary to popular belief, plants do tend to move around. During recording for several species that had been overlooked by earlier botanists were discovered new to Britain (see Section 4), and some species previously considered to be 21 are now known to be more widespread than when they were last mapped in 2000. A good example is Alpine Bearberry Arctostaphylos alpinus, a montane shrub of upland heaths that was found in several new localities due to more intensive recording in the remoter parts of its range in northern Scotland (Fig. 3).
20 A ‘recording day’ is a standardised measure and is defined as a recording event when 40 or more species are recorded during a single visit to a 2 × 2 km square (tetrad). This threshold was chosen as a conservative lower limit of species likely to be found in a tetrad in a single visit. Overall, this approach will underestimate recording activity as it ignores the multiple recorders and more casual recording. 21 Nationally scarce species are plants known to occur in 16-100 10 × 10 km squares in Britain (equivalent to 0.6-3.5% of all British hectads). For more details see Stewart, A., Pearman, D.A. & Preston, C.D. 1994. Scarce Plants in Britain. Peterborough: Joint Nature Conservation Committee.
Britain has a modest flora by global standards, as virtually all our native22 plants migrated to our shores since the last glaciation ended around 12,000 years ago and before the land bridge connecting Britain to Europe was submerged by rising sea-levels around 4,000 years later23. Exceptions include plants that survived to the south of the ice sheet during the last glaciation or colonised more recently without human assistance. Since then, humans have transformed the flora of our islands through agriculture and trade, importing species from around the world, either deliberately or accidentally within raw materials. Archaeological evidence has revealed that this process began around 6,000 years ago, with Neolithic farmers introducing many new plants for food, textiles and medicine; some of these ancient introductions (known as archaeophytes)24 also arrived unintentionally as ‘hitch-hikers’ in raw materials. Many archaeophytes are confined to regularly disturbed soils, including cultivated land, and have therefore declined in recent decades (see Section 7). Far more numerous are plants brought to Britain since the ‘discovery’ of the New World by European explorers at the end of the 15th century. Most of these modern introductions (known as neophytes)25 are garden plants (ornamentals) but they also include crops, forestry trees and species accidentally
introduced with imported materials. A few of these introductions have become invasive in recent decades, disrupting ecosystems and causing declines in native biodiversity (see Section 6).
During the 2000–2019 survey 3,445 species were recorded in Britain26, including 1,692 natives, with most of these concentrated in the lowlands, especially in southeastern and southern England (Fig. 4a). With a few exceptions, far fewer natives were recorded in the northern half of Britain, especially in upland and montane regions. Native species were outnumbered by introductions, with 1,753 recorded, comprising 1,596 neophytes and 157 archaeophytes. The overall geographic distribution of archaeophytes was similar to natives but with a much greater concentration in the area dominated by arable cultivation in the southern half of Britain, and a virtual absence from large swathes of upland and montane regions in the north (Fig. 4b). In comparison, neophytes had a much stronger association with urban areas, most notably London and Birmingham, but also smaller cities with a long tradition of botanical recording such as Cambridge. The virtual absence of neophytes from most upland and montane regions is striking (Fig. 4c).
22 Native species are those species that originated in an area without human influence or migrated to that area without human intervention from an area where they are native. Therefore, in Britain they include species that survived the last (Quaternary) glaciation, migrated here, without human assistance, since it ended around 12,000 years ago, or evolved in our area during the post-glacial period.
23 Ingrouille, M. 1995. Historical Ecology of the British Flora. London: Chapman & Hall.
24 Archaeophytes are species that were introduced to Britain by humans, either intentionally or unintentionally, between the start of the Neolithic period around 6,000 years ago and the ‘discovery’ of the New World by European explorers around AD 1500. Most archeophytes are plants associated with arable crops that were introduced accidentally by early farmers (e.g. poppies) or culinary and medicinal herbs that were deliberately imported by early settlers. For further information see Preston, C.D., Pearman, D.A. & Hall, A.R. 2004. Archaeophytes in Britain. Botanical Journal of the Linnean Society, 145: 257-294.
25 Neophytes are species introduced by humans, either intentionally or unintentionally since the ‘discovery’ of the New World by European explorers around AD 1500. Most neophytes are ornamental plants grown in parks and gardens and trees introduced for commercial forestry.
26 The 3,445 plants recorded in Britain during the Plant Atlas 2020 survey includes 2,977 species, 167 subspecies, 54 aggregates (closely related species that have been recorded inconsistently in the past and so are grouped together for recording and analytical purposes), 246 hybrids (both spontaneous hybrids and those bred for horticulture) and the asexual (gametophyte) stage of the Killarney Fern Trichomanes speciosum
Despite the dramatic changes in land use over the last century, only nine native species have been lost from Britain since 1930 (Table 1), although a further ten species are known to have been lost before then27. Only two of these species are globally extinct in the wild. Interrupted Brome Bromus interruptus is an endemic annual grass that appears to have evolved in Britain in arable crops during the 20th century28. In comparison, York Ragwort Senecio eboracensis arose following hybridisation between two common ragworts but had disappeared from all its localities in central York before it was described as a new species in 200329. Thankfully, seeds of both species were collected when they were still extant and are now being used to re-establish populations in the wild30
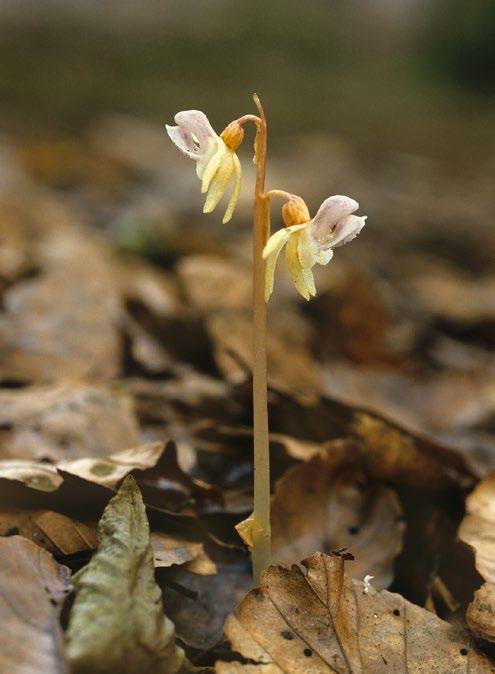
One species missing from Table 1 is Ghost Orchid Epipogium aphyllum. This plant is, for some, the holy grail of British botany and some enthusiasts spend many hours scouring former sites each year in the hope that it will reappear. There were only a handful of records of this elusive species in the 20th century31 and following its absence for over twenty years it was declared nationally extinct in 200932, but within days of this proclamation news emerged of its reappearance at a former site in Herefordshire33. This illustrates the risk of declaring a species extinct, especially one with such an extraordinary subterranean lifestyle as Ghost Orchid34.
During recording for Plant Atlas 2020 ten native species have been found for the first time in Britain (Table 2), although many more have been described as new species following historical and taxonomic research35. Some of these ten species are likely to have been overlooked by botanists in the past. A good example is Saltmarsh
Sedge Carex salina, an arctic species that rarely flowers in Britain and was discovered in 2004 during a survey of Scottish saltmarshes36. In comparison, some of these species may have colonised Britain naturally this century, most notably Tongue-orchid Serapias lingua, a Mediterranean species, that was found in Essex in 2017, although the location is a former fruit farm and so doubts over its origin persist37. There is also at least one species that evolved here recently; New Monkeyflower Erythranthe peregrina was described as a new species in 2012 following research that showed that it arose following hybridisation between two non-native parents38. Although originating from introductions, this new species is treated as a native in Britain39.
27 The following 10 native species were last recorded in Britain before 1930 and are therefore considered to be extinct (the year of the last known record is given in parentheses): Asplenium fontanum (1923), Carex davalliana (1831), C. trinervis (1869), Cystopteris alpina (1911), Diphasiastrum tristachyum (1876), Dryopteris remota (1894), Pinguicula alpina (1912), Rubus arcticus (1841), Tephroseris palustris (1899) and Trichophorum alpinum (1888).
28 Rich, T.C.G. & Lockton, A.J. 2002. Bromus interruptus (Hack.) Druce (Poaceae) – An extinct English endemic. Watsonia, 24: 69-80.
29 Senecio eboracensis was discovered in the 1970s but was only described as a new species in 2003 following research that showed it arose from a hybrid between the native Groundsel Senecio vulgaris and the neophyte Oxford Ragwort S. squalidus. For further details see Lowe, A.J. & Abbott, R.J. 2003. A new British species, Senecio eboracensis (Asteraceae), another hybrid derivative of S. vulgaris L. and S. squalidus L. Watsonia, 24: 375-388.
30 Rumsey, F.J. & Stroh, P.A. 2020. Will de-extinction be forever? Lessons from the re-introductions of Bromus interruptus (Hack.) Druce. Journal of Nature Conservation, 56: 125835.
31 Cole, S.R. 2014. History and status of Ghost Orchid (Epipogium aphyllum, Orchidaceae) in England. New Journal of Botany, 4: 13-24.
32 Plantlife, 2009. The Ghost Orchid Declaration: Saving the UK’s Wildflowers Today. Salisbury: Plantlife.
33 Garner, P. 2010. Haunted Herefordshire: the “Ghost” reappears in Britain after an absence of 23 years. BSBI News, 113: 7.
34 Bateman, R.M. 2010. The Ghost Orchid vividly illustrates why the term ‘extirpation’ is an essential element of plant conservation. BSBI News, 113: 8-11.
35 In addition to the 10 species listed in Table 2, 29 species have been added to the British list since 2000 but all were present in the past and have only come to light following historical and taxonomic research. Three of these species now appear to be extinct (Asplenium fontanum, Cystopteris alpina, Diphasiastrum tristachyum). See Table 3.1 in the Plant Atlas 2020 book for further details.
36 Dean, M., Ashton, P.A., Hutcheon, K., Jermy, A.C. & Cayouette, J. 2008. Description, ecology and establishment of Carex salina (Saltmarsh Sedge) – a new British species. Watsonia, 27: 51-57.
37 Waller, M. & Cole, S. 2017. Serapias lingua discovered in Essex. BSBI News, 136: 11-12.
38 Vallejo-Marín, M. 2012. Mimulus peregrinus (Phrymaceae): A new British allopolyploid species. Phytokeys, 14: 1–14.
39 A plant that has arisen without human involvement as the result of hybridisation between native and alien or exclusively alien parents is called a neonative. For further details and examples see Stace, C.A. & Crawley, M.J. 2015. Alien Plants. London: HarperCollins.
Bromus

Euphorbia
Neotinea
Saxifraga
Schoenoplectus
Serapias
Spiranthes
Scientific
Bolboschoenus
Botrychium nordicum Nordic Moonwort
Carex cespitosa Scarce Tufted-sedge
Carex salina Saltmarsh Sedge
Cystopteris diaphana Diaphanous Bladder-fern
Erythranthe peregrina New Monkeyflower
Lycopodium lagopus Hare’s-foot Clubmoss
Myosotis stricta Upright Forget-me-not
Serapias lingua
Zannichellia obtusifolia
Tongue-orchid
Thin-leaved Horned-pondweed
Confirmed recently but earlier records exist
Discovered in South Aberdeenshire in 2017
Identified in 2011 but 1st recorded in 1985
Discovered in West Ross in 2004
Discovered in Cornwall in 2000
Discovered in Lanarkshire in 2011
Confirmed recently but earlier records exist
Confirmed recently but earlier records exist
Found in 2017; also introduced
Discovered in Essex in 2016
One of the main challenges when measuring change between surveys is differences in recording activity over space and time. It is vital to take account of these biases in the underlying data, otherwise the resultant trends may largely reflect changes in recording effort rather than genuine shifts in species’ frequency over time. Therefore, a modelling approach was used for Plant Atlas 2020 that estimated an adjustment for spatial and temporal variation in effort using the frequencies of locally common ‘benchmark species’ which are most likely to have been well-recorded across survey periods and areas40. The relative frequency estimates for each of these survey periods are those of a species relative to these benchmarks within its overall range. This modelling approach, known as “FREquency SCAling LOcal” or Frescalo for short, used the distribution from discrete Atlas survey
periods41. These relative frequencies, and the modelbased uncertainty associated with them, were then used to produce modelled time trend summaries for each species42. An example of how the Plant Atas 2020 data were used to model these trends is shown for Hutchinsia Hornungia petraea in Figure 5. In this example, the results suggest a moderate decline or stability in the estimated distribution since the 1950s, but with some variability and hence some spread across all five trend categories as summarised in Figure 5c. The mean of 100 compatible linear trends (shown in Fig. 5a) was also calculated to provide an overall value of change (the mean for Hutchinsia was -0.0015). These values are used here to rank species in terms of their estimated average increase or decrease, and to quantify the numbers of species estimated to have increased, decreased or remained stable (see Section 6).
Figure 5. An example of the flow of information and uncertainty through the analyses used to calculate trends for Plant Atlas 2020. The example given is Hutchinsia Hornungia petraea. In (a) the circles and bars are the Frescalo means and standard deviations for the four time periods, plotted at the median year of each Atlas date-class; the transparent blue lines represent a random selection of 100 linear trends that are compatible with these estimates. In (b) the smoothed blue line is the distribution of the 100 slope estimates from (a), with 0 indicated by an unbroken grey vertical line. The black vertical broken lines in (b) represent the discretization scheme used in (c) which divides the slopes into easyto-interpret trend categories. Inset (d) is a simplified summary of (c) and is presented alongside each species’ caption in the Plant Atlas 2020 book and on the website. Photo © Paul Sterry.
40 Pescott, O.L., Humphrey, T.A., Stroh, P.A. & Walker, K.J. 2019. Temporal changes in distributions and the species atlas: How can British and Irish plant data shoulder the inferential burden? British and Irish Botany, 1: 250-282.
41 The “long-term” trends were calculated by comparing data for the following recording periods: 1930-1969, 1987-1999, 2000-2009 and 2010-2019. The “short-term” trends were calculated by comparing data for the following recording periods: 1987-1999, 2000-2009 and 2010-2019. See Chapter 6 in the Plant Atlas 2020 book for more information.
42 Pescott, O.L., Stroh, P.A., Humphrey, T.A. & Walker, K.J. 2022. Simple methods for improving the communication of uncertainty in species temporal trends. Ecological Indicators, 141: 109117.
Smoothed trends were also calculated for groups of species with common ecological attributes, biogeographic affinities, or broad habitat associations; for example, for all species associated with high soil or water pH. Such grouped trends can provide indirect insights into the likely drivers of environmental change, particularly if coupled with other sources of information and expert knowledge. For a detailed description of all the methods used, the reader is referred to Chapter 6 of the Plant Atlas book and the references therein.
It is important to note that whilst the method used here to calculate trends attempts to account for variation in recording effort, it is unable to deal with systematic biases introduced by changes in the relative attention paid to some species or habitats by botanists over time and space. In Britain, some of these biases result from advances in taxonomy and the field guides available to recorders since the 1950s43, as well as targeted surveys of species groups in particular periods, such as arable
plants and freshwater aquatics. Ideally, the species’ trends created by the Plant Atlas 2020 project would also be subject to qualitative “risk-of-bias” assessments that utilise expert knowledge44 when resources allow.
It should be stressed that whilst the scale of analyses (10 km squares) is suitable for detecting larger-scale changes in distribution, it inevitably ignores more localised changes where the distribution in 10 km squares remains stable. For example, the abundance of some arctic-alpine plants has declined due to increased competition and the loss of populations at lower altitudes, although their larger-scale distribution remains much the same. Surveys undertaken at finer scales are, therefore, required to complement the findings presented here, such as those carried out as part of the UK’s National Plant Monitoring Scheme45; merely analysing the Plant Atlas 2020 dataset at finer scales would inevitably introduce further complex biases.
One of the most startling findings of Plant Atlas 2020 is that just under half (49%) of all plant species analysed are estimated to have declined in range in Britain since the 1950s, whereas only a fifth (20%) have increased46. When analysed by national status (i.e. native, archaeophyte, neophyte) the results are even more shocking, with 53% of native plants and 62% of ancient introductions (archaeophytes) estimated to have suffered declines (Fig. 6). Modern introductions (neophytes) had the opposite trend; whilst we did not analyse trends for all species since the 1950s, as many introductions were not present, or insufficiently well-established or recorded before the 1990s, 58% of neophytes analysed were estimated to have increased (Fig. 6).
Figure 7 presents the smoothed trends for each of these status groups as a whole; natives and archaeophytes have declined consistently since the 1950s, albeit more pronounced for the latter, whereas neophytes have steadily increased. The results from the short-term analyses
Figure 6. The proportion of plants with decreasing, increasing or stable estimated mean trends at the 10 km square scale in Britain since the 1950s. These mean trends are shown in relation to whether species are native or were introduced by humans in ancient or modern times (archaeophytes, neophytes).
43 BSBI Handbooks are a good example of publications that have improved our taxonomic understanding of some difficult plant groups over the last half century. This series started in 1968 with the publication of Sedges of the British Isles by A.C. Jermy & T.G. Tutin; 24 handbooks have been published since then covering a wide range of genera including broomrapes, charophytes, dandelions, docks, crucifers, eyebrights, fumitories, gentians, grasses, lady’s-mantles, pondweeds, roses, umbellifers, water-starworts, whitebeams, willows and violets.
44 Boyd, R.J., Powney, G.D., Burns, F., Danet, A., Duchenne, F., Grainger, M.J., Jarvis, S.G., Martin, G., Nilsen, E.B., Porcher, E., Stewart, G.B., Wilson, O.J. & Pescott, O.L. 2022. ROBITT: A tool for assessing risk-of-bias in studies of temporal trends in ecology. Methods in Ecology and Evolution, 13: 1497-1507.
45 Pescott, O.L., Walker, K.J., Harris, F., New, H., Cheffings, C.M., Newton, N., Jitlal, M., Redhead, J., Smart, S.M. & Roy, D.B. 2019. The design, launch and assessment of a new volunteer-based plant monitoring scheme for the United Kingdom. PLoS ONE, 14: e0215891.
46 The numbers of species estimated to have increased, decreased or remained stable in Figure 6 are based on the mean value of the 100 compatible linear slope estimates produced for each species, as shown for Hutchinsia Hornungia petraea in Figure 5a. The mean of these 100 estimates was calculated for each species. In Figure 6, decreasing species had a mean slope value <= -0.001, whilst increasing species had a mean slope value of >= 0.001. Species with mean trend slopes between -0.001 and 0.001 were therefore classed as stable as per the discretisation scheme illustrated in Figure 5c. Note that this summary is a simplification of the situation, as it ignores the spread of any given species’ slopes across trend categories. See Chapter 6 of the Plant Atlas 2020 book for further details on the underlying methods.
(1987–2019) suggest a levelling off for natives, and to a lesser extent for archaeophytes, but an acceleration in the estimated increase in the overall distribution of neophytes (noting that the short-term trends included many more neophytes than the long-term trends).
The results from Plant Atlas 2020 demonstrate that many species with centres of distributions further south in Europe have increased in range in Britain in recent decades (see Section 9). Possibly one of the most celebrated is the beautiful Bee Orchid which has spread northwards from its former strongholds in chalk grasslands in southern England47 to reach the Scottish Borders by 2003, and as far north as Midlothian and Fife by the time fieldwork for Plant Atlas 2020 was completed.
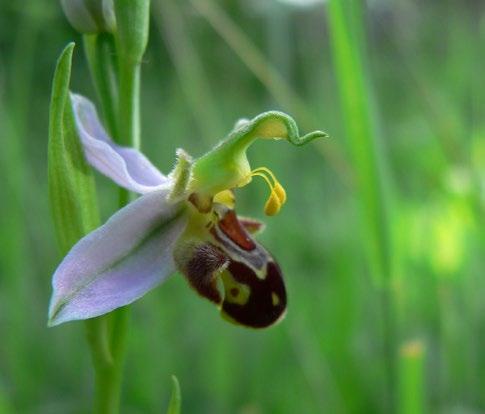
Since the late-20th century it has also started to colonise a greater range of habitats, most notably urban lawns and roadsides where its appearance has generated public and media interest. Milder winters are likely to be improving the survival of its winter-green rosettes, thereby allowing it to increase in numbers and colonise new sites via wind-dispersed seed.
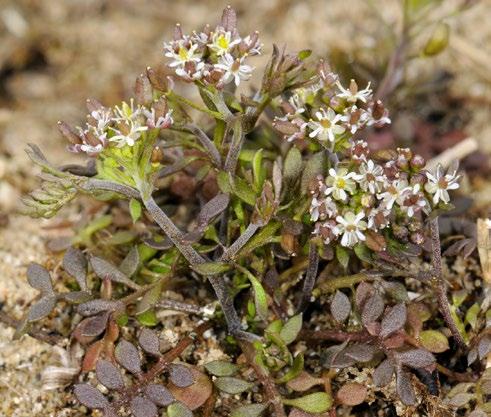
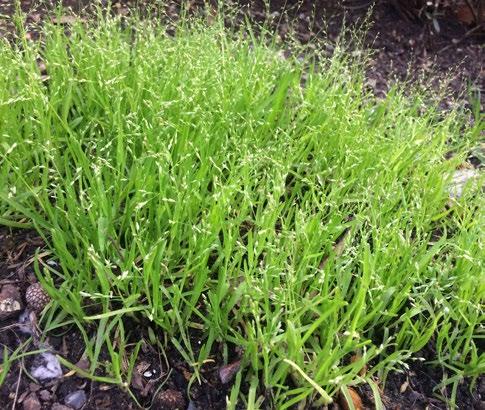
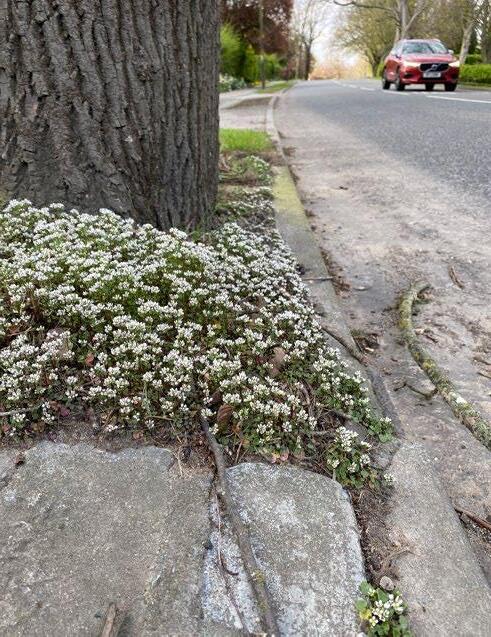
Like Bee Orchid, Early Meadow-grass has benefitted from milder winters this century. Historically, this tiny Mediterranean grass was restricted to the mildest parts of Britain (West Cornwall, Isles of Scilly, Channel Islands) but in recent decades its range has expanded eastwards and northwards, colonising open grassland in parks and on road verges in towns and cities where conditions are a degree or two warmer than in the surrounding countryside48. Whether these urban plants
originated from native populations or were introduced from Europe has yet to be determined.
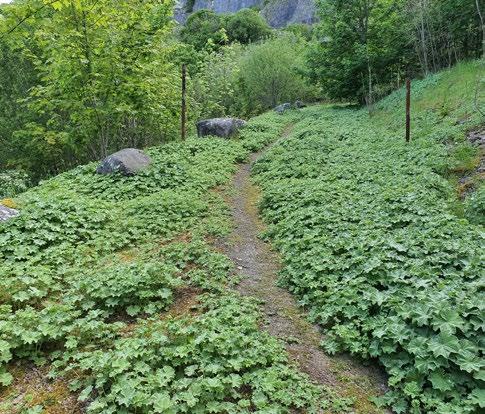
Garden Lady’s-mantle Alchemilla mollis
(Fig. 10) WEB
This vigorous perennial is a modern introduction (neophyte) from south-eastern Europe and tops the list of species that have the greatest estimated increases in distribution in Britain since the late 20th century49. It is widely grown in gardens, where it seeds prolifically and frequently escapes or is thrown-out with garden waste. Although established in the wild since 1925, it has recently undergone a considerable expansion in range and is now regularly encountered in the wild, most notably in dry, semi-natural grasslands where it can become invasive and, on some sites, outcompete native lady’s-mantles50.
Lesser
(Fig. 11) WEB
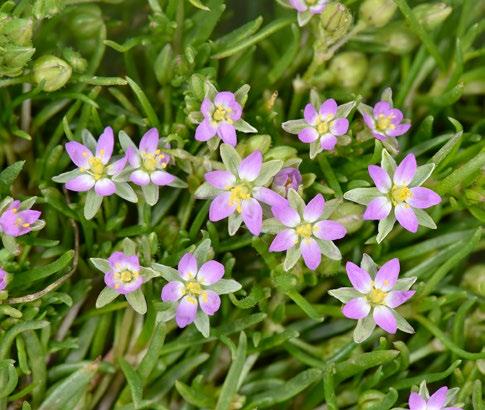
This native annual herb of saltmarshes and muddy places by the sea is one of a small band of salt-loving plants (halophytes) that have spread along the edges of inland roads treated with salt since the 1970s51. Like Danish Scurvy-grass Cochlearia danica, Reflexed Saltmarsh-grass Puccinellia distans and Grass-leaved Orache Atriplex littoralis, its initial spread was along motorways from where it has colonised the minor road network as well as pavements and railway platforms treated with salt in the winter months.
(Fig. 12) WEB
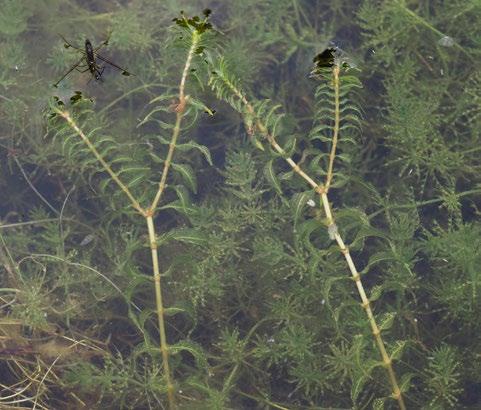
This aquatic herb is a modern introduction (neophyte) that was first recorded growing wild in Britain in 1956.
49 Lists of species that are estimated to have increased or decreased the most at the 10 × 10 km level since the 1950s (long-term) and 1990s (short-term) are published in Chapter 6 of the Plant Atlas 2020 book. Note that the estimates in the book also take into account the model-based certainty of the trends.
50 Lynes, M. 2022. Alchemilla - Lady’s-mantles of Britain and Ireland. BSBI Handbook No. 24. Durham: Botanical Society of Britain and Ireland.
51 Scott, N.E. & Davison, A.W. 1985. The distribution and ecology of coastal species on roadsides. Vegetatio, 62: 433-440.
Since then, it has spread rapidly throughout Britain, colonising ponds, lakes, reservoirs, canals and ditches. It is one of our most invasive non-native plants, able to persist and dominate water-bodies and also their muddy margins, where it outcompetes native species and alters aquatic ecosystems52. It has proved stubbornly resistant to mechanical and chemical control methods and scientists are currently trialling the efficacy of a gallforming mite as a biocontrol agent53
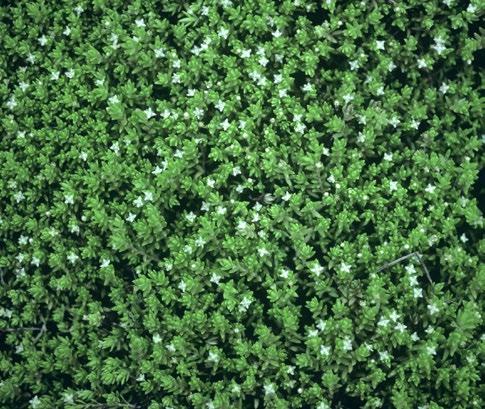
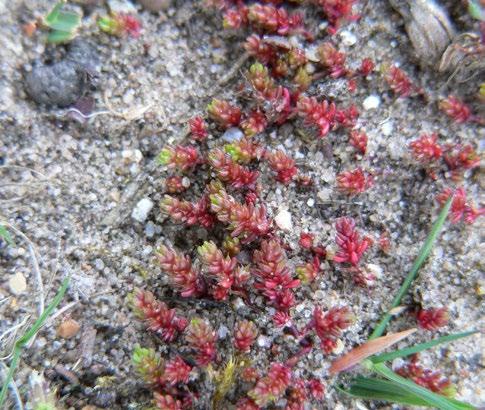
Like Early Meadow-grass, Mossy Stonecrop is a native plant that has increased considerably in range in recent decades, spreading from former strongholds in East Anglia and the New Forest to coastal regions in western Britain, but most notably to north-eastern Scotland. This tiny Mediterranean species is probably dispersed as vegetative fragments and often first appears in carparks or on tracksides, suggesting that it is being transported unintentionally in sand used for construction or by humans on material attached to shoes or
car tyres. Following such dispersal events, milder winters in coastal regions have meant that it survives and establishes in these new areas, from where it can continue its spread with our accidental assistance.
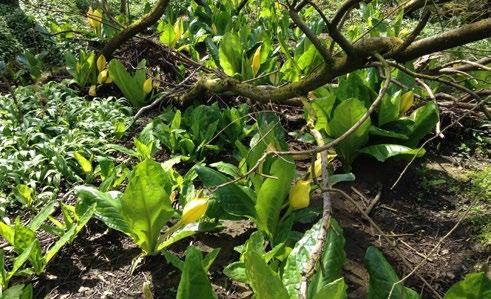
WEB
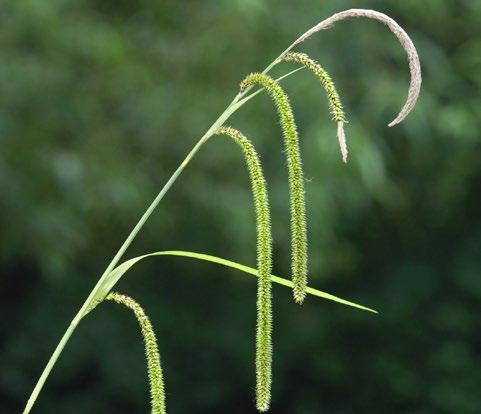
This is Britain’s largest sedge and occurs locally as a native in wet woodland, but it is now much more common as an escape from gardens where it is grown as an ornamental for its long pendulous flowers. It has spread significantly in recent decades, especially along woodland rides and watercourses, and in some lowland woods it is now locally invasive.
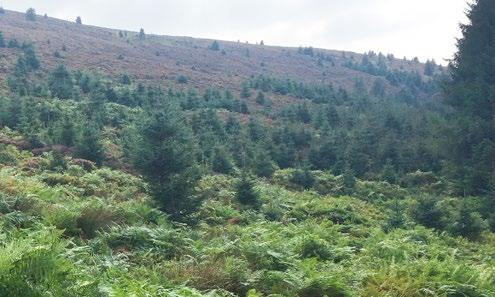
This North American conifer had the greatest estimated increase in range of any species covered by the Plant Atlas 2020 project. It is a modern introduction (neophyte) that was brought back from North America by David Douglas
53 Varia, S., Wood, S.V., Allen, R.M.S. & Murphy, S.T. 2022. Assessment of the host-range and impact of the mite, Aculus crassulae, a potential biological control agent for Australian swamp stonecrop, Crassula helmsii Biological Control, 167: 104854.
52 Smith, T. & Buckley, P. 2020. Biological Flora of the British Isles. No. 290. Crassula helmsii. Journal of Ecology, 108: 797–813.WEB
in 1831 and since the mid-20th century it has become the most widely planted commercial forestry species, especially on peaty soils in the north and west of Britain. Whilst many of the mapped records will be of planted trees, it has been increasingly found naturally regenerating
on moorlands distant from plantations, even at high altitudes54. Its ability to regenerate successfully on peaty soils that are so vital for native biodiversity and carbon sequestration means that future planting of Sitka Spruce will need to be carefully controlled and managed to ensure
54 Ison, J. & Braithwaite, M.E. 2009. The Status of Some Alien Trees and Shrubs in Britain. London: Botanical Society of the British Isles.
that important peatland habitats, species and carbon stores are protected.
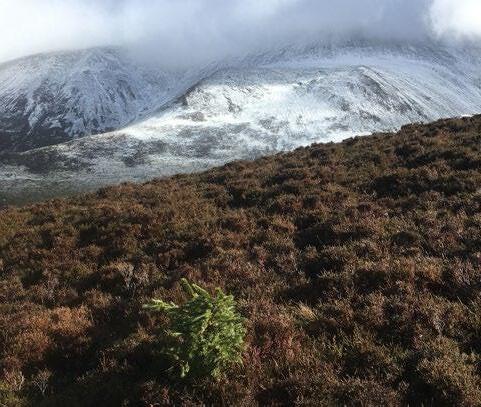
Alpine Lady-fern Athyrium distentifolium (Fig. 16) WEB
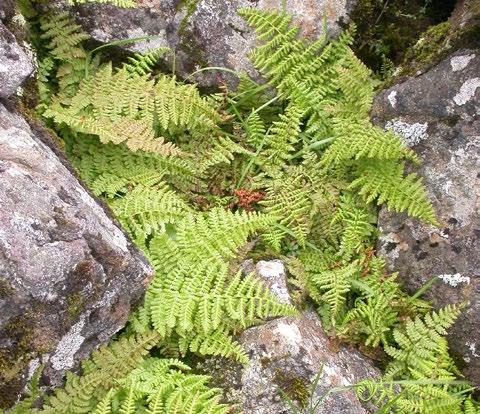
In Britain, Alpine Lady-fern is confined to the mountains of Scotland where it occurs at high altitudes on rocky slopes and in gullies where the snow lies late. Since the late-20th century, climate change has reduced the amount of snow in its main habitats and this appears to have been associated with population declines, especially of the endemic late snow bed ecotype known as A. distentifolium var. flexile
Corn Spurrey Spergula arvensis (Fig. 17) WEB
Corn Spurrey is a small, annual herb, possibly native in the Channel Islands but an ancient introduction (archaeophyte) elsewhere in Britain on cultivated and
waste ground. Like many other arable plants it has declined considerably since the 1950s due to changes in crop management (see Section 7). It remains locally abundant on small, cultivated plots in northern and western Britain where management has been less intensive, although such traditional practices are being abandoned or superseded in many areas by more modern methods, threatening the already precarious survival of this and many other arable plants.
Devil’s-bit Scabious Succisa pratensis (Fig. 18) WEB
Devil’s-bit Scabious is an attractive native herb of infertile grasslands, heathlands and fen-meadows on both acid and basic soils that have not been ploughed or improved for many centuries. It has suffered substantial declines in lowland Britain due to habitat loss, drainage and agricultural improvement. Populations in many regions are now very small and fragmented and this may be exacerbating losses due to reduced fitness caused by restricted gene-flow, especially on sites where the vegetation is no longer grazed or soil fertility has increased due to nutrient inputs55.
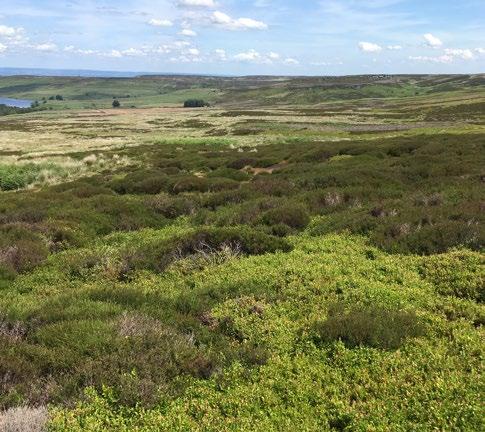
Heather Calluna vulgaris (Fig. 19) WEB
Heather is one of the most characteristic plants of both wet and dry heathlands throughout Britain, growing from sea-level to the tops of our highest mountains. It declined in many lowland regions before the 1950s but losses have continued since then as heathlands have been lost to scrub, agriculture, housing development, road building, afforestation and quarrying. Losses have been much less pronounced in the uplands, although even here its abundance has declined due to afforestation, drainage, pollution, burning and overgrazing by sheep and deer. Conversely, its abundance is maintained at an artificially high level in some regions because of management of moorlands for Red Grouse, albeit at the expense of a range of bryophytes, lichens and vascular plants that are sensitive to burning56
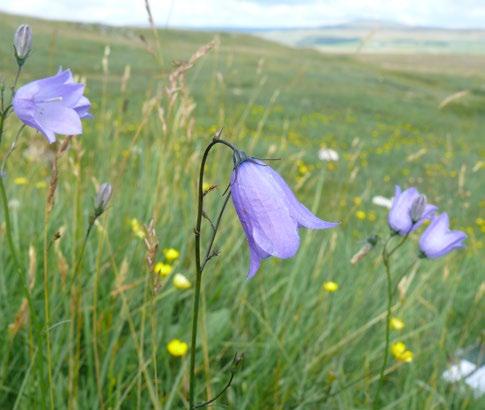
Harebell Campanula rotundifolia (Fig. 20) WEB
This much-loved native herb occurs in a wide range of open grassland and heathland habitats on infertile, dry soils with either low or high pH. It has declined because of the destruction of species-rich grasslands but as a poor competitor it has also become much scarcer in swards where grazing pressures have been reduced. Equally it has declined in grasslands that have become more productive due to the intensification of grassland management (including overgrazing of pastures) and eutrophication from atmospheric deposition of nutrients such as nitrogen57
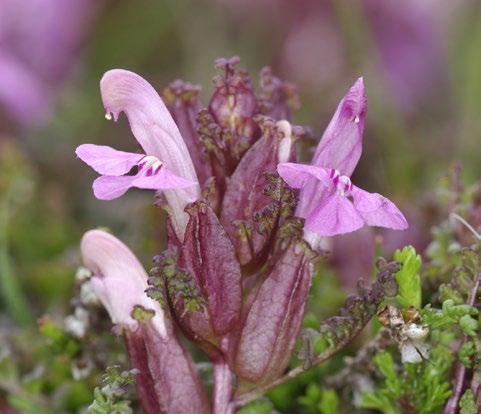
Lousewort Pedicularis sylvatica (Fig. 21) WEB
Lousewort is a native hemi-parasitic58 herb of very infertile, acidic peats in heathland, upland grassland and
56 Tucker, G. 2002. Review of the impacts of heather and grassland burning in the uplands on soils, hydrology and biodiversity. English Nature Research Report Number 550. Peterborough: English Nature.
57 Van Den Berg, L.J.L., Vergeer, P., Rich, T.C.G., Smart, S.M., Guest, D. & Ashmore, M. 2010. Direct and indirect effects of nitrogen deposition on species composition change in calcareous grasslands. Global Change Biology, 17: 1871-1883.
58 A hemi-parasite is a parasitic plant that obtains at least some of its nutrients from a host plant as well as by photosynthesis.
bogs. It has undergone a considerable decline in lowland regions throughout Britain due to the loss of heathlands, bogs and acid grasslands to agriculture; it remains, however, locally common in suitable upland areas of northern and western Britain.
(Fig. 22) WEB
Opposite-leaved Pondweed is a native aquatic herb confined to clear, base-rich water-bodies, especially shallow ditches and ponds. Its distribution appears to have been declining since the 19th century, mainly because of the loss of spring-fed streams, ponds and
ditches to urbanisation and agriculture, as well as falling water-tables, eutrophication, reduced water quality and a lack of ditch management59
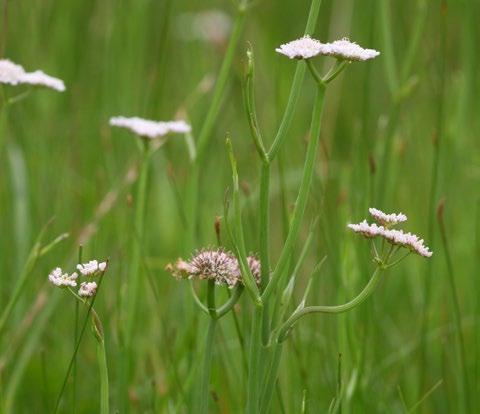
(Fig. 23) WEB
This native umbellifer occurs in a wide range of wetland habitats in lowland Britain, including wet meadows and pastures on floodplains, marshes, fens and the margins of water-bodies. It is much less common than in the past due to the drainage of wetlands, conversion of meadows and fens to arable or improved grassland, and eutrophication of vegetation beside
In this section we summarise the overall trends for species in relation to the main terrestrial habitats that they are most often associated with in Britain60. It is important to note that these trends are based on changes in occurrence at the 10 km scale and not on a direct analysis of change within specific habitats as is routinely carried out in vegetation surveys such as the Countryside Survey61 and the National Plant Monitoring
Scheme62. This means that trends for some habitats will include changes to typical species that have occurred in other habitats. For example, some coastal species (halophytes) have increased in range on inland roadsides since the 1970s, whereas their distributions in more typical coastal habitats are likely to have remained stable or even decreased.
60 The habitat associations used for British species in the analyses of Plant Atlas 2020 data are those given in the plant traits database PLANTATT. For further details see Hill, M.O, Preston, C.D. & Roy, D.R. 2004. PLANTATT. Attributes of British and Irish Plants: Status, Size, Life History, Geography and Habitats. Huntingdon: Centre for Ecology and Hydrology.
61 Smart, S.M., Bunce, R.G.H., Marrs, R., LeDuc, M., Firbank, L.G., Maskell, L.C., Scott, W.A., Thompson, K., Walker, K.J. 2005. Largescale changes in the abundance of common higher plant species across Britain between 1978, 1990 and 1998 as a consequence of human activity: Tests of hypothesised changes in trait representation. Biological Conservation, 124: 355-371.
62 Pescott, O.L., Walker, K.J., Harris, F., New, H., Cheffings, C.M., Newton, N., Jitlal, M., Redhead, J., Smart, S.M. & Roy, D.B. 2019. The
launch and assessment of a new volunteer-based plant
scheme for the United Kingdom. PLoS ONE, 14: e0215891.
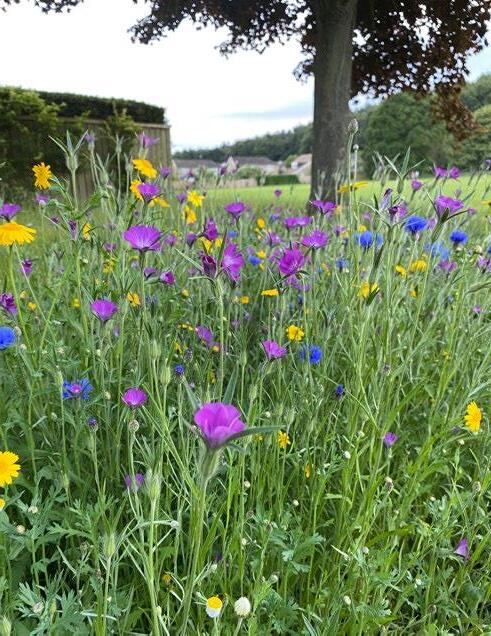
One of the most significant changes in the British flora during the 20th century was the decline of plants associated with cultivated land (Fig. 24). Since the 1940s many of these plants have been almost eradicated from arable fields due to improvements in seed-cleaning and the increased use of herbicides and artificial fertilisers63. Some of the worst affected species are ancient introductions (archaeophytes) that were introduced by early farmers, and were once abundant in cereal crops, such as Corn Buttercup Ranunculus arvensis, Corn Marigold Glebionis segetum and Shepherd’s-needle Scandix pecten-veneris. Although many are now very scarce in Britain, some remain locally abundant on light soils where arable crops have been less intensively managed or in areas where regular disturbance has created a suitable niche (e.g. along disturbed track edges in chalk grassland). In some areas they have also benefitted from the introduction of conservation measures built into arable systems since the 1990s64. Conversely, some of the rarest species, such as Cornflower Centaurea cyanus and Corncockle
Agrostemma githago, are now making a comeback of sorts due to the deliberate sowing of ‘cornfield seed mixtures’ in public spaces, although populations rarely persist without repeated cultivation. A few grasses are also increasing in autumn-sown crops due to their increasing tolerance to herbicides, most notably Rye Brome Bromus secalinus and Black-Grass Alopecurus myosuroides65
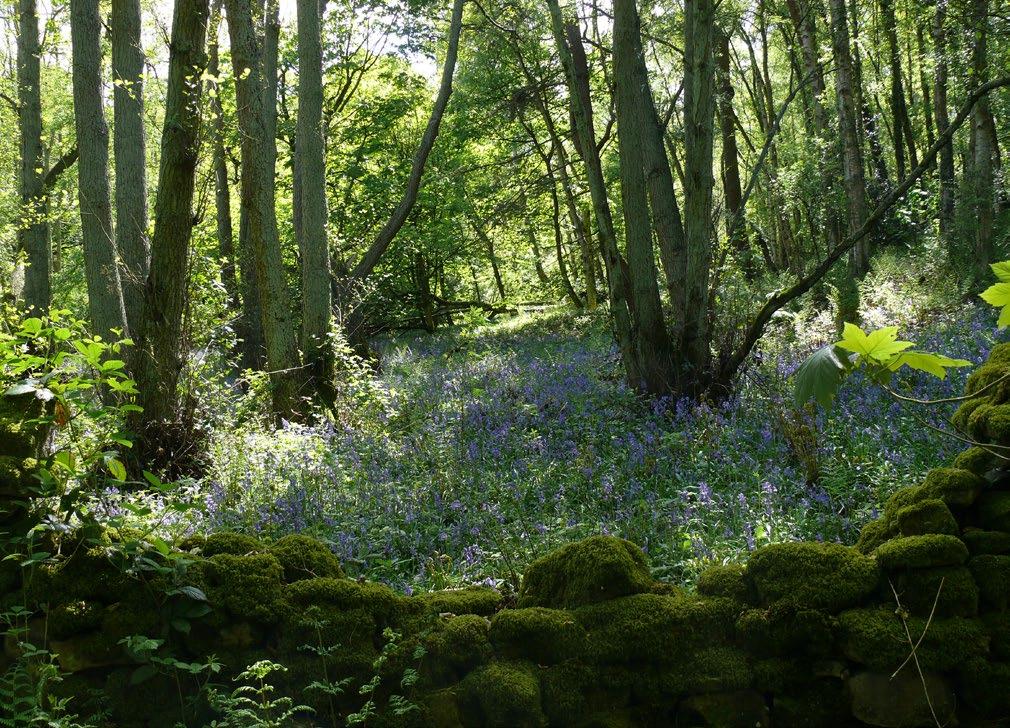
Plants associated with woodland habitats and linear features such as hedgerows have remained remarkably stable as a group at the 10 km scale over the past 70 years (Fig. 24). This is despite a decline of traditional management such as coppicing and hedge-laying, eutrophication caused by atmospheric pollution and increased grazing by both native and exotic deer. These changes have caused an overall decline in diversity in many woodlands (described as ‘homogenisation’ by ecologists)66,67 with increasing shading and fertility leading to a loss of open woodland specialists such as Early-purple Orchid Orchis mascula and Oxlip Primula elatior and an increase in more shade-tolerant species such as Broad Buckler-fern Dryopteris dilatata and Male Fern Dryopteris filix-mas.
In comparison, the overall increase of species associated with coniferous woodland reflects the considerable expansion of commercial forestry since the 1950s, most notably the planting (in order of area) of Sitka Spruce
Picea sitchensis, Scot’s Pine Pinus sylvestris, larches Larix spp., Lodgepole Pine Pinus contorta, Norway Spruce Picea abies, Black Pine Pinus nigra and Douglas Fir Pseudotsuga menziesii68
Grasslands are amongst the most threatened habitats in Britain, mainly because of changes in agriculture since the 1950s, including greater mechanisation, the use of chemical fertilisers, re-seeding with high-yielding varieties and a change from hay to silage production. The plants that have been worst affected are those associated with dry grasslands on infertile, acid or calcareous soils (Fig. 25). These species-rich grasslands characterise the culmination of centuries of grazing by sheep, cattle and rabbits, and the absence of herbicide use. They support
63 Storkey, J., Meyer, S., Still, K.S. & Leuschner, C. 2012. The impact of agricultural intensification and land use on the European arable flora. Proceedings of the Royal Society, Series B: Biological Sciences, 279: 1421-1429.
64 Walker, K.J., Critchley, C.N.R., Sherwood, A.J., Large, R., Nutall, P., Hulmes, S., Rose, R. & Mountford, J.O. 2007. The conservation of arable plants on cereal field margins: an assessment of new agri-environment scheme options in England, UK. Biological Conservation, 136: 260-270.
65 Hicks, H., Lambert, J. Pywell, R., Hulmes, L., Hulmes, S., Walker, K., Childs, D.Z. & Freckleton, R.P. 2021. Characterising the environmental drivers of abundance and distribution Alopecurus myosuroides on a national scale. Pest Management Science, 77: 27262736.
66 Keith, S.A., Newton, A.C., Morecroft, M.D., Bealey, C.E. & Bullock, J.M. 2009. Taxonomic homogenization of woodland plant communities over 70 years. Proceedings of the Royal Society, Series B, 276: 3539-3544.
67 Kirby, K.J., Smart, S.M., Black, H.I.J., Bunce, R.G.H., Corney, P.M. & Smithers, R.J. 2005. Long-term ecological change in British woodland (1971-2001). English Nature Research Report Number 653. Peterborough: English Nature.
68 The proportion of conifer species planted in Britain are as follows: Sitka Spruce Picea sitchensis, 51%; Scot’s Pine Pinus sylvestris, 17%; larches Larix spp., 10%; Lodgepole Pine Pinus contorta, 8%; Norway Spruce Picea abies, 5%; Black Pine Pinus nigra, 4%; and Douglas Fir Pseudotsuga menziesii, 4% Figures obtained from Forestry Commission, 2018. Forestry Statistics 2018 https://www.forestresearch.gov.uk/ tools-and-resources/statistics/forestry-statistics/forestry-statistics-2018/
the highest plant diversity of any British habitat, with over 30 species per square metre sometimes found on unimproved chalk downland in southern England69.
Large areas of dry grassland had already been ploughed by the 1950s, often at times of reduced grain imports. Although the destruction of such habitats continued into the late-20th and early-21st centuries, as farms shifted from mixed farming to solely arable cultivation, the steep
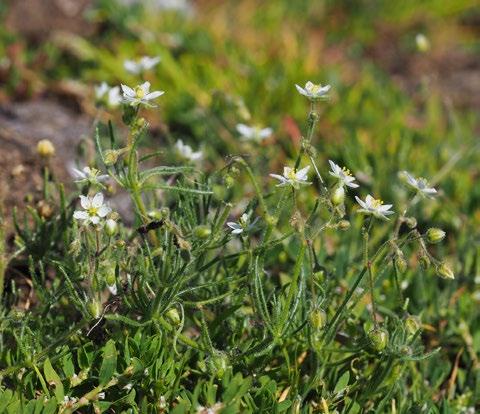
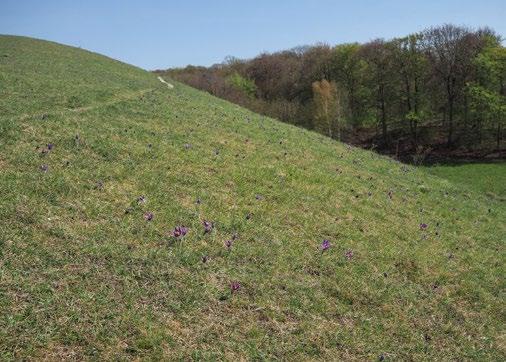
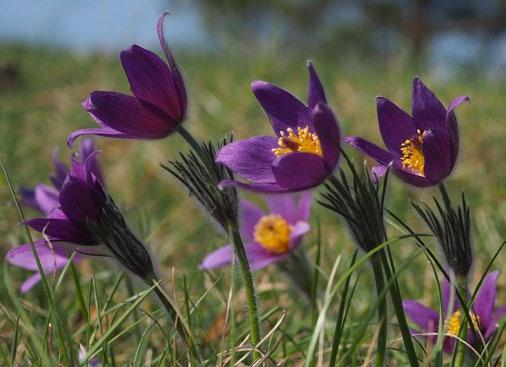
declines of many species were more often associated with reduced livestock grazing exacerbated by a fall in rabbit numbers following the spread of myxomatosis70. This has led to a loss of overall species diversity and populations of plants such as Burnt Orchid Neotinea ustulata and Pasqueflower Pulsatilla vulgaris on chalk and limestone downland, and Sheep’s Sorrel Rumex acetosella and Tormentil Potentilla erecta in acid grassland. Equally, some specialists adapted to small-scale periodic disturbance within grasslands have also declined, such as Fine-leaved Sandwort Sabulina tenuifolia and Hound’s-tongue Cynoglossum officinale. Species of neutral grasslands (meadows and pastures) have suffered to a lesser extent, possibly because fewer species are restricted to these habitats, although there is still a long list of species with estimated declines, including now very localised species such as Green-winged Orchid Anacamptis morio, Meadow Saxifrage Saxifraga granulata, and Sulphur Clover Trifolium ochroleucon.
Plants associated with heathlands and bogs have suffered a similar fate to those of infertile grasslands, especially in lowland Britain where their already restricted and fragmented habitats have suffered greatly from agricultural improvement (conversion to pasture, drainage), forestry and urban development (Fig. 26). Overall losses have been less marked in the uplands, where northern (boreal) species are more abundant. However, the combined effects of the drainage and burning of moorland, overgrazing by sheep and deer and eutrophication have led to the severe decline of some species which would once have been very widespread, such as Bell Heather Erica cinerea, Bilberry Vaccinium myrtillus, Heather Calluna vulgaris and Matgrass Nardus stricta.
The conversion of mires, wet heathlands and blanket bogs to rough pasture and forestry has also precipitated declines of a wide range of plants, such as Common Butterwort Pinguicula vulgaris, Common Cottongrass Eriophorum angustifolium, Cross-leaved Heath Erica tetralix, louseworts Pedicularis spp. and sundews Drosera spp. (Fig. 26). In contrast, the overall trend for plants of mountain habitats (montane)71 is broadly stable, although some species found at their climatic limits in Britain appear to have declined in recent decades due to climate change (see Section 9), whereas others have become much scarcer due to overgrazing (e.g. montane willows Salix spp., Alpine Gentian Gentiana nivalis, Highland Cudweed Omalotheca norvegica)72,73
69 Proctor, M.C.F. 2013. Vegetation of Britain and Ireland. London: HarperCollins.
70 Sumpton, K.J. & Flowerdew, J.R. 1985. The ecological effects of the decline in Rabbits (Oryctolagus cuniculus L.) due to myxomatosis. Mammal Review, 15: 151-186.
71 Montane species in Britain have their main distribution above 600 m altitude in the mountains of North Wales, Northern England and Scotland, although many grow down to sea-level in northern and western Scotland (as they do in the arctic).
72 Geddes, C. & Payne, S. 2006. Loss of highland Cudweed Gnaphalium norvegicum from the Caenlochan area, Angus, Scotland. BSBI News, 102: 26-27.
73 Mardon, D.K. 2003. Conserving montane willow scrub on Ben Lawers NNR. Botanical Journal of Scotland, 55: 189-203.
Figure 26. The smoothed long-term trends (1930–2019) for plant species typically associated with bog, dwarfshrub heath and montane habitats in Britain. The trends are plotted as medians with 90% uncertainty intervals shown.
or increased competition caused by eutrophication74 However, reasons behind the declines of montane species are complex, and it is certainly possible that for at least a few cases the downward trends reported here are partially influenced by some time-period specific underrecording due to the remoteness of many populations.
Species of terrestrial wetlands (including fens, mires, marshes and swamps) have also suffered significant declines since the 1950s due to the impacts of drainage and subsequent improvement for agriculture, as well as atmospheric pollution and the run-off of chemicals from adjacent farmland. Species of nutrient-poor, baserich fens appear to have been the worst affected due to their very localised distribution and susceptibility to
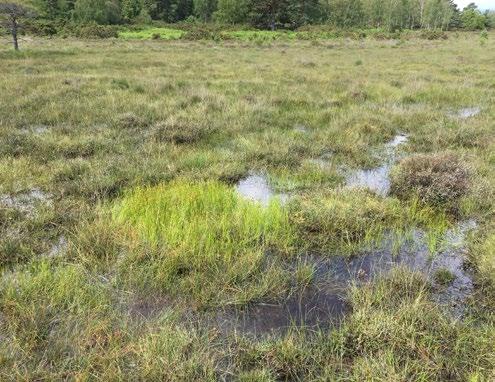
Figure 27. The smoothed long-term trends (1930–2019) for plant species typically associated with wetlands (fen, marsh and swamp), rivers and streams and standing waters and canals in Britain. The trends are plotted as medians with 90% uncertainty intervals shown.
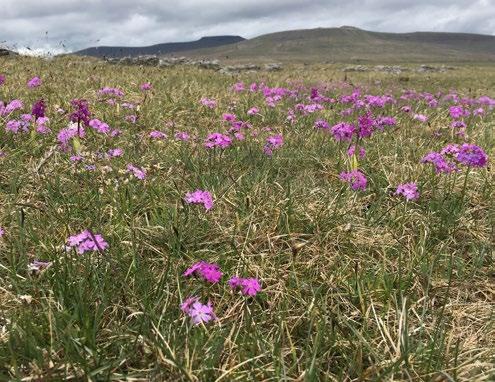
even small changes in the underlying hydrology and neighbouring land-use, especially in intensively managed regions of lowland Britain, and their reliance on cutting and grazing regimes that limit competition from the surrounding vegetation. Examples of species that have declined more than most in these habitats include Bird’s-eye Primrose Primula farinosa, Carnation Sedge Carex panicea, Flat-sedge Blysmus compressus, Grass-ofParnassus Parnassia palustris, Tubular Water-dropwort Oenanthe fistulosa and Sneezewort Achillea ptarmica
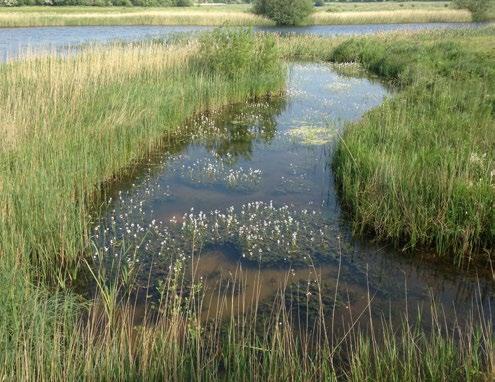
There have undoubtedly been severe declines of aquatic species associated with low-moderate nutrient conditions since the 1950s, with the main factors for loss including the destruction and neglect of ponds and the conversion of wetlands to agricultural use, as well as the direct and indirect eutrophication of lakes and rivers.
Increased recreational use and the spread of invasive non-natives have also significantly and negatively impacted many aquatic species due to increased turbidity and competition. However, the creation of new water-bodies as a by-product of mining, quarrying, gravel extraction and flood defence works has improved the picture for some species. Likewise, canals acted as a refuge for many aquatic species during the 20th century although many aquatic species in canals have suffered the same pressures as in more natural water-bodies over recent decades. It should also be noted that the perceived decline of some species of standing waters are likely to have been exaggerated this century due to the more focussed recording effort that aquatic plants received in parts of Britain in the late 20th century.
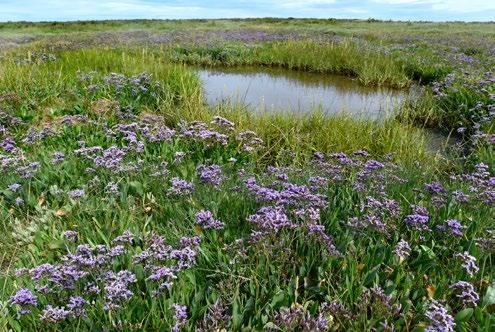
The distributions of species of coastal habitats (coastal rock, strandlines, shingle, sand dunes, saltmarsh) in Britain appear, in general terms, to have remained relatively stable since the 1950s (Fig. 28). Some coastal species are even increasing because of the colonisation of salted roadsides inland75, planting76 or climate change (see Section 9). This overall picture, however, hides a decline of some plants of saltmarshes in southern and eastern Britain, where pressures from agricultural reclamation, development, shipping and coastal erosion caused by sea-level rise have been greatest, leading to a ‘squeeze’ of intertidal habitats and the decline of species such as Small Cord-grass Spartina maritima and eel-grasses Zostera spp.77. Likewise, more frequent winter storms and increasing recreational disturbance is likely to be causing a reduction in range of some sand-dune, shingle and strandline specialists such as Prickly Saltwort Salsola kali and Sand Cat’s-tail Phleum arenarium, although strong evidence linking these factors with declines is currently lacking.
Here we summarise these trends in terms of the main ecological conditions that influence plant growth, namely light, moisture, pH (reaction) and fertility78
As many of the results described above demonstrate, species with the greatest estimated declines are habitat specialists adapted to a narrow range of ecological conditions. In relation to light, species of open habitats
have declined the most as a group, and species of shaded or semi-shaded habitats the least (Fig. 29a). In terms of moisture, plants of the driest and wettest conditions have declined to a much greater extent than species of intermediate moisture; aquatics have seen a much steeper decline more recently, although as stated above this trend is likely to be exaggerated by a greater focus on recording such species in Britain during the 1990s (Fig. 29b). A
75 Since the early 1970s several coastal halophytes have spread inland along roadsides that have been treated with rock salt over the winter months (e.g. Atriplex littoralis, Cochlearia danica, Puccinellia distans, Spergularia marina).
76 Common Cord-grass Spartina anglica is a British endemic that evolved towards the end of the 19th century following hybridisation between the native Small Cord-grass S. maritima and an introduced species from North America S. alterniflora. It has since spread naturally or been planted widely as a ‘mud-binder’ in intertidal areas leading to rapid accretion of saltmarsh on many sites.
77 Jones, B.L. & Unsworth, R.K.F. 2016. The perilous state of seagrass in the British Isles. Royal Society Open Science, 3: 150596. 78 Ellenberg indicator values are estimates of a species’ ecological optima along seven main gradients affecting plant distribution; light, moisture, reaction (pH), fertility and salinity. These values were originally devised for central Europe by the German plant ecologist Heinz Ellenberg but have been recalculated for all British and Irish species. For further details see Hill, M.O., Roy, D.B., Mountford, J.O. & Bunce, R.G.H. 2000. Extending Ellenberg’s indicator values to a new area: an algorithmic approach. Journal of Ecology, 37: 3-15.
similar pattern emerges in relation to reaction, with plants associated with the highest and lowest pH having declined to a much greater extent than those of more neutral conditions (Fig. 29c).
One of the most striking results of Plant Atlas 2020 is in relation to fertility, with specialists adapted to infertile conditions having declined by far the most as a group (Fig. 29d). Whilst this significant decline reflects the scale of the losses of low productivity habitats as described above, it may also partly reflect the eutrophication of all habitats from airborne and surface sources since the 1950s which has been to the detriment
of poor competitors adapted to open conditions maintained, at least in terrestrial habitats, by low soil fertility and grazing. Counterintuitively, species of the most fertile conditions mirror the slight declines of species of moderately fertile soils. This result is likely to reflect the decline in mixed farming (arable and pasture) since the 1950s and substitution of organic waste materials used in agriculture, such as animal dung and wool shoddy79, by artificial fertilisers in recent decades. It may also reflect the increasing ‘tidiness’ of urban and rural settlements caused by gentrification and increased use of herbicides to remove weeds from pavements and other areas.
79 ‘Shoddy’ is a collective term for the waste products produced during the cleaning and refining of imported wool products. These waste materials were formerly spread on arable fields to help fertilise and improve the structure of soils and, because they contained seeds, this led to the appearance of many exotic plants in the same fields or where waste materials had been stored or transported. Due to the introduction of more efficient wool cleaning methods, the use of shoddy declined throughout the second half of the 20th century. For further details see Shimwell, D.W. 2006. A shoddy tale: perspectives on the wool alien flora of West Yorkshire in the twenty-first century. New Journal of Botany, 26: 127-137.
Since the publication of the first atlas in 1962, Britain’s climate has become on average a degree centigrade warmer. This has resulted in more frequent, lengthier and hotter warm spells resulting in droughts and fewer and shorter cold spells leading to less frost and snow80. The climate has also become wetter with more frequent, intense storms. All these changes have had an impact on our flora, although it is often challenging to disentangle the direct impacts from changes driven by other factors such as habitat loss, eutrophication and changes in land management.
Having said that, the responses of plants to climate change are much more apparent now than when the last distribution atlas was published 20 years ago. Most notably, many species at the northern edge of their range in Britain (i.e. the Mediterranean-Atlantic and Southerntemperate elements in the British flora)81 have expanded their ranges northwards in recent decades (Fig. 30), in some cases significantly so, with milder winters enabling them to survive at higher latitudes than in the past. We have already given some examples in Section 6 (Bee Orchid Ophrys apifera, Early Meadow-grass Poa infirma, Mossy Stonecrop Crassula tillaea) and to these we would add Bristly Oxtongue Helminthotheca echioides, Four-leaved Allseed Polycarpon tetraphyllum, Goldensamphire Limbarda crithmoides, Keel-fruited Cornsalad
Valerianella carinata, Little-Robin Geranium purpureum, Pyramidal Orchid Anacamptis pyramidalis, Soft Shieldfern Polystichum setiferum, Spotted Medick Medicago arabica and Wall Bedstraw Galium parisiense.
Several modern introductions (neophytes) are also expanding their ranges in Britain, most likely because of climate change, for example Water Bent Polypogon viridis. The 10 km square distribution of this southern European grass has increased 15-fold in the last 20 years, presumably due to increased movement of material by humans combined with a succession of milder winters that have enabled its establishment in areas where previously it would have not persisted82.
At the other extreme, some species at the southern edge of their range in Britain (Arctic, Alpine and Boreal species) are estimated to be declining. Although many have suffered from habitat loss in southern Britain, with remaining strongholds now in the north of our area, climate change has been equally if not more important in causing declines when compared with southerly distributed species with the same ecological characteristics83. Climate change is also likely to be the primary cause of the declines of some mountain plants restricted to snow beds - areas where the snow lies late in the spring and summer. Examples include Alpine Ladyfern Athyrium distentifolium, Alpine Pearlwort Sagina
80 Kendon, M., McCarthy, M., Jevrejeva, S., Matthews, A., Sparks, T., Garforth, J. & Kennedy, J. 2022. State of the UK Climate 2021. International Journal of Climatology, 42: 1-80.
81 All British and Irish plants have been assigned to major biome categories based on their distributions in the Northern Hemisphere (Arctic, Boreal, Temperate, Southern, Wide). Species in the Southern-Temperate and Mediterranean-Atlantic categories have expanded the most in Britain in recent decades. For details of the categories see Preston, C.D. & Hill, M.O. 1997. The geographical relationships of the British and Irish vascular plants. Botanical Journal of the Linnean Society, 124: 1-120.
82 Pescott, O. & Baker, A. 2014. Alien grasses in urban Sheffield: An update on Water Bent and some predicted colonists. The Sorby Record, 50: 62-65.
83 Hill. M.O. & Preston, C.D. 2015. Disappearance of boreal plants in southern Britain: habitat loss or climate change? Biological Journal of the Linnean Society, 115: 598-610.
saginoides, Alpine Speedwell Veronica alpina, Drooping Saxifrage Saxifraga cernua, Dwarf Cudweed Omalotheca supina, Mountain Bog-sedge Carex rariflora, Mountain Sandwort Sabulina rubella, Snow Pearlwort Sagina nivalis and Starwort Mouse-ear Cerastium cerastoides. Many of these snow beds have received much less snow in recent decades and, consequently, they have become ‘greener’ due to the encroachment and competition from more warmth-loving species84. The greater incidence of hot spells, leading to droughts, is also having a detrimental impact on short-lived plants restricted to shallow soils in
upland regions, although the evidence for this at the 10 km square scale is weaker.
These findings remain tentative, but the Plant Atlas 2020 survey does confirm that some species are already shifting their distributions in response to our changing climate. While a warmer climate is likely to hasten the arrival of more Mediterranean species such as tongue-orchids85, sadly it may seal the fate of arctic species such as Snow Pearlwort Sagina nivalis, which has its southern global outpost
84 Watts, S.H., Mardon, D.K., Mercer, C., Watson, D., Cole, H., Shaw, R.F. & Jump, A. 2022. Riding the elevator to extinction: Disjunct arctic-alpine plants of open habitats decline as their more competitive neighbours expand. Biological Conservation, 272: 109620. 85 Three species of tongue-orchid are thought to have naturally colonised Britain in recent decades; Tongue-orchid S. lingua, Lesser Tongueorchid S. parviflora and Long-lipped Tongue-orchid S. vomeracea
86 Mardon, D.K. & Watts, S.H. 2019. Population dynamics and life history of the rare arctic-alpine plant Sagina nivalis (Caryophyllaceae) on the Ben Lawers range, Scotland, UK. British & Irish Botany, 1: 50-69.
One of the principal changes to the British flora in recent times has been the increased incidence and abundance of introduced (non-native, alien) plants growing in wild locations. This proliferation has been driven by three main factors: (1) the widespread planting of trees and shrubs, (2) the escape of ornamental plants from parks and gardens, and (3) a growing interest in the identification and recording of alien species in the wild87.
Trees and shrubs dominate the lists of introduced plants that are estimated to have increased the most in Britain since the 1950s. To a large extent this reflects an upsurge in the afforestation of previously treeless landscapes with conifers since the 1950s, especially in upland regions, as well as the widespread regeneration of species inside and outside plantations, most notably Lodgepole Pine Pinus contorta and Sitka Spruce Picea sitchensis. In the lowlands, there has also been a significant increase in the planting of native broadleaved trees and shrubs in new woods and hedgerows, as well as the use of non-native trees and shrubs as boundary hedging such as Cherry Laurel Prunus laurocerasus, Garden Privet Ligustrum ovalifolium, Lawson’s Cypress Cupressus lawsoniana and Leyland Cypress Cupressus × leylandii
Just as striking, if not more so, has been the increased incidence of garden escapes that are now found established in the wild. These include several native species grown as ornamentals in gardens, such as Columbine Aquilegia vulgaris, Italian Lords-and-ladies Arum italicum, Pendulous Sedge Carex pendula, Stinking Hellebore Helleborus foetidus, Tutsan Hypericum androsaemum, Welsh Poppy Papaver cambricum and Wood Forget-me-not Myosotis sylvatica that possibly now have more introduced than
indigenous populations in Britain.
Non-native garden plants dominate the lists of species estimated to have increased the most at the 10 × 10 km level, especially perennials with the capacity to spread vigorously, either vegetatively or by seed, most notably Montbretia Crocosmia × crocosmiiflora, Dotted Loosestrife Lysimachia punctata, Druce’s Crane’sbill Geranium × oxonianum, Garden Lady’s-mantle Alchemilla mollis, Himalayan Honeysuckle Leycesteria formosa, Hybrid Bluebell Hyacinthoides × massartiana, Three-cornered Garlic Allium triquetrum and the variegated subspecies of Yellow Archangel Lamiastrum galeobdolon subsp. argentatum. Many of these species are increasing in semi-natural habitats, having originated from garden waste discarded in wild locations or dispersed via vegetative propagules that escaped along roadsides and watercourses88. Most of these introductions are benign additions to local floras, but a small minority are becoming invasive, out-competing native species, for example American Skunk-cabbage Lysichiton americanus, Few-flowered Garlic Allium paradoxum, Garden Lady’s-mantle Alchemilla mollis, Himalayan Balsam Impatiens glandulifera, Japanese Rose Rosa rugosa and the variegated subspecies of Yellow Archangel Lamiastrum galeobdolon subsp. argentatum
Possibly the most invasive, however, are aquatic plants which have been accidentally or purposively introduced into standing and running waters. Prime examples are New Zealand Pigmyweed Crassula helmsii which now dominates the margins of many ponds and lakes throughout Britain89, and Floating Pennywort Hydrocotyle ranunculoides which has spread rapidly in canals and rivers throughout lowland
87 Whilst a minority of British botanists have always focussed on the recording of introduced plants, it only became a widespread practice following the publication of Clive Stace’s New Flora of the British Isles in 1991. This landmark publication included all the non-native plants likely to be encountered in the wild (later editions in 1997, 2010 and 2019 added many more introductions) and therefore it enabled the authors of New Atlas and Plant Atlas 2020 to map many more non-natives than in the past.
88 Plants that are invasive in gardens, due to vigorous spread and/or prolific seed production, are frequently discarded in garden waste, often near to gardens along roadsides or watercourses from where they can become established from root fragments, seeds, or bulbs. This is now one of, if not the most important pathways for ornamental plants to become established in the wild.
89 Smith, T. & Buckley, P. 2020. Biological Flora of the British Isles. No. 290. Crassula helmsii Journal of Ecology, 108: 797–813
Britain since it was first recorded near to Chelmsford in Essex in 199090, outcompeting native plants and creating a major obstacle to navigation on many waterways.
The widespread sowing of wild-flower and pollinator seed mixtures since the early 1980s has also led to notable increases in some species, including some native plants
(e.g. Cowslip Primula veris, Pennyroyal Mentha pulegium, Red Clover Trifolium pratense, Yellow Rattle Rhinanthus minor) as well as ancient introductions (archaeophytes) that declined in the past due to the intensification of arable cultivation (e.g. Corncockle Agrostemma githago, Cornflower Centaurea cyanus, Thorow-wax Bupleurum rotundifolium).
Here we provide a brief overview of the main changes that have occurred to the floras of England, Wales and Scotland since the 1950s and how these have differed from Britain as a whole. For each country, we present the numbers of species estimated to have decreased, increased or remained stable in terms of their estimated 10 × 10 km square distributions since the 1950s91. We provide an overall summary of trends for the main habitats that species are associated with in each country. As in Section 7, these comments are based on multispecies trend graphs for habitats (graphs not shown).
Ninety-five percent of the species recorded in Britain during Plant Atlas 2020 were also recorded in England, including 92% of those that are native (Table 3). Consequently, the changes that have occurred in England largely mirror those already described for Britain as a whole, with 65% of natives and 64% of archaeophytes estimated to have decreased in range over the longer term and 61% of neophytes estimated to have increased (Fig. 31 on next page). These figures reflect the high proportion of lowland landscapes that are dominated by intensive farming, urban areas and associated land use activities (e.g. roads, railways, industry and buildings). The upland regions are less intensively managed, but probably more so than equivalent regions of Wales and Scotland due to higher human population densities and associated activities. Therefore, the declines of species associated with upland habitats have been more
pronounced than in Wales and Scotland, especially for those plants with ranges extending into the lowlands on arable land, and in neutral grasslands, heathlands, bogs, wetlands (fen, marsh and swamp) and freshwaters. In contrast, the distributions of species of montane habitats have been more stable than in Wales and Scotland, with no evidence for a decline in recent decades, whereas species associated with coniferous woodland have displayed a steady increase in range.
Despite its small size Wales has a relatively large flora, comprising 72% of all British species, including 78% of natives (Table 3). However, the overall estimated trends are markedly different to those in England and to a lesser extent Scotland, with which it shares similarities (small human population, few urban areas, greater proportion of upland terrain). Most notably, only 41% of natives and 45% of archaeophytes were estimated to have decreased, whereas 75% of neophytes were estimated to have increased (Fig. 32 on next page). Whilst this may partly result from a degree of under-recording in the past, this seems to correlate well with major differences in the landscapes of Wales when compared to England, especially the greater proportion of extensively managed upland habitats. These are less profitable from an agricultural perspective and so have undergone fewer radical changes than more intensively managed and densely populated lowlands of England and Scotland over the past 70 years.
The estimated distributions of species associated with
90 Newman, J.R. & Dawson, F.H. 1999. Ecology, distribution and chemical control of Hydrocotyle ranunculoides in the U.K. Hydrobiologia, 415: 295–298.
91 The numbers of species estimated to have decreased in each country is based on the mean of the 100 compatible linear slope estimates produced for each species, as shown for Hutchinsia Hornungia petraea in Figure 5a. The mean of these 100 estimates was calculated for each species. Decreasing species had a mean slope value <= -0.001, whilst increasing species had a slope value of >= 0.001. Species with mean trend slopes between -0.001 and 0.001 were therefore classed as stable as per the discretisation scheme illustrated in Figure 5c. Note that this summary is a simplification of the situation, as it ignores the spread of any given species’ slopes across trend categories. See Chapter 6 of the Plant Atlas 2020 book for further details on the underlying methods.
lowland habitats have remained relatively stable or have even increased slightly since the 1950s, most notably plants of arable, neutral grassland, broadleaved woodlands, hedgerows, fens, marshes, swamps, rivers and standing waters. In comparison, plants more typically associated with upland habitats, notably heathlands, bogs, and acid grasslands, all show consistent declines, albeit less pronounced than in England and Scotland. Plants associated with calcareous grasslands saw a steep decline as in other parts of Britain, presumably reflecting not just outright loss but also the poor condition of some grasslands in Wales which, as in other parts of Britain, are likely to have suffered from changes in grazing pressure (both under and overgrazing), eutrophication and the spread of invasive species since the 1950s. Conversely, species of coniferous woodlands saw the steepest increase of any British country, which is not surprising given the extent of afforestation in the uplands of Wales. The results for species of montane habitats were largely equivocal and may reflect the very small area of truly montane habitat in Wales when compared to other parts of Britain.
Although similar in size to England, Scotland supports 75% of all British species including 79% of natives (Table 3). Overall, 47% of natives and 66% of archaeophytes are estimated to have decreased in range since the 1950s, whereas 63% of neophytes are estimated to have increased (Fig. 33). The figure for natives is lower than in England but higher than in Wales and presumably reflects the greater area of intensively managed and densely populated land in Scotland relative to Wales, and the greater extent of extensively managed upland habitats relative to England. The decline of archaeophytes is the highest of the three countries (but on a par with England) and reflects the rarity of many of these species in Scotland, combined with the widespread declines of arable weeds due to the agricultural changes described in Section 7, and also the abandonment of small-scale cropping around crofts in northern and western areas.
The trends for acid and calcareous grasslands and heathlands all mirrored England, with long-term declines since the 1950s, presumably due to the ongoing loss of open habitats to agriculture, although neutral grasslands appear to have recovered to some extent in recent decades. The reasons for this are unclear but could relate to widespread sowing of many of the constituent species in wild-flower seed mixtures for landscaping along roadsides and in urban areas. Like England and Wales, the flora of broadleaved woodlands has been stable at the 10 km square scale since the 1950s, whereas species of coniferous woodlands have increased, although less than expected, possibly due to under-reporting of planted conifers in remote regions. As in Wales, species associated with bogs saw an estimated increase in range overall between the 1950s and 1990s, possibly due to an increase in recorder effort in remote upland regions during the 1990s, but they have declined as a group since then (despite high recording effort), possibly due to land use changes, eutrophication and climate change. A
Figure 31. The proportion of plants with decreasing, increasing or stable estimated mean trends at the 10 km square scale in England since the 1950s. These mean trends are shown in relation to whether species are native or were introduced by humans in ancient or modern times (archaeophytes, neophytes).
Figure 32. The proportion of plants with decreasing, increasing or stable estimated mean trends at the 10 km square scale in Wales since the 1950s. These mean trends are shown in relation to whether species are native or were introduced by humans in ancient or modern times (archaeophytes, neophytes).
Decrease
Figure 33. The proportion of plants with decreasing, increasing or stable estimated mean trends at the 10 km square scale in Scotland since the 1950s. These mean trends are shown in relation to whether species are native or were introduced by humans in ancient or modern times (archaeophytes, neophytes).
similar pattern emerged for montane species which again may reflect more recent declines due to climate change, eutrophication and overgrazing. Like Wales, wetland species (fen, marsh, swamp) have not suffered to the same degree as in England, and species of running and standing
waters have seen an overall increase since the 1950s. This likely reflects the relative stability of freshwater habitats in Scotland, especially those in the uplands which have been largely unaffected by habitat loss and pollution from agricultural and human sources.
What changes might a botanist from the 1950s notice on a botanical tour of Britain today? If they had grown up in the early 20th century, then they would be struck by the amount of arable cultivation and the lack of plants amongst the crops. They would lament the loss of species-rich pastures and hay meadows, now replaced by ‘nitrogengreen’ rye-grass monocultures, and the loss of chalk downland, so cherished by generations of botanists, much of it now invaded by scrub. Mature elms would be notable by their absence as would heathlands and wetlands in many parts of lowland England, with the fragments that remain nestled amongst improved pasture, roads, housing estates and golf courses. The margins of our lakes and watercourses might appear less well vegetated, but many riverbanks would appear lusher (due to increased nutrients) and support some unfamiliar exotic species.
Motorways would be a noisy intrusion to the rural scene, often bisecting important sites such as Twyford Down or Aston Rowant. But if they looked closely at the roadsides, they would be amazed to see coastal plants like Danish Scurvy-grass Cochlearia danica growing inland or once common cornfield weeds such as Corncockle Agrostemma githago and Cornflower Centaurea cyanus creating colourful displays in our towns and cities.
On a more positive note, ancient woodlands would appear much the same, although some botanists might comment on a lack of diversity in the ground flora or signs of neglect. They might comment on the number of new hedges and small woodlands on farmland, and the unfamiliarity of some of the species planted, or the numbers of disused railway lines and flooded gravel pits which add so much biodiversity to the lowland scene. Much of our coastline would appear unchanged except around major estuaries where intertidal habitats have been ‘squeezed’ by agriculture, port infrastructure and urban sprawl.
In the uplands, the most striking differences would be the ‘serried ranks’ of conifer trees planted over vast areas, and the ‘grips’ draining areas of blanket bog and wet heath. Those familiar with montane habitats might notice the scarcity of snow patches and the lusher, more vegetated slopes and hollows where it once lay. Some might also comment on the virtual restriction of some of our most precious mountain plants to rock ledges beyond the reach of sheep and deer.
Plant Atlas 2020 has revealed the extent to which we have transformed our landscape over the last century. The overall message is clear – our native flora is much
diminished relative to the situation recorded by our predecessors in the 1950s. We need a holistic plan of action to reverse this decline so that our flora can be restored and flourish for the benefit of this and future generations. The evidence presented here will be vital in helping shape this plan for plant conservation which, we believe, should include the following six actions:
1. Strengthen protection for plants and other wildlife. The laws that protect biodiversity need to be strengthened to ensure that the best sites are safeguarded and managed in a way that benefits the species that they were originally set up to conserve. These laws also need to reflect the threats and challenges that our wild plants are facing, most notably new urban and industrial developments, indiscriminate tree planting, land use change, climate change and the spread of invasive species.
2. Extend the area of high-quality habitat available for plants. The area of high-quality, species-rich habitat should be extended through more proactive and targeted measures that benefit biodiversity, of which plants are a fundamental component; this could be achieved through new designations, as well as measures to restore and/or manage more land for nature, link areas of existing high-quality habitat, and to protect and enhance ecological function where this has been compromised by past land use (e.g. over or undergrazing or the drainage of wetlands and peatlands). Stronger monitoring and enforcement of such measures are needed to ensure that public investments in such schemes are truly benefitting biodiversity.
3. Managing land, water, and soil more sustainably for plants. Unsustainable land uses that are known to be harmful to plants and other wildlife need to be reduced or replaced by more sustainable practices. Those that have the greatest impact on plants are the use of chemical fertilisers that damage soils, insect communities and aquatic ecosystems, unsustainable farming practices that promote generalists at the expense of specialists, the burning and afforestation of sensitive peatlands and other habitats, and land management that promotes high densities of livestock and deer in the uplands. Measures are also needed to ensure that the planting of trees for carbon sequestration are carefully planned to ensure important habitats for plants, other wildlife and carbon storage are protected92
4. Placing plant species recovery at the heart of conservation initiatives. The protection of sites and landscapes, combined with sustainable land use, helps to reduce negative impacts on plants, and habitat restoration creates more viable space for them. However, unless the management of these places is carried out with the requirements of plants in mind then we will continue to see population losses, not gains, in overall biodiversity. Considering the needs of plants, and planning to manage or restore differing vegetation types for them, should therefore be a central ecological tenet of conservation measures and efforts for nature recovery more generally.

5. More effective plant monitoring and research. There has never been a greater need for a robust plant monitoring and surveillance programme that tracks trends in relation to habitats and key drivers (pressures, threats, interventions). Such schemes


need to be well designed so they deliver reliable data that answers clear policy and research questions. They also need to be adequately funded to ensure continuity and viability and be underpinned by more intensive surveys and research to improve our understanding of the changes and measures needed to mitigate them.
6. Reduce plant blindness. Despite their importance to us, plants are often overlooked and undervalued. To address the substantial declines in populations of our wild plants highlighted by Plant Atlas 2020, there is an urgent need to build appreciation of the vital roles that wild plants play in our daily lives, the threats they face and what we can do to help them. This needs to occur across all sectors of society so that we can work together to protect and restore the wild plants on which we all rely.Is volest, in etur aut ommostrum et ea ilitasp elicatum licae volorecto digende nditate
Plant Atlas 2020 would not have been possible without the efforts of thousands of volunteer botanists who went out in all weathers to record the locations of plants across the whole of Britain and Ireland. In particular, the authors would like to acknowledge the enormous contribution of BSBI vice-county recorders who carried out the bulk of recording, as well as the collation and checking of the many millions of records that were submitted during the project. The BSBI is grateful for the generosity demonstrated by its members in supporting the Plant Atlas 2020 project through their many financial donations, and gratefully acknowledges the support of its partner organisations, the logos of which can be found below.
The authors are grateful to Julia Hanmer, Paul Green, Louise Marsh, Simon Smart, Nicola Hutchinson and Mags Cousins for their constructive comments on an earlier version of this report and to Fred Rumsey, Ian Bonner, Jennifer Clayton-Brown, Mark Lynes, Paul Sterry, Richard Abbott and Sarah Watts for permission to use their photos. The BSBI authors would personally like to thank Richard Burkmar, Oliver Pescott and David Roy of the UK Centre for Ecology and Hydrology for their invaluable contributions, expertise and good humour throughout the course of the Plant Atlas 2020 project.

The Botanical Society of Britain and Ireland (BSBI) is the leading charitable voluntary organisation promoting the study, understanding, conservation and enjoyment of wild plants in Britain and Ireland. Tracing our origins back to 1836, we are one of the world’s largest contributors of biological records, with our database currently holding over 50 million records, many collected by volunteer members of the Society. We provide opportunities for involvement through a range of participation projects, surveys, events, training opportunities and the production of books and other resources. We aim to build a diverse community of skilled and enthused botanists, provide data and science to help address biodiversity loss and climate change, and disseminate information to drive a passion for plants.

The Biological Records Centre (BRC), part of the UK Centre for Ecology & Hydrology (UKCEH), provides a focus for the collation, management, dissemination and interpretation of biological records. Most records are collected by volunteer recording schemes and societies, which are integral to the work of BRC. Our innovative use of technology helps to harness the enthusiasm and knowledge of naturalists, enables them to collate and analyse their records, and helps the recording community to publish atlases, data and other online resources, thus providing essential information that informs research requirements, policy development and the conservation of our heritage of wildlife.
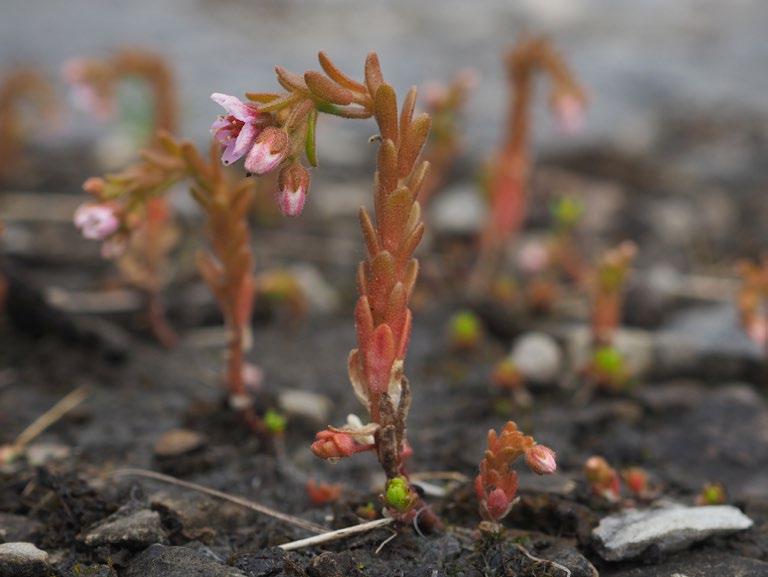 Hairy Stonecrop Sedum villosum, Selside, Yorkshire. Photo © Pete Stroh.