
INCLUDING KEY PERFORMANCE METRICS


Tim Kenyon, Vice-President, Research Ken Chan,
This report contains certain forward-looking information. In preparing the Budget Report, certain assumptions and estimates were necessary. They are based on information available to management at the time of preparing the budget. Users are cautioned that actual results may vary. Throughout the text in this report, financial values have been rounded to the nearest thousand unless otherwise stated.
We are pleased to provide this year’s budget report. This fiscal year has been shaped by some remarkable but increasingly familiar challenges. Despite these challenges, we are pleased to provide an overview of the thoughtful, strategic, and collective decisions that shaped the budget allocations presented in this document and have ensured the University remains on sound financial Forfooting.thefourth consecutive budget year, Ontario’s universities faced unprecedented fiscal challenges. This era of uncertainty began with the provincially mandated 10 per cent domestic tuition rate reduction for 2019-20 academic year. Soon thereafter, the global pandemic further reduced Brock’s fiscal flexibility. It led to the moderating of Brock’s planned enrolment trajectory and significantly impacted the University’s ancillary Therevenues.10per cent tuition rate cut resulted in an immediate $15-million permanent reduction in revenue perpetuated by the subsequent and ongoing tuition rate freeze. In 2020-21, the global pandemic resulted in revenues falling short of the pre-pandemic budget by another $39 million. The combined impact of these two events exceeds $54 million. Despite this, Brock’s revenue is budgeted to be only $13 million less than the Institutional Strategic Plan’s forecast. This is an extraordinary accomplishment by everyone at Brock. Every member of the Brock community played a role in helping to ensure the University emerged from these challenging times. In the year just ended, the University made significant gains in key strategic areas. In 2021-22, funding for student financial aid increased by 17 per cent as part of a plan to invest in our students and to support them as they recovered from the pandemic. In 2022-23, we will continue this investment with a further increase of 17 per cent. While this level of expenditure is not sustainable over the longer term, we recognize the ongoing hardship faced by our students and this funding will continue to alleviate financial barriers.
Message from the senior team
Vice-President,Vice-Chancellor;LynnAdministrationVice-President,Wells,PresidentandProvostandAcademic MessageCONTENTSfromthesenior team ii Our financial health Financial results 2 About Brock Governance at Brock University 3 Board of Trustees 3 Senate 4 Pullout 1 Institutional Strategic Plan ii The big picture (pullout) iv Budget development Process and objectives 9 BudgetFrameworkenvironment 15 Review Financial update 19 Historical timeline 20 Pullout 2 Space considerations i Historical timeline (pullout) iii Budget details Funding budget 23 Revenue assumptions 23 Operating cost assumptions 34 Snapshots Responsibility budget centre snapshots 40 Teaching Faculties 44 Academic support 50 Student specific 53 Ancillary 59 Shared services 62 Space 68 Global 71 Capital 75 Capital and related projects budget 75 Background 75 Capital and related projects overview 75 Treasury Financing 81 Endowment summary 83 Allocation model Revenue and expense allocation model 85 Appendices Appendix A 88 Appendix B 88 Appendix C 90 Appendix D 92 Appendix E 93 Appendix F 94


ReportBudget2017-18 1 ReportBudget2022-23MESSAGEFROMSENIORTEAM
We thank each one of you for your dedication to the programs you support within our Brock community. Progress is ongoing yet dependent on your commitment, a commitment which is unmistakably evident in the development of our students, knowledge and community. We have much more work to do in removing barriers, fostering inclusivity, and supporting reconciliation and decolonization through our thoughts and actions, yet we are confident in the people who are supporting these vital strategic priorities.
Another challenge across the sector and at Brock is the evolving instructor and student expectations for teaching and learning. Expectations and capabilities for pedagogy are becoming more diverse, arguably at an accelerated rate, due to the global pandemic. This budget plan supports capital developments in a new online learning management system, and these investments will also support the expansion of Brock’s accessibility to students beyond our physical campus and our ability to generate enrolment.
Brock will further increase its investment in Student Wellness and Accessibility Services, almost doubling the budget allocation in recognition of the growing need to support student mental health and health services. As outlined in the Fiscal Framework, Brock must rely on enrolment growth and new revenue sources to achieve longer-term fiscal sustainability within the current regulatory environment. Significant investments are being made to accelerate the startup of the Yousef Haj-Ahmad Department of Engineering and in Professional and Continuing Studies. These investments are allocated from the University’s strategic reserves and not at the expense of our Faculty and department budgets. This budget plan also makes strategic investments in the University’s research enterprise. This continues a sustained and strategic effort to deliver increased investment supporting Research. The plan also provides a stable, centrally funded grant program that advances innovation across the campus. These investments are aligned with Brock’s Institutional Strategic Plan, which prioritizes building research capacity across the University. With the approval of the 2022-23 Fiscal Framework Update, we also have a commitment to accelerate research support funds over the coming years. Further to these commitments, Brock’s recent fiscal planning progression recognizes the need to align our resource allocations with our comprehensive university aspirations and growth in graduate studies.

Financial results The funding budget for fiscal 2022-23 is illustrated in Figure 1. It identifies an in-year mitigation target of $3.0 million, as compared to a mitigation target of $3.5 million in 2021-22. At the time of preparing the budget report, fiscal 2021-22 has not been completed; however, we are projecting through our second trimester reporting (T2) for fiscal 2021-22 a remaining mitigation target of $2.1 million, which we anticipate will be mitigated by year-end. The information below describes our financial health and compares several of our financial health metrics to other comprehensive universities. In addition to the metrics below, Brock's current DBRS Morningstar credit rating is "A (high)". See page 82 for further details of the credit rating. Figure 1 ($000s) 2022-23Budget 2021-22Budget 2020-21Actual Revenue Student fees 204,268 196,563 186,012 Grant revenue 99,589 97,708 106,724 Internal chargebacks 11,948 8,641 3,098 Inter-fund revenue 11,981 7,462 8,843 Other revenue 62,176 48,406 24,319 Total revenues 389,962 358,780 328,996 Operating costs Personnel costs (245,830) (233,761) (214,657) Inter-fund expense (32,690) (26,610) (18,143) Other operating costs (114,445) (101,888) (83,302) Total operating costs (392,965) (362,259) (316,102) Mitigation target 3,003 3,479 Discretionary appropriations –one-time items (9,936) Discretionary appropriations –general operations (2,949) Funding surplus - - 9 Refer to page 82 for explanations of the debt-related financial health metrics. Financial health metrics Statement of operations metrics The following metrics were developed to identify areas of strength as well as improvement. Figure 2 By student headcount ($000s) Brock Median(1) Average (1) April 2021 April 2020 April 2021 April 2020 April 2021 April 2020 Student fees (primarily tuition) 9.46 9.39 9.46 9.60 9.43 9.41 Grant 6.07 5.62 9.67 8.44 10.50 10.27 Personnel costs 11.18 11.48 13.77 13.88 14.01 13.82 Scholarships 1.40 1.25 1.53 1.39 1.63 1.55 Interest on long-term debt 0.53 0.35 0.33 0.35 0.33 0.31 Investment income 0.24 0.15 0.80 0.47 1.00 0.51 (1) Calculated using financial information from 13 comprehensive universities. Certain 2020 metrics have been updated due to revisions in certain universities' financial statements. Brock’s tuition is in line with the average; however, grant revenue per student continues to be well below the sector average and represents an area of ongoing attention for the University. Naturally, Brock operates more efficiently, given the belowaverage funding, and this results in lower personnel costs per student to counterbalance the lower funding. Brock continues to invest in students through increasing scholarships. Interest and investment income metrics are in line with Brock’s financial health metrics, as detailed below. ReportBudget2022-23 2 healthfinancialOur Figure 3 Brock Median (1) Weighted average (1) April 2021 April 2020 April 2021 April 2020 April 2021 April 2020 Primary reserve ratio 25.6% 14.2% 27.5% 22.8% 45.2% 40.6% Debt burden ratio 3.7% 6.7%(2) 2.6% 2.4% 2.5% 3.8% Interest burden % 3.4% 2.1% 1.5% 1.3% 1.7% 1.2% Interest coverage 3.00 4.64 4.48 4.64 5.19 5.07 Viability ratio 32.9% 35.7% 113.1% 109.2% 131.5% 131.6% Net operating revenues ratio 8.3% 9.3% 11.7% 4.6% 15.20% 5.4% Employee future benefits per student headcount ($000s) ($1.09) $(1.13) $(1.24) $(3.52) $(2.35) $(4.25) Endowment per student headcount ($000s) $6.28 $5.25 $10.37 $8.61 $8.81 $7.94 (1) Calculated using financial information from 13 comprehensive universities. Certain 2020 metrics have been updated due to revisions in certain universities' financial statements. (2) Increase is due to a one-time repayment of a $14.4-million loan utilizing the debt repayment reserve established within the Fiscal Framework.
• Debbie Zimmerman, Community Trustee
• Christopher Yendt, Student Trustee, President, Brock University Graduate Students’ Association
24 Board committeesTrusteesof CommitteeExecutive UniversityCommunityandExperienceCommittee InfrastructureCapitalCommittee Financial Planning andCommitteeInvestment CommitteePension CommitteeAudit HumanCommitteeResourcesGovernance/NominatingCommittee Figure 5 Figure 4: The bicameral system of governance Board Trusteesof Senate Standing committees and ad hoc or special committees Standing committees and ad hoc or special committees
• Anne McCourt, Community Trustee
The Board consists of up to 26 members, including up to 17 community members elected by the Board, as well as one graduate and one undergraduate student, three faculty members and two staff members elected by their respective constituencies. The Chancellor and the President and Vice-Chancellor are ex officio members of the Board. The Board currently consists of 24 members.
• Bradley Clarke, Staff Trustee
• Mark Arthur, Community Trustee, Chair of the Board
• JoAnna Roberto, Community Trustee
• Hilary Pearson, Chancellor
• Rafay Rehan, Student Trustee, President, Brock University Students’ Union
• Miriam Richards, Faculty Trustee
• Robert Welch, Community Trustee
The University was incorporated in 1964 through The Brock University Act (the Act), a Statute of the Province of Ontario. The University is governed by the Act, which provides that the governance, conduct, management and control of the University’s property and the conduct of its business and affairs is vested in the Board of Trustees (the Board), while the Senate is responsible for the education policy of the University. This bicameral system of governance is shown below.
• Greg Berti, Community Trustee
• Don Cyr, Faculty Trustee, Chair of Senate
• Bill Maurin, Community Trustee
ReportBudget2022-23 BROCKABOUT3
Board of Trustees
• Erin Mathany, Community Trustee, Member, Brock University Alumni Association Executive Committee
• Mary De Sousa, Community Trustee, Vice-Chair of the Board
• Trecia McLennon, Staff Trustee
2021-22 Board of Trustees
• Jens Coorssen, Faculty Trustee
members
• Arti Freeman, Community Trustee
• Brian Lang, Community Trustee
• Lynn Wells, Interim President and Vice-Chancellor
• Marylee O’Neill, Community Trustee
Governance at Brock University About Brock
• Kristian Knibutat, Community Trustee
• Gary Comerford, Community Trustee, Immediate Past Chair of the Board
• Stephanie Thompson, Community Trustee
• Michelle
Carol Merriam (Dean, Faculty of Humanities) Michael Owen (Dean, Faculty of Education) PeterTiidus (Dean, Faculty of Applied Health Sciences)
Tim Kenyon (Vice-President, Research)
and two
•
•
• Kirsty
Hilary Pearson (Chancellor)
Lynn Wells (Interim President and Vice-Chancellor; Provost and Vice-President, Academic)
•
Ingrid Makus (Dean, Faculty of Social Sciences)
• Ejaz Ahmed (Dean, Faculty of Mathematics and Science)
•
James O’Brien Murphy (FOSS) Nickel (FOH) Unyong (Howard) Pyo (GSB) Rettig (Library) Ribaric (Library) Ritchie (FAHS) Savage (FOSS) Spence (FAHS) Thongpapanl (GSB) Vachon (GSB) Wade (FAHS) Webber (FOSS) Welbourn (FOE) elected full-time undergraduate students graduate students the Senate.
• Ian
• Larry
Robyn Bourgeois (Acting Vice-Provost, Indigenous Engagement)
Thomas Winger (President, Concordia Seminary)
• Francine
elected by their respective constituencies. There are also 22 ex officio members of
Brian Power (Vice-Provost and Associate Vice-President, Academic)
Andrew Gaudes (Dean, Goodman School of Business)
• Ken Chan (Vice-President, Administration) Austin Hurley (Vice-President, External Affairs, BUSU) Haley Myatt (Designate for President, GSA from the GSA Executive) (non-voting)
•
• Roberto
•
•
•
•
•
•
(Alumni Association Representative) • Jennifer Dockstader (Co-Chair, Aboriginal Education Council) Full-time teaching staff/professional librarian representatives 3922 71 • Lynn Arner (FOH) • Michael Ashton (FOSS) • Kate Bezanson (FOSS) • Michael Bidochka (FMS) • Irene Blayer (FOH) • Alison Braley-Rattai (FOSS) • Christene Carpenter-Cleland (FMS) • Rosemary Condillac (FOSS) • Maureen Connolly (FAHS) • Jens Coorssen (FAHS) • Gale Coskan-Johnson (FOH) • Don Cyr (GSB) • Drew Dane (FOSS) • Sheng Deng (GSB) • Tim Dun (FOSS) • Fayez Elayan (GSB) • Bareket Falk (FAHS) • Amy Friend (FOH) • Dawn Good (FOSS) • Nicholas Hauck (FOH) • David Hutchison (FOE) • Kelli-an Lawrance (FAHS) • Jingyu Li (GSB) • Francine McCarthy (FMS) • Cheryl McCormick (FMS) • Richard Mitchell (FOSS) • Tim
Mark Robertson (University Librarian) Mark Arthur (Chair, Board ofTrustees)
Anna Lathrop (Vice Provost and Associate Vice- President, Students)
• Monica
•
• Shannon
Senate As of the time of preparation of this report, the Senate consists of 71 members, including 39
FacultyNote: of Applied Health Sciences (FAHS); Goodman School of Business (GSB); Faculty of Education (FOE); Faculty of Humanities (FOH); Faculty of Mathematics and Science (FMS); Faculty of Social Sciences (FOSS); and Faculty of Graduate Studies (FGS). standingSenateandspecialcommittees GovernanceCommittee CommitteeGraduateStudies InfrastructureInformationTechnologyandCommittee Research ScholarshipandPolicyCommittee andTeachingLearningPolicyCommittee UndergraduateStudentAffairsCommittee StudentAppealsBoardUndergraduateProgramCommitteeCommitteeandPlanning,PrioritiesBudgetAdvisory CommitteeAcademicReview(special) Two (special)CouncilRow Figure 6 22Representatives of the Board of Trustees • Arti Freeman • Debbie Zimmerman 6 • Ria Choksi • Omer Gul • Yasmine Hejazi • Benjamin Johnson • Daniel Krowchuk • Moksh Sharma Graduate student representatives • Ash Grover • Nawal Syed Undergraduate student representatives
teaching staff and professional librarians, two members of the Board, six
•
•
•
ReportBudget2022-23 BROCKABOUT4 2021-22 Senate members Members ex officio •
Geraldine Jones (Registrar and Associate Vice-President, Enrolment Services) (non-voting)
• Tek
•
Suzanne Curtin (Vice-Provost, Graduate Students and Dean, Faculty of Graduate Studies)
•
•
• Terrance
•
• Tim
d) The budget system and strategic planning processes, and any proposed changes in the budget system and strategic planning processes of the University.
Barbara Sainty – BUFA Observer (non-voting)
•
c) The academic and fiscal challenges of the University.
• David Hutchison (FOE) Tim Murphy (FOSS) Jens Coorssen (FAHS) Rosemary Condillac (FOSS) Michael Ashton (FOSS) Christene Carpenter-Cleland (FMS) Tim Dun (FOSS) Haley Myatt Graduate Student Omer Gul – Undergraduate student Ex officio Don Cyr (GSB) – Senate Chair
f) Any other matters referred to it by the Senate or the Senate Governance Committee.
•
i
The following are the 2021-22 PPBAC members: Elected members
•
15726 Pullout 1i
•
Students •
Ingrid Makus (FOSS) – Faculty Dean Michelle McGinn – Associate VP, Research
•
Lynn Wells – Interim President and Vice-Chancellor Provost and VP, Academic S. Ejaz Ahmed (FMS) – Faculty Dean
•
•
•
•
b) The academic and fiscal priorities of the University.
•
e)Matters requiring institutional advocacy.
•
a) The principles of allocation of the University budget and determination of strategic objectives and prioritization processes.
•
Planning, Priorities and Budget Advisory Committee
The Senate’s Planning, Priorities and Budget Advisory Committee (PPBAC) defines its terms as follows: It undertakes the responsibility to advise Senate regarding advice to the Board of Trustees in respect to the consistency of the budgets, policies, plans and prioritization processes with academic policy, as well as their consonance with the goals of the University. The PPBAC advises Senate regarding the following:
•


Institutional Strategic Plan
Strategic priority: Build research capacity across the University Our research focus is central to our identity. Brock will invest in building a world-leading research institution that is grounded in scholarly excellence and strong graduate and post-graduate programs. We will leverage our strengths within and across disciplines to enhance research impact.
The Institutional Strategic Plan establishes four strategic priorities, along with associated goals and action items, to advance Brock’s vision over the next seven years.
These priorities focus the University community on fulfilling and strengthening our mission as an engaged and comprehensive university through: Strategic priority: Offer a transformational and accessible academic and university experience To be a destination of choice for undergraduate, graduate and part-time students, we must ensure an academic and university experience that positively transforms our students’ abilities, understanding and impact on the world. We teach future-ready students and equip lifelong learners with a zest for knowledge, skills and competencies that will enable them to achieve their full academic, professional, career and life potential. Core to our student experience is the development of engaged citizens who are resilient, involved, career-ready and versatile.
Strategic priorities
Illuminating Brock’s path forward is our Brock University Institutional Strategic Plan for 2018-2025, entitled “Niagara Roots – Global Reach,” referred to throughout the text of this document as the “Institutional Strategic Plan.” It was developed through a broad-based, full-year consultation process and has been approved by the Board of Trustees and Senate. The document sets out the vision, mission, guiding values and strategic priorities to support planning and decision-making until 2025. The entire Plan, including the Guiding Values, can be viewed at sites/65/Brock-University-Strategic-Plan.pdfbrocku.ca/vp-academic/wp-content/uploads/
Pullout 1ii
Vision
Brock University is a dynamic, comprehensive university that makes a positive difference in the lives of individuals in our Brock community, the Niagara region, Canada and the world through leadership, innovation and excellence in learning, teaching, research, scholarship and creativity across disciplines. Mission Brock flourishes through the scholarly, creative and professional achievements of our students, faculty and staff. Although we share a common purpose, we recognize and honour knowledge pursued through diverse perspectives and approaches. Our academic mission is to nurture and support our students and faculty in the discovery of knowledge through exemplary scholarship, teaching and service. We provide undergraduate, graduate and professional education of the highest quality. Our graduate programs enhance Brock’s growing reputation for excellence in teaching, research, creativity and innovation. We provide a transformative experience for our students inside and outside the classroom by helping to develop their full potential as educated and engaged citizens in local and global communities. Brock graduates go out into the world as leaders, with a track record of entering fulfilling careers across all disciplines. Brock University works to enhance the economic, social, cultural and intellectual lives of the communities around us – Niagara, Ontario, Canada and globally – and to demonstrate the vital ways in which we contribute to the well-being and betterment of society in the 21st century.
Strategic priority: Foster a culture of inclusivity, accessibility, reconciliation and decolonization At Brock, we believe that a diverse and welcoming learning community is built upon the foundation of exceptional students, faculty, staff and alumni. This requires that Brock be attractive and welcoming to people of all identities, and accepting of the unique histories and experiences of Indigenous people within the Canadian state.
Strategic priority: Enhance the life and vitality of our local region and beyond Brock is committed to working with the communities in Niagara, Ontario, Canada and the world. Through local and global connections, we increase opportunities for the residents of Niagara. By responding to the needs of society and supporting its growth and development, we strengthen community vitality and vibrancy.
Pullout 1iii Our strategic priorities set the University on the path towards greater national and global recognition for its engagement and relevance to students and communities through enhanced innovation and excellence in teaching, learning, discovery, creativity and the application of knowledge across disciplines. Integrity and respect Freedom of thought and expression coupled with academic responsibility Inclusivity, diversity, equity Unique student experience The generation and mobilization of knowledge Reconciliation and decolonization Offer transformationalaandaccessibleacademicanduniversityexperience Build capacityresearchacrosstheUniversity Enhance the life and vitality of our local region and beyond Foster a culture of reconciliationaccessibilityinclusivity,,anddecolonization aluesGuidingV Strategic Focus and Priorities Innovation Sustainable,transdisciplinarityandaccountablestewardship GUIDING VALUES AND STRATEGIC PRIORITIES(1) (1) The colours in the graphic include Brock’s brand standards and those from the Indigenous Medicine Wheel, the Pride Flag and the Dish with One Spoon Wampum Agreement Flag. Figure 30
Source: 2020 Ontario University Graduate Survey. 94% of monthsemployedundergraduateBrockstudentswerewithin24ofgraduation.
picturebigThe
Source: Maclean’s 2022 University Rankings.
Source: 2020 Ontario University Graduate Survey. Brock was ranked #1 of 15 among universitiescomprehensiveCanadianformentalhealthservices.
Note: the table above also includes ‘No Faculty’ (i.e. auditing and non-degree) enrolment. Student headcount full time (FT) and part time (PT)
1,879 1,885 5,362 5,765 5,625 5,827 5,543 Year Figure 10: Fall
30,477 27,177 Total personnel
countries) International
AppliedSciencesHealth Education Humanities Mathematics and Science Social SciencesGoodman School of Business 21-2220-2119-2018-1917-18 21-2220-21 2,449 1,9141,809 1,724 2021 undergraduate permanent (OutsideDomesticInternational(Ontario)Ontario (IncludesOtheNigeriaBangladeshr85UnitedChinaIndia on points which have a financial impact. The data points were made available from IA as well as other units throughout the University. Your suggestions for future budget reports and key data points are always welcome at budgetreport@brocku.ca The second pullout after page 20 presents a timeline that includes some major events impacting our financial experience since 2002-2003, closely aligned with when the move to a comprehensive university was proposed and endorsed. We hope that you find these data points useful and that they encourage constructive and collegial discussion.
POINTSTHEINTRODUCINGDATA
Total
country of residence (%) Domestic
members, Associate Deans, Associate Vice-Presidents of Research and Associate Librarian; Admin/Professional – ongoing administrative/professional and exempt staff;
1
EmiratesArab 90.0 8.3 2.02.22.8.4 .5.4 1.7 Figure 11 Fall 2021 graduate students by permanent country of residence (%) 63.7 32.6 12.6 7.8 1.1.2.3656.8 3.7 Domestic (OutsideDomesticInternational(Ontario)Ontario International RIranChinaIndia(Islamicepublicof UnitedBangladeshStates of America (IncludesOther 39 countries) Total undergraduate students 1,893 Faculty of Applied Health Sciences (FAHS) Goodman School of Business (GSB) Faculty of Education (FOE) Faculty of Humanities (FOH) Faculty of Mathematics and Science (FMS) Faculty of Social Sciences (FOSS) 40184 83 613433 Total graduate students 663 44115 16 78 5954540 Figure 10: Fall 2021 undergraduate students by permanent country of residence (%) Figure 11: Fall 2021 graduate students by permanent country of residence (%) Figure 12: 2021 international student headcount by Faculty As part of the budget report, we provide data points to assist users of this report to draw relationships between financial and non-financial data. The goal is to continue the process of providing meaningful data points to help establish a foundation to explain the “why” behind the revenue and expense values and the outcomes the budget supports. The data points presented in this report were chosen in consultation with Institutional Analysis (IA), with an emphasis
support and technical staff;
Source: Maclean’s 2022 University Rankings. Brock was ranked #3 of 15 among residencecomprehensiveCanadianuniversitiesforliving.
Figure 9 Personnel group (1) ($000s) 2022-23 6,964 2,513 9,477 SAC 6,693 1,438 8,131 5,715 1,134 6,849 CUPE 4207 – Unit 15,282 1,742 17,024 14,398 1,642 16,040 temporary personnel 14,625 1,081 15,706 13,474 963 14,437 10,785 temporary personnel 29,907 2,823 32,730 27,872 2,605 200,909 BUFA OSSTF – CUPE 1295 FT – full-time
16,392 Other
Budget 2021-22 Budget 2020-21 Actual Salary/Wage Benefits Totalcostspersonnel Salary/Wage Benefits Totalcostspersonnel Totalcostspersonnel Faculty and Professional Librarians 96,628 21,480 118,108 94,023 20,647 114,670 106,533 Admin/Professional 51,762 13,975 65,737 47,656 13,381 61,037 54,667 OSSTF 7,986 2,513 10,499 7,857 2,538 10,395 9,498 CUPE 1295 FT 7,154 2,474 9,628
students by
44,921 245,830 190,742 43,019 233,761 214,657 (1) Faculty and Professional Librarians –
of monthsemployedundergraduateBrockstudentswerewithinsixofgraduation.
13Figure headcountStudent: majorofFacultyby 14Figure full-timeStudent: majorofFacultybyequivalent 2017-18 2018-19 2019-20 2020-21 2021-22 Undergraduate (FT) 14,767 14,980 15,519 15,324 15,220 Undergraduate (PT) 2,288 2,306 2,270 2,448 2,433 Graduate (FT) 1,425 1,493 1,660 1,637 1,617 Graduate (PT) 352 333 347 314 243 Total 18,832 19,112 19,796 19,723 19,513 Note: the table above also includes ‘No Faculty’ (i.e. auditing and non-degree) enrolment. Figures represent the number of students in each Faculty of Major on Nov. 1 of each Academic Year (as per PFIS-USER submissions). In addition, figures also include new-entry enrolments as of Feb. 1 for Master of Education (ISP), Master of Accountancy, Master of Material Physics, and Technological Education programs. For the 2020-21 Academic Year, Master’s Preparation Certificate in Education was also included in this list, while Master of Education (ISP) was excluded. FTEs are reported based on a student’s home Faculty, weighted based on each individual’s course registrations, according to course weights. Undergraduate FTEs represent all semesters, as of each ministry reporting date and in accordance with ministry reporting guidelines; graduate FTEs represent Fall and Summer semesters (in accordance with ministry reporting guidelines), as well as Winter MAcc registrations. Full-time equivalent (FTE) student AppliedSciencesHealth Education Humanities MathematicsandScience Social SciencesGoodman School of Business 21-2220-2119-2018-1917-18 21-2220-2119-2018-1917-18 21-2220-2119-2018-1917-18 21-2220-2119-2018-1917-18 21-2220-2119-2018-1917-18 21-2220-2119-2018-1917-18 4,005 4,057 4,285 4,324 3,705 3,735 3,744 3,839 3,704 3,618 1,504 1,627 1,767 1,863 1,487 1,993 2,101 2,302 2,337 2,284 1,650 1,555 1,724 1,748 1,777 5,229 5,067 5,301 5,240 5,008 Year 2017-18 2018-19 2019-20 2020-21 2021-22 Undergraduate 16,275 16,409 17,099 17,407 17,237 Graduate 1,566 1,614 1,783 1,724 1,697 Total 17,841 18,023 18,882 19,131 18,934
19-2018-1917-18 21-2220-2119-2018-1917-18 21-2220-2119-2018-1917-18 21-2220-2119-2018-1917-18 21-2220-2119-2018-1917-18 4,429 3,836 4,121 4,168 4,412 3,501 3,576 3,593 3,415 3,368 1,699 1,728 1,772 1,920 1,895 2,4202,115 2,230 2,474
6,846 Other ongoing personnel 779 218 997 655 201 856 1,295 Total ongoing personnel 171,002 42,098 213,100 162,870 40,414 203,284 187,480
Figure 8 92%
8,641
maintenance, trades and custodial staff; SAC – Senior Administrative Council; Other ongoing – CUPE 4207-2, CUPE 4207-3 and IATSE; CUPE 4207 – Unit 1 – instructors, teaching assistants, lab demonstrators, course co-ordinators and marker/graders; Other temporary – all other part-time teaching and non-teaching positions, Faculty overloads and stipend transfers. Total 147 135 20,50823,845312,96019,5818,5339,09827,8295,4464,7032,69026,29518,1728,10713,0198,5025,2224,51326,610 Total 128,498 Figure 60 Budgeted operating costs ($000s) Other operating costs Inter-fund expense Cost of sales Library acquisitions Scholarships and fellowships FinancialPuUtilitiesexpendituresandtaxesrchasedservices 2021-22 Budget Other operating costs Inter-fund expense Cost of sales Library acquisitions Scholarships and fellowships FinancialPuUtilitiesexpendituresandtaxesrchasedservices Repair and maintenance and capital replacement Repair and maintenance and capital replacement 2022-23 Budget 13% 6% 3%4%6%9% 18% 22% 19% 3%4%6%10%14%7%19%21%16% Figure 7: Budgeted operating costs ($000s) Pullout 1iv Pullout 1v
Figure 23: 2018-19 to 2022-23 Parking Services revenue Figure 24: 2018-19 to 2022-23 Campus Store revenue
co-op programs and enrolment 2,293 2,452 2,591 2,290 2,657
Figure 27: 2016-17 to 2021-22 2,273
Figure 27: 2016-17 to 2021-22 co-op programs and enrolment
Note: Starting in 2018-19, permits are no longer required in Zones 1 and 2 for the months of May, June, July and August. Provided by Ancillary Services. Provided by the Office of Research Services. Grants are presented on a cash basis. *Includes external research grants in the office of the Vice-President, Research, Office of Research Services and Faculty of Graduate Studies, including Research Support Funds and externally-funded scholarships for graduate students.
Figure(1)25: 2018-19 to 2022-23 Residence revenue
22Figure ratesRetention: Average class size by year (Full-course equivalent). Overall average class size. AppliedSciencesHealth EducationGoodman School of Business Year 4Year 3Year 2Year 1 Year 4Year 3Year 2Year 1 Mathematics and ScienceYear4Year 3Year 2Year 1 Social SciencesYear 4Year 3Year 2Year 1Year 4Year 3Year 2Year 1 Humanities Year 4Year 3Year 2Year 1 96 5659 56 221 33 21 84 234 98 21 73 4945 75 60 50 29 32 19 10 31 67 156 3339 48 5045 71 60 62 59 64 64 Overall average 2021-222020-212019-202018-192017-18 Figures are based on 2021-22 Fall/Winter enrolment. frectlydirStudentsom schoolsecondary <75 75-84 84.1-89 89.1-95 >95 Figure 18 2020-21 undergraduate programs average entering grade (%) 296 28 30 7 Source: AppDetails BrockDB (students who applied to Brock for more than one program only included once). Source: AppDetails Brock DB Source: AppDetails Brock DB Figure21 sizeclassaverageUndergraduate: FOSSFMSFOHGSBFAHS Figure 19: 2020-21 undergraduate programs entering average grade by Faculty (%) 85.5 85.2 85.286.2 87.8 Within Faculty, same department (%) Within Faculty, different department (%) Outside of Faculty (%) AppliedSciencesHealth Education*Goodman School of Business Mathematics and Science Social SciencesHumanities 202020192018201720162020201920182017201620202019201820172016202020192018201720162020201920182017201620202019201820172016 83.55.513.42.1 1.2 0.6 1.7 1.1 7.6 8.0 10.6 5.9 13.5 15.8 8.4 75.6 72.9 82.7 74.4 7.7 18.9 15.8 18.2 12.5 74.3 60.8 65.5 60.9 67.9 81.1 61.2 65.8 65.1 74.2 15.4 4.2 3.9 77.862.0 65.9 57.2 72.0 6.96.8 8.2 8.28.0 2.02.3 2.6 2.8 2.1 60.3 59.1 73.5 60.7 76.6 4.0 16.2 97.3 95.996.7 96.797.3 90.189.9 92.890.3 89.3 87.987.3 89.4 89.7 89.0 96.7 97.3 96.797.3 95.9 91.7 88.4 89.8 89.2 85.9 87.285.2 88.6 85.3 85.6 85.083.482.9 82.5 80.8 8.6 11.0 3.9 8.7 19.8 7.8 6.6 16.4 14.5 20.1 19.9 19.6 18.9 7.8 6.5 5.4 2.6 Figures represent the tracking of first-time, full-time bachelor’s degree-seeking students. The figures represent the percentage of firstyear students returning the following November, regardless of year of study. The year shown represents the cohort year (year of entry). Figure 15: Self-identified Indigenous applicants and registrantsApplicants Registrants 2018-19 175 41 2019-20 251 69 2020-21 214 52 2021-22 218 67 Source: Power BI Admissions on March 10, 2022. Figure 17: Students that received OSAP in 2020-21 (%) YES: 47 NO: 53 Figure 16 Full-course equivalents (FCE) offered in 2021-22 (%) 87 13 SummerSpring/Fall/Winter 20212020201920182017 Figure 20 Brock mean entering average of new students directly from secondary school (%) 81.8 81.8 84.3 85.9 81.8 Figure 16: Full-course equivalents (FCE) offered in 2021-22 (%) Figure 17: Students who OSAP in 2021-22 Overall average Figure 18: 2021-22 undergraduate programs average entering grade (%) Figure 19: 2021-22 undergraduate programs entering average grade by Faculty (%) Figure 20: Brock mean entering average of new students school (%) *Represents Teacher Education only. Source: Consortium for Student Retention Data Exchange (CSRDE). Campus Store revenue ($000s) Sales per student headcount ($) 2022-23Budget2021-22Budget2020-212019-202018-19 419 6,615 8,009 7,665 5,597 6,296 387 284 324 329 Parking Services revenue ($000s) Number of permits issued 2022-23Budget2021-22Budget2020-212019-202018-19 6,437 875 5,853 4,783 3,4,8487293,857 3,776 3,622 295 Residence revenue ($000s) Occupancy (%) 2022-23Budget2021-22Budget2020-212019-202018-19 24,158 18,55718,901 9.83 98.32 3,708 19,087 97.61 75.00 94.40 Cash donations (includes stock and property) Endowment donations 2020-212019-202018-192017-18 1,863 1,279 1,394 3,003 4,970 1,079 2,942 2,495 2016-17 2017-18 2018-19 2019-20 2020-21 Other Units (VPR, ORS & FGS)*Social SciencesMathematics and ScienceHumanitiesEducationGoodman School of BusinessApplied Health Sciences 245180 3,3613,422 2,3922,537 1,738 177 18 118 365 450 414 299 219 151 217 562 1,167 268 3,945 4,466 3,812 3,396 4,251 3,242 3,408 3,608 2,686 2,500 8,472 3,081 3,259 5,059 5,293 2020-212019-202018-192017-182016-17 14,385 16,173 14,697 18,348 5,8455947,982 15,337 6,9946097,734 5,452,08798,627 8,6682,9483,081 6,9079,1702,271 Tri-council* Other grants Contracts * CIHR, SSHRC, NSERC, CRCs 2021-222020-212019-202018-192017-182016-17 98 3231 9 9 9 9 31 31 3231 Undergraduate co-op programs Graduate co-op programs Total co-op student enrolment
(1) Certain 2019 figures have been restated.
Figure 26: 2017-18 to 2020-21 donations ($000s)
Figures provided by Financial Services. Amounts will differ from the Financial Statements, as these numbers represent cash collected, not revenue recognized. Provided by Ancillary Services. Provided by Co-op, Career and Experiential Education.
Pullout 1vi Pullout 1/vii
Figure 28: 2016-17 to 2020-21 external research grants – cash received ($000s) (1)
Figure 29: 2016-17 to 2020-21 external research grants by Faculty – cash received ($000s)
Pullout 1viii
ReportBudget2022-23 DEVELOPMENTBUDGET9
This budget was developed under the direction of the May 7, 2015 Board of Trustees two-part motion: “That the President be given a mandate to: 1. Ensure the University funding budget for 2015-16 and all subsequent years are prepared and presented as balanced. If a balanced funding budget cannot be achieved when presented to the Board of Trustees for approval, the deficit can be presented as a mitigation target provided a plan to achieve the mitigation target is included. 2. Manage the affairs of the University in order for it to achieve, or do better than, the funding budget.”
Process and objectives Budget development
As an initial part of the budget process, guidance is prepared by considering all known commitments in the upcoming year, including personnel rate increases, debt payment commitments and investments set out in the Fiscal Framework. For 2022-23, this resulted in $13.4 million of savings to be found as the budget was developed. This overall target was split between a $3.5-million or 1.5 per cent central mitigation target and a $9.9-million or 4.3 per cent mitigation target for each unit of the University to find through their budget preparation. Following a challenging budget year in 2021-22, each unit throughout the University once again analyzed their budgets to identify savings, while carefully considering the impact on student experience. We thank all units who worked diligently and prepared their budgets to bring the overall 2022-23 budget together. Following all the consultations, our people brought the budget to within less than one per cent of being balanced with an in-year mitigation target of $3.0 million for During2022-23.the development of the 2022-23 budget, the COVID-19 pandemic was still very much present and an ongoing concern. While the full impact of this pandemic is not certain, this budget assumes that on-campus University operations, including in-person classes will be largely restored for fall 2022-23. For further discussion, see the ‘Budget environment’ section of this report, starting on page While15.in-year mitigation targets are established in the budget, these efforts do not overshadow the long-term growth and development of the University. Certain areas will require investment for the University to achieve our strategic goals. The following sections provide additional information in areas of new and ongoing investment as established in the 2022-23 operating budget. These sections provide no priority to any of the functions, tasks or programs identified.
Overview The budget is a plan to allocate resources in advance for the maximum benefit of interested parties and to support the Institutional Strategic Plan. It is a method to authorize spending and establish revenue targets of units within Brock University. The 2022-23 budget process was one of consultation and multiple meetings with the Senior Administrative Council; the Strategic Academic Leadership Team; the Senate Planning, Priorities and Budget Advisory Committee; in addition to numerous unit-specific meetings. Every effort was made to ensure the budget is consistent with the academic policy of the University, and that it supports the Institutional Strategic Plan and the Strategic Mandate Agreement 2020-25 (SMA3). As established seven years ago, the timeline for the budget process allows the budget to be completed for approval at the cycle 4 meeting of the Board of Trustees in May to coincide with the start of our fiscal year – running from May 1 to April 30. We thank all units for meeting the requirements of the budget timeline.

• The Goodman School of Business continues to support student progress through rigorous programs of study and supports for Chartered Professional Accounting (CPA) accreditation
• Faculty of Education includes investment to increase support for practicum/experiential education placements
• Total operating and personnel cost budget: $168.4 million, which is 43 per cent of the total University operating and personnel costs budget
• Faculty of Social Sciences continued support for students and research activity
• As set out in the 2022-23 Fiscal Framework, one of the key priorities of the one per cent of revenue strategic/discretionary funds established in this budget will be reconciliation and decolonization
The Institutional Strategic Plan specifically identifies focusing and strengthening engagement and trust with Indigenous communities and partners. The 2022-23 budget supports this initiative in a number of meaningful ways that are highlighted below: Teaching Faculties
(1) Net direct operating budget equals revenue minus expenses for 2022-23 fiscal year. These budgets do not allocate overhead costs (i.e. support services, space, etc.).
(2) FTE represents 2022-23 evaluated salaried staff and faculty full-time equivalent positions and ongoing CUPE 1295 positions (both filled and unfilled).
• Faculty of Mathematics and Science continues to diversify the student population through international recruitment efforts such as going to international universities to promote offerings brocku.ca/academics
Core to the Institutional Strategic Plan is academics and teaching. The 2022-23 operating budget is in support of this as can be seen by the investments in the Teaching Faculties highlighted below: New and ongoing investments
ReportBudget2022-23 10DEVELOPMENTBUDGET
• Continued support of Tecumseh Centre, Aboriginal Student Services and Undergraduate Aboriginal Studies
• Support for equipment for research and teaching activities, and events such as colloquia and guest speakers in the Faculty of Humanities
• FTE(2): 853.6
• Continued support for the Vice-Provost Indigenous Education and Community Engagement
• Targeting scholarship support for Indigenous students
Indigenous support
• Faculty of Applied Health Sciences continues to maintain support for all undergraduate and graduate programs as well as accommodate significant growth in the Nursing programs
• Faculties supporting growth in Indigenous content in curricula


• Where this is budgeted: Faculty of Mathematics and Science
• Operating and personnel cost budget: $1.6 million, this investment is being fully funded by strategic funds in 2022-23.
• Net direct operating budget(1): $5.3 million
• Total net direct operating budget(1) of Research Enterprise and the Office of the Vice-President, Research (VPR): $3.6 million
We know the Library is important to both teaching and research, and for this reason, in order to ensure Brock’s Library remains competitive with our peers, the Fiscal Framework establishes a goal of benchmarking our acquisitions on a per-student basis against our peers in the Canadian Association of Research Libraries (CARL).
• FTE(2): 8.9
• Where this is budgeted: Professional and Continuing Studies and ESL responsibility centre. brocku.ca/continuing-education
ReportBudget2022-23 11DEVELOPMENTBUDGET
Engineering
The strategic priority to “Build research capacity across the University,” as identified in the Institutional Strategic Plan, is supported as part of the 2022-23 budget. The section below details investments to support research activity.
• Highlights of some investments in the 2022-23 budget include: – Grant funding for various items including VPR Research Excellence for Research Initiative Awards, application support, equipment support, Indigenous research, and matching funds. As well as Chancellor's Chair and Match of Minds grants.
• Strategic Investment: $0.2 million
(2) FTE represents 2022-23 evaluated salaried staff and faculty full-time equivalent positions and ongoing CUPE 1295 positions (both filled and unfilled).
Another of the strategic priorities detailed in the Institutional Strategic Plan is to “Offer a transformational and accessible academic and university experience.” Part of this priority is to deliver high-quality programs that meet the interests and needs of students and support them to achieve their potential in life, as well as to expand Brock’s lifelong learning opportunities for our students and members of the community. The 2022-23 operating budget supports this priority through its development of Professional and Continuing Studies and Engineering.
Library acquisitions
Professionalbrocku.ca/mathematics-science/engineeringandContinuingStudies
• Operating and personnel cost budget: $1.5 million, this investment is being fully funded by strategic funds in 2022-23.
(1) Net direct operating budget equals revenue minus expenses for 2022-23 fiscal year. These budgets do not allocate overhead costs (i.e. support services, space, etc.).
Research support
– Funding the Cool Climate Oenology and Viticulture Institute, Niagara Community Observatory and Lifespan Development Research Centre. brocku.ca/research-at-brock
• FTE(2): 6.0
• Where is this budgeted: Library brocku.ca/library
– Funding for post-doctoral fellowship awards and distinguished/early career research awards.


•
(2) FTE represents 2022-23 evaluated salaried staff and faculty full-time equivalent positions and ongoing CUPE 1295 positions (both filled and unfilled).
accessibilitybrocku.ca/health-wellnessReportBudget2022-23 12DEVELOPMENTBUDGET
•
• Graduate: $11.4 million
• Funding sources: $27.8 million (91%) operating budget and $2.7 million (9%) endowment.
As part of Advancement and External Relations, the Department of Development and Alumni Relations supports the goal in the Institutional Strategic Plan that states “cultivating outstanding relationships with our alumni and celebrating their success.” This department is responsible for Brock’s philanthropic activity, alumni engagement and capital fundraising campaigns. Another component of the priority to "Offer a transformational and accessible academic and university experience” is that the University strives to ensure students receive timely and proactive support services as well as continue to improve effective and well-integrated student services in order to meet the needs of an increasingly diverse student body. The 2022-23 budget supports this by continuing to invest in the Student Wellness and Accessibility Centre. Funding for this unit increased significantly in 2022-23, demonstrating Brock’s commitment.
• Undergraduate: $19.1 million
• 16% increase in funding over the 2021-22 budget
•
brocku.ca/graduate-studies/fgs-awardsbrocku.ca/safa/awardsbrocku.ca/international/future/tuition-awards/
•
Student
•
Scholarships, bursaries and fellowships support the Institutional Strategic Plan by helping Brock become a destination of choice for students and making it possible for more to attend the University.
Scholarships, bursaries and fellowships
(1) Net direct operating budget equals revenue minus expenses for 2022-23 fiscal year. These budgets do not allocate overhead costs (i.e. support services, space, etc.).
•
Development Alumni Relations(Advancement and External Relations) Net direct operating budget(1):$1.2 million Five-year average annual funds raised (2017-18 to 2021-22 as of March 21, 2022) $8.96 million FTE(2): 19.0 brocku.ca/alumni Wellness and Accessibility Net direct operating budget(1): $2.5 million Strategic investment: $0.8 million over 2021-22 budget FTE(2): 46.2 in 2022-23 vs 36.9 in 2021-22


Continue to andaccountability,enhanceunderstandabilitytransparencyofthebudget
To everyone involved in the budget development, thank you for making this budget possible. Furthermore, this year’s report continues the linkage of financial and non-financial data through a strong partnership with Financial Services and Institutional Analysis. We suspect this information will generate
The Brock University Labyrinth is an inclusive space that encourages participants from all communities to walk mindfully, uninterrupted by obstacles, while moving on a singular pathway that spirals to the centre and then returns to the beginning. discussion, which is encouraged. It is anticipated that future budget reports will continue to build and add to the financial and non-financial data disclosed herein. Discussing both financial and non-financial data together will help support ongoing efforts to ensure a fiscally responsible budget while paying close attention to quality and academic outcomes. It is hoped that the efforts made throughout the development of this budget have enhanced accountability, understandability and transparency. Feedback is always encouraged and welcomed, and can be directed to budgetreport@brocku.ca
ReportBudget2022-23 13DEVELOPMENTBUDGET

ReportBudget2022-23 14FRAMEWORK

ReportBudget2022-23 15FRAMEWORK
Development of the 2022-23 budget was certainly a complex challenge for the entire community given the compounding affects of the global pandemic and ongoing Government limitations on grant and tuition revenue. These complexities were combined with the flowthrough implications on our budget of the 10 per cent domestic tuition rate reduction that was announced for the 2019-20 fiscal year which resulted in a five per cent reduction to total revenue. As a not-for-profit organization, each year our goal is to achieve a balanced budget. Recognizing costs are subject to inflation, our ability to offset these costs with additional revenue is not possible within the confines of current government policy; thus, each year we endeavour to find additional savings or diversify revenues to achieve a balanced budget. Indeed, the Brock community rallied together yet again for another round of reshaping our fiscal plans while remaining committed to our values outlined in our Institutional Strategic Plan. Demands on the University impose costs that will always exceed its available resources. Brock University must therefore have some means both of setting priorities among its many possible opportunities and of planning to enable the strategies it undertakes. This is a reality in normal circumstances, and certainly during a global pandemic. As we have done in past years, consultation with the University community has informed budget development. Integrating the feedback received on the budget within our fiscal parameters and guided by the Institutional Strategic Plan, this budget plan certainly supports the academic policy of the University in progressive ways. This document outlines the many investments in our students, research, community and future trajectory. This discussion on the budget environment serves to highlight areas that significantly impact the budget development.
Subsequent to these documents being established, Brock and indeed the world fell into the realities of the global pandemic. The Fiscal Framework underwent an update this year with new fiscal guidance weaved into the 2022-23 Fiscal Framework Update to address our adjusted enrolment trajectory and areas of strategic growth for the University.
The core financial challenge influencing the Framework’s financial forecast, prior to considering the impacts of the global pandemic, is the reality under the current government’s regulations that 54 per cent of the University’s revenue is subject to zero per cent inflation. Regulated tuition and grants represent 28 per cent and 26 per cent respectively of the University’s revenue, both fixed at zero per cent inflation. The remaining 46 per cent of revenue is sourced from ancillary revenues and international student tuition. Without enrolment growth, total revenue is projected to increase at 1.6 per cent. With expenses growing at 2.4 per cent annually, and with 63 per cent of expenses associated with personnel costs, most of which is tied to collective agreements, the University is faced with a budget model that must rely on increasing enrolment revenue to fund base operating expenses. This framework is highlighted in Figure 31. Strategic enrolment growth is a key ingredient of our Framework to generate additional revenues to offset the inflationary pressures on expenses. The Framework also aligned funding allocations with strategic priorities to ensure investments were protected in student funding, capital renewal, our people, strategic initiatives such as Engineering and Professional and Continuing Studies, and Research Enterprise funding. ($9.4)
Fiscal Framework The 2020-21 Fiscal Framework update (the Framework) aligned our budget planning strategy with the Institutional Strategic Plan, entitled “Brock University: Niagara Roots – Global Reach.”
Budget Frameworkenvironment 25262128 Regulated tuition Non-regulated tuition Grant revenue Other revenue Total revenue (%) Weighted average annual revenue growth (%) Total revenue growth = 1.6% Total operating costs growth = 2.4% Revenue growth 0% increase 5% increase 0% increase 2% increase 0.0.1.0.0105 6337 Operating cost Personnel costs Total operating costs (%) Weighted average annual operating costs growth (%) Operating costs growth 1.0.68 $6.2 million Annualimpact Structural deficit ($3.2)0.8%millionloss
million 1.7% increase 2.8% increase Figure 31: Budget Framework
ReportBudget2022-23 16FRAMEWORK
Enrolment Enrolment generates the majority of our revenue; thus, it is a key assumption in our budget planning. As noted in the Framework, Brock plans for strategic enrolment growth to fund a portion of our cost increases. The implications of the global pandemic on enrolment have varied significantly across the sector. Following a record year for enrolment in 2019-20, where our degree-seeking enrolments exceeded the strategic plan levels by 438 students, Brock, like many other small to mid-sized Universities in the sector, has faced a disproportionate decline in enrolments. The global pandemic has resulted in an observed change in the competitive landscape, with larger institutions realizing a disproportionate increase in domestic student intake. For this reason, Brock is allocating resources within this budget for areas of strategic enrolment growth. New programs, such as Engineering, as well as new student types that we plan to attract through Professional and Continuing Studies will aid in our fiscal necessity to grow our revenues. Brock and the 2022-23 budget plan also supports growth in priority programs identified by the Province for growth in grant funding such as Nursing and potentially Education. With much uncertainty from the enrolment environment, Brock has developed a reasonable budget plan for 2022-23 that recognizes this uncertainty. Figure 32 outlines our updated all-in enrolment plan. While the next few years will be fiscally challenging as we endeavour to regain enrolment growth, our community has certainly demonstrated consistently, without exception, incredible resilience to overcome our fiscal constraints.
(1) ‘All-in’ enrolment includes letter of permissions, non-degree students, auditors, additional qualifications, and certificates. These are excluded in the degree-seeking-only enrolment, typically presented by the Office of the Registrar. Actual Budgetenrolmentenrolment 22-2321-2220-2119-2018-1917-18 18,832 19,112 19,796 19,51319,723 20,101
Government Policy Brock continues to appreciate its strong and collaborative relationship with the Province of Ontario through the Ministry of Colleges and Universities (MCU). Despite the Province’s fiscal constraint, it continues to fund important activities and projects at Brock. The global pandemic has significantly impacted governments' finances as they have had to focus on public health restrictions and financial supports for individuals and businesses. By way of example, Brock incurred $12.95 million of incremental expenses in fiscal 2020-21 to address COVID-19 impacts. For fiscal 2021-22 as of the end of January 2022, Brock had incurred an additional $8 million in COVID-related expenses that would have otherwise been available for operations. The Province generously provided a COVID-19 relief grant, covering $7.9 million of the 2020-21 expenses; however, no relief has been provided or announced for 2021-22 or beyond. Given the demands on the government to support public health and pandemic recovery, it is unlikely additional base operating grant funding will be made available to the sector; however, opportunities still exist through special-purpose funding for program expansions, such as Nursing and potentially Education. The risks facing our sector remain elevated and examples of financial hardship are real to the extent that we have seen a publicly funded university in Ontario file for bankruptcy. The reality that the Province did not provide a bailout to avoid a bankruptcy filing has changed public perception, especially with lending institutions, where universities were previously considered low risk borrowers with the imputed backing of the Province to guarantee funding in a fiscal crisis.
olmentEnr
Figure 32: Total all-in headcount enrolment projection(1)Figure 32: Total all-in headcount enrolment projection (1)

Core Differentiation 2022-23 Budget2021-22 Budget2020-21 Actual2019-20 Actual 68,70619,08281,7436,045 29,69758,091 48,36239,42687.9% 87,78887,788 87,788 87,788 Figure 33: Base Operating Grants ($000s) Figure 34: Differentiation envelope metrics SKILLS AND OUTCOMES METRICS: • Graduate employment earnings • Experiential learning • Skills and competencies • Graduate employment • Graduation rate • Institutional strength/focus (negotiated metric) ECONOMIC METRICS:COMMUNITYANDIMPACT • Research funding and capacity (Tri-Council funding) • Research funding from private-sector sources (innovation) • Impact in the local community • Economic impact: Co-op, Nursing and Teacher Education practicum student placements in Niagara (institution-specific)
The Province has tied grant funding to labour market outcomes beginning with the Strategic Mandate Agreement 2020-25 (SMA3), which took effect in 2020-21. As initially established, this updated funding model includes tying a larger portion of funding to metric performance through the Differentiation Envelope. This proportion started with a system average of 25 per cent in 2020-21 and is ramped up to a system average of 60 per cent of MCU operating grant funding by 2024-25. Figure 33 details Brock’s proportion of the Differentiation Envelope. Brock, along with our peers across the province, has 10 metrics used to determine funding allocations. As detailed in Figure 34, six metrics are aligned with priorities in skills and job outcomes, and four metrics related to economic and community impacts. Brock’s Institutional Strategic Plan aligns our strategic priorities well with the government. It should be noted that during 2020-21, the MCU announced that the metrics tied to the Differentiation Envelope would not impact the grant funding for 2020-21 due to the significant impact of the global pandemic on the sector, and this is still the case for 2021-22 and 2022-23. While there is no new government funding planned for the sector or for Brock specifically, our goal within the context of our budget is to achieve our target metrics and maintain our grant funding at current amounts while capitalizing on strategic growth areas where the government is providing special-purpose grant opportunities.
ReportBudget2022-23 17FRAMEWORK

ReportBudget2022-23 18REVIEW

ReportBudget2022-23 19REVIEW
4. Inclusion of uncommitted strategic/discretionary funds of one per cent of the revenue budget, at $3.9 million.
5. The assumption that the University would return to mainly in-person operations for all of 2022-23. Due to the mitigation target in 2022-23, the mitigation measures of fiscal 2021-22 will remain in effect. These measures will assist us in meeting our target of a year-end balanced result or better. Steps are also required to find a way to permanently eliminate the need for these mitigation measures and ensure we remain financially sustainable, where revenues naturally grow in harmony with the rate of growth in our expenditures. Any surplus at the end of the year derived from mitigation efforts will be reinvested in strategic priorities of the Institutional Strategic Plan.
At the time of writing this budget report, we are projecting, through our second trimester reporting (T2) for fiscal 2021-22, a remaining mitigation target of $2.1 million vs the mitigation target to be found in year as part of the budget of $3.5 million. The T2 reporting can be found at brocku.ca/about/university-financials/. This outcome indicates that we have already mitigated $1.4 million of our budgeted mitigation target. This mitigation target is driven by a revenue shortfall versus budget of $8.2 million. This is offset by mitigation strategies such as personnel savings forecasted to be $11.4 million under budget. At year end, this projection will be updated to actual results in the 2021-22 Annual Report. After another challenging year of prioritizing spending and reducing costs where possible, during the ongoing COVID-19 pandemic, we are showing a mitigation target for 2022-23 of $3.0 million, which represents less than one per cent of the budgeted revenue. The 2022-23 budget was established with certain key 1.assumptions:Theenrolment forecast shows increases of 364 (2.1 per cent) undergraduate and 224 graduate (12.0 per cent) students as compared to 2021-22 actual all-in enrolment.
Financial update Review
2. No further change in the Province’s tuition policy, with domestic tuition rates held flat at 2021-22 levels.
3. Ministry of Colleges and Universities (MCU) operating grants in 2022-23 are forecasted to be consistent with the amounts expected to be received in 2021-22, with the exception of additional funding for Nursing. The updated funding model is described in the Grant revenue section of this report starting on page 28.

Note: The from Brock University, Canadian generally (2011-12 to 2020-21). 35: Historical audited financial results ($
ReportBudget2022-23 20REVIEW
which were prepared in accordance with the
figures were obtained
accepted accounting principles for not-forprofit organizations (2002-03 to 2010-11) and in accordance with Canadian accounting standards for not-for-profit organizations
Revenue Expense Surplus/(deficit) 0 15.9 11.912.0 7.0 (1.7) 13.2 10.2 7.3 7.4 (4.6) (16.1) (7.6) (5.8) (1.9) (2.2) 1.0 6.4 8.8 16.9 2002-03 2003-04 2004-05 2005-06 2006-07 2007-08 2008-09 2009-10 2010-11 2011-12 2012-13 2013-14 2014-15 2015-16 2016-17 2017-18 2018-19 2019-20 2020-21 133 174 198 204 224 221 229 245 260 271 286 299 313 313 324 337 354 358 341 134 161 188 197 217 226 245 253 266 273 288 298 296 307 315 325 338 346 334
millions)
Historical timeline In planning for the future, it can be useful to look back and ask “how did we get here?” The chart and historical timeline provided here attempts to rewind the clock and identify some key decisions with significant financial impact that have occurred since 2002-03. These key decisions have been identified on the timeline along with an undergraduate and graduate student headcount, and a faculty, professional librarian and staff headcount. The chart begins in 2002-03, as it closely coincides with when the move to a comprehensive university was proposed and endorsed. An interesting observation is that the student to faculty and librarians, and the staff to faculty and librarians ratios have not changed substantially since 2002-03.
the audited financial statements of
Figure
Note: The faculty and professional librarians headcount figures accumulated represent roster data (i.e. all employees holding a faculty position in the academic year). The staff headcount figures are from Human Resources and represent headcount as of October each year.

(4) Main – other: All buildings on the main campus that are not specifically identified.
Figure 38: Deferred maintenance 2021
Source: VFA Asset List Report as of May 2021 (1) Facilities Condition Index (FCI): Represents deferred maintenance backlog divided by replacement value.
(5) Satellite buildings: Includes Brock Research and Innovation Centre and Rodman Hall.
(2) Central Utilities Building: Mainly relates to the Cogeneration Facility and also includes Facilities Management offices.
(3) Infrastructure: Includes many of the non-building assets, such as parking lots, storm sewers and roadways.
Pullout 2/i considerationsSpace Figure 37: Space usage Category Estimate 2022 (1) Actual 2019 (1) Metres 2 % Metres 2 % Classroom facilities 13,772 6% 13,544 6% Laboratories – undergraduate 10,909 5% 10,743 5% Research laboratory space 12,806 5% 12,280 6% Academic departmental office and related 18,740 8% 19,334 9% Library facilities and library study space 7,284 3% 7,311 3% Athletic/recreation space 10,151 4% 9,112 4% Food service 6,094 3% 4,931 2% Bookstore and other merchandising facilities 1,105 0% 1,105 0% Plant maintenance 2,002 1% 2,583 1% Central administrative office and related 9,375 4% 9,184 4% Non-library study space 3,752 2% 3,901 2% Central services 2,517 1% 2,411 1% Health service facilities 595 0% 555 0% Common use and student activity space 1,446 1% 1,446 1% Assembly and exhibition facilities 1,935 1% 2,583 1% Residential space 55,384 23% 49,424 22% Animal space 169 0% 169 0% Other University facilities 2,763 1% 3,336 1% Health science clinical facilities 792 0% 792 0% Net non-assignable square metres (NNASM) (2) 75,140 32% 72,741 32% Total 236,731 100% 227,485 100% (1) The 2019 data was prepared for submission to the Council of Ontario Universities Triennial report that takes place every three years. The data is as of Nov. 1, 2019. The estimate for 2022 was updated after the original submission as of Apr. 12, 2022 and is included as an updated comparison to the 2019 data. (2) NNASM includes items such as central utilities plants, corridors, stairwells, elevators, service tunnels and parking structures. Deferred maintenance ($ millions) Total $330 Facilities condition index (1) – Total 0.26 Replacement value ($ millions) Total $1,253 Roy and Lois Cairns Health and Bioscience Research SchoolChownMackComplexenzieComplexCentralUtilitiesBuilding(2)EastbuildingsElectricaldistributionInfrastructure(3)Main–other(4)MarilynI.WalkerofFineandPerformingArtsPlazaBuildingResidencebuildingsSatellitebuildings(5)SchmonTowerServicetunnelsThistleWalkerComplexWelchHall 1 154 54 28 63 154 9 47 8 2328 69 58 1 14 34 1 184 100 19 5 96 30 14 1 82 18 64 17 39 11 157 0.840.000.180.160.180.900.100.020.020.550.240.310.100.210.270.27
The following charts present two different ways of examining space at the University. Figure 37 details the space usage by category as of 2019, which was prepared for the Council of Ontario Universities’ Survey of Physical Facilities, as well as an updated estimate for 2022. Only 68 per cent of the University’s space is assignable to specific functions, while 32 per cent is non-assignable, meaning it relates to items such as utility plants, corridors and hallways. Figure 38 details the deferred maintenance backlog by asset type and compares this to the replacement value of those assets. This information was obtained from the condition assessment performed by VFA Inc. (through Council of Ontario Universities) in May 2021, which determined Brock has $330 million in deferred maintenance requirements that have accumulated over a number of years. In addition, the chart details the Facility Condition Index (FCI) (deferred maintenance divided by the current replacement value), which determines the relative condition of the asset. The lower the FCI, the better the condition of the asset. For example, MIWSFPA has a low FCI, while buildings with higher FCIs are generally older, such as the Schmon Tower and the Walker Complex. Brock’s overall FCI is 0.26, while our goal is to maintain a FCI of 0.18.
AcademicconstructionSouthcompleted PlazaconstructionBuildingcompleted Welch completedexpansionHall InternationalconstructionCentrecompleted 2002-03 2003-04 2004-05 2005-06 2006-07 2007-08 2009-10 2010-112008-09 HEADCOUNTSTAFFANDFACULTY Faculty and librarians (1) 449 507 533 560 609 595 614 596 603 Ongoing staff (1) 606 637 708 766 816 831 915 923 895 Staff to faculty and librarians ratio 1.3 1.3 1.3 1.4 1.3 1.4 1.5 1.5 1.5 Graduate headcount(2) 671 858 1,065 1,053 1,169 1,259 1,419 1,544 1,536 1,534 Undergraduate headcount(2) 12,458 14,669 15,532 16,356 16,284 15,747 15,431 15,949 16,341 16,656 Student to faculty and librarians ratio 29 31 31 31 29 29 27 29 30 (1) Faculty and professional librarians headcount figures represent all employees holding a faculty position in the academic year. Staff headcount figures represent headcounts as of October of each year. (2) Figures represent the number of students in each Faculty of major on Nov. 1 of each academic year (as per PFIS-USER submissions). In addition, figures for 2014-15 to 2021-22 also include the number of new-entry students in programs having a Winter Term start date (MAcc, Tech BEd, TCTD, MPCE, MTSI; as per PFIS-USER Feb. 1). Faculty and Librarians Permanent Staff Graduate UndergraduateHeadcountHeadcount headcountfstafandacultyF 1,588equivalentsfull-courseofferedDouble CUnionendecohortdgroupCUPE4207–Unit2(ESLo-ordinators)wascertifiedUnion group CUPE 2220 (Rodman Hall Art Centre) was assumed 40prgraduateograms25prgraduateograms Union group OSSTF (support staff ) was certified changedloadfull-courseRequiredforfacultyfrom3to 2.5 full-courseRequiredload for faculty changed from 2.5 to 2 Doublebegancohort 1,489equivalentsfull-courseoffered 2011-12 Pullout 2/ii


599 608 616 611 603 607 614 623 625 622 626 922 961 964 919 912 921 938 957 987 991 967 1.5 1.6 1.6 1.5 1.5 1.5 1.5 1.5 1.6 1.6 1.5 1,534 1,630 1,689 1,718 1,703 1,756 1,777 1,826 2,007 1,951 1,860 16,656 16,882 16,999 17,154 16,813 17,042 17,055 17,286 17,789 17,772 17,653 30 30 30 31 31 31 31 31 32 32 31 Roy and Lois Cairns Health and ResearchBioscienceComplexconstructioncompleted Goodman School of Business expansion and Rankin Family Pavilion substantially completed Canada Games constructionParkstarted Residence construction8completed Marilyn I. Walker School of Fine and Performing Artscompletedconstruction timelineHistorical headcountStudent 44prgraduateograms 48prgraduateograms 52prgraduateograms Union group CUPE 4207–Unit 3 (ESL Instructors) and IATSE (Theatre Technicians, etc.) was certified 1,741equivalentsfull-courseoffered 1,718equivalentsfull-courseoffered 1,746equivalentsfull-courseoffered 2011-12 2012-13 2013-14 2014-15 2015-16 2016-17 2017-18 2018-19 2019-20 2020-21 2021-22 Figure 36 HEADCOUNTSTUDENT Pullout 2/iii


Pullout 2/iv

ReportBudget2022-23 23DETAILSBUDGET
The funding budget is used to communicate the revenue targets and expense approvals that support the teaching, research, scholarly, creative and service activities of the University. It fundamentally tracks where cash has been allocated. Figure 39 details the funding budget for 2022-23 in comparison to the 2021-22 budget and 2020-21 actuals.
Funding budget Budget details
Figure 40 ($000s) 2022-23Budget 2021-22Budget 2020-21Actual
Total domestic tuition is budgeted to be $108.7 million, which is $1.9 million more than the 2021-22 budget. Total international tuition is budgeted to be $82.0 million, which is $5.6 million more than the 2021-22 budget. Domestic and International budgeted enrolment are shown in Figure 42. Intensive and short-term English language program revenue is budgeted to be $0.8 million, which is $0.4 million less than the 2021-22 budget. The decline is due to the continued restrictions on international students entering Canada as a result of the pandemic. Continuing Teacher Education and Adult Education constitute the remaining types of tuition revenue, with both programs budgeting revenue to be $0.1 million lower than the 2021-22 budget. Note: although Figure 41 details global tuition by Faculty of major, the revenue and expense allocation model explained in the ‘Revenue and expense allocation model’ section of this report has been adopted and records tuition based on where students take their courses (i.e. teaching Faculty).
Some reclassifications were made to the 2021-22 budget for comparison purposes when the overall funding budget was not impacted. See Appendix B for a reconciliation of these reclassifications. The 2022-23 budget includes a mitigation target of $3.0 million to be found through in-year savings. This mitigation target is comparable to mitigation targets from previous years budgets, including the $3.5-million mitigation target as part of the 2021-22 budget. Tuition revenue Tuition revenue, defined as a fee charged for educational instruction, is budgeted to be $193.0 million, $7.0 million higher than the 2021-22 budget. Figure 41 on the following page details 2022-23 tuition by Faculty of major, split by graduate/undergraduate and domestic/international as compared to the 2021-22 budget and 2020-21 actuals. Of the total tuition revenue, $190.7 million is budgeted in the University Global responsibility centre, representing all tuition revenue except for $1.5 million related to continuing teacher education and adult education budgeted in the Faculty of Education, and $0.8 million of intensive and short-term English language programs tuition revenue budgeted in Professional and Continuing Studies and ESL.
Tuition 193,012 186,039 178,305 Fee revenue 11,256 10,524 7,707 Total student fees 204,268 196,563 186,012 Revenue assumptions Student fees Student fees include both tuition and fee revenue and represent 52 per cent of total revenue (55 per cent in 2021-22). Student fees are budgeted to be $204.3 million for 2022-23, detailed in Figure 40, which represents a $7.7 million increase as compared to the 2021-22 budget. Figure 39 ($000s) 2022-23Budget 2021-22Budget 2020-21Actual Revenue Student fees 204,268 196,563 186,012 Grant revenue 99,589 97,708 106,724 Internal chargebacks 11,948 8,641 3,098 Inter-fund revenue 11,981 7,462 8,843 Other revenue 62,176 48,406 24,319 Total revenues 389,962 358,780 328,996 Operating costs Personnel costs (245,830) (233,761) (214,657) Inter-fund expense (32,690) (26,610) (18,143) Other operating costs (114,445) (101,888) (83,302) Total operating costs (392,965) (362,259) (316,102) Mitigation target 3,003 3,479 Discretionary appropriations –one-time items (9,936) Discretionary appropriations –general operations (2,949) Funding surplus - - 9
ReportBudget2022-23 24DETAILSBUDGET
Total Tuition Revenue 193,012 186,039 178,305 (1) Figures based on Faculty of major. (2) Includes letter of permission, non-degree students and auditors. Figure 43 reconciles the overall increase in tuition budgeted for 2022-23 compared to the 2021-22 budget with three main factors – the difference of the 2021-22 budgeted tuition to the 2021-22 actual tuition (estimated at trimester 2), the enrolment change, and the rate change as compared to 2021-22 actuals – enrolment and rate. The centrallymanaged enrolment projection model is described in the ‘Enrolment forecasting’ section of this report starting on page 25. As detailed in Figures 47 and 48, these projections resulted in all-in undergraduate enrolment forecasted to increase 2.1 per cent over 2021-22 actual enrolment and graduate enrolment increasing at 12.0 per cent.
Domestic tuition fees remained consistent with 2021-22 as regulated by the Ministry of Colleges and Universities (MCU); therefore, all the tuition revenue growth resulting from tuition rate increases were directly related to international tuition rates. For undergraduate international tuition, a new cohort model will be introduced in 2022-23, which will see an eight per cent increase each year for year one students only, guided by the principle to maintain tuition rates at the median of Ontario universities. Tuition rates will then be frozen for four additional years to provide students with a total of five years of fixed tuition rates to assist with budget planning and fiscal stability for their four-year degree program, with one additional year, to graduate. After the fifth year, the tuition rate would revert back to the incoming Year 1 tuition rate. The cohort model for tuition rate increases for international students represents a response to the insights of Brock University units directly working with international students and recognizing that these students would experience significant benefits from having a direct line of sight for tuition rates for all years of study for their program. For 2022-23, tuition rate increase for undergraduate international students in Year 1 to 3 will be eight per cent. The increase for Year 4 and 5 students will be five per cent, recognizing that students in their last year of study would pay more compared to the previous five per cent annual increase strategy, whereas all other students would benefit from this Internationalchange.Student Program (ISP) tuition rates will be increased by five per cent over 2021-22, recognizing most of these programs are a one year duration or less. A tuition rate freeze for international research-based master's and PhD programs was started in 2018-19 to support Brock’s
Tuition revenue(1) Undergraduate – domestic Faculty of Applied Health Sciences 25,347 23,660 23,863 Goodman School of Business 16,979 17,710 18,292 Faculty of Education 8,270 7,833 7,598 Faculty of Humanities 10,501 10,352 10,247
Total graduate – international 20,254 19,017 16,276 Total international 82,032 76,395 67,445
Figure 41 ($000s) 2022-23Budget 2021-22Budget 2020-21Actual
Total undergraduate – domestic 99,293 98,289 99,850 Graduate – domestic Faculty of Applied Health Sciences 1,971 2,006 2,248 Goodman School of Business 2,280 1,848 1,459 Faculty of Education 1,092 1,215 1,025 Faculty of Humanities 459 354 363 Faculty of Mathematics and Science 824 555 679 Faculty of Social Sciences 2,749 2,472 2,703
Faculty of Mathematics and Science 12,087 12,274 12,473 Faculty of Social Sciences 25,795 26,234 27,159 Other (2) 314 226 218
Total undergraduate – international 61,778 57,378 51,169
Continuing Teacher Education – Additional Qualifications (AQ) 831 943 919 Adult Education 662 722 581 Intensive and Short-term English Language Programs (IELP & SELP) 819 1,240 1,033
Undergraduate – international Faculty of Applied Health Sciences 5,960 4,583 4,487 Goodman School of Business 18,821 18,871 16,548 Faculty of Education 722 641 304 Faculty of Humanities 2,530 2,140 2,089 Faculty of Mathematics and Science 14,268 12,879 11,239
Total graduate – domestic 9,375 8,450 8,477 Total domestic 108,668 106,739 108,327
Graduate – international Faculty of Applied Health Sciences 301 270 286 Goodman School of Business 14,697 13,371 12,914 Faculty of Education 1,093 2,521 787 Faculty of Humanities 416 245 146 Faculty of Mathematics and Science 2,393 1,766 1,408 Faculty of Social Sciences 1,354 844 735
Faculty of Social Sciences 19,427 18,230 16,456 Other (2) 50 34 46
Total undergraduate and graduate tuition 190,700 183,134 175,772
ReportBudget2022-23 25DETAILSBUDGET
3,263 2,501 2,649 2,884 Total 3,699 3,943 4,306 3,403 3,642 3,896 Figure 44: Year 1 intake (undergraduate)headcount Tuition year-over-year reconciliation 2021-22 BUDGET $186.0 million • ($8.3) million – 2021-22 Budget to 2021-22 Actual (note: actual tuition was not yet finalized at the time of writing) • $10.8 million – Enrolment impact ($2.1 million domestic, $8.1 million international, $0.4 million Intensive and Short-term English as a Second Language and $0.1 million in both Continuing Teacher Education and Adult Education) • $4.5 million – Rate impact based approved international rates 2022-23 BUDGET $193.0 million Figure 43 Figure 42: All-in student headcount by type (1) Type 2022-23Budget 2021-22Actual 2022-23 Budget vs. 2021-22 Actual 2021-22Budget 2022-23 Budget vs. 2021-22 Budget 2020-21Actual# % # % Undergraduate – domestic 15,985 15,760 225 1.4% 15,468 517 3.3% 15,905 Graduate – domestic 1,330 1,197 133 11.1% 1,302 28 2.2% 1,292 Total – domestic 17,315 16,957 358 2.1% 16,770 545 3.2% 17,197 Undergraduate – international 2,032 1,893 139 7.3% 1,957 75 3.8% 1,867 Graduate – international 754 663 91 13.7% 701 53 7.6% 659 Total – international 2,786 2,556 230 9.0% 2,658 128 4.8% 2,526 Total headcount 20,101 19,513 588 3.0% 19,428 673 3.5% 19,723 (1) 'All-in' includes letter of permissions, non-degree students, auditors, additional qualifications, and certificates. commitment to enhancing research. Research-based master's and PhD students were receiving a greater proportion of Faculty research grant dollars to offset their rising tuition costs, leaving less funding available to support other research expenditures. This strategy is continued into 2022-23. For an explanation of the tuition fee policies for both government-funded programs and non-governmentfunded programs as well as the approved tuition fee increases for 2022-23, see Appendix D.
Enrolment projections – undergraduate There are two key assumptions in projecting undergraduate enrolment: intake targets for Year 1 and the retention behaviour of current students. For intake purposes, students are classified on the basis of their admission status. Based on observation, each group behaves differently in terms of their retention status: (1) domestic students directly from secondary school, (2) domestic students not directly from secondary school, and (3) international students. Figure 44 displays the undergraduate Year 1 (full-time) intake headcount projections for 2022-23 as compared to prior years.
Enrolment forecasting The process for budgeting tuition revenue consists of two key considerations – student enrolment and tuition rates. Forecasting student enrolment differs for undergraduate and graduate students, as such, the following section describes each method.
Source: Actual values accessed from PowerBI Admissions on April 8, 2022. Values may differ from the 2021-22 Budget Report as PowerBI is a fluid data source. Intake targets are sourced from Brock's Strategic Enrolment Planning tool. 2017-18Actual 2018-19Actual 2019-20Actual 2020-21Actual 2021-22Actual 2022-23Forecast 243 383 465 379 329 401 518 586 578 523 664 611 2,938 2,974
Figure 42: Year 1 intake (undergraduateheadcount) International students Domestic students not directly from secondary school Domestic students directly from secondary school Year 1 intake is forecast to increase 7.0% over 2021-22.
Mathematics
Intake targets are set through collaboration and consultation with units across the University, including the Faculties. For the purposes of the 2022-23 budget, Year 1 intake is projected to see an increase of seven per cent over 2021-22 actuals, as shown in Figure 44. This growth continues to represent a rebound after the low in 2020-21; however, it is still 10 per cent lower than 2019-20 actuals. Year 1 intake is dependent on applications received. Overall undergraduate application totals rebounded from 2020-21, with late March 2022 seeing an increase of 9.3 per cent from the same time the previous year. Brock's undergraduate applications directly from secondary school are up 14.7 per cent over prior year, as shown in Figure 45. This returns the University to levels experienced prior to the pandemic. Given shifts in applicant behaviour from pre-pandemic norms, this may not necessarily equate to higher yield rates. To ensure that we remain competitive, recruitment efforts continue to focus on an early offer and conversion strategy. By March, undergraduate offers of admission have been extended to 85.9 per cent of the applicant pool, compared to 73.6 per cent in 2021, and ranging from 62 to 65 per cent during the 2016-2020 cycles. As public health guidelines shift and become more conducive to hosting in-person events, we have hybridized our conversion strategy. This ensures we can offer in-person activities to those able to visit us, while maintaining a suite of resources for those further afield, including international students. Further enhancing our international recruitment strategy, virtual tours are now offered in four languages (English, Spanish, Hindi and Mandarin). We also maintain a digital presence akin to our typical Spring Open House offerings online. The March Break Campus Tour program has been expanded to welcome visitors through April and May. As we push towards confirmation and registration deadlines, applicant receptions will be hosted in hybrid formats, offering in-person sessions in key markets domestically, as well as virtual offerings for international applicants. This year, Smart Start, the academic orientation program led by recruitment, will also be available in a hybrid delivery mode. We have re-introduced an applicant calling program, augmented by new SMS (i.e. texting) outreach, which aligns with a broad marketing and communications plan that includes email, digital and social media advertising, and physical mailings.
Social
Figure 45: Domestic applications directly from secondary school Faculty 2022-23 2021-22 % Chg Health Sciences 4,388 3,938 11.4% School of Business 2,586 2,489 3.9% 1,755 1,450 21.0% and Science 2,607 2,183 19.4% Sciences 4,780 3,994 19.7% Total applications 16,116 14,054 14.7% Offer rate (offers/applications) 77% Yield rate (registrations/offers) 25% Resulting intake 2,649
Source: Nov. 1 PFIS-USER submissions for both 2020 and 2021, and the 2021 academic year Consortium for Student Retention Data Exchange (CSRDE) submission
The Year 1 intake figures are then combined with retention and progression rates, as well as movement to and from full-time and part-time status (retention behaviour), to determine a total returning undergraduate headcount. This retention behaviour is determined by reviewing historical enrolment patterns. As an example, Figure 46 shows the return or retention rates of students who entered the University directly from secondary school in 2020 into the 2021-22 year. Note: retention rates by Faculty are detailed in Figure 22 on the ‘The Big Picture' pullout.
Goodman
Applied
Humanities
Source: Data was extracted from the PowerBI application details as of March 12, 2022. Figures may differ from prior year as Power BI is a fluid data source.
ReportBudget2022-23 26DETAILSBUDGET
Figure 46 2020-21 degree seeking, first-time, first-year entry cohort # students % students Entered in 2020 as Year 1 2,785 Activity in 2021-22 Returned full time as Year 1 582 21% Returned full time as Year 2 1,783 64% Returned as part time as Year 1 57 2% Returned as part time as Year 2 32 1% Not registered 331 12% Total 2,785 100%

ReportBudget2022-23 27DETAILSBUDGET
Ancillary fees are established by student referendum, according to the ancillary fee protocol, and agreed to with the Brock University Students’ Union (BUSU) and Graduate Students’ Association (GSA). Some existing fees can increase automatically (i.e. either each year or after the Consumer Price Index has accumulated to five per cent since the last fee increase). Ancillary fees are all assessed and collected by the University, and are either administered by the University, BUSU or the GSA. Note: only the University-administered ancillary fees are included as part of the funding budget. The setting of ancillary and administrative fees was delegated to the President and Vice-President, Administration at the Dec. 1, 2016 Board of Trustees University-administeredmeeting.
ancillary fees are budgeted to be $7.0 million ($6.6 million in 2021-22). University administered ancillary fees include the following:
• Athletic fee of $1.56 million ($1.48 million in 2021-22); with $1.47 million undergraduate and $0.09 million graduate, which is reported in Brock Sports and Recreation.
Figure 47: Undergraduate all-in headcount Faculty 2022-23Budget 2021-22Actuals Change Change% Faculty of Applied Health Sciences 4,359 4,121 238 5.8% Goodman School of Business 2,716 2,747 (31) (1.1%) Faculty of Education 1,714 1,679 35 2.1% Faculty of Humanities 1,864 1,848 16 0.9% Faculty of Mathematics and Science 2,312 2,242 70 3.1% Faculty of Social Sciences 4,952 4,891 61 1.2% No Faculty 100 125 (25) (20.0%) Total 18,017 17,653 364 2.1%
Source: Figures represent the number of students in each Faculty of major on Nov. 1 of each academic year (as per PFIS-USER submissions). In addition, figures also include new entry enrolments as of Feb. 1 for Technological Education programs.
• Undergraduate student life fee of $1.97 million ($1.88 million in 2021-22), of which $1.44 million is reported as part of Brock Sports and Recreation and $0.53 million in Student Wellness and Accessibility.
Figure 48: Graduate all-in headcount Faculty 2022-23Budget 2021-22Actuals Change Change% Faculty of Applied Health Sciences 263 308 (45) (14.6%) Goodman School of Business 739 621 118 19.0% Faculty of Education 245 216 29 13.4% Faculty of Humanities 93 66 27 40.9% Faculty of Mathematics and Science 209 178 31 17.4% Faculty of Social Sciences 535 471 64 13.6% Total 2,084 1,860 224 12.0% Once the total forecasted headcount is determined, it is then translated into full-time equivalents (FTEs) based on historical full-time/part-time student enrolment patterns, which are then combined with the tuition rates to calculate tuition. Enrolment projections – graduate Graduate enrolment projections are produced with intake targets from the Faculty of Graduate Studies, and then combined with historic progression, retention and graduation rates of continuing graduate students. For the purpose of the 2022-23 budget, overall graduate enrolment is forecast to experience a significant increase of 224 students or 12.0 per cent over actual 2021-22 headcount enrolment. As shown in Figure 48, the largest growth is forecast in the Goodman School of Business, with 118 additional graduate students forecast. Strong graduate enrolment growth is also forecast in all other Faculties, with the exception of the Faculty of Applied Health Sciences. Although, as of March 29, 2022, the number of graduate applications are 0.6 per cent lower than this date last year, the number of admitted offers are up four per cent and confirmations more than 38.1 per cent higher. After these considerations, for the purposes of the 2022-23 budget, total undergraduate all-in headcount is forecasted to increase by 364 students or 2.1 per cent as compared to 2021-22 actual headcount, as shown in Figure 47.
Source: Figures represent the number of students in each Faculty of major on Nov. 1 of each academic year (as per PFIS-USER submissions). In addition, figures also include new entry enrolments as of Feb. 1 for Master of Education (ISP), Master of Accountancy, and Master of Material Physics.
Fee revenue Fee revenue is budgeted to be $11.3 million, which is $0.7 million higher than the 2021-22 budget. Student fee revenue includes both ancillary fees and other student fees.
• Undergraduate Pool fee of $0.23 million ($0.22 million in 2021-22), which is reported in Brock Sports and Recreation.
• Health services fee of $0.53 million ($0.52 million in 2021-22); with $0.48 million undergraduate and $0.05 million graduate, reported in Student Wellness and Accessibility.
Figure 49 ($000s) 2022-23Budget 2021-22Budget 2020-21Actual MCU Operating grants Core Operating Grant 48,362 58,091 68,706 Differentiation Envelope (Performance/ Outcomes-based Funding Grant) 39,426 29,697 19,082 Special Purpose Operating Grant Envelope 3,161 3,071 11,141 International Student Recovery (1,928) (1,749) (1,748) Total MCU operating grants 89,021 89,110 97,181 Other MCU and specific purpose grants 10,568 8,598 9,543 Total grant revenue 99,589 97,708 106,724
• Undergraduate sexual violence and support fee of $0.25 million ($0.23 million in 2021-22), which is reported in Human Rights and Equity Services.
• Zone expansion fee of $1.55 million ($1.47 million in 2021-22); with $1.45 million undergraduate and $0.10 million graduate, which is reported in the Financing unit. This fee supports the expansion of the Zone Fitness Centre.
• Graduate Zone Fitness Centre fee of $0.15 million ($0.12 million in 2021-22), which is reported in Brock Sports and Recreation.
• Graduate students’ mental health and wellness fee of $0.09 million ($0.06 million in 2021-22), which is reported in Student Wellness and Accessibility. Other student fees of $4.30 million ($3.97 million in 2021-22) are included as part of fee revenue in the 2022-23 budget. Other student fees include the International Student Recovery Fee, which offsets the reduction in the Core Operating Grant, which MCU calculates as $750 per international student. This fee is charged to international students and results in $1.91 million ($1.75 million in 2021-22) of revenue in 2022-23. It is reported as part of the University Global responsibility centre. Also included in other student fees are program-specific fees charged by the program in which a student is enrolled. Included in this figure are $1.90 million ($1.85 million in 2021-22) of co-op fees (reported in Co-op, Career and Experiential Education), $0.22 million ($0.11 million in 2021-22) of ESL ancillary fees for international students (reported in Professional and Continuing Studies and ESL) and $0.26 million ($0.25 million in 2021-22) related to the Business English and Skill Transition fee for International Student Program participants in the Goodman School of Business. Grant revenue Grant revenue, as reported in the 2022-23 Budget Report, includes Ministry of Colleges and Universities (MCU) operating grants and other operating and specific purpose grants. Grant revenue represents 26 per cent of total revenue (27 per cent in 2021-22 budget), and is budgeted to be $99.6 million for 2022-23, which is detailed in Figure 49. Grant revenue increased $1.9 million compared to the 2021-22 budget and decreased $7.1 million compared to actual 2020-21. This decrease from 2020-21 actuals is because of the one-time MCU COVID relief grant of $7.9 million that was received in 2020-21.
• Undergraduate Student Justice Centre fee of $0.25 million ($0.23 million in 2021-22), which is reported in Human Rights and Equity Services.
ReportBudget2022-23 28DETAILSBUDGET
• Ombuds levy of $0.13 million ($0.12 million 2021-22), with $0.11 undergraduate and $0.02 graduate, which is reported in Human Rights and Equity Services.

Ministry of Colleges and Universities (MCU)
ReportBudget2022-23 29DETAILSBUDGET
Special Purpose Operating Grant Envelope Covid Relief Grant 7,915 Grant in Lieu of Municipal Taxation 1,087 1,087 1,120 Access Fund for Students with Disabilities 702 686 646 Indigenous Student Success Fund 336 336 336 Credit Transfer Grant 256 220 220 Access and Inclusion Program 234 166 132 Mental Health Support Grant 139 138 138 Mental Health Workers Grant 100 100 100 Other MCU special purpose grants 307 338 534 Total Special Purpose Operating Grant Envelope 3,161 3,071 11,141
Operating grants MCU operating grants include the Core Operating Grant (COG), the Differentiation Envelope and the Special Purpose Operating Grant Envelope, offset by the International Student Recovery, all of which are MCU funded.
In 2019, the MCU announced that performance/outcomesbased funding would be implemented starting in 2020-21 as part of the Strategic Mandate Agreements 2020-25 (SMA3) process. The SMA3 links 10 metrics (nine systemwide and one institution-specific) to performance/ outcomes-based funding through two priority areas – skills and job outcomes, and economic and community impact. These metrics are shown in Figure 34 on page 17. This updated funding model includes tying a larger portion of funding to metric performance, through the Differentiation Envelope, which started with a system average of 25 per cent of MCU operating grants in 2020-21. This proportion is ramped up to a system average of 60 per cent of total MCU operating grant funding by 2024-25, with the system average for 2022-23 being 45 per cent. As a result of the global pandemic, the metrics tied to the Differentiation Envelope did not impact the grant funding for 2020-21 and 2021-22. In addition, the MCU recently announced that the metric performance results will not be linked to funding for one additional year of SMA3 – Year 3 (2022-23), and that the Ministry will assess the sector’s readiness for activation in Year 4 (2023-24) at a planned system-wide proportion of 10 per cent increasing to 25 per cent in Year 5 (2024-25). The MCU also confirmed that the proportion for the Differentiation Envelope funding will remain at a system average of 45 per cent for 2022-23 as originally planned.
Special Purpose Operating Grant Envelope There is also a third major component of the MCU operating grants, the Special Purpose Operating Grant Envelope, which represents funding by which the government is able to address system priorities, such as initiatives to support Indigenous learners and students with disabilities. For the purposes of the 2022-23 budget, this envelope includes a number of MCU-funded grants, as detailed in Figure 50. Figure 50 ($000s) 2022-23Budget 2021-22Budget 2020-21Actual
Differentiation Envelope
Each university’s Differentiation Envelope proportion will vary and will be capped at the system average. For 2022-23, Brock’s Differentiation Envelope is budgeted to be $39.4 million, which represents 44 per cent of the total MCU operating grants, as noted in Figure 49, and is reported in the University Global responsibility centre. Core Operating Grant (COG) The Core Operating Grant (COG) represents the portion of the MCU operating grants that are related to enrolment. The COG funding continues to be governed by an enrolment corridor mechanism, with Brock's midpoint WGUs multiplied by the global WGU rate to determine the COG. The corridor midpoint includes actual enrolment levels in 2019-20, including graduate spaces (master’s degrees and PhDs) achieved up to target in SMA2, meaning the additional growth beyond 2019-20 levels will not receive additional incremental funding. For more information regarding the enrolment corridor, see the Budget Environment section on page 17 of the 2021-22 Budget Report. Based on MCU communication to date, Brock is budgeting the COG to be $48.4 million in 2022-23 and it is reported in the University Global responsibility centre. The 2022-23 budget for the COG, in combination with the Differentiation Envelope, represents $87.8 million, which is consistent with the total COG/ Differentiation Envelope received in 2020-21 and the amount expected to be received in 2021-22.
ReportBudget2022-23 30DETAILSBUDGET
Other MCU and specific-purpose grants Nursing Grant 4,518 2,644 2,798 Research Support Fund 2,279 2,093 2,218 Facilities Renewal Program Funds 2,953 2,950 2,953 Other specific-purpose grants 818 911 1,574 Other MCU and specific purpose grants 10,568 8,598 9,543
Other MCU and specific-purpose grants
• Accessibility Fund for Students with Disabilities: The MCU provides funding to support a wide range of services for students with disabilities through the Access Fund for Students with Disabilities (AFSD). These services include access to adaptive computer and software learning technology; arranging note-taking for students who are visually impaired; and interpreter services for students who are deaf, deafened and hard of hearing. Brock’s funding for 2022-23 is budgeted to be $0.70 million ($0.69 million in 2021-22). The grant revenue related to the AFSD is shown as part of Student Wellness and Accessibility.
• Ontario Post-Secondary Access and Inclusion Program: The MCU provides funding to support students that might not otherwise access postsecondary education. The 2022-23 budget for this funding is $0.23 million ($0.17 million in 2021-22), which is reported in Student Life and Success.
Figure 51 ($000s) 2022-23Budget 2021-22Budget 2020-21Actual
• Mental Health Support for Post-Secondary Education Students Grant and Mental Health Workers Grant: The MCU funds support for mental health initiatives for students. The 2022-23 budget for this funding is $0.14 million ($0.14 million in 2021- 22) and $0.10 million ($0.10 million in 2021-22), respectively. Both are reported in Student Wellness and Accessibility.
The ISR offsets MCU operating grants by $750 for every undergraduate and master’s-level international student. This reduction is budgeted to be $1.93 million in 2022-23 ($1.75 million in 2021-22) and is reported in the University Global responsibility centre.
• Grant in Lieu of Municipal Taxation: The MCU provides subsidies to universities to pay their municipal taxes. The municipal tax (payment in lieu of property taxes) is based on a charge of $75 per domestic FTE; however, the related grant does not change with enrolment. The 2022-23 tax payments are budgeted to be $1.25 million ($1.28 million in 2021-22) and the grant is budgeted to be $1.09 million ($1.09 million in 2021-22); therefore, $0.16 million is budgeted to be unfunded through this grant. Both the grant revenue related to the Grant in Lieu of Municipal Taxation and the offsetting payment in lieu of property taxes are reported as part of the Utilities, Taxes and Insurance responsibility centre.
• Also included in the Special Purpose Operating Grant Envelope are the following: Disabilities Interpreters' Grant, First Generation Bursary funding and the Women’s Safety Grant (2022-23 and 2021-22). The revenue related to these grants is shown as part of Student Wellness and Accessibility, the Scholarship, Bursaries and Fellowships responsibility centre, and Human Rights and Equity.
• Covid Relief Grant: In 2020-21 the MCU provided a one-time COVID Relief grant of $7.9 million. This grant is reported in the University Global responsibility centre.
The University receives a number of other MCU grants, not included as part of the ‘MCU operating grants,’ as well as a number of other specific-purpose grants, which are detailed in Figure 51.
International Student Recovery (ISR)
• Credit Transfer Grant: The MCU funds support for post-secondary education transfer mobility initiatives. The 2022-23 budget for this funding is $0.26 million ($0.22 million in 2021-22), which is reported in The Office of the Registrar.
• The Indigenous Student Success Fund: The MCU supports Indigenous students through funding for student support initiatives, academic enrichment and partnership initiatives. The 2022-23 budget for this funding is $0.34 million ($0.34 million in 2021-22), which is reported in Aboriginal Student Services.

The Research Support Fund is a Government of Canada funding program to assist Canadian post-secondary institutions in offsetting the cost of administering research awards from the three federal granting councils (Natural Sciences and Engineering Research Council, Social Sciences and Humanities Research Council and the Canadian Institute of Health Research). Brock receives funding to support the indirect costs incurred on Tri-Council-funded research through the program. These costs can include maintenance and utilities of libraries and laboratories, salaries for staff or students who provide research administration support, training costs for workplace health and safety, or the administrative costs associated with getting a patent. The amount is determined by a formula that incorporates a base amount and the average of the last three years of research funding from the three agencies. Brock’s funding is estimated to be $2.28 million for 2022-23 ($2.09 in 2021-22), which is reported as part of the Office of Research Services.
Nursing Grant
Facilities Renewal Program funds
ReportBudget2022-23 31DETAILSBUDGET
Other specific-purpose grants
Prior to 2022-23, the Nursing Grant has been separately funded through the college system. Brock received its grant through Loyalist College and was paid on a slipyear basis (based on enrolment in the prior year). In Feb. 2020, the Ontario government announced that colleges and universities are permitted to offer Bachelor of Nursing programs on a stand-alone basis. As such, the Brock-Loyalist Collaborative Nursing program will be dissolved. The MCU communicated in Oct. 2021 that the policy is cost and enrolment-neutral and the total current enrolment of 540 full-time equivalents (FTEs) will be split evenly between Loyalist College and Brock, meaning each institution will receive an allocation of 270 FTEs. While uncertainty still exists on how the funding for nursing students will occur next year and going forward, for the purposes of the 2022-23 budget, it was assumed 540 FTEs will be funded resulting in a grant of $4.52 million ($2.64 million in 2021-22). This grant is reported in the University Global responsibility centre. Research Support Fund
• Ontario Graduate Scholarships in the amount of $0.58 million in 2022-23 and Queen Elizabeth II program in the amount of $0.08 million in 2022-23. These two grants and their offsetting scholarship expenses are included in the Scholarships, Bursaries and Fellowships responsibility centre.
Included in other specific-purpose grants are a number of special grants, including the following:
• Bursaries for Students with Disabilities Grant (MCU) and in 2020-21 and 2021-22 the Niagara Community Foundation Grant, the Ontario Women’s Health Scholars Grant and other smaller special grants. The revenue related to these grants is shown as part of a number of departments, including Student Wellness and Accessibility, Co-op, Career and Experiential Education and Graduate Student Funding, etc.
The provincial Facilities Renewal Program (FRP) funds are meant to help ensure that academic spaces and supporting infrastructure are maintained in good repair to provide a safe environment to work and study. The distribution of the university sector FRP funds has been determined based on the university’s share of the theoretical space entitlement calculated in accordance with the Council of Ontario Universities’ space standards. The data used in the formula is taken from the Inventory of Physical Facilities of Ontario Universities, which is updated every three years. The funding also includes top-up funding, which is distributed based on an institutions’ enrolment. The formula also includes a floor so that no institution receives less than 0.5 per cent of the total university sector allocation. During 2020-21, the MCU announced that the funding amount for Brock University would increase $1.49 million to $2.95 million for both 2020-21 and 2021-22 funding allocations. Communication related to 2022-23 had not been received at the time of budget preparation, as such, the budget for 2022-23 is consistent with prior years at $2.95 million. The grant revenue related to the Facilities Renewal Program funds is reported in the Capital responsibility centre. The specific projects the Facilities Renewal Project Funds are being used for are detailed as part of the capital and related project budget, starting on page 75.
• Transfers from the capital project reserve of $0.61 million ($0.77 million in 2021-22) to support positions in various units including Information Technology Services and Facilities Management.
Inter-fund revenue Inter-fund revenue represents transfers from various funds, including reserves to support operating activities. Inter-fund revenue is budgeted to be $11.98 million in 2022-23 ($7.46 in 2021-22) and includes the following:
ReportBudget2022-23 32DETAILSBUDGET
• Campus Security chargebacks of $0.12 million ($0.12 million in 2021-22), mainly to Residence Services.
• Facilities Management charges for services, including salary, custodial and maintenance chargebacks of $0.68 million ($0.68 million in 2021-22).
• Parking Services chargebacks of $0.06 million ($0.06 million in 2021-22).
Internal chargebacks represent revenue received by units within the University for services performed or goods received from other units. The offsetting expenses are within the operating costs of those units that received the service.
Internal chargebacks
• Information Technology Services charges of $0.39 million ($0.38 million in 2021-22), mainly to Residence Services.
• Charges for utilities from the Utilities, Taxes and Insurance responsibility centre, mainly to Residence Services, of $1.72 million ($1.71 million in 2021-22).
• Funding from Ancillary Services and Residence to support the financing of the 2020 Bond Debenture in the amount of $3.2 million. See page 38 for details of the debt financing.
• Transfers from Government of Canada, Canada Research Chairs’ grants to fund a portion of the chair holders' salaries of $0.63 million ($0.83 million in 2021-22), shown in the Faculty of Social Sciences, the Faculty of Mathematics and Science and the Faculty of Applied Health Sciences.
• Campus Store charges for goods purchased by units within the University of $0.15 million ($0.15 million in 2021-22).
• Spending allocations from Marilyn I. Walker School of Fine and Performing Arts Endowment Fund of $0.53 million ($0.49 million in 2021-22), shown in the Faculty of Humanities.
• Charges for printing and binding of $0.78 million ($0.71 million in 2021-22) and stationery of $0.15 million ($0.21 million in 2021-22) from Printing and Digital Services.
• Funding of the Ancillary Services and Residence portion of the capital budget in the amount of $4.0 million ($4.0 million in 2021-22). See page 75 for details of the capital budget.
• Faculty of Mathematics and Science chargebacks for Machine and Electronic Shop and Mass Spectrometer/ Nuclear Magnetic Resonance charges of $0.06 million ($0.06 million in 2021-22). Also included in internal chargebacks are interdepartmental transfers of funds to support operations. Included in the 2022-23 budgeted internal chargebacks are the following:
• Additional inter-departmental transfers include several smaller transfers within and between units related to specific projects and initiatives.
• Transfers from strategic funds of $6.82 million ($1.14 million in Included2021-22).inthese transfers are $5.31 million ($0.83 in 2021-22) from the President, Provost, Vice-President, Research and Associate Vice-President, Development Strategic Initiative Funds to support various initiatives within the University, including $2.18 million to support Engineering, $1.50 million to support Professional and Continuing Studies, $0.49 million to support the Research Enterprise, $0.33 million to support Development and Alumni Relations, $0.09 million to the Scholarships, Bursaries and Fellowships unit to support Brock Horizon Scholarships and various other small amounts to support other strategic initiatives in the University. Also included in these strategic fund transfers are $1.51 million ($0.31 in 2021-22) from the Dean’s Strategic Funds to support ongoing operations in the Faculty of Applied Heath Sciences ($0.50 million), the Faculty of Mathematics and Science ($0.69 million) and the Faculty of Social Sciences ($0.32 million).
• Endowment funding supporting scholarships, bursaries, and fellowships of $2.65 million ($2.52 million in 2021- 22), this revenue is offset by inter-fund expenses for the same amount. For further information on this transfer, see page 83.
Internal chargeback revenue is budgeted to be $11.95 million in 2022-23 ($8.64 million in 2021-22) and includes the following:
ReportBudget2022-23 33DETAILSBUDGET
Income generated from sales and services represents a wide variety of sources, including the following: Ontario University Application Centre revenue; recreation and youth program revenue, including aquatic centre instructional fees; various service fees charged on student accounts; health insurance reimbursement; intramural fees and Brock Sports Performance Centre fees; affinity revenue; revenue from programs, such as Goodman’s professional and executive development programs, Smart Start, BOOST, and international learning programs; rental income (e.g. Heritage Place Plaza); chargebacks to external units, including utilities; contributions from the pension plan for pension-related expenses; contributions from the endowment fund for endowment-related expenses and student printing fees. Asset sale revenue
The asset sale revenue relates to the sale of the Hamilton campus. The Hamilton campus was sold in August 2020, with a portion of the proceeds being recognized as imputed interest revenue as a result of the leaseback arrangement with the buyer. In 2022-23, $7.93 million ($0.80 million in 2021-22) of the proceeds of sale, along with $0.07 million ($0.20 million in 2021-22) of imputed interest, is being recognized and is equally offset by an allocation of $8.0 million to the strategic fund to be used to support certain strategic priorities, including a potential Burlington campus. This is reported in the University Global responsibility centre.
Total ancillary revenue budgeted in 2022-23 is $38.12 million. This budget represents a significant rebound in both residence fees and other ancillary revenue as compared to actual results in 2020-21, representing an increase of $28.85 million, and an increase over the 2021-22 budget of $6.94 million. This recovery is mainly the result of students and other members of the Brock community returning to campus. Residence fees are budgeted to be $23.88 million in 2022-23, resulting from a budgeted occupancy rate of 94.4 per cent as compared to the 75 per cent occupancy budgeted in 2021-22. Other ancillary revenue growth over the 2021-22 budget of $1.96 million was experienced across all ancillary units. There remains risk to this budget should public health restrictions return because of negative developments from the global pandemic. Investment income
The 2022-23 budgeted investment income includes the interest the University receives on short-term investments of $1.50 million ($1.50 million in 2021-22). Also included is the investment income on the Mawer balanced fund investments of $0.38 million ($0.37 million in 2021-22). This investment income net of administration fees is transferred to an internally restricted reserve as part of inter-fund expenses to support the repayment of the 2045 $93-million debenture and the 2020 $125-million debenture (i.e. sinking funds) and the employee future benefits reserve. Sales and services
• Transfer from the contingency reserve of $1.21 million in 2021-22. Other revenue Other revenue represents revenue from ancillary operations, including residence fees, investment income, sales and services, and asset sale revenue, and represents 16 per cent of total revenue (13 per cent in 2021-22). As detailed in Figure 52, other revenue is budgeted to be $62.18 million, an increase of $13.77 million over the 202122 budget and $37.86 million over 2021-22 actuals. Figure 52 ($000s) 2022-23Budget 2021-22Budget 2020-21Actual Residence fees 23,881 18,895 3,376 Other ancillary revenue 14,238 12,283 5,898
Ancillary revenue
• Transfers from operating projects of $0.49 million ($0.35 million in 2021-22) to support operations in the Faculty of Applied Health Sciences, the Faculty of Humanities, the Faculty of Mathematics and Science, and the Research Enterprise.
Total ancillary revenue 38,119 31,178 9,274 Investment income 1,884 1,866 2,469 Sales and services 14,239 12,716 12,576 Asset sale revenue 7,934 2,646 Total other revenue 62,176 48,406 24,319
Figure 54: Part-time teaching by teaching Faculty (1) ($000s) 2022-23Budget 2021-22Budget 2020-21Actual Faculty of Applied Health Sciences 4,312 3,971 4,241 Goodman School of Business 3,135 3,557 3,966 Faculty of Education 4,913 4,832 4,731 Faculty of Humanities 3,398 3,098 3,241 Faculty of Mathematics and Science 2,802 2,952 2,953 Faculty of Social Sciences 5,693 5,457 6,078 Total 24,253 23,867 25,210 (1) Includes salaries and benefits in teaching Faculties for the following: CUPE 4207 – Unit 1, nonunion instructors, BUFA overload, stipend transfers and CUPE 4207 – Unit 3.
Figure 55: Part-time teaching by personnel group(1) ($000s) 2022-23Budget 2021-22Budget 2020-21Actual CUPE 4207 – Unit 1 16,718 16,039 17,327 Non-union instructors 5,258 5,279 5,023 BUFA overload 2,628 2,732 3,015 CUPE 4207 – Unit 3 109 106 106 Stipend transfers (460) (289) (261) Total 24,253 23,867 25,210 (1) The figures above
include part-time teaching costs reported in the teaching Faculties only. Budgets related to the personnel groups noted in this figure which are reported outside the teaching Faculties are not reported in these figures. Figure 53 Personnel group (1) ($000s) 2022-23 Budget 2021-22 Budget 2020-21 Actual Salary/Wage Benefits Totalcostspersonnel Salary/Wage Benefits Totalcostspersonnel Totalcostspersonnel Faculty and Professional Librarians 96,628 21,480 118,108 94,023 20,647 114,670 106,533 Admin/Professional 51,762 13,975 65,737 47,656 13,381 61,037 54,667 OSSTF 7,986 2,513 10,499 7,857 2,538 10,395 9,498 CUPE 1295 FT 7,154 2,474 9,628 6,964 2,513 9,477 8,641 SAC 6,693 1,438 8,131 5,715 1,134 6,849 6,846 Other ongoing personnel 779 218 997 655 201 856 1,295 Total ongoing personnel 171,002 42,098 213,100 162,870 40,414 203,284 187,480 CUPE 4207 – Unit 1 15,282 1,742 17,024 14,398 1,642 16,040 16,392 Other temporary personnel 14,625 1,081 15,706 13,474 963 14,437 10,785 Total temporary personnel 29,907 2,823 32,730 27,872 2,605 30,477 27,177 Total personnel 200,909 44,921 245,830 190,742 43,019 233,761 214,657 1) Faculty and Professional Librarians – BUFA members, Associate Deans, Associate Vice-Presidents of Research and Associate Librarian; Admin/Professional – ongoing administrative/professional and exempt staff; OSSTF – support and technical staff; CUPE 1295 FT – full-time maintenance, trades and custodial staff; SAC – Senior Administrative Council; Other ongoing – CUPE 4207-2, CUPE 4207-3 and IATSE; CUPE 4207 – Unit 1 – instructors, teaching assistants, lab demonstrators, course co-ordinators and marker/graders; Other temporary – all other part-time teaching and nonteaching positions, Faculty overloads and stipend transfers. Figures 54 and 55 detail personnel costs for part-time teaching by Faculty and by personnel group. Note: the amounts in these figures include stipend transfers, which in some cases would have an offsetting amount in another unit of the University.
Operating cost assumptions Personnel costs Personnel costs include salaries/wages, benefits and pension costs and represent 63 per cent of the total budgeted costs. Personnel costs are budgeted to be $245.8 million, an increase of $12.07 million from the 2021-22 budget and $31.17 million from 2020-21 actual, as detailed in Figure 53.
ReportBudget2022-23 34DETAILSBUDGET
Total full-time equivalent (FTE) salaried staff and faculty members (including BUFA limited-term and instructional limited-term faculty appointments) included in the 2022-23 budget is 1,691.3, which represents an increase from the 2021-22 budget of 76.7 FTEs. The increase represents investments in a number of areas of the University, including Student Wellness and Accessibility, Professional and Continuing Studies, and Nursing in the Faculty of Applied Health Sciences. FTEs by unit are detailed in the snapshot section on pages 44 to 73. Benefit and pension costs include employer contributions to the Brock University Pension Plan, as well as dental, medical and statutory taxes (CPP, EI, EHT and WSIB). Also included is funding of the University’s pension plan deficit obligation. Both the pension plan obligation and the employee future benefits reserve are more fully described starting on page 35 of this report.
Personnel costs Personnel cost as a % of operating expenses incr2%ease incr10%easechangeno incr1%ease incr5%ease incr4%ease
(1) Represents figures prepared in accordance with Canadian accounting standards for not-forprofit organizations (2014-15 to 2020-21, and have been audited by KPMG LLP (independent auditors). 2015-16 figure includes a reclassification between operating expenses and salaries and benefits made for comparative purposes.
(2) Represents trimester two forecast figures converted to NFPS (3) Represents budget figures converted to NFPS. Pension The pension plan continues to be a topic of interest at our University and for many universities across the province. Our plan has continued to experience positive returns as illustrated in Figure 57. Every three years, the financial health of the plan is recalculated through an actuarial valuation.
incr4%ease incr3%ease 14-15(1) 15-16(1) 16-17(1) 17-18(1) 18-19(1) 19-20(1) 20-21(1) 21-22 (2) 22-23 (3) 193,041 195,754 204,882 212,064 220,714 227,265 220,557 224,949 247,838 65% 64% 65% 65% 65% 66% 66% 63% 63% Figure 56: 2014-15 and 2022-23 NFPS personnel costs ($000s) to monitor developments of the UPP and other pension plan managers, such as the College of Applied Arts and Technology (CAAT) Pension Plan. Our focus for 2022-23 will also encompass analyzing opportunities to enhance Environmental, Social and Governance (ESG) factors relevant to Pension and Endowment Fund investments. Net assets available for benefits ($000s) Returns Figure 57: Pension Plan as of June 30 pension year end ($000s) 2014 2015 2016 2017 2018 2019 2020 2021 401,731 437,508 449,411 481,174 515,006 561,168 595,224 653,618 15.8% 9.5% 3.1% 9.7% 8.4% 8.3% 7.5% 12.5% The Brock University Pension Plan returns exceeded the required six per cent rate of return over the last three years to drive an improved funded position. This resulted in a $0.4 million annual savings in pension plan payments that are required to amortize the going concern deficit. Increased diversification of plan assets into infrastructure and real estate assets over the past three years have contributed to the strong investment performance. Overall, employee annual contributions into the pension plan represent $8.0 million and Brock’s annual contributions represent $16.0 million. Brock currently funds the pension at a 2.0:1.0 ratio employer to employee.
ReportBudget2022-23 35DETAILSBUDGET
Figure 56 shows personnel costs and personnel costs as a percentage of operating costs prepared in accordance with accounting standards for not-for-profit organizations (NFPS) since 2014-15.
The actuarial valuation on the pension plan was recently updated as at Jan. 1, 2020, indicating the plan was 98 per cent funded on a going-concern basis (96 per cent as at July 1, 2017) and 106 per cent on a solvency basis (105 per cent as at July 1, 2017). The going concern deficit improved from $17.9 million in 2017 to $12.7 million in 2020 mainly due to strong investment returns, offset by new legislation to fund a provision for adverse deviation (Pfad), which is a requirement for all single employer sponsored pension plans. This requirement to fund a Pfad is not applicable for jointly sponsored pension plans. The university sector has launched a jointly sponsored pension plan (JSPP) with Guelph, Queens, the University of Toronto, and Trent, which recently joined. The University Pension Plan (UPP) became operational Jan. 1, 2020. The UPP is now close to opening up to new entrants. Administration is continuing decr-3%ease

Figure 59 Employee future benefits (as at April 30, 2021) ($000s) Retiree benefits 3,907 Health-care spending account 18,818 Retirement allowance benefits 1,278 Sick leave 288 Disability 6,210 Total 30,501 benefits
Post-retirement
vs. pension liability trajectory ($000s) 2022 2023 2024 384,965 394,204 403,665 660,056 703,952 750,498 1.71 1.79 1.86
ReportBudget2022-23 36DETAILSBUDGET
Brock University’s non-pension post-retirement benefits liability as at April 30, 2021 was $30.5 million. Figure 59 describes the nature of these future obligations.
vs. pension liability trajectory Budget expenses Pension liabilities Pension liabilities to budgeted expenses Figure 58: Operating
Administration now annually performs test valuations with Mercer (Plan actuary) to test budget sensitivities as recommended by the Financial Services Regulatory Authority of Ontario. As part of the University’s fiduciary responsibility to manage the Pension Plan, an off-cycle funding test was performed as of July 1, 2021. The goingconcern deficit has deteriorated to $20.7 million deficit primarily due to a 0.25 per cent decrease in the discount rate. Pension cost will continue to rise in the future and grow at a faster pace than the University’s operating budget as the costs are tied to salary increases which grow on average faster than the overall budget of the University. Using the Mercer projections for pension liabilities and standard inflation on budgeted expenses, Figure 58 shows that over time the size of the pension liabilities grow at a faster rate in comparison to Brock’s operating budget. Salient to the growth in pension costs is the pension stabilization reserve funding of $1.59 million established from 2017-18 year end surplus which remains uncommitted. This reserve is budgeted to remain restricted for future pension stabilization as needed. Additional information on the pension plan may be found at financials/#auditedpension-statementsbrocku.ca/about/university-
Brock has traditionally had a pay-as-you-go model to fund immediate requirements. For example, in 2021-22, Brock paid $0.31 million related to BUFA’s health-care spending account as of February 2022. As time goes on, continuation of this practice would impact Brock’s financial sustainability. This would occur as more people retire and the University becomes obligated to pay these benefits in addition to the benefits of the replacement employee. The reality is these post-retirement costs are similar to Brock’s pension liability, which is funded while employees earning the benefit perform their employment responsibilities. It is in the interest of Brock and its employees that these post-retirement benefits are funded in a similar manner as the pension liability to ensure these future obligations can also be met and do not become an unfunded burden on future budget plans. For these reasons, starting in 2014-15, $0.9 million was reserved annually to begin setting aside assets for this obligation. As of Feb. 2022, this fund has $6.6 million invested representing $4.5 million invested capital and $2.1 million investment income. While the annual contribution of $0.9 million was removed from the budget in 2019-20 as a mitigation target and remains excluded in the 2022-23 budget, the reserve will remain invested in the sinking fund. This amount is in addition to the pay-as-you-go funds already in the budget. It is important to note that in the DBRS Morningstar credit rating they noted, “Brock’s decision to begin reserving for non-pension post-employment benefits is viewed as a prudent practice, which will gradually address growth in these obligations over time.” Ontario universities vary on how they fund post-retirement benefits. There are some that have a reserve balance that equals the total liability and others with no reserve. budgetbudget
Figure 58: Operating
-232022
ReportBudget2022-23 37DETAILSBUDGET Operating costs Non-personnel operating costs (operating costs), including inter-fund expenses, represent 37 per cent of the total budgeted expenditures of the University (35 per cent in 2021-22). Operating costs increased $18.6 million over the 2021-22 budget and $45.7 million over 2020-21 actual. Operating costs have been segregated into nine categories. See Figure 60 for a breakdown by category. Total 147,135 20,50823,845312,96019,5818,5339,09827,8295,4464,7032,69026,29518,1728,10713,0198,5025,2224,51326,610 Total 128,498 Figure 60: Budgeted operating costs ($000s) Other operating costs Inter-fund expense Cost of sales Library acquisitions Scholarships and fellowships FinancialPuUtilitiesexpendituresandtaxesrchasedservices 2021-22 Budget Other operating costs Inter-fund expense Cost of sales Library acquisitions Scholarships and fellowships FinancialPuUtilitiesexpendituresandtaxesrchasedservices Repair and maintenance and capital replacement Repair and maintenance and capital replacement 2022-23 Budget 13% 6% 3%4%6%9% 18% 22% 19% 3%4%6%10%14%7%19%21%16% Figure 60: Budgeted operating costs ($000s) return to pre-pandemic levels. Other specific examples of purchased services in the budget include security services; the payment to the First Ontario Performing Arts Centre; physician and counselling services; the payment to Niagara College for the GAME program; consulting, legal and audit fees; liability and property insurance; and internet and mobile phone charges. Utilities and taxes Budgeted utilities and taxes for 2022-23 are $8.5 million, ($8.1 million in 2021-22). Utilities include the cost of heating and cooling, hydro, water and carbon and greenhouse gas costs of $7.18 million ($6.73 million in 2021-22). The majority of the University’s utilities expenses, $6.27 million ($6.17 million in 2021-22), are reported in the Utilities, Taxes and Insurance responsibility centre. In addition, utility expenses of $0.91 million ($0.56 million in 2021-22) are directly reported in specific units, the majority of which is reported in Residence Services as well as Heritage Plaza and the Canada Summer Games Consortium. See Figure 61 for a breakdown of the net utilities costs by type. Utilities and taxes also includes $1.35 million ($1.37 million in 2021-22) related to municipal tax, of which the majority is reported in the Utilities, Taxes and Insurance responsibility centre. See page 30 for further discussion on property taxes and the offsetting Grant in Lieu of Municipal Taxation.
WaterHydro Heating and cooling Carbon and green house gas costs 2.44 3.18 1.19 0.37 2.18 3.10 1.18 0.27 2-22021
Purchased services Budgeted purchased services for 2022-23 are $19.6 million ($18.2 million in 2021-22). For the purposes of this report, overall purchased services represent the following types of services: contracted services and professional fees, external information technology and telecommunication services, rental/lease costs, and insurance costs. The increase versus 2021-22 is mainly due to an increase in contracted services related to student recruitment fees as international enrolment is forecast to increase, as well as foodservice and custodial contracted services as operations on campus
Figure 61: Utilities by type ($000s)
Repairs and maintenance and capital replacement costs of $9.1 million ($8.5 million in 2021-22) include $4.73 million ($4.20 million in 2021-22) of costs related to repairs and maintenance of devices, buildings and grounds and their related supplies. Also included are $4.37 million ($4.30 million in 2021-22) of furniture, equipment and software and licence purchases that are not included in any projects within the capital and related project budget. Note: funding of the capital and related project budget is reported as part of inter-fund expenses and not as part of repairs and maintenance and capital replacement costs.
Figure 62 ($000s) 2022-23 Budget Financingunit AncillaryResidenceand Total 2005 Bond – interest 2,137 2,483 4,620 2020 Bond – interest 571 3,220 3,791 Loan renewal – interest 335 335 Loan renewal – principal 997 997 Scotia loan – interest 359 359 RLCHBRC (1) – interest 245 245 RLCHBRC (1) – principal 231 231 Residence – interest 685 685 Residence – principal 1,264 1,264 Total interest and principal payments 4,875 7,652 12,527 (1) Roy and Lois Cairns Health and Bioscience Research Complex Figure 63 ($000s) 2022-23 Budget SBF responsibilitycentre Otherunits Undergraduate scholarships, bursaries and student awards 15,496 265 Undergraduate tuition waivers 1,283 Graduate fellowships and student awards 10,399 192 Graduate tuition waivers 194 Total 27,372 457 Financial expenditures Budgeted financial expenditures for 2022-23 are $13.0 million ($13.0 million in 2021-22). The University’s external debt principal payments of $2.49 million ($2.09 million in 2021-22) and interest payments of $10.03 million ($10.54 million in 2021-22) are included as part of financial expenditures. Figure 62 details the breakdown by the unit where
Repairs and maintenance and capital replacement
Scholarships and student awards
ReportBudget2022-23 38DETAILSBUDGET
The majority of these student awards are reported in the Scholarships, Bursaries and Fellowships (SBF) responsibility centre, with Figure 63 detailing the amounts. See page 71 for further discussion on the SBF responsibility centre.
Total budgeted scholarships, fellowships, bursaries and student awards were $27.8 million ($23.8 million in 2021-22). This increase reflects Brock's continued commitment to supporting students. Undergraduate entrance scholarship funding, financial need bursaries and other student awards are budgeted to be $17.04 million in 2022-23 ($14.03 million in 2021-22) of which $12.4 million ($9.4 million in 2021-22) relates to the Brock Scholars program (both entrance and renewal awards). The increase in these awards is a result of significant grade inflation from secondary schools resulting in a greater proportion of students becoming eligible for the program and an increase in the proportion of students achieving higher averages, which results in more students achieving the higher dollar value awards. Included in the undergraduate student awards are $1.28 million ($1.28 million in 2021-22) of employee benefit student tuition waivers. Graduate student scholarships and fellowships are budgeted to be $10.78 million ($9.82 million in 2021-22). The increase in graduate student funding is aligned with the Fiscal Framework as well as additional commitments to graduate students affected by the pandemic. Included in the graduate student awards are $0.19 million ($0.19 million in 2021-22) of employee benefit student tuition waivers. these costs funded. Note: the $3.2 million of 2020 bond interest funded by Ancillary and Residence in 2022-23 is reported as an inter-departmental chargeback to the Financing unit. All other debt payments are reported directly in the units detailed in Figure 62. Refer to the Financing section on page 81 for a discussion on the University’s debt and financing strategies. Also included as part of financial expenditures are banking charges and payment card fees of $0.43 million ($0.40 million in 2021-22), which are reported in units throughout the University.
Note: The funding budget also includes the endowment allocated spend related to scholarships and fellowships of $2.65 million for 2022-23 – $2.05 million undergraduate and $0.60 million graduate ($2.52 million in 2021-22 –$1.95 million undergraduate and $0.57 million graduate). This support is reported in the funding budget as a funding source (inter-fund revenue), with the offsetting expense (inter-fund expense) in the SBF responsibility centre.
• Funding related to the capital and related project budget of $14.81 million ($14.80 million in 2021-22) as outlined on pages 75 to 79 of this report. The related interest and principal payments of debt-funded projects are included as part of the financial expenditures category.
Library acquisitions
• Transfers of $2.65 million ($2.52 million in 2021-22) to the endowment fund for scholarships (this is offset by inter-fund revenue from the endowment fund).
• Transfers of $1.56 million ($1.49 million 2021-22) from the Research Enterprise to the research with no external obligation fund for funding of several important research initiatives, including VPR Research Excellence programs, CCOVI, the Match of Minds program and the Chancellor’s Chair.
The budgeted library acquisitions of $5.4 million in 2022-23 ($5.2 million in 2021-22) represent the funding to purchase critical information resources (ejournals, books, ebooks, geospatial data, music, full text databases, etc.) and discovery/access/dissemination technologies to support teaching and research. The increase in the budget is consistent with the targets set out in the Fiscal Framework as well as new resources for Engineering. Cost of sales Cost of sales of $4.7 million in 2022-23 ($4.5 million in 2021-22) represent the cost of purchasing the items for resale by Ancillary Operations mainly related to the Campus Store. The increase is consistent with the budgeted ancillary revenue.
• Transfers of $0.39 million ($0.51 million in 2021-22) from the teaching Faculties to operating project accounts and internally restricted research funds with no external obligations.
• Transfer of $8.0 million ($1.0 in 2021-22) from University Global to the strategic initiative funds related to the proceeds from the sale of the Hamilton campus.
• Transfers from the Financing responsibility centre of $1.94 million ($1.85 million in 2021-22) to an internally restricted reserve to support the Zone expansion project and the 2020 bond debenture. For more information, refer to the ‘Financing' snapshot section of this report on page 70.
Other operating costs
Other operating costs represent all other costs not included in the above eight categories, including internal chargeback expenses, travel costs, marketing and advertising expenses, other materials and supplies, membership dues and subscriptions, hospitality costs, postage and courier charges, professional development and training, practicum payments, printing and duplicating costs, conference fees, bad debt expense, and other costs. Also included in the 2022-23 budget is $3.9 million ($1.8 million in 2021-22) of uncommitted strategic/discretionary funds, representing one per cent of the budgeted revenue (one half of a per cent in 2021-22).
ReportBudget2022-23 39DETAILSBUDGET
Inter-fund expense
• Transfers of $1.85 million ($1.93 million in 2021-22) from the Faculties, the Library and other units for professional expense reimbursements (PER) and $1.15 million ($0.68 in 2021-22) from the Research Enterprise to Faculty start-up accounts.
Budgeted inter-fund expenses for 2022-23 are $32.7 million ($26.6 million in 2021-22). Inter-fund expenses represent transfers from the operating budget to other funds within the University, usually representing internally restricted reserves. The 2022-23 budget includes many significant contributions to internally restricted reserves, as detailed below:

Figure 64 and the following snapshots present the budgeted revenue and costs of each of the University’s responsibility centres based on each unit’s responsibility for establishing their respective budgets. The division of responsibility centres is not meant to measure each unit’s total revenue impact or fully loaded costs. As such, revenue shown in the Faculties does not include an allocation of global tuition or operating grant revenue. Revenue shown by the responsibility centre only reflects the tuition, fee and grant revenue specifically budgeted in the respective centres, as well as any other revenue generated within each centre. Total costs, as shown in the responsibility centres, include salaries, benefits and direct non-personnel costs (operating costs). Support service costs have not been allocated in these figures. For example, the majority of utility costs are shown collectively as part of the Utilities, Taxes and Insurance responsibility centre on page 70, and the majority of scholarships, bursaries and fellowships are reported as part of the Scholarships, Bursaries and Fellowships responsibility centre on page 71. As detailed in the 'Revenue and expense allocation model' section of this report, the revenue and expense allocation model has been developed and allocates all budgeted net operating costs of the University, including support service costs for each of the six teaching Faculties. The Provost, working with Financial Services, utilizes this model as a planning tool. Refer to page 85 for a full discussion of this model.
The following snapshots also detail the faculty and staff full-time equivalent (FTE) positions within each unit. The FTE figures represent each evaluated salary position included in the budget (i.e. the salary and benefits related to this position are included in the budget) and represent both filled and unfilled positions. The FTE of a faculty/staff member is calculated based on whether they are full-time, part-time, seasonal, etc. For example, an ongoing part-time position that works 17.5 hours per week would be counted as 0.5 FTE; whereas a full-time position would be counted as one FTE. During 2021-22, there have been a number of changes to units across the University. Reclassifications were made to the 2021-22 budget as reported in the 2021-22 Budget Report in both budget dollars and FTEs for comparison purposes to the 2022-23 budget when the overall funding budget was not impacted. See Appendix B for details of these adjustments.
ReportBudget2022-23 40SNAPSHOTS
It should also be noted that direct externally funded research revenue and matching expenses are not included in the budget.
Snapshotssnapshots
Responsibility budget centre

ReportBudget2022-23 41SNAPSHOTS

(1,640)(159,079)(7,620)(156,212)(160,719)(7,335)(161,039)FacultiesTeachingTotal7,6554,753 SupportAcademic (180)(1,730)StudiesGraduateofFaculty460 (1,450) (160)(1,415)361 (1,214) (236)50 (5,871)(5,363)Library126 (11,108) (5,692)(5,369)181 (10,880) (228)50 (3,776)(2,797)EnterpriseResearch3,977 (2,596) (3,016)(2,271)2,760 (2,527) (69)51 (35)(939)InnovationPedagogicalforCentre68 (906) (42)(910)25 (927) 5221 (701)(1,834)ESLandStudiesContinuingandProfessional2,556 21 (190)(1,014)1,369 165 (144)52 (656)(15,383)(9,100)(10,979)(16,039)(10,563)(12,663)SupportAcademicTotal7,1874,696 SpecificStudent (3,185)(5,811)RegistrartheofOffice2,464 (6,532) (2,453)(5,735)2,225 (5,963) (569)53 (1,400)(4,072)AccessibilityandWellnessStudent3,017 (2,455) (1,244)(3,511)3,089 (1,666) (789)54 (373)(1,810)SuccessandLifeStudent666 (1,517) (268)(1,748)604 (1,412) (105)55 (194)(1,381)ServicesInternationalBrock106 (1,469) (331)(1,467)194 (1,604) 56135 (33)(336)ServicesStudentAboriginal369(31)(342)369 (4) 564 (388)(3,911)EducationExperientialandCareerCo-op,2,419 (1,880) (440)(3,778)2,289 (1,929) 4957 (2,761)(5,440)RecreationandSportsBrock6,647 (1,554) (2,538)(4,921)6,189 (1,270) (284) 58 (1,559)(13,848)(7,305)(21,502)(15,407)(8,334)(22,761)SpecificStudentTotal15,68814,959 Ancillary (8,846)(2,810)OperationsAncillary14,184 2,528 (7,845)(2,851)12,437 1,741 59-60787 (18,284)(4,477)ServicesResidence24,158 1,397 (14,950)(3,478)19,087 659 61738 (22,795)(6,329)(27,130)(7,287)AncillaryTotal38,3423,92531,5242,4001,525
ReportBudget2022-23 42SNAPSHOTS centreresponsibilitybybudgetFunding StudentSupport,AcademicFaculties,Teachingcategories:followingtheofoneintogroupedareturninwhichcentre,responsibilitybybudgetfundingthedetails64Figure Global.andSpaceServices,SharedAncillary,Specific, 64:Figure centreresponsibilitybybudgetFunding ($000s) Budget2021-22Budget2022-23Differenceof amounts“Net” PageNon-personnelPersonnelref.RevenuecostscostsNetRevenuePersonnelcostsNon-personnelcostsNet FacultiesTeaching
(892)(26,995)SciencesHealthAppliedofFaculty637 (27,250) (893)(25,090)176 (25,807) (1,443)44 (2,947)(28,825)BusinessofSchoolGoodman1,372 (30,400) (2,965)(27,904)936 (29,933) (467)45 (616)(18,953)EducationofFaculty1,771 (17,798) (953)(18,596)1,858 (17,691) (107)46 (827)(22,854)HumanitiesofFaculty593 (23,088) (769)(23,076)587 (23,258) 47170 (1,022)(24,116)ScienceandMathematicsofFaculty2,638 (22,500) (941)(23,385)875 (23,451) (1,031)(39,296)SciencesSocialofFaculty644 (39,683) (1,099)(38,161)321 (38,939) (744)49
48951
ReportBudget2022-23 43SNAPSHOTS continued64Figure ($000s) Budget2021-22Budget2022-23Differenceof amounts“Net” PageNon-personnelPersonnelref.RevenuecostscostsNetRevenuePersonnelcostsNon-personnelcostsNet ServicesShared (1)TeamAdministrationandAcademicSenior(4,370)(695) (5,065) (694)(4,166)120 (4,740) (325)62 (1,929)(6,874)ServicesTechnologyInformation723 (8,080) (1,981)(6,690)772 (7,899) (181)62 (749)(3,003)ServicesFinancial589 (3,163) (725)(3,031)444 (3,312) 63149 (752)(3,837)374ResourcesHuman (4,215) (753)(3,638)206 (4,185) (30)63 (1,529)(1,634)CommunicationsandMarketingUniversity1,080 (2,083) (1,662)(1,626)1,086 (2,202) 64119 (394)(1,711)RelationsAlumniandDevelopment914 (1,191) (465)(1,542)859 (1,148) (43)64 (453)(1,188)ServicesEquityandRightsHuman765 (876) (840)(969)573 (1,236) 65360 (8)(515)SecretariatUniversity (523) (47)(820) (867) 65344 (52)(737)EngagementsCommunityandGovernmentofOffice (789) (52)(568) (620) (169)66 (13)(523)PlanningandAnalysisInstitutional (536) (18)(361) (379) (157)66 (32)(524)ManagementRiskUniversityandAuditInternal (556) (7)(391) (398) (158)67 (21)(691)CounselLegal (712)(712)67 (803)(26,986)(7,244)(23,802)(27,789)(6,627)(25,607)ServicesSharedTotal4,4454,060 Space (4,310)(12,315)ManagementFacilities1,677 (14,948) (3,617)(12,374)1,103 (14,888) (60)68 (998)(1,587)ServicesSecurityCampus150 (2,435) (1,075)(1,582)154 (2,503) 6968 (3,013)(88)AgreementsCommunityandDevelopmentCampus693 (2,408) (2,609)(71)554 (2,126) (282)69 (9,873)InsuranceandTaxesUtilities,3,048 (6,825) (10,360)3,051 (7,309) 70484 (10,101)Financing5,156 (4,945) (11,123)1,833 (9,290) 704,345 (36,116)(28,784)(14,027)(31,561)(28,295)(13,990)SpaceTotal10,7246,6954,555 Global (30,023)FellowshipsandBursariesScholarships,3,550 (26,473) (26,018)3,504 (22,514) (3,959)71-72 (14,815)Capital6,976 (7,839) (14,795)8,554 (6,241) (1,598)72 (14,013)(2,483)GlobalUniversity295,395 278,899 (4,837)(910)280,035 274,288 734,611 (946)(45,650)(910)(58,851)(2,483)GlobalTotal305,921244,587292,093245,533 (3,479)(128,498)(233,761)(3,003)(147,135)(245,830)UniversityTotal389,962358,780476 Learning,andTeachingVice-Provost,theAcademic;Vice-President,AssociateandVice-ProvosttheAdministration;Vice-President,theResearch;Vice-President,theAcademic;Vice-President,andProvostthePresident;theofofficesthefollowing:theIncludes(1) Senate.andTrusteesofBoardtheofcostsoperatingtheaswellasRelations,ExternalandAdvancementVice-President,AssociatetheEngagement,IndigenousVice-President,theStudents,Vice-President,Associatethe
ReportBudget2022-23 44SNAPSHOTS Faculty of Applied Health Sciences Applied Health Sciences supports the priorities of the Institutional Strategic Plan: We deliver and develop high-quality undergraduate, graduate and professional programs, which meet the needs of students and the community; we promote and develop strong basic and applied research foci with outstanding researchers, research partnerships and excellent graduate and undergraduate student research opportunities; our expansive experiential education and practicum opportunities for undergraduate and graduate students along with our extensive network of community partnerships work synergistically to enhance the life and vitality of the Niagara region and beyond; and we prioritize curriculum revision, new program development and student/faculty recruitment and support, which fosters inclusivity, accessibility, reconciliation and decolonization. For more information on the FAHS, visit brocku.ca/applied-health-sciences Note: Revenue includes $0.09 million ($0.14 million in 2021-22) funding related to Canada Research Chairs (shown as inter-fund revenue). See Figure 65-B for a breakdown of operating expenses by type. Figure 65-A ($000s) 2022-23Budget 2021-22Budget 2020-21Actual Revenue 637 176 168 Personnel costs (26,995) 96.8% (25,090) 96.6% (23,144) 97.4% Operating costs (892) 3.2% (893) 3.4% (618) 2.6% Total costs (27,887) 100% (25,983) 100% (23,762) 100% Net (27,250) (25,807) (23,594) FTE – faculty (1) 95.6 90.0 FTE – LTA/ILTA faculty (1) 9.3 9.3 FTE – staff (2) 43.9 34.2 Figure 65-C 2022-23Budget 2021-22Actual 2020-21Actual 2019-20Actual Undergraduate average class size Overall 75.0 86.7 76.3 Year 1 155.9 160.5 177.5 Year 2 96.1 112.2 108.1 Year 3 70.7 83.7 66.2 Year 4 44.6 49.2 41.1 Headcount by major (3) 4,622 4,429 4,412 4,168 FTE by Undergraduatemajor(4) 4,035 3,979 3,815 Graduate 289 306 242 Source: Institutional Analysis CUPEFaculty*4207 – Unit 1 Non-unionAdmin/professionalinstructors OtheSAOSSTFCr 7 10.1 11.8 1.93.42.070.7 0.1 Figure 65-D: 2022-23 Budget personnel costs (including benefits) (%) Teaching Faculties Figure 65-B: 2022-23 Operating costs (%) Internal chargeback expense Funding of professional expense reimbursement (PER) accounts Repair and maintenance and capital InterTreplacementravel-fundexpenses (other than PER) Purchased Scholarshipsservicesandstudent awards 39 34 12 5 4 4 2 (1) Full-time equivalent (FTE) faculty/librarians represents Brock University Faculty Association (BUFA) probationary and tenured faculty and Associate Deans (both filled and unfilled positions). LTA/ILTA represents BUFA limited-term and instructional limited-term faculty appointments. Faculty on sabbatical are represented as one FTE. (2) FTE – staff represents evaluated salaried staff positions and ongoing CUPE 1295 positions (both filled and unfilled). (3) See Figure 13 in 'The Big Picture' pullout for explanation of the figures reported. (4) See Figure 14 in ‘The Big Picture’ pullout for explanation of the figures reported. Figure 65-B: 2022-23 Operating costs (%) Figure 65-D: 2022-23 Budget personnel costs (including benefits) (%) *Note: BUFA positions, BUFA overload and Associate Deans.

ReportBudget2022-23 45SNAPSHOTS
The Goodman School of Business budget supports efforts toward continuous improvement and expanding impact to fulfil not only Goodman, but also Brock’s Institutional Strategic Plan while continuing to work to address gaps identified through the Business School Impact System (BSIS). A key finding of the report is that Goodman contributes $380 million to the Niagara economy through direct, indirect and induced annual contributions. Our push toward continuous improvement has resulted in the re-accreditation of our MBA-CPA program through CPA Ontario and international recognition and accreditation of our Bachelor of Business Administration International Double Degree from the European Foundation for Management Development (EFMD). In addition, we continue to serve our community with professional development, venture development, consulting services and the bi-weekly Business Breathers webinar series through Goodman Group, one of the services the BSIS report repeatedly praised for its impact on the community. Goodman holds an annual Business Matters panel discussion series, with recent topics focusing on Equity, Diversity and Inclusion, and Sustainability. While working with the Office of the Acting Vice-Provost of Indigenous Engagement, Goodman established the annual Indigenous Leader Speaker Series to coincide with National Indigenous Peoples Day. Visit brocku.ca/goodman Note: Revenue includes $0.32 million ($0.36 million in 2021-22) of program revenue related to Goodman’s professional and executive programs. See Figure 66-B for a breakdown of operating expenses by type. Starting in 2021-22, International student program (ISP) revenue is reported in the University Global responsibility centre. ISP revenue of $11.3 million was included as part of Goodman’s 2020-21 Actuals. 66-A
Figure
($000s) 2022-23Budget 2021-22Budget 2020-21Actual Revenue 1,372 936 11,891 Personnel costs (28,825) 90.7% (27,904) 90.4% (27,698) 92.6% Operating costs (2,947) 9.3% (2,965) 9.6% (2,227) 7.4% Total costs (31,772) 100% (30,869) 100% (29,925) 100% Net (30,400) (29,933) (18,034) FTE – faculty (1) 82.2 80.0 FTE – LTA/ILTA faculty (1) 14.0 14.0 FTE – staff (2) 44.6 Pur41.0chased services Other operating costs Funding of professional expense reimbursement (PER) accounts Inter-fund expenses (other than PER) Repair and maintenance and capital Internalreplacementchargeback expense ScholarshipsTravel and student awards Figure 66-B: 2022-23 Operating costs (%) 569205 24 2 2 Figure 66-C 2022-23Budget 2021-22Actual 2020-21Actual 2019-20Actual Undergraduate average class size Overall 45.5 50.0 49.7 Year 1 59.4 59.9 62.9 Year 2 55.8 64.1 61.0 Year 3 38.9 41.4 41.7 Year 4 32.8 35.7 34.1 Headcount by major (3) 3,455 3,368 3,415 3,593 FTE by Undergraduatemajor(4) 3,017 3,089 3,195 Graduate 601 615 644 Source: Institutional Analysis *Note: BUFA positions, BUFA overload and Associate Deans. CUPEAdmin/prFaculty*ofessional4207–Unit1 OtheSAOSSTFCr 81.5 4.7 10.3 1.5 1.1.00 Figure 66-D: 2021-22 Budget personnel costs (including benefits) (%) Figure 66-B: 2022-23 Operating costs (%) Figure 66-D: 2022-23 Budget personnel costs (including benefits) (%) (1) Full-time equivalent (FTE) faculty/librarians represents Brock University Faculty Association (BUFA) probationary and tenured faculty and Associate Deans (both filled and unfilled positions). LTA/ILTA represents BUFA limited-term and instructional limited-term faculty appointments. Faculty on sabbatical are represented as one FTE. (2) FTE – staff represents evaluated salaried staff positions and ongoing CUPE 1295 positions (both filled and unfilled). (3) See Figure 13 in 'The Big Picture' pullout for explanation of the figures reported. (4) See Figure 14 in ‘The Big Picture’ pullout for explanation of the figures reported.
Goodman School of Business


The Faculty of Education (FOE) is a leader in the delivery of academic programs related to learning and teaching across the lifespan. Our academic programs, scholarship and creative activities, and service are recognized for their excellence and career orientation. Our Indigenous Education programs, currently Brock's only Indigenous programs, support the educational and professional formation of teachers for remote communities and university education pathways for Indigenous adults in communities across Ontario. Our outstanding Teacher Education programs respond to the needs of Ontario's boards of education, including in the much-needed fields of technological education. Adult Education and Early Childhood Education (ECE) are Brock leaders as fully online programs, which create opportunities for adults and professionals to complete a university degree while maintaining employment and family responsibilities. The Early Childhood Education (ECE) program is a degree completion pathway for ECE educators in Ontario and internationally. Our graduate (MEd, PhD) programs provide rigorous academic and professional education for teachers and school, university, college, community and industry leaders. Visit brocku.ca/education Note: Revenue includes $1.49 million ($1.66 million in 2021-22) of student fees related to Continuing Teacher Education and Adult Education. See Figure 67-B for a breakdown of operating expenses by type. Starting in 2021-22 International student program (ISP) revenue is reported in the University Global responsibility centre. ISP revenue of $0.53 million was included as part of FOE's 2020-21 Actuals.
Figure 67-B: 2022-23 Operating costs (%) 242910 12 12 28 3 Funding of professional expense reimbursement (PER) accounts Other operating costs Purchased services Repair and maintenance and capital ScholarshipsTreplacementravel and student awards Internal chargeback expense Inter-fund expenses (other than PER) Figure 67-A ($000s) 2022-23Budget 2021-22Budget 2020-21Actual Revenue 1,771 1,858 2,211 Personnel costs (18,953) 96.9% (18,596) 95.1% (17,245) 96.9% Operating costs (616) 3.1% (953) 4.9% (546) 3.1% Total costs (19,569) 100% (19,549) 100% (17,791) 100% Net (17,798) (17,691) (15,580) FTE – faculty (1) 46.7 44.4 FTE – LTA/ILTA faculty (1) 11.5 12.5 FTE – staff (2) 40.0 39.6 Figure 67-C 2022-23Budget 2021-22Actual 2020-21Actual 2019-20Actual Undergraduate average class size Overall 49.4 45.6 42.6 Year 1 55.7 79.2 106.5 Year 2 29.4 28.2 30.3 Year 3 60.2 44.2 38.6 Year 4 49.5 48.0 39.0 Headcount by major (3) 1,959 1,895 1,920 1,772 FTE by Undergraduatemajor(4) 1,701 1,599 1,383 Graduate 162 168 244 Source: Institutional Analysis Non-unionFaculty* instructors OSSTFAdmin/professional CUPE 4207 – Unit 1 OtheSACr 7 55.1 10.4 22.6 3.11.61.9 5.3 Figure 67-D: 2022-23 Budget personnel costs (including benefits) (%) *Note: BUFA positions, BUFA overload and Associate Deans. Figure 67-B: 2022-23 Operating costs (%) Figure 67-D: 2022-23 Budget personnel costs (including benefits) (%) ReportBudget2022-23 46SNAPSHOTS (1) Full-time equivalent (FTE) faculty/librarians represents Brock University Faculty Association (BUFA) probationary and tenured faculty and Associate Deans (both filled and unfilled positions). LTA/ILTA represents BUFA limited-term and instructional limited-term faculty appointments. Faculty on sabbatical are represented as one FTE. (2) FTE – staff represents evaluated salaried staff positions and ongoing CUPE 1295 positions (both filled and unfilled). (3) See Figure 13 in 'The Big Picture' pullout for explanation of the figures reported. (4) See Figure 14 in ‘The Big Picture’ pullout for explanation of the figures reported.
Faculty of Education


ReportBudget2022-23 47SNAPSHOTS
The world has changed utterly in the past few years, and those changes have been most apparent in their impact on the lives and spirits of individual human beings. That's where the Humanities come in. Our researchers and creative practitioners examine the cultural, historical, and intellectual frameworks of the world and the human experience, and have significant impact both locally and internationally. We work on figuring out what really happened or is happening, how we can know, and what we can do about it. We are the very embodiment of the Institutional Strategic Plan: our students have an experience unparalleled in Ontario universities, both in the classroom and beyond, as they engage with the world and consider how to improve it. We enhance the life of our community through creative performances, exhibits and intellectual events; and we actively pursue inclusion and accessibility through our teaching, research, creative activity and service. Along the way, as well, we help inoculate against “Fake News” and extremism by fostering a respect for rigour and truth in our teaching, scholarship and creative activity. brocku.ca/humanities/ Note: Revenue includes $0.53 million ($0.49 million in 2021-22) of spending allocations from the Marilyn I. Walker School of Fine and Performing Arts Fund . The 2021-22 budget included $0.08 million of funding related to Canada Research Chairs (shown as inter-fund revenue). See Figure 68-B for a breakdown of operating expenses by type. 68-A
Visit
Figure
Endowment
($000s) 2022-23Budget 2021-22Budget 2020-21Actual Revenue 593 587 546 Personnel costs (22,854) 96.5% (23,076) 96.8% (22,319) 97.0% Operating costs (827) 3.5% (769) 3.2% (684) 3.0% Total costs (23,681) 100% (23,845) 100% (23,003) 100% Net (23,088) (23,258) (22,457) FTE – faculty (1) 89.9 93.3 FTE – LTA/ILTA faculty (1) 2.2 3.5 FTE – staff (2) 29.9 30.1 Non-unionSAOtherC instructors CUPEFaculty*4207 – Unit 1 OSSTFAdmin/professional 0.2 4.7 2.0 14.1 74.874 3.26 1.0 Figure 68-D: 2022-23 Budget personnel costs (including benefits) (%) Figure 68-C 2022-23Budget 2021-22Actual 2020-21Actual 2019-20Actual Undergraduate average class size Overall 32.3 32.8 33.2 Year 1 67.3 63.9 69.0 Year 2 31.4 32.7 31.8 Year 3 19.2 19.3 18.4 Year 4 10.4 11.3 9.7 Headcount by major (3) 1,957 1,914 1,885 1,879 FTE by Undergraduatemajor(4) 1,717 1,688 1,667 Graduate 60 60 57 Source: Institutional Analysis *Note: BUFA positions, BUFA overload and Associate Deans. Funding of professional expense reimbursement (PER) accounts Purchased services Other operating costs Inter-fund expenses (other than PER) RTravelepair and maintenance and capital Internalreplacementchargeback expense Figure 68-B: 2022-23 Operating costs (%) 39 20 14 7 7 7 6 Figure 68-B: 2022-23 Operating costs (%) Figure 68-D: 2022-23 Budget personnel costs (including benefits) (%) (1) Full-time equivalent (FTE) faculty/librarians represents Brock University Faculty Association (BUFA) probationary and tenured faculty and Associate Deans (both filled and unfilled positions). LTA/ILTA represents BUFA limited-term and instructional limited-term faculty appointments. Faculty on sabbatical are represented as one FTE. (2) FTE – staff represents evaluated salaried staff positions and ongoing CUPE 1295 positions (both filled and unfilled). (3) See Figure 13 in 'The Big Picture' pullout for explanation of the figures reported. (4) See Figure 14 in ‘The Big Picture’ pullout for explanation of the figures reported.
Faculty of Humanities


Budget personnel costs (including benefits) (%) Faculty of
and courses to provide knowledge and hands-on experiences
in many ways,
The Faculty of Mathematics and Science (FMS) develops and delivers programs (many with a co-op option) that serve as a strong foundation its students. FMS aligns to the Institutional Strategic Plan including by having a culture that focuses on multidisciplinary and transdisciplinary approaches (as seen in Neuroscience, Biotechnology, etc.); being a leader in bringing in funding from a wide range of sources to support research infrastructure and capacity; and having researchers' work in a wide range of areas with local and global impact, ranging from pharmaceutical development to grape and wine innovation. FMS also supports Indigenous students through the Indigenous Entrance Awards created through the FMS Dean Strategic Discretionary Fund. In total, 15 students can now access award funding totaling $0.11 million. FMS is also home to the Yousef Haj-Ahmad Department of Engineering. Brock is one of only three universities in Canada to offer Integrated Engineering, an approach to engineering education tailor-made to address emerging needs and challenges in the engineering field. Visit brocku.ca/mathematics-science Note: Revenue includes $1.56 million ($0.35 million in 2021-22) of funding from strategic funds for Engineering and $0.23 million ($0.30 million in 2021-22) funding related to Canada Research Chairs (shown as inter-fund revenue). See Figure 69-B for a breakdown of operating expenses by type. Starting in 2021-22, International student program (ISP) revenue is reported in the University Global responsibility centre. ISP revenue of $0.18 million was included as part of FMS' 2020-21 Actuals.
(1) Full-time equivalent (FTE) faculty/librarians represents Brock University Faculty Association (BUFA) probationary and tenured faculty and Associate Deans (both filled and unfilled positions). LTA/ILTA represents BUFA limited-term and instructional limited-term faculty appointments. Faculty on sabbatical are represented as one FTE.
Operating costs (%)
for
and Science
(2) FTE – staff represents evaluated salaried staff positions and ongoing CUPE 1295 positions (both filled and unfilled). (3) See Figure 13 in 'The Big Picture' pullout for explanation of the figures reported. (4) See Figure 14 in ‘The Big Picture’ pullout for explanation of the figures reported.
ReportBudget2022-23 48SNAPSHOTS Repair and maintenance and capital Fundingreplacementofprofessional expense reimbursement (PER) accounts Other operating costs Scholarships and student awards Internal chargeback expense Purchased services Inter-fund expenses (other than PER) Travel Figure 69-B: 2022-23 Operating costs (%) 35 20 16 3 3 7 3 13 Figure 69-A ($000s) 2022-23Budget 2021-22Budget 2020-21Actual Revenue 2,638 875 603 Personnel costs (24,116) 95.9% (23,385) 96.1% (20,905) 95.9% Operating costs (1,022) 4.1% (941) 3.9% (887) 4.1% Total costs (25,138) 100% (24,326) 100% (21,792) 100% Net (22,500) (23,451) (21,189) FTE – faculty (1) 79.5 73.4 FTE – LTA/ILTA faculty (1) 4.3 4.0 FTE – staff (2) 51.3 51.2 Figure 69-C 2022-23Budget 2021-22Actual 2020-21Actual 2019-20Actual Undergraduate average class size Overall 83.9 94.9 102.9 Year 1 220.9 243.6 272.8 Year 2 47.7 58.0 54.0 Year 3 32.8 33.9 32.3 Year 4 20.8 24.2 17.3 Headcount by major (3) 2,521 2,420 2,449 2,474 FTE by Undergraduatemajor(4) 2,107 2,174 2,110 Graduate 177 163 192 Source: Institutional Analysis CUPEAdmin/prFaculty*ofessional4207–Unit1 OtheSAOSSTFCr 74 7 0.1 70.0 11.3 1.1 14.5 3.06 Figure 69-D: 2022-23 Budget personnel costs (including benefits) (%) *Note: BUFA positions, BUFA overload and Associate Deans.
Figure 69-B: 2022-23
Figure 69-D: 2022-23 Mathematics


for
49 ReportBudget2022-23 SNAPSHOTS Faculty of Social Sciences
Brock’s largest Faculty offers cutting-edge programs and diverse experiential learning opportunities, providing students with opportunities to push boundaries while developing the tools required to succeed in an ever-changing world. Home to both new and emerging fields of study, including environmental sustainability, politics, economics, psychology, labour studies, communication theory and business communications, applied disability studies, child and youth studies, social justice, applied linguistics, popular culture and film studies, geography and tourism, gender studies, and sociology, the Faculty of Social Sciences prepares students for multiple career paths. An emphasis on understanding complex phenomena through a variety of lenses helps students become innovative, engaged citizens ready to tackle the problems that matter most to them. Highlights of our strategic investments that promote institutional priorities include certificate program development; enhanced course offerings in blended, online and accelerated formats; and additional cohorts in professional accreditation programs. These initiatives increase accessibility for part-time students, provide opportunities for adult learners and promote community outreach. Visit brocku.ca/social-sciences/ Note: Revenue includes $0.31 million ($0.31 million in 2021-22) funding related to Canada Research Chairs (shown as inter-fund revenue). See Figure 70-B a breakdown of operating expenses by type. 70-A ($000s) 2022-23Budget 2021-22Budget
Figure
2020-21Actual Revenue 644 321 405 Personnel costs (39,296) 97.4% (38,161) 97.2% (37,717) 97.5% Operating costs (1,031) 2.6% (1,099) 2.8% (958) 2.5% Total costs (40,327) 100% (39,260) 100% (38,675) 100% Net (39,683) (38,939) (38,270) OG FTE – faculty (1) 154.9 153.3 FTE – LTA/ILTA faculty (1) 10.3 10.8 OG FTE – staff (2) 43.5 41.1 Figure 70-C 2022-23Budget 2021-22Actual 2020-21Actual 2019-20Actual Undergraduate average class size Overall 73.1 75.3 77.7 Year 1 233.6 226.4 254.6 Year 2 98.3 105.2 98.6 Year 3 49.7 49.9 50.9 Year 4 21.4 21.2 21.6 Headcount by major (3) 5,487 5,362 5,543 5,827 FTE by Undergraduatemajor(4) 4,599 4,828 4,897 Graduate 409 412 404 Source: Institutional Analysis Figure 70-B: 2022-23 Operating costs(%) Funding of professional expense reimbursement (PER) accounts Other operating costs Scholarships and student awards Purchased services Inter-fund expenses (other than PER) InternalTravel chargeback expense Repair and maintenance and capital replacement 46 12 11 98 5 5 4 CUPEFaculty*4207 – Unit 1 Admin/professional SAOSSTFC 6 74 7 0.7 77.3 14.2 5.02.8 Figure 70-D: 2022-23 Budget personnel costs (including benefits) (%) *Note: BUFA positions, BUFA overload and Associate Deans. Figure 70-B: 2022-23 Operating costs (%) Figure 70-D: 2022-23 Budget personnel costs (including benefits) (%) (1) Full-time equivalent (FTE) faculty/librarians represents Brock University Faculty Association (BUFA) probationary and tenured faculty and Associate Deans (both filled and unfilled positions). LTA/ILTA represents BUFA limited-term and instructional limited-term faculty appointments. Faculty on sabbatical are represented as one FTE. (2) FTE – staff represents evaluated salaried staff positions and ongoing CUPE 1295 positions (both filled and unfilled). (3) See Figure 13 in 'The Big Picture' pullout for explanation of the figures reported. (4) See Figure 14 in ‘The Big Picture’ pullout for explanation of the figures reported.


(2) FTE – staff represents evaluated salaried staff positions and ongoing CUPE 1295 positions (both filled and unfilled).
ReportBudget2022-23 50SNAPSHOTS Academic support Faculty of Graduate Studies Faculty also advocates for graduate student needs and issues on campus. In alignment with the Institutional Strategic Plan, the Faculty hopes to offer a transformational and accessible academic and university experience to our graduate students, and enhance the life and vitality of our local region and beyond. For more information, visit brocku.ca/graduate-studies Note: Revenue includes $0.42 million ($0.35 million in 2021-22) from the Ontario University Application Centre. Library Figure 72 ($000s) 2022-23Budget 2021-22Budget 2020-21Actual Revenue 126 181 303 Personnel costs (5,363) 47.7% (5,369) 48.5% (4,966) 47.4% Operating costs (5,871) 52.3% (5,692) 51.5% (5,521) 52.6% Total costs (11,234) 100% (11,061) 100% (10,487) 100% Net (11,108) (10,880) (10,184) FTE – faculty (1) 19.0 18.5 FTE – LTA/ILTA faculty (1) - 1.0 FTE – staff (2) 30.1 28.8 (1) Full-time equivalent (FTE) faculty/librarians represents Brock University Faculty Association (BUFA) probationary and tenured faculty and Associate Deans (both filled and unfilled positions). LTA/ILTA represents BUFA limited-term and instructional limited-term faculty appointments. Faculty on sabbatical are represented as one FTE.
(1) Full-time equivalent (FTE) faculty/librarians represents Brock University Faculty Association (BUFA) probationary and tenured faculty and Associate Deans (both filled and unfilled positions).
LTA/ILTA represents BUFA limited-term and instructional limited-term faculty appointments. Faculty on sabbatical are represented as one FTE. (2) FTE – staff represents evaluated salaried staff positions and ongoing CUPE 1295 positions (both filled and unfilled). Brock embraces integrative graduate education as a pathway to independence and a breadth of career options built on a foundation of collegial mentorship, collaboration, transparency and merit. Accordingly, our 52 graduate programs embrace contemporary issues, highlighting and pushing the boundaries of current thought, ongoing progress, and future developments across and between disciplines. The Faculty of Graduate Studies (the Faculty) has a critical role in meeting the Institutional Strategic Plan’s goal to build research capacity across the University, thereby positioning Brock as a key comprehensive university for the 21st century.
The Faculty is the centralized administrative and academic entity for the University’s graduate programs and therefore operate across all Faculties and is intimately involved in integrative recruitment and retention efforts for both undergraduate and graduate levels. The Faculty aligns with the Institutional Strategic Plan by ensuring these initiatives encourage inclusivity, accessibility, reconciliation and Thedecolonization.Facultyoversees
all graduate applications, admissions and registration, ongoing enrolment and records, funding, internal and external graduate scholarships and awards, and graduate student essential skills and professional development programming. In collaboration with Brock’s Graduate Council and the Senate Graduate Studies Committee, the Faculty ensures the development and enforcement of all relevant rules, regulations and policies concerning graduate studies. In collaboration with the Graduate Students’ Association, the The Brock University Library enriches teaching, learning and research at Brock through collaborative expertise, rich content and inclusive spaces. The Library supports student success by providing the competencies, tools and resources that learners need to excel in a changing environment; advances knowledge by providing access to scholarly information and through active engagement in the research lifecycle; and inspires discovery by fostering creative engagement with technology. The Brock University Library includes the James A. Gibson Library; the Map, Data and GIS Library; the Archives and Special Collections; and the Makerspace in the newly built Rankin Family Pavilion. The Library comprises six departments and a staff of 49, of whom 19 are professional librarians. The Brock Library's strategic plan has four strategic pillars highlighting student success; the research lifecycle; community engagement; and strengthening capacity. For more information, visit brocku.ca/library Note: Operating costs include $5.45 million of library acquisitions ($5.22 million in 2021-22), $0.12 million of this is offset by strategic funding revenue to support Engineering acquisitions.
Figure 71 ($000s) 2022-23Budget 2021-22Budget 2020-21Actual Revenue 460 361 531 Personnel costs (1,730) 90.6% (1,415) 89.8% (1,388) 90.7% Operating costs (180) 9.4% (160) 10.2% (142) 9.3% Total costs (1,910) 100% (1,575) 100% (1,530) 100% Net (1,450) (1,214) (999) FTE – faculty (1) 1.0 1.0 FTE – staff (2) 16.6 14.0
* The above costs do not reflect the direct revenue or expenses of research, nor do they reflect the research portion of Faculty members’ salary and benefits (typically 40 per cent) and other overheadrelated costs. Faculty members’ salary and benefits are reflected in the teaching Faculties.
Funding in the 2022-23 budget includes $2.28 million of grant revenue related to the Research Support Fund ($2.09 million in 2021-22). Operating costs include $0.60 million of funding for VPR Research Excellence support ($0.65 million in 2021-22), $1.15 million of funding for start-up funds and related costs for new faculty members and librarians ($0.68 million in 2021-22), and $0.65 million of funding for CCOVI and the transdisciplinary research institutes ($0.66 million in 2021-22). Enterprise Figure 73-A ($000s) 2022-23Budget 2021-22Budget 2020-21Actual Revenue 3,977 2,760 2,686 Personnel costs (2,797) 42.6% (2,271) 43.0% (1,942) 30.4% Operating costs (3,776) 57.4% (3,016) 57.0% (4,446) 69.6% Total costs (6,573) 100% (5,287) 100% (6,388) 100% Net* (2,596) (2,527) (3,702) FTE – staff (1) 29.3 26.1 (1) FTE – staff represents evaluated salaried staff positions and ongoing CUPE 1295 positions (both filled and unfilled).
Research Services Funding
Animal
10 58 8
Figure 73-B: 2022-23 total costs by cost centre (%)
The Brock LINC aims to foster a culture of creativity and innovation, grow entrepreneurship, and support research innovation and capacity at the University. Programs and services support users through the innovation journey. For more information, visit brocku.ca/linc/ CCOVI is Brock’s flagship transdisciplinary institute. It defines a place, not only within the University, to network faculty, students, and staff dedicated to advancing the Canadian grape and wine industry. It extends to partnering academic communities, federal and provincial government research organizations, and regional grape and wine industry groups across Canada, as well as cool climate wine regions around the world. For information about CCOVI, visit brocku.ca/ccovi Brock continues to support several other transdisciplinary research institutes: Brock–Niagara Validation, Prototyping and Manufacturing Institute (VPMI); Canada–Caribbean Institute; Institute for Lifespan Development Research; Niagara Community Observatory; and Social Justice Research Institute. Find out more at brocku.ca/research-at-brock/institutes-and-centres/
The Research Enterprise supports Brock’s strategic priority of advancing research capacity across the University. The offices continuously strive to enhance service to researchers and the broader community by identifying opportunities for improving process efficiencies and reducing timelines. The 2022-23 budget includes measures to improve operations through personnel and software advancements. The Research Enterprise units are working to establish a focal point for funders, industry, community groups and researchers to connect and build awareness of Brock University as a centre of research excellence. ORS staff assist researchers in crafting grant proposals, administer contracts and funding, and provide support for commercialization and intellectual property management. A major portion of the ORS budget is devoted to internal funding for research activities. The Office of Research Ethics (ORE) supports research involving humans and Animal Care Services supports research involving animals. For information about these offices, visit brocku.ca/research of internal research grants Faculty Start-up, recruitment, CCOrelocationVIand Research Institutes Care Brock LINC Research
ReportBudget2022-23 51SNAPSHOTS
Research
The Research Enterprise includes the Office of Research Services (ORS), Animal Care Services, the Office of Research Ethics, the Brock LINC innovation and entrepreneurship hub, and funding for transdisciplinary research and activities, including the Cool Climate Oenology and Viticulture Institute (CCOVI). (Note: Costs related to the Office of the Vice-President, Research are included in the Senior Academic and Administration Team responsibility centre.)
Figure 73-B: 2022-23 total costs by cost centre (%) 34 17 18
Ethics
ReportBudget2022-23 52SNAPSHOTS Centre for Pedagogical Innovation Figure 74 ($000s) 2022-23Budget 2021-22Budget 2020-21Actual Revenue 68 25 152 Personnel costs (939) 96.4% (910) 95.6% (933) 80.0% Operating costs (35) 3.6% (42) 4.4% (233) 20.0% Total costs (974) 100% (952) 100% (1,166) 100% Net (906) (927) (1,014) FTE – staff (1) 11.0 11.0 (1) FTE – staff represents evaluated salaried staff positions and ongoing CUPE 1295 positions (both filled and unfilled).
For the purpose of this report, the Professional and Continuing Studies and ESL unit is comprised of Professional and Continuing Studies (PCS) and English as a Second Language (ESL) Services. PCS supports one of the Institutional Strategic Plan’s goals of ‘Expanding Brock’s lifelong learning opportunities for our students and members of the community.’ This includes flexible and inclusive courses and program delivery formats, expanding and formalizing responsibilities for lifelong learning such as part-time degree offerings and professional development opportunities, and creating initiatives that further skills for working professionals (micro credentialing) and offer learning opportunities for older adults. For information about PCS, visit brocku.ca/continuing-education
ESL supports the Institutional Strategic Plan and Brock’s goals for internationalization. ESL Services is a path for international students and those with English as an Additional Language (EAL) to gain essential language skills, which facilitates their successful participation in Brock’s undergraduate programs. For information on ESL Services, visit brocku.ca/esl-services
The Centre for Pedagogical Innovation (CPI), as defined in the 2022-23 budget, includes teaching and learning advancement and online learning. CPI is committed to fostering a culture of excellence in teaching and learning across the University. Through educational outreach and services to Brock faculty, instructors, teaching assistants and staff, CPI brings people together to explore effective teaching and learning practices, as well as innovative pedagogies, both in the classroom and online. CPI also assists departments and instructors in the design, development and delivery of online and blended courses and programs. For more information, visit brocku.ca/pedagogical-innovation/
Professional and Continuing Studies and ESL
Note: Included in revenue is $1.5 million of strategic funding to offset the start-up costs of PCS. Figure 75-B: 2022-23 total costs by cost centre (%) 59 41 Professional and Continuing Studies English as a Second Language (ESL) Figure 75-B: 2022-23 total costs by cost centre (%) Figure 75-A ($000s) 2022-23Budget 2021-22Budget 2020-21Actual Revenue 2,556 1,369 1,218 Personnel costs (1,834) 72.3% (1,014) 84.2% (1,329) 91.5% Operating costs (701) 27.7% (190) 15.8% (123) 8.5%
Total costs (2,535) 100% (1,204) 100% (1,452) 100% Net 21 165 (234) FTE – staff (1) 16.0 10.5 (1) FTE – staff represents evaluated salaried staff positions and ongoing CUPE 1295 positions (both filled and unfilled).

ReportBudget2022-23 53SNAPSHOTS Office of the Registrar Figure 76-A ($000s) 2022-23Budget 2021-22Budget 2020-21Actual Revenue 2,464 2,225 2,671 Personnel costs (5,811) 64.6% (5,735) 70.0% (5,103) 70.4% Operating costs (3,185) 35.4% (2,453) 30.0% (2,146) 29.6% Total costs (8,996) 100% (8,188) 100% (7,249) 100% Net (6,532) (5,963) (4,578) FTE – staff (1) 72.4 71.0 (1) FTE – staff represents evaluated salaried staff positions and ongoing CUPE 1295 positions (both filled and unfilled). Student specific The Office of the Registrar supports the Institutional Strategic Plan by providing a wide range of enrolment services that include national and international recruitment, admissions, front-line services (Brock Central), registration, curriculum management support, maintenance and enhancement of the student information system, examinations and scheduling, grade reporting, degree audit, student transfers and articulation agreements, and Convocation. It issues official academic documents and is responsible for maintaining the integrity of the University’s student academic record. For information on the Office of the Registrar, visit brocku.ca/registrar Note: Revenue includes $1.45 million ($1.28 million in 2021-22) from the Ontario Universities' Application Centre and $0.26 million ($0.22 million in 2021-22) in grant revenue related to the Credit Transfer Institutional Grant. Operating costs include $0.11 million of capital replacement and repairs and maintenance costs ($0.18 million in 2021-22) as well as $1.53 million ($1.11 million in 2021-22) of contracted services mainly related to international student recruitment commissions. Office of The Registrar International Market Development Recruitment and Liaison Credit Transfer Convocation Figure 76-B: 2022-23 total costs by cost centre (%) 43 30 23 3 1 76-B: 2022-23 total costs by cost centre (%)

Student Wellness and Accessibility
Figure 77-B: 2022-23 total costs by cost centre (%) Student Accessibility Services Health Services Personal Counseling Health StudentPromotionWellnessand Accessibility Administration
Student Accessibility Services supports students with disabilities and medical conditions (physical and mental), as well as learning and sensory disabilities during their time at the University. Staff work with students to develop individualized accommodation plans based on documented disability-related needs. They also provide individualized and group support to build students’ self-advocacy skills and learning strategies in keeping with their strengths.
Figure 77-B: 2022-23 total costs by cost centre (%) 40 34 20 33
Student Health Services offers a diverse range of health-care services. Primary care is available to students at the main campus in two locations – Campus Pharmacy and Harrison Hall, as well as Marilyn I. Walker School of Fine and Performing Arts and the Hamilton campus; services include physical exams, sexual and reproductive health, first aid for injuries, mental health, wellness counselling, injections, prescriptions, COVID vaccinations and referrals to other health professionals and services.
Personal Counselling Services offers students individual, group and crisis counselling. These services are provided by professional therapists employed by Brock as well as contracted through a purchase of services agreement with LifeWorks (formerly Morneau Shepell), Canadian Mental Health Association of Niagara and Community Addiction Services of Niagara. Students can also access intensive supports through our From Intention to Action (FITA) program. The Health Promotion team provides information, programming and outreach for students in important aspects of student life, such as stress management, healthy relationships and physical and mental wellness. Note: Revenue includes $1.15 million ($1.09 million in 2021-22) of student ancillary fees and $1.04 million ($1.28 million in 2021-22) of grant revenue related to a number of MCU grants, including the Access Fund for Students with Disabilities. Operating costs include $1.21 million ($1.06 million in 2021-22) of professional fees and contracted services, including physicians and counselling services. Figure 77-A ($000s) 2022-23Budget 2021-22Budget 2020-21Actual Revenue 3,017 3,089 2,879 Personnel costs (4,072) 74.4% (3,511) 73.8% (3,212) 71.9% Operating costs (1,400) 25.6% (1,244) 26.2% (1,254) 28.1% Total costs (5,472) 100% (4,755) 100% (4,466) 100% Net (2,455) (1,666) (1,587) FTE – staff (1) 46.2 36.9 (1) FTE – staff represents evaluated salaried staff positions and ongoing CUPE 1295 positions (both filled and unfilled). The team at the Student Wellness and Accessibility Centre (SWAC) are driven by the vision of health, wellness and personal success for all students. The team consists of Student Health, Health Promotion, Counselling and Accessibility Services. Our unit supports the Institutional Strategic Plan by supporting a transformational and accessible academic and university experience; enhancing the life and vitality of our local region and beyond through community partnerships; and fostering a culture of inclusivity, accessibility, reconciliation and decolonization. Operations are supported through grants from BUSU, GSA, MCU and the Niagara Community Foundation. For more information, visit brocku.ca/health-wellness-accessibility
54 ReportBudget2022-23
SNAPSHOTS


ReportBudget2022-23 SNAPSHOTS
Figure 78-B: 2022-23 total costs by cost centre (%) Student Life and Success Student Affairs Faith And Life 85 213 Figure 78-B: 2022-23 total costs by cost centre (%)
55
Student Life and Success (SLS) is comprised of Student Life, Student Affairs, A-Z Learning Services, and Faith and Life. Our department supports the Institutional Strategic Plan by offering programming and services that support student success both academically and outside the classroom. Student Life offers programs and services that support student success through co-curricular learning activities, campus involvement, leadership development, community engagement and off-campus living. Student Affairs is committed to providing a safe living and learning environment that promotes student success. The Student Affairs team is responsible for overseeing several policies and services, including supporting students-at-risk, administering the Student Code of Conduct and offering mediation services.
Student Life and Success Figure 78-A ($000s) 2022-23Budget 2021-22Budget 2020-21Actual Revenue 666 604 366 Personnel costs (1,810) 82.9% (1,748) 86.7% (1,649) 92.8% Operating costs (373) 17.1% (268) 13.3% (128) 7.2% Total costs (2,183) 100% (2,016) 100% (1,777) 100% Net (1,517) (1,412) (1,411) FTE – staff (1) 18.0 18.4 (1) FTE – staff represents evaluated salaried staff positions and ongoing CUPE 1295 positions (both filled and unfilled). A-Z Learning Services helps Brock students with a broad range of academic challenges as they transition to and progress through their university life. Workshops and drop-in services are available throughout the year to help students with time management, note-taking, writing, math and science, exam preparation and more. Faith and Life provides opportunities for friendship, education, spiritual counselling and personal growth. For more information, visit brocku.ca/student-life-success Note: Revenue includes $0.23 million ($0.17 million in 2021-22) of grant revenue related to the Ontario PostSecondary Access and Inclusion Program and $0.33 million ($0.32 million in 2021-22) of program fee revenue as part of services offered.


ReportBudget2022-23 56SNAPSHOTS Brock International Services Figure 79-A ($000s) 2022-23Budget 2021-22Budget 2020-21Actual Revenue 106 194 175 Personnel costs (1,381) 87.7% (1,467) 81.6% (1,039) 77.1% Operating costs (194) 12.3% (331) 18.4% (309) 22.9% Total costs (1,575) 100% (1,798) 100% (1,348) 100% Net (1,469) (1,604) (1,173) FTE – staff (1) 15.0 15.6 (1) FTE –staff represents evaluated salaried staff positions and ongoing CUPE 1295 positions (both filled and unfilled). Aboriginal Student Services Brock International Services supports the Institutional Strategic Plan through the facilitation of strategic global partnerships and support services for Brock students and scholars. Brock International Services is responsible for: • Provision of programs, activities and services that support student well-being, success, career transition, settlement, and immigration that are specifically tailored to the needs of the international student community • Developing partnerships and agreements that increase Brock’s global reach and engagement • Increasing access to global learning opportunities for students and scholars through exchange, mobility programs and international co-operation • Fostering a culture of inclusivity and community engagement For more information on Brock International Student Services, visit brocku.ca/international/international-services Figure 80 ($000s) 2022-23Budget 2021-22Budget 2020-21Actual Revenue 369 369 343 Personnel costs (336) 91.1% (342) 91.7% (254) 70.2% Operating costs (33) 8.9% (31) 8.3% (108) 29.8% Total costs (369) 100% (373) 100% (362) 100% Net - (4) (19) FTE – staff (1) 4.0 4.0 (1) FTE – staff represents evaluated salaried staff positions and ongoing CUPE 1295 positions (both filled and Aboriginalunfilled).Student Services is dedicated to helping all Aboriginal students, including First Nations, Métis and Inuit, to make the transition to the Brock University community, and to be successful in their program of study. Support and resources are provided to enhance students’ academic, cultural, personal and spiritual life at Brock in a culturally sensitive manner. For more information, visit brocku.ca/aboriginal-student-services Note: Revenue includes $0.34 million ($0.34 million in 2021-22) of grant revenue related to the Indigenous Student Success Fund.


ReportBudget2022-23 57SNAPSHOTS
Figure 81-B: 2022-23 total costs by cost centre (%) Co-op GoodmanExperientialEducationCCampusEducationCareerEducationo-op,CareerandExperiential–AdministrationEducationCareerEducation41 23 17 6 Figure 81-B: 2022-23 total costs by cost centre (%)
13
Co-op, Career and Experiential Education (CCEE) supports the Institutional Strategic Plan and Strategic Mandate Agreement with the Ontario government. CCEE is the overarching department for student and new graduate employment, experiential education, and career development on campus – both for undergraduate and graduate students. The department consists of the following operational areas: Co-operative Education, Career Education (Campus and Goodman Career Education), and Experiential Education. A team of dedicated human resources, career development and experiential professionals work with students, employers, faculty, and community members to support their employment and/or experiential needs. For more information, visit brocku.ca/ccee Co-operative Education offers a valuable opportunity for students to enhance their education by acquiring career-related work experience before graduation. Undergraduate and graduate students gain practical experience, develop a network of contacts and obtain a better understanding of careers in their field.
Figure 81-A ($000s) 2022-23Budget 2021-22Budget 2020-21Actual Revenue 2,419 2,289 3,027 Personnel costs (3,911) 91.0% (3,778) 89.6% (3,731) 81.6% Operating costs (388) 9.0% (440) 10.4% (844) 18.4% Total costs (4,299) 100% (4,218) 100% (4,575) 100% Net (1,880) (1,929) (1,548) FTE – staff (1) 44.6 41.9 (1) FTE – staff represents evaluated salaried staff positions and ongoing CUPE 1295 positions (both filled and unfilled). Career Education offers career exploration and development information and resources to support students and alumni. In addition, Career Education provides employers and community members with information and services about on-campus recruiting and talent brand opportunities. Included in the Career Education unit is also Goodman Career ExperientialEducation.Education promotes faculty, staff, students and community partners working together to provide opportunities for students to apply their classroom learning through hands-on experience. Undergraduate and graduate students reflect on their experiences to build skills, realize competencies, and contribute to the community, to prepare for their careers and build beneficial connections. Experiential opportunities include internships, placements, field courses, service learning, labs and more, and are available in every Faculty at Brock. Note: Revenue includes $1.90 million ($1.85 million in 2021-22) of co-op student fees. In addition, co-operative education students pay tuition (applicable half-credit fee for each work term). However, like the Faculties, the revenue shown in the units does not include the allocation of Global tuition. Operating costs include $0.15 million ($0.15 million in 2021-22) of repairs and maintenance and capital replacement costs, mainly related computer software and licences.
Co-op, Career and Experiential Education

Brock Sports and Recreation Figure 82-A ($000s) 2022-23Budget 2021-22Budget 2020-21Actual Revenue 6,647 6,189 2,912 Personnel costs (5,440) 66.3% (4,921) 66.0% (3,362) 90.0% Operating costs (2,761) 33.7% (2,538) 34.0% (374) 10.0% Total costs (8,201) 100% (7,459) 100% (3,736) 100% Net (1,554) (1,270) (824) FTE – staff (1) 38.9 36.1 (1) FTE – staff represents evaluated salaried staff positions and ongoing CUPE 1295 positions (both filled and unfilled). lifeguard training), camps and programming for children and youth, school-based programs and community adult memberships for aquatics and fitness. For information on programming, visit brocku.ca/recreation Note: Revenue includes $3.62 million ($3.42 million in 2021-22) of student ancillary fees and $2.53 million ($2.13 million in 2021-22) of sales and services revenue, including program/activity and instructional fees related to schoolbased programs, Youth University camps, aquatics programs, other youth and community-based programming and intramurals, Badgers men’s and women’s teams, and Badgers Sports Camp programs. Operating costs include $0.51 million ($0.32 million in 2021-22) of repairs and maintenance and capital replacement costs and $0.42 ($0.57 in 2021-22) of purchased services.
ReportBudget2022-23 58SNAPSHOTS
Figure 82-B: 2022-23 total costs by cost centre (%) 59 41 Brock Sports Brock Recreation Figure 82-B: 2022-23 total costs by cost centre (%)
Brock Sports takes a leadership role and engages the community through sporting events and activities, tournaments, community partnerships, and the Badgers Sports Camp programs. Badgers men’s and women’s teams provide more than 900 students with the opportunity to participate in OUA and USPORTS competitions. Brock Sports also runs the Brock Sports Performance Centre and the Brock Sports Medicine Clinic. For more information, visit gobadgers.ca Brock Recreation provides programming for students including a wide variety of intramural activities, group and individual fitness programs, aquatics, open recreation opportunities, certification courses and leadership courses. The department also provides community-based programming, including all levels of aquatic programs (learn to swim through competitive club swimming and


Ancillary Operations
Ancillary Services identifies its core pillars as customer, value, simplicity and people. As part of the core pillars, the mission is to support learning through engaged experiences, and the vision is to provide experiences that exceed expectations. Ancillary Services has the unique opportunity to provide student experiences that enhance the life and vitality of our local region and provide opportunities to generate and mobilize knowledge through all Theunits.2022-23
Fiscal Framework Update provided guidance for Ancillary operations to fully fund all capital improvements and additions, fund a deferred maintenance reserve and grow their surplus contribution towards the University budget by four per cent each year. The global pandemic has impacted the Ancillary operations more than any other area within the University from a financial perspective. Even as the pandemic continues, operations on campus have significantly resumed, allowing the budgeted Ancillary and Residence contribution in the 2022-23 to increase 22 per cent from the 2021-22 budget to $3.93 million. This budget also includes funding of the debt related to the ancillary/residence student experience project of $3.2 million. There remains risk to this budget should public health restrictions return because of negative developments from the global pandemic.
Conference and Event Services
With an experienced team of conference and event co-ordinators, and facilities for every occasion, Brock Conference and Event Services delivers exceptional experiences one event at a time. Focused on the customer, conference co-ordinators simplify the event management process making Brock University the ideal place to facilitate knowledge exchange by hosting local, national and international symposia. For more information, visit brocku.ca/conference-services/ Parking Services
As the first touchpoint for many campus guests, Parking Services manages the issuance of permits, parking pay systems, maintenance, special event parking, parking lot enforcement and ticket appeals on campus. Committed to excellent customer service, Parking Services works with partners across campus and local transit providers to ensure a positive, safe and accessible experience for all customers travelling to campus. Parking Services continues to provide free parking weeknights, weekends and all of spring and summer for Zone 1 and Zone 2 lots as part of an initiative to make the campus more accessible to the Brock University community and visitors. For more information, visit brocku.ca/parking-services/
Note: Included in internal chargeback expenses is a $0.40 million ($0.24 million in 2021-22) contribution to the capital and related projects budget and $0.18 million ($0.20 million in 2021-22) of funding of debt payments related to the ancillary/residence student experience projects.
Ancillary Services is comprised of Residence Services, Dining Services, Campus Store, Parking Services and Brock Card. Campus Development Services and Community Agreements, described on page 69 of this report, are also managed as part of Ancillary Services.
The Campus Store manages the retail environment on campus as the primary retailer at Brock University. It includes everything from textbooks and tools required to offer a transformational and accessible academic and university experience, to your favourite Brock or Badger sweatshirt. The Campus Store is committed to leveraging the purchasing power of Brock to ensure it is providing affordable options that meet the needs of its customers. For more information, visit campusstore.brocku.ca Note: Operating costs include $4.67 million ($4.49 million in 2021-22) of cost of sales. Ancillary
ReportBudget2022-23 59SNAPSHOTS
Campus Store

services and
Dining Services is committed to providing seamless and comprehensive services and choices, while supporting a healthy and sustainable university environment
Figure 83 ($000s) Campus Store Parking Services Conference and Event Services Dining Services and Brock Card AVPServicesAncillary TotalOperationsAncillary 2022-23 Budget Revenue 6,615 3,729 697 3,143 14,184 Personnel costs (882) (467) (361) (413) (687) (2,810) Operating costs* (5,315) (998) (492) (1,838) (203) (8,846) Total costs (6,197) (1,465) (853) (2,251) (890) (11,656) Net 418 2,264 (156) 892 (890) 2,528 2021-22 Budget Revenue 6,296 3,621 2,391 129 12,437 Personnel costs (850) (538) (257) (398) (808) (2,851) Operating costs* (5,050) (849) (46) (1,656) (244) (7,845) Total costs (5,900) (1,387) (303) (2,054) (1,052) (10,696) Net 396 2,234 (303) 337 (923) 1,741 2020-21 Actual Revenue 5,597 295 (9) 91 5,974 Personnel costs (758) (268) (329) (323) (813) (2,491) Operating costs* (5,079) (428) (30) (740) (59) (6,336) Total costs (5,837) (696) (359) (1,063) (872) (8,827) Net (240) (401)
(2,853) OG FTE – Staff (1) Budget 2022-23 7.9 3.4 3.6 3.6 7.0 25.5 Budget 2021-22 8.4 4.1 2.8 4.0 8.0 27.3 (1) FTE – staff represents evaluated salaried staff positions and ongoing CUPE 1295 positions (both filled and unfilled). * Included in operating costs is cost of sales (COS.) Operating costs do not include allocated costs such as lighting, security, etc.
Dining Services and Brock Card
Valuing healthy, quality and convenient food options to fuel the mind, as well as special dietary needs, Dining Services operates eight locations, as well as catering and vending. Dining Services also manages all food and beverage contracts with external vendors and brings new brands to campus to meet the needs of today's students.
The Brock Card is the official identification (ID) card for students, faculty and staff at the University. The Brock Card functions primarily as Brock ID and as a payment card on campus and with community partners. In addition, the Brock Card serves many other purposes, such as a campus recreation centre membership card, a transit card (when affixed with a current bus pass sticker), meal plan card, door access, and it is used to control access to specific areas/buildings on campus. more information, visit brocku.ca/dining-services/ Note: Operating costs include $0.11 million ($0.72 million in 2021-22) of repairs maintenance and capital replacement costs; $0.11 million ($0.16 million in 2021-22) of contracted professional fees, and $0.18 million ($0.25 million in 2021-22) of funding of debt payments related to the ancillary/residence student experience projects. (368) (872)
For
(972)
and
ReportBudget2022-23 60SNAPSHOTS

Figure 84-B: 2022-23 total revenue by cost centre
Village Residence DeCew Residence Residence Lowenberger8 Residence Quarryview Residence Earp Residence Vallee GatewayResidenceResidence1430 12 1011 9 11 3
Residence Services
Also, all bedrooms, washrooms and common lounges have been fully renovated. The residence system at Brock will be able to accommodate almost 2,800 students, should we be at 100 per cent capacity. A reduced occupancy plan to 94 per cent has been budgeted for 2022-23, in case there is a reduction in demand due to concerns related to the COVID-19 pandemic. For more information, visit brocku.ca/residence Figure 84-A ($000s) 2022-23Budget 2021-22Budget 2020-21Actual Revenue 24,158 19,087 3,708 Personnel costs (4,477) 19.7% (3,478) 18.9% (2,232) 18.3% Operating costs (18,284) 80.3% (14,950) 81.1% (9,963) 81.7% Total costs (22,761) 100% (18,428) 100% (12,195) 100% Net 1,397 659 (8,487) FTE – staff (1) 43.6 33.7 (1) FTE – staff represents evaluated salaried staff positions and ongoing CUPE 1295 positions (both filled and unfilled).
ReportBudget2022-23 61SNAPSHOTS
Note: Revenue includes $23.79 million ($18.89 million in 2021-22) of residence fees. Operating costs include $2.18 million ($2.00 million in 2021-22) of purchased services, mainly related to residence annual lease payments and contracted services; $0.55 million ($0.53 million in 2021-22) of direct utility costs and $1.71 million ($1.71 million in 2021-22) of utility costs charged back to Residences; $4.43 million ($4.43 million in 2021-22) of debt payments and $1.48 million ($1.11 million in 2021-22) of repairs and maintenance and capital replacement costs. Residence’s internal chargeback expense also includes a contribution to the capital and related projects budget of $3.62 million ($3.77 million in 2021-22) as well as a contribution to the financing of the 2020 bond of $2.85 million.
Figure 84-B: 2022-23 total revenue by cost centre (%)
There are four semi-suite style residences, two townhouse complexes, one apartment style building and one traditional style residence. This includes the opening of our newest residence, Residence 8, which opened in January 2022. This six storey semi-suite building will accommodate 308 students, all in single rooms, as well as provide common lounges and study rooms throughout.
The traditional residence, DeCew, underwent significant renovations that were completed in spring 2021. The DeCew renewal project creates new community gathering places that will support the generation and mobilization of knowledge and a transformative student experience.


NOV. 18, 2021: Brock University Interim President Lynn Wells signs the Scarborough Charter, committing to address the realities of anti-Black racism. ReportBudget2022-23 62SNAPSHOTS Senior Academic and Administration Team As the University moves forward with the Institutional Strategic Plan, the University’s leadership is taking an active role in advancing the strategic priorities as set out in this plan. The Senior Academic and Administration Team, as defined in the 2022-23 budget report, represents a number of the offices of senior administration as well as the operating costs of the Board of Trustees and Senate. The senior administrative offices included are: the President; the Vice-President, Administration; the Provost and Vice-President, Academic; the Vice-President, Research; the Vice-Provost and Associate Vice-President, Academic; the Associate Vice-President, Students; the Vice-Provost, Indigenous Engagement; the Associate Vice-President, Advancement and External Relations; and the Vice-Provost, Teaching and Learning. Information Technology Services Shared services Figure 85 ($000s) 2022-23Budget 2021-22Budget 2020-21Actual Revenue 120 23 Personnel costs (4,370) 86.3% (4,166) 85.7% (3,823) 92.3% Operating costs (695) 13.7% (694) 14.3% (320) 7.7% Total costs (5,065) 100% (4,860) 100% (4,143) 100% Net (5,065) (4,740) (4,120) FTE – staff (1) 24.6 22.8 (1) FTE – staff represents evaluated salaried staff positions and ongoing CUPE 1295 positions (both filled and unfilled). Figure 86-A ($000s) 2022-23Budget 2021-22Budget 2020-21Actual Revenue 723 772 434 Personnel costs (6,874) 78.1% (6,690) 77.2% (5,578) 74.0% Operating costs (1,929) 21.9% (1,981) 22.8% (1,962) 26.0% Total costs (8,803) 100% (8,671) 100% (7,540) 100% Net (8,080) (7,899) (7,106) FTE – staff (1) 67.9 65.9 (1) FTE – staff represents evaluated salaried staff positions and ongoing CUPE 1295 positions (both filled and unfilled). Figure 86-B: 2022-23 total costs by cost centre (%) EnterpriseInfrastructureSystems Support Client Services Project and Administrative Support Office (PASO) 35 28 26 11 Figure 86-B: 2022-23 total costs by cost centre (%) In addition to the budget reported in the ITS responsibility centre, Information Technology Services' capital projects are budgeted in the Capital responsibility centre. Details of these expenditures can be found starting on page 75. Information Technology Services (ITS) is a trusted partner in the University’s teaching, learning, research, and administrative initiatives and in the broader Niagara community. Our mission is to foster collaboration and trust, develop and enhance a reliable technology-rich environment, provide secure and accessible systems, and continue promoting a service-oriented culture within ITS to support the Brock community. ITS is comprised of five teams: Enterprise Solutions, Client Services, IT Infrastructure, the Security team and the Project and Administrative Support Office (PASO). For more information on ITS, visit brocku.ca/information-technology Note: Revenue includes $0.39 million ($0.38 million 2021-22) of internal chargeback revenue related to the Residence Technology Fee. Operating costs include $0.67 million ($0.62 million in 2021-22) of purchased services, including internet services and $1.11 million ($1.17 million in 2021-22) of repairs and maintenance and capital replacement costs.

ReportBudget2022-23 63SNAPSHOTS
Financial Services is responsible for the efficient control, budgetary guidance and analytics of the financial activities of the University through development of the Fiscal Framework documents in support of the Institutional Strategic Plan. Financial Services also has shared responsibility for various operating units. Procurement Services, the Student Accounts and Financial Aid (SAFA) office, and Central Receiving and Mail Services are also part of Financial Services. For more information on Financial Services, visit brocku.ca/finance
Note: Operating costs include $0.56 million ($0.56 million in 2021-22) of legal fees and other professional fees and contracted services. Figure 87-A ($000s) 2022-23Budget 2021-22Budget 2020-21Actual Revenue 589 444 479 Personnel costs (3,003) 80.0% (3,031) 80.7% (2,999) 80.7% Operating costs (749) 20.0% (725) 19.3% (715) 19.3% Total costs (3,752) 100% (3,756) 100% (3,714) 100% Net (3,163) (3,312) (3,235) FTE – staff (1) 34.6 35.4 (1) FTE – staff represents evaluated salaried staff positions and ongoing CUPE
1295 positions (both filled and unfilled). Figure 88 ($000s) 2022-23Budget 2021-22Budget 2020-21Actual Revenue 374 206 199 Personnel costs (3,837) 83.6% (3,638) 82.9% (3,378) 87.0% Operating costs (752) 16.4% (753) 17.1% (504) 13.0% Total costs (4,589) 100% (4,391) 100% (3,882) 100% Net (4,215) (4,185) (3,683) FTE – staff (1) 39.2 36.0 (1) FTE – staff represents evaluated salaried staff positions and ongoing CUPE 1295 positions (both filled and unfilled). Figure 87-B: 2022-23 total costs by cost centre (%) Financial Services Procurement Services CSAFAentral Receiving and Mail Services Finance – University Wide 37 20 1319 11 Figure 87-B: 2022-23 total costs cost centre
Note: Operating costs include $0.12 million ($0.12 million in 2021-22) of financial expenditures, related to bank fees and service charges, and $0.34 million ($0.34 million in 2021-22) of audit fees and other professional fees and contracted services. Human Resources The Human Resources (HR) Department develops strategy and creates and administers programs, policies and procedures to effectively manage the employee life cycle, to support the creation of a sustainable, high-performing organization. Through HR's main portfolios of 1) HR Advising, Talent and Systems, 2) Faculty & Staff Relations, 3) EDI Culture and Education, 4) Organizational Design, Development and Learning, 5) Health, Safety and Wellness, and 6) HR Administration (including Compensation, Benefits, Pension and Payroll), the HR team focuses on attracting, retaining and developing the key talent needed to execute against the institution's four strategic priorities. The newly created (2022) position of Director, EDI Culture and Education provides innovative leadership over the development and implementation of critical institutional initiatives to advance Brock's equity, diversity and inclusion goals. As well, HR will continue to play an important role in creating and supporting a safe, welcoming and effective organizational culture. To learn more about HR and how they support faculty and staff, visit brocku.ca/human-resources.
Financial Services

staff represents evaluated salaried staff positions and ongoing CUPE 1295 positions (both filled and unfilled). Figure
staff represents evaluated salaried staff positions and ongoing
57.2% Operating costs (1,529) 48.3%
2022-23 total costs by cost centre (%)
(%) 70 30 Office of University Marketing and PrintingCommunicationsandDigitalServices
Development and Alumni Relations (Advancement and External Relations)
(%) Figure
($000s) 2022-23Budget 2021-22Budget 2020-21Actual Revenue 1,080 1,086 466 Personnel costs (1,634) 51.7%
100% Net
(1) 19.7 19.8 (1) FTE
100%
2022-23 total costs by cost
Figure
2020-21Actual Revenue 914 859 584 Personnel costs
1295 positions (both filled and unfilled).
Figure 89-B: 2022-23 cost centre
total costs by
(%) Development and Donor Relations Alumni DevelopmentRelationsand Alumni Operations Annual Fund from Telegrad Alumni Association 471134 7 1 Figure
total costs by cost
49.5%
(766) FTE
Note: Revenue includes $0.93 million ($0.92 million in 2021-22) of internal charges to other departments by PDS. As part of Advancement and External Relations, the Department of Development and Alumni Relations aligns with the Institutional Strategic Plan by raising funds for strategic plan fundraising priorities, including funding for the transformational student experience, enhancing research, and collaborating with partners from the local region and beyond to deliver philanthropic support. The department is responsible for Brock’s philanthropic activity, alumni engagement and maintaining records to stay in touch with Brock’s more than 100,000 alumni. The department works with donors who provide philanthropic support for University priorities, including capital projects, teaching and learning, technology and student support, as well as with the volunteer Brock University Alumni Association Board of Directors. For more information, visit brocku.ca/alumni Note: Revenue includes $0.35 million ($0.35 million in 2021-22) of affinity revenue. 90-A ($000s) 2022-23Budget 2021-22Budget (1,711) 81.3% (1,542) 76.8% (1,094) 81.1% (394) 18.7% (465) 23.2% (256) 18.9% costs (2,105) 100% (2,007) 100% (1,350) 100% (1,191) (1,148) ––89-A (1,626) (1,608) (1,662) (1,204) (3,288) (2,812) (2,083) (2,202) (2,346) – staff – CUPE
ReportBudget2022-23 64SNAPSHOTS
staff (1) 19.0 18.3 (1) FTE
Net
Total
Figure 89-B: 2022-23 centre 90-B: centre90-B:
Operating costs
FTE
University Marketing and (AdvancementCommunicationsandExternal Relations) As part of Advancement and External Relations, University Marketing and Communications represents the Office of University Marketing and Communications (UMC) as well as Printing and Digital Services (PDS). UMC provides the strategic direction for Brock University’s brand, marketing and communications efforts. As stewards of Brock’s brand and reputation, UMC tells the Brock story to the University’s many and varied audiences, including students, prospective students, staff and faculty, the community, industry, and the government. UMC’s key responsibilities include brand management, integrated marketing and communications, media relations and public affairs, social media, web and digital content development, and community engagement. PDS is the official on-campus provider for printing, stationery and the management of the fleet of multifunction copiers across campus. The department provides a full in-house manufacturing facility to produce a wide range of print materials for academic, administrative and student print requirements. For information, visit brocku.ca/printing and brocku.ca/marketing-communications
50.5%
42.8% Total costs (3,163) 100%
The University Secretariat supports the Institutional Strategic Plan by working to ensure the University’s two governing bodies (Board of Trustees and Senate) and their committees operate effectively and efficiently by providing governance expertise, research and analysis, and general support. The Secretariat also manages the University's policy framework and processes.
Note: Prior to 2022-23, the University's legal services was included as part of the University Secretariat unit. The Legal Counsel is a stand-alone unit in the 2022-23 Budget. page 67 for details. more information on the University Secretariat, visit brocku.ca/university-secretariat 92 ($000s) 2022-23Budget 2021-22Budget
ReportBudget2022-23 65SNAPSHOTS
Figure
For
Human Rights and Equity Services supports the Institutional Strategic plan as a resource for all members of the Brock community, providing information, education and complaint resolution related to harassment, discrimination, sexual violence, accessibility and bullying. Revenue and operating expenses for Brock’s Ombuds office, which is an independent and impartial body for conflict resolution and confidential service, is included as part of the Human Rights and Equity Services unit. For more information on Human Rights and Equity, visit brocku.ca/human-rights Note: Revenue includes $0.63 million ($0.57 million in 2021-22) of student ancillary fees. Operating Expenses include $0.31 million ($0.70 million in 2021-22) of contracted and professional fees.
See
2020-21Actual RevenuePersonnel costs (515) 98.5% (820) 94.6% (807) 97.0% Operating costs (8) 1.5% (47) 5.4% (25) 3.0% Total costs (523) 100% (867) 100% (832) 100% Net (523) (867) (832) FTE – staff (1) 5.0 8.0 (1) FTE – staff represents evaluated salaried staff positions and ongoing CUPE 1295 positions (both filled and unfilled). Figure 91 ($000s) 2022-23Budget 2021-22Budget 2020-21Actual Revenue 765 573 596 Personnel costs (1,188) 72.4% (969) 53.6% (941) 48.6% Operating costs (453) 27.6% (840) 46.4% (997) 51.4% Total costs (1,641) 100% (1,809) 100% (1,938) 100% Net (876) (1,236) (1,342) FTE – staff (1) 10.0 9.0 (1) FTE – staff represents evaluated salaried staff positions and ongoing CUPE 1295 positions (both filled and unfilled).
Human Rights and Equity Services University Secretariat

ReportBudget2022-23 66SNAPSHOTS Office of Government and Community Engagements Institutional Analysis and Planning gathers, processes, interprets and translates campus data into useful information for University decision-makers, the government and the general public, focusing on enrolment, retention and graduation statistics; institutional characteristics, survey analysis and support; and ad hoc requests. For information on Institutional Analysis and Planning, visit brocku.ca/institutional-analysis Figure 93 ($000s) 2022-23Budget 2021-22Budget 2020-21Actual RevenuePersonnel costs (737) 93.4% (568) 91.6% (460) 80.7% Operating costs (52) 6.6% (52) 8.4% (109) 19.3% Total costs (789) 100% (620) 100% (569) 100% Net (789) (620) (569) FTE – staff (1) 6.0 5.0 (1) FTE – staff represents evaluated salaried staff positions and ongoing CUPE 1295 positions (both filled and unfilled). Figure 94 ($000s) 2022-23Budget 2021-22Budget 2020-21Actual Revenue 8 Personnel costs (523) 97.6% (361) 95.3% (269) 92.8% Operating costs (13) 2.4% (18) 4.7% (21) 7.2% Total costs (536) 100% (379) 100% (290) 100% Net (536) (379) (282) FTE – staff (1) 5.0 4.0 (1) FTE – staff represents evaluated salaried staff positions and ongoing CUPE 1295 positions (both filled and unfilled). Institutional Analysis and Planning The Office of Government and Community Engagements builds relationships at all levels of government to advance Brock University’s strategic priorities and to raise awareness about the University’s unique areas of strength. The office is responsible for supporting Brock’s strategic priorities with all levels of government by: • Monitoring and providing advice on public policy and programs • Developing, building and broadening relationships with elected representatives, non-elected officials and community partners • Supporting Brock’s government advocacy • Acting as a liaison and central point of contact • Co-ordinating strategic communications and engagement • Facilitating government and community partner visits to Brock’s campus • Engaging with sector associations, including Universities Canada and the Council of Ontario Universities (COU) • Matching community needs with University expertise to build community capacity • Partnering with community partners across the Niagara region and beyond to help solve problems, generate research solutions, and co-create knowledge For more information on the Office of Government and Community Engagements, visit brocku.ca/government-relations FEB. 8, 2022 - Three Canadian senators brought their community engagement experience and expertise to a virtual Brock University classroom. Clockwise from top left: Brock University Assistant Professor of Child and Youth Studies Heather Ramey moderates a discussion between students in her course and Senators Kim Pate, Marilou McPhedran and Wanda Thomas Bernard. (Photo courtesy of Senate of Canada)

The University’s Legal Services unit provides legal advice and support to the University to advance the mission and strategic priorities of the University while mitigating legal risks and promoting compliance with all legal and regulatory requirements. The Legal Services unit also oversees the administration of the University’s Freedom of Information and Protection of Privacy Act responsibilities and manages the University’s records management program. For more information, visit brocku.ca/university-secretariat/legal/
2020-21Actual RevenuePersonnel costs (524) 94.2% (391) 98.2% (372) 94.4% Operating costs (32) 5.8% (7) 1.8% (22) 5.6% Total costs (556) 100% (398) 100% (394) 100% Net (556) (398) (394) FTE – staff (1) 4.0 3.0 (1) FTE – staff represents evaluated salaried staff positions and ongoing CUPE 1295 positions (both filled and unfilled). Figure 96 ($000s) 2022-23Budget 2021-22Budget 2020-21Actual RevenuePersonnel costs (691) 97.1% Operating costs (21) 2.9% Total costs (712) 100% Net (712) FTE – staff (1) 6.0 (1) FTE – staff represents evaluated salaried staff positions and ongoing CUPE 1295 positions (both filled and unfilled).
Figure
ReportBudget2022-23 67SNAPSHOTS
Note: Prior to 2022-23, the University's legal services were included as part of the University Secretariat unit as detailed on page 65. 95 ($000s) 2022-23Budget 2021-22Budget
Legal CounselInternal Audit and University Risk Management Internal Audit independently assesses the strength of the University’s risk-management and control processes. We support the achievement of the University’s guiding value of ensuring sustainable, accountable and transparent stewardship of public and private resources through traditional risk and control-based reviews, assurance and compliance audits, project oversight and support, and investigations. University Risk Management, which includes the management of Brock’s insurance portfolio, supports the management of risks through a framework that identifies, assesses, monitors and reports on the status of the University’s principal risks. For more information, visit brocku.ca/internal-audit

Note: Revenue includes $0.68 million ($0.68 million in 2021-22) of revenue related to internal charges to other departments within the University, mainly salary chargebacks. Operating costs include $2.15 million ($2.05 million in 2021-22) of repairs and maintenance and capital replacement costs, and $1.68 million ($1.41 million in 2021-22) of contracted services and professional fees, including maintenance, custodial and grounds contracted services. Utilities costs are not included in the Facilities Management budget and are reported as part of the Utilities, Taxes and Insurance responsibility centre on page 70.
Management Facilities Management supports the Institutional Strategic Plan by providing an exceptionally clean, safe, accessible and well-maintained physical environment for the University community by planning and developing services that are sustainable and supportive of academic excellence, including the sustainable operation of our District Energy System; facility maintenance; ground In addition to the budget reported in the Facilities Management responsibility centre, Facilities Management capital projects are budgeted in the Capital responsibility centre. Details of these expenditures can be found starting on page 75. Figure 97 ($000s) 2022-23Budget 2021-22Budget 2020-21Actual Revenue 1,677 1,103 579 Personnel costs (12,315) 74.1% (12,374) 77.4% (11,973) 78.9% Operating costs (4,310) 25.9% (3,617) 22.6% (3,196) 21.1% Total costs (16,625) 100% (15,991) 100% (15,169) 100% Net (14,948) (14,888) (14,590) FTE – staff (1) 146.0 146.0 (1) FTE – staff represents evaluated salaried staff positions and ongoing CUPE 1295 positions (both filled and unfilled). maintenance; capital planning, design and construction; project management; code and bylaw compliance; and cleaning and non-hazardous waste management. For more information, visit brocku.ca/facilities-management
ReportBudget2022-23 68SNAPSHOTS SpaceFacilities

Campus Security Services is a dedicated team of experienced and skilled professionals who ensure the safety and security of the Brock Community along with all of its campuses and properties. We align our goals and objectives with the Institutional Strategic Plan to ensure the campus experience is engaging and meets the needs of our students, faculty, staff and visitors. We provide individual personal safety planning, threat assessments, teaching and learning opportunities, mentorship, and support to meet the needs of the entire Brock community. Campus Security is closely connected and in partnership with all external emergency responders to our campus in order to train and respond together for emergency preparedness and awareness. Campus Security Services continues to work closely with the Niagara Region Public Health unit and have been co-ordinating Brocks pandemic response to ensure the well-being of our Brock Community. This will continue throughout 2022-23. For more information on our services, videos and safety applications, visit brocku.ca/campus-security Note: Operating costs include $0.87 million ($0.96 million in 2021-22) of contracted security services.
events, First Ontario Performing Arts Centre, and a transfer to BUSU for transit funding. Also part of this portfolio is the Canada Summer Games Park Consortium. Figure 99 ($000s) 2022-23Budget 2021-22Budget 2020-21Actual Revenue 693 554 350 Personnel costs (88) 2.8% (71) 2.6% (53) 3.8% Operating costs (3,013) 97.2% (2,609) 97.4% (1,360) 96.2% Total costs (3,101) 100% (2,680) 100% (1,413) 100% Net (2,408) (2,126) (1,063) FTE – staff (1) 0.6 1.0 (1) FTE – staff represents evaluated salaried staff positions and ongoing CUPE 1295 positions (both filled and unfilled)
ReportBudget2022-23 69SNAPSHOTS
Figure 98 ($000s) 2022-23Budget 2021-22Budget 2020-21Actual Revenue 150 154 123 Personnel costs (1,587) 61.4% (1,582) 59.5% (1,563) 61.1% Operating costs (998) 38.6% (1,075) 40.5% (994) 38.9% Total costs (2,585) 100% (2,657) 100% (2,557) 100% Net (2,435) (2,503) (2,434) FTE – staff (1) 18.0 18.0 (1) FTE – staff represents evaluated salaried staff positions and ongoing CUPE 1295 positions (both filled and unfilled). Campus Development and Community Agreements Campus Development includes the rental revenue and related expenses for Heritage Plaza, which houses McDonald's, Tim Hortons, The Campus Pharmacy and Medical Clinic, and other retailers. Community Agreements includes payments for an on-campus art collection, community
Campus Security Services


–
Figure 99-B: 2022- 23 costs vs. offsetting revenue revenue Total $3,048
($000s) Operating costs – Total $9,873 Utilities Municipaltaxes prservicesContractedandofessionalfees Repairs maintenanceandandcapitalreplacementInsurance Other 6,273 1,961 1,250 1,087 500 1,214 395 241 Grant in Lieu MunicipalofTaxation ($1,chargebacksInternal720)&externalchargebacks($241) Offsetting
The Utilities, Taxes and Insurance responsibility centre includes all centrally billed utility costs of $6.27 million ($6.17 million in 2021-22), including $0.36 million ($0.25 million in 2021-22) of federal carbon taxes. This represents the majority of the University's total utility costs of $7.18 million ($6.73 million 2021-22). See Figure 61 on page 37 for details of utility costs. The remaining utility costs are billed directly to operating units. As detailed in Figure 100-B, offsetting these utility costs are chargebacks to Residence Services and external units to the University. As further detailed in Figure 100-B, included in operating costs are municipal taxes (payment in lieu of property taxes), offset by the Grant in Lieu of Municipal Taxes. For more details, see page 30. The remaining operating costs are made up of repairs and maintenance and capital replacement costs, the majority of which are related to the University's central utilities building; insurance costs, contracted services and professional fees, and other operating costs.
Figure 100-B: 2022-23 operating costs vs. offsetting revenue ($000s)
ReportBudget2022-23 70SNAPSHOTS Utilities, Taxes and Insurance Financing Figure 100-A ($000s) 2022-23Budget 2021-22Budget 2020-21Actual Revenue 3,048 3,051 1,941 Personnel costs 0.0% 0.0% (1) 0.0% Operating costs (9,873) 100.0% (10,360) 100.0% (8,035) 100% Total costs (9,873) 100% (10,360) 100% (8,036) 100% Net (6,825) (7,309) (6,095) Figure 101 ($000s) 2022-23Budget 2021-22Budget 2020-21Actual Revenue 5,156 1,833 3,252 Personnel costs 0.0% 0.0% 0.0% Operating costs (10,101) 100% (11,123) 100% (9,123) 100% Total costs (10,101) 100% (11,123) 100% (9,123) 100% Net (4,945) (9,290) (5,871)
The Financing responsibility centre includes the portion of the principal and interest payments of the University’s external debt, which is not included in the Residence Services or in Ancillary Services. The budget includes principal payments of $1.23 million ($0.91 million in 2021-22) related to debt for the Roy and Lois Cairns Health and Bioscience Research Complex (RLCHBRC) and to the loan renewal. Interest of $6.87 million ($6.83 million in 2021-22) related to the debt for the RLCHBRC, the 2045 $93-million debenture (2005 bond), the 2060 $125-million debenture (2020 bond), the Scotia loan and the loan renewal were included in the budget. For details on all interest and principal payments included in the budget, see Figure 62 on page 38. For a breakdown of the debt and more information on Brock’s financing strategies and all debt outstanding, see page 81. Also included in 2020-21 actuals and 2021-22 budget figures is the investment towards the debt reduction strategy of $1.50 million. The revenue in the Financing responsibility centre in the 2022-23 budget represents the Zone expansion student ancillary fee of $1.55 million ($1.47 million in 2021-22), which is being transferred to an internally restricted reserve (sinking fund) as part of inter-fund expenses to support the repayment of the Zone Expansion project. Also included in revenue is $0.38 million ($0.37 million in 2021-22) of investment income on the sinking fund, which is transferred to an internally restricted reserve to support the 2005 bond. New in 2022-23 is a transfer from Ancillary and Residence to fund $3.22 million of the 2020 bond debenture debt payments.
operating
Figure 102-A ($000s) 2022-23Budget 2021-22Budget 2020-21Actual Revenue 3,550 3,504 3,838 Personnel costs 0.0% 0.0% 0.0% Operating costs (30,023) 100% (26,018) 100% (22,761) 100% Total costs (30,023) 100% (26,018) 100% (22,761) 100% Net (26,473) (22,514) (18,923) The Scholarships, Bursaries and Fellowships budget supports the Institutional Strategic Plan by helping and supporting students in attending the University. This unit represents the majority of Brock’s undergraduate and graduate scholarships, bursaries and fellowships (SBFs). Of the total SBFs reported in this unit, $18.83 million ($15.87 million in 2021-22) relates to support for undergraduate students and $11.20 million ($10.15 million in 2021-22) relates to support for graduate students, including endowment-allocated scholarships and student awards.
The undergraduate SBFs can be split into four main types: University-funded, those funded by government grants, student tuition waivers and those funded by endowments.
Total budgeted undergraduate University-funded SBFs of $15.36 million ($12.45 million in 2021-22) are either meritbased or need-based.
Scholarships, Bursaries and Fellowships
Total grant-funded undergraduate SBFs for 2022-23 are budgeted to be $0.13 million ($0.18 million in 2021-22), which are directly offset with grant revenue.
Undergraduate student tuition waivers for Brock faculty and staff and their dependents are budgeted to be $1.28 million ($1.28 million in 2021-22).
ReportBudget2022-23 71SNAPSHOTS
Brock
GrantEndowmentTuitionNeeds-basedMerit-basedwaivers-funded-funded
Figure 102-B: 2022-23 undergraduate scholarships and student awards (%)
financial aid to cover a student’s assessed needs for expenses directly related to his or her program that are not fully met by OSAP. Also included in need-based awards is Brock’s bursary assistance of $0.43 million ($0.43 million in 2021-22), as well a number of other specialty awards, including the Student International Mobility Awards, Emergency Bursaries, etc.
• Merit-based awards are budgeted to be $14.04 million ($11.10 million in 2021-22). Merit-based awards include Brock Entrance Scholars Awards of $5.53 million ($3.87 million in 2021-22) and renewals of those scholarships of $6.82 million ($5.57 million in 2021-22), as well as a number of other awards, including course-based scholarships, the International Student Ambassador Award, the Principal’s Awards, etc.
The following chart details the proportion of the total undergraduate SBFs (in this unit) by type – merit-based, need-based, tuition waivers, endowment-funded and grant-funded.
Figure 100-B: 2022-23 undergraduate scholarships and student awards (%) Scholars and Otherrenewals 11 1 74 77 89 11
Starting in 2018-19, the funding budget includes the endowment-allocated spend related to scholarships and student awards. The undergraduate portion for 2022-23 is $2.05 million ($1.95 million 2021-22). This support is shown in the budget as an inter-fund expense, with an offsetting inter-fund revenue of the same amount.
• Need-based awards are budgeted to be $1.32 million ($1.36 million in 2021-22). These include funding related to the requirements of the Student Access Guarantee (SAG), an MCU initiative that states that no qualified Ontario student should be prevented from attending post-secondary education because of a lack of financial support programs. The MCU requires all colleges and universities that receive public funding to provide enough Global
Undergraduate
ReportBudget2022-23 72SNAPSHOTS Graduate
2,985
Revenue
The majority of graduate SBFs are in the form of University-funded fellowships of $8.13 million ($7.53 million in 2021-22). Other graduate SBFs of $1.24 million ($0.85 million in 2021-22) include University-funded entrance scholarships and awards for excellence, research awards, and bursaries. In addition, there are scholarships funded two-thirds by the MCU, in the amount of $1.03 million ($0.98 million in 2021-22), with an offsetting grant revenue of $0.66 million ($0.65 million in 2021-22). In 2021-22, there was one scholarship funded fully by a grant in the amount of $0.04 million. Also included in graduate SBFs are student tuition waivers for Brock faculty and their dependents and Brock staff, which are budgeted to be $0.19 million ($0.19 million in As2021-22).previously mentioned, starting in 2018-19, the funding budget includes the endowment-allocated spend related to scholarships and student awards. The graduate portion for 2022-23 is $0.60 million ($0.57 million in 2021-22). This support is shown in the budget as an inter-fund expense, with an offsetting inter-fund revenue of the same amount.
Capital Figure 103 ($000s) 2022-23Budget 2021-22Budget 2020-21Actual 6,976 8,554 Personnel costs 0.0% 0.0% 0.0% Operating costs (14,815) 100% (14,795) 100% (5,508) 100% Total costs (14,815) 100% (14,795) 100% (5,508) 100% Net (7,839) (6,241) (2,523) The Capital responsibility centre represents the total funding of both the Facilities Management projects of $9.49 million ($10.43 million in 2021-22) and the Information Technology Services projects of $5.33 million ($4.37 million in 2021-22) in the capital and related project budget. Offsetting these costs is the contribution from Ancillary and Residence to the capital and related project budget of $4.02 million ($4.00 million in 2021-22). Also included in revenue is Facilities Renewal Program Funds of $2.95 million ($2.95 million in 2021-22). See page 31 for a discussion of these funds. In 2021-22, revenue also included proceeds from the disposition of capital assets in the amount of $1.6 million as an offset to the capital project funding. See pages 75 to 79 for details of the capital and related project budget.
Work is continuing on Canada Games Park, which is being constructed in the southeast corner of Brock University's main campus.

University Global
– Differentiation envelope of $39.43 million ($29.70 million in 2021-22) – see page 29. – Nursing grant of $4.52 million ($2.64 million in 2021-22) – see page 31.
• International Student Recovery Fee of $1.91 million ($1.75 million in 2021-22), which offsets most the reduction mentioned above in grant revenue – see page 30.
• Interest on short-term investments of $1.50 million ($1.50 million in 2021-22) – see page 33.
See Appendix B for further details. University Global also includes other personnel costs not allocated to any department of $0.68 million ($0.58 million in 2021-22).
2021-22 included inter-fund revenue from the contingency reserve of $1.21 million, as part of the University’s mitigation strategy. This funding was not included in the 2022-23 budget.
• Grant revenue of $90.38 million ($88.68 million in 2021- 22) as follows: – Core operating grant of $48.36 million ($58.09 million in 2021-22) – see page 29.
Offsetting these costs are budgeted savings from voluntary vacation buy back of $0.09 million ($0.16 million in 2021-22). Operating costs for University Global include the •following:Strategic funding to support the Institutional Strategic Plan in the amount of $3.9 million ($1.79 million in 2021-22), which was introduced as part of the operating budget for the first time in 2020-21.
University Global represents those costs and revenue that are University-wide and are not budgeted for by any Faculty or department, including the majority of student tuition, MCU operating grants and anticipated salary increases that haven’t yet been awarded. University Global also includes $3.90 million, representing 1.0 per cent of overall revenue ($1.79 million representing 0.5 per cent of overall revenue in 2021-22) of unallocated funding to support the Institutional Strategic Plan. These funds will be distributed to Faculties or departments throughout 2022-23 for identified projects that directly support the priorities identified in the Institutional Strategic Plan. Full details of the University Global costs and revenue are described below. Revenue for University Global includes the following:
• Other operating costs of $2.11 million ($2.05 million in 2021-22), which include University memberships, allowances for uncollectable funds, payment to Niagara College related to its share of the GAME program and other University-wide expense items.
• Funding of $8.0 million ($1.0 million in 2021-22) to the strategic fund related to the sale of the Hamilton campus to be used to support the new Burlington campus in the following years.
• Asset sale revenue in the amount of $7.93 million ($0.80 million in 2021-22) related to the sale of the Hamilton campus. The $7.93 million proceeds, along with the $0.07 million imputed interest, is offset by an allocation of $8.0 million ($1.0 million in 2021-22) to the strategic fund to be used to support the new Burlington campus in the following years.
Figure 104 ($000s) 2022-23Budget 2021-22Budget 2020-21Actual Revenue 295,395 280,035 270,370 Personnel costs (2,483) 15.1% (910) 15.8% 2,920 (17.7%) Operating costs (14,013) 84.9% (4,837) 84.2% (19,371) 117.7% Total costs (16,496) 100% (5,747) 100% (16,451) 100% Net 278,899 274,288 253,919
ReportBudget2022-23 73SNAPSHOTS
• Inter-fund revenue from strategic reserves of $0.15 million to offset the cost of the rapid antigen program.
• Tuition of $190.70 million ($183.13 million in 2021-22) as detailed in Figure 41 on page 24.
– An offset to grant revenue of $1.93 million ($1.75 million in 2021-22) due to International Student Recovery Fee – see page 28.
• Other revenue of $2.82 million ($2.96 million in 2021- 22), which includes $0.07 million ($0.2 million in 2021-22) of imputed interest related to the sale of the Hamilton campus.
Personnel costs for University Global includes $1.89 million ($1.46 million in 2021-22) related to salary and wage increases that are anticipated but not yet awarded or negotiated. Note: The salary and wage increases that were anticipated but not yet awarded or negotiated included in the Global responsibility unit in the 2021-22 Budget Report have since been allocated to the respective units and are therefore reported as such in this Budget Report.
ReportBudget2022-23 74CAPITAL

overview The 2022-23 capital and related projects budget (capital plan) is $14.82 million (Information Technology Services Projects – $5.33 million; Facilities Management Projects – $9.49 million). The specific projects are detailed in Figures 107 and 108. As shown in Figure 105, the funding of the capital plan is made up as follows: $11.86 million is funded by the operating budget – both ancillary ($4.02 million) and nonancillary contributions ($7.84 million), and $2.95 million is funded from Facilities Renewal. The 2022-23 capital and related projects budget identifies key areas of investment, including the District Energy Water Supply replacement ($1.26 million), Learning Capital and related projects budget Capital Management System ($0.75 million), residence and dining services projects ($2.40 million), core subscription and strategic student solutions ($1.97 million), classroom modernization ($1.00 million) and parking lot repairs and maintenance ($0.4 million). The capital plan includes $8.88 million in deferred maintenance spending and $0.25 million reserved for residence renewal as approved in the student experience infrastructure projects.
The condition assessment report (May 2021) by VFA Inc. determined the University has $330 million in deferred maintenance requirements (including residences) that have accumulated over a number of years. Although this level of maintenance is not obviously apparent when walking the halls of the University, the reality is that much of the deferred maintenance is related to roofs, HVAC, electrical, plumbing and accessibility. An important observation is that this deferred maintenance figure does not include information technology. The specific classifications of areas of deferred maintenance are included in Figure 106. Non-ancillary contribution – $7.839 million Ancillary Contribution – $4.023 million Facilities Renewal Program – $2.953 million Figure 104: Capital Budget funding source (%) 53 27 20 105: Capital Budget funding source (%)
ReportBudget2022-23 75CAPITAL
The capital and related project budget was approved on Dec. 9, 2021 by the Board of Trustees after input-gathering from the Brock community. The process to develop this capital and related project budget began in the summer of 2021, when Facilities Management and Information Technology Services first published proposed projects and sought input. Further discussions were held at committee levels, including the Senate Information Technology and Infrastructure Committee and the Senate Planning, Priorities and Budget Advisory Committee. The capital plan was developed in support of the Institutional Strategic Plan for the ApprovingUniversity.thecapital and related projects budget in late November or early December allows Facilities Management and Information Technology Services time to start planning the projects so, where possible, they can be accomplished in the spring and summer when the campus is less busy, as well as to ensure there is sufficient time to obtain competitive pricing. Information and updates on the 2021-22 capital and related projects can be found in the 2021-22 trimester reporting at brocku.ca/about/university-financials
Background
The primary driver informing much of the Facilities Management campus planning regarding deferred maintenance has been the condition assessment performed by VFA Inc. VFA, through the Council of Ontario Universities (COU), maintains a common reporting tool to track facilities conditions across Ontario universities for deferred maintenance reporting. In 2019-2020, Ontario universities conducted a data harmonization, to ensure the data is now calculated in a consistent manner with other broader public sector organizations.
. A key feature of this capital and related project planning is that any unspent funds of the 2021-22 capital and related projects budget will be reserved at April 30, 2022 and be moved into fiscal 2022-23 so the projects can be completed.
Capital and related projects
Looking back over the past years, the turning point of the capital program really occurred when the Board of Trustees endorsed a motion to invest $6 million in deferred maintenance in the 2014-15 budget. The intent of the $6-million contribution was to at least maintain deferred maintenance and FCI at its current level. It should be noted that the capital plan has been accelerated through decisions to source external financing (incremental funding outside of the operating budget) and investments in student experience projects. The 2022-23 Fiscal Framework re-established the commitment to fund deferred maintenance of at least $6 million annually.
(1) 5,405 77,272 0.07 Total academic and administrative 142,491 958,044 0.15 Site and utility infrastructure Roadways 3,408 3,544 0.96 Parking lots 5,724 6,662 0.86 Water supply mains 13,231 11,846 1.12 Storm sewer 16,429 13,888 1.18 Electrical distribution 23,492 28,050 0.84 Service tunnels 1,394 14,042 0.10 Other 23,735 33,340 0.71 Total site and utility infrastructure 87,413 111,372 0.78 Residence Total residence 100,371 184,009 0.55 Total 330,275 1,253,425 0.26 Source: VFA Facility Asset Condition Database. (1) Satellite campuses: Includes Brock Research and Innovation Centre, Rodman Hall Art Centre and the Marilyn I. Walker School of Fine and Performing Arts.
valuereplacementCurrent($000s) FCI Academic
Nov. 26, 2021: In photo, Tom and Beth Rankin, who were honoured by Brock University for their on-going family support and their $2-million gift that helped to transform Brock’s main entrance. ReportBudget2022-23 76CAPITAL
In addition to the 2022-23 capital and related projects budget, other units maintain significant capital replacement and repairs and maintenance budgets. The Facilities Management budget has $2.15 million in capital replacement and repairs and maintenance costs, Residence Services has $1.48 million, other Ancillary Operations have $1.20 million and the Information Technology Services budget has $1.11 million included as part of its operating costs. These budgets support building, mechanical, electrical and grounds maintenance projects ranging from elevator maintenance to door repairs to upgrades in equipment and technology. 106: COU VFA Data (as at May maintenanceDeferred2021)($000s) and administrative Main campus 128,728 833,423 0.15 East campus 8,358 47,349 0.18 campuses
The Facility Condition Index (FCI) metric provides a methodology to determine the relative condition of a single building, group of buildings or total facilities and is calculated by dividing the deferred maintenance backlog by the current replacement value. The lower the FCI, the better the condition. Brock’s backlog of deferred maintenance items, as described below, results in the FCI for Brock of 0.26, which translates to “Poor” (an FCI>0.15).
Figure
Satellite

ReportBudget2022-23 77CAPITAL 107:Figure projectsServicesTechnologyInformation–budgetprojectrelatedandCapital ($000s)Project spendingProject2022-23Total project costs valuesUniversityBrockReportingcriteria RenewalFacilities fundsProgram andAncillary Residence Other operating Student experience andTeaching Non-DeferredDeferredCampusRegulatoryResearchlearningcommunityMaintenance(DM)Maintenance flexibleorNew compliancePCI300300 300 DM–administrative–switchesNetwork203203 3200 growth–administrative–switchesNetwork2020 20 growth–residences–switchesNetwork1515 15 DM–residences–switchesNetwork3535 35 growth–administrative–Wireless7272 72 DM–administrative–Wireless100100 100 DM–residence–Wireless180180 180 DM–visualAudio4444 44 growth–conferencing)video(includingvisualAudio4444 44 DM–administrative–UPS6060 60 DM–residence–UPS2525 25 DM–administrative–TVcircuitClosed4040 40 DM–residence–TVcircuitClosed1010 10 systemmanagementvideoandaccesscardEnterprise287287 287 administrativeUPSandreplacementUPSroomServer8080 80 DM–back-upData7575 75 DM–cardProxy3030 30 140140DM–Servers 140 infrastructureAzure2525 25 redeploymentandpurchaseComputer500500 500 infrastructureCabling5050 50 DM–clocksAlarms/security/IP2525 25 replacement–systemTelephone250250 250 flexibleornewTotal2,6102,6101,2141,396 activitiesCore feessubscriptionCore1,3941,394 1,394 solutionsstudentstrategicCore572572 572 systemmanagementLearning750750 750 activitiescoreTotal2,7162,716-2,716 Total5,3265,3261,2144,112
ReportBudget2022-23 78CAPITAL 108:Figure PlanRenewalCapitalManagementFacilities–budgetprojectrelatedandCapital ($000s)Project spendingProject2022-23Total project costs valuesUniversityBrockReportingcriteria RenewalFacilities fundsProgram andAncillary Residence Other operating Student experience andTeaching Non-DeferredDeferredCampusRegulatoryResearchlearningcommunityMaintenance(DM)Maintenance projectscapitalMajor replacementsupplywaterenergyDistrict481,2081,256 1,256 projectscapitalmajorTotal48-1,2081,2561,256- maintenancedeferredUniversity ChownMackenzie–upgradesWashroom7575 75 renewalFlooring6060 60 replacementdoorexteriorandInterior6060 60 spacespublicofPainting5050 50 upgradesefficiencyEnergy150150 150 maintenancehigh-voltageAnnual100100 100 controlssystemautomationbuildingAnnual100100modernization 100 replacementandupgradesHVAC800800 800 replacementRoof750750 750 programmodernizationElevator450450 450 replacementlineshydrantFire150150150 maintenancedeferredUniversityTotal2,745--2,7452,745- upgradessiteCampus replacementandrepairFurniture5050 50 repairsRoad200200 200 wayfindingandsignageExternal200200 200 enhancementlandscapeCampus8080 80 storagechemicalCentralized200200 200 upgradesAthletics100100 100 upgradessitecampusTotal--830830200630
ReportBudget2022-23 79CAPITAL 108:Figure PlanRenewalCapitalManagementFacilities–budgetprojectrelatedandCapital (continued) ($000s)Project spendingProject2022-23Total project costs valuesUniversityBrockReportingcriteria RenewalFacilities fundsProgram andAncillary Residence Other operating Student experience andTeaching Non-DeferredDeferredCampusRegulatoryResearchlearningcommunityMaintenance(DM)Maintenance renovationspacelearningandTeaching renewalandmodernizationClassroom1,0001,000 1,000 renovationspacelearningandteachingTotal1,0001,0001,000- (1)AODAAccessibleBuiltEnvironment(ABE) travelofpathsexteriorBarrier-free5050 50 upgradeswashroomuniversalAccessible7070 70 upgradesAODAMiscellaneous4040 40 (1)AODATotalAccessibleBuiltEnvironment160--160160- studiesandAudits Inc.)(VFAAuditsConditionFacilityAnnual7575 75 planmasteruseLands400400 400 studiesandauditsTotal--475475-475 Vehicles replacementfleetBrock221221 221 vehiclesTotal--221221-221 lotsParking maintenanceandrepairlotParking400400 400 lotsparkingTotal-400-400400- Residence renewalinfrastructureResidence500500 500 renewalinfrastructure8Residence152152 152 renewalexteriorandinterior–ResidencesVillage650650 650 upgradesHVACResidence500500 500 renewalServicesDining500500 500 reserveinfrastructureResidenceDecew100100 100 ResidenceTotal-2,402-2,4021,902500 1,8267,6639,4893,7342,8022,953TOTAL DisabilitieswithOntariansforAccessibility–AODA(1)
ReportBudget2022-23 80TREASURY

Figure 109 details the current and projected external debt of the University, which is within financial metric ranges of the University’s current credit rating. The 2022-23 Fiscal Framework Update continues with the holistic approach to Brock’s capital financing strategy that allows for decisions to be made in support of strategic priorities in a fiscally sustainable manner. Maintaining the University’s credit rating at A (high) or better is a strategic priority that remains in the Fiscal Framework. The impact on the University’s credit rating will be considered for any new debt and will be supported by a complete repayment plan, including Board-approved assumptions for sinking fund strategies if required.
DBRS Morningstar maintained Brock’s credit rating on March 3, 2022, with the Issuer Rating and Senior Unsecured Debentures rating of “A (high)”, and changed our trend from “Negative” to “Stable”. The trend changed to “Negative” last year based on DBRS Morningstar's understanding that Brock had been disproportionately affected by the global pandemic as a result of increased competition for domestic students. This, in turn, resulted in a weaker enrolment outlook. The positive change back to “Stable Trending” reflects DBRS Morningstar's view that Brock's enrolment forecast has modestly improved and, combined with responsive management, will lead to an improvement in financial risk metrics relative to previous expectations. DBRS Morningstar continues to expect the University to post balanced operating results, or better, on a consolidated basis. Brock’s debt repayment strategy is on track thanks to the successes in navigating the global pandemic and maintaining balanced operating results throughout. The proceeds included in the 2020 Series B Debenture for repayment of the Roy and Lois Cairns Health and Bioscience Research Complex loan with the Bank of Montreal (BMO) remain unencumbered, as well as the residual amount needed for full repayment within the debt repayment reserve. In July 2022, this loan will be repaid with ongoing consideration for potential renewal of the loan to acquire a strategic property. The budget includes the expectation this strategic property will be acquired; however, if the purchase falls through there will be an anticipated savings of $1.33 million principal and interest payments for 2022-23. There also remains $14.4 million excess capital from the 2020
FinancingTreasury Figure 109: Outstanding debt Unless($000s)otherwise noted Actual Forecast April201730, April201830, April201930, April202030, April202130, April202230, April202330, April202430, April202530, 2005 Bond 93,000 93,000 93,000 93,000 93,000 93,000 93,000 93,000 93,000 Roy and Lois Cairns Health and Bioscience Research Complex 24,863 24,109 23,319 22,491 21,623 20,714 Loan renewal 14,333 12,968 11,561 Residence 15,215 14,333 13,385 12,366 11,271 10,095 8,831 7,473 6,014 Marilyn I. Walker School of Fine and Performing Arts (MIWSFPA) 15,960 15,240 14,520 2020 Bond and Scotia loan 14,400 139,400 139,400 139,400 139,400 125,000 Total debt 149,038 146,682 144,224 142,257 265,294 263,209 255,564 252,841 235,575 Total student FFTE (1) 20,086 20,303 20,548 21,597 21,896 21,689 22,475 22,980 23,090 Total debt/FFTE (in dollars)(1) $7,420 $7,225 $7,019 $6,587 $12,116 $12,136 $11,371 $11,003 $10,202 Debt reduction strategy Sinking fund – 2005 Bond 6,413 6,696 7,370 7,607 8,843 9,285 9,749 10,237 11,154 Sinking fund – 2020 Bond 1,855 3,447 5,154 7,856 Debt repayment reserve 2,895 4,457 6,753 384 1,884 3,153 M. Walker donation – MIWSFPA 5,326 5,470 5,617 Other donations – MIWSFPA 717 851 932 Total assets for debt reduction 15,351 17,474 20,672 7,991 10,727 14,293 13,196 15,391 19,010 Net debt 133,687 129,208 123,552 134,266 254,567 248,916 242,368 237,450 216,565 Net debt/FFTE (in dollars)(1) $6,656 $6,364 $6,013 $6,217 $11,626 $11,477 $10,784 $10,333 $9,379 (1) Fiscal full-time enrolment (FFTE). For a definition, refer to page 88.
ReportBudget2022-23 81TREASURY
(1) Calculated using financial information from 13 comprehensive universities. Certain 2020 metrics have been updated due revisions certain universities' financial
in
statements.
(2) Increase is due to a one-time repayment of a $14.4-million loan utilizing the debt repayment reserve established within the Fiscal Framework. Series B Debenture for a loan renewal with Scotiabank due June 2024. These funds will remain invested until 2024, at which time the loan will be repaid unless approval is obtained for a major capital investment to support our strategic priorities before that time. The existing sinking fund for the Series A Debenture issued in 2005 continues to grow ahead of schedule due to strong investment returns. The existing sinking fund requires operating budget contributions to begin 2024-25 and accelerating in 2028-29 with the debt cost for the Sunlife Residence Loan being repurposed into the sinking fund when it is fully repaid. The use of the debt repayment reserve will also come to a close with the repayment of the Roy and Lois Cairns Health and Bioscience Research Complex loan in July 2022. The annual contribution to this reserve of $1.5 million is no longer included in the budget with this reduced funding contributing to the mitigation plan to achieve a balanced budget with a reasonable mitigation target. Brock’s cautious debt strategy is supported by Figure 110, which compares Brock’s key debt metrics to that of other universities in our comprehensive category as well as the Council of Ontario Universities' (COU) minimum recommended thresholds. Appendix F provides full definitions for each financial health metric.
to
ReportBudget2022-23 82TREASURY Figure 110: Financial healthBrockmetrics Median(1) MinimumsCOU2021April 2020April 2021April 2020April(1) Debt burden ratio 3.7% 6.7%(2) 2.6% 2.4% N/A Interest burden % 3.4% 2.1% 1.5% 1.3% 5.0% Interest coverage 3.00 4.64 4.48 4.64 N/A Viability ratio 32.9% 35.7% 113.1% 109.2% 30.0%
The following details a high-level explanation of our debt metrics.Thefirst two ratios describe how Brock utilizes a greater proportion of its annual operating expense to fund debt Theobligations.interest coverage ratio measures the ability to fund interest charges from cash generated through operations. It remains above the guidance of 2.00 set by the Board of Trustees and above the ratio of 2.50 considered to be the standard by DBRS Morningstar for Brock’s current credit rating of A high. The viability ratio is essentially how much of the institution’s debt could be paid off with expendable resources. The average institution in our category could pay all its debt with expendable resources, whereas Brock can only pay off 33 per cent and is therefore vulnerable to unplanned events.

ReportBudget2022-23 83TREASURY The funding budget includes the full endowment-allocated spend related to undergraduate and graduate scholarships and student awards. This support is shown in the funding budget as a funding source (inter-fund revenue) with the offsetting expense (inter-fund expense). The endowment fund policy can be found at brocku.ca/policies/ The full activity of the endowment for the past three years is shown in Figure 111. Figure 112 details the 2022-23 approved endowment spending of $3.6 million, which includes both the student awards spending allocations as well as the operating and capital. Endowment summary Figure 111 ($000s) Actual 2020-21 2019-20 2018-19 Opening Endowment 103,896 107,026 96,671 Spending (3,091) (2,929) (2,464) Investment Income and Unrealized (Loss)/Gain 19,893 (1,553) 10,932 New Endowments 3,112 1,352 1,887 Ending Endowment 123,810 103,896 107,026 Figure 113: Top 10 endowments (April 30, 2021) Amount ($000s) Name Purpose 20,285 Marilyn I. Walker SFPA Fund Supports the MIWSFPA 8,927 The Harrison-Thompson Bursary Trust Supports Undergraduate Awards 3,401 The Joyce Foundation Bursary Supports Undergraduate Awards 3,173 Dr. Gerald B. Mitchell Fund in Experiential Learning Supports Research, Student Experience and Programming 2,797 VP Research Discretionary Fund VP Research Discretionary 2,207 Dr. & Mrs. Moriyama Graduate Fellowship Fund Supports Graduate Awards 2,127 Bluma Appel Enterance Scholarship for Excellence Supports Graduate Awards 1,717 Luigi and Amalia Setacci Award Supports Undergraduate Awards 1,595 Ruth Evely Williamson Estate Supports Undergraduate Awards 1,567 Provost Discretionary Enhancement Fund Provost Discretionary Figure 112 Endowment Approved spending ($000s) 2022-23 2021-22 Undergraduate Scholarships 867 833 Undergraduate Bursaries 969 916 Undergraduate Prizes 214 206 Graduate Awards 602 565 Operating 384 261 Capital 596 576 Total 3,632 3,357 Includes the MIWSFPA endowment spending allocation, which can be used for both capital and operating. Figure 113 details the Top 10 endowments as of April 30, 2021. Due to the timing of preparing and approving this budget, the information presented is as of April 30, 2021. This information will be updated for April 30, 2022 and incorporated into the University’s 2021-22 Annual Report.
ReportBudget2022-23 84MODELALLOCATION

Allocation model
2022-23 Budget costs as a percentage of total revenue
Revenue and expense allocation model
1.University:Enhances the understanding of how revenues are generated and how costs are incurred and allocated at the Faculty level in a transparent manner.
2. Supports longer-term resource allocation decision-making for academic units.
ReportBudget2022-23 85MODELALLOCATION
The revenue and expense allocation model was developed through a consultative process with allocation methodologies approved by the Deans and Provost. The model has three key functions to support academic and financial planning of the
The model has certainly improved understanding of University activities from a financial perspective and reinforces the interdependence of all Faculties and support units, building a culture of unity. Unspent funding is allocated back to Faculties in accordance with the terms of reference approved by the Provost and Deans. These allocations support strategic priorities of the Faculties consistent with the Institutional Strategic Plan.
Figure 114 is a visual representation of the 2022-23 budget, using the details of the revenue and expense allocation model shown in Figure 115. This model reports the full operating budget and portrays expenses as a percentage of revenues allocated to each Faculty and in total. The model identifies three Faculties generating net positive contributions and three Faculties requiring additional funding from these positive contributions to support their operations. Through guidance from the Strategic Academic Leadership Team (SALT), this model reports all tuition allocated to the course students take and the Faculty the course belongs to, regardless of a student’s home Faculty. Taking a student-centric approach, allocating tuition based on a 100 per cent students-in-seats model, facilitates the ongoing review of academic program requirements and supports increased flexibility in programs for students to take additional elective credits. Going forward, the model will continue to be evaluated and adjustments to the model will be made, in consultation with the SALT, where appropriate to ensure the model is meeting its goals as well as supporting the Institutional Strategic Plan.
100%
Figure 114:
Budget costs as a percentage of total revenue140108040200600120160 TotalFOSSFMSFOHFOEGSBFAHS16 55121163 141574610 141569575218613 Space costsDirect costs 105 87 119 137 93 101 95 Scholarships Academic and student support Overhead 8617141010 481015119 53161358
3. Establishes an incentive mechanism to ensure year-end surplus funds are allocated to the Faculties and to support institutional strategic priorities.
Figure 114: 2022-23
ReportBudget2022-23 86MODELALLOCATION 115:Figure Budget2022-23–modelallocationexpenseandRevenue SocialofFacultyMathematicsofFacultyofFacultyofFacultySchoolGoodmanAppliedofFaculty($000s)HealthSciencesofBusinessEducationHumanitiesandScienceSciencesTotal Revenue (undergraduate)FacultyteachingbytuitionGlobal21,70727,25212,44618,24733,63146,529159,812 (graduate)FacultyteachingbytuitionGlobal2,9154,5661,4136302,5103,97116,005 tuitionProgramStudentInternational13,60393534514,883 revenueDirect6371,3721,7715932,5126447,529 92,30523,89910,6378,3129,69212,15327,612Grant revenuegrantFundSupportResearch50041701508596592,279 revenueTotal53,37158,98726,32727,93250,49475,702292,813 marginsContribution costspersonnelongoingDirect22,67025,47713,68019,27820,24933,550134,904 costspersonneltemporaryDirect4,3253,3485,2733,5762,8175,74625,085 costsoperatingDirect8922,9476168279381,0317,251 bursaries)andscholarships(beforemarginContribution25,48427,2156,7584,25126,49035,375125,573 fellowshipsandbursariesScholarships,6,8773,6651,6612,9205,2886,06226,473 bursaries)andscholarships(aftermarginContribution18,60723,5505,0971,33121,20229,31399,100 costsSpace 18,7623,5914,6352,8022,5601,7513,423costsSpace (1,471)costs)space(aftercontributionNet15,18421,7992,53716,56725,72280,338 unitssupportstudent-specificandAcademic (1)StoresScienceandServicesTechnicalEnterprise,Research1,6591071834032,9081,9937,253 StudiesGraduateofFaculty197553184701574001,561 Library3,0902,3211,3181,3391,7033,69413,465 InnovationPedagogicalforCentre229172991001272731,000 (2)unitSpecificStudentandAcademicOther4,6413,4701,9671,9642,5325,51220,086 (5,347)(1,214)allocations)overhead(beforecontributionNet5,36815,1769,14013,85036,973 allocationsOverhead (3)servicesShared6,0465,5542,9213,5563,8487,47529,400 (1,369)(376)(172)(134)(134)(236)(317)contributionResidenceandoperationsAncillary Capital1,7931,3527747819982,1417,839 GlobalUniversity7685803516558159374,106 (3,003)(10,205)(5,126)(2,922)contributionNet7,9263,6513,673 revenue.ofpartasseparatelyshownasrevenuegrantFundSupportResearchExcludes(1) ContinuingandProfessionalandRecreation,andSportsBrockEducation,ExperientialandCareerCo-op,Services,InternationalBrockSuccess,andLifeStudentAccessibility,andWellnessStudentServices,StudentAboriginalRegistrar,theofOfficetheincludesSpecific''Student(2) ESL.andStudies ofOfficeSecretariat,UniversityServices,EquityandRightsHumanRelations,AlumniandDevelopmentCommunications,andMarketingResources,HumanServices,FinancialServices,TechnologyInformationTeam,AdministrativeandAcademicSeniorincludesServicesShared(3) CounselLegalandManagementRiskUniversityandAuditInternalPlanning,andAnalysisInstitutionalEngagements,CommunityandRelationsGovernment
ReportBudget2022-23 87MODELALLOCATION


• During 2021-22, $0.44 million of internal chargeback revenue and expense was eliminated between Co-op, Career and Experiential Education and the Goodman School of Business. This is in line with the Fiscal Framework guidance to eliminate chargebacks where possible.
ReportBudget2022-23 88APPENDICES Appendix B
• Full-time equivalent (FTE) enrolment: One undergraduate fiscal FTE (FFTE) represents a student whose study load in the fiscal year is equal to the normal full-time study load for their program and level of registration in the academic year. Undergraduate student FFTEs are summed over all academic terms. One graduate FTE is based on the registration level, full-time or parttime, of a student for an academic term; full-time = 1.000 FTEs, part-time = 0.300 FTEs. Graduate student FTEs are summed over Fall and Summer academic terms; This methodology aligns with the student-based FTEs reported to the Ministry and ensures that a single student, whether undergraduate or graduate, is treated equally as a full-time equivalent. Undergraduate FFTEs and graduate FTEs, when considered in combination, are termed FTEs. Note: certain new-entry winter registrations were also added to FTEs to more accurately reflect actual and budgeted tuition.
• Headcount enrolment: A snapshot of the number of individuals who are attending the University at a particular point in time, usually Nov. 1 of each Academic Year, and the response to the commonly asked question: “How many students does Brock have?”
• Fiscal full-time equivalent (FFTE) enrolment: Graduate FFTEs are equal to graduate FTEs; however, they are summed over all academic terms. Undergraduate FFTEs and graduate FFTEs, when considered in combination, are termed FFTEs.
• During 2021-22, budgets for positions of $0.76 million were established and funded from additional grants received from the MCU ($0.1 million), strategic reserve funds ($0.65 million) and other operating costs ($0.01 million). This resulted in an increase in personnel costs of $0.76 million, an increase in grant revenue of $0.10 million, an increase in internal chargebacks of $0.04 million, an increase in interfund revenue of $0.61 million, and a decrease in other operating expenses of $0.01 million.
• Eligible FTEs: Those that are associated with programs or students that are approved by the Ontario government for funding purposes. Certain categories of students are ineligible (international, additional qualification and coop on work term being the three largest groups).
Summary of budget adjustments
• Weighted grant units (WGUs): WGUs are used in reporting enrolment to the Ontario government for funding purposes and represent a weighted enrolment measure. The WGUs for Brock University range from 1.0 for General Arts to 3.2 for PhD students.
Appendix A Enrolment definitions The following are measures of enrolment, as reported in this budget report.
• Degree-seeking: A student seeking either a bachelor’s degree, a first professional degree, or a graduate master’s or PhD degree.
• All-in enrolment: Includes degree-seeking, non degreeseeking, additional qualifications and certificate programs.
Figure 116: Reclassifications by function ($000s) approved2021-22budget(1) Reclass. adjusted2021-22budget Revenue Student fees 196,563 196,563 Grant revenue 97,612 96 97,708 Internal chargebacks 9,044 (403) 8,641 Inter-fund revenue 6,838 624 7,462 Other revenue 48,410 (4) 48,406 Total revenues 358,467 313 358,780 Operating costs Personnel costs (233,001) (760) (233,761) Inter-fund expense (26,610) (26,610) Other operating costs (102,335) 447 (101,888) Total operating costs (361,946) (313) (362,259) Mitigation target 3,479 3,479 Funding deficit - -(1) Agrees to the 2021-22 Budget Report Appendices
As a result of certain changes in preparing the 2022-23 budget as well as changes that occurred during the 2021-22 year, reclassifications were made to the 2021-22 budget as reported in the 2021-22 Budget Report for comparison purposes when the overall funding budget was not impacted. Figures 116 and 117 detail these reclassifications by function and by responsibility centre with the most notable reclassifications highlighted with explanations. Faculty and staff full-time equivalent (FTE) impacts related to the adjustments are also shown in Figure 117.
• Non-degree-seeking undergraduate: Those on a Letter of Permission, those auditing a course/program, or someone enrolled in undergraduate courses but with no program declaration.
Reclassifications by function
Figure 117: Reclassifications by responsibility centre (continued) ($000s) approved2021-22budget(1) Salaryreclassesincreaserate&other adjusted2021-22budget 2021-22FTEchanges
ReportBudget2022-23 89APPENDICES
• During 2021-22, internal chargeback costs of $0.44 million between Co-op, Career and Experiential Education and the Goodman School of Business were removed.
• During 2021-22, a $0.24 million budget was established for the Professional and Continuing Studies Unit. This was moved from Senior Academic and Administrative Team to its own responsibility centre.
Figure 117: Reclassifications by responsibility centre ($000s) approved2021-22budget(1) Salaryreclassesincreaserate&other adjusted2021-22budget 2021-22FTEchanges
• During 2021-22, changes to Brock International occurred to better align with the Institutional Strategic Plan. International Market Development moved from Brock International to the Office of the Registrar. The budget related to this move is $2.25 million. English as a Second Language (ESL) moved to the Professional and Continuing Studies unit in the amount of $0.4 million.
• For the 2022-23 budget, Residence Life is being combined back together with Residence Operations under Ancillary. The budget amount related to this is $1.55 million.
• During 2021-22, $0.96 million of personnel rate increases were allocated out from the University Global responsibility centre to other units throughout the University, as these specific amounts were not known at the time of preparing the 2021-22 budget. This total of $0.96 million related to salary increases to administrative/professional staff.
Human Rights and Equity Services (1,224) (12) (1,236) University Secretariat (857) (10) (867) Office of Government and Community Engagements (614) (6) (620) Institutional Analysis and Planning (375) (4) (379) Internal Audit and University Risk Management (390) (8) (398) Total Shared Services (26,959) (27) (26,986) Space Facilities Management (14,833) (55) (14,888) Campus Security Services (2,475) (28) (2,503) Campus Development and Community Agreements (2,124) (2) (2,126) Utilities, Taxes and Insurance (7,309) (7,309) Financing (9,290) (9,290) Total Space (36,031) (85) (36,116) Global Scholarships, Bursaries and Fellowships (22,514) (22,514) Capital (6,241) (6,241) University Global 273,324 964 274,288 Total Global 244,569 964 245,533 Total University (3,479) - (3,479) 5.7
Shared Services Senior Academic and Administrative Team (4,961) 221 (4,740) (0.8) Information Technology Services (7,803) (96) (7,899) Financial Services (3,279) (33) (3,312) Human Resources (4,139) (46) (4,185) Marketing and Communications (2,181) (21) (2,202) Development and Alumni Relations (1,136) (12) (1,148) 0.3
Reclassifications by responsibility centre
Teaching Faculties Faculty of Applied Health Sciences (25,767) (40) (25,807) 0.5 Goodman School of Business (30,322) 389 (29,933) (1.0) Faculty of Education (17,656) (35) (17,691) Faculty of Humanities (23,238) (20) (23,258) Faculty of Mathematics and Science (23,389) (62) (23,451) 3.5 Faculty of Social Sciences (38,907) (32) (38,939) Total Teaching Faculties (159,279) 200 (159,079) Academic Support Faculty of Graduate Studies (1,204) (10) (1,214) Library (10,855) (25) (10,880) Research Enterprise (2,495) (32) (2,527) Centre for Pedagogical Innovation (915) (12) (927) Professional and Continuing Studies and ESL 165 165 10.5 Total Academic Support (15,469) 86 (15,383) Student Specific Office of the Registrar (3,664) (2,299) (5,963) 9.0 Student Wellness and Accessibility (1,618) (48) (1,666) Student Life and Success (1,392) (20) (1,412) Brock International (3,427) 1,823 (1,604) (18.0) Aboriginal Student Services (4) (4) Co-op, Career and Experiential Education (1,435) (494) (1,929) Brock Sports and Recreation (1,223) (47) (1,270) Residence Life (1,549) 1,549 (7.0) Total Student Specific (14,308) 460 (13,848) Ancillary Ancillary Operations 1,779 (38) 1,741 Residence Services 2,219 (1,560) 659 (7.0) Total Ancillary 3,998 (1,598) 2,400 (1) Agrees to the 2021-22 Budget Report.
10. Post-retirement benefits – The NFPS adjustment represents an estimate of the actuarially determined adjustment to employee future benefits related to current service. An adjustment is required because this amount represents an expense in the NFPS Financial Statements; however, since it doesn’t reflect a cash outflow, it is not recorded in the funding basis.
Reconciliation of funding budget to financial statements
NFPS Adjustments
9. Non-capital purchases in capital and related project fund – Non-capital purchases (including personal costs) made in the capital and related project fund are reported as an expense in the NFPS Financial Statements but are not recorded in the funding basis as the spending is not directly out of operating. In 2022-23, $3.30 million of non-capital purchases is estimated to be made, which is included as part of the NFPS adjustment.
7. Principal payments – Principal payments of long-term debt represent cash outflows and therefore are recorded as expenses on a funding basis. These payments are not considered expenses in the NFPS Financial Statements, as they reduce a liability. The 2022-23 budgeted principal payments have been eliminated in the NFPS adjustments.
2. Capital Grants – The Facilities Renewal Program Funds received by the University are used for capital purchases and are included as part of deferred capital contributions in the NFPS Financial Statements and later amortized over the useful life of the capital items it funded. However, on a funding basis, this grant is recorded as revenue. The NFPS adjustment represents the 2022-23 budget for the Facilities Renewal Program Funds.
3. Research, including fellowships – Research grants for restricted purposes and the offsetting research expenses, including fellowships, have not been included as part of the funding budget; however, they are included as part of the NFPS Financial Statements. An estimate has been included as part of the NFPS adjustments, based on the average of the prior three years’ actual figures (2018-19 to 2020-21).
8. Capital purchases – Capital purchases made as part of operating spending are recorded as an expense on a funding basis, while they are recorded as an asset in the Statement of Financial Position for NFPS purposes. The University expects purchases of $1.66 million in the 2022-23 budget to actually be capitalized, which is included as part of this NFPS adjustment.
11. Pension – The annual pension liability payment of $3.34 million calculated by the University’s actuary is recorded as an expense in the funding budget, as it represents a cash outflow. However, $1.46 million of the $3.34 million represents the estimated paydown of the pension liability if the actuarial assumptions are met. The NFPS Financial Statements do not require this amount to be expensed, as it is shown as a reduction to the pension liability and therefore it is included in the NFPS adjustments.
5. Endowment and trust spending – Spending in the endowment fund and non-endowed trust fund, mainly in the form of scholarships, is included as an expense, with an offsetting revenue as part of the NFPS Financial Statements. This spending is not recorded as part of operating expenses on a funding basis (with the exception
Appendix C
The University’s funding budget is prepared on a funding basis, which represents committed cash. The funding basis should not be confused with the audited Financial Statements, which are prepared in accordance with accounting standards for not-for-profits (NFPS). To allow for comparison to the annual Financial Statements, the budget has also been prepared based on the NFPS. In order to accomplish this task, certain accounting entries and reclassifications are required. Figures 118 and 119 detail these entries, with the following explanations.
1. Course fee spending – Course fee revenue, along with the offsetting spending, is included as part of the NFPS Financial Statements. This revenue and spending is not recorded on a funding basis. An estimate of the 2022-23 course fee spending, along with the offsetting revenue, has been included as part of the NFPS adjustments.
ReportBudget2022-23 90APPENDICES of inter-fund transactions). The approved endowment spending for 2022-23 and an estimate of the trust spending for 2022-23 has been included as part of the NFPS adjustments, along with the offsetting revenue.
6. Proceeds of asset sales – The net proceeds of the Hamilton campus will be recorded on a funding basis as the cash is received, while the NFPS statements will record the gain on sale of these assets in accordance with accounting standards. This adjustment represents the difference in these methods – $7.9 million funding vs. $0.2 million NFPS.
4. Amortization, net – Amortization is a non-cash expense and is therefore not included in the funding basis. For Financial Statement purposes, capital asset amortization is recorded to reflect the usage of capital assets, and amortization of deferred capital contributions (restricted external donations and grants) is amortized over the useful life of the assets they have funded. The 2022-23 forecasted amortization figures are included as part of the NFPS adjustments.
11,948 (11,948)Inter-fund revenue 11,981 (11,981)Research revenue 12,695 3 12,695 Other revenue 62,176 6,150 4-6 68,326 Total revenue 389,962 16,401 (11,981) (11,948) 382,434 Operating costs Personnel costs (245,830) (2,008) 3,9-11 (247,838) Inter-fund expense (32,690) (1,402) 3,5 34,092 Other operating costs (114,445) (38,719) 1,3-5,7-9 11,948 (141,216) Total costs (392,965) (42,129) 34,092 11,948 (389,054) Funding surplus/deficit (3,003) (25,728) 22,111 - (6,620)
Revenue
Grant
Internal
ReportBudget2022-23 91APPENDICES Figure 119 Notes Reconciliation of NFPS adjustments ($000s) 1 Course fee revenue 509 2 Capital grants (2,953) 3 Research, including fellowships 12,695 4 Amortization of deferred capital contributions 9,517 5 Endowment and trust spending 4,325 6 Proceeds of asset sales (7,692) Total revenue adjustments 16,401 1 Course fee spending (509) 3 Research spending – personnel (3,237) 3 Research spending – operating costs (9,458) 4 Amortization of capital assets (27,150) 5 Endowment and trust spending (4,325) 7 Principal payments 2,492 8 Capital purchases in operating 1,655 9 Capital and infrastructure project reserves spending –personnel (478) 9 Capital and infrastructure project reserves spending –operating (2,826) 10 Post-retirement benefits 244 11 Pension 1,463 Total costs adjustments (42,129) Internal chargebacks Internal chargeback revenue and the offsetting expenses of $11.95 million are included in the funding basis; however, they are eliminated in the NFPS Financial Statements as they only represent internal charges between departments. Inter-fund Transfers Activity, including expenses and externally-funded revenue in the internally restricted funds, is recorded as part of the NFPS Financial Statements. For the purposes of the budget, the net change in these reserves are assumed to be negligible. However, the transfers to and from these funds are reported on a funding basis as they represent committed cash transactions. The budgeted inter-fund revenue of $11.98 million and inter-fund expenses of $32.69 million are eliminated as part of NFPS Financial Statements as they only represent internal movement of funds. Refer to pages 32 and 39 for explanations of these transfers.
Figure 118 ($000s) 2022-23FundingBudget adjustmentsNFPS FigureNotes–see119 inter-fundEliminatetransfers chargebacksEliminateinternal 2022-23NFPSbudget Student 204,268 509 1 204,777 revenue 99,589 (2,953) 2 96,636 chargebacks
fees
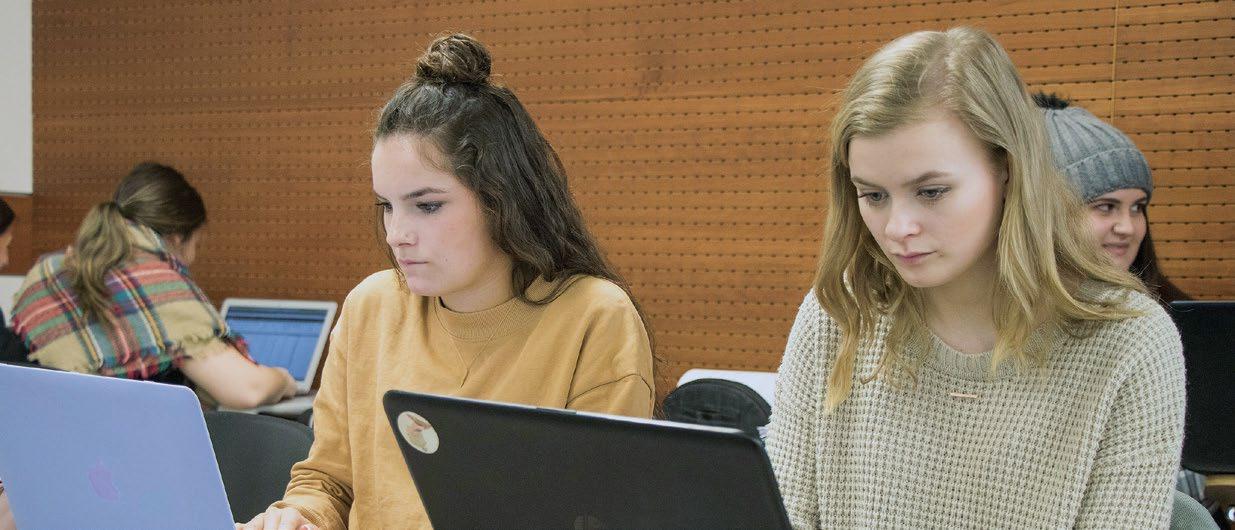
Figure 121 details the 2022-23 non-government-funded program rates that were proposed to and approved by the Board of Trustees in December 2021 and March 2022.
Figure 121: Brock University board approved 2022-23 rate increases International program types Tuition increase Undergraduate international students – all years with the exception of Years 4 and 5 8.0% Undergraduate international students – Years 4 and 5 5.0% Graduate international students (Research programs) 0% Graduate international students (Professional programs) 5.0% International student programs (ISPs) 5.0% Other programs Continuing Teacher Education – Additional Qualification courses (AQ) 1.46% Intensive English Language Program (IELP) (online) 4.00% Intensive English Language Program (IELP) (in person) 2.86% Tuition fee policy, non-governmentfunded programs International students in undergraduate and graduate programs and cost-recovery programs are not eligible for provincial government funding, and therefore universities are not governed by the government’s tuition policy in setting tuition rates for this student group. A differentiated approach is taken to account for demand after benchmarking to fees charged at other Ontario universities. Note: Starting in 2022-23, a cohort model will be introduced for undergraduate international tuition rates where each year, Year 1 students will see an eight per cent increase followed by rates frozen for four additional years.
Appendix D
Figure 120 MCU tuition guidelines Undergraduate programs 0.0% Graduate programs 0.0% Average tuition decrease 0.0% Brock University Board-approved 2022-23 rates Undergraduate programs 0.0% Graduate programs 0.0% Average tuition decrease 0.0%
Tuition fee policy, government-funded programs On March 29, 2019, the MCU introduced a new tuition fee framework. The framework imposed a 10 per cent reduction to all existing tuition fees for publicly assisted programs with a subsequent freeze on tuition rates in 2020-21. This tuition fee framework was extended with a continued mandatory tuition freeze in 2021-22 and 2022-23. The approved fee changes for the 2022-23 academic year are detailed in Figure 120.
ReportBudget2022-23 92APPENDICES


Appendix E Multi-year financial results on a funding basis ReportBudget2022-23 93APPENDICES Figure 122 ($000s) 2019-20 Actual 2020-21 Actual 2021-22 Budget 2021-22 Forecast 2022-23 Budget Revenue Student fees 185,078 186,012 196,563 188,477 204,268 Grant revenue 96,788 106,724 97,708 99,372 99,589 Internal chargebacks 8,484 3,098 8,641 7,662 11,948 Inter-fund revenue 4,920 8,843 7,462 8,345 11,981 Other revenue 51,707 24,319 48,406 46,679 62,176 Total revenue 346,977 328,996 358,780 350,535 389,962 Operating costs Personnel costs (220,419) (214,657) (233,761) (222,323) (245,830) Inter-fund expenses (25,900) (18,143) (26,610) (27,799) (32,690) Other operating costs (93,000) (83,302) (101,888) (102,537) (114,445) Total operating costs (339,319) (316,102) (362,259) (352,659) (392,965) Mitigation target 3,479 2,124 3,003 Funding surplus/(deficit) 7,658 12,894 - -

ReportBudget2022-23 94APPENDICES Appendix F
Viability ratio
The viability ratio is a basic determinant of an institution’s financial health, as it provides an indication of the funds on hand to settle its long-term obligations. It is calculated as expendable net assets over long-term debt. Expendable net assets include unrestricted surplus (deficit), internally restricted net assets and internally restricted endowments, adjusted for the non-cash component of employee future benefits. Long-term debt is total external long-term debt as disclosed in the institution’s financial statements without adding the current portion that may be included in accounts payable.
Expendable Net Assets include unrestricted surplus (deficit), internally restricted net assets, and internally restricted endowments, adjusted for the non-cash component of employee future benefits.
Financial health metrics definitions
The primary reserve ratio compares expendable net assets to total expenses and provides an indication of an institution’s financial strength and flexibility by determining how long the institution could function using its expendable reserves without relying on additional net assets generated by operations.
Primary reserve ratio
The Interest burden ratio compares the level of current debt service with the institution's total expenses. It is an indicator of debt affordability, as it examines the percentage of total expenses used to cover an institution’s cost of servicing its debt. The ratio is calculated as interest expense over total expenses (adjusted for amortization of capital assets). Interest burden ratio = interest expense/ (total expenses –amortization) Interest coverage ratio
Interest coverage ratio measures how many times an institution could pay its current interest payment with its available earnings. The ratio is calculated by dividing earnings before interest, depreciation and amortization (EBIDA) during a given period by the amount an institution must pay in interest on its debts during the same period. Interest coverage ratio expenseEBIDA/interest=
Viability ratio = expendable net assets/ long-term debt
Net revenuesoperatingratio
The net operating revenues ratio provides an indication of the extent to which institutions are generating positive cash flows in the long run to be financially sustainable. The ratio is calculated as cash flow from operating activities over total revenues.
Net revenuesoperatingratio = cash flow from revenuesactivities/totaloperating
The debt burden ratio measures how an institution utilizes a greater portion of its annual expenditures to fund debt obligations. The ratio is calculated by dividing total current debt obligations, which include interest expenses and principal payments, by operating expenses. Debt burden ratio = (interest expense + principal payments)/ total expenses Interest burden %
Primary reserve ratio = expendable net assets/ total expenses Debt burden ratio (Non-cash basis)
Figure 123 Metric Definition Formula

Brock University Niagara Region 1812 Sir Isaac Brock Way St. Catharines, ON L2S 3A1 Canada 905 688 5550 budgetreport@brocku.ca brocku.ca/finance STRATEGIC PRIORITIES ExperienceStudent EngagementCommunity InclusivityResearch
