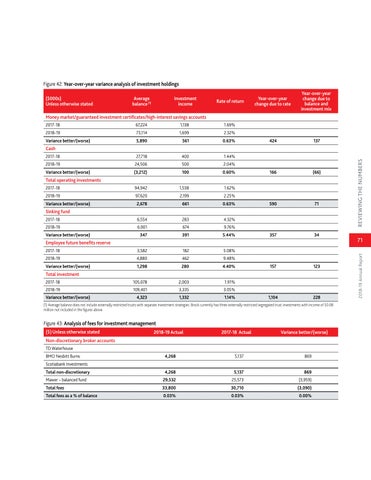
Figure 42: Year-over-year variance analysis of investment holdings ($000s) Unless otherwise stated
Average balance (1)
Investment income
Rate of return
Year-over-year change due to rate
Year-over-year change due to balance and investment mix
424
137
166
(66)
590
71
357
34
157
123
1,104
228
Money market/guaranteed investment certificates/high-interest savings accounts 2017-18
67,224
1,138
1.69%
2018-19
73,114
1,699
2.32%
Variance better/(worse)
5,890
561
0.63%
2017-18
27,718
400
1.44%
2018-19
24,506
500
2.04%
Variance better/(worse)
(3,212)
100
0.60%
2017-18
94,942
1,538
1.62%
2018-19
97,620
2,199
2.25%
Variance better/(worse)
2,678
661
0.63% 4.32%
Sinking fund 2017-18
6,554
283
2018-19
6,901
674
9.76%
Variance better/(worse)
347
391
5.44%
Employee future benefits reserve 2017-18
3,582
182
5.08%
2018-19
4,880
462
9.48%
Variance better/(worse)
1,298
280
4.40%
2017-18
105,078
2,003
1.91%
2018-19
109,401
3,335
3.05%
4,323
1,332
1.14%
Total investment
Variance better/(worse)
(1) Average balance does not include externally restricted trusts with separate investment strategies. Brock currently has three externally restricted segregated trust investments with income of $0.08 million not included in the figures above.
Figure 43: Analysis of fees for investment management ($) Unless otherwise stated
2018-19 Actual
2017-18 Actual
4,268
5,137
Variance better/(worse)
Non-discretionary broker accounts TD Waterhouse BMO Nesbitt Burns
869
Scotiabank Investments Total non-discretionary
4,268
5,137
869
Mawer – balanced fund
29,532
25,573
(3,959)
Total fees
33,800
30,710
(3,090)
Total fees as a % of balance
0.03%
0.03%
0.00%
71 2018-19 Annual Report
Total operating investments
REVIEWING THE NUMBERS
Cash