The 2022 Midterms – Results from Exit Polling
Key Findings from 2022 Exit Polling
Presented by Cornell Belcher
@cornellbelcher

The Results of the 2022 Midterm Elections
to the postwar midterm average
Seat Change in the House of Representatives for President’s Party in Midterm Elections Since WWII

(Dashed line represents the average of 1946-2018: -26.4)
Since World War II, when a President’s approval rating is below 50%, his party loses an average of 43 seats in his first midterm*
*Source: NPR
KEY FINDINGS FROM THE 2022 ELECTION @cornellbelcher
3
While Democrats lost House seats, they dramatically overperformed relative
-55 -28 -18 -48 -4 -48 -12 -48 -15 -26 -5 -8 -54 5 8 -30 -63 -13 -40 -9 -75 -50 -25 0 25 1946 1950 1954 1958 1962 1966 1970 1974 1978 1982 1986 1990 1994 1998 2002 2006 2010 2014 2018 2022
Democrats also bucked historical trend by gaining a seat in the Senate
Seat Change in the Senate for President’s Party in Midterm Elections Since WWII
(Dashed line represents the average of 1946-2018: -3.8)
KEY FINDINGS FROM THE 2022 ELECTION @cornellbelcher
4
-12 -5 -1 -12 2 -4 1 -4 -3 1 -8 -1 -8 0 1 -6 -6 -9 2 1 -20 -15 -10 -5 0 5 1946 1950 1954 1958 1962 1966 1970 1974 1978 1982 1986 1990 1994 1998 2002 2006 2010 2014 2018 2022
Source: NPR
Change in Governorships for President’s Party in Midterm Elections Since WWII
(Dashed line represents the average of 1946-2018: -4.4)
The only other postwar gain in governorships occurred in 1986, during the Reagan admin.
KEY FINDINGS FROM THE 2022 ELECTION @cornellbelcher
5 -3 -6 -8 -6 0 -8 -11 -5 -5 -7 8 -1 -10 0 -1 -6 -6 -3 -6 2 -20 -15 -10 -5 0 5 10 1946 1950 1954 1958 1962 1966 1970 1974 1978 1982 1986 1990 1994 1998 2002 2006 2010 2014 2018 2022
For the first time since WWII, Democrats gained governorships in a midterm election—a historic result
National Trends
KEY FINDINGS FROM THE 2022 ELECTION @cornellbelcher
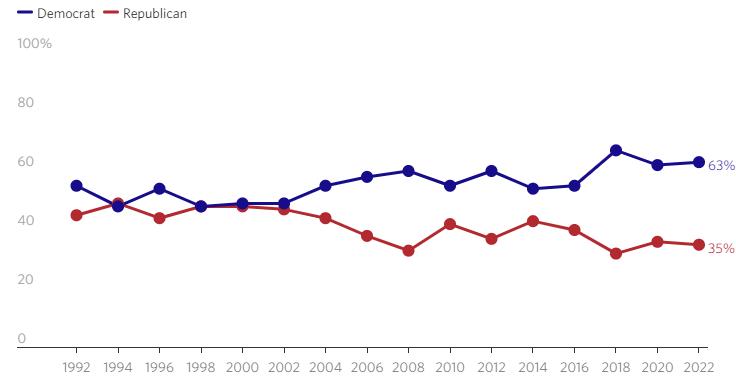
Since the Civil Rights Act of 1964, Democrats have not won a majority of the white vote
57 59 51 41 47 68 52 56 66 60 40 46 55 58 55 59 58 58 58 43 41 49 59 38 32 48 36 34 40 39 43 42 41 43 39 37 41 40 0 10 20 30 40 50 60 70 80 1952 1956 1960 1964 1968 1972 1976 1980 1984 1988 1992 1996 2000 2004 2008 2012 2016 2020 2022 Republican Democrat
Source: exit polls (as of 12/15/20)
LBJ/ Civil Rights Act
Joe Biden
“We have lost the South for a generation.”
7
-Lyndon Johnson, upon signing the Civil Right Act, 1964
Barack Obama
Bill Clinton
Jimmy Carter
Midterm Voters by Race
KEY FINDINGS FROM THE 2022 ELECTION @cornellbelcher
79% 77% 75% 72% 73% 10% 11% 12% 11% 11% 8% 8% 8% 11% 11% 2% 2% 3% 3% 2% 2% 2% 2% 3% 3% 0% 20% 40% 60% 80% 100% 2006 2010 2014 2018 2022
The 2022 electorate was as white as it was in 2018, halting the trend of increasing diversity in midterm electorates
White Black Hispanic Asian Other 8 Source: exit polls (as of 11/15/22)
Racial Makeup of the Electorate: Presidential Elections
Source: exit polls (as of 11/15/22)
KEY FINDINGS FROM THE 2022 ELECTION @cornellbelcher
9
The 2022 electorate was as white as it was in 2018, halting the trend of increasing diversity in midterm electorates
the
13% 9% 2% 74% 2% 2008 13% 10% 3% 72% 2% 2012 12% 11% 4% 71% 2% 2016 13% 13% 4% 67% 4% 2020 10% 8% 2% 79% 2% 2006 11% 8% 2% 77% 2% 2010 12% 8% 3% 75% 2% 2014 11% 11% 3% 72% 3% 2018 11% 11% 2% 73% 3% 2022
Racial Makeup of
Electorate: Midterm Elections
Women
Party Support by Gender
(Showing net support for Democrats in elections since 2004; dashed lines indicate the trend)
In 2022, 53% of women supported Democrats while 45% supported Republicans. Among men, 42% supported Democrats and 56% supported Republicans.
Source: exit polls (as of 11/15/22)
KEY FINDINGS FROM THE 2022 ELECTION @cornellbelcher
10 -11% 3% 1% -14% -7% -16% -12% -4% -8% -14% 3% 12% 13% -1% 11% 4% 12% 19% 15% 8% -20% -10% 0% 10% 20% 2004 2006 2008 2010 2012 2014 2016 2018 2020 2022 More Republican More Democratic
voters have moved towards Democrats over time, and a 20-point difference in party support between men and women voters has persisted since 2014
Women
Men
Party Support by Gender – Midterms Only
(Showing net support for Democrats in midterm elections since 2006; dashed lines indicate the trend)
Men Women
Women voted more heavily Democratic in 2018 and 2006, but these were both wave Democratic years under extremely unpopular Republican administrations. In the context of a Democratic administration, 2022 was a high point for support from women.
Source: exit polls (as of 11/15/22)
KEY FINDINGS FROM THE 2022 ELECTION @cornellbelcher
11 3% -14% -16% -4% -14% 12% -1% 4% 19% 8% -20% -10% 0% 10% 20% 2006 (W. Bush) 2010 (Obama) 2014 (Obama) 2018 (Trump) 2022 (Biden) More Republican More Democratic
In 2022, women supported Democrats by a larger margin than they had during the Obama midterms (2010 and 2014)
White Black Hispanic Asian
KEY FINDINGS FROM THE 2022 ELECTION @cornellbelcher
Democrats managed to equal Biden’s 2020 margins among white and Black voters, but Hispanic voters continue to trend more Republican
2014 electorate share 75% 12% 8% 3% Democrats 38% 89% 62% 49% Republicans 60% 10% 36% 50% 2014 Margin -22 +79 +26 -1 2018 electorate share 72% 11% 11% 3% Democrats 44% 90% 69% 77% Republicans 54% 9% 29% 23% 2018 Margin -10 +81 +40 +54 2020 electorate share 67% 13% 13% 4% Biden 41% 87% 65% 61% Trump 58% 12% 32% 34% 2020 Margin -17 +75 +33 +27 2022 electorate share 73% 11% 11% 2% Democrats 40% 86% 60% 58% Republicans 58% 13% 39% 40% 2022 Margin -18 +73 +21 +18 2014 to 2022 Margin Shift +4 -6 -5 +17 2018 to 2022 Margin Shift -8 -8 -19 -36 2020 to 2022 Margin Shift -1 -2 -12 -9 12
(as
11/15/22)
Source: exit polls
of
KEY FINDINGS FROM THE 2022 ELECTION @cornellbelcher
13
Men Women 2014 electorate share 49% 51% Democrats 41% 51% Republicans 57% 47% 2014 Margin -16 +4 2018 electorate share 48% 52% Democrats 47% 59% Republicans 51% 40% 2018 Margin -4 +19 2020 electorate share 48% 52% Biden 45% 57% Trump 53% 42% 2020 Margin -8 +15 2022 electorate share 48% 52% Democrats 42% 53% Republicans 53% 45% 2022 Margin -11 +8 2014 to 2022 Margin Shift +5 +4 2018 to 2022 Margin Shift -7 -11 2020 to 2022 Margin Shift -3 -7
Democrats won a majority of women in 2022 and had limited losses among men
Source: exit polls (as of 11/15/22)
KEY FINDINGS FROM THE 2022 ELECTION @cornellbelcher
14
White men White women Black men Black women Hispanic men Hispanic women 2014 electorate share 37% 38% 5% 7% 4% 4% Democrats 33% 42% 86% 91% 57% 66% Republicans 64% 56% 13% 8% 41% 32% 2014 Margin -31 -14 +73 +83 +16 +34 2018 electorate share 35% 37% 5% 6% 5% 6% Democrats 39% 49% 88% 92% 63% 73% Republicans 60% 49% 12% 7% 34% 26% 2018 Margin -21 0 +76 +88 +29 +47 2020 electorate share 35% 32% 4% 8% 5% 8% Biden 38% 44% 79% 90% 59% 69% Trump 61% 55% 19% 9% 36% 30% 2020 Margin -23 -11 +60 +81 +23 +39 2022 electorate share 36% 37% 5% 6% 5% 6% Democrats 35% 45% 82% 88% 53% 66% Republicans 63% 53% 17% 10% 45% 33% 2022 Margin -28 -8 +65 +78 +8 +33 2014 to 2022 Margin Shift +3 +6 -8 -5 -8 -1 2018 to 2022 Margin Shift -7 -8 -11 -10 -21 -14 2020 to 2022 Margin Shift -5 +3 +5 -3 -15 -6
While support from Black men and white women has rebounded since 2020, Hispanic voters have moved significantly towards the Republican party
Source: exit polls (as of 11/15/22)
KEY FINDINGS FROM THE 2022 ELECTION @cornellbelcher
15
18-44 45+ 18-29 30-44 45-64 65+ 2014 electorate share 35% 65% 13% 22% 43% 22% Democrats 51% 44% 54% 50% 45% 41% Republicans 46% 54% 43% 48% 53% 57% 2014 Margin +5 -10 +11 +2 -8 -16 2018 electorate share 35% 65% 13% 22% 39% 26% Democrats 61% 49% 67% 58% 49% 48% Republicans 49% 50% 32% 39% 50% 50% 2018 Margin +12 -1 +35 +19 -1 -2 2020 electorate share 40% 60% 17% 23% 38% 22% Biden 56% 48% 60% 52% 49% 47% Trump 42% 51% 36% 46% 50% 52% 2020 Margin +14 -3 +24 +6 -1 -5 2022 electorate share 34% 66% 12% 21% 39% 28% Democrats 55% 44% 63% 51% 44% 43% Republicans 42% 54% 35% 47% 54% 55% 2022 Margin +13 -10 +28 +4 -10 -12 2014 to 2022 Margin Shift +8 0 +17 +2 -2 +4 2018 to 2022 Margin Shift +1 -9 -7 -15 -9 -10 2020 to 2022 Margin Shift -1 -7 +4 -2 -9 -7
Younger voters supported Democrats levels similar to 2018 and 2020; for older voters, this election was closer to 2014
Source: exit polls (as of 11/15/22)
Meanwhile,
KEY FINDINGS FROM THE 2022 ELECTION @cornellbelcher
16 89% 9% 2% Black Voters 18-29 68% 30% 2% Latino Voters 18-29 58% 40% 2% White Voters 18-29 2020: 89% / 10% / 1% 69% / 28% / 3% 44% / 53% / 3% 2018: 92% / 7% / 1% 81% / 17% / 2% 56% / 43% / 1% 2016: 85% / 9% / 6% 68% / 26% / 6% 43% / 47% / 10% 2014: 88% / 11% / 1% 68% / 28% / 4% 43% / 54% / 3% 2012: 91% / 8% / 1% 74% / 23% / 3% 44% / 51% / 5%
White voters under 30 were more supportive of Democrats than in any election in the past 10 years
Source: exit polls (as of 11/15/22)
Democratic support remained high among young Black and Latino voters
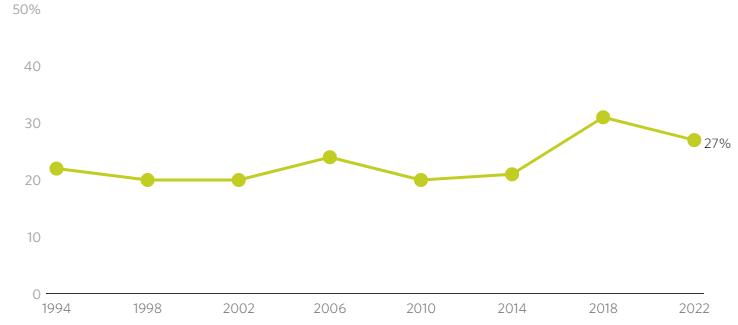
Early estimates
predict that
young
voter
turnout
surpassed all other recent midterms, except for 2018
At the same time, support for Democrats was higher in 2022 than it has been for all recent general elections, except for 2018
KEY FINDINGS FROM THE 2022 ELECTION @cornellbelcher
17
Estimated Voter Turnout in Midterms Among Voters 18-29 31% Estimated National House Vote Choice Among Voters 18-29 67% 32% 62% 36% 55% 40% 54% 43% 60% 37% 55% 42% 60% 33% 58% 38% 55% 44% 49% 47% 49% 48% 48% 48% 54% 44% 48% 49% 55% 45% 63% 35%
Source: CIRCLE at Tufts University
Democrats did much better among Independent voters than they had in 2014 or 2016 (although they didn’t do quite as well with Independents as they had in 2018 or 2020)
Source: exit polls (as of 11/15/22)
In 2016, Independent voters broke Republican by 6 points, 48% to 42%.
KEY FINDINGS FROM THE 2022 ELECTION @cornellbelcher
Dem Rep Ind 2014 electorate share 35% 36% 28% Democrats 92% 5% 42% Republicans 7% 94% 54% 2014 Margin +85 -89 -12 2018 electorate share 37% 33% 30% Democrats 95% 6% 54% Republicans 4% 94% 42% 2018 Margin +91 -88 +12 2020 electorate share 37% 36% 26% Biden 94% 6% 54% Trump 5% 94% 41% 2020 Margin +89 -88 +13 2022 electorate share 33% 36% 31% Democrats 96% 3% 49% Republicans 3% 96% 47% 2022 Margin +93 -93 +2 2014 to 2022 Margin Shift +8 -4 +14 2018 to 2022 Margin Shift +2 -5 -10 2020 to 2022 Margin Shift +4 -5 -11 18
Candidate Quality
NC-01: Sandy Smith (attended the Jan 6th riot, credibly accused of domestic abuse by family members, anti-abortion fanatic, opposes gay marriage, QAnon conspiracy theorist) defeated a moderate in the primary and lost what could have been a Republican flip
NC-13: Bo Hines (anti-abortion fanatic, ally of Madison Cawthorn, carpetbagger who moved into the district months before the election just to run for office there) lost a R-leaning district
TX-34: Mayra Flores (anti-abortion fanatic, opposes gay marriage, QAnon conspiracy theorist, and said January 6th was a false flag done by Antifa) lost a very winnable seat to Vicente Gonzalez
WA-03: In the biggest upset of the election, Joe Kent (anti-abortion fanatic, outright white nationalist, 2020 election denier) knocked moderate incumbent Republican Jaime Herrera Buetler out in the primary and then lost an easily winnable R district to a strong Democratic challenger, Marie Gluesenkamp Perez
AK-at-large: Sarah Palin split the Republican vote, throwing away an easy Republican victory in Alaska
PA-08: Jim Bognet (2020 election denier, anti-abortion fanatic, lost his district in 2020 even though Trump won it) lost for a second time in a rematch to Matt Cartwright
OH-09: J.R. Majewski (pro-Trump rapper, lied about his military service and got caught, was at the Capitol right before the Jan 6th insurrection) beat a more moderate Republican in the primary, then got blown out by 13 points in what should have been a tossup election
CO-03: MAGA whacko Lauren Boebert nearly lost a solidly red district
There are many, many more more stories like these.
KEY FINDINGS FROM THE 2022 ELECTION @cornellbelcher
20
In an election cycle where control of the House and Senate came down to razor-thin margins, candidate quality was one of the decisive factors in the GOP collapse
Despite much more favorable conditions for the GOP in 2022 compared to 2020, Rubio was the only Republican Senate candidate in a swing state to significantly improve on Trump’s 2020 margin
GOP Senate Candidate Margins Relative to Trump’s 2020 Margins
Data as of 11/16/22
The bar for Republicans in 2022 was incredibly low. If they had run candidates in PA, AZ, and GA who improved on Trump’s margin by just 1.25%, they would have won all three of those seats and a Senate majority. All they needed was an Adam Laxalt-level performance in those states.
However, even in a midterm election with 8% inflation and an unpopular Democratic president, the GOP somehow managed to do worse than Trump’s 2020 performance in 5 vital swing Senate seats and ultimately lost 4 of them.
KEY FINDINGS FROM THE 2022 ELECTION @cornellbelcher -4.5% -3.3% -1.8% -1.5% -0.6% 1.5% 1.7% 2.3% 13.1% -8% -6% -4% -2% 0% 2% 4% 6% 8% 10% 12% 14% 16% AZ: Masters PA: Oz NH: Bolduc OH: Vance GA: Walker NV: Laxalt WI: Johnson NC: Budd FL: Rubio
21
National Trends
Black voters, white voters, young votes, and college voters supported Democrats at levels comparable to 2020, while Hispanic voters, Asian voters, older voters, and non-college voters broke Republican
KEY FINDINGS FROM THE 2022 ELECTION @cornellbelcher
23
exit polls
-16% -4% -8% -14% 4% 19% 15% 8% -30% -20% -10% 0% 10% 20% 30% 2014 2018 2020 2022 Net Support by Gender -22% -10% -17% -18% 79% 81% 75% 73% 26% 40% 33% 21% -1% 54% 27% 18% -30% -15% 0% 15% 30% 45% 60% 75% 90% 2014 2018 2020 2022 Net Support by Race White Black Hisp Asian 5% 25% 14% 13% -10% -1% -3% -10% -30% -20% -10% 0% 10% 20% 30% 2014 2018 2020 2022 Net Support by Age 18-44 45+ -3% 20% 12% 10% -8% 0% -2% -12% -30% -20% -10% 0% 10% 20% 30% 2014 2018 2020 2022 Net Support by Education College Non-college
Source:
(as of 11/15/22)
Net Support by Gender and Age*
Source: exit polls (as of 11/15/22)
(Note: 2014 and 2018 data not available for these age and gender groups)
KEY FINDINGS FROM THE 2022 ELECTION @cornellbelcher
24
Young women were the only group to move more Democratic between 2020 and 2022, supporting the theory that Roe’s overturn mobilized young women
4% -3% -15% -20% 23% 26% 9% -1% -30% -20% -10% 0% 10% 20% 30% 2020 2022
18-44 men 45+ men 18-44 women 45+ women
Hispanic voters, especially Hispanic men, have moved away from the Democratic Party
Net Support by Race and Gender
Source: exit polls (as of 11/15/22)
KEY FINDINGS FROM THE 2022 ELECTION @cornellbelcher
25
-31% -21% -23% -28% -14% 0% -11% -8% 73% 76% 60% 65% 83% 85% 81% 78% 16% 29% 23% 8% 34% 47% 39% 33% -45% -30% -15% 0% 15% 30% 45% 60% 75% 90% 2014 2018 2020 2022
men White women Black men Black
Hisp
White
women
men Hisp women
Older voters of all races shifted Republican in 2022, but younger Black and white voters shifted more Democratic
Net Support by Race and Age
Older Hispanics moved an alarming 15pts towards Republicans between 2020 and 2022.
Source: exit polls (as of 11/15/22) (Note: 2018 data not available for these race and age groups)
KEY FINDINGS FROM THE 2022 ELECTION @cornellbelcher
26 -16% -14% -1% -26% -19% -25% 75% 67% 70% 82% 81% 74% 27% 34% 30% 26% 28% 13% -45% -30% -15% 0% 15% 30% 45% 60% 75% 90% 2014 2020 2022
White 18-44 White 45+ Black 18-44 Black 45+ Hisp 18-44 Hisp 45+
Among whites, college educated women were the only group that broke Democratic; non-college white men continue to move further away from Democrats
Net Support Among Whites by Gender and Education
Source: exit polls (as of 11/15/22)
(Note: 2014 data not available for these race and education groups)
KEY FINDINGS FROM THE 2022 ELECTION @cornellbelcher
27 20% 9% 14% -14% -27% -24% -4% -3% -7% -34% -42% -46% -50% -40% -30% -20% -10% 0% 10% 20% 30% 2018 2020 2022
White college women White non-college women White college men White non-college men
Swing States
See the next section for a fuller picture of the data, but the following quickly summarizes the shifts between 2020 and 2022
• Young voters (18-44) were key to Democrats beating expectations and defying historical trends
• In 7 out of 9 swing states, exit polls showed young men voting significantly more Democratic in 2022 than they had in 2020.
• In 4 out of 9 swing states, exit polls showed young women voting significantly more Democratic in 2022 than they had in 2020.
• White, college-educated women abandoned Republicans
• Nationwide, and in 6 out of 9 swing states, white college educated women voted significantly more Democratic in 2022 than they had in 2020
• Democrats continue to lose support from Hispanic voters
• Nationwide, and in 6 out of 9 swing states, Hispanics voted significantly more Republican in 2022 than they had in 2020
• This trend was particularly pronounced in Florida. In 2018 and 2020, Democrats won 53-54% of the Hispanic vote. But in 2022, that dropped to 41%.
Source: exit polls (as of 11/15/22)
KEY FINDINGS FROM THE 2022 ELECTION @cornellbelcher
29
In swing states, Democrats mostly lost ground among Hispanic voters and older voters, but gained ground among young voters and college-educated women
KEY FINDINGS FROM THE 2022 ELECTION @cornellbelcher
30 Source: exit polls (as of 11/15/22) Shift in Dem Margin (2020 to 2022) National AZ FL GA NV NH NC OH PA WI Better for Dems than 2020 Worse for Dems than 2020 Men 0 4 Women 2 2 White 3 2 Black 2 2 Hispanic 1 6 18-44 6 2 45+ 2 5 18-44 men 7 2 45+ men 1 5 18-44 women 4 2 45+ women 3 4 White college women 7 1 White non-college women 5 3 White college men 3 6 White non-college men 3 5 Total groups better 1 9 3 4 4 4 4 4 9 6 Total groups worse 9 3 10 3 6 5 5 4 1 6
The Dobbs Decision
Source: exit polls (as of 11/15/22)
(Note: Age and gender breakouts not available from 2014 or 2018 exit polls)
KEY FINDINGS FROM THE 2022 ELECTION @cornellbelcher
32
Younger women voters were vital to the Democrats in 2022; men and older women were less likely to vote Democratic than in 2020
18-44 Men 45+ Men 18-44 Women 45+ Women 2020 electorate share 19% 29% 21% 31% Biden 50% 42% 61% 54% Trump 46% 57% 38% 45% 2020 Margin +4 -15 +23 +9 2022 electorate share 16% 32% 18% 34% Democrats 47% 39% 62% 49% Republicans 50% 59% 36% 50% 2022 Margin -3 -20 +26 -1 2020 to 2022 Margin Shift -7 -5 +3 -10
Reasons to Support Democrat
(Showing coded open-ended responses for those saw ads for Democratic candidates)
I am a Democrat / Share their views
Reasons to oppose Republican
(Showing coded open-ended responses for those saw ads for Republican candidates)
Source: brilliant corners post-election poll (602 midterm voters from 15 battleground Congressional districts, plus oversample of 200 African American voters)
Democrats have done a good job
Support Trump / Say 2020 was stolen
Is for the people / Support Democracy
Dishonest / Bad character and values
Values and character / Is honest
The negative attack ads
Do not like GOP
Too extreme / Radical
Is more reasonable / GOP too extreme
Lack of experience, unqualified
KEY FINDINGS FROM THE 2022 ELECTION @cornellbelcher
33
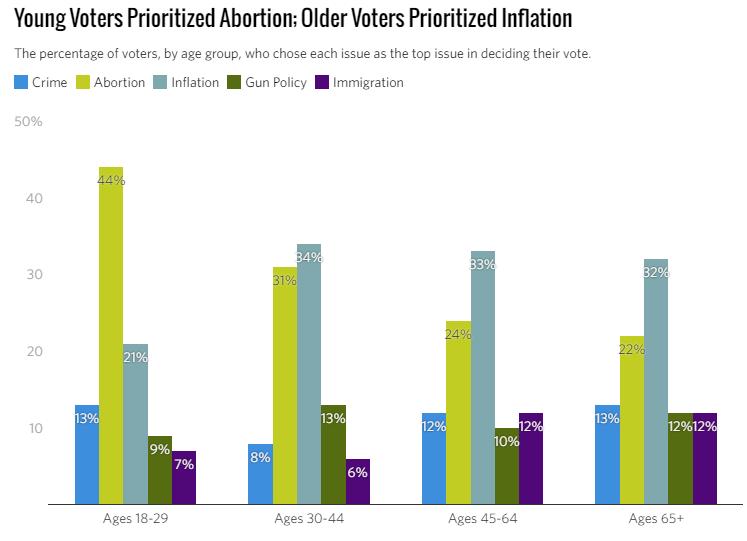
According to our post-election polling, many voters were convinced by advertising that highlighted the Democratic and Republican candidates’ stances on abortion
4% 4% 7% 8% 11% 15% 24%
against abortion rights / Pro-life
Disagree with their views / I am Democrat Is
4% 7% 7% 9% 10% 17% 23%
Pro-choice / Women's rights
KEY FINDINGS FROM THE 2022 ELECTION @cornellbelcher
34
The Dobbs decision and Republican extremism on abortion appears to have driven the high levels of support Democrats received from young voters
Source: CIRCLE at Tufts
