INDUSTRIAL MARKET REPORT

Q1 MARKET SNAPSHOT


OVERALL INVENTORY* 71.4 MILLION SF
MARKET BULK (100,000 SF+) OVERALL INVENTORY* 48.8 MILLION SF
5.5%
6.7%
Q1 CONSTRUCTION & DELIVERIES

CONSTRUCTION
8.1 MILLION SF

YTD DELIVERIES 446,150 SF
*71.4 Million SF does not include 22.7 Million SF of specialized buildings.
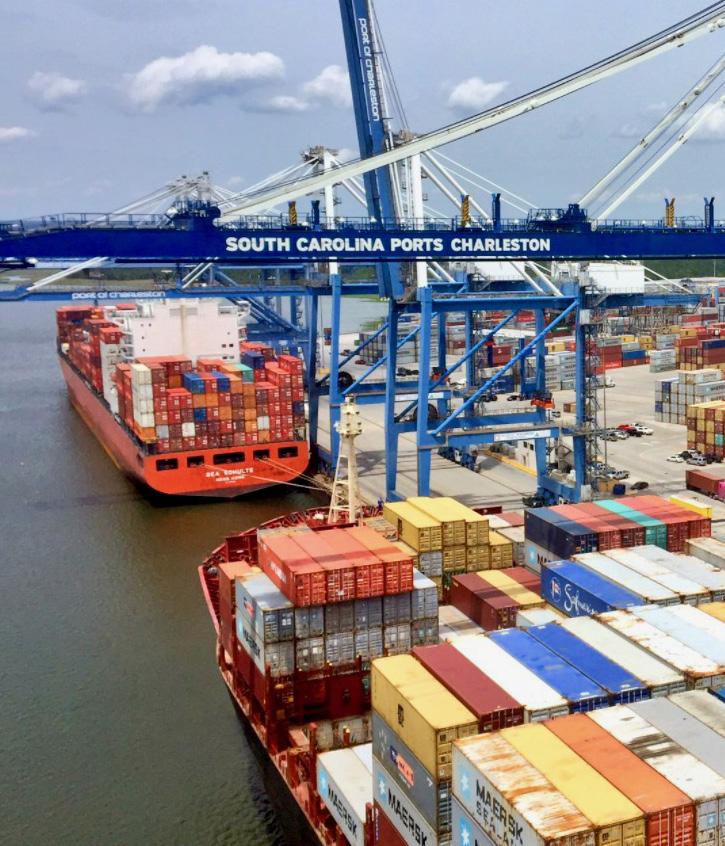
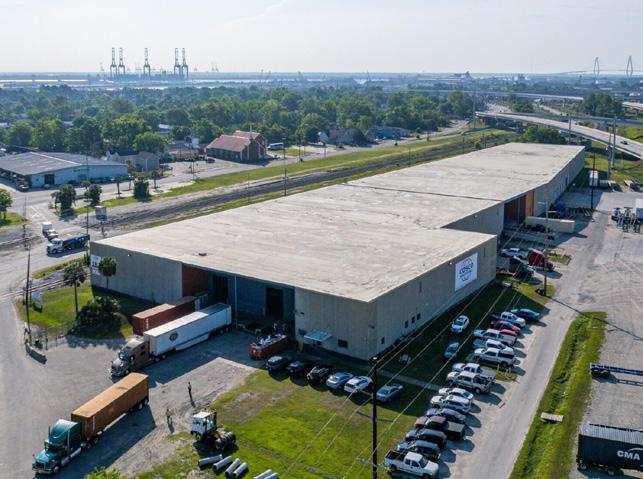
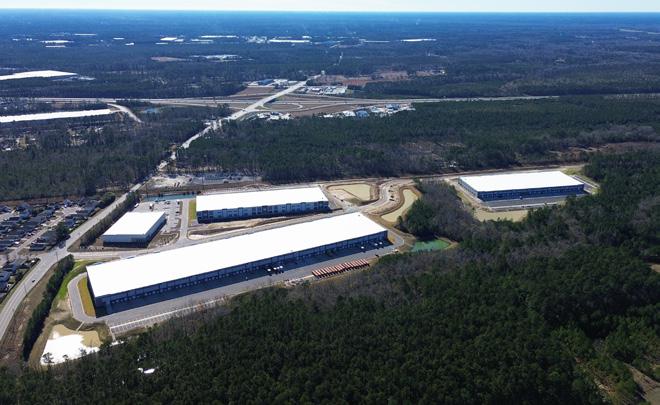
*Photo courtesy of SCSPA.
Q1 TRENDS & HIGHLIGHTS
•LARGE DISTRIBUTION AND MANUFACTURING REQUIREMENTS HAVE SLOWED.
•DEMAND FOR SMALL AND MID SIZED INDUSTRIAL REMAINS STRONG.
•NEW REQUIREMENTS IN THE MARKET INCLUDE ENERGY RELATED USES, INCLUDING RECYCLING, SOLAR AND BATTERY.
•NEW LARGE BULK SPEC DELIVERIES ARE DRIVING INCREASED SUPPLY AND VACANCY.
•RENTAL RATES ARE STABILIZING THROUGHOUT THE MARKET.
•RECENT PORT ANNOUNCEMENTS BODE WELL FOR FUTURE GROWTH.
BRIDGE-COMMERCIAL.COM
2024 | CHARLESTON, SC
Q1
VACANCY
VACANCY
TOTAL
Q1 SUBMARKET SUMMARY
Bridge tracks buildings 10,000 SF and greater.
Bridge uses only internal research within its Charleston office for its market research.
*Other includes Ridgeville, St. George and other outlying rural areas within +/-50 miles of I-26/526. **Total market statistics do not include specialty or specialty manufacturing buildings (22.7 Million SF).
Class A Class B Class C BRIDGE-COMMERCIAL.COM
Source: Bridge Commercial SUBMARKET RBA SF # OF BLDGS TOTAL VACANT SF VACANCY RATE UNDER CONSTRUCTION SF YTD DELIVERIES SF Charleston/N. Charleston 17,111,354 501 559,490 3.27% 665,000 0 Hanahan/North Rhett 5,114,565 48 0 0.00% 0 0 Ladson/Palmetto 9,761,563 108 417,743 4.28% 1,312,840 0 Clements Ferry 5,847,138 109 265,215 4.54% 0 0 Summerville/Jedburg 22,320,512 209 2,500,424 11.20% 2,786,913 434,150 Goose Creek/Moncks Corner 3,711,258 51 42,103 1.13% 0 0 Other* 7,582,198 91 205,057 2.70% 3,347,902 12,000 TOTAL MARKET** 71,448,588 1,117 3,990,032 5.58% 8,112,655 446,150 16% 38% 45% Distribution / Warehouse Manufacturing Other 34% 57% 9% Distribution/Warehouse Manufacturing Other INDUSTRY TYPE +500,000 SF 100,000 - 499,999 SF 10,000 - 99,999 SF SIZE PERCENTAGE BREAKDOWN BASED ON OVERALL SQUARE FOOTAGE BY TYPE, SIZE & CLASS Class A: 179 Buildings Class B: 433 Buildings Class C: 505 Buildings OVERALL CLASS ALL NON-SPECIALIZED BUILDINGS (+10,000 SF)
Q1 2024 charleston industrial MARKET REPORT PG. 2 AVERAGE ASKING RENTAL RATES BY BUILDING TYPE/CLASS CLASS A BULK WAREHOUSE CLASS B WAREHOUSE SHALLOW BAY 100,000 - 350,000 SF $7.25- $8.25 PSF NNN 350,000 SF + $6.75 - $7.50 PSF NNN 50,000 SF - 200,000 SF + $6.50 - $7.75 PSF NNN 10,000 - 20,000 SF $11.00 - $14.00 PSF NNN 20,000 - 40,000 SF $10.00 - $12.00 PSF NNN 500,000 200,000 - 499,999 100,000 - 199,999 28% 28% 200,000 SF + $5.50 - $6.25 PSF NNN 44%

WINDS OF CHANGE UPON CHARLESTON’S INDUSTRIAL MARKET
Q1 RECAP
• The Charleston market continues to expand geographically as evidenced by the activity in St. George and Orangeburg. The Port95 project in St. George is realizing leasing activity. In Orangeburg, a large vacant plant recently traded and there are two 50,000+ leases in the works.
• Q1 was not on pace compared to other first quarters the past few years. More pressure is on the market from the combination of macroeconomic factors including:
- rising interest rates;
- reduction in unused post-Covid goods;
- reduction in oversupply of general inventory;
- change in consumer demand for goods;
- presidential election year; and
- uncertainty of the opening of the Leatherman terminal.
• The abundance of new supply delivered has increased the lease-up periods and has put pressure on general rents.
• The most fluid user size is in the 40,000 - 60,000 SF range even with the more expensive build-out that is required. For example, these users are adding more customized office designs along with fully air conditioned warehouse areas.
• IOS site rates in the area have leveled off. Rates differ among sites based on location and zoning.
• Cold storage companies continue to consider the Charleston market after the large increase in buildings for the last two years. Loaded refrigerator container throughput has increased 110% since 2011.
• Lead times for most building supply related materials has normalized to pre-Covid levels. Power and switchgear still present longer and uncertain lead times.
DEMAND FOR NEW ECONOMIC DEVELOPMENT PROJECTS IN SPECIFIC SECTORS
• Data centers have seen demand in response to the anticipated data needs for AI.
• Energy requirements from battery development to energy infrastructure and alternative methods of developing new energy sources.
• Recycling manufacturers, including the recent announcement of Redwood Materials and others, are finding creative ways to reuse or eliminate the abundance of plastics and other materials.
PORT MAKES STRATEGIC MOVES THAT ADD UP TO FUTURE INVESTMENTS
• The port is selling the Union Pier and purchasing the Ingevity land which will allow them to expand the North Charleston Terminal.
• SCDOT announcement of funding to build new/raise the Don Holt Bridge.
SF
SF CONFIDENTIAL
/ JEDBURG
SF
Q1 2024 charleston industrial MARKET REPORT PG. 3 BRIDGE-COMMERCIAL.COM Q1 NOTABLE TRANSACTIONS
OWNER / USER RIDGEVILLE 219,055
COSCO NORTH CHARLESTON 125,000 SF
QUANTIX
CHARLESTON / N. CHARLESTON 200,000
SUMMERVILLE
160,000
INDUSTRIAL
OPPORTUNITIES


PETER FENNELLY, MCR, SIOR, SLCR President peter.fennelly@bridge-commercial.com
SIMONS JOHNSON, SIOR, MCR, CCIM Executive Vice President simons.johnson@bridge-commercial.com
JOHN BEAM, SIOR Vice President john.beam@bridge-commercial.com
HAGOOD MORRISON, SIOR, MBA, CRE Executive Vice President hagood.morrison@bridge-commercial.com WILL CROWELL, SIOR Vice President will.crowell@bridge-commercial.com
HAGOOD S. MORRISON, II, SIOR Executive Vice President hs.morrison@bridge-commercial.com
CPM Vice President of Property Management meredith.millender@bridge-commercial.com


BRIDGE COMMERCIAL 25 Calhoun Street, Suite 220 Charleston, SC 29401 +1 843 535 8600 info@bridge-commercial.com Bridge Commercial uses only internal research within its Charleston office for its market data.
Q1 2024 charleston industrial MARKET REPORT
SIGN UP FOR MARKET REPORTS AT INDUSTRIAL
www.bridge-commercial.com
ADVISORS
Bridge Commercial makes no guarantees, representations or warranties of any kind, expressed or implied, including warranties of content, accuracy and reliability. Any interested party should do their own research as to the accuracy of the information. Bridge Commercial excludes warranties arising out of this document and excludes all liability for loss and damages arising out of this document. PORT CITY CENTRE Summerville/Jedburg ±489,918 SF Available (3 Buildings) BERKELEY
TRADEPORT 3
CHARLESTON
Summerville/Jedburg
DORCHESTER COMMERCE CENTER Summerville/Jedburg ±534,081 SF Available (2 Buildings)
±354,202 SF Available
INVESTMENT ADVISOR
PROPERTY MANAGEMENT BRIDGE OFFERS PROPERTY MANAGEMENT, ACCOUNTING & PROJECT MANAGEMENT SERVICES NEED PROPERTY MANAGEMENT EXPERTISE? 2660 CARNER AVENUE Charleston/North Charleston ±50,000 SF Available CHARLESTON LOGISTICS CENTER Summerville/Jedburg ±228,784 SF Available PORT 95 St. George
Buildings)
MEREDITH MILLENDER,
±1,219,772 SF Available (3
