The Journal of the London Planning & Development Forum
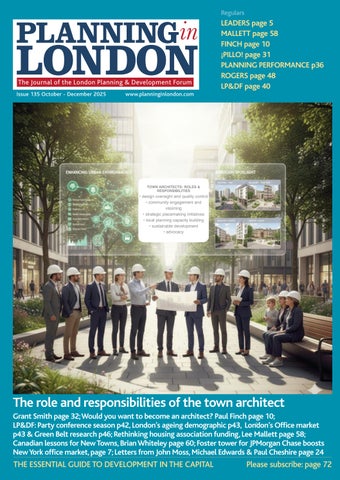
TOWN ARCHITECTS: ROLES & RESPONSIBILITIES
• design oversight and quality control
• community engagement and visioning
• strategic placemaking initiatives
• local planning capacity building
• sustainable development
• advocacy
The role and responsibilities of the town architect
Grant Smith page 32; Would you want to become an architect? Paul Finch page 10; LP&DF: Party conference season p42, London’s ageing demographic p43, London’s Office market p43 & Green Belt research p46; Rethinking housing association funding, Lee Mallett page 58; Canadian lessons for New Towns, Brian Whiteley page 60; Foster tower for JPMorgan Chase boosts New York office market, page 7; Letters from John Moss, Michael Edwards & Paul Cheshire page 24
LP&DF page 40 THE ESSENTIAL GUIDE TO DEVELOPMENT IN THE CAPITAL Please subscribe: page 72
from John Moss, Michael Edwards & Paul Cheshire page 24
5 LEADERS
‘Place’ is the client; Trump: right and wrong about Mayor Khan
7 Foster tower for JPMorgan Chase boosts New York office market 10 PAUL FINCH
Would you want to become an architect?
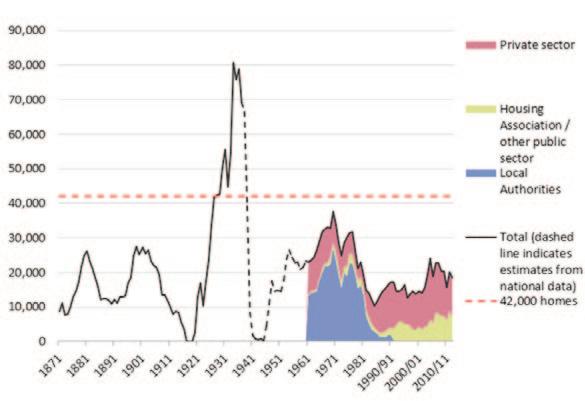
Why London stopped building | Nick Cuff
small sites | Nick Cuff
The new towns challenge | Riëtte Oosthuizen
Regional spatial planning | Pete Canavan
The potential of S106 agreements | Pam Sullivan
The latest on viability | Andrew Golland
Economy versus ecology | Lawrence Turner
National design guide and model design code | Glen Richardson
Consultation on infrastructure | Hannah McGinn 24 LETTERS from John Moss, Michael Edwards & Paul Cheshire
27 BRIEFING
CLIPBOARD: Housing target to be met by half; CORRECTION; New land policy changes in the UK; City forms historic markets regeneration arm; Citi’s £1bn tower will be the workplace of tomorrow; New towns identified
¡PILLO!
Design Museum plans ambitious overhaul of its permanent gallery; Affordable Homes Programme? Custom House to become an hotel on the Pool of London
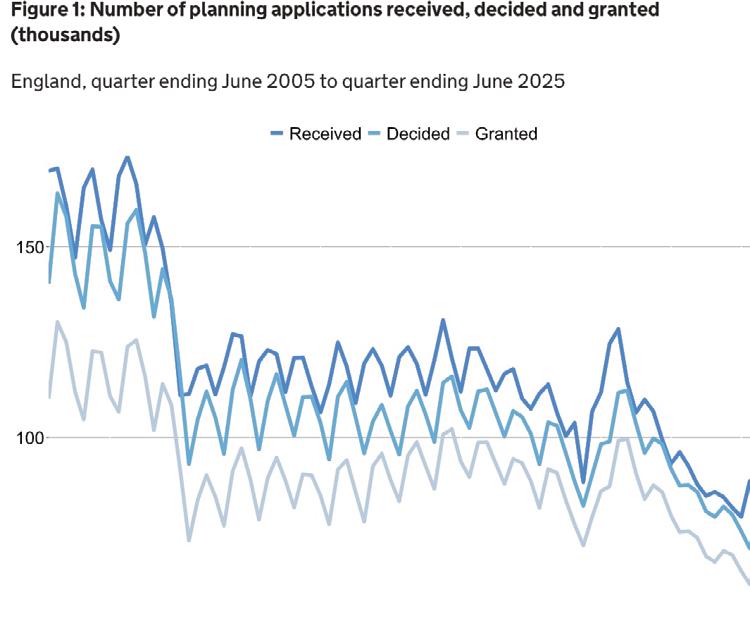
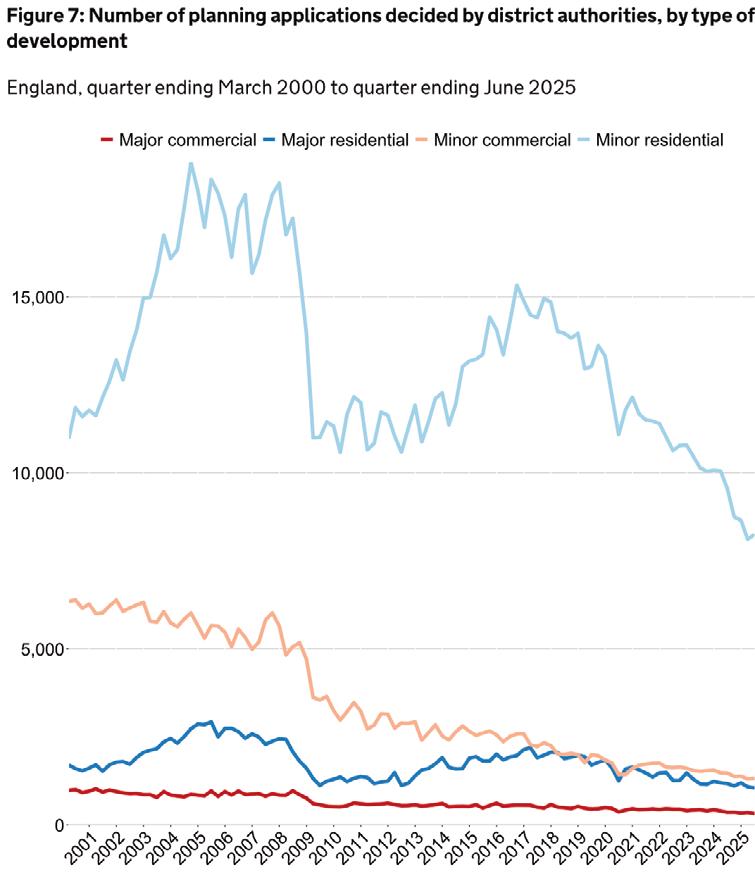
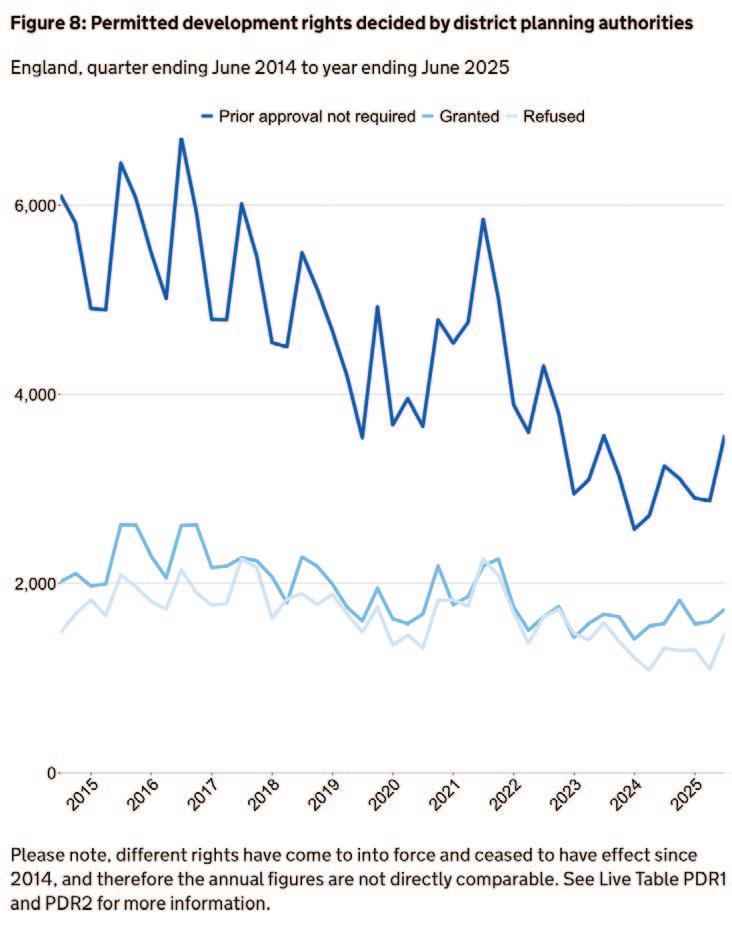
PLANNING PERFORMANCE
Residential applications granted down 8% from the same quarter a year earlier and planning applications received down 5 per cent
Chairman: Brian Waters MA DipArch (Cantab)DipTP RIBA MRTPI ACArch ppACA FRSA Principal: The Boisot Waters Cohen Partnership – brian@bwcp.co.uk
Vice-Chairmen: Riette Oosthuizen HTA Design: riette.oosthuizen@hta.co.uk and Brian Whiteley Brian.Whiteley@planningaid.rtpi.org.uk
Member bodies
Association of Consultant Architects Planning Officers’ Society/Association of London Borough Planning Officers London Councils British Property Federation Design Council CABE City o London Law Society
Canadian lessons for New Towns Brian Whiteley page 60
200 Years of Britain's Railways in 14 Journeys Sherin Aminossehe page 65
Available only on subscription: £99 pa
Provides a licence for five copies by email See subscription form or buy online at www.planninginlondon.com.
Planning in London is published quarterly in association with The London Planning & Development Forum by Land Research Unit Ltd, Studio Petersham, Gorshott, 181 Petersham Road TW10 7AW
Confederation for British Industry DLUHC Design for London/ Urban Design London Historic England Environment Agency Greater London Authority
Home Builders Federation Landscape Architecture SE
London Chambers of Commerce & Industry
London Forum of Amenity Societies
London Housing Federation
National Planning Forum ICE, RIBA, RICS, RTPI, UDAL, TCPA Transport for London
London University (The Bartlett, UCL) University of Westminster
Contributors write in a personal capacity. Their views are not necessarily those of The London Development & Planning Forum or of their organisations.
Correspondence and contributions are invited for consideration. The editors reserve the right to edit material and letters supplied.
Made on a Mac
Affiliated members: Planning Aid for London
London Metropolitan University
Government needs to recognise that if new towns, urban extensions, whatever, are to get built, they may have to be delivered at the larger scale by non-democratic agencies that can move quickly
Planning in London has been published and edited by Brian Waters, Lee Mallett and Paul Finch since 1992
‘Place’ is the client
Why is it few of us feel confident the Government’s new towns will deliver the housing we need? There is an enormous deficit between current targets, in London and nationally, and delivery. There is little evidence of what will be done to ensure delivery.
This has been a problem in planning in London, particularly around affordable housing policy, for two decades. The setting of unrealistic targets, which may be what people wish to hear, braced with complex and disputatious mechanisms for establishing viability, has removed a swathe of smaller builders or developers from the supply side, made sites much harder to develop, squeezed the developer’s equation so that quality is the usual victim – often after planning is granted – and sites remain undeveloped when there is what economists might term obvious ‘excess’ demand, boosted by overseas investors who think Sterling cheap.
And, in the meantime, the viability of London has been undermined as the cost of living here has soared. To the point where schools close because of falling roles, young people move out, the age of the population rises, and businesses start to suffer, complain, and take themselves elsewhere. London is not the only city in the UK with an ageing population, but it is bucking the trend of other large UK cities where populations have been getting younger. Baby bust, not baby boom.
The private sector, unless paid directly, will never deliver what the public wants, or needs in affordable housing. The quantum will always be determined under current policy not by need but by what the developer is forced to ‘afford’. This tax does not deliver what is needed. Do we have to wait another 20 years for this to be further demonstrated?
Sir Terry Farrell put his finger on the core of the problem eloquently in a special edition of Architectural Review in 2007, titled London Calling: “There has been an inexorable shift from the late 1940s Welfare State vision of town planning…to a culture of ‘non-plan’ with development control the primary operating force at town and city level – a kind of built-environment-traffic-warden culture that relies on others doing the actual planning.” ie, largely the private sector in today’s marketplace.
What was needed he argued are planners that were ‘advocates’, whose role it is to put forward propositions, advocate them, debate them, consult on them, and let communities decide. The nature of London is a collage of places, but these are overlaid by arbitrary boundaries that militate against ‘place’ as the foremost ‘client’. And we can see, they are also disadvantaged by a planning system that prioritises policy and control rather than planning as a flexible enabling framework.
The whole edifice of planning in London is forced through the keyhole of affordable housing policy. And now on the commercial side, affordable workspace. Hence a startling decline in delivery. Fewer things are being delivered that have anything ‘affordable’ in them, because they are not ‘affordable’ by those delivering them.
The Mayor of London, Government, Boroughs, all need to recognise that if new towns, urban extensions, whatever, are to get built – with alacrity – they may have to be delivered, at the larger scale, by non-democratic agencies that can move quickly. This does not mean an absence of democracy or engagement. It means we need agencies that marry private and public sector skills, resources and responsibilities, that have power and funding to deliver. But working to visions that are not ‘owned’ or driven solely by one stakeholder, public or private.
Place is the client, as Farrell argued. Planning and delivery in London needs perestroika if we are to get the housing we need.
The problem with our mayor is his consistent failure in key areas which affect Londoners as a whole
Trump: right and wrong about Mayor Khan
Sadiq Khan has been a terrible mayor for London, but not for the reasons given by the blow-hard president of the United States following his recent visit to the capital, where once again he insulted his ambassador by failing to visit his country’s fine embassy at Nine Elms.
The charge sheet against Mayor Khan has nothing to do with crime statistics, which mask deep underlying causes. He doesn’t like the police but that is because he makes a simple-minded calculation that his ‘constituency’ of ethnic minorities doesn’t like them either. Nor is it anything to do with Sharia law, despite Trumpian nonense, though there are plenty of zealots who would dearly love it to operate, and occasionally get support from opportunist Labour politicians.
No, the problem with our mayor is his consistent failure in key areas which affect Londoners as a whole, rather than woke initiatives where he doles out money to the few which he should be spending to improve the capital for the many.
His record on delivery of housing, public, private and anything in between is risible. We all had a laugh when he turned up in Cannes for the Mipim property event, supposedly banging the drum for investment and development in London. Why had it taken him nine years? What housing development has happened as a result? Zilch.
On transport, his major recent initiative was to pay off striking Tube drivers and then say nothing when they went on strike again even more recently.
His crazed road traffic initiatives have brought London to a grinding halt, achieving levels of speed which were hitherto the province of third-world cities we used to jeer at. His own armour-plated limo is a symbol of what we are reduced to. The mixture of malice and incompetence that has characterised Transport for London’s surface traffic management, under his mayoralty has become increasingly malicious, and competent only in the sense that TfL is very good at making things worse. A symptom of all this is the fact that the mayor cannot sort out Hammersmith Bridge – or more likely he does not want to.
On planning, the latest draft London Plan shows signs of improvement – but that is only because even Khan can see that his general opposition to development of any sort is sending housing delivery, in particular, into a doom loop.
The latest rumours that he will cut the percentage of affordable homes required from private housebuilders, if they come to pass, will not be evidence of a pragmatic and successful mayor, but a disastrous failure who has realised far too late that his hopeless policies are killing the capital.
With such a failure of both vision and delivery, it was probably inevitable that he would seek a fourth term as mayor – how the Labour government which instigated the London mayoralty allowed such a governance absurdity can only be guessed at.
At least Trump only gets two terms.
Foster tower for JPMorgan Chase boosts New York office market
JPMorgan Chase’s new global HQ opens this month
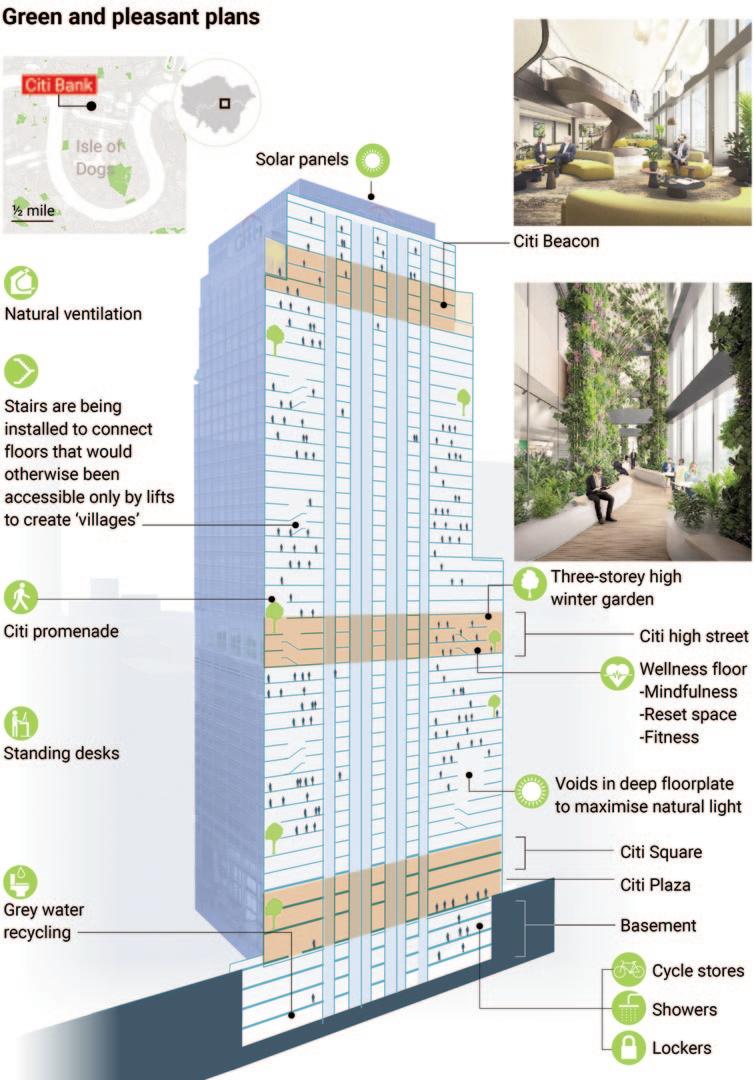
270 Park Avenue is set to be the new state-of-theart global headquarters for JPMorgan Chase. The 1,388-foot (423m), 60-story skyscraper will be New York City’s largest all-electric tower with net zero operational emissions and exceptional indoor air quality that exceeds the highest standards in sustainability, health and wellness. It will help define the modern workplace with 21st century infrastructure, smart technology and 2.5 million square feet of flexible and collaborative space that can easily adapt to the future of work.
The new building will house up to 14,000 employees – replacing an outdated facility designed in the late 1950s for about 3,500 employees. It will offer 2.5 times more outdoor space on the ground level of Park and Madison Avenues, featuring wider sidewalks and a large public plaza on Madison Avenue
with natural green space and other amenities geared toward the residents, workers and visitors who frequent the neighborhood on a daily basis.
The concept for the new design was to create a timeless addition to Park Avenue, which celebrates the city’s iconic architectural history and serves as a powerful new symbol for the next generation of office towers in New York.
Using a state-of-the-art structural system to negotiate the site constraints below and at ground level, the innovative fan-column structure and triangular bracing allow the building to touch the ground lightly across the entire block. By lifting the building about 80 feet (24m) off the ground, it extends the viewpoint from the Park Avenue entrance through to Madison Avenue.
270 Park Avenue will be 100 per cent powered by
renewable energy sourced from a New York State hydroelectric plant. In addition to operating on net zero carbon emissions, the building will use state-ofthe-art building technology and systems to ensure it operates as efficiently as possible, including intelligent building technology that uses sensors, AI and machine learning systems to predict, respond and adapt to energy needs; advanced water storage and reuse systems to reduce water usage by more than 40 per cent; triple pane glazing on the façade and automatic solar shades connected to HVAC systems for greater energy efficiency; and outdoor terraces featuring natural green space and plantings.
The project also recycled, reused or upcycled 97% of the building materials from the demolition – far exceeding the 75% requirement of the leading green building standard – Foster + Partners
Images courtesy Foster + Partners
“The New York City office market is recovering from its pandemic debacle faster than any other in the U.S. Nothing speaks more to the turnaround than the gleaming new office tower built for JPMorgan Chase.” –RebeccaPicciottowritingininthe Wall Street Journal
After six years of development, JPMorgan is moving thousands of staff into its new $3 billion, 60story headquarters at 270 Park Avenue, opening in October.
The 2.5-million-square-foot tower, designed by Foster + Partners, symbolizes confidence in New York’s business future as the city leads the U.S. in office recovery.
New York office visits surpassed 2019 levels this summer, while national visits remain down. Companies are seeking premium office space to
attract employees back, with finance firms such as JPMorgan and Goldman Sachs enforcing the strictest return-to-office mandates. Leasing demand is strong: 12.2 million square feet were leased in early 2025, led by tech, law, and finance firms.
The new tower features luxury amenities—gardens, wellness facilities, dining, and social spaces— designed to draw staff in. JPMorgan remains the largest private office tenant in Manhattan, and brokers expect high demand for any space the bank eventually vacates. n
FINCH
Would you want to become an architect?
Architecture can be a marvellously fulfilling occupation but increasingly the first requirement for a successful career will not be pure design skill
I was recently asked whether I would recommend architecture as a career choice for a bright A-Level student. I hesitated. It takes up to seven years of study and work experience, incurring a hefty debt far greater than most undergraduate students will ever need to repay. Yet the expected salary will be modest by the standards of most other professions, while stability of employment will certainly be variable.
Moreover, it is not as if the social status of architects is what it was. In living memory, a building site would be tidied up if the architect were making an inspection visit. These days, given some of the more obtuse clauses in design-and-build contracts, a site visit may only happen by arrangement in advance, with contractor assent. No spot checks on build quality, thank you.
These days, architectural practices have become whipping boys (and girls) both within the construction profession, and in the wider world. The Grenfell inquiry, looking for someone to pin ultimate blame on, appears to be seizing on the architects – who didn’t even know (and weren’t told) that their zinc cladding design had been replaced with an illegal aluminium rainscreen design.
Given the length, scale and cost of that inquiry, it is unfortunate, to put it as mildly as possible, that its remit did not include an examination of the design-and-build ‘culture’ that has infected the way we construct, premiating risk transfer over taking proper responsibility for the health, safety and convenience of building users.
In all this, there is an assumption that as the lead designer, the architect is somehow in control of the process of building delivery. Contractually this is rarely the case. However, because architects are legally required as professionals to have indemnity insurance , whenever something goes wrong, they are invariably joined in lawsuits by contractors, sub-contractors and others, who ride on the architects’ insurance coat-tails.
So practices and individual architects find themselves in the position of having responsibility -- but not the power to ensure that their designs have
been delivered competently.
It must be said the architectural profession itself has become infected by the cult of risk transfer, these days being all too happy to let other specialist consultants and product manufacturers take responsibility for various detailed aspects of building design and delivery. The problem arises when design-and-build procurement bypasses an overall understanding of how a building is designed and will perform, in favour of assuming that any change can be managed and justified by the people doing specific and limited tasks. Suddenly installers are supposed to understand Building Regulations. Under the doom loop of risk transfer, the least able and least qualified to take the risk end up taking it. Then the architect gets sued.
This explains the extraordinary increase in indemnity insurance charges, and the introduction of exclusion clauses which would have been unthinkable a generation ago. Practices are told, for example, that they cannot design swimming pools, or basements or, amazingly, elements of a building involving fire risk. Since that covers virtually every element in a building, this is serious.
Yet we ask our architects to become ever-more responsible for cleaner, greener buildings and environments. We expect them to be visionaries capable of designing the government’s impending new towns programme; to somehow wave a magic wand to transform the crumbling Palace of Westminster into a beacon of democracy for the rest of the 21st century.
We want architects to design us out of the housing shortage. We want them to regenerate defunct housing estates. We want to them to design cheap-as-chips student accommodation on the one hand, and remodel large chunks of our towns and cities on the other.
Yet the profession is now beset by vicious fee competition, encouraged by both public and private clients; it is asked to undertake design work for no fee in order to get to first base on competition projects. This results in long working hours, low pay, and levels of profit which are far too low – this then
Paul Finch is programme director of the World Festival of Architecture and joint publishing editor of Planning in London
leading to accusations that architects don’t understand finance or business. In reality, many are far too trusting that clients will behave decently. As if this were not enough, planning and construction requirements have become so complex that they have spawned specialist consultants and managers, each of whom need to be paid, and each of whom have taken aspects of the architect’s role. Meanwhile, every architect is obliged to pay a substantial fee each year to the Architects Registration Board, whose origins date from the registration acts of 1931 and later years, which gives the title ‘architect’ protected status. The ARB formerly had elected representative of the profession on its board, now it has none. This is an offensive case of taxation without representation. What a mess. As to the advice on becoming an architect? There is a ‘Don’t put your daughter on the stage, Mrs Worthington’ element to this. Unless that A-level student has been inspired by someone or somewhere to head towards architecture, I would advise against. But if they show both artistic and scientific interest (art and mathematics as ALevel subjects are a clue), then there are compensations in following a path despite the difficulties. Architecture can be a marvellously fulfilling occupation – making things better for the beneficiaries of well-designed homes, schools, hospitals, stadiums, and other facets of the built environment – the everyday backdrop to all our lives. It is still the mother of the arts. But increasingly the first requirement for a successful career will not be pure design skill – instead, dogged resilience in the face of a plethora of challenges. n
Why London stopped building
Nick Cuff argues that the public sector does not have the cash to build, so it must find ways to encourage others to take the risk
A few weeks ago, London focused furniture company David Phillips went into administration. The business, roughly 25 years old, cited the ongoing downturn in the housing and construction market. I had worked successfully with David Phillips on mobilising several build to rent schemes. It was a great business and an important part of the complex ecosystem of companies that aid the delivery of good quality homes for sale and rent.
That ecosystem, once so bright, is being rapidly dissembled, the victim of a series of poorly thought through policy interventions and perhaps well-intentioned but politically motivated attempts to spur affordable housing that have backfired.
Only 3,950 new homes were sold in the first half of 2025, according to housing data company Molior – just nine per cent of the government’s half year delivery target for London.
Molior predicts that by 2028 the industry can expect just £90 million of completion funds to flow through per week rather than the £1 billion it should expect. This is not the bottom. It is likely to get worse. High density brownfield sites for residential flatted schemes, once the bedrock of the London market, are no longer viable. There appears as yet to be no meaningful attempt in government to address the issues.
Why has London stopped building? The first thing to say is that it is not because of NIMBYs and defective planning committees alone, although neither are very helpful.
The system was always precarious – a delicate balance of pragmatic trade-offs by local authorities and developers accepting risk of discretionary decisions because the returns were there. Sometimes they did well, sometimes they did not, but there was always an opportunity to recover returns during the elongated development process.
Those returns have been whittled away over the last five years. On the demand side, erosion has come in the form of Stamp Duty, soaring mortgage rates, tax changes on overseas investors and Buy To Lets, the loss of Help to Buy and the impact of higher risk free rates on Build To Rent yields.
On the supply side, more taxes mean more costs
to carry. Two forms of Community Infrastructure Levy (CIL), Section 106 contributions, carbon offset levies, biodiversity net gain and now the soon to be adopted Building Safety Levy (BSL). It doesn’t end there: a landfill tax hike is also being mooted to firmly nail the coffin of brownfield housing development.
Then you have new regulatory requirements around fire safety. Buildings have lost around three to five percent of net saleable floor area from the addition of secondary cores and evacuation lifts. Less revenue, more cost and on an appraisal the impact is around 20 per cent on land value (or if you had already bought your site before the changes, your entire profit).
That’s a big ouch made worse by the fact you still have to pay CIL and the BSL on all that extra space. The newly implemented Gateway system, rather than facilitating safer developments, has merely become a check post causing serious delays to delivery, exacerbating the shortage of housing.
It’s been five years since James Murray left the role of London’s deputy mayor for housing to sit sits on the green benches. He departed with a legacy of additional planning requirements which now cannot work alongside the tax and building safety changes of the last three years.
“Genuinely affordable” housing was good party politics for Murray and adopted by the Sadiq Khan mayoralty when he came to office. It suggested previous administrations had somehow got a bad deal from developers. With limited grant available to pay for social housing, City Hall decided to put further onus onto the private sector by introducing a set of profit capture mechanisms, or late stage reviews, for all development proposals which didn’t hit 35 per cent both in terms of tenure and mix.
This meant the Mayor proposed to take the majority of profit over a certain percentage. His upside is unlimited and difficult to price. He has no downside and he has no capital at risk. That sits squarely on the developer: to assemble, fund and project manage a development where profit is fixed for all time but you are exposed to catastrophic losses. The result? Investors required far higher returns
Cuff is managing director of real estate advisers Urban Sketch
because the London planning system is so obscure. Such complexity has also disempowered local politicians and planners from making judgement calls.
Is there much distinction between a local politician who opposes new housing and a local politician who supports new housing as long as it is social housing? If the state is not willing to pay for it and the private sector cannot afford it, there is actually little difference between the two positions. Both end up at the same place – nothing gets built. That is what is happening across London.
A mistaken belief that the private sector could and should pay for everything and anything has led to an exodus from the capital and to other, less politicised, asset classes. The housebuilders were the first to go, then the investors, both foreign and domestic. The housing assoications have consolidated and looked to their own estates for improvements rather than take development risk.
Multifamily Build To Rent, which should be motoring in a rental crisis, now creates negative land values, unable to provide anywhere near 35 per cent affordable due to higher debt costs. The sector that is functioning is single family housing – much less risk and far, far away from London.
Co-living and student development are still there. But London cannot rely on this alone and even these tenures are under huge pressure due to the building safety regulations and the risks around the Renters Rights Bill. There is no golden goose to be found in them, just an avoidance of negative land value.
The simple truth is that housing development is not a bonanza of goodies, yet successive governments and the mayoralty have mistakenly thought otherwise. It can offer something, but if the planning
Nick
system is too demanding the consequence is that we all get nothing.
Urban renewal, housing agglomeration and regeneration yield long term benefits to society and the economy, but they are often not immediate cash cows and many times they need state subsidy or at least co-investment. Limited government resources have meant the default position is that the private sector is always there. But it has turned out to have alternative options.
There are huge tracts of land in London, much of it brownfield. You look at the bigger cities and the land is there. A “brownfield first” approach can carry a very significant part of the housing numbers where people want to live.
Unlocking it requires a move away from a discretionary, poorly resourced and land tax heavy broken system. Simpler rules, which are based on zones to which developers and investors are enticed and encouraged to put their capital at risk to improve the built environment is now the only way back. Politicians, both national and regional, need to get real about the viabilities of sites in London and elsewhere. Over the course of the past decade, governments and Mayors have extracted more and more value to the point where there is little to none left.
The public sector does not have the cash to build, so it must find ways to encourage others to take the risk. That means simpler, fairer rules and an end to the war on profit that has stopped this great city from building.
Unlocking small sites
We are asking too much from small sites, says Nick Cuff
Should the focus of planning reform be on the bigger sites and bigger players? Is it possible for small sites and small developers to make a meaningful contribution to housing numbers? Or is it too late to try and change what has become the default setting? This was the debate and the line of inquiry taking place over the summer in Whitehall.
Let’s start with what we know. There has been a material reduction in the contribution of SME developers. 30 years ago, they contributed 40% of housing supply. Today it’s around 12%. In London, between 2006 and 2016 there was a 50% reduction in small site development.
The decline has not gone unnoticed by policy makers. Indeed, supporting smaller builders has been a central plank of Government housing policy for at least a decade; most recently through initiatives such as the ENABLE Build loans. This £1bn loan guarantee scheme was launched to support finance for smaller housebuilders. But is finance what is actually needed?
Getting under the bonnet
There are differing theories as to why there has been a fall in SMEs. If we want to get under the bonnet and move beyond conjecture, data is required. Unfortunately, there is very little of it. There is no doomsday book detailing how many small sites exist in the UK. There is not a national wide data set on small sites developments and small developers.
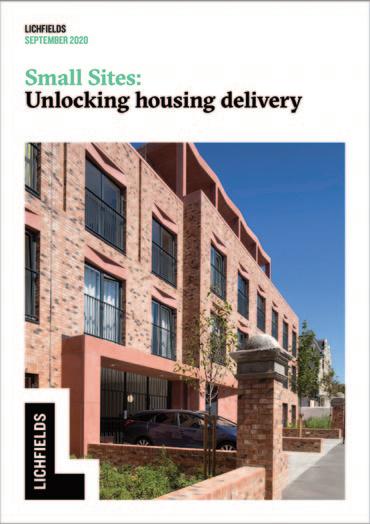
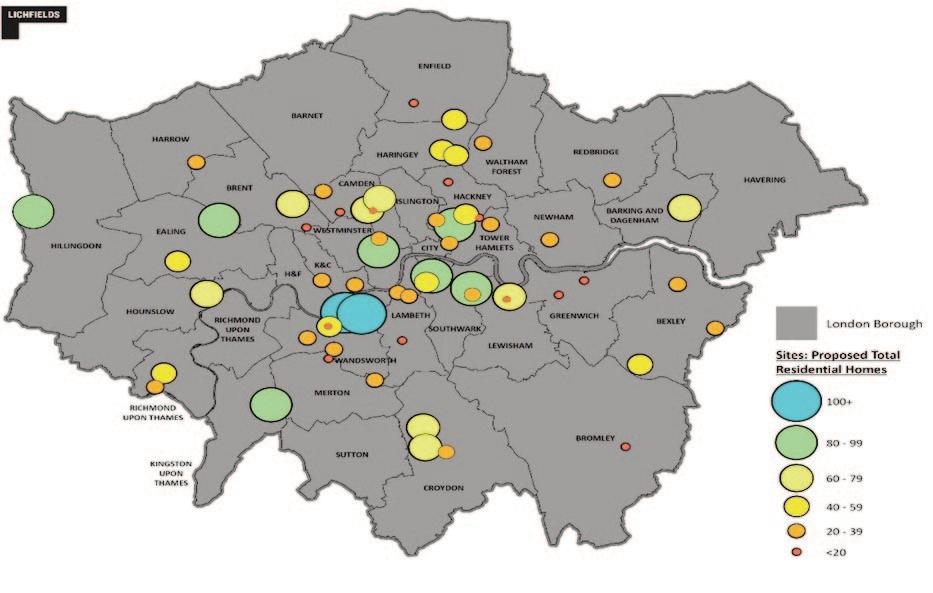
There is though, thanks to the GLA, a dataset of small sites that have obtained planning permission in Greater London – the only dataset of its kind. With this data the team at Pocket working in conjunction with our colleagues at planning consultancy Litchfields decided we had a chance to conduct a deeper analysis of the journey of small site developers and find out what’s happening out there.
The dataset consists of 675 small sites. By small sites we mean not micro sites – under ten homes, instead we mean over ten homes and under 150 homes or less than 0.25 hectares of land. When you remove outliers such as 100%
grant funded schemes and permitted development schemes (different approval regime), you are left with the state of play for SMEs in Greater London. The team then undertook a deeper analysis at random of 10% of the data set, 60 sites equating to over 2,000 homes and averaging 33 homes per site to see if there were any common threads.
The main issues facing small site development
The analysis of the 60 sites sought to identify and codify the principle issues facing small sites. The findings were compelling. In three quarters of all cases, one of the biggest issues in the planning journey was affordable housing and viability. Moreover in a third of cases, there was a protracted dispute over the land value of a small site leading sometimes to deadlock between the local authority and the developer.
There were other issues, affordable housing was not considered in isolation. Residential amenity, density and parking are also considerations. However, design and architecture seemed to be an increasingly minor consideration with fewer than one in five cases giving detailed consideration to the quality of the building being delivered.
The lion’s share of time between the applicant and the Authority is spent negotiating affordable housing. Only 6 applications in the data set were able to achieve a policy compliant level of affordable housing. The result was the majority entered a viability process which appeared to lead to dispute, challenge and deadlock.
The clock ticks
Any small business knows that time is your enemy and no more so than in small site development where third-party funding is often the norm. The small sites in the sample size were taking on average a staggering 60 weeks to get planning permission. That is almost five times the statutory deadline. Just one of the sixty sites analysed met the statutory timescale and a fifth of permissions reviewed by the team took longer than two years to determine.
Much of this time delay was due to the com-
plexity dealing with the viability and affordable housing approach. Ironically, those that actually did achieve good levels of affordable housing took longer to finally be determined due to the need to produce a more detailed Section 106 Agreement. The Section 106 process itself took an average 23 weeks to get through revealing that the journey to Committee itself was only part of the battle. There were some examples where the Agreement was taking years to agree.
Getting it right
One of the most surprising findings was that almost a quarter of the permissions reviewed from the random sample required two or three successive attempts to secure a planning permission. Half of the first-time permissions required major amendments during the determination. The amount of energy, time and money wasted trying to get through the planning system between developer and local authority is staggering.
Where we go from here
There is no one at fault here but the system itself which has created a constant stream of conflict. We are asking too much from small sites. Viability negotiations are protracted and complex. Small sites are just not able to meet the policy hurdles. The regime leads to regular and
often intractable disputes over land value and affordable housing leaving little time to actually concentrate on what might actually be good design and place making.
This does not mean that affordable housing should not be delivered on small sites. However, it does need a simpler regime if it is to succeed. n
Check out the full research here: https://tinyurl.com/2aef9r4h
Rising to the new towns challenge
The government has announced chosen locations for 12 ‘new towns’. Riëtte Oosthuizen looks at the challenge
They are in areas under growth pressure – the South East, the Midlands, the North and the Thames Estuary. With funding of around £3.5bn to £4bn per town, each new location is expected to have 10,000 homes with a minimum of 40% affordable housing.
More than 1.2 million households are on social housing waiting lists in England, so affordable housing provision as part of the mix is an urgent priority. Social rented homes usually form part of the total affordable housing mix negotiated through planning permissions, so an estimated 48,000 new affordable homes in new towns will only go some way to addressing the social housing waiting list.
The strategy of mass housing development through new towns is a case of the government putting almost all its eggs in one basket, as it is new towns that are largely expected to address the target of building 1.5 million homes in this parliament. Construction of new towns is due to start in 2029, before the next general election. Some of the plan’s fiercest critics would describe this idea as perhaps politically convenient.
The housing crisis requires drastic measures and new towns look well placed to enable the development of more homes and boost productivity, with the release of grey- and green-belt land a possibility. But it is hard to see how they will not be vulnerable to the delays affecting housing development, namely the complexity of land assembly, underfunding of infrastructure, local opposition, changes in political power and skills and materials shortages.
Big development: the chosen locations for 12 new towns will be announced imminently The plan promises the most significant housebuilding expansion since the Second World War. As part of the Planning and Infrastructure Bill, development corporations are acquiring broader powers to manage new towns and urban extensions, with multiple sites under a single corporation. Each will be empowered to provide roads, utilities, health facilities, schools, retail and district heat networks.
It is essential that these towns are sustainable places of opportunity and access, rather than sleepy residential extensions leading to displaced depriva-
tion and social isolation and requiring cars to move around. Their economic foundation needs to be right to support new ways of living, working and shopping and leisure.
They must have foundations that encourage sustainable movement and behaviours and be built for the long term, fostering community life, creating access to fresh food, healthcare, education and economic opportunity and allowing people to travel with ease using sustainable modes of transport. The right density of the built form will be a key enabler.
Design failings
But how well does the development industry understand how to achieve these objectives? Studies demonstrating the placemaking success of urban extensions have shown remarkably low scores on overall design quality and the ability to instigate sustainable behaviours. Place Alliance’s 2020 report ‘A housing design audit for England’ pointed out key issues resulting in poor design, including: streets designed around vehicle movement rather than people; generic housing design; standardised house types; poorly planned open space; too low density; and poor ability of local authorities to judge design quality.
Distinctive, sustainable and economically vibrant new towns should go beyond housing. The National Model Design Code would assist in setting out essential considerations for high-quality design, but there is no general acceptance of what a sustainable
The announcement
The three places where building will begin before the end of this parliament are:
Tempsford in Bedfordshire in the OxfordCambridge Growth Corridor
Leeds South Bank development
Crews Hill in Enfield to address housing need in London
Before final decisions are made the government will conduct a strategic environmental assessment.
The other nine places recommended by the taskforce are:
A standalone settlement in Adlington, Cheshire
Dr
Riëtte Oosthuizen is planning partner at HTA Design
density is. However, at locations near public transport, medium densities of around 50 to 70 dwellings per hectare would encourage walkable neighbourhoods, community activity and informal interaction.
Most urban extensions have average densities of between 30 and 40 dwellings per hectare. They do not necessarily encourage sustainable behaviours, as transport via car remains dominant. Landowner and volume housebuilder-led urban extensions have failed to support sustainable behaviours or introduce much diversity to housing.
A new emphasis on strategic planning, design codes, upfront infrastructure, long-term management and stewardship are all part of the ingredients for new towns. New behaviour will be required all round – planning and working closely with communities, delivering good-quality homes at higher densities and investing in places with community involvement over the long term.
It is an exciting if daunting prospect, but one that needs to be delivered right – even if only to make a small dent in the overall need for affordable housing. n
East
A corridor of connected development in South Gloucestershire
Redevelopment of the former airbase at Heyford Park in Cherwell, connecting to Oxford
Inner-city development and densification in Manchester, Victoria North
A standalone settlement in the Marlcombe, East Devon
A ‘renewed’ town in Milton Keynes
Densified development in Plymouth
Riverside settlement in Thamesmead, Greenwich
Expanded development at Worcestershire Parkway, Wychavon
If we need more houses, slash over-regulation
Will the proposed reintroduction of regional spatial planning deliver the housing numbers asks Pete Canavan
Is the proposed reintroduction of regional spatial planning the single most important aspect of housing delivery announced by this government to date?
In my view, the simple answer to this question is ‘yes.’ I, and it’s probably safe to say the majority of planners and developers, am encouraged by the recent announcement, in the Planning and Infrastructure Bill, that Spatial Development Strategies will be put in place at a sub-regional level to facilitate effective cross-boundary working to address development and infrastructure needs.
Recent research as reported in Inside Housing paints a negative picture of imminent housing output, suggesting that the Government is set to miss its target by nearly 500,000 homes. The housebuilding sector built 56,971 new affordable homes in England in 2023-24, according to government statistics, but starts were down 39% overall and dropped by 88% in London.
So, I am excited to see the return of strategic planning, and the opportunities that it represents in overcoming challenging political matters at a local level; it can elevate the housing numbers debate beyond individual concerns. Also, while strategic planning might not directly drive delivery on development sites, it will free up some ‘bandwidth’ within local authorities. Strategic plans and regional bodies can deal with housing numbers, demographic statistics, and other often ethereal matters, allowing local authority officers to focus on site-specific delivery by allocating robust and deliverable sites, and using agency and partnership opportunities to reduce infrastructure gaps.
To suggest that this is DeJa Vu all over again’ (to harness my inner Yogi Berra), might feel a little bit lazy, and certainly cliched, but we have been here before. Most planning consultants and developers will agree that the Regional Spatial Strategies (RSS) of the late 1990s were generally pretty successful, allowing infrastructure and new housing, specifically social and affordable housing, to be delivered around planned growth over a wider city-region area.
Our planning system is the product of decades of tinkering and little overview as to how the system should work, from national policy down to planning applications. In 2011, Localism was brought in to try
to appease the argument that RSS were top-down ‘unelected quangos’. Along with removing the most important element of strategic planning, this essentially introduced an element which (intentionally or otherwise) was anti-planning and anti-development.
A reoccurring challenge recently has been the Duty to Cooperate, or failures in that Duty, where neighbouring authorities have – despite best intentions – never reached an agreement on the level of ‘unmet housing needs’; less so, how to share that unmet need amongst other local planning authorities (LPAs). Even where those agreements have been made – like in Oxfordshire – it remains an area of acute political rancour.
In my view, for planning to succeed and for housing targets, including social and affordable housing, to be met, the regional level must be re-introduced. This would alleviate some of the pressure on local plans and better manage the politics in planning. The introduction of the promised Spatial Development Strategies (SDS) is eagerly anticipated.
For SDS, as with many of the initiatives in this Bill, timing may be an issue: the Bill must progress through both Houses of Parliament and will inevitably attract some opposition. Additionally, the Government is committed to local government reform alongside planning reform. How will a changed approach to strategic planning be implemented alongside emerging plans for devolution? There are many moving parts to the reforms package and the Government will need to ensure that measures are compatible with one another and will deliver the planned levels of growth.
However, in removing pressures from the local
level, I am not advocating a top-down approach, but one which makes it easier for local planning to succeed: if for example, housing targets were determined on a regional level and passed down to the LPA, planners would be able to spend time planning for those numbers, and where development might best be delivered in a sustainable and coherent way, rather than arguing over whether the correct base date has been chosen, and the most up-to-date affordability ratio has been applied. Planners can return to creating places for the people that these formulas and statistics represent. More time could also be spent on assessing the genuine deliverability of sites and understanding when where new infrastructure is required. Partnership working, and agency, with statutory consultees and service providers such as utility companies and health services could be improved.
Local councillors too, would no longer risk the electoral unpopularity which comes with justifying housing targets or the consequences of failing to meet them. That said, there is likely to be some politics at a regional level (and there should be some accountability, to avoid the criticisms made of RSS), but it will be felt less acutely, and of course, the Government must impose responsibility from the top: both carrot and stick have a role to play.
The proposed SDSs are absolutely key to increasing the number of social and affordable housing throughout the country – but as many said following the First Reading of the Planning and Infrastructure Bill in the House of Commons, planning is only part of the solution (and strategic planning one element of that): it is necessary for other components of the Bill, and of the NPPF, and of initiatives yet to be launched, to combine to bring about the much-needed change. n
Pete Canavan is a partner with Carter Jonas
How we can solve the S106 crisis
Much needs to happen if we’re going to reach the 1.5m target, including unlocking the potential of S106 agreements, says Pam Sullivan
Since their introduction in the Town and Country Planning Act in 1990, Section 106 (S106) agreements have been one of the main ways of delivering new affordable housing in the country. Few planning clauses have had as much impact, or attracted as much scrutiny.
Local authorities have long seen S106 agreements as vital to delivering wider priorities: from mitigating development impacts to funding infrastructure, protecting the environment and supporting the local economy.
However, the Home Builders Federation reports that around 17,000 S106 homes are not being built, because housing associations aren’t bidding for them. It’s clear that the appeal and effectiveness of these deals is diminishing.
And the timing couldn’t be worse, with the housing crisis acutely impacting millions of people in the country. As of March this year, a record 336,366 households in London were on local authority social housing waiting lists. This figure represents a 32% increase since 2014 and is the highest number in over a decade.
Meanwhile, many local authorities are also faced with ever-increasing budget cuts and a fullblown temporary accommodation crisis.
The Government has recognised the urgent need for more homes, setting a target of 1.5 million set by the end of the parliament.
But targets alone won’t get us there. Given the scale of the crisis, we need to rethink S106 agreements, as they are an essential way of meeting the demand for housing across the country.
Rethinking the S106 model
The G15 group of London’s largest housing associations has recently published a report setting out the challenges behind the current S106 model.
Collectively, the G15’s members own or manage more than 770,000 homes across the country and they house around one in ten Londoners. They also build around 15% of all affordable homes across England. Much of that was historically delivered through S106 agreements. However, recently, all members have reported a sharp decline in their
appetite for these contracts.
While every scheme is unique, G15 members have agreed a set of standards and principles for future S106 homes. Our report, Building Together, Building Better: Rethinking S106 for Affordable Housing Delivery, provides a practical framework for developers and housing associations.
The affordable housing sector has raised concerns over the quality, design and timing of homes acquired through these agreements. Until recently, this feedback was largely anecdotal. However, with the introduction of Homes England’s S106 Affordable Housing Clearing Service, the widespread matter of declined contracts has become clear. Unless these issues are revisited, they risk continuing to undermine the provision of affordable housing in the UK.
At L&Q, we have consistently been one of the largest providers of new affordable homes in the sector for years. Historically, over 1,000 of our new homes each year came from S106 agreements. In 2024/25, it’s zero.
And unfortunately, we are not alone. The fact is that, when bidding for these homes, we are often faced with a ‘take it or leave it’ deal, rather than being brought in early on, when we can influence the planning process. This includes essential aspects like the design and quality of properties, the way that places are managed, and the terms of the deals themselves. Building new homes isn’t enough. They must genuinely meet the needs of the people who live in them and be manageable by housing associations for decades to come.
That’s why our report finds that early engagement and collaboration are the key principles which should sit behind a successful, long-term S106 agreement.
An important role for local authorities With record-level housing delivery targets being placed on them, councils and their planning teams can play a crucial part in facilitating the development process and ensuring the right homes are delivered in the right areas.
Bringing HAs on board, ideally during the preplanning stage, or at land acquisition, allows them
Pam Sullivan is a Development Support Director at L&Q
to actively contribute to design, specification and performance decisions, ensuring that homes meet long-term management needs. Moreover, having an affordable housing partner on board at this stage can help housebuilders overcome planning hurdles and secure consents more quickly.
Local authorities have an important role to play as facilitators of S106 agreements. They know who the key players in each area are, from HAs to developers and small and medium sized builders, and can broker discussions. They also have an interest in shaping the terms of new developments from an early stage, like the tenure split and the size of the homes to be delivered.
For example, at L&Q, we’ve had conversations with a large London borough which has recently taken over a large number of 2-bedroom affordable homes and are struggling to allocate them. As developers and registered providers, we always hear that we should be looking to deliver larger homes rather than 1-bed flats. That’s not the case in this area, illustrating the importance of tailoring provision to local need.
HAs as crucial delivery partners
A critical change in the way S106 contracts are structured would be to treat HAs as equal development partners and involve them throughout the planning and design process.
The second principle, of ongoing collaboration and transparency throughout the project, is also essential. This includes meaningful engagement at key points in the development process, such as regular technical and design meetings to approve specifications and components, as well as site visits
to ensure alignment and smooth delivery.
Both principles are detailed in the report, which has been endorsed and supported by the National Housing Federation, the Chartered Institute for Housing, the Greater London Authority and Homes England.
We can’t afford to overlook these issues, because S106 makes up such a huge proportion of affordable housing delivery. Over the last five years, nearly half of the new affordable homes in the country have been delivered through S106 agreements.
We can’t ignore the fact that many housing associations finances are stretched meeting the
costs of essential investments into the safety and quality of residents’ homes. The social housing sector needs sustained, long-term investment and financial certainty from Government to enable it to build and acquire homes at scale again. The fact that many S106 deals often require a large upfront payment from the affordable housing partner is a challenge in this context.
However, it’s also time that HAs, which are collectively the largest providers of affordable housing in the country, are considered equal partners in these deals. We need a new, more collaborative way of working with developers and planners so we can
get to work together.
This principle of mutually-beneficial outcomes should be the foundation of every partnership and it’s what the G15 argues for in this latest report.
The Government’s target of 1.5m homes doesn’t have to be a distant dream, but much needs to happen if we’re going to reach it, including unlocking the potential of S106 agreements. Since its launch, the publication has received a hugely positive response, which leads us to think there is an appetite for change. If we can embrace it, this represents an opportunity to not only unlock more new homes, but also create better places. n
The Government and the latest on viability
If ministers are serious about delivering 1.5 million homes they must face viability directly, says Andrew Golland
The government’s NPPF Consultation Response stated that the Ministry of Housing, Communities and Local Government would update development viability guidance in “spring this year.” The latest position, according to the Minister for Housing and Planning, is that the guidance will be issued “as soon as possible this year.”
This may follow Matthew Pennycook’s intriguing statement that the new guidance will allow developers to negotiate contributions only “where it is genuinely necessary and where local authorities can be confident that this is the case.” Pennycook has also suggested that land value benchmarks (LVBs) are under review, with possible amendment or even abolition.
Below is my response to this apparent direction of travel.
“Genuinely Necessary”
If this term appears in guidance, we must ask: in what circumstances would it be “genuinely necessary” to negotiate contributions? I can think of several:
• When scheme economics differ from plan assumptions.
Local plan viability assessments rarely go beyond headline targets and thresholds. Affordable housing
targets, for example, often fail to distinguish between flats and family housing, and higher thresholds (in line with national policy at 10 units) are seldom explored. This leaves many schemes outside the scope of plan testing.
• If LVBs are abolished.
Without LVBs, LPAs could revert to the old practice of assuming any scheme with a positive residual value is viable. But if a site has a positive residual value and is still held back, how do we explain its non-delivery? Incentive matters. Ignoring landowner motivation is like expecting a taxi to depart simply because the tank is full, without considering whether the driver is paid.
Interestingly, Pennycook noted that developers themselves objected to LVBs in consultation. This is surprising, since LVBs often benefit applicants: “EUV Plus” (existing use plus premium) allows them to justify paying market value, even where land deals do not discount for Section 106.
• When housing land supply falls short.
This is becoming more likely. Planning (4 September 2025) highlighted recent local plan examinations (Malvern Hills, Wychavon, Uttlesford) where inspectors accepted plans despite land supply shortfalls. Such cases risk inflating land prices and embed-
Dr Andrew Golland specialises in the field of housing, planning and regeneration
ding Section 106 into deals, making viability assessment not just “genuinely necessary” but unavoidable.
• Because of market conditions.
Since the 2008 crash and Brexit, development has faced slower prices, rising costs, and greater risk. Returns have shifted from 10% to 20% on GDV. Against this backdrop, how realistic is it for local authorities to deny the need for viability assessment—or to claim they are “confident” it isn’t needed? In practice, such calls will be made by officers who turn first to viability assessors. We will end up back where we started.
The Lesson of Canute
The government may be forgiven for wanting to simplify viability. The last Conservative administration tried something similar, insisting site-specific assessments should only happen where circumstances diverged from plan evidence.
But reality intervenes: viability is always site-specific, and the sums at stake are too large to avoid argument, however strong the plan evidence. Policy testing has its place—it should help shape the land market—but policy targets ultimately depend on land supply, which dictates Section 106 levels.
King Canute demonstrated the futility of resisting forces beyond control. Likewise, government should recognise that viability cannot be wished away. While the industry repeatedly warns that policy must be responsive to market conditions, the current approach seems to head in the opposite direction.
If ministers are serious about delivering 1.5 million homes, they must face viability directly. That requires more data, better evidence, and clearer guidance –not less. n
Andrew Golland Associates –Housing, Planning & Regeneration Experts
Economy versus ecology
Are we anti-development or pro-development? What is needed is balance, says Lawrence Turner
In the current discussion around planning and development, the Government stands accused of polarising the debate: are we anti-development or pro-development; NIMBY or YIMBY; economically driven, or environmentally conscious?
Yet the essence of good planning should not hinge on such a binary viewpoint. It is about the need for balance. Balancing people’s needs, protecting the environment and stimulating the economy. Sustainability.
The challenges of achieving this equilibrium are more difficult still, when the public debate revolves around two critical issues: our failure to build enough homes since the 1950s; and a persistent economic stagnation that followed the 2008 financial crash. Both factors have heightened our urgency to grow the economy.
Critics argue that environmental regulations have become excessively bureaucratic, delaying development and economic growth. From the production of lengthy Environmental Impact Assessments to compliance with complex Habitat Regulations, the level of consents, permissions and regulations can be overwhelming for developers. Take HS2, for example. Despite its ambition, the project was mired in delays, showcasing a planning system that excels at regulating and safeguarding the environment, but falters in delivering timely planning permissions and consents.
A more cynical perspective suggests we are far too bureaucratic when it comes to assessing environmental impacts of development. Take for example protected species, such as bats. Recent headlines highlighted the extraordinary ecological costs associated with the HS2 project, which included spending £100m on a shield to protect bats that was just one of 8,276 separate consents required.
Yet, thorough environmental assessment of our impacts on habitats or climate are critical to meeting our commitments to greenhouse gas emissions targets and to protect and restore protected habitats. The Government’s new Nature Restoration Fund proposal may offer a hint of progress in this regard, allowing developers to pay into the fund and the project to proceed unhindered.
The Government’s new Nature Restoration Fund proposal may offer a hint of progress ... allowing developers to pay into the fund and the project to proceed unhindered.
Still the debate is far from settled. Take the contentious issue of a third runway at Heathrow. The Chancellor argues that such an expansion could yield a 0.43% boost to GDP by 2050, yet aviation is among the most significant contributors to climate change and is responsible for around 7% of total UK greenhouse gas emissions.
The stark reality is that expanding air travel in the UK will require monumental carbon offsetting. Commentors suggest this would require the planting of a forest twice the size of Greater London to offset the projected emissions from the Government’s planned expansion of Heathrow,
Lawrence
Turner is a director of Boyer (part of LRG)
Gatwick and Luton airports.
Instead of questioning whether we can genuinely reconcile economic growth with safeguarding the environment, we should ask how we can work together better to foster development that balances people’s needs. A significant part of this lies in empowering our decision-makers to support sustainable development, rather than opposing it. n
What changes are required?
The government intends to update the National Design Guide and the National Model Design Code. What changes are required, asks Glen Richardson
Spring is often perceived as a period of renewal, and that sentiment now extends to the planning system. Back in December, the government confirmed that both the National Design Guide (NDG) and National Model Design Code (NMDC) would be updated this season. While the changes are predicted to be modest, this presents an appropriate opportunity to consider how these documents might evolve, and how even small refinements could help accelerate housing delivery without compromising quality.
The importance of the NDG and NMDC
Essentially a broad checklist for making spaces well-designed and in tune with community needs, the current NDG considers building design, green spaces and road layouts, and aims to create areas that are attractive, healthy and easy to navigate. The NMDC provides a roadmap to local authorities to prepare design codes and builds on the NDG by detailing particulars such as materials, building heights, car-parking and street widths.
Embedded in policy, these national-level guidelines are frequently quoted in planning decisions, appeals and inquiries and offer a useful foundation and point of reference to assess the quality of design.
NPPF sets the standard
While last year’s NPPF modifications marked a significant shift in national planning policy, the imminent tweaks to the NDG and NMDC are anticipated to be relatively minor – more a case of refinement than reinvention. Crucially, they’re not expected to include anything which would delay the process of expediting planning consents.
The NPPF gives the NDG and the NMDC considerable weight. Paragraph 133 of the revised NPPF outlines that to provide maximum clarity about design expectations at an early stage, all local planning authorities (LPAs) should prepare design guides or codes consistent with the principles set out in the NDG and NMDC.
Meanwhile, paragraph 138 states that the NMDC is, the primary basis for the preparation and use of local design codes and removes the requirement for local design codes to be the primary means for assessing and improving the design of new development.
Keeping guidance fit for purpose
Ensuring these guides are refreshed is important. In practice, they’re not only regularly cited in appeals and real-world applications, but they also serve as a “default” guidance for LPAs overstretched to deliver more homes, especially where time and resources to develop bespoke design codes are limited.
Following the widely welcomed removal of the word “beauty” from the revised NPPF, there’s a renewed emphasis on clarity and objectivity in design, as well as substantially increasing housing output. By refreshing the NDG and the NMDC, these guidelines will be brought in line with a more grounded and practical policy direction.
What changes are required?
LPAs are stretched, and with Labour’s 1.5 million homes target, it’s essential to keep processes straightforward. Excessive specifics risk complicating planning and hindering the construction of much-needed market, social and affordable housing. A one-size-fits-all approach, therefore, should be replaced with localised, context-sensitive design.
It makes complete sense, in both architecture and planning, that design codes – where they exist –should be applied at a local level. To suggest that a local authority should have a single design style covering its jurisdiction is the antithesis of good design: places should always respond to their immediate surroundings.
Perhaps more significantly, given the push for growth and the magnitude of national housing targets, it is vital that both the NDG and NMDC support those councils that lack the internal capacity to create their own guidance. As such, the updated documents must remain well-defined, accessible and straightforward to apply, specifically for authorities already under pressure.
Guiding good design and accelerating housing delivery
There’s a misapprehension that good design takes time. In practice, good design policies – those which stem from national policy but are implemented through local policy – are instrumental in
Glen Richardson is an Associate Partner with Carter Jonas (Cambridge)
allowing schemes to progress quickly, even on difficult sites.
Our recent experience in North West Hatfield illustrates how transparent, early-stage design guidance – aligned with local policy and national principles – can pave the way for complex, large-scale, multi-phase developments. Prepared on behalf of Gascoyne Estates and adopted by Welwyn Hatfield Borough Council, the Supplementary Planning Document (SPD) outlined a phased vision for a new neighbourhood that includes 1,750 homes, primary and secondary schools, employment space and transport and travel links. Carter Jonas’ Masterplanning and Urban Design team led the preparation of a Development Framework Supplementary Planning Document which set out key requirements for the delivery of a well-designed, high-quality neighbourhood for Hatfield.
Supporting social and affordable housing
LPAs and developers working on social and affordable homes typically face tighter budgets and more pressing timelines. Updating guides to make them easier to interpret – and to minimise delays caused by design-related back-and-forth – could also benefit resource-strapped housing associations and councils.
There remains a common misconception that the swift rollout of housing – particularly social and affordable types, which are typically in even higher demand than open market units – comes at the expense of quality. However, with the aid of the updated NDG and NMDC– as well as the revised NPPF – councils and housing associations will hopefully be better equipped to define what good design looks like. This ease of understanding can remove a lot of the guesswork and, in turn, helps reduce unnec essary costs.
For social and affordable housing, fostering inclu-
Streamlining consultation on infrastructure schemes
Streamlining must relate to delivery. It can’t mean doing the same amount of work more quickly; it should mean doing less to achieve the same high-quality (or better), argues Hannah McGinn
Under government proposals set out in April as part of the Planning and Infrastructure Bill, ‘burdensome’ consultation requirements on nationally significant infrastructure projects (NSIPs), will be scrapped to (according to MHCLG figures) save £1bn and lead to schemes being completed ‘at least a year faster’.
Carter Jonas’ Consents team welcomes the government’s aspiration to make the UK a ‘Clean Energy Powerhouse’, together with the majority of the Planning and Infrastructure Bill, which will be fundamental in achieving this.
But the proposed changes to consultation will require careful consideration, especially if the Bill is to succeed in delivering planning decisions at speed without damaging the finely balanced process of local involvement in planning decisions.
Carter Jonas’ Energy team works for a wide range of clients in this sector, across a wide geography. This includes National Grid, Cadent, Scottish Power Energy Networks, National Highways, Green GEN Cymru and SWECO, working on a range of gas, trans-
sive, well-connected and sustainable places – underpinned by tenure-blind design – is a central aim. Creating communities is one of the NDG’s core characteristics, with factors such as social interaction, walkability, green space, mixed-use development and inclusion all seen as fundamental. Updates to this document should seek to refine and reinforce these principles, ensuring they continue to support diverse tenures and neighbourhoods, including those with a high proportion of affordable homes.
The road ahead
Ultimately, consistent and clear policy and guidance are what’s needed to enable good-quality design and facilitate the timely delivery of market, affordable and social housing. While recent updates to the NPPF have marked an important shift, the forthcoming revisions to the NDG and NMDC must continue this trajectory. Change for change’s sake is rarely the right course. While politics may flourish on dramatic twists and turns, policy works best when it remains clear, measured and consistent. n
port and electricity infrastructure projects. So, on the surface, this is encouraging news for us and our clients.
As we see it, the government’s aspiration to both achieve Net Zero and drive growth will inevitably require changes to the process. Currently, the process of securing consent for NSIPs can be slow and uncertain and clearly the government appreciates that this can constrain economic growth and undermine energy security.”
The Guide to the Planning and Infrastructure Bill states that it can fast-track 150 planning decisions on major economic infrastructure projects by the end of this Parliament. The Bill aims to do this by simplifying the initial stages of the consenting regime.
Streamlining – pros and cons
The views of Secretary of State Angela Rayner have been characteristically blunt: “Critical national infrastructure is key to Britain’s future and security – so we can’t afford to have projects held up by tiresome requirements and uncertainty, caused by a system that is not working for communities or developers and holding back our true potential.”
But while the intention to streamline consultation is welcomed, we believe that the mechanism warrants careful scrutiny. Streamlining must not become a euphemism for sidelining. One of the foundations of our planning system is public participation. While consultations can be time-consuming, they are also the main channel through which communities can engage with the process and much of this can be positive.
I would be concerned if ‘efficiency’ or ‘streamlining’ was used to gloss over a democratic deficit. Community insight frequently brings to the surface site-specific knowledge that can improve project outcomes—whether it's identifying flood risks, preserving biodiversity corridors, or understanding local heritage and culture.
Furthermore, curtailing consultation risks fuelling public resistance and eroding trust. If channels of communication in the early stages of the process are reduced, this could come back to bite developers at a later stage.
McGinn is an Associate Partner Carter Jonas
Striking the right balance
It is interesting to consider whether it is possible to streamline consultation without sacrificing accountability. Furthermore, it’s hard to identify specific phases in the consultation process which are entirely unnecessary. A crucial part of the process is creating a statement of common ground with key stakeholders. You do need to put in time and effort at this stage as this helps agree on the methodology ahead of the examination. With stakeholders, it’s important to bring them in on the journey from project design to inception.
It’s been widely talked about that there won’t be a requirement to consult on a PEIR (Preliminary Environmental Information Report), which will help to speed up the process as consultation takes 6-8 weeks and can only be done at certain times of the year (for example, avoiding school holidays). Seasonal survey windows and land access can further restrict timescales.
Consultation is necessary in building a relationship with the community, which is important as you’ll be working alongside them over a long period of time. On the one hand, planning processes such as archaeological trail trenching can help provide the community with local knowledge which generates positive conversations.
On the other, consultation is risk mitigation. In my experience, if you start by leaving people out, it gives them more cause to object at the Examination stage – it may speed things up initially but it then cause bumps further down the line.
There is certainly room for improvement: educating stakeholders to better understand planning documents and issues, and simplifying documents – but implementing these changes would take more time, not less. There is also the question around whether there is enough resource within local planning
Hannah
authorities to deal with the volume of work coming forward.
A proposed solution
So the solution may be in improving consultation, rather than reducing it. For example, digital tools should be more widely adopted to make consultations more accessible and efficient. Virtual engagement platforms, online forums and data visualisation tools can bring plans to life and engage a broader cross-section of the public, including younger and digitally literate demographics who are often underrepresented.
Secondly, there is scope to professionalise the consultation process itself. Clearer guidance on what constitutes effective engagement, coupled with capacity-building for local authorities and statutory consultees, could ensure that consultations are more focused, constructive, and timely.
Thirdly, the government should consider a tiered approach to consultation, proportional to the scale and impact of the project. Not every NSIP requires the same level of scrutiny, and a more graduated framework could preserve the principle of participation while avoiding unnecessary delay.
Our work demonstrates the need for this nuanced approach. Consulting with communities and stakeholders will always be fundamental: it’s impossible to develop and shape our projects without local input. Although the Bill is yet to be enacted I hope that ultimately the changes will ensure that consultation and engagement can be more effective and more targeted.
Financial incentives
Another aspect of the Bill is a new funding mechanism which will enable communities to gain financially from new infrastructure sited in their vicinity. For example the government has said that households near to new or upgraded pylons will save up to £250 a year for 10 years. Additionally, new guidance will require that developers fund projects including sports clubs, educational programmes and leisure facilities.
The government estimates that new community funds would benefit communities by approximately £200,000 of funding per km of overhead elec-
tricity cables in their area, and £530,000 per substation.
We agree with that approach. Community incentives already exist but this is currently quite disparate. There’s also a risk that it can be seen as buying planning consent. So the proposal to make this more transparent is certainly welcome.
Streamlining throughout the process
All processes, not least the planning process, require regular reviews, and the Planning and Infrastructure Bill is the ideal opportunity. Inevitably, streamlining will form part of this. It can also be achieved through other aspects of the planning. For example, streamlining can enable a joined-up approach across local planning authority areas; also updating the National Policy Statements to reflect current needs and priorities, and reviewing thresholds – all of which we wel-
But streamlining must relate to delivery, rather than just intention. It can’t mean doing the same amount of work more quickly; it should mean doing less to achieve the same high-quality applications (or better). But if it achieves a lesser result, I think it should be questioned.
As everyone will agree, the ambition to turn the UK into a Clean Energy Powerhouse is laudable and necessary, and reforming the NSIP regime is a key part of that puzzle. Our view is that we should strive for a planning system that is both faster and fairer; one that recognises that the voices of local people, far from being a drag on progress, are often the very source of its legitimacy and success.
The government's challenge is not just to build infrastructure, but to build consensus. If it can do both, the vision of a Clean Energy Powerhouse might not just be rhetoric, but reality. n
Affordable
Homes
Programme not as generous as it seems
From: Councillor John Moss MRICS (retired)
The government has announced a 10-year Affordable Homes Programme (AHP) of £39bn, together with a 10-year rent formula, intended to give the sector long-term certainty and get it building again.
Welcome though this is, it is perhaps not such an increase in funding as is being claimed.
This is because last year, the government announced that from November 2024, the discounts available to council tenants who wished to buy their own homes would be drastically reduced. Predictably, this has led to applications to exercise the Right to Buy all but drying up.
This matters, because Right to Buy receipts have, when adjusted for inflation, totalled over £12.5bn in the 12 years since the scheme was rejuvenated by the coalition government.
In the last two full years, receipts exceeded £1bn, and after a surge of applications when the reduction in discounts was announced, they may reach that level again in 2024-25.
Following the 2012 reset, councils were challenged to use these receipts to build new affordable homes.
The almshouses charity I chair used some of my council's receipts to support building 20 new homes under this scheme.
While the replacement rate is not as high as it might have been, every one of these homes was a home available to a household in need. The ones sold, of course, were already occupied.
So, the net result is that funds from buyers and their banks are being replaced by taxpayers' money or government borrowing and, overall, the funding available is not going up that much at all.
(First published by Property Week)
The September Forum
– especially a contribution by Paul Finch – led to this outbreak of professorial correspondence
From Professor Michael Edwards, UCL Post to Paul Finch and LSE professors Paul Cheshire and Ian Gordon
Today I had an argument with Paul Finch which made me think of writing this open letter to him. Labour and Tory parties in Britain have converged on housing and planning policies which most of us completely reject and I’m detecting some common ground between what deregulationists like Paul Finch and leftists like me are saying. Odd but true. Here goes.
Dear Paul
At the end of Tuesday’s meeting of the London Planning and Development Forum you made an impassioned speech which roused the meeting to clapping and cheers.
I agreed with half of what you said but not the other half. The common ground seems to be worth exploring.
The essence of your argument was that the UK saw its biggest housing output in the postwar years when public sector and private sector were both producing. We won’t get such massive output now without the state again building at a large scale. (Agreed)
Private housebuilding firms won’t supply social housing / ‘affordable’ housing at the required scale where the costs come on top of general inflation of building costs plus rising environmental, floorspace, safety and other standards, especially in a shrinking economy where disposal prices in the private housing market are flat-lining or falling. (Agreed)
It’s wrong to blame the planning system for this failure to build a lot more. Planning authorities don’t (on the whole) build. It’s private housebuilders who decide how much to build. (Agreed) Housebuilders are like bakers making bread. If
they are told to give away half their loaves at half price they will naturally shut down production. (Disagree)
I disagree with this step in the argument because the costs faced by housebuilders include land whose behaviour is special, accounting for a third or a half of the final price of a house. Over recent decades the prices of residential land in the UK, especially in and around London, have escalated very dramatically as developers have made large bids for sites in the good years and builders can’t/won’t meet all these demands for affordable homes, better standards, payments for infrastructure, especially in a falling market unless they can get land much more cheaply. Land prices ‘ought’ to fall in these conditions and Mr X, the strategic land expert who spoke to us today, confirmed that development land prices can and do fall. But evidently — for our discussion — not fast enough, and that will be especially so in London. Housebuilders are stuck with the sites they own and what they paid for them. I think the evidence supports my version of this problem. We would need to get land price expectations down, as Prof Ian Gordon said today, to have any hope of bringing house prices down to more affordable levels. Until then, land prices ratchet up more readily than they fall.
The important disagreements in all this are about why land prices and house prices have risen so much. Labour and Tory leaderships have swallowed the argument that it’s just down to an inadequate total supply of homes. There are crude and more sophisticated versions of this position but many of us disagree. House prices have been driven up by the combined action of many forces: Paul Cheshire’s analysis showing that as people
get richer they consume more housing, for a whole variety of reasons (expand)
Combined with sustained income growth for better-off UK households in our increasingly unequal society
Combined with the lavish availability of mortgages since the 1980s to cover our lavish bids for the next home as we trade up, and more recently for buy-to-rent
Combined with the tax/subsidy treatment of owner-occupation and housing generally, including IHT, CGT and the way housing benefit (LHA) has sustained the growth of private renting and the way Help to Buy fuelled prices and builder profits.
Increasingly by the feedback loop in which old people like me, enriched by these mechanisms over a working life, pass this crazy wealth on to our children by gift or bequest, further accelerating price growth.
But this is not the whole story. Housing markets are partly local and prices reflect access to jobs, environmental qualities, state investment in Elizabeth Lines, super-sewers, good schools and so on. London and its region are uniquely wellendowed in these ways, not to mention with theatres, concerts, museums and universities which people want to use.
The crude versions of the supply-side argument simply propose massive de-regulation, assuming that housing output would grow without social housing obligations, conservation areas, green belts, biodiversity net gain and so on. Many of us are unconvinced and the serious research on the subject suggests that the affordability benefits would be very very slow indeed, swamped by all these other factors pushing prices up, and environmentally disastrous too..
The Mayor of London is clearly not keen on us discussing these issues. The planning team wants to be left alone to produce what looks like being an even worse plan than its predecessors.
How can we progress it?
Perhaps a version with footnotes should be next.
Michael
From Professor Paul Cheshire LSE to Professor Michael Edwards
Dear Michael, Nice letter but I fear I disagree with your arguments in crucial places.
First and most important is the work I and others at LSE (particularly Christian Hilber) have done now over many years (you were involved as an ESRC overseer/interlocutor in the first project back in the early 1980s). In my judgement this line of research has produced overwhelming and absolutely rigorous evidence that the planning system we have in Britain is the major cause of our housing crisis – a crisis or supply. The co-authored paper Christian published in the Economic Journal in 2016 (The Economic Journal, 126, 358–405. Doi:
10.1111/ecoj.12213)
demonstrated that variations across LAs in their ‘restrictiveness’ –measured as % of major applications rejected, offsetting in an econometrically very sophisticated way for problems of reverse causation or endogeneity - causally explained a variation of at least 25% in the difference in house prices – all other characteristics held constant –between the South East and the North. This still excluded the constraining effects on supply of both Green Belts and Brown field first policies and the uncertainty the discretional decision making process of our planning system (not Continental European systems) injects into the development process. The uncertainty generated by our locally politically controlled and lobbyable planning system in turn helps drive the monopolisation of our development industry because it generates a big barrier to entry favouring bigger firms.
132% by 2016. In the outturn the increase was around 140% - depending a bit on what price deflator you use to get ‘real’ price increase. And, as you say Michael, by far the most important driver of this price increase – of course in the face of a supply constraint – was the expected increase in real incomes not population. If you subtracted projected income growth but retained the projected increase in population then the increase was only 4.4%.
The brown field and greenbelt policies – in place respectively for a generation and over two generations – constricts land supply for housing and most strongly constricts it in those places people most want to live – near big urban jobs markets. The most convincing evidence for me on the effects of this constriction of land supply was the modelling Steve Sheppard and I did back in the late 1990s early 2000s, commissioned in April 1997 (when there was no government), by the then DETR to model the impact on real house price growth between 1996 and 2016 of alternative policies for land release. The results of this modelling (again very detailed econometric work using observations of actual houses, the size and shape of their gardens, transactions in them and the characteristics of the households who bought them including their incomes) concluded that the combination of both these restrictions on land supply for housing would lead to an increase of 132% in the real price of characteristic-constant houses by 2016; and that was when the brown field target was set at only 60%.
This research was sadly never published (see graphic above) because by the time it was completed Rogers had reported and Prescot had committed to urban densification and sacrosanct greenbelts). So it was literally suppressed because it was thought ‘critics of government policy might use our results’ –so much for evidence based policy. It was also claimed that our results were absurd and there was no way house prices could rise in real terms by
Nor do I agree that only a big increase in government house building can generate a serious increase in supply. I disagree because i) all houses, however paid for, need land and that is what we are absolutely constraining; ii) we have completely persuasive evidence that the current set of planning policies are creating a perfect storm in terms of building; iii) if you go back before 1947 to when we did build houses we built lots of them; and, of course iv) there is no way in reality it could happen because of public finances.
In the current GLA area the largest number of houses built since 1945 is some 37,500 in 1970 at the peak of social housing build. Mostly we have averaged around 25,000 a year in the last 60 years but very variable. In fact in 2019/20 we got close to the 1970 figure with not many social houses. But back in the 1930s we were happily building 70,000+ houses a year within what is now the GLA area. I attach a slide of historic house building in what is now the GLA area.
A minor point on land prices is that indeed they do reflect the expected loss of profits to developers of ‘affordable housing’ production via S106. I searched around for sites with outline planning but no obligations in Barnet and found one implying a price per ha of building land of £37million. At the same time – 2020 – a very senior valuer estimated the price of building land in Barnet at £5m per ha. But of course they were implicitly subtracting the negative value of S106 – so what a developer would pay assuming there would be S106 obligations.
All the best, Paul
CLIPBOARD CLIPBOARD
Housing
target to
be met by half
Projections by Lanpro reveal that the 1.5 million target is set to meet little more than 50%.
Labour has staked much of its economic strategy on housing. The government’s promise to deliver 1.5 million homes by 2029 is intended to improve affordability, boost construction productivity and stimulate growth. But analysis from planning consultancy Lanpro based on government figures shows that despite a flurry of policy announcements, delivery is 10 per cent down on the ten-year average, and well below the 300,000 per year widely accepted as the minimum needed to reach Labour’s pledge. At current rates, only half of that figure is set to be met.
The latest estimates from the Ministry for Housing, Communities and Local Government (MHCLG) indicate that around 196,500 dwellings were added to England’s housing stock in 2024–25, an average of 16,375 homes a month.
By contrast, the previous decade averaged 222,746 homes a year: 18,562 per month.
If delivery continues at today’s rate, Lanpro calculates that the country will be around 860,000 homes short by the end of 2029 – missing the headline 1.5 million target by about 46 per cent.
Regional imbalances
Lanpro’s new mapping shows a starkly uneven picture. The South East and London, where housing need is most acute, are also the furthest from meeting targets – achieving just 47 per cent and 35 per cent of their estimated requirements in 2024–25. By contrast, parts of the East Midlands (79 per cent) and North East (77 per cent) are closer to keeping pace.
At local authority level, the contrast is even sharper. Preston added homes at 232 per cent of assessed need in 2023–24, with Ribble Valley (186 per cent) and Salford (196 per cent) also exceeding targets. Yet many high-demand southern councils delivered less than 20 per cent of the homes they require – with Kensington and Chelsea at just 5 per cent and Bromley at 8 per cent.
This mismatch reveals that the regions and boroughs with the greatest affordability crisis are least likely to meet targets.
Policy ambition versus delivery reality
Labour has introduced reforms aimed at unlocking land and investment – including the introduction of the 'grey belt', setting mandatory housing targets and launching a National Housing Bank to channel capital into new development. But planning bottlenecks, infras-
tructure constraints and market uncertainty remain.
Commenting on the research, Faraz Baber, Chief Operating Officer at Lanpro, said: “During the Labour Party Conference we heard the mantra ‘build baby build’ numerous times. Yet our analysis shows that to pick up the necessary speed to meet the target, record breaking numbers of homes will need to be built in a short space of time. Based on the current housing delivery trajectory, if we do not see a significant uptick with immediate effect, we could see the target missed by almost half.
This will require a holistic, cross departmental collaborative approach, led by both No.10 and the Treasury, working with local authorities and government agencies. It will require a significant number of these homes need to be built directly by the Government and its associated agencies and will require alignment with transport and energy planning.
Failing this, it’s not clear how the target will be met.”
CORRECTION
Yvonne Sampoh, Principal Planning Officer (Policy) at the London Borough of Barnet asks that the following paragraph replace that in last issue’s LP&DF forum report: ‘The London Borough of Barnet adopted its Local Plan early March 2025. The Inspector’s Report came a month before the NPPF was published late last year, with implications for some Green Belt release and development in the Grey Belt. So, the NPPF has interesting implications. The Council is very much of the view that its Local Plan position regarding the Green Belt is justifiable. They eagerly await the outcome of London Wide Green Belt study.’
New land policy changes in the UK
From TerraQuest UK: Developer’s hold onto your hard hats for this one. There have been a series of recent developmentfocused policy updates, all set to have notable implications for small and medium-sized developers. To help you navigate the changes, stay informed about challenges, and make the most of new
CLIPBOARD CLIPBOARD
opportunities, we’ve collated some of the key takeaways into helpful explainers below.
The good news is, much of the updates are aimed at streamlining processes and revealing development potential - especially if you’re working on those smaller home schemes or unlocking brownfield sites.
We know it’s not all smooth slabs and strong brews, so we’ve laid out the what’s changed, what it really means for SME developers - and how to act on it now.
The emergence of “medium site” planning tiers
In May 2025, the Government released a Planning Reform Working Paper: Reforming Site Thresholds. It proposes splitting planning applications into three sizes:
• Minor: Under 10 homes
• Medium: 10–49 homes (NEW)
• Major: 50+ homes (gov.uk)
This new “medium site” tier could be a genuine unlock for SME builders, who for years have been caught in a “one size fits all" system. Less bureaucracy, more proportionate demands, and an emphasis on delegation to officers rather than potentially slow-moving committees? These updates seem to be paving the way for streamlined processes and more pragmatic decision making.
Our take? It’s a promising step. But execution matters - local authorities need the resourcing and clarity to deliver these streamlined pathways.
To learn more, check out our recent post: The future of grey belt land: planning and sustainability changes , which dives into how grey/brownfield strategies intersect with tiered planning.
Less ‘red tape’ for Biodiversity Net Gain (BNG)?
BNG, a 10% biodiversity uplift, is currently mandatory for most developments, but it hasn’t landed evenly. There are some indications that smaller developers may have struggled with the metric’s technical and financial requirements, especially on urban or brownfield sites. The May 2025 consultation proposes:
• BNG exemptions or simplified rules for single dwellings and small sites
• A revised metric to make applying for BNG easier
• Streamlining for brownfield and grey-belt developments (gov.uk)
Our take: Biodiversity Net Gain (BNG) is a bold, forward-thinking policy that places nature at the heart of planning priorities - an approach we have always supported. However, its implementation has presented challenges, particularly for smaller developers. Some of the proposed updates may help to ease these pressures, especially for those working on urban or brownfield sites. Regardless of the consultation’s outcome, we believe that greater transparency and ongoing support will be crucial to BNG’s longterm success. We encourage developers to make use of available tools, such as Joe’s Blooms’ online calculator, to ensure they are well-equipped to meet requirements.
You can read more on BNG’s implementation in our full report: Biodiversity Net Gain: The Story So Far.
Proposed changes to the way applications are processed include:
• Delegated authority for minor and medium-site applications
• National service standards for planning response times
• Reduced need for planning committees on smaller schemes
These changes aim to unblock the pipeline for the kinds of projects SMEs typically lead - local, low-rise, and often on trickier sites that major developers overlook.
Our take: Efforts to reduce unnecessary delays are always welcome, and we acknowledge that committee processes can have time-consuming or even potential roadblocks to progress. The government has reaffirmed the importance of meaningful local engagement in every project, while also recognising that aspects current procedures may benefit from greater efficiency. These proposed changes have the potential to support SMEs by creating a more level playing field - enabling them to bring forward highquality developments in a timelier and streamlined manner.
Brownfield and grey belt land in focus
The updated National Planning Policy Framework (NPPF) includes support for developing on ‘grey belt’ sites - areas within green belt boundaries that don’t strongly serve green belt purposes. This is a subtle but powerful policy shift that could open
new supply in well-connected locations.
For SME developers, who often lack the scale to compete on open market land bids, this represents a key opportunity. Explore our land-source strategies in: The future of grey belt land: planning and sustainability changes.
Access to finance and land for SME developers
New and updated support for SME developers includes:
• Home Building Fund: loans for SME-led builds (gov.uk)
• Homes England land schemes: reserved for smaller firms (gov.uk)
• Small Sites Aggregator pilots: active in Bristol, Sheffield, Lewisham (gov.uk)
• A future £16bn National Housing Bank for small developers (gov.uk)
What these changes could mean for SME developers
1 Tiered thresholds - faster, cheaper planning for 10 - 49 home schemes
2 Committee reform - officer-led processes, meaning less time spent at committee
3 Grey belt opportunities - more accessible, viable land in well-connected areas
4 Finance and land support - Dedicated funding and pilot schemes tailored to SME needs.
City forms historic markets regeneration arm
The City of London Corporation has formed a regeneration arm to reposition the Smithfield and Barbican area as the ‘epicentre of the capital’. They have voted to form the Markets Site Regeneration Programme which will have responsibilities including overseeing a 30-year strategic masterplan for the Smithfield and Barbican area. The 11-strong team will have wide-ranging responsibilities for around 70 acres of prime land including strategic master-planning of the Smithfield and Barbican area.
Citi’s
£1bn tower
will be the workplace of tomorrow
The American bank is leading a renovation of its Canary Wharf tower and CEO Tiina Lee wants to “re-imagine the workplace of the future”
This landmark on the Docklands skyline for the past 25 years is undergoing what is regarded as one of the largest tower block renovations in Europe, at a rumoured cost of more than £1 billion. As far as Tiina Lee, the head of Citi in the UK, is concerned, it is “an opportunity to really re-imagine what does the workplace of tomorrow look like”.
With its own restaurants, ‘wellness centre’ and gym, the finished tower will also have a three-storey winter garden where staff can hold meetings or just enjoy the panoramic views across London.
While the project is under way, the 10,000 people who would usually work in the tower are spread across two sites in Canary Wharf. Some have decamped to 40 Bank Street just across the road — a building that HSBC has also picked to keep a base in Canary Wharf.
Lee reckons the upheaval will be worth it as Citi intends to keep the tower as its base in the capital for the next 30 years: “It really underlines our longterm commitment to London as a financial centre.”
– The Times
New towns identified
The New Towns Taskforce, created in 2024, has recommended 12 potential sites for a new generation of towns or major expansions across England (SEE left)
The government has accepted all 12 recommendations and intends to begin development on at least three during the current Parliament.
The three “most promising” sites selected so far are Tempsford (Bedfordshire), Crews Hill (Enfield), and Leeds South Bank.
Key features and targets
• Each new town should include at least 10,000 homes.
• There is an ambition for 40% of homes to be “affordable,” with half of those available for social rent.
• The proposals combine different models: fully new settlements, urban extensions, and regeneration of existing urban areas.
• A New Towns Unit will be formed within government to coordinate progress, reduce barriers, and oversee innovation.
• Before any final decisions are made, a Strategic Environmental Assessment (SEA) will evaluate environmental impacts, and public consultation will follow, says the government. n
Architect: WILKINSON EYRE
20% off of our planning titles using code PIL20
¡¡ PILLO! PILLO!
Design Museum plans ambitious overhaul of its permanent gallery
This is thanks to support from the National Lottery Heritage Fund.
Following the most successful year for temporary exhibitions in its history, the Design Museum has revealed major ambitions to transform its permanent gallery in time for its 40th anniversary.
At the heart of a new long-term organisational strategy — called Transformation 2029 — is the Design Museum’s plan to ensure its permanent, free-to-access gallery meets the evolving needs of visitors and reflects the fast-paced evolution of the global design story.
To achieve this, and to increase access to its collection of world-class design objects, the museum will embark on a major expansion of its permanent collection gallery, as well as a full overhaul of its displays.
Affordable Homes Programme?
The GLA has published the latest quarterly Council House building statistics.
London Councils started 106 social rent homes and 84 LLR homes under the general 2021-2026 AHP during the first quarter of the financial year. This is 190 homes across all London Councils.
There were no newbuild AHP completions by London Councils under the 2021-2026 AHP in the first quarter of the year. Zero!
The 2021-2026 AHP programme includes allocations totalling £4.6 billion of which just under half is allocated to Councils.
We are four years into the programme.
– Steve Beard, Partner at Beacon Partnership LLP on LinkedIn
Custom House to become an hotel on the Pool of London
The City of London Corporation’s Planning Applications Sub-Committee has unanimously approved plans to restore and convert the Grade 1 Listed Custom House building on Lower Thames Street, into a new 179room hotel.
Formerly an office used by His Majesty's Revenue and Customs, the Custom House is neighboured on the waterfront by Sugar Quay to the east and Old Billingsgate Market to the west.
Described as an exemplar of positive collaboration between City planners and the applicant, the new hotel will feature a spa, health centre and a range of food and beverage uses, opening up the historic building to the public for the first time, including access to the historic Tidewaiters and Long Rooms, for use by community and cultural groups.
The proposals for the wider site are also set to deliver some further, highly anticipated benefits to the public, including a reimagining and opening up of the quayside, providing a unique and inclusive new public space on the riverside, with unfettered access 24/7, 365 days a year. The space will be roughly the size of 12 tennis courts (2400 square metres), with no private closures allowed, replacing the site’s existing car park and security railings.
The City’s hotel stock, currently at around 4,800 rooms, with 1,000 more in the planning pipeline, will play a major role in realising the Corporation’s ‘Destination City’ growth strategy, by helping to accommodate those visitors whose numbers are projected to rise substantially.
The role and responsibilities of the town architect
Hosted by the Architects’ livery company at their hall, Temple Bar by St Paul’s, this seminar debated the role of the town architect. Report by Grant Smith
Peter Murray welcomed attendees and reflected on the legacy of the Society of Chief Architects in Local Authorities. Hilary Satchwell, the town architect for Angel Edmonton, shared her extensive experience in urban design and her focus on using the built environment for public benefit. She emphasised the importance of design leadership and the emotional impact of spaces on communities.
The role of city architects in enhancing urban environments and design quality, and Town Architect roles and responsibilities in various boroughs.
Angel Edmonton and Town Architecture Insights
Hilary Satchwell provided an overview of the Angel Edmonton area, noting its strategic location and the ongoing regeneration projects aimed at improving the community. She highlighted the Shaping Edmonton initiative, which focuses on small-scale projects that enhance public spaces and support local needs. The goal is to create a positive environment for residents during a period
AI Summary
of significant change.
Strategies for enhancing public spaces and community infrastructure.
Ilford's Urban Development Challenges and Opportunities
Jas Bhalla highlighted Ilford's unique position as a suburban area with a diverse community and significant growth potential. However, challenges such as high car dependency, land speculation, and a lack of coherent planning have hindered housing delivery. The speaker noted the importance of member engagement and strategic planning to address these issues and improve local conditions.
Challenges and opportunities in housing delivery across London.
Community engagement in urban design and planning processes.
Hackney Central Town Centre Strategy and Community Engagement
Holly Lewis presented the Hackney Central town centre strategy, which was developed over two
The discussion centred on urban design practices and the roles of various architects and planners in enhancing community engagement and development. Peter Murray initiated the session by providing historical context about the Society of Chief Architects in Local Authorities, emphasising its significance in contemporary urban design. Hilary Satchwell, the town architect for Angel Edmonton shared her experiences and introduced the Town Architect Copilot programme, which aims to improve place shaping in London through independent town architects. This programme focuses on establishing design protocols to ensure long-term benefits for local boroughs.
Hilary Satchwell highlighted the Shaping Edmonton initiative, which encompasses small-scale projects aimed at revitalising public spaces and infrastructure in Angel Edmonton, where 2,000 new homes are set to be constructed. She stressed the importance of community engagement and collaboration between boroughs to address challenges effectively. In a similar vein, another speaker discussed Ilford's urban development, noting the potential for housing and job creation due to Crossrail's connectivity, while also addressing the challenges of car dependency and land ownership
years with extensive community input. The strategy outlines five missions focused on championing character, promoting well-being, ensuring a fair economy, enhancing green spaces, and facilitating sustainable development. She also mentioned the successful acquisition of £19 million in funding to support various projects aligned with these missions.
Architect in Residence: Insights from Bob Allies
Bob Allies shares insights about his position as Architect in Residence, a role initiated by the Liberal Democrats to enhance architectural quality in Bath. He notes the city's responsibility as a steward of its World Heritage Site status and expresses concerns about the contemporary architecture being developed. Allies emphasizes the need for a longer commitment to effectively address these challenges.
Challenges and Opportunities in Bath's Urban Development
Bob Allies outlined the difficulties Bath faces in meeting its housing obligations, particularly the
fragmentation that hinder progress.
Holly Lewis presented the Hackney Central town centre strategy, developed through extensive community engagement, which outlines five missions to tackle local challenges. She mentioned securing £19 million in funding to implement projects aligned with these missions, ensuring local voices are integral to the development process. Bob Allies discussed his role as Architect in Residence in Bath and North East Somerset, where he aims to improve architectural standards while navigating the complexities of maintaining the city's heritage as a World Heritage Site.
The conversation also touched on the broader challenges faced by local authorities, including resource depletion and the need for collaboration among various stakeholders. Sarah Allen and Bridget Smyth emphasised the importance of investment in local authorities and redefining the architect's role to foster design excellence. The need for community involvement in planning processes was highlighted, with calls for early engagement and transparency to manage expectations. The session concluded with discussions on the importance of including young people's perspectives in urban design and the challenges of influencing design elements beyond site boundaries, underscoring the critical role architects play in shaping urban environments.
Mission 1
Champion our Character Broaden cultural and heritage
Activities to make them more representative and celebratory of diverse local histories, activism and identities.
requirement for 28,000 new homes amidst strict building regulations and limited space. The speaker noted the city's reliance on tourism and the need to diversify its economy, while also addressing the tensions between student housing and local residents. Additionally, the speaker mentioned ongoing discussions about integrating sustainable practices within the constraints of Bath's heritage.
Mayor picks top names for London’s new ‘town architects’
The ‘town architects’ have been selected from Khan’s 42-strong design advocates panel of independent built-environment professionals.
They include We Made That co-founder and director Holly Lewis, Adam Khan Architects’ founder Adam Khan, Jas Bhalla Works principal Jas Bhalla, and AHMM cofounder Paul Monaghan.
The architects have each been handed a different neighbourhood, from Croydon town centre to Abbey Wood (see full list below), and are tasked with ensuring that new buildings and public spaces in their respective area ‘benefit all Londoners by promoting quality and inclusion in the built environment’.
The Greater London Authority (GLA) says the architects will directly support chief planning officers and design champions to ‘review project proposals and help develop a strategic vision for the local area’.
Key responsibilities include establishing design quality management protocols, developing best-practice procurement approaches, and honing design competition processes, as well as identifying ‘quick-wins’, unlocking long-term benefits across service areas, and supporting ‘inclusive placemaking’.
The architects will be expected to provide a ‘constructive and critical view across multiple projects’ within their identified area, offering ‘oversight and coherence across schemes’.
The town architects programme will run for a two-year pilot period thanks to £180,000 government funding, with the overall aim of improving public spaces across London.
The GLA insists the 10 town architects will build ‘much-needed’ capacity in local boroughs, promote knowledge-sharing and bolster skills in existing teams, and help authorities to ‘utilise the skills of planners and architects to help shape better places in their local areas’. AJ report extract
Engagement and Design Review in Bath
Bob Allies highlighted their enjoyment in meeting diverse individuals within the council and university, which has provided valuable insights into community sentiments. They mentioned their primary focus on working with councillors and planning officers, while expressing a preference for more involvement in design reviews. Speaker 9 noted that architects often seek design reviews before formal pre-applica-
tion meetings due to the latter's rigid nature.
Discussion on Urban Development Challenges in Bath
Bob Allies highlighted the issue of many successful retail spaces in Bath having unoccupied upper floors, advocating for their conversion into residential units. They pointed out the difficulties posed by various stakeholders, including real estate interests and conservation architects, which hinder progress. The speaker stressed the importance of collaboration to achieve productive use of these buildings and the potential environmental benefits of such conversions.
Government Support for Design Quality and the Role of City Architects
Sarah Allen highlighted the government's recognition of challenges within local authorities, particularly the lack of resources and expertise in planning. She stressed the need for investment in local authorities to enhance design quality and the importance of integrating various design professions. Bridget Smyth shared her experiences as the City Architect for Sydney, emphasizing the role of architects in local government to resolve complexities and foster collaboration.
Amhurst Road and Pembury Junction (LB Hackney Street Scene Team, Steer, Urban Movement)
Amhurst Road and Pembury Junction (LB Hackney Street Scene Team, Steer, Urban Movement)
Challenges faced by local authorities in urban planning and design
Facilitating Good Growth Sitting client side
Discussion on the Role and Impact of City Architects
Bob Allies discussed the challenges faced by city architects, noting that without adequate support, their impact is limited .Another stressed that community interest and financial backing are essential for the role to thrive. Another added that a collaborative approach with local officials is necessary to ensure effective outcomes in urban planning.
Collaboration
and Challenges in Urban
Development
Another speaker highlighted the necessity of interdepartmental collaboration to enhance urban development efforts. Bob Allies expressed concerns about the difficulty in proving the effectiveness of initiatives within their limited time frame, suggesting that reporting back to government could help advocate for successful models. Peter Murray raised questions about the relationship between Town Architects and Planning Committees, seeking a more direct communication route for critical applications.
new housing should: be dense, cheap to build, easy to maintain, make efficient use of its site, form continuous urban fabric, be fully connected to its surroundings, be specific and responsive to its setting, and be configured as a succession of defined spaces
The impact of local government structures on urban development. Discussion on Child-Friendly Cities and Young People's Needs
Another speaker highlighted the need for discussions around young people in urban planning, questioning what it means to create child-friendly cities. Speaker 13 responded by noting the Good Growth Programme's focus on children's independent mobility but pointed out the broader issue of affordability in London, which affects families and children.
Both speakers agreed on the importance of engaging with young people to understand their needs.
Discussion on Urban Design and Highways Collaboration
Interest was expressed in the connective tissue concept in urban design and the need for effective collaboration with highways teams. A speaker recounted a challenging experience with a poorly placed road sign and discussed the complexities of navigating different priorities within highway projects. He emphasized the importance of scrutiny in public realm initiatives and the need for architects to maintain a holistic view in their work. n
Images by Periscope & We Made That
Ilford
Architect in residence brief
1 Act as a champion for creative design and imaginative place making in Bath and North East Somerset, with a focus on the World Heritage City of Bath.
2 Influence design proposals at an early, concept stage, before ideas and approaches become set in people’s minds and become much harder to change.
3 Help architects working on projects within the city and its hinterland to respond more sensitively to the city’s architectural heritage, without resorting to pastiche.
4 Support the Council in their quest for design excellence by providing advice on the challenges of individual projects, whether at the scale of the building, the masterplan, or the wider city.
5 Explore new ways – meetings, workshops, lectures, exhibitions - of communicating directly with owners, developers, builders, architects and other relevant professionals, to help them understand the city’s requirements in terms of design.
– Bob Allies, Bath
Residential applications granted down 8% from the same quarter a year earlier and planning applications received down 5%
Latest planning performance by English districts and London boroughs: planning applications in England during April to June 2025
OVERVIEW
Between April to June 2025, district level planning authorities in England:
• received 80,400 applications for planning permission, down 5% from the same quarter a year earlier;
• decided 80,800 applications for planning permission, down 1% from the same quarter a year earlier;
• granted 70,800 decisions, up 1% from the same quarter a year earlier; this is equivalent to 88% of decisions, up 2 percentage points from the same quarter a year earlier;
• decided 91% of major applications within 13 weeks or the agreed time, unchanged from the same quarter a year earlier; and
• decided 23% of major applications within the statutory period of 13 weeks, up 3 percentage points from the same quarter a year earlier;
• granted 7,000 residential applications, down 8% from the same quarter a year earlier;
• granted 1,500 applications for commercial developments, down 7% from the same quarter a year earlier; and
• decided 44,000 householder development applications, up 4% from the same quarter a year earlier. This accounted for 54% of all decisions, up from 51% a year earlier.
In the year ending June 2025, district level planning authorities:
• granted 266,400 decisions, down 5% from the year ending June 2024; and
• granted 28,700 residential applications, down 9% from the year ending June 2024.
Planning applications received
During April to June 2025, authorities undertaking district level planning in England received 80,400 applications for planning permission, down 5% from the same quarter a year earlier. In the year ending June 2025, authorities received 329,700 planning applications, down 4% from the year ending June 2024 (Live Table P134, PS1 Dashboard).
Planning decisions
Authorities reported 80,800 decisions on planning applications in April to June 2025, down 1% from the same quarter a year earlier. In the year ending June 2025, authorities decided 306,800 planning applications, down 6% from the year ending June 2024 (Live Tables P120/P133/P134, PS1/PS2 Dashboard).
Applications granted
During April to June 2025, authorities granted 70,800 decisions, up 1% from the same quarter a year earlier. This represented 88% of all decisions, up 2 percentage points from the same quarter a year earlier. In the year ending June 2025, authorities granted 266,400 decisions, down 5% from the year ending June 2024. Authorities granted 87% of all decisions, up 1 percentage point from the year ending June 2024 (Live Tables P120/P133, PS2 Dashboard).
Applications on hand
Authorities reported that they had 116,500 applications on hand as at 1 April 2025, down 3% from the same quarter a year earlier. This is 44% above the number of decisions made during the quarter. The corresponding figure for the same quarter a year earlier was 47%. Taking account of numbers of applications received, decisions made and applications withdrawn during the quarter gives a total of 111,200 as at the end of June 2025, down 4% from the same quarter a year earlier (Live Table P133, PS1 dashboard).
Historical context
Figure 1 shows that, since about 2009-10, the numbers of applications received, decisions made and applications granted have each followed a sim-
ilar pattern. As well as the usual within-year pattern of peaks in the Summer (July to September quarter) and troughs in the Autumn and Winter (October to December and January to March quarters), there was a clear downward trend during the 2008 economic downturn, followed by a period of stability. There was a large dip in 2020 following the start of the pandemic and a subsequent recovery in early 2021, including a particular peak in applications received, but since the peak there has been a steep downward trend.
Regional breakdowns
Table 1 shows how numbers of applications received, decisions made and decisions granted varied by region. It also shows how the percentage of decisions granted varies widely by region, from 83% in London to 93% in North East (Live Table P133, PS1/PS2 Dashboard).
Table 2 like Table 1 shows how numbers of applications received, and planning decisions made, varied by region. It also shows the percentage change in number of applications received and decided compared to the same quarter a year earlier. The percentage change in the number of applications received varies widely by region, from -10% in West Midlands to 0% in London (PS1 Dashboard).
Decisions granted
Figure 2 summarises the distribution of the percentage of decisions granted across authorities for major, minor and other developments using box and whisker plots. The ends of the box are the upper and lower quartiles, meaning that 50% of local authorities fall within this range, with the horizontal line in the centre of the box representing the median. The whiskers are the two lines above and below the box that are 1.5 times the size of the box (the interquartile range) with the dots representing outliers. Figure 2 shows that the range between the whiskers for the percentage of applications granted is widest between authorities for major developments (50% to 100%), followed by minor developments (56% to 100%) and other developments (74% to 100%) (PS2 Dashboard).
Planning decisions by development type, speed of decision and local planning authority.
All tables and figures can be found here:
https://tinyurl.com/3bs8ts59
Source: DLUHC/ONS
Speed of decisions
In April to June 2025, 91% of major applications were decided within 13 weeks or within the agreed time, unchanged from the same quarter a year earlier. 23% of major applications were decided within the statutory time period of 13 weeks, up 3 percentage points from the same quarter a year earlier.
In the same quarter, 88% of minor applications were decided within 8 weeks or within the agreed time, up 1 percentage point from the same quarter a year earlier. 42% of minor applications were decided within the statutory time period of 8 weeks, up 1 percentage point from the same quarter a year earlier.
Also in the same quarter, 92% of other applications were decided within 8 weeks or within the agreed time, up 1 percentage point from the same quarter a year earlier. 62% of other applications were decided within the statutory time period of 8 weeks, up 1 percentage point from the same quarter a year earlier.
Use of performance agreements
‘Performance agreement’ (PA) is an umbrella term used here to refer to Planning Performance Agreements, Extensions of Time and Environmental Impact Assessments (EIAs). The EIA process is undertaken to assess whether a project will have a substantial impact on the environment, with applications having an accompanying Environmental Statement[footnote 3] (see Technical Notes for further definitions of PAs). Between April to June 2025, 39% of all planning application decisions involved a performance agreement. Major developments were more likely to involve a performance agreement compared to minor and other developments with 74% of major decisions involving a planning agreement, compared with 51% of minor decisions and 32% of other decisions (Reference Table 2, PS2 Dashboard).
Figure 4 shows, from April 2010, the numbers of decisions on major, minor and other developments made involving a performance agreement, compared with numbers without a performance agreement. Notwithstanding definition changes, there has been a marked increase in the use of agree-
ments since early 2013 (see Technical Notes for more information). This longer upward trend has been driven by both the additional scope for recording them and their additional use (Live Table P120, PS2 Dashboard).
Performance of individual district level
local
planning authorities
The existing approach to measuring the performance of authorities was introduced by the Growth and Infrastructure Act 2013 and is based on assessing local planning authorities’ performance on the speed and quality of their decisions on applications for major and non-major development. Where an authority is formally designated by the Secretary of State as underperforming, applicants have had the option of submitting their applications for major and non-major development (and connected applications) directly to the Planning Inspectorate (who act on behalf of the Secretary of State) for determination.
Speed of decisions
The designation thresholds, below which a local planning authority is eligible for designation are:
For applications for major development: less than 60% of an authority’s decisions made within the statutory determination period or such extended period as has been agreed in writing with the applicant;
For applications for non-major development: less than 70% of an authority’s decisions made within the statutory determination period or such extended period as has been agreed in writing with the applicant.
See Live Tables P151/P153
Quality of decisions
The threshold for designation on applications for both major and non-major development, above which a local planning authority is at risk of designation, is 10% of an authority’s total number of decisions on applications made during the assessment period being overturned at appeal.
Once the figures for the relevant period have been published in Live Table P152 or P154, which identify local planning authorities are at risk of designation by exceeding the threshold, they are invited to contact Departmental officials with any data corrections, and information on any exceptional circumstances applying to the authority that might be used as reasons why the Secretary of State should not designate them.
The Secretary of State then takes this evidence into account when making decisions on which authorities should be designated.
See Live Tables P152/P154
Two local planning authorities are currently designated by the Secretary of State in relation to their planning performance. These are Lewes
District Council (on 8th May 2024) in relation to quality of decision-making for major applications; and Bristol City Council (on 6th March 2024) in relation to speed of decision-making for non-major applications.
Residential decisions
In April to June 2025, 9,300 decisions were made on applications for residential developments of which 7,000 (76%) were granted. The number of residential decisions made was down 13% from the same quarter a year earlier, with the number granted down 8% from the same quarter a year earlier. 900 major residential decisions were granted, down 6% from the same quarter a year earlier and 6,100 minor residential decisions were granted, down 8% from the same quarter a year earlier (Live Table P120A, PS2 Dashboard).
In the year ending June 2025, 38,200 decisions were made on applications for residential developments, of which 28,700 (75%) were granted. The number of residential decisions made was down 14% from the previous year, with the number granted down 9% from the year ending June 2024. 3,700 major residential decisions were granted, down 2% from the previous year and 25,000 minor residential decisions were granted, down 10% from the previous year.
Residential units
The figures collected by the Department are the numbers of decisions on planning applications submitted to local planning authorities, rather than the number of units included in each application, such as the number of homes in the case of housing developments. The Department supplements this information by obtaining statistics on housing permissions from a contractor, Glenigan.
The latest provisional figures show that permission for 221,000 homes was given in the year to June 2025, down 7% from the 237,000 homes granted permission in the year to June 2024. On an ongoing basis, figures are revised to ensure that any duplicates are removed as far as possible, and also to include any projects that local planning authorities may not have processed: they are therefore subject to change, and the latest quarter’s provisional figures tend to be revised upwards. For the previous eight quarters, the year to figures have been revised 0.6% on average. These figures are provided here to give contextual information to users and have not been designated as National Statistics.
Commercial decisions
In April to June 2025, 1,600 decisions were made on applications for commercial developments[footnote 6], of which 1,500 (90%) were granted. The number of commercial decisions
made was down 10% from the same quarter a year earlier, with the number granted down 7% from the same quarter a year earlier. 300 major commercial decisions were granted, down 10% from the same quarter a year earlier and 1,200 minor commercial decisions were granted, down 6% from the same quarter a year earlier (Live Table P120B, PS2 Dashboard).
In the year ending June 2025, 6,700 decisions were made on applications for commercial developments, of which 6,000 (89%) were granted. The number of commercial decisions made was down 11% from the previous year, with the number granted down 10% from the year ending June 2024. 1,300 major commercial decisions were granted, down 12% from the previous year and 4,700 minor commercial decisions were granted, down 9% from the previous year.
Trends in the percentage of residential and commercial decisions granted SEE Fig 7 BELOW
Householder developments
Householder developments are those developments to a residence which require planning permission such as extensions, loft conversions and conservatories (see Definitions section of the Technical Notes).
The number of decisions made on householder developments was 44,000 in the quarter ending June 2025, accounting for 54% of all decisions, down from 51% of all decisions made in the quarter ending June 2024. Authorities granted 90% of these applications and decided 93% within eight weeks or the agreed time (Reference Table 2, PS2 Dashboard).
In the year ending June 2025, 159,600 deci-
sions were made on applications for householder developments, accounting for 52% of all decisions, down from 51% of all decisions made in the year ending June 2024. Authorities granted 89% of these applications and decided 93% within eight weeks or the agreed time.
Major public service infrastructure development decisions
Since August 2021, major public service infrastructure developments broadly defined as major developments for schools, hospitals and criminal justice accommodation have been subject to an accelerated decision-making timetable.
Separate figures on major public service infrastructure development decisions have been collected on the quarterly PS2 return with effect from October 2021. During April to June 2025 there were 11 decisions, of which all 11 were granted and 9 were decided in time (Live Table MJPSI, PS2 Dashboard). Please note that figures are not collected on the CPS1/2 return and so don’t include education developments by county councils.
Permission in Principle/Technical Details consent decisions
Since April 2017, local planning authorities have had the ability to grant permission in principle (PiP) to sites which have been entered on their brownfield land registers. Where sites have a grant of permission in principle, applicants have been able to submit an application for Technical Details Consent (TDC) for development on these sites. In addition, since June 2018, it has also been possible to make an application for PiP for minor housingled development as a separate application, independently of the brownfield register. Where a site has been granted PiP following an application, it is possible to apply for a TDC.
Figures on PiP/TDC decisions have been collected on the quarterly PS2 return from January 2020. During April to June 2025, local planning authorities reported 305 PiP (minor housing-led developments) decisions, 10 TDC (minor housing-led developments) decisions and 5 TDC (major developments) decisions. The totals for the previous quarters have been similar although there has been a slow upward trend since 2020, when there were about 60 PiP decisions per quarter (Live Table PiP/TDC1, PS2 dashboard).
Permitted development rights
Planning permission for some types of development has been granted nationally through legislation, and the resulting rights are known as ‘permitted development rights’ (PDRs). For certain permitted development rights, if the legislation is complied with, developments can go ahead without the requirement to notify the local planning
authority. Hence no way of capturing this data exists and these are not accounted for in this report. In other cases, the permitted development right legislation requires an application to the local planning authority to determine whether or not prior approval is required and to determine as appropriate (see the Definitions section of the Technical Notes).
Between April to June 2025, 6,800 applications were reported, of which prior approval was not required for 3,600, permission was granted for 1,700, and 1,500 were refused.
This resulted in an overall acceptance rate[footnote 7] of 78%. Large householder extension accounted for 57% of all PDR applications reported, with 25% relating to All others, 9% relating to Agricultural to residential, and 6% relating to Commercial Business and service to residential (Live Tables PDR1/PDR2).
In the quarter to June 2025, 1,100 permitted development right applications were made for changes to residential use, of which 700 (64%) were given the go-ahead without having to go through the full planning process.
Overall during the 45 quarters ending June 2025, district planning authorities reported 363,200 applications for prior approvals for permitted developments. For 201,100 of them prior approval was not required, 86,300 were granted and 75,200 were refused (Live Table PDR2).
Other information
Delegated decisions: Of the 80,800 decisions made during the quarter, 78,200 (97%) were delegated to officers. This percentage has been stable since 2014, having previously increased from around 75% in 2000 (Live Table P133).
Enforcement activity: During the quarter, authorities issued 872 enforcement notices and served 1202 planning contravention notices, 178 breach of condition notices, 26 stop notices and 84 temporary stop notices, while 14 enforcement injunctions were granted by the High/County Court, 0 injunctive applications were refused, and 28 enforcement warning notices were issued.
In recent years, this level of activity has remained broadly proportionate to the number of planning decisions made (Live Table P127). n
Party conference season, London’s ageing demographic, London’s Office market & Green Belt research
Account of the London Planning and Development Forum meeting on Tuesday 16 September 2025 at the London School of Economics
Discussion topics
I Party conference season
Is the government risking electoral defeat if it ignores local views on its growth plans?
“Unless ministers find a way to balance delivery with democratic legitimacy, they may find their planning reforms have not only reshaped the built environment - but the electoral map as well” – Victoria Yeandle.
Speaker: Victoria Yeandle, Associate Planner, Lanpro
II London’s ageing demographic
Speaker: Christine Whitehead, LSE Emeritus Professor of Housing Economics
Speaker: Les Mayhew, Professor of Statistics, Bayes Business School & Chairman of the Mayhew Review
III London’s Office market – a longer view
“We're still oriented towards yet more office growth in central London, preferably in buildings as tall as possible according to the City of London Plan. Does that still make sense post-Covid? Will we return to a London office market at pre-Covid levels of activity or is the need now for more dispersed, remote work options across London (and beyond)?” – Brian Whiteley
Speaker: GLA Gudrun Andrews, planning policy lead at the City Corporation
Speaker: Shabab Qadar, head of London offices research Knight Frank
IV Green Belt research and SME developers
"Nearly 5 years ago I worked with Lichfields to publish some hard hitting research on the challenges facing smaller sites and smaller developers (under one hundred homes). The main challenges: - the viability ask, planning treats smaller sites the same as majors - they take too long to be determined - they become the play thing of nimbys. Five years on the situation has deteriorated. As a industry we have failed to make the case and successive Governments have failed to act.” – Nick Cuff
Speaker: Alex Scarriatta, Group Land Director, Richborough
Report by Riette Oousthuizen of HTA Design also at www.planninginlondon.com >LPDF
Party Conference Season
Is the government risking electoral defeat if it ignores local views in its growth plan?
1. Party Conference Season:
Speaker: Victoria Yeandle, Lanpro
Background: Consultancy involving Planning, Design, and Environment
The presentation addressed electoral shifts and its relationship to devolution. The government has established a national target of 1.5 million homes, with particular focus on developing 'grey belt' land.
Government Initiatives
• New Towns Taskforce
• National Scheme of Delegation
• English Devolution Bill
Strategic Authority Powers
The government proposes creating additional powers for Strategic Authorities, in the English Devolution and Community Empowerment Bill, including:
• Newly elected mayors gaining ability to prepare Spatial Development Strategies (SDS), similar to the London Mayor
• Mayoral powers to raise Community Infrastructure Levy (CIL) and determine planning applications
Key Question: Political Viability of Devolution
Case Study: Ramsey, Huntingdonshire
The discussion centered on whether a top-down approach from strategic authorities could succeed, in particular due to a unique mix of party affiliation across elected officials and how that affects strategic collaboration.
• National Infrastructure Projects increasing to 30 projects
Case Study: Meridian Solar Farm, Lincolnshire
• 750MW electricity generation project
• To be determined under Planning Infrastructure Act
• Located in Reform Party stronghold constituency
• Local action groups opposing
Conclusions
Key questions raised include:
- Government narrative positions devolution as gateway to empower local communities but is it working?
Discussion
The relationship between Devolution and Local Government
The Government is pushing for unitary authorities at the level of counties or even groups of counties. The problem with this approach in, for example, Surrey and Essex is that it would require different, opposing lobbying groups to work together. It will result in chaos over the next three years.
The Government is also progressing with proposals that groups of authorities will produce Strategic Plans similar to the London Plan. The Government will determine these groupings (and they may not align with the unitary authorities created). The timeline for these Strategic Plans is not clear.
The methodology for determining housing need
ATTENDANCE Meeting held on Tuesday 16 September 2025 at the London School of Economics
LP&DF TEAM, HOSTS AND SPEAKERS: Riette Oosterhuizen, HTA Design
Brian Waters LP&DF Chairman
Prof Ian Gordon, LSE (host)
Gudrun Andrews City of London Corporation, Victoria Yeandle Lanpro, Alex Scierretta Richborough, Prof Les Mayhew Baynes Business School, Prof Christine Whitehead LSE, Shabab Qadar Knight Frank,
MEMBERS & GUESTS: Duncan Bowie, UCL, Stephen Heath Bloomsbury Society, Michael Coupe Coupe Planning, D Fitzpatrick UCL, Prof M Edwards UCL, Paul
Finch Planning in London & emap, Mark Willingale Willingale Assocs, Darryl Chen Hawkins\Brown, Roger Hepher hgh consulting, Ian Butcher Andrew Martin, Jason Katz UCL, Alex Balkan Sharedvoice, Robert Dolata Highgate Society, Prof Paul Cheshire LSE, Mike Burnell Hopkins Architects, Lee Mallett Planning in London, Deon Lombard architect, Andrew Catto architect, Chris Eaglen architect, Eric Sorensen, John Lett
APOLOGIES: Brian Whiteley RTPI, Pascal Levine ds2, Thomasin Renshaw Pocket Living, A Wood Age UK London
figures (The Standard Housing Method) is still being reviewed by Government following consultation feedback. Strong representations have been made to review this method by, for example, the Highbury Group. The main criticism is that the housing need figures it produce do not have a direct relationship with local housing need.
The interaction of all of the above components will result in a very messy process. Questions debated by the forum included: would Reform led local authorities want to co-operate? Should there be a Strategic Plan nationally? Do Regional Plans need to align with a National Plan? Will the change in Secretary of State for Housing make a difference to housing strategy?
The Forum discussion then turned to New Towns.
The list of New Towns was still amiss at the time of the meeting with uncertainty around the announcement, but the list has since been announced (on 29 September 2025 prior to the Labour Party conference).
A view was expressed that housing delivery through Government determined New Town locations is a prime example of national politics interfering with localities.
As far as New Town locations are concerned, it is expected the focus will be more on urban extensions rather than actual ‘new towns’, which has now been confirmed.
These New Towns is not expected to be delivered in full in the current Labour term. There will be no actual New Towns prior to 2035.
The New Towns Act is an immediate tool that could be used to enable delivery. It only need altering by a few lines and as such there is an existing legal framework at the ready. Historic New Towns were successful as they were given a lot of money and powers. They effectively bypassed local democracy. They were clear standalone ‘entities’ that could be engaged with.
The town extensions that now seem to be on the agenda may not have any stand-alone autonomous powers. Will they be governed by Local Authorities? Or will Urban Development Corporations be used? Current large scale residential extensions can cause a lot of discontent amongst local residents when social or transport infrastructure is missing. Would planners be able to negotiate the tension between local and wider regional interests? Would we go down a rabbit hole of reinforcing local interests who would never want to support housing in their localities? It is not clear what the mechanisms would be to reconcile these tensions.
Local Government devolution and planning reform is ultimately going in opposite directions although the objective for Strategic Planning is sound. An example is Cambridge. Anglia Water has finally been given permission to relocate its wastewater treatment works to the Cambridgeshire green
London’s ageing demographic
belt. This could free up a brownfield site for 8,500 homes. However, the Government has just pulled the funding for its relocation, which defies logic. n Speaker: Christine Whitehead, LSE Emeritus Professor of Housing Economics
Christine opened her discussion with the statement that data needs to form the basis for what is said and acted upon. Inner London houses significantly younger households with a peak age group of 25-29. In Outer London the peak age average is 29-35. In comparison, the rest of the country the peak age group is 55-59.
In London there are relatively few older people aged 55 and over. They form 9.5% of the inner London population and 13.8% in the outer parts of London. The component of this group in the rest of the country makes up nearly 20%. So, London has a relatively young population.
London Population Trends
Pre-war London experienced growth
Post-war decline due to government policy and new towns development
Current population: 8.9 million
Projected: 10 million – but notes that the data source for projection is uncertain
Note: the COVID census has also been roundly critiqued, with poor response rates
Immigration and Migration Patterns
Post-Brexit immigration patterns favour other parts of country over London
London is only UK city where population is ageing Older people increasingly staying in place
Low birth rate in London due to expensive housing and childcare costs
People moving out of London as result 57% of temporary accommodation and homelessness concentrated in London
Housing Delivery Reality
Government targets versus actual delivery significant gap
Housing starts only 5% of government target
No meaningful relationship between targets and delivery reality
Developers not attempting to meet London targets due to cost.
Speaker: Les Mayhew, Professor of Statistics, Bayes Business School and author of the Mayhew Review
Les presented findings of research undertaken on ‘Age Friendly Neighbourhoods and Homes ’. The Mayhew Review identified that 50,000 fewer homes would be required per annum if older people downsized. However, there are insufficient homes of appropriate size and quality for downsizing. Additional barriers include the cost and complexity of moving and location preferences.
‘Age friendly neighbourhoods’ have the following characteristics:
• Proximity of properties to services, away from harm, e.g. congestion.
• Walkability index, reflecting accessibility to services such as health providers, shops, employment, and green space.
• Home-based services efficacy: social care, voluntary services.
Older households are more isolated than younger households. They have specific requirements such as the need to be warm and live in stair-free accommodation. Older households are put off by the drudgery of moving. They might be very attached to a familiar location. There is a shortage of decent homes to live in. Estate agents are not focussed on the needs of older people. The information listed is very biased.
Les has worked on a ‘Home Accessibility Score’. It is an AI tool where the URL of the property listing could be copied into generating a synopsis of everything good/bad about a property, including its physical size, layout, cost per square meter, etc.
Discussion
Whilst one’s stage of life drives the demand for space, it is clear too few homes for older people are being built. Some skepticism was voiced about downsizing as a solution, whilst surveys showed that cost and the lack of availability of suitable homes among existing stock were key barriers. The reality may be both.
Social networks were also thought to play a very important role in relation to age friendly neighbour-
hoods, according to the Older People’s Housing Task Force (OPHTF) which reported at the end of 2024. Les confirmed there is a whole area of study focusing on ‘living in place’. There are many health benefits from living in a well-connected community. It was felt there is no simple story about the growth of London’s population. Immigration plays a role in the profile of the city’s population. International population movement is occurring, of which the effects may be more prominent in
London. In comparison, a lot of inertia might occur outside of London.
The question about demographics prompted a discussion on why the type of housing built and its suitability in relation to need is not discussed in more earnest by City Hall. Planning policy lacks sophistication regarding housing suitable for older people or others for that matter. What is built is driven by the availability of capital rather than an understanding of need. n
Speaker: Gudrun Andrews, Head of Planning Policy, Corporation of the City of London
Gudrun presented an overview of the City of London's office space planning and trends. She discussed the city's current office market, including key statistics.
She highlighted the importance of monitoring vacancy rates and understanding changing office usage patterns post-COVID, noting that occupiers now want more flexible space with on-site amenities.
She explained the City of London’s role in supporting office growth through planning policies and a new business investment unit.
City of London Context
• Home to 678,000 workers
• Vacancy rate: 1.5%
• One of Europe's strongest pipelines for new, sustainable office space
• Fintech and creatives increasingly want to locate in the city
• The diversification of the City – Horizon 22 is now one of the 10% global attractions.
• A 58% increase in Lime bike usages in London during the tube strikes show that people have returned back to the office
• There is a wave of new occupiers resulting in rising rents
• 99.6% of office space in the city is within 5 min walk from a tube
City Plan 2040
Status: Latter stage of examination, consultation responses reviewed Identified Need:
3.5 million square meters of additional floorspace required in central London (between 2016 and
Strong demand for Grade A space
Ease of access to tube, culture, hospitality, retail Finance sector in particular have preference for on site gyms, swimming pools and even nail bars 78% of movers to Central London office market did so for expansion of floorspace reasons. 60% of movers moved less than 0.5 mile. Location is key. Analysis of Development Capacity
• 'Sieving' exercise and modelling to identify office space locations
• 85% capacity in City cluster
• 5% in Fleet Valley
• Confirmed ability to deliver required floorspace
• 98% of businesses in City are smaller and medium enterprises. Need to understand more about sub-market expectations
Office Trends Evolution
Office trends are influenced by: diversification of offer, lower densities, minimization of emissions, environmental performance, upgrading and repurposing of stock.
The City has a strong pipeline. It needs to follow demand. It is important to understand the timetable for delivery.
Potted Historical Timeline:
• Taylorism (1901)
• Frank Lloyd Wright (1939)
• Bürolandschaft (1958)
• Herman Miller (1968)
• Cubicles (1980s)
• Leadenhall (2025)
Current Trends
• “Flight to quality”
• Diversification of City uses with residential such as student accommodation, co-living and serviced apartments. Smaller offices of around 3,000 sqm are more likely to be changed into other uses.
• The City is working on a New Offices SPD to protect existing office floorspace. It provides guidance on strategic locations for offices, and look at different marketing requirements for different type of offices.
• The City launched a City Business Investment Unit in June 2025 providing specialist support for investors, developers and occupiers.
London Office Market - Q2 2025
Speaker: Shabab Qadar, head of London offices research Knight Frank
Market Fundamentals
• London's office market is structurally undersupplied
• Office demand historically cyclical
• There has been a 69% take up of new/refurbished space
• Demand is strong and supply is weak.
Quality-Led Development
• Drive for 'quality-led office space' rich in amenities, communal space and an experience improving general wellbeing
• Better work life balance requires better office space, providing a customer experience to staff
• Within Grade A prime space – only a small percentage available
• The last 5 years of leasing activity in London indicates the development pipeline not keeping pace with lettings activity
• Occupiers are in a drive to find the best space to occupy; even lightly refurbished space goes
• Demand is relatively strong despite the weak economic outlook. The media commentary tends to focus on a 27% vacancy rate but in the City
core the vacancy rate is only 0.5%.
• There is barely 6 months’ supply at present of prime space in the City core sub-market.
• This squeeze will not be alleviated soon. Future completions fall below demand level. It is likely that there will be a prolonged period of under sup-
ply of around 5 years and 11 million square feet.
Core Submarkets
• Prime rents have moved to the West End and Marylebone. Growth of around 5% expected in the West End core and 5.8% in the City Core.
• Strong risk of obsolescence due to regulatory regime. EPC rates do not comply in many instances.
• Levels of refurb is up at record levels in the City.
Discussion
In comparison to the City, Canary Wharf is different all together. A lot of buildings reached the end of their lifecycle. The cost of refurbishment of the towers is very high. There is resistance toward curating better quality office space in this location. Instead, the focus is on office to residential conversions. There is a shift in occupier base with subsequent place based changes to allow for this change.
The City is now popular amongst legal firms, tech companies and hedge funds who occupy large amounts of space and pay large sums of rent. There is a question to what extend the current focus allow for SME’s to thrive in this area.
There is evidence that people are more productive in office space, supporting the need for expansion.
Grade A office space tends to be occupied at
The London Series 2025
lower densities. Even though there is a large amount of floorspace provided, it will not necessarily result in more foot fall or workers.
The growth ambition for office space in the City poses a question regarding the continued need for decentralized office space. Are Royal Docks and Old Oaks office destinations therefore a non-starter?
It was questioned whether ‘Destination City’, a
Green Belt research
major City of London policy driver within its current Plan, conflicted with its ambitions to grow as a Grade A office destination. The City of London’s view was that ‘Destination City’ was very much a product of Covid. The vision has changed now, although green and healthy streets are still a major objective. n
Speaker: Alex Sciarretta, Group Land Director, Richborough
This presentation focused on the Metropolitan Greenbelt and housing policy in London.
Alex presented on the current state of the Greenbelt, noting its historical purpose of preventing urban sprawl and discussing how it has been gradually released over the years. He highlighted the challenges in meeting housing targets, including the drop in housing starts from 40,000 to 7,000 in 2024, and the impact of affordable housing requirements on viability.
The discussion included debate about whether the 50% affordable housing requirement on Greenbelt sites is feasible, with some arguing it places too much burden on developers, while others defended its necessity given high housing need. The group also discussed potential reforms to Greenbelt policy and housing delivery, with suggestions for greater government involvement in housing procurement to reduce reliance on market-driven solutions.
Discussion
Comment 1: Market Viability
• Questioning whether there is any Developer interest in sites with a 50% affordable housing requirement
• Affordable/social rent review and £39b pledge for registered providers
• Private developer participation concerns
Comment 2: Development Viability Challenges Housing Consultancy Perspective:
• @*.,"3"K%.4&(E3*&(64&2 ! ,*2,4<. to distinguish between MOL and Green Belt to ‘protect’ MOL <,"-(5,**&(J*K.(,*C%*8$A ! Very specific circumstances’ 8:*,*(=*,.4%&(@E6(L($#=:(4$('"K<( ="#,$*$(L(="#K2(;*(="&$%2*,*2(<",(,*K*4$*(."(2*K%C*,(:"#$%&'0(C%4(4( K4&2$=43*LK*2(433,"4=:A
These are short term issues. Planning needs a wider strategic view.
• GLA lacks a coherent Green Belt policy – what will the picture be in 30 years?
• Viability questions are based on land values that may change with policy shifts and as such it is ‘fictitious’, but altogether real in the immediate term
Comment 4: Reality Check on Delivery
• London Plan is totally divorced from reality: allocates 88,000 homes annually
• Historically delivery has been approximately 30,000 homes
• Plan described as based on "fiction" with institutional blindness to gaps between policy and delivery, amounting to a kind of "political cowardice" in addressing delivery shortfalls. No one expects to meet targets.
• Grey Belt as improvisation "planning by appeal" while broader strategic guidance developed. n
/ ,# . 23 )**'+,- ./ , % 4
+ ( , " $-. " /, ( 0 ( )1, ( &/
• R4KK(<",(?%.*(L(SI1(sites (including GB) submitted in last year’s Call for Sites T67GMN6MGO(–(5J($%.*$($*34,4.*2("#.(4$(.:*>(8%KK(;*(,*C%*8*2(%&(5J( ,*C%*8A
“Does the use accompany the main residential use of the dwelling, or is it supplementary to the use”?
Those readers working at the coal face of planning will be aware that, when dealing with permitted development rights allowing the construction of an outbuilding within the curtilage of a dwelling, it is necessary to determine how that outbuilding will be used. Does the use accompany the main residential use of the dwelling - as a home office or gym (allowed), or is it supplementary to the use - as another living area or bedroom (not allowed)?
This was brought home to me in a Richmond appeal that I dealt with many years ago. The Inspector’s decision letter considered “that the hobby or home working use would be subordinate to the primary use of the dwellinghouse and therefore incidental to the enjoyment of it”. Result, appeal allowed. [As an aside, I also learnt as part of this same Inspector’s decision that an appeal determination can be split - the second part of the appeal, concerning a proposed first floor terrace, was refused.]
To put it another way, a building used for ancillary purposes (ie not allowed) would generally contain such accommodation as bedroom(s), kitchen, bathroom, living room(s) - uses that are normally found within a standard dwelling, known as ‘primary living accommodation’. A building used as incidental residential accommodation will normally contain uses that do not comprise primary living space, such as a garage, swimming pool, bowling alley, gym, art studio, home office, shed for gardening tools, or anything else that can be classed as a hobby. Also an incidental use is parasitic on the main dwelling - it must not exist without it, so a swimming pool has to be used by the occupants of the house or their friends/family and cannot take in strangers who are paying to learn how to swim. However, as often in planning, when it comes to full planning approval it’s not always that simple. While an ancillary residential annex can provide all the primary living areas that would allow
incidental naturally attached; accompanying; concomitant; occasional… – The Chambers Dictionary
it to be self-contained, this might create a new planning unit (ie a new dwelling). Whether it does will depend on the extent of facilities shared with the main house, the access to the property (particularly to the rear), etc. When a London borough recently issued an enforcement notice claiming that the relative who lived in the annexe had created a separate planning unit, the appeal
inspector ruled that the extension was ancillary to, and a supplementary part of, the dwelling and granted it planning permission.
Similarly, an incidental use may be of such a scale or intensity that it should no longer be classified as incidental but becomes materially different from the primary residential use. Examples of this are Mr Sage, who was using his outbuilding as
Out of the crooked timber of humanity no straight thing can ever be made. –Immanuel Kant 1784
a gym - but also as a personal trainer to visiting clients, which caused visual disturbance to the neighbours and changed the character of the dwelling (Sage v Secretary of State for Housing, Local Government and Communities [2021]): and the lady who had built kennels for her hobbybreeding dogs - which had become a material change of use by its scale (at least 20 St Bernards): or the construction of an outbuilding so large that it competed in scale with the house that it was supposed to be subordinate to - for example the pigeon-fancier whose pigeon loft outbuilding for 250 competitive birds dominated the modest house and garden where it was located, while its use was no longer incidental. On the other hand, the conversion of an outbuilding from a garage to a small commercial bakery in a residential area was granted a lawful development certificate because no material change of use was found to have taken place as the business was small scale and its activities were no different from those undertaken in a typical domestic kitchen.
Then again, we might get into one of the many grey areas of planning by deciding to implement a change of use from an incidental use to an ancillary one (home office to living room or gym to bedsitting room), which could be considered (in the planning jargon) as not material and therefore not needing planning approval. Maybe this is a subject for consideration at another time…
So the question in the heading above is, do my columns accompany the main themes of Planning in London (allowed), or are they supplementary to them - concentrating on the planning system as it operates in the country generally (not allowed)? I have here cited several appeals relating to London boroughs, so I submit that the column is indeed permitted. If you are reading it, then the Editor has accepted my appeal. n
Sorry Andy, it’s gone to arbitration... – Ed.
Andy Rogers is a planning consultant and former director in architects
The Manser Practice
Image:
Félicie Krikler says the right home isn’t always the biggest one, it’s the one that fits
Space standards in housing
There is no skirting around the topic I want to discuss: we need to talk about space standards in housing. And more specifically, to confront a controversial yet increasingly relevant question: should space standards apply to all new housing in the future?
This might seem contradictory to my usual advocacy for ‘quality not just quantity’, but as we move forward with the ‘Towards a New London Plan’ consultation, I feel that now is the time to interrogate how as architects, we define quality and whether fixed space standards always support it.
Why do we have space standards?
The Nationally Described Space Standard (NDSS) exist for a good reason, they provide protection over minimum habitable space in new homes. In London, the NDSS are already adopted under the current London Plan and supplemented by two additional requirements:
1 Ceiling heights 20cm higher than the national standard;
2 A minimum area of private outdoor space for each home.
These standards rightly aim to protect residents from substandard living conditions and avoiding the ‘race to the bottom’, an issue we saw manifest itself in many early Permitted Development conversions.
But even with their good intentions, space standards deserve scrutiny, especially now. In a rapidly evolving housing landscape, we must ask: do current standards encourage the best design outcomes? Or have they become an inflexible metric that risks suppressing more viable alternatives?
Quality, affordability, and the space dilemma
Let’s talk specifics. The current London Plan encourages homes to be around 10% larger than NDSS. If we instead allowed homes to be 10% smaller, could we unlock a 10% increase in numbers of homes created?
That’s not an argument for density at all costs. But consider housing models like Pocket Living, their homes are typically 1 bed 1 person at 38m², offering a cheaper alternative to the standard 1 bed 2 person apartment. They are purposefully designed and very desirable among first-time buyers. These are homes that prioritise design intelligence over footprint.
Architects designing for Pocket and similar models are not compromising quality. They’re refining it.
And Pocket buyers aren’t necessarily looking for bigger homes; they want affordability, independence, and design that fits their needs. So, are these smaller homes substandard? Or are they a smart response to a shifting housing landscape?
A shift in tone from the GLA?
This argument for flexibility is starting to be echoed at City Hall. At LREF 2025, Deputy Mayor for Planning Jules Pipe didn’t make specific announcements on reforms, but he expressed his commitment that significant change is imminent. Both he and Deputy Mayor for Housing Tom Copley fully acknowledged the severity of London’s housing development crisis.
Copley emphasised the scale of the challenge: London needs to deliver 88,000 new homes a year, a figure not seen since the 1930s, in what is now the second most expensive construction market in the world. He also conceded that the London Plan’s context has shifted dramatically since its 2016 inception, underlining that greater flexibility in how its rules are applied is now essential. The forthcoming version of the Plan, he suggested, will be streamlined to ease viability constraints.
Jules Pipe went further, identifying three areas where, as he put it, “the froth needs to be cleared”: dual aspect requirements, cycle parking and cooling standards. He was careful not to dismiss the importance of these policies outright, but argued that boroughs adopting an inflexible approach were unnecessarily impeding housing delivery. His intervention is significant, because it recognises a tension we have long observed: the gap between the spirit of the London Plan, promoting quality and sustainability, and following policies to the letter, which, when rigidly enforced, can become counterpro- >>>
Félicie Krikle is head of residential at Barr Gazetas
RIGHT and previous page:
Tower House, Lewisham
Architect Barr Gazetas
Tower House is a locally listed 1930s Art Deco department store, a sadly unloved landmark that had begun to fall into disrepair. Our complex creative reuse project has successfully breathed new life and purpose into both the building and town centre. We carefully restored, extended and converted the building into high quality residential apartments, commercial and office space, all without diminishing the original Art Deco character. Tower House remained in occupation throughout construction and, coupled with the constraints of working with a neglected listed building, this was one of our most complex creative re-use projects to date.
Completed: 2019
Client: MHA Properties
Photographer: Philip Vile
ductive.
A major announcement on tackling viability is expected shortly, with Jules Pipe reiterating that the Mayor will call in applications where boroughs are obstructive. For architects, planners and developers, this signals a potential recalibration of priorities: design quality and liveability remain vital, but an overzealous approach to policy detail must not stand in the way of urgently needed homes.
Smaller homes: smart or risky?
Some will argue that smaller homes can be detrimental to health and wellbeing, but this is not a one-size-fits-all situation. To understand the broader implications, we should ask design for wellbeing specialists like Ben Channon – author of Happy by Design (RIBA Publishing 2018) and now Head of Inclusive Environments at Buro Happold – who have explored how mental health and design intersect.
Ben tells us that “while larger homes can certainly allow us to provide features and facilities that can enhance liveability and ultimately mental wellbeing, it is certainly not a simple equation of ‘bigger homes = happier people’. There are a plethora of other factors which impact how we feel both in our home and about our home, be that our level of physical comfort (including acoustic and thermal comfort), our sense of safety, our perceived level of control, and even things like the material selection and views offered from our home. And without smaller homes – in my case through Pocket Living – I would never have been able to get on the property ladder. There is certainly a case therefore that we need a range of ‘product types’ to suit the needs of people at different stages of their lives, although of course it is also fundamental that we ensure homes are still liveable, accessible and adaptable, regardless of size.”
Perhaps the answer lies not in the size of the home, but in how it is designed. Prioritising daylight, views, ventilation, floor to ceiling height, and intelligent storage may deliver quality living in compact spaces. A tight plan can still be a healthy, generous home if the right principles are applied.
Price per square metre: a metric we should use?
As architects, we’re often left out of economic decision-making, but we shouldn’t be. If we're asked to design within rigid standards, we should also be able to question whether those standards reflect value.
In housing markets like Paris, price per square metre is a public, transparent figure. It's treated as a critical metric; much as I check cost per kilo at the supermarket. Should we not adopt the same transparency for housing, arguably the most expensive purchase we will ever make?
Space costs money. If we’re going to argue for more space, let’s be honest about what it costs and whether that value is always proportionate to what it provides.
Who gets to choose smaller?
It is worth asking: should smaller homes be limited to the private sector, where buyers choose them, and not for those who have less choice about their housing situation? Nobody relying on social or affordable housing should be forced into homes that feel inadequate. But for those who want small,
Architect Barr Gazetas restored, extended and converted the building into high quality apartments, commercial and office space. The mixed-use scheme comprises 56 apartments over two existing floors and within the new two storey roof extension, plus first floor office space, ground and lower floor commercial units. Interiors are shown on the previous page.
compact, well-designed homes, we shouldn’t stand in their way.
Choice matters. Design makes that choice viable.
Adapting to life transitions
Housing needs are not static. As Sonia Lavadinho, a Swiss sociologist, explained at the Housing Matters forum during MIPIM 2024, traditional housing models haven’t kept pace with the fluidity of modern life. She used the terms “aloning” and “togethering” to reflect key lifestyle phases. She described the recurring shifts in how people live: alone in their 20s and 30s, with others after forming families or partnerships, and often alone again later in life.
In a world where divorce, relocation, delayed family formation, and longer life expectancies are common, housing should offer flexibility. The market, however, is still creating standard frameworks that assume one type fits all as the default.
If the housing sector is to stay relevant and supportive, it must reflect these realities; providing homes that cater to varied life stages, living arrangements, and economic circumstances. The industry needs to catch up. We need a housing mix that reflects this dynamism. And as architects, we can question whether assumptions about permanence, family structure, and size are serving modern lives.
Variety, not uniformity
So, what if we allowed some flexibility in space standards to foster greater housing variety? A proportion of smaller homes could be one tool in a bigger strategy, to be used intelligently to meet demand without compromising dignity. That doesn’t mean abandoning standards altogether, it means applying them thoughtfully, considering both minimum quality and maximum choice.
Because ultimately, the right home isn’t always the biggest one. It’s the one that fits. n
Based on an article first published in Building Design
Tower House, Lewisham
Lars Christian argues that to raise billions for net zero transport infrastructure, thinking the unthinkable is possible
How to raise £1bn annually for net zero transport
This article contains a fivefold strategy for the mayor, assembly and parliament to pursue: i) Turn all paths into shared paths throughout London and the metropolitan greenbelt, with minimum width set by secondary legislation; ii) Create half a dozen bike priority outer borough town centres; iii) Extend the DLR, Tram and Overground in the outer boroughs; iv) Build 3-4 suspension swing bridges; two short rail tunnels; and v) Build up to eight car and lower van toll tunnels.
How to generate up to £1bn annually for transport infrastructure? With a majority of households paying their share; Where the top two decile earning households pay on average £2.5k annually, direct and indirect; The two next decile £1.5k; The two middle decile, and four bottom decile car households £500; And with the four bottom decile car-free households contributing nothing.
Single tube toll tunnels
Instead of building the £19bn, 23 km, 16½m diameter Lower Thames Crossing; and/or the £+30bn Crossrail 2. Consider building up to eight toll tunnels, altogether up to 55 miles, The toll tunnels are for 2⅓m high e-vans and e-cars only*. In 14m internal diameter tunnels, split horizontally in two halves; With
three lanes in each direction, and a forth emergency lane. With each tunnel costing a fraction of the above two sums. The eight tunnels serve eight inner and nine outer boroughs; nine north and eight south of the river.
There are three purposes for the toll tunnels: i) To raise revenue for bike, pedestrian, and public transport investments and improvements; ii) To nudge most outer and inner borough households to turn to e-vehicles; and iii) To make north-south journeys and south-south journeys more comparable to east-west journeys (M4, A40), and diagonal journeys. (M1, M3, A3, M20, A20, A2, A13, A12, M11).
There are three precedents for this**; In Oslo, where more than half the toll tunnel revenue goes to public transport, for 30+ years; With the initial full hight tunnels opening in 1989***. Sydney has an extensive network of toll tunnels, apx 33+15+9 km. And the nearest similar restricted hight tunnel is in western Paris; With two lanes and a hard shoulder, for up to 2m high vehicles; Inside a 10½m internal diameter tube; 10 km long, with one intermediate junction, at €2½bn in 2011. It is similar in diameter to the Silvertown tunnel. The HS2, Blackwall, Rotherhithe and Channel tunnel internal diameters are all a little smaller, at 9.1m; >>>
Lars Christian is an urbanist and lecturer
8.2-8.6m, 7.6m and 7.6m diameter respectively. There are additional benefits of the eight toll tunnels, direct and indirect: To London households, businesses, productivity, competitiveness, and society at large; Less pollution and noise; Better access for vans, lorries, cyclists and similar; On the new toll, and the existing (strategic) road network; Improved access, for the self employed, SME and skilled professionals;
Up to eight potential toll tunnels
• Two toll tunnels form a north-south strategic e-car axis; Linking in the north with the M25 and the North Circular; And in the south with the South Circular toll tunnel, Croydon, and the M23.
• The Great North toll tunnel, starts at Holloway; Intersects halfway with a free off-peak 2 mile tunnel under the North Circular, between Arnos Grove and A10; And continues north to the M25, ending halfway between junctions 24 and 25.
• The Great South toll tunnel, starts at M23 at Coulsdon; With a junction under Croydon; And a no exit/entry junction under Crystal Palace; Wth the nearest exit and entry 2½ miles further east and west at Streatham and Catford.
• The South Circular toll tunnel extends from White City to Eltham; With five intermediate junctions, at Hogarth by Chiswick, Wandsworth, Streatham, Crystal Palace and Catford.
• The M3 toll tunnel, extends 4 miles from Hogarth to Twickenham; With or without a junction at Richmond. The M1 toll tunnel extends 3 miles from Swiss Cottage.The Tower Bridge toll tunnel extends 2 miles from Aldgate to Bricklayers Arm. And the Woolwich toll tunnel extends 1½ miles between the Gallions/Pettman/Plumstead roundabouts. Reserving the bridge for bikes, buses and lorries, and the ferry for lorries, both tolled at peak hours.
• At the Lower Thames Crossing, restricted height toll tunnel extending maybe 4 miles, is supplemented by: A combined tram-train between Romford via Lakeside and Bluewater to Ebbsfleet, sharing a single two directional track across the Dartford Bridge; The two remaining bridge lanes reserved for vans and lorries only, one in each direction; With the existing tunnel, reserved for vans and cars only; With one single lane (entering, one half of the tunnel length); and two lanes (exiting, second half the tunnel length).
• There may be other worthy options of (shorter) toll tunnels to consider, including; 1.5 miles from Hammersmith to Earls Court.
Tolls, revenue & finance
With 100k cars daily in each direction in each tunnel (half travelling half the length, half the entire length; half off peak,
half peak hours); The revenue may amount to £1bn annually; if the above pay £2.5, £4, £4, £6 respectively; Charges similar to the half a mile long Silvertown/Blackwall tunnels.
What are the financial alternatives that can raise a billion annually for zero emission transport infrastructure? Tax on goods transport, businesses, home ownership, land ownership. As for the former, western European nations typically tax goods transport, except Sweden, Ireland, UK.
Raising the income tax for employees living in London may also be pursued; On par with the flexibility Scottish and Wales parliaments have to vary income tax by two percentage points. Supplemented by peak hour toll charges at bridges west of Lambeth Bridge; Peak hour toll charges crossing borough boundaries; And toll tunnel charges; The four together may contribute to finance some of the following:
Zero carbon green transport & public realm
• A strategic network of concentric shared bike and pedestrian paths throughout outer London; And potentially the metropolitan greenbelt; With a minimum width of 3-4-5-6 metres between hedges, fences and walls, defined by secondary legislation****(see PIL103);
• Complete the Thames Path in East London by 2044, the centenary of its conception; From Canary Wharf Pier via Barking Creek to Rainham; And from Rotherhithe to Dartford Creek;
• Recreate Croydon, Bromley, Romford, Uxbridge, Ealing, Harrow and/or Brent Cross as bike priority town centres; Including a SuperBikeLoop between the seven centres, and the three existing cycle friendly ones; Richmond/Twickenham, Kingston and Enfield; And extend the TfL bikes to the ten centres; and retail parks along the orbital Overground; supplemented by cargo bikes;
Net zero public transport
• A Heathrow to Feltham train tunnel; And a Heathrow & West
London Tramlink; The train tunnel joining Waterloo to Reading and Paddington to Staines; The Tramlink joining Feltham, Staines, to Uxbridge, Harrow, Brent Cross (see PIL113);
• Extension of the Tramlink and DLR in east south east; The Tramlink to Crystal Palace; via Bromley, Eltham to Woolwich; The DLR to Ilford, Abbey Wood, Eltham (figure);
• Extension of the orbital Overground west south west; Joining Acton, Heathrow, Kingston, Wimbledon, Sutton, Croydon (figure); With a 20min frequency via Hounslow and Brentford; 20min to Richmond and 10+10min to Clapham Junction (c/w+a/c/w) ;
• A 2mile Thameslink West tunnel, from Victoria to Marylebone; with one intermediate station; Joining Clapham Junction, Brixton, to West Hampstead, Gospel Oak (PIL111);
Five net zero carbon transit bridges
• Commission one West London and three East London pedestrian/bus/tram/DLR double fan design cable stayed swing bridges at Rotherhithe/Canary Wharf, North Greenwich/Blackwall, Thamesmead/Barking; With five tension cables, one extending between the two towers, and two between each tower and land, forming two fixed triangular structures, to hold the two towers in place for generations; With the roadway fixed to each tower, swinging open a few times a day (figure; see also PIL117);
• Commission a new Hammersmith toll bridge, with combined bus and bike lanes; Possibly a high grade steel copy of the existing bridge; The existing moved down or upriver as a bike/pedestrian bridge; or sold abroad;
• And potential commission additional or replacements of other end of life bridges and/or tunnels, pedestrian and cycle ones included.
Afterword
The above is not arguing for building altogether 55 miles of toll tunnels, but maybe half this, prioritising a few of the eight possible toll tunnels presented above.
London has since WW1 received a disproportionate share of central government funded public transport. There are endless arguments for this, but also endless arguments against this. There is only one other G20 nation that has done something similar, France.
What happens if London raises an equivalent amount of the Oslo toll revenue, €4-5 billion annually, proportional to inhabitants? Divided by four million households, that is over a thousand pound per household. Enough to build almost everything anyone could ever wish for in London.
But can London, Londoners and London businesses afford this? Possibly, yes. If the rich annually spend £1k less on add on’s to their SUVs, £1k less on designer handbags and other accessories; £½k less on premium phones; The semi-rich half that annually.
An armageddon or a way forward? For all Londoners; The rich? The above average income? The middle income? The below average income? The low or no income? n
Footnotes
* Van heights: Ford 2.5m; MB Sprinter 2.35m, Renault 2.3m; Vauxhall 2.25m, VW 2.3m;
** Stockholm attempts to build a 21 km full height western tunnel bypass, financed from a congestion cordon since 2007; has experienced endless delays and cost multiplications;
*** Greater Oslo: €½bn annual toll revenue, in an urban area of 1mn inhabitants
**** Minimum road and path widths were first defined in London in 1666
Paul Campbell makes the case for SME sites and Green Belt reform
Unlocking London’s housing potential
Housing in London has never been more unaffordable: according to The Observer, it is now at its highest price point since the 1980s. Yet new home starts in the city have fallen by 75% in the last year. SME sites, those under 250 homes, represent the most viable route to accelerate delivery, but they remain mired in a planning system that cannot keep pace.
It’s not all doom. More than a year into the new Labour government, there are signs that confidence is returning to the housing sector. A pro-growth agenda, clearer targets and leadership and a revised NPPF are all helping to re-energise a market long plagued by uncertainty.
Paul Campbell is Chief Executive of Richborough
At Richborough, 2025 has seen encouraging momentum. For the first time, we have been appointed on three new sites within the Greater London Authority boundary, all expected to fall within Greybelt classification, as well as further significant sites within the wider Metropolitan Green Belt with strong connections to London. These developments represent thousands of homes that could begin to ease the capital’s deep housing shortage.
But the challenges in London remain acute, accentuated even further by the collapse in the market viability of the high rise, high density developments on central brownfield sites following the Building Safety Act amends.
The planning system is still too slow, too unpredictable and too poorly resourced to support the scale of housing delivery the capital urgently needs. Nowhere is this more visible, or more damaging, than in the case of small and medium-sized (SME) sites which are most often stuck in the system.
Richborough’s own activity illustrates both potential and constraint. In the first half of 2025, we submitted 15 planning applications across England, equating to over 2,600 homes, with a further 35 applications - up to 11,000 homes - expected by year-end. Over 75% of these are for developments under 250 homes, the size at which SME builders can operate most effectively, with local supply chains and agile delivery models. Yet the system’s delays threaten to stifle this potential.
The average timeline for a major outline application now exceeds 24 months, nearly three times longer than a decade ago, according to Lichfields’ How Long is a Piece of String? research. Over 30% of that time is spent just getting applications validated. This bottleneck disproportionately hits SME sites, which are precisely the kinds of developments London needs for rapid delivery and tenure diversity.
National and London-specific data highlight the issue. Planning consents for sites under 100 homes have fallen 45%
since 2017, and for 100–250 homes by 36%. Major housebuilders’ outlets remain 12% below 2018 levels, while sales rates have stagnated. In London, this translates into fewer deliverable sites in a city already struggling to meet demand.
absolutely critical, alongside a focus on SME-friendly planning reforms. The GLA-wide Green Belt review needs to be accelerated and extend proposed streamlined planning routes from 10–50 homes to include sites up to 250 homes. This mid-sized bracket represents the “sweet spot” where delivery is feasible at pace, impact is meaningful, and SMEs can thrive.
Beyond policy design, we must also address capacity. Local authority planning departments and statutory consultees need proper resourcing. The public sector must be enabled to match the private sector’s readiness. And there must be greater transparency and accountability for delays that stall otherwise viable projects.
At Richborough, we are committed to delivering across London and the South East, submitting applications that are deliverable, embedding good design and technical due diligence. These are not speculative projects, they are homes London urgently needs. But without a functioning planning system, the potential of SME sites remains untapped, and London continues to face a cycle of too few homes, delivered too slowly, by too few builders.
The government has the intent. London needs execution and the political will to unlock the planning system where it matters
Richborough partners with landowners and land agents who want to sell land for residential and commercial development. We design a masterplan, secure outline planning permission, and sell the site on the open market to a suitable development partner.
Richborough operates across England and Wales with offices in Birmingham, Nottingham, Manchester, Bristol, and London.
LEFT: Richborough projects at Croxley Green and BELOW: Hornchurch
The G15 and Housing Today magazine have some ideas for boosting supply of affordable housing, reports Lee Mallett
Rethinking housing association funding
While planning policy and housing targets help manage the supply of affordable housing in London, other factors could have a more direct impact on supply, as a recent report from Housing Today magazine produced in partnership with London’s G15 largest registered providers of subsidised housing suggests.
Given there are 323,800 households on London’s waiting lists, and London’s share of the national housing target is nearly 81,000 a year, of which the Mayor of London’s target is a fairly paltry 1719,000 homes a year (having been cut by 6,000 a year back in May), some new ideas are needed to boost Registered Providers’ ability to deliver.
In addition to the well reported factors suppressing development generally, registered providers (better known as housing associations) are afflicted by a broad set of fiscal problems, for which the report, State of the Capital: Shaping a new model for affordable housing in London, written by HT reporter Carl Brown, has some interesting recommendations.
We might have a better chance of meeting targets if these recommendations and others were considered by a more dynamic and delivery-oriented government view of the housing crisis. Planning is strategy, delivery needs specific tactics. And there is a need for a more holistic approach.
First some of the issues the report identifies. Starmer’s Government is chasing growth. One area with big potential is housebuilding. Building the homes required to meet social need, 90,000 a year nationally called for by MPs, would deliver £48bn of economic impact, and £31bn in indirect benefits according to research commissioned last year by the National Housing Federation and Shelter.
In London, says Housing Today’s report, housing associations provide 289,000 social rented homes, which apparently contribute an average £23,777 or more in value annually totalling £6.86bn. Providing new social tenancies for the 323,800 households on waiting lists would inject another £7.7bn a year into London and the UK’s economy, it is claimed.
But (and there are several ‘buts’), Housing associations and indeed the Government, have severely constrained balance sheets. We know because they keep telling us so.
PiL and an urban regeneration consultant
The evidence of the impact these constraints have can be seen in much diminished demand from housing associations for private developers’ built-out S106 quotas in new developments.
Construction Enquirer website, for example reports recently that ‘London developer Chase New Homes has called on housing minister support to resolve a planning stand-off blocking the start of its 251-home Claremont Quarter at Cricklewood.’
‘Despite marketing to more than 30 registered providers, no buyer came forward,’ the website reported. The only offer, in fact, from neighbouring Brent Council was rejected by Barnet. And apparently a payment-in-lieu deal has been struck, but Barnet has
not taken this up. Other private developers with S106 affordable homes to dispose of report similar lacklustre demand from housing associations. This can stall developments.
Balance sheets are squeezed because of inflation and rising construction costs, plus all the rising costs associated with the new safety regime. This has put the associations’ cross-subsidy model, with reduced grants, under immense strain – not to mention rising interest costs. Also total grants, set at £53,000 per home in 2008, are now only £38,500 under Homes England’s program that runs until next year.
Then there are the decarbonisation costs imposed on registered providers’ portfolios. An enormous and unavoidable commitment, leading to reduced appetite for new-build or acquisition.
Consequently, it should be no surprise that the Regulator of Social Housing has issued repeated warnings about eroded interest cover in the sector, projected to fall to a record low this year. And of course the strongest pressures are in London, where there are more costly flatted blocks to maintain, more older stock, more unsafe cladding, greater wear and tear in dense urban environments, greater labour costs, etc. G15 members, who house one in 10 Londoners, spent £8.4bn on repairs and maintenance in 2024, a 90% increase over five years.
The G15 reckons associations need £54bn to deliver the number of social homes outlined in the London Plan over the next five years – something like 100,000 homes. Increasing the grant pot will not cover the cost, other measures are needed, says the report.
An amortising grant model
While the sector has high levels of liquidity, RPs are not generating enough cash to cover interest bills in the short term. That
Lee Mallett is a founder editor/publisher of
>>> makes it difficult to take on more debt to develop.
Associations need to know that net rent covers interest costs on new properties, then they could commit to building more homes, safe in the knowledge their credit rating won’t suffer.
With an amortising grant model, RPs would get a higher amount of grant up front, so they need to borrow less privately and net rent could cover interest more easily. The grant paid back over time could be re-classified as an investment instead of debt (or expense to the tax-payer) – which sounds like a form of ‘offbalance sheet’ funding for the Government.
‘For example,’ says the report, ‘if government can account for half the grant as asset investment rather than revenue spend, in theory it could spend twice as much in grant for the same amount under this model.’ And the money paid back could be recycled into an affordable housing fund.
The model would address the problem that sub-market rented homes makes losses for years but comes good in the longer term as debt is eroded. It is a method for overcoming lack of government capacity – or will – in the current parliament.
Affordable housing as critical infrastructure
Another solution would be to reclassify social housing grant. Grant funding should not be classified as borrowing or grant because it provides a significant return to government. It currently enables associations to lever in private finance producing a ‘gearing’ or multiplier effect on that grant while reducing strain on the benefits bill for government. There are massive net positive benefits estimated at £51bn.
If housing were reclassified as infrastructure in this way, it would provide long term certainty around funding and unlock substantial investment and ‘could better integrate housing with essential services’ claims the report.
Reboot London’s financing and rent policies
The G15 wants a 10-year rent settlement and the reintroduction of rent convergence as a way of cementing funding certainty for the sector. But rental income alone can’t pay for what’s needed. London needs a big capital funding programme and a new holistic view of that balances rent and grant funding. And a new separate and more flexible devolved funding program for housing providers in London. The City Hall Developer Fund proposed by Sir Sadiq Khan could with the Affordable Homes Program unlock the scale and pace of delivery London needs. A much more interventionist City Hall, in other words, with the means to make stuff happen.
Reintroduce
rent convergence
Ending rent convergence that allowed lower rents to rise to ensure alignment between rents on similar types of properties has severely dented the financial capacity of the sector. A mistake. Ending the policy has meant RPs have foregone £2bn that could have been deployed on new schemes. Government is concerned about the impact on the benefits bill, but this looks like a shot in the foot in terms of meeting housing delivery targets.
Give RPs more access to the Building Safety Fund
Social landlords are mostly excluded from accessing this £5.1bn fund. Social landlords are eligible ‘only if costs would otherwise be passed onto leaseholders, or threaten the landlord’s viability’. The G15 is forecasting a spend of £3.6bn on saftey works to 2036, none of which are covered by the fund. The fund should be opened up to social landlords.
Regional costs and skills shortages
Workers are more rare and more expensive in London, leading to an extra £1,900 in housing costs per home in the capital –far exceeding the amounts higher rents are producing. National policy should take this challenge into account.
Long term funding for investment in existing homes
Funding mechanisms for retro-fit are not fit for purpose. Competitive rounds of bidding waste money, generate an unpredictable pipeline and ‘a pepperpot’ of uncoordinated projects. This holds back supply chain growth and speed of delivery. A warm, decent homes policy is needed to improve co-ordination of decarbonisation efforts to improve outcomes. A joint 10-year funding pot would help G15 members invest in their workforce and undertake larger-scale improvement projects. This would speed up getting to net zero and save money that could be put into supply.
The existing model is bust. G15 landlords have cut pipelines from 14,700 starts in 22/23 to 6,400 in 23/24. A catastrophic decline. ‘After all,’ states the report, ‘if London, which generates around 25% of UK income tax, starts to fail, Keir Starmer’s plans for growth will be in tatters’.
Indeed. To which we might add it should be incumbent on all 33 local authority social landlords in the capital as well as RPs, to comb their own substantial portfolios for development and intensification opportunities and make public what they discover. There is no shortage of private capital looking for opportunities in London to invest in residential schemes. n
Brian Whiteley considers the lessons for proposed New Towns offered by Grand Falls
Some Canadian lessons for New Towns
A Canadian Garden City
Grand Falls-Windsor, Newfoundland is among the first garden cities created outside the UK in the early 1900’s. Designed and built by the Anglo-Newfoundland Development Company between 1906 and 1909, the town’s layout was inspired by Ebenezer Howard’s pioneering theory of 1898with separate residential, commercial, and industrial zones, and suburban housing lots organized along a series of sweeping curvilinear streets meant to integrate scenic views and landscape into the urban experience.
It is a notable example of how industrial development and emergent planning theories guided the creation of paternalistic Canadian resource towns in the early decades of the twentieth century, when industrial entrepreneurs seized upon planning as a way to forge a stable and passive workforce by protecting workers’ health and enforcing social standards. One of the earliest professionally designed company towns in Canada, it was not a work camp but aspired to be a real community, based on Garden City planning principles. Other, later examples of company towns can be found across Canadaresulting from the country’s resource extraction sector – e.g. Kitimat, British Columbia (1951), Uranium City, Saskatchewan (1956), Flin Flon, Manitoba (1927), Batawa, Ontario (1939) and Arvida, Quebec (1927).
Location
During the early 1900’s, worried about an impending war in Europe which might restrict the supply of timber for his newsprint, Fleet Street press baron Alfred Harmsworth, later Lord Northcliffe, began looking for an alternative source of newsprint for his family's UK newspaper and publishing business, one safely removed from continental Europe. Searching for a suitable location to build and operate a pulp and paper mill, his brother Harold Harmsworth discovered Grand Falls on the Exploits River:
Alfred Harmsworth called the falls “white coal,” coal being the dominant power source at the time. Other incentives for building a pulp and paper mill there included the completion of the Newfoundland Railway in 1898, access to plentiful lumber, and a port in nearby Botwood (35 km northeast).
An Economic Driver
Brian Whiteley is Planning Advisor at RTPI’s Planning
On January 7, 1905, the Harmsworths and Robert Gillespie Reid, owner of the Newfoundland Railway, formed the AngloNewfoundland Development (AND) Company. When in 1905 it acquired a 99-year lease to 10 360 km2 of timberland and its minerals at Grand Falls, it is doubtful that the original
inhabitants of the area, the first nation indigenous inhabitants, were consulted or involved. Construction then started on the mill, which opened on October 9, 1909: Harmsworth established what was then the world’s largest pulp and paper mill together with an associated company town, just after the first garden city was begun at Letchworth, England, in 1903. Harmsworth knew Ebenezer
Howard and contributed financially to his project. Another brother, Cecil, was an influential member of the Garden City Association in England.
Grand Falls was built to house the workforce attracted there from throughout the colony and the world to help run the mill and develop the surrounding area. Initially, mill staff were housed temporarily in hostels or boarding houses before more permanent homes were built around a network of wide, often tree-lined linear and circular roads. The land required for the mill and town site was leased to the AND Company which, in turn, leased homes to residents for $1 per annum. Only employees of the AND mill and ancillary businesses were permitted to live in the community; non-AND employees (e.g. forest workers, merchants and sundry service providers) resided in the adjacent town which grew up in the shadow of Grand Falls - Grand Falls Station. In contrast to Grand Falls it had no formal planning. The two communities effectively separated different classes of workers and services. Main Street and Grand Falls Station (the building on the right) is pictured below as it was in 1919. Many businesses like those in the background set up shop to take advantage of railway traffic:
A Master Plan
The 1907 plan for Grand Falls shows five parts: the mill, town centre, two residential districts, and a recreational area.
The mill was situated at a bend in the Exploits River because there the river is forced through a narrow gorge where hydro-electric power could be generated and fed directly into the mill. Land east of the mill was designated the High Street, which then as now would be the commercial and administrative centre of the community. Further east was a residential area distinguished by a peripheral circular road. Two pairs of intersecting streets form a grid within the circle. Houses are arranged on spacious lots along each street, with front and rear ‘gardens’ as per the dictates of Howard’s Garden City model.
North of the mill, another residential area was also built, this time featuring an irregular curvilinear street network dictated by the hilly terrain. A recreational area was laid out to the east of this neighbourhood, which for many years held a race park and grandstand. In keeping with Garden City ideas, buildings were of local materials, chiefly wood. Raw materials were abundant; the workers hired were familiar with the materials used. Later, imported Scottish brick was used for several large structures including the town hall and a hotel called the Carmelite House.
Housing & Community Facilities - developed concurrently
The design and substance of the domestic architecture varied depending on the intended occupant. Thus, Lord Northcliffe’s home away from home, Grand Falls House built in 1909 was a large, traditional Tudor-style dwelling that feels like it was lifted from the English countryside. As one moved down the management ladder, dwellings rapidly became more modest:
The building programme began in 1906, lasting until 1912, with a later development thrust after World War I that lasted until 1922. In this period, a total of 485 houses were constructed. Some of the post-War streets are named for battlefields in Europe where Newfoundland soldiers suffered major losses — for example, Beaumont Avenue and Suvla Road. >>>
FAR LEFT and LEFT: From the artist, Christopher Peet, and a photograph of the mural by Craig Goudie at the GFW Heritage Centre. Both are provided courtesy of the Grand Falls-Windsor Heritage Society
The 1907 plan for Grand Falls shows five parts: the mill, town centre, two residential districts, and a recreational area
The city’s progressive appearance and factory wages made it the envy of people across Newfoundland. The AND Co.’s state-of-the-art pulp and paper mill was among the first landbased industries to develop in Newfoundland following the completion of the railway in 1898. The company also built shops, clubs, churches, schools, and a hospital for its workers, along with an abundance of greenery in the form of athletic fields, parks, and gardens. Company housing in Grand Falls was modelled on that in Letchworth Garden City (the world’s first garden city, built 1903-05), where the Harmsworth’s Daily Mail sponsored a Cheap Cottage Exhibition that challenged British architects to create low-cost workers’ housing using industrially produced materials and based on the latest sanitary science. Similarly, workers’ housing in Grand Falls was arranged along wide streets with front and rear gardens and featured modern amenities like indoor plumbing and electricity. The company also directed all aspects of social life in Grand Falls, sponsoring picnics and sports teams and banishing alcohol.
Building a Place with Community Landmarks – now an architectural heritage
In addition to many surviving examples of the town’s original housing stock, several heritage structures remain in place, including Grand Falls House and portions of the original AND Co. Pulp and Paper Mill.
Perhaps the most notable historic building in the town
today, Harmsworth Hall was constructed by the AND Company in 1929 and named after one of the original owners of the mill. The building comprises a wood frame with a brick exterior and stands two storeys tall. It has roof trim moulding, copper flashing and large arched windows that overlook High Street, once the main street in Grand Falls.
For decades it served the community as a theatre, playhouse and meeting hall. When Grand Falls was incorporated in 1961, the company gave the building to the new municipality as a town hall. Since then, the city council has renovated the interior to include offices and council chambers.
RIGHT:
Lord Northcliffe’s home away from home, Grand Falls House built in 1909
ABOVE:
As one moved down the management ladder, dwellings rapidly became more modest
Perhaps the most notable historic building in the town today,
Post Company Town Development
After more than 50 years under company management, in 1961, Grand Falls became a municipality with local governance and private land ownership became available to anyone. In 1991 it amalgamated with Windsor, and jointly they developed into the largest town in central Newfoundland. Today, the main focus of business activity has moved from the High Street to Cromer Avenue, just north of the Trans Canada Highway. Grand Falls-Windsor has become a major service and distribution centre with considerable mining and aquaculture activity in the surrounding region; tourism is also gaining importance; and the population has grown to 13,800. The mill remained one of the town's largest employers until its 2009 closure.
Conclusion: Does Grand Falls offer lessons for proposed New Towns?
The visionary British planner and reformer Ebenezer Howard’s influential Garden City proposal for self-contained settlements, first outlined in 1898, arrived in less than a decade to Grand Falls. Like earlier paternalist-capitalist efforts such as Lever Brothers’ Port Sunlight outside Liverpool and the Cadbury family’s Bourneville near Birmingham, Grand Falls’s founders took salubrious housing with associated community facilities and services as means to improve its workers’ livesand morals. The consequent company town, predicated on functional zoning and picturesque residential districts, sought
the modernization of every aspect of life, from industrial production and social responsibility to cultural life and familial duty.
Whilst developed in both a very different time and economic context there are perhaps five pointers which Grand Falls offers for New Towns now under consideration in the UK:
1 Location – it must be a place able to attract internationally mobile capital, with good transport links, attractive to work and live in, and with ready access to any raw materials or technologies and labour needed to forge a new local economy.
2 Economic Driver – it takes decades to build a new community and there has to be a durable economic driver able to support growth over that period.
3 Master Plan – whether a single company (as at Grand Falls) or a single overarching development organisation, experience from many successful new towns suggests they are more likely to achieve a focussed plan for their evolution and sustained growth. Municipal control and private land ownership were both later facets of Grand Falls’s development. A single company which owned and leased back land to developers ensured the town developed to its original master plan, giving certainty as to growth and development from its initial beginnings.
4 Housing & Community Facilities: developed concurrently –the Garden City concept ensured that the social and commu-
RIGHT:
Harmsworth Hall
Some modern views of Grand Falls showing the spacious housing plots with gardens and a variety of street trees and open spaces.
nity needs of the workforce needed at Grand Falls were attended to from its early stages – after services initially developed more haphazardly around Grand Falls Station. Temporary housing was in place ahead of permanent housing developed by the AND Company in the carefully planned streets of the master plan.
5 Building A Place: using Landmark Buildings – importance was given to developing community buildings in prominent positions across the town to give it an identity and sense of place – e.g. the town hall, hotels and places of worship for various denominations present in the workforce. n
– Brian Whiteley, MRTPI – with particular thanks for: (a) research assistance from Greta Forster and (b) for their comments and suggestions from Robyn Warren and colleagues at the Grand Falls-Windsor Heritage Society.
References
• Futureproof New Towns interim report – (August 2025) Royal Town Planning Institute, UK
• Commentry by the Expert Panel - (June 2025) Prix du XXe siècle | Institut royal d’architecture du Canada
• New Towns: What Can We Learn From History? – (December 2024) Jon Neale, Head of Research & Insight, Montagu Evans, UK
• Unlocking the mysteries of Grand Falls House: Town opening up historic home for summer tours – (June 2024), article published by CBC News
• The English New Towns since 1946: What are the Lessons of their History for their Future? – (2017) Mark Clapson, article published in Histoire Urbaine, 50 (2017/3), pp. 87-105
• Grand Falls-Windsor – (2015) Janet & Robert Pitt, article published in the Canadian Encyclopedia
• Overview of the English New Towns – (1997) Stephen Potter, Research Fellow, The Open University, UK
• Photographs and illustrations are taken from the photographic collection of the Grand Falls-Windsor Heritage Society, P.O. Box 823, Grand Falls-Windsor, NL, A2A 2P7 (e: gfwheritagesociety@gmail.com / w: https://gfwheritagesociety.ca ) and from Wikipedia at: https://en.wikipedia.org/wiki/Grand_Falls-Windsor
RIGHT:
Sherin
Aminossehe with foreword by Lord Hendy of Richmond Hill
Published by Frances Lincoln
Hardcover £35 (26.03 at Amazon)
RIGHT: Looking through the brick arches of the Ouse Valley viaduct
More drawings on following pages
200 Years of Britain's Railways in 14 Journeys
The world's first public railway, the Stockton & Darlington Railway, opened in the northeast of England in 1825 and marked the start of rail travel in Britain and across the world. Over the following two centuries the rail network expanded over the country and led to the construction of some of the most spectacular examples of British architecture and engineering.
Through a selection of 14 varied journeys, this book takes the reader on a breathtaking illustrated tour of Britain's rail network, taking in stations, bridges, viaducts and other architectural elements, but also the people and personalities associated with them.
This beautiful and engaging book is filled with stunning illustrations by the author and will appeal to anyone with an interest in Britain's railway history and architecture.
This very beautiful coffee table sized book will have railway nerds, doubtless including Michael Portillo, ecstatic. For the rest of us the rich and beautiful coloured drawings by the author will be
enough to keep us mesmerised.
Author and illustrator Sherin Aminossehe moved from Iran to the UK as a child, training as an architect, working across the world both in the government and private sector. Taught by her mother, she has been drawing since she could hold a pencil. (Sherin's recent day jobs have included responsibility at the Cabinet Office for all government land and buildings. A lesser achievement was being a mentee to your Editor!).
AUTHOR’S NOTE ON THE DRAWINGS
For those of you with an artistic bent, all of the drawings here have been drawn with 0.05 and 0.03 fine liners to capture some of the remarkable architectural detail. The colour is truly mixed media, the materials used range from gouache and watercolour to Indian ink, brush pens, pastel and more oily coloured pencils, acrylic pens and even some Tippex for highlights!
LEFT: Decorated cast-iron column capital at Great Malvern station
The London Borough Of Waltham Forest Town Hall London E17 4JF 020 8496 3000 www.walthamforest.gov.uk
Chief Executive Martin Esom martin.esom@walthamforest.gov.uk 020 8496 3000
Strategic Director, Corporate Development Rhona Cadenhead rhona.cadenhead@walthamforest.gov.uk 020 8496 8096
Director Regeneration & Growth Lucy Shomali lucy.shomali@walthamforest.gov.uk
The London Borough of Wandsworth Town Hall Wandsworth High Street London SW18 2PU 020 8871 6000 www.wandsworth.gov.uk
Chief Executive Paul Martin paul.martin@wandsworth.gov.uk 020 8871 6001
Head of Development Permissions Nick Calder ncalder@wandsworth.gov.uk 020 8871 8417
Environment and Community Services Directorate >>>
Mark Hunter mhunter@wandsworth.gov.uk 020 8871 8418
Head of Forward Planning and Transportation
John Stone jstone@wandsworth.gov.uk 020 8871 6628
City Of Westminster Westminster City Hall 64 Victoria Street London SW1E 6QP
020 7641 6500 www.westminster.gov.uk
OTHER ORGANISATIONS
Greater London Authority City Hall
Kamal Chunchie Way London E16 1ZE
020 7983 4000 www.london.gov.uk
Sadiq Khan Mayor of London mayor@london.gov.uk 020 7983 4000
Greater London Authority
Executive Director, Good Growth Philip Graham
Assistant Director, Planning (GLA) and City Planning (TfL)
Lucinda Turner
Head of Development Management
John Finlayson
Head of the London Plan and Growth Strategies
Lisa Fairmaner lisa.fairmaner@london.gov.uk
Planning Change Manager
Peter Kemp
Chief Executive Stuart Love slove@westminster.gov.uk 020 7641 3091
Director of Planning 020 7641 2519
Head of City Policy and Strategy Barry Smith bsmith@westminster.gov.uk 020 7641 3052
Urban Design London Palestra 197 Blackfriars Road London SE1 8AA 020 7593 9000 www.urbandesignlondon.com
Planning Officers Society The Croft, 81 Walton Road, Aylesbury HP21 7SN tel: 01296 422161
Design For London City Hall
Kamal Chunchie Way, London E16 1ZE info@designforlondon.gov.uk
Keep taking your PiL
Please complete and mail the form below with cheque for £99.00 or click SUBSCRIBE at www.planninginlondon.com and pay with PayPal or credit card
China National Publications, Deloitte, Womble Bond Dickinson, Avalon Planning, L B Barnet, Gilmartinley, Harvard College Library, London Wharf PLC, L B Islington, L B Greenwich, Sport England, Entec UK, Berkeley Group, Workspace Group, LB Bexley, RBK&C, RTPI, LB Bromley, PRP Architects, Durrants, L B Islington, CBE, GL Hearn, Holistic Group, White Young Green, Dentons, i-Document Solutions, Trowers & Hamlins, Montagu Evans, Hayes Davidson, Precise Media, NLP, L B Merton, Cluttons Planning, Speechly Bircham, TP Bennett, The London Society, Ebsco, Brockton Capital, Turley Associates, Munkenbeck & Partners, Terence O'Rourke, Assael Architecture, Metropolitan Workshop, PRP, Urban Research, AMEC, GLA, LCR Stations and Property, Terence O'Rourke, Rolfe Judd Planning, Southbank University, Lurot Brand, Alliance Planning, Cluttons, DPP, Savills, Henley Business School, Grosvenor, Sainsbury's, Hamptons International, Barratt Homes, National Grid, Network Rail, Foster + Partners, Gorkana Group, London & Continental Railways, London Communications Agency, Cardiff University, L B Ealing, MHCLG, Transport for London, LSE Library, Deloitte Real Estate, London Councils, Circle 33 Housing Trust, P&O Estates Ltd, Greenwich University, Steer Davies Gleave, City of Westminster, British Architectural Library, CBRE, Delancy, PDP London, Bellway Homes, Jestico & Whiles, London & Quadrant, Ecology Consultancy Ltd, Tesco Plc, Ramboll, Dominion Properties, BWCP Architects, WSP Indigo, Slaughter and May, LSE library, British Land Company, Dentons, HTA Design, Howard Kennedy, ...
... Just some of the firms and organisations who have taken their Planning in London subscription. ONE YEAR FOR JUST £99
To subscribe: click on www.planninginlondon.com or please return this form. Bank transfer: HSBC 40-07-13 a/c 91551655 'Planning in London'. A subscription is a licence for 5 copies emailed in PDF format. Please supply up to 5 email addresses to planninginlondon@mac.com
Please notify any changes immediately by e-mail to planninginlondon@mac.com with the subject ‘planning in london directory’.
WOULD YOU LIKE TO SPONSOR THIS DIRECTORY? Previous sponsors were Colliers and Knight Frank. If maybe then please email editor@planninginlondon.com
Department of Levelling up, Communities and Local Government 020 7944 4400
Sarah Allan, head of design designquality@levellingup.gov.uk
Simon Gallagher, director, planning
Go to planninginlondon.com > Subscribe and pay online with
I would like to subscribe from: last issue 134 July 2025 this issue 135 October 2025 next issue 136 January 2026
I enclose a cheque for £99.00 (no VAT, payable to Planning in London) I am interested in advertising in the Advice directory (£300 for one year)
Please debit my card £106 (£99+£6.00 for credit card administration, no VAT payable)
Card type: VISA MASTERCARD
Card number:
Expiry date: security no:
Signature:
Name on card:
Firm:
Card billing address:
Delivery address if different:
Tel: Up to 5 Email addresses:
Post cheque to: Planning in London, Studio Petersham, Gorshott, 181 Petersham Road TW10 7AW for the attention of Melanie Hern
For many years Sir Terry filled these ‘Shaping the World’ pages and more recently colleagues from Farrells. We reproduce the cover and an article by Terry from PiL 96, January 2016 and the editors add to all the recent tributes
Sir Terry Farrell CBE
The near-simultaneous deaths of Nick Grimshaw and Terry Farrell were a reminder of what a powerful force they were when in practice together, for 15 years, before a philosophical falling-out over post-modernism. Each architect went on to national and international success, with buildings and projects around the globe. Terry always had a greater interest in planning and the evolution of cities than Nick, with Newcastle and Edinburgh examples where his ideas about place-making were put into practice.
But it was London, his adopted home town, that inspired some of Terry’s most creative thinking about not just architecture, but the built environment as a whole. He was a sort of pragmatic theorist whose observations and conclusion derived from his life as an architect, but also from his early life studying in the USA with teachers including Robert Venturi. Like Norman Foster and Richard Rogers, but at a different time and in a different place, it was America which influenced his subsequent life as an urbanist.
His thoughts on the nature of cities, the implications of density and intensity, and the recognition that abandonment of the city was a mistake that made him a powerful figure in the world of planning, perhaps more so than architecture. His support of post-modernist architecture made him almost persona non grata in some architectural circles. Absurdly he was never made a Royal Academician (contrast that with some of the second-raters recently promoted to membership), though Nick Grimshaw became president. No RIBA Royal Gold Medal either. But he did receive the Royal Town Planning Institute Gold Medal, prompting a memorable lecture and publication about his ideas.
The combination of architectural and planning thinking is an unusual one in the UK; it is a matter of profound regret that there is no obvious successor to Sir Terry. He always regarded himself as something of an outsider, though the honours and appointments bestowed on him scarcely justified this feeling. He was really an outsider because of the decline of that honourable and necessary profession in the UK: the architect-planner.
– Paul Finch
Sir Terry Farrell’s Farrell Review of 2014, which built on the Bishop Review of 2011 (by Peter Bishop), moved us closer to restoring design as a fundamental part of planning and urged the need for national planning, not just development control. Alas Government was not really interested, the perception being of an absence of votes in it. Or worse, as David Cameron voiced it: ‘planning is the enemy of enterprise’. He couldn’t have been more mistaken.
Although Farrell never matched the national influence of Richard Rogers’ Towards an Urban Renaissance, he nevertheless had many more useful ideas for thinking about planning London and other places. Back in the early 90s, talking about London Wall and his pink ‘jukebox’, Alban Gate, he described his approach as ‘mending Modernism’, now widespread in both architecture and planning as the movement’s post-war failings are acknowledged. His critique of the rebarbative nature of London Wall and the Barbican reflected this – whatever you think of the architecture.
He made ‘no small plans’. Outside London, by 2008 a new unitary authority took charge of the five towns of Strood, Rochester, Chatham, Gillingham and Rainham. Terry’s idea for the area was that ‘Five Towns Make a City’. Like so many British towns the Medway towns were conspicuously failing to make the most of their shabby, but fantastic assets – the dramatic topography of the Medway estuary, the historic docks, a tatty industrial estate occupying valuable riverside land, rundown High Streets.
It boiled down to some key concepts. Reinhabit the ‘empty stage’ of the riverside; create a new linking public realm; connect and heal the High Streets; a continuous landscape of green spaces; connect key nodes with new multi-modal links - cross the river with a cable car, more water transport, new pedestrian routes. Ideas that Medway is still struggling to realise. But what a fabulous place it would be now if Government and Medway had fully delivered on Farrell’s ideas.
He was so right about our need for speculative, design-led, creative planning at a local and national level, to create and argue about visions that lead to strategic plans. They are an essential tool for testing potential futures. And as he always maintained – the ‘place is the client’. A simple tenet that should drive ambitions for social, environmental and economic sustainability.
– Lee Mallett
Terry probably had more impact on London than any other City although his architecture centre in Newcastle will be an important legacy as will be his very tall buildings in China.
Many people will see his notable London buildings as his legacy – MI6 in Vauxhall, Charing Cross station and – just completed – his Chelsea Waterfront development between Lots Road and Chelsea Harbour which was featured on these pages in our last issue.
I see his London Legacy as being largely invisible. Terry was above all a master planner. He promoted, unpaid, concepts for the enhancement of the public domain. A great example was his long running promotion for the improvement of Euston Road which, over time, was largely achieved by underpasses, landscaping, pedestrian crossings and uplifting major developments.
Terry was good at marketing so managed to benefit his practice as he promoted public facing Ideas. Thus, for example, his commission for Regents Place from the British Land Company. Perhaps the most significant achievement of his Euston Road concept has been the major redevelopment of the Paddington railway lands at the western end.
Terry contributed the ‘Shaping the World’ feature at the back of Planning in London since PIL74, July 2010, which partners in Farrells have carried on in recent years.
He had a broad but realistic view of the involvement of communities, once quipping: "I believe in bottom-up planning but the trouble is, when you are at the bottom you don't know which way is up."
– Brian Waters
It may seem ironic that in looking for ideas for the future, we are starting with the solutions of the past says Terry Farrell
As we move towards a denser London, is it time to rethink the rules?
I’ve spoken many times about the challenges facing London. In the last five years we’ve added the population of Edinburgh to our city and in the next ten years we will add a ‘Birmingham’. Looking beyond that the GLA have identified in their Infrastructure Plan the pressures that will be placed on the capital including the need for doubling the capacity of the underground system and building 600 schools for the predicted population in 2050. Meanwhile, London is still only half the density of other world cities like Paris and New York. So what are the big issues facing us as we move towards a denser London?
There has been much debate about a new generation of towers planned or under construction, and much of the criticism has been centred on the rejection of the fabric and DNA of the city we know and love that makes it uniquely ‘London’. Density does not mean building tall, something which is often misunderstood. Many have questioned why we are not building more of the typical, street-based residential blocks that are found in areas like Islington and Covent Garden. Areas that we preserve and make ‘conservation areas’. One of the major constraints, in my view, is the set of rules we have come to accept around daylight and sunlight. These rules are actually based on a suburban model rather than the urban model we need to move towards a denser London with a variety and mix of uses.
With higher density comes greatly improved quality of life – access to amenities and public spaces. The closer buildings are together and the more compact the city as a result, the less reliance there is on cars and the easier it is to walk and cycle with all the associated health benefits and reduction in carbon emissions. So it is incumbent upon us to review and refresh the rules, and how they are interpreted, and to understand the unintended consequences.
Our industry is starting to understand the scale of this issue and I’ve attended a number of events that capture these high level statistics. But when I say ‘understand’ I believe this is in the abstract, in a non-engaged and often purely theoretical way. Technocrats come to the fore with their habitable rooms per hectare and plot ratios but what really interests me is what it means ‘on the ground’. This discussion, in my view, should be led by practitioners who are planning and designing the new and infilled parts of our city - architects and planners that are creatively addressing the issues of delivering new homes in a multi-layered metropolis.
Whether we like it or not, we are moving towards a denser London and with the mayoral election now in the minds of the public and the construction industry, there is no better time to start reimagining our future city. In the last few decades we have seen swathes of the capital transformed from former industrial land into publicly accessible, greened spaces support-
ing new communities and vibrant new places. These reimagined parts of the city have been made within the framework of planning rules, often responsive in nature and created in isolation to each other. Layers of technical advice and guidance have been applied to new buildings, which reduce the opportunity and flexibility of design and leads developers to rely on a small number of ’safer’ typologies and devices. These controls range from city-wide rules, like the abstract London Views Management Framework, to architectural detail like the BRE daylight guidance. Surely it is time to review these rules and question whether are they fit for purpose in order for us to move towards a denser London?
I’ve recently been working closely with Gordon Ingram, who’s company GIA have carried out some fascinating studies on existing daylight levels within some of London’s best-loved districts. These areas are full of life, character and charm but if they were to be assessed at planning stage using our current daylight methodology they would never have been built. It will be argued that the BRE guidance is simply that, however it
Sir Terry Farrell CBE
ABOVE: Kensington Court Mansions
takes an experienced and confident planning officer to capture the full opportunity and flexibility of its wording. Similarly, the distances between buildings in these areas go against the often quoted 18m face to face ‘rules’ of many development control officers. Our collaborative research with Savills is looking to establish that proximity is no barrier to quality or value. It is interesting, for example, that many of our most valuable streets in Kensington and Chelsea measure little more than 14m.
This has led me to looking again at some of the capital’s finest streets and the emerging thinking in respect to mansion block typologies, which give a tried and tested alternative to the formulaic perimeter blocks we see all too often these days. Mansion blocks by their nature have good percentage of ground coverage (I’m always questioning my design teams to tell me the footprint of our schemes) and this means that a site’s use can be optimised. An important factor considering less than 29 per cent of London’s brownfield
sites are larger than a hectare. In turn, we can build lower and more cheaply which is increasingly important in a cooling residential market. This approach goes against the rules though. Typically, as we increase densities, buildings get taller and further apart in their ‘search’ for daylight.
The mansion block typology is closer and tighter and through its architecture moves the debate into a more expansive discussion of quality and experience rather than one based on numbers. Its elevated ground level together with its heightened ceilings on lower floors creates a spatial experience that goes beyond its Sub-BRE daylight levels. Its angled bays change the orientation of its rooms relieving the face-to-face relationships between neighbours and asking more demanding questions of architects. It may seem ironic that in looking for ideas for the future, we are starting with the solutions of the past. But it is the long standing popularity, flexibility and ultimately value of these buildings that may hold all the clues. ■
BELOW: Bird’s Eye View of Marylebone –High Density, High Value & Tight Knit. Courtesy of Bing Maps
Advice
The Aim of the Society is to stimulate a wider concern for the beauty of the capital city, for the preservation of its charms and the careful consideration of its developments
WHY DO WE EXIST?
We believe that London's future must be shaped by contemporary culture as well as its rich and layered history
WHAT WE DO
Celebrate and enjoy the capital’s culture and architectural history. Debate how we plan a future that is beautiful, sustainable and fair
HOW WE DO IT
Engage Londoners with how the capital is designed and planned through tours, walks, talks and debates