Corn
Production Practice Rankings
2012
2013
2014
2015
2016
2017
2018
2019
2020
2021
10 yr Avg
10 yr ROI
1
Planting Date
67.6
99.6
94.2
41.8
97.3
47.0
36.4
100.2
72.9
127.7
78.5
$$$
2
Hybrid Variance
39.3
18.1
11.5
47.1
33.1
35.1
65.3
66.3
38.7
79.8
44.6
$$$
3
Solar Maximization
n/a
n/a
n/a
n/a
n/a
n/a
n/a
n/a
39.6
34.8
37.2
$$$
4
Nitrogen Rate
16.3
47.8
36.1
35.7
31.2
15.1
14.9
12.6
36.4
77.5
31.1
3.7
5
Crop Rotation Penalty
10.3
6.3
20.3
33.6
9.9
21.9
11.2
37.1
63
24.1
28.5
$$$
6
Strobilurin Response
51.7
13.4
14.3
21.2
27.2
17.0
24.8
46.8
32.6
36.8
27.3
4.7
7
Tillage System
n/a
n/a
19.7
15.0
19.5
18.8
22.1
19.8
38.3
52.1
25.7
7.7
8
P&K Rate
23.3
10.7
16.7
10.1
14.1
16.0
24.1
8.3
66.0
34.3
22.8
2.2
9
BRANDT Smart Trio
22.0
22.1
34.1
17.5
15.8
6.5
15.1
9.6
33.4
10.1
18.4
21.9
10
Population Rate
3.7
32.5
27.3
40.4
12.3
16.6
7.0
19.5
7.5
22.9
18.5
2.2
11
Row Width 20" vs 30"
n/a
n/a
n/a
n/a
10.8
4.1
36.5
36.0
6.8
13.7
18.0
$$$
12
Nitrogen Timing
n/a
23
20.5
7.6
16.3
2
21.7
0
30.4
17.1
17.3
$$$
13
Banding Nitrogen
n/a
13.0
15.4
22.9
11.9
20.9
n/a
n/a
n/a
n/a
16.8
$$$
14
Starter (28% + ATS at Plant)
4.0
11.1
13.6
13.6
13.4
6.7
21.3
15.5
18.8
29.1
13.8
4.9
15
Boron at Tassel
4.0
n/a
9.3
5.9
6.8
12.4
n/a
8.5
6.3
7.1
7.5
10.0
16
Zinc (1qt/ac)
8.1
4.6
20.7
5.0
1.2
4.1
4.1
5.8
7.4
3.9
6.9
5.9
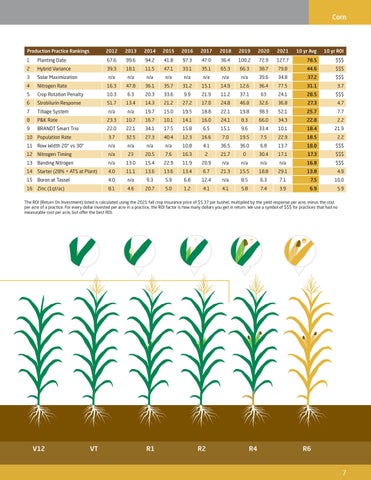
The ROI (Return On Investment) listed is calculated using the 2021 fall crop insurance price of $5.37 per bushel, multiplied by the yield response per acre, minus the cost per acre of a practice. For every dollar invested per acre in a practice, the ROI factor is how many dollars you get in return. We use a symbol of $$$ for practices that had no measurable cost per acre, but offer the best ROI.
V12
VT
R1
R2
R4
R6
7
