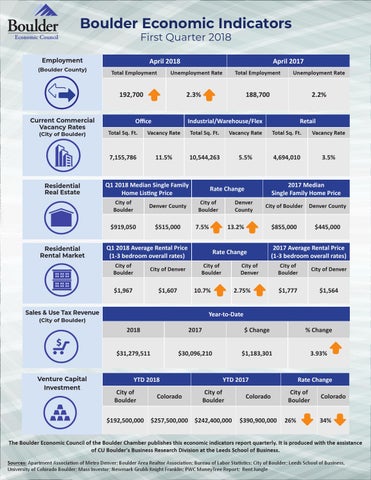
Boulder Economic Indicators First Quarter 2018 April 2018
Employment (Boulder County)
Total Employment
Unemployment Rate
192,700 Current Commercial Vacancy Rates (City of Boulder)
Residential Real Estate
Residential Rental Market
April 2017 Unemployment Rate
188,700
2.2%
2.3%
Office
Industrial/Warehouse/Flex
Retail
Total Sq. Ft.
Vacancy Rate
Total Sq. Ft.
Vacancy Rate
Total Sq. Ft.
Vacancy Rate
7,155,786
11.5%
10,544,263
5.5%
4,694,010
3.5%
Q1 2018 Median Single Family Home Listing Price City of Boulder
Denver County
$919,050
$515,000
City of Boulder
City of Denver
$1,967
$1,607
Denver County
7.5%
Q1 2018 Average Rental Price (1-3 bedroom overall rates) City of Boulder
2017 Median Single Family Home Price
Rate Change
City of Boulder Denver County
13.2%
$855,000
Rate Change City of Boulder
$445,000
2017 Average Rental Price (1-3 bedroom overall rates)
City of Denver
10.7%
Sales & Use Tax Revenue
2.75%
City of Boulder
City of Denver
$1,777
$1,564
Year-to-Date
(City of Boulder)
Venture Capital Investment
Total Employment
2018
2017
$ Change
% Change
$31,279,511
$30,096,210
$1,183,301
3.93%
YTD 2018 City of Boulder $192,500,000
Colorado
YTD 2017 City of Boulder
$257,500,000 $242,400,000
Colorado $390,900,000
Rate Change City of Boulder 26%
Colorado 34%
The Boulder Economic Council of the Boulder Chamber publishes this economic indicators report quarterly. It is produced with the assistance of CU Boulder’s Business Research Division at the Leeds School of Business. Sources: Apartment Association of Metro Denver; Boulder Area Realtor Association; Bureau of Labor Statistics; City of Boulder; Leeds School of Business, University of Colorado Boulder; Mass Investor; Newmark Grubb Knight Franklin; PWC MoneyTree Report; Rent Jungle