Findings A total of 1393 trail users were surveyed throughout the eight trails in Indiana participating in the study. While the 2017 Indiana Trails Study did use a new survey instrument, many of the questions were similar to those of the 2001 survey. When possible, comparisons were made between both studies to examine changes in trail use patterns and attitudes in the intervening 16 years. The B-Line Trail did not participate in the 2001 Indiana Trail Study, therefore all comparisons between the studies in this report are study wide.
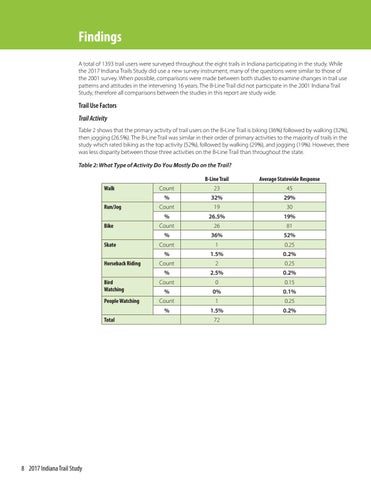
Trail Use Factors Trail Activity Table 2 shows that the primary activity of trail users on the B-Line Trail is biking (36%) followed by walking (32%), then jogging (26.5%). The B-Line Trail was similar in their order of primary activities to the majority of trails in the study which rated biking as the top activity (52%), followed by walking (29%), and jogging (19%). However, there was less disparity between those three activities on the B-Line Trail than throughout the state. Table 2: What Type of Activity Do You Mostly Do on the Trail? B-Line Trail
Average Statewide Response
Count
23
45
%
32%
29%
Run/Jog
Count
19
30
%
26.5%
19%
Bike
Count
26
81
%
36%
52%
Count
1
0.25
%
1.5%
0.2%
Count
2
0.25
%
2.5%
0.2%
Bird Watching
Count
0
0.15
%
0%
0.1%
People Watching
Count
1
0.25
%
1.5%
0.2%
Walk
Skate Horseback Riding
Total
8 2017 Indiana Trail Study
72