BLAINE COUNTY CLEAN ENERGY MODELING & FEASIBILITY ANALYSIS


PREPAREDBY BRENDLE GROUP FUNDEDBY BLAINE COUNTY AND THE CITYOF KETCHUM
TECHNICALASSISTANCE ACKNOWLEDGEMENT ICLEI USA


PREPAREDBY BRENDLE GROUP FUNDEDBY BLAINE COUNTY AND THE CITYOF KETCHUM
TECHNICALASSISTANCE ACKNOWLEDGEMENT ICLEI USA


5B CAN is Blaine County’s Sustainability and Climate Program. Ledby Blaine County and the cities of Ketchum and Hailey, 5B CAN engages the cities of Bellevue,Carey, andSun Valley as well as the community — local nonprofits, institutions, businesses, and residents.
It embodies aspirations for a sustainable and resilient community —one that tackles the challenge of climate change andalso elevates the quality of life for allresidents and visitors, today and well intothefuture. It isa partnership that builds on past accomplishmentsand createsa new era of collaboration.
5B CAN focuseson creating acommunity where the health of residentsand visitors and the health of theenvironment are viewed as inextricably linked priorities; where an innovative andresilient economy promotes green jobs stemming from sustainability and climate solutions; and where diversity, equity and inclusion are valuedto ensure all residents
benefitfromopportunities and participation in the community.
As part of the climate action planning process, Blaine County collaborated with the cities in the WoodRiver Valley and with ICLEI USA to inventory greenhousegas(GHG) emissions.The inventory was basedon 2018 data.
The GHG inventory found that in 2018 Blaine County municipalities,businesses, residents, and visitors were responsible for emitting 336,107 metric tons of carbon dioxide equivalent(CO2e). In comparison to emissions data from 2007, total community-wide emissionswere 71 percent higher in 2018.
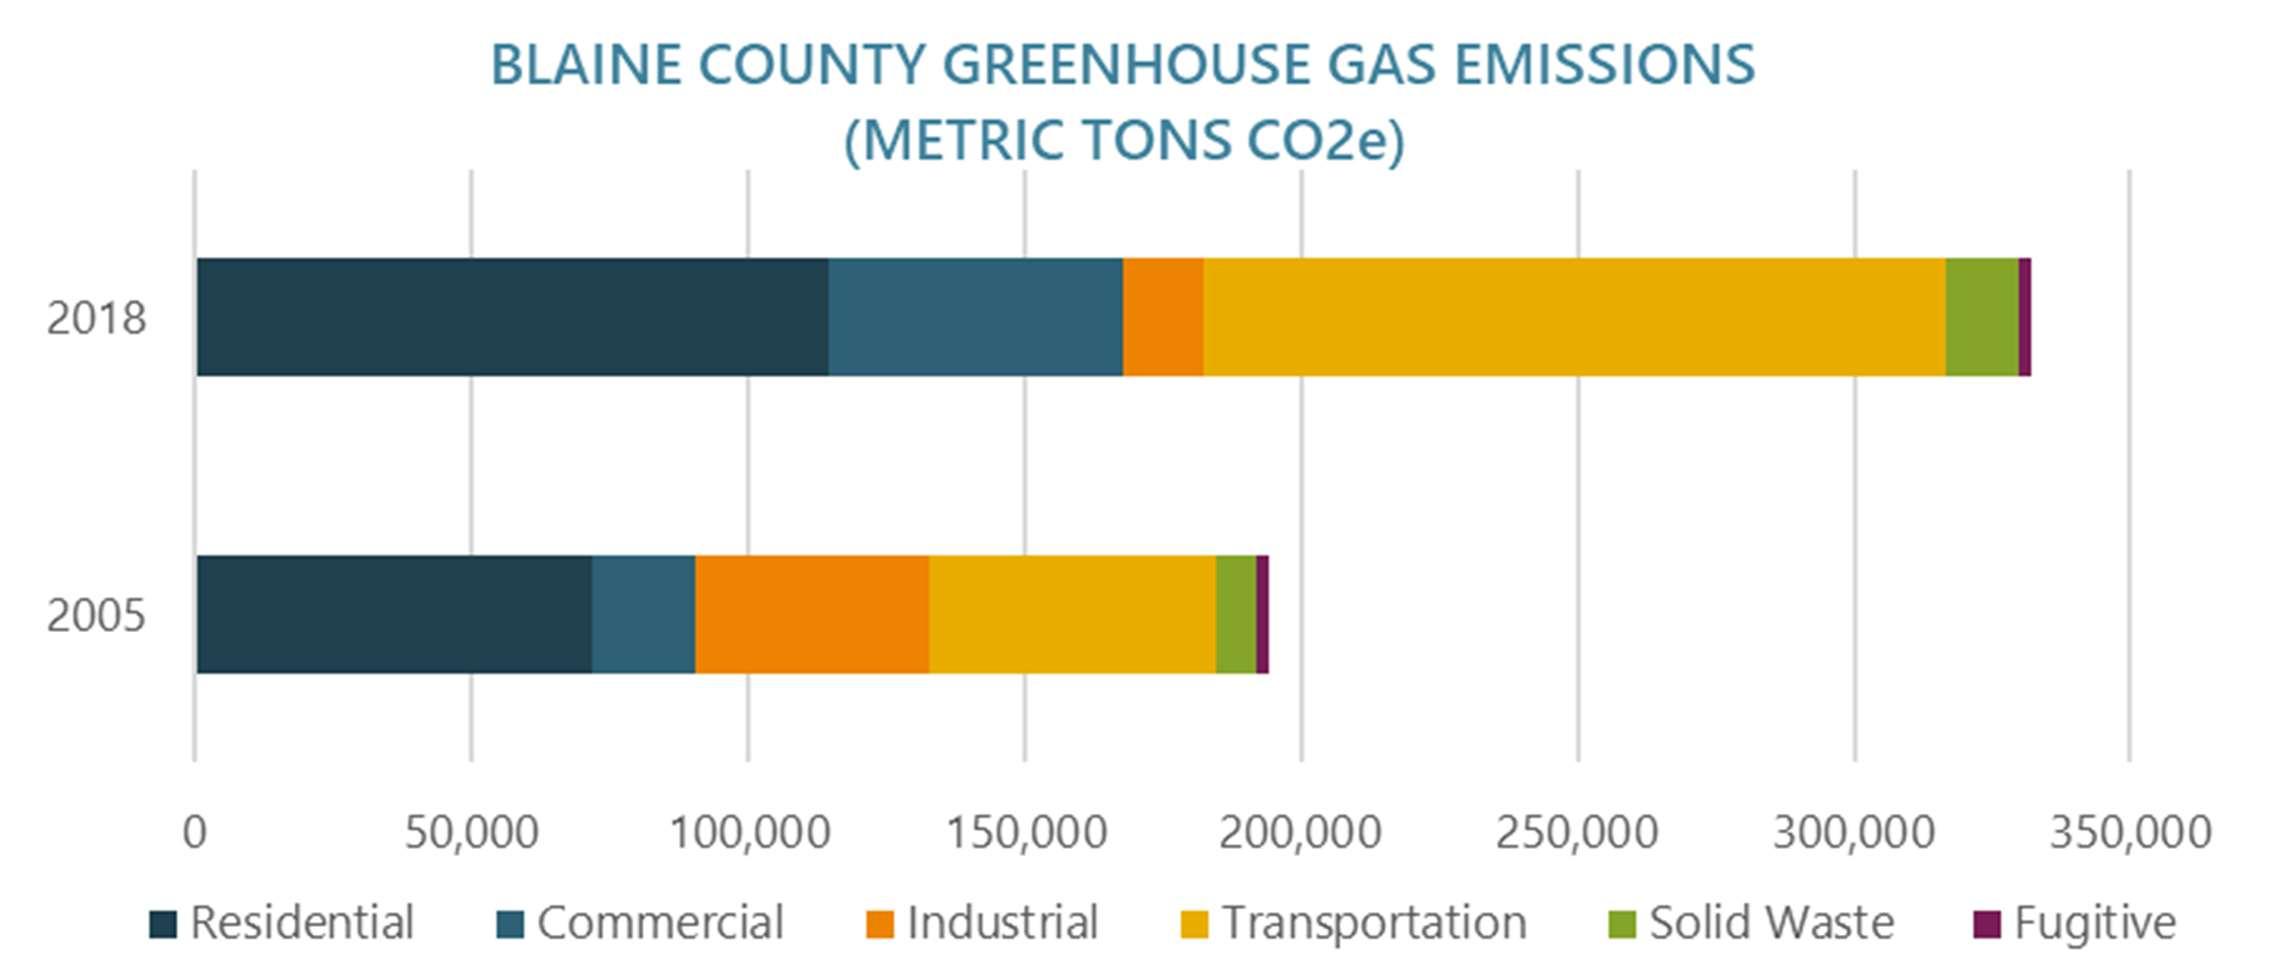
The single largestcontributor was the transportation sector which accountedfor 40 percentofemissions. The next largest contributorwasresidential buildings energy with 34percentof emissions. Commercial and industrialbuildings energy contributed nearly 20percent of emissions.
Together,transportation and thebuilding sector representednearly 95 percent of total emissions.Actions to reduce emissionswill necessarily focuson thesetwo sectors.
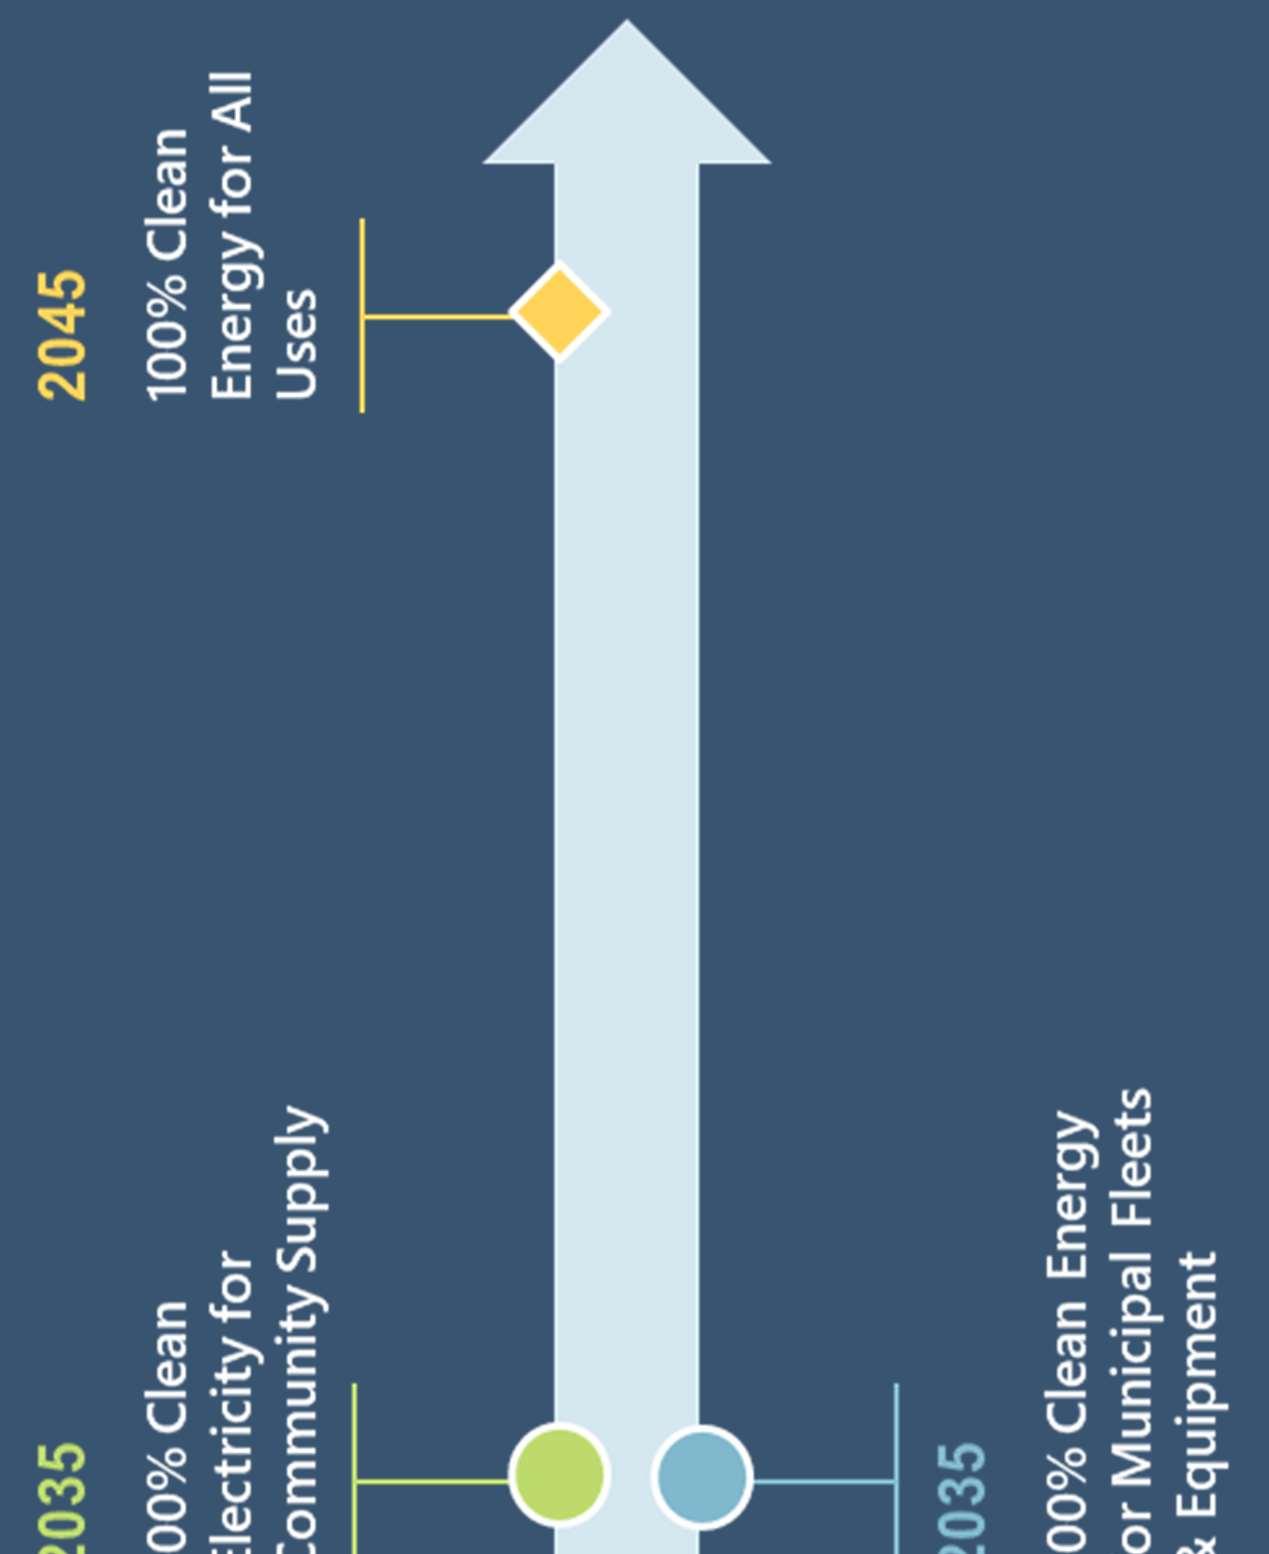
In fiscal year 2021, elected leaders in BlaineCounty and thecities of Bellevue, Hailey, andKetchumunanimously adoptedambitious clean energy goals. The clean energy goals reflectthe urgency of the climatecrisis, and the need to transform the energy,building,and transportation sectors.
The community’s leaders recognizedthat investments in clean energy would bring economic opportunities and new jobsto the community. The goalsalso aligned with local priorities that value clean air and water, land and wildlife conservation, and public healthand community wellbeing.
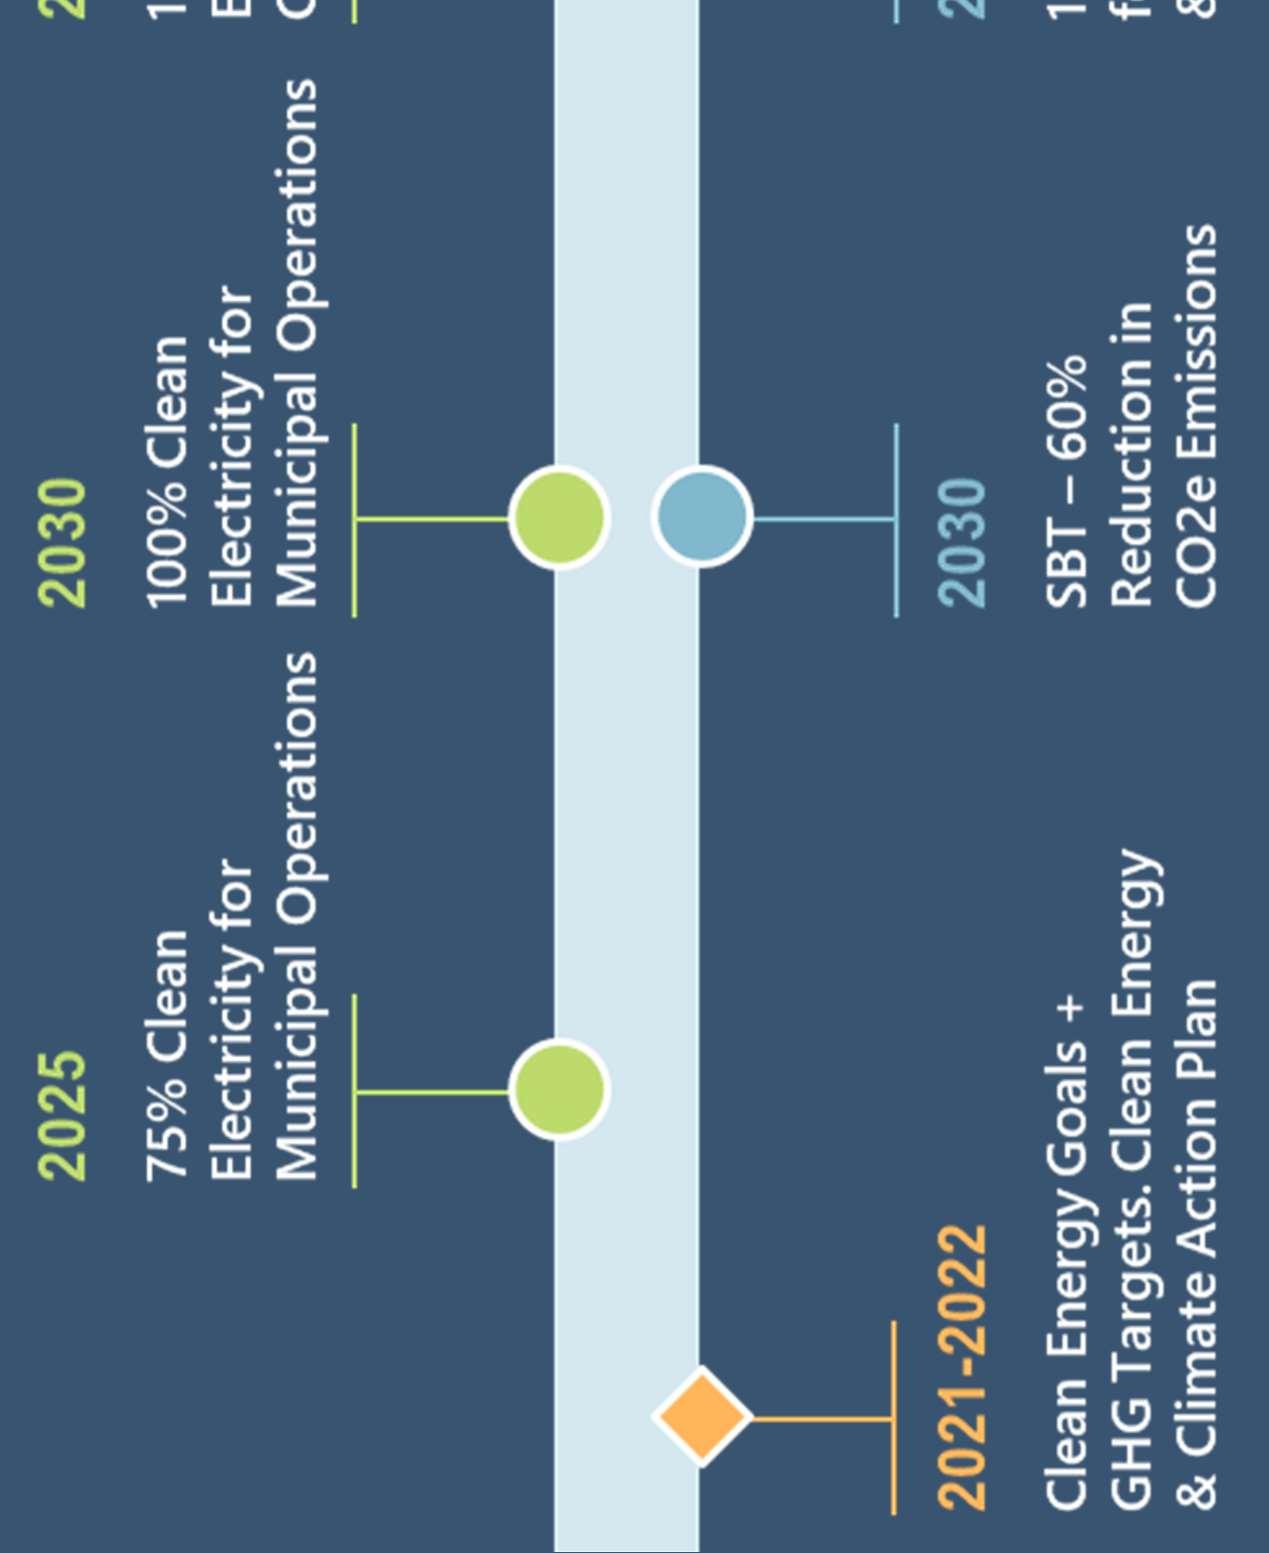
75% by 2025 for municipal electricity use.
100% by 2030 for municipal electricity use.
100% by 2035 for community-wide electricity supply.
100% by 2030 for municipal fleets and equipment as feasible.
100% by 2045 for all energy uses.
Alignmentof clean energy goals with the ParisClimate Agreement was needed to better enablethecommunity to transition to a low-carbon and climate resilient future. This can be accomplished by adopting emission reduction targets in addition toclean energy goals. Blaine Countysought assistancefrom ICLEI USA, which led the county andcitiesof Haileyand Ketchum to join ICLEI USACITIESRACETOZERO.
Throughthis program, ICLEI USAprovidedtechnicalassistance in twokey areas: 1) calculation of BlaineCounty’s Science-Based Target (SBT)and 2)a clearlydefinedand data-drivenpathway forachieving the SBT.
Science-based targets align with the most current climate science and represent eachcommunity’s fair share of ambition necessary to limitglobal warmingbelow 1.5degrees Celsius. Because the United States is the second highest emitter of climate pollution, U.S.communities are called on to reduce emissionsby more than 50 percent.
ICLEI USA calculated Blaine County’s 2030 science-based emissions reduction targetand community-wide carbondioxide equivalent (CO2e) emissions budget in metric tons. TheSBT and GHG emissionsbudgetarebasedonScope 1 andScope 2emissions thatoccur within thecounty’s boundary –direct emissionsand emissionsfrom grid-supplied energy.
Clean energy comes from renewable, zero emission sources that do not pollute the atmosphere when used including energy saved through efficiency measures.
Climate change is a longterm change in the average weather patterns that have come to define Earth’s local, regional and global climates.
Equity means fair and just practices and policies that ensure all community members can thrive.
Global warming refers to human-produced temperature increases observed in Earth’s climate since the early 20th century primarily driven by fossil fuel burning, which increases heat-trapping GHG levels in Earth’s atmosphere, raising Earth’s average surface temperature.
Renewable energy relies on fuel sources that restore themselves over short periods of time and do not diminish including the sun, wind, moving water, organic plant and waste material, and geothermal.
Resilience means the ability to endure and recover from stress and shock.
Sustainability means development that meets the needs of the present without compromising the ability of future generations to meet their own needs.
USA applied
Framework to
a pathway for Blaine County toward
Implementation of a
and
the
of
measures offersa
reductionof 122,025 MT CO2e. Additional
are needed to achieve additional GHG


of 65,159MTCO2e by 2030.


Blaine County hired Brendle Group to conducta thorough analysisof thehigh-practices, performance measures,and science-based targetcalculated by ICLEI-USA. The county’s objectiveswere to lend assurance of achievability and to createa roadmap that is anchored in local data and reflectiveof community priorities.
The scopeof this analysis included:
Gather local datato forecast GHG emissions,changes inenergy demand, and utility transition to clean energy
Evaluate feasibility of achieving high-impact strategiesand performance measures
Analyze the rangeof achievement potential based on implementation tactics
Gather stakeholder input and adjust performance measuresbased on local conditionsand buy-in
Themagnitude of each strategy’s impactwas evaluated from a top-down andbottom-up perspective from continuingcurrentefforts versus striving for best-in-class results. Assumptions for the defined currentcourse and best-in-class actions are summarized in each section. The evaluations andrecommendations assumed one setof universally applicable county-wide goals andtargets.
The impacts for each strategy were aggregated and compared to abaseline GHG and energy forecastto determine whether the clean energy goals and SBT couldbe achieved.A high-level cost analysiswascompleted to gauge the benefitsand tradeoffs for each strategy.
This analysis evaluatedtheinitial high-impact strategiesprovidedby ICLEI USA. Brendle Grouprecommended arefined approach for some strategies to betteralign with local conditionsand data. Theanalysis establisheda rangeof potential CO2ereductionsfor each strategy based on implementation tactics. The
low end of the rangeassumes the countywould continuewith current level of effort;the top end of the range assumesthe county will strivefor ambitious, best-in-class results. Details associatedwith the rangeof GHG reductions and comparison to the level of ambition neededto meet goalsand targetscanbe found in the ENERGYSUPPLY,BUILDINGS,and TRANSPORTATION sections of this report.
Brendle Group was selected basedon similar energy planning work completedfor other communities, including a member of the City of Boise’s team that developed Boise’sEnergy Future: ACommunity-wide Energy Plan.
Brendle Group is aColorado-based consulting firm thathelpsclients solve complex sustainability challengesthrough practical planning, robust engineering andanalysis, and actional implementation.Thefirm focuseson creating lasting impacts using innovative solutions to supporttheirclients’bottom-line goals, addressing immediate localizedneeds, and creating lasting global impact.


The analysis utilized the 2018 Blaine County GHG inventory to establish abaseline for the primary sources of emissions in the region. The county had apopulation of just over 22,000 residents in 2018. Residents and businesses are located in unincorporated Blaine County and the cities of Bellevue,Carey,Hailey, Ketchum, and SunValley.
While a small, rural community, the county hostsnearly 400,000 unique visitors each year.
Tourismrepresents 65percent of the county’s economic activity measured in gross domestic product. The county covers a total land areaof over 2,600 squaremiles.
The county’s total GHG emissions in 2018were 336,107 metric tons of carbon dioxide equivalent(MT CO2e). The largest sourcesof emissionsweretransportation-related fuels at 40percent, electricity at 32 percent, andnatural gas and propane at 23 percent.
The GHG inventory did not include emissions from air travel. Because of the dynamic nature of GHG emissions associated with air travel and aircraft, the Friedman Memorial Airport (SUN) conducted a separate inventory using an airportspecific methodology from the National Academy of Sciences to assess airport-related emissions. SUN completed its inventory in March 2022 utilizing 2020 data. Airport-related emissions not captured by Blaine County’s GHG inventory was estimated to add approximately 21,344 metric tons of emissions to the transportation sector increasing transportation emissions to 44 percent with aviation responsible for 6 percent and other transportation sources responsible for 38 percent.
This feasibility analysis did not incorporate emissionsfrom aviation both becauseSUN’s GHG Emissions Inventory wasnot availableuntil May 2022 and reduction in aviation emissions is outside thepurview of the county and cities.

TheAirportiscommittedtosupportinglocalandregionaleffortsto improveclimateresilience.AsastakeholderoftheRegional Sustainability&ClimateAdvisoryCommittee,theAirportwillworkwith localandregionalpartnerstofacilitatealignmentonclimategoalsand collaborateonkeystrategiestoimproveresilience.Further,theAirport willusethisGHGemissionsinventoryasabaselinetoconsiderand implementappropriateinitiativestoreduceSUN’scarbonfootprint andincreasetheoverallsustainabilityoftheAirportandcommunity. Tolearnmorevisithttps://iflysun.com/greenhouse-gas-emissions/.

Resultsof the 2018 Blaine County GHG inventory (BlaineCounty, 2021). The highest contributing sectorswereresidential energy at 34percent, on-roadtransportation gasoline use at 28 percent, commercialand industrial energy at 18 percent, and on-road transportation diesel use at 12percent.
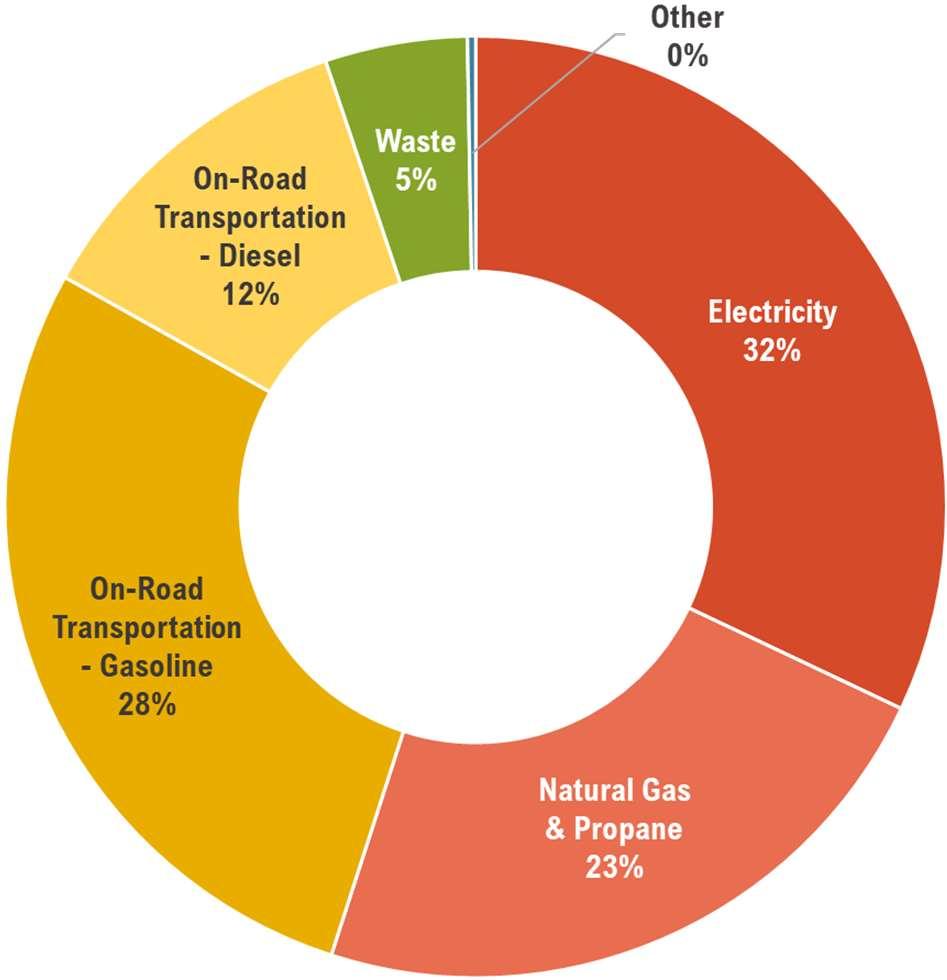
The emissions sources labeled as “Other” includedelectricity emissionsassociated with irrigationpumpsand fugitive natural gas emissionsattributed to leakage ratesat production areas, alongtransmissionand distribution systems, at gas meters, andwithin residentialand commercial buildings. These other emissions sourcesaccount for 3percent of the county’s overall emissions. Theywere consideredunder relevant strategiesbut were not consideredmaterial and thereforewere not specifically addressed in the results.
In addition to the 2018 Blaine County GHG inventory,the analysisreviewed the estimated 2018emissions reportedby thecitiesof Hailey, Ketchum,and SunValley.
Note that SUN’s aviation-related emissions are not reflected in the City of Hailey or Blaine County transportation emissions. If added, transportation-related emissions would increase by 21,344 MT CO2e.
The strategies inthis analysis specifically addressbuilding energy emissionsand on-road transportation fromdieselandgasoline vehicle. Building emissions for commercial and industrialbuildings are groupedtogether.
The 2018 Blaine County GHG inventory didnot delineate estimatesfor emissions from the supply of potablewater, wastewater treatment, and solidwaste,whichcombinedaccount for 5 percentofoverall emissions.
The 2018 emissions by jurisdictionand sector highlightsdifferences between communities. Excluding aviation emissions, the largest sourcesof emissions in Hailey are building energy useat 62 percent followed by transportation at 30 percent. In Ketchum, 50 percentofemissions are from the residential building sector. Sun Valley’s primary emissions source istransportation at 41 percent followed by residential energy use at 39 percent.
Thefollowing table displays sector emissions for each jurisdiction.
TRANSPORTATION 133,981 21,284 10,923 27,144
COMMERCIAL ENERGY 53,356 20,775 23,455 6,012
INDUSTRIAL ENERGY 7,847
2,299 5,533
RESIDENTIAL ENERGY 114,402 23,918 40,024 25,353 SOLID WASTE 17,292 3,456 1,870
WATER & WASTEWATER 40 1,404
ELECTRIC IRRIGATION 6,799
PROCESS & FUGITIVE EMISSIONS 2,390
TOTAL 336,107
PERCENTTOTAL
Analysis established abusiness-as-usual(BAU) forecastof GHG emissions based on the 2018 inventory as the baseline.The BAUforecast runs through 2050. Detailed assumptions for the data analysis are captured under the ENERGYSUPPLY, BUILDINGS,andTRANSPORTATION sections of this report.
The BAUprojection assumes emissions factors for fuel, electricity, and natural gas will remain constant. Each emissions source was scaled by a specificgrowthrate: population, employment, or natural gas use. Basedon projectionsfor 2019-2029 from the State of Idaho SouthCentral District 5, population is estimatedto grow by 1percent annually. District 5 includes the counties of Blaine,Camas, Gooding, Lincoln, Jerome, Minidoka, Twin Falls, and Cassia.
79,913
The population growthrate was appliedto the following emission sources:
Electricity – Residential
Natural Gas –Residential
Propane –Residential
On-RoadVehicle Transportation – Gasoline
SolidWaste Disposal
The employment growth rate was estimated to be 2percent annually.This rate was calculated by averagingthe annual percentchange in the number of people employed in BlaineCounty from 2017 through 2021 using availabledata from the U.S. Bureau of Labor Statistics (Data Commons, 2022).
The employment growth rate wasappliedto the following emission sources:
Commercial
Gas
Gas
Commercial
Industrial


Vehicle Transportation –Diesel
The BAUforecast assumesno new actionsby consumers and nochange tocurrentpolicies. Aviation, solidwaste disposal, and wastewater treatment emissionswerescaledbut strategies associatedwith these emission sourceswere not evaluated. Only strategiesidentified in support of the clean energy goalswere within that scope of this report.
Natural gas fugitiveemissionswere estimated based on growth in natural gas usage.
Basedon populationandeconomic growth rates, the GHG emissions in Blaine County are expected to grow by 56percent between 2018 and 2045 if no efforts were made toreduce emissions.Emissions sources willcontinue to rise from energy use in homes and buildings and fromon-road transportation vehicles.


Energy use in theform of electricity and fuelsgenerate 90 percent of countywide GHG emissionsand will continue to dominatethe county’s carbon footprint through the report planning horizon. Therefore, the high-impact strategies outlined in this report focus on energy use in buildingsand transportation.
For perspective, the total county spending on energy wascalculatedfor the baseline year of 2018. Residents, businesses and visitors spent $52.6 million on energy and fuelfor homes,buildings,andvehicles. These expendituresare expectedto grow to $77.2 million by 2045 based on the BAU energy useforecast andprojected energy costs (U.S.Energy Information Administration, 2022).
The socialcost of carbon, an indirectcost, is a metric that estimatesthe economic damages thatresult from emittingone additional ton of carbon dioxide into the atmosphere(Interagency Working Group on SocialCost of GreenhouseGases, United States Government, 2016).Incorporating the socialcost of carbon into the projected energy costsunderthe BAU scenario increasesthe costs to $110.8 million in 2045.
The University of Idaho publishedthe Idaho Climate-Economy Impacts Assessment. The assessment was theresultof a nonpartisan effort toconnect Idaho business, nonprofits, and tribal, local, and stategovernment with the latest scientificresearch on Idaho’schanging climate. The assessment identifies both climate risks and opportunities and seeks to “inspire new collaborations, commitments andongoing forums to leverageresources, encourage
innovationsand spur investments in Idaho solutions.”


A few key findings from the economicanalysis:
1. Energy: Climate change islikely to increase summerenergy demand due to cooling needs,whichwill increasehomeand business energy costs.
2. HumanHealth:Critical health impacts will increasefrom extremeweather events such as fires andfloods,as well as an increase in
chronichealth issues such as asthma and vector borne diseases. The ability of rural Idaho communities to adaptmay be limiteddue to a low physician-to-patient ratio and availability of trauma beds.
3. Infrastructure: Increasing frequency of flooding and heavy rainfall will damage roads and bridges. In 2018, Madison County spent more than9.5 timestheannual road budget to repair damage fromflooding.
4. Land: Climate change impacts such as wildfire,bark beetle outbreaks, and droughts threaten to interrupt Idaho’s $2.4 billion timber harvest industry and $1.8 billion livestock industry.
5. RecreationandTourism: Tourism supports over 100,000 jobs andadds $3.7 billion to Idaho’s economy. Climatechange impacts suchas decreasing snowpack, reduced streamflow and increasedwater temperature, and wildfiresthreatento disrupt recreationand tourism. For example, the opening day for the Bogus Basin ski area has been movingto later in theyear. Theopening date in 2018wasa month later than itwas in 1969.
6. Agriculture: Impacts will vary by region and crop type.


Basedon the initial high-impact strategies provided by Blaine County, the table below lists the recommendedhigh-impact strategies and
performance measuresgrouped into three categories:ENERGYSUPPLY,BUILDINGS, and TRANSPORTATION
E1: REDUCE GRID CARBON INTENSITY 80% by 2030.
E2: SWITCH TO CLEAN ENERGY FOR MUNICIPAL ELECTRICITY USE 75% by 2025 and 100% by 2030.
E3: EXPAND LOCAL, DISTRIBUTED RENEWABLE ENERGY RESOURCES 22% annual growth in generation capacity through 2030.
E4: PROCURE UTILITY-SCALE RENEWABLE ENERGY 74,600 to 197,900 MWh by 2030. (Range depends upon highimpact strategies implementation and performance achieved.)
B1: EVALUATE ENERGY EFFICIENCY GAINS FROM BUILDSMART CODE Ensure BUILDSMART energy code results in energy efficiency gains for residential buildings.
B2: REDUCE CARBON FOOTPRINT OF EXISTING COMMERCIAL BUILDINGS 1% of existing square feet (SF) meets 2018 IECC efficiency standards and 1% are all-electric by 2030.
B3: REDUCE CARBON FOOTPRINT OF EXISTING RESIDENTIAL BUILDINGS 1% SF meet IECC 2018 efficiency standards, 20% reduce EUI* by 20% from 2018 baseline, and 11% are all-electric by 2030.
B4: LOW-CARBON COMMERCIAL NEW CONSTRUCTION All new buildings will meet 2018 IECC requirements and are allelectric.
B5: LOW-CARBON RESIDENTIAL NEW CONSTRUCTION All new buildings will meet 2018 IECC requirements and are allelectric.
T1: REDUCE VEHICLE MILES TRAVELED (VMT) 4% total reduction in VMT by 2030.
T2: INCREASE ON-ROAD EV ADOPTION 30% VMT by electric vehicles by 2030.
T3: TRANSITION TO CLEAN MUNICIPAL FLEETS AND EQUIPMENT 100% clean fleets by 2030 and equipment by 2035.
NOTE: Energy Use Intensity (EUI) expresses a building’s energyuse as a function of its size or other characteristics. (ENERGY STAR, https://www.energystar.gov/buildings/benchmark/understand_metrics/what_eui)
Each strategy was evaluated basedon the potential impactonthe reductionof energyrelated GHG emissionsand whether the strategy contributed to the statedclean energy goals. Of the strategies evaluated,fivewere highlighted ashaving a medium to high levelof impacton theCounty’s GHG emissionsas definedby the 2018 baseline.
Cost effectivenesswasdeterminedby evaluating potential energy cost datafrom the U.S. Energy Information Administration and


high-level assumptions on return on investment (ROI) basedon publicly available studies(U.S. Energy Information Administration, 2022).
The relationshipbetweenthe potential mitigation impactand thecost effectivenessof each strategy is mapped in the Cost-Impact Priority Matrix.Details onthe magnitude of potential impactfor eachstrategy andcost analysis can be found in the ENERGYSUPPLY, BUILDINGS, and TRANSPORTATION sections of this report.
LOW Low ROI <
Cost Neutral 2 to <5%


High

The table below summarizes whether Blaine County and thecities of Bellevue,Hailey and Ketchum will beabletoachieve sharedclean energy goalsbased on the recommendedhighimpact strategies and additional measuresas
identified. Details on the analysisof the energy supply mix neededto supportthesegoals and the associated serviceproviderscan befound in the ENERGYSUPPLY section of thisreport.


Achievable through a combination of grid-supplied clean electricity and municipal participation in a renewable energy program, green energy tariff, or purchase of renewable energy credits (REC). Cost to meet goal will be dependent on Idaho Power (IPCO) meeting its 2021 Integrated Resource Plan (2021 IRP) emission reduction targets (Idaho Power, 2021). Details on meeting this goal are outlined in section E2: SWITCH TO CLEAN ENERGY FOR MUNICIPAL ELECTRICITY USE.
Achievable through a combination of grid-supplied clean electricity and municipal participation in a renewable energy program, green energy tariff, or purchase of RECs. Cost to meet goal will be dependent on IPCO meeting its 2021 IRP emission reduction targets. Details on meeting this goal in section E2: SWITCH TO CLEAN ENERGY FOR MUNICIPAL ELECTRICITY USE
Achievable through a combination of grid-supplied clean electricity, local renewable installs, and community-wide participation in an available renewable energy program. Cost to meet goal will be dependent on IPCO meeting its 2021 IRP emission reduction targets. Details on meeting this goal are outlined in section E4: PROCURE UTILITY-SCALE RENEWABLE ENERGY.
The 2021 IRP set a goal for 100% clean grid-supplied electricity by 2045. Intermountain Gas Company filed a request for access to renewable natural gas for distribution but is not currently proposing purchasing this commodity due to high costs (Intermountain Gas Company, 2022). The development of 100% renewable natural gas will be dependent on market demand and industry advancements. The best-in-class scenario forecasts a reduction in natural gas usage of 79% by 2045. Analysis considered potential impacts to natural gas consumption from building electrification strategies. Assumptions detailed in sections B2 / B3: REDUCE CARBON FOOTPRINT OF EXISTING COMMERCIAL / RESIDENTIAL BUILDINGS and B4 / B5: LOW-CARBON COMMERCIAL / RESIDENTIAL NEW CONSTRUCTION.
Best-in-class scenario for transportation strategies forecasts more than 50% reduction in vehicle miles traveled. Even with full implementation, the county would not be able to meet the transportation sector goals. Transportation strategies will take time to implement and are highly influenced by technological developments and consumer behavior. Assumptions detailed in TRANSPORTATION section. A pathway for achievement is to purchase carbon offsets. However, cost may be prohibitive (estimated at over $2M for 2045 based on best-in-class implementation for all strategies and a current offset cost of $16.25/tonne). (Carbonfund.org, 2022)

For each strategy,the magnitudeof impactwas evaluated against the SBT– a 60 percent reduction in Scope 1and 2emissionsby 2030 from the 2018 GHG inventory baseline,or 187,184 MT CO2e. Thewedgediagrambelow shows the BAU GHG emissions forecastand the relative contribution to emissions reductions over the time horizon foreach strategy. The dotted line illustrates theSBT.
The analysis assumes abest-case scenario in which all strategies are implementedat abestin-class level. Under this scenario, the county can reach 78 percent of emissionsreduction towardthe SBTwith a gap of just over 60,000 MT CO2e needed. Decarbonizing the grid, increasing on-roadEV adoption, and improving energy efficiency and building electrification standards for existing residential buildings were
the most impactful strategies for reducing GHG emissions. Procurement of utility-scale renewableenergy wasaddedto the evaluation to minimize the gap toward the SBT. The range of mitigation impact andcost associated with procuring renewable energy through autilityscaleprogram will bedependentonthe cumulativeperformance achieved inthe execution of all of the high-impact strategies.
This analysis acknowledges that while common high-impact strategieswere evaluated, other strategiescouldbe identified that would address the gap, andfuture analysis may be required.Details around each strategy’s contribution to meeting the 2030 SBT can be found under thefocus area sections in the report:ENERGYSUPPLY,BUILDINGS, and TRANSPORTATION


In 2018, energy usage in the county wasover 2,640,000 MMBtu, with 53percent of usage from naturalgasand propane sources and 47 percentfrom electricity. Residential energy usage represented 63percent of the total,with commercialand industrialusage accounting for 37percent.
2,640,009 MMBtu
Residentialconsumption of naturalgas and propane represented 63percentof the total 1,400,700 MMBtu used in 2018. Intermountain Gas Company (IMG) is theprimary provider of natural gas for BlaineCounty. Estimates for natural gas usagewere based on information receivedfrom IMGfor Ketchum,Hailey,Sun Valley, and Bellevue. Natural gas estimates associatedwith Careywere considered de minimisand not includedin the BlaineCounty totals. Propane was provided by AmeriGasfor residents and only represented two percent of total usage.
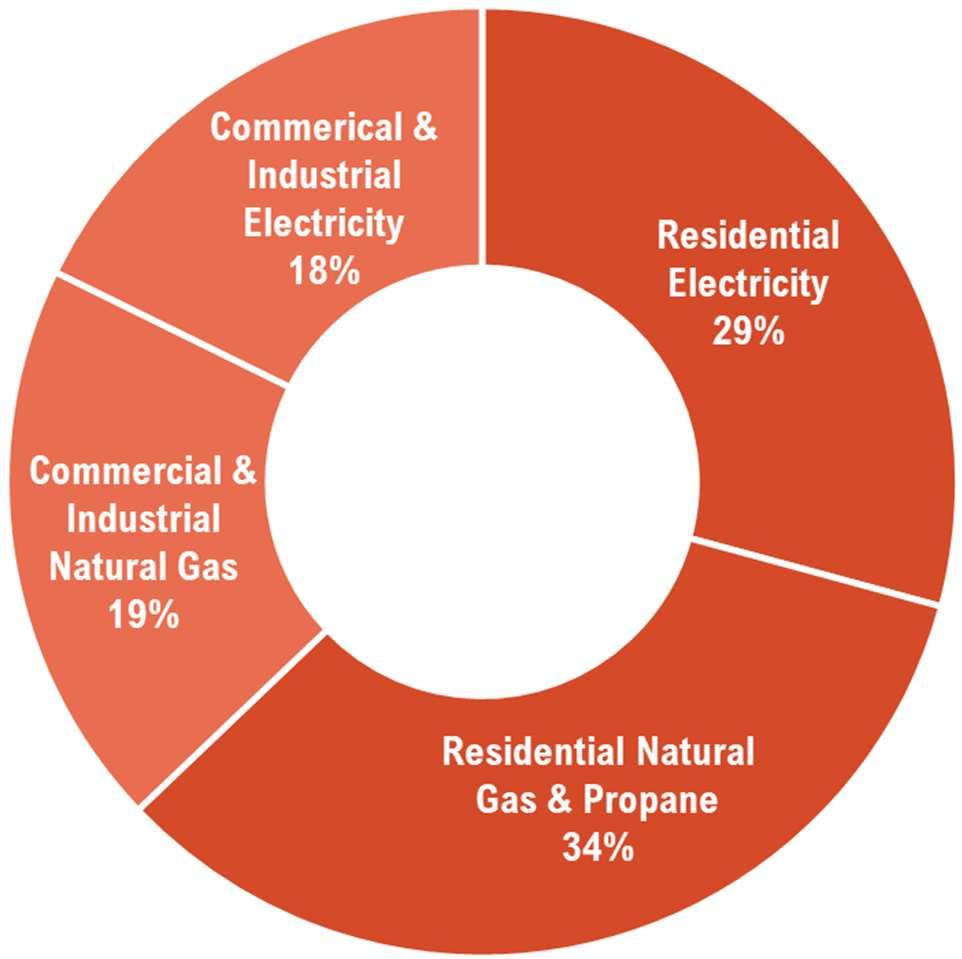
Energy losses along transmissionand distribution systems for electricityor natural gas were not included in the 2018 energy use by sector totals.However, theBlaine County 2018 GHG inventory did acknowledgefugitive natural gas emissions -attributedtonatural gas leakage alongproduction areas; transmission and distribution systems;at gas meters; and evenwithin residential and commercial buildings -of over 2,000 MT CO2e.
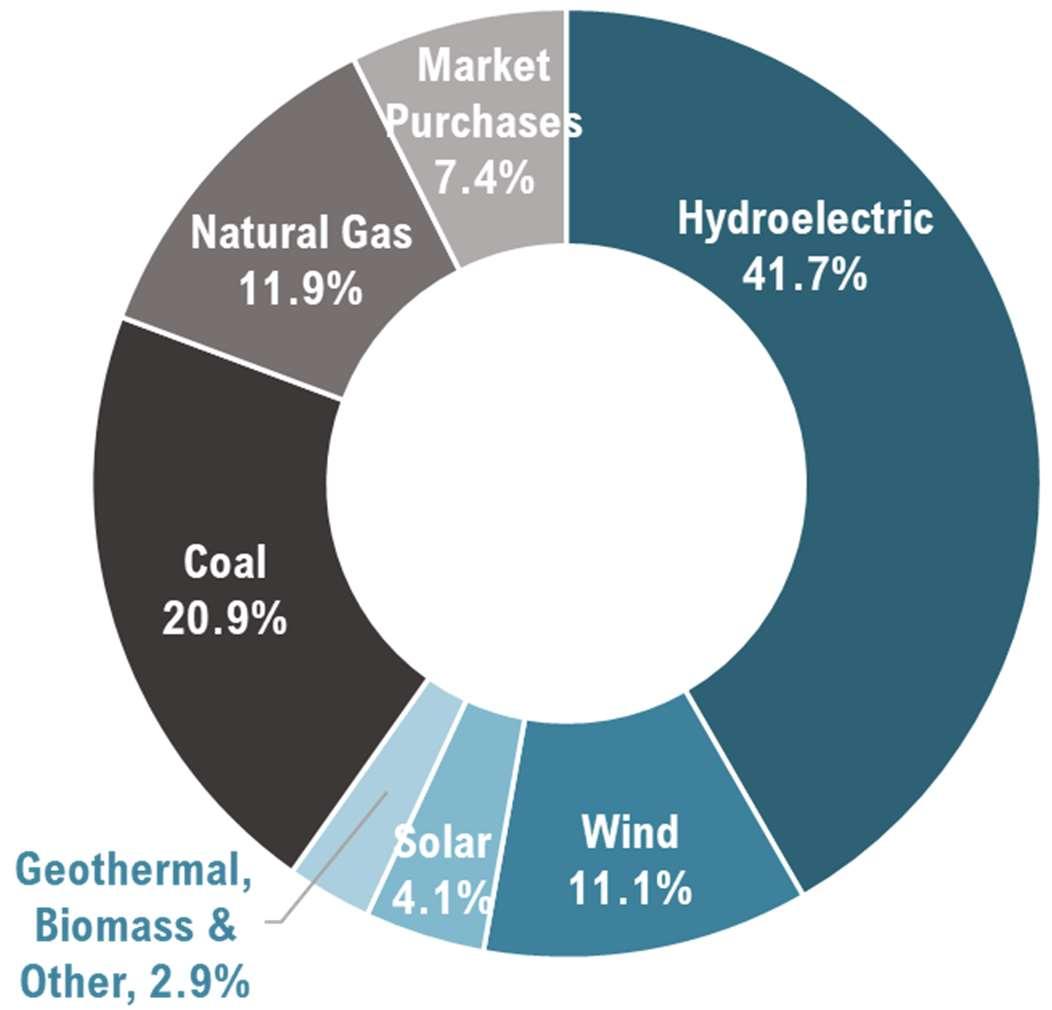
In 2018, electric usage totaledover 1,200,000 MMBtu, with 62percent of electricity being consumedby residents. BlaineCounty is supported by two electricserviceproviders: Idaho Power and Salmon River Electric Cooperative. Idaho Power provides 99percent of the total electricrequirements for the county.
According to Idaho Power’s 2020ESG Report, approximately 60 percentof Idaho Power’s portfolio of resources is considered clean - with a statedgoalofachieving100 percent clean energy by 2045 (Idaho Power, 2020).
Idaho Power’s portfolio of resources is not representative of the actual energy mix delivered to BlaineCounty, as the company currently sells its renewable energy credits. The sale transfers the legal rights to claimuse of the renewableenergy generation to thebuyer (Idaho Power, 2021).
In addition, Idaho Power’sportfolio mix is dependent on normal water conditions,average temperatures, and forecastedcustomer demand. Idaho Power has experiencedyears with lower water levelsand higher expected demand. Underthese conditions, use of hydroelectric generation has declinedand fossil fuelgeneration has increased which resulted in
higher-than-expectedCO2 emissions. In fact, Idaho Power’s publishedactual emissions factorsfor 2019 and 2020 were higher than the 2018baseline due todrought and above normal customerdemand. (Idaho Power, 2021)

Salmon River Electric Cooperativeprovides one percentof Blaine County’s total electricity requirements. Itdoes notown generation and suppliesconsumers entirely with electricity procuredthrough awholesale market. Limited information is availableon Salmon River’s purchasing strategy andwhetherthe cooperativeprocuresclean energy resources.
NOTE: An emission factor (EF)is a coefficient that describes the rate at which a given activityreleases greenhouse gasesinto the atmosphere. (Climatiq, https://www.climatiq.io/docs/ guides/what-is-an-emission-factor)
The chartabove illustratesthe impact ranges for ENERGYSUPPLY strategies in 2030 as comparedtothe BAU forecast. The top bar represents the projected Scope 1 and 2BAU electric and naturalgas emissions in 2030 if no actionsare taken. The bars adjacent to each strategy show the rangeof potential impact. Strategy E2 is not displayed in the chart because municipalusage is included in the total energy emissions evaluated under strategy E1. A detailedanalysisof municipalusage is captured in section E2: Switch to Clean Energy for Municipal Electricity Use.
Analysis identified griddecarbonization as the highest impactopportunity for reducing GHG emissions.Themodelprojected amaximum impactof allENERGYSUPPLY strategiesof 62 percentof 2030 BAU energy emissions –equivalentto a 37 percent reduction of all forecasted BAU totalcommunity emissions. The rangeof impact will bedependent upon on IPCO ability tomeet its emissions targets.
Analysis was basedon forecasted emissions reductions noted in Idaho Power’s 2021 IntegratedResource Plan (IRP) and commitmentsnoted as short-, medium-, and long-termtargets outlined in Idaho Power’s CO2 EmissionsReductionReport.
Salmon River Electric Cooperative isassumed to purchase clean electricity through the wholesale market at the same emissionsfactor noted in Blaine County’s 2018GHGInventory.
The range of emissions reduction potential from griddecarbonization is based on the emission factor assumptions in the table below. The current course assumesno changefrom the baseline and therefore no emissions reductions.
The best-in-class courseassumes Idaho Power attains its estimatedfuture emissions factors.
The best-in-class coursewill reduce emissions by approximately 128,710 MT CO2e. This scenario projects a gap of approximately 700 MT CO2e toward achievement of theSBT.
Idaho Power 2018 emissions factor 0.000298
Blaine County GHG Inventory (Blaine County, 2021)
Salmon River 2018 emissions factor 0.000118 Blaine County GHG Inventory
Idaho Power 2020 reported emissions factor 0.000380
Salmon River 2018 emissions factor 0.000118
Idaho Power’s 2025, 2030, 2035, 2040, 2045 estimated emission factors
2025: 0.0001074 2030: 0.0000768 2035: 0.0000781 2040: 0.0000777 2045: 0
Salmon River 2018 emissions factor 0.00011837
Based on 2020 Idaho Power ESG Report (Idaho Power, 2021)
Assumed no change in emissions factor; Blaine County GHG Inventory
Based on Idaho Power CO2 Emissions Reduction Report (Idaho Power, 2021). Short-, Medium- and Long-Term Targets based on % of 2005 baseline
Assumed no change in emissions factor; Blaine County GHG Inventory
$2,700–$38,500 2030projectedgap2,265–6,540MWh: $22,700–$65,400
Analysis was basedon theelectricityusage of the facilities and infrastructure associated with Blaine County and the cities of Bellevue, Hailey, and Ketchum.Municipaloperationsaccounted for two percent of 2019 baseline electricity consumption andone percent of natural gas consumption.
Total municipal energy consumption in 2019 wasnearly 44,000 MMBtu – 70 percent electricity and 30percent natural gas. TheCity of Ketchum was the largest electricity and natural gas user, averaging 37 percent and 38 percentofthe totalsrespectively. Hailey was the second largest electricity consumer at 36 percent,while Blaine County wasthe second largest natural gasuser at30 percent. The adjacent chart shows the relative proportionsof electricity andnaturalgasuse by jurisdiction.
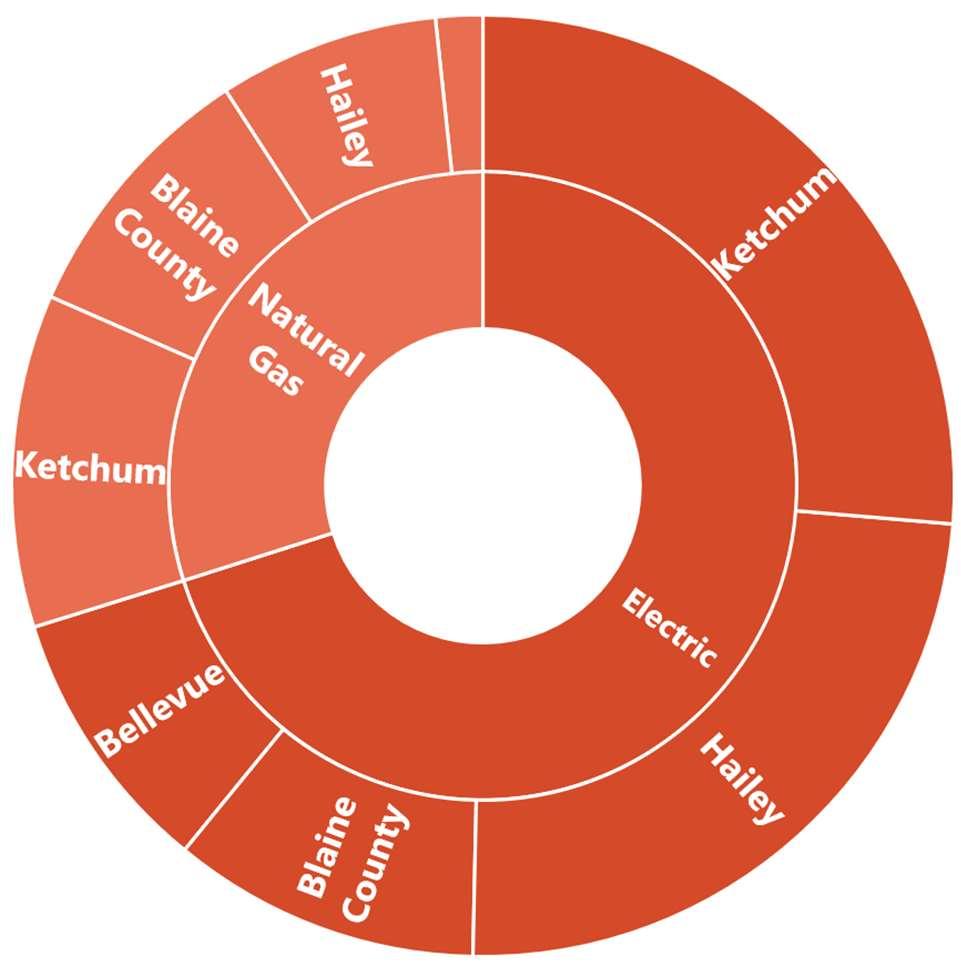
While naturalgasuse wascaptured to analyze contributions to GHG emissions, this strategy focuses on a transition to clean electricity and doesnot address changesin natural gas usage.
Basedon average electric usage trends for 2018-2021, the BAU electricity forecast is estimatedto grow by onepercent annually. This growth coincideswithpopulation outlooks and is consistent with an expectationof growth in governmental servicerequirements. Itwas assumed that all municipal facilities will continueto be served by IPCO.
2019 Energy Usage: 43,756 MMBtu
Sourcing 75 percentof current municipal electricity consumption fromclean energy will result in an emissions reduction of 2,729 MT CO2e from projected 2025 emissions. The bestin-class scenario projects a gap of 120 MTCO2e towardachieving the goal. Toclose this gap, the county and cities willneedto purchase renewableenergy credits(REC)orparticipate in a green powerprogram.
Sourcing 100percent of municipal electricity consumption from clean energy resources will result in an emissions reduction of 3,822 MT CO2e from projected 2030 emissions. The bestin-class scenario projects an approximategap of 770 MT CO2e to meet this goal. To close the
gap, the county andcitieswill need to purchase renewableenergy creditsor participate in a green power program.
For achievement of the 2025 and 2030 goals, the rangeof impactand clean energy purchases will be dependent upon IPCO’s attainment of its emissionstargets.
Idaho Power 2020 reported emissions factor 0.000380

Idaho Power’s 2025 and 2030 estimated emission factors 2025: 0.0001074 2030: 0.0000768
To meet 2025 and 2030 clean electricity goals, the county and cities willneedto explore alternatives suchas RECsand participation in green power programs. IPCO is also proposing new programs such as a green tariff program. Cost estimates are basedon current courseand best-in-class scenario. The cost estimate can be
Based on the 2020 Idaho Power ESG Report (Idaho Power, 2021)
IPCO CO2 Emissions Reduction Report short-, medium- and longterm targets % of 2005 baseline.
updated each year to incorporate current data on thegrid-suppliedclean energy mix.
Cost estimates will be dependent upon the renewableenergy procurement option selected. The analysis utilized the price of $1/100 kWh for Idaho’s Green Power Program. ROI is also unknown as it isprojectdependent.
700MTCO2ereduction
COSTESTIMATE: ROIof2.5–5.6%basedonnetmeteringandtimeofuserates Projectedaccumulativesavingsthrough2050: $16Million
Analysis was basedon theinstalleddistributed solargeneration in the county for 2019-2021 and forecasted annual growth of new installed generation through 2030. Blaine County has seen an average annual growthrateof 22 percentfor installed solar capacity, according to data provided by IPCO.
The range of emissions reductions potential from this strategy is from693 to 4,231 MT CO2e. The targetwas setat 700 MTCO2e to address emissions reduction gap identified under strategy E1:ReduceGridCarbon
Intensity. The targetassumes IPCOwill meet its
2021IRP emissionsreductions targets. The calculation also assumes thatannual growth in distributed renewable generation will continue at thecurrent rate of 22percent.
Energy cost savings associated with local distributed generation areestimatedto be nearly $16million through2050. The returnon investment for solar installations is estimated to be between 2.5 and 5.6 percent and will depend upon netmeteringand electric time-of-use rates (Nadel, Zero-energy Buildingsare Focusof Growing Numberof Energy Efficiency Programs, 2020).
BASELINE 2019 installed capacity in Blaine County 1.592 (MW)
CURRENT COURSE
IN CLASS
Average annual growth of installed capacity in Blaine County
Annual growth in residential solar
Idaho Power email on total installed systems for Blaine County from 2019-2021 (Idaho Power, 2022)
Calculated annual growth based on Idaho Power email on total installed systems for Blaine County from 2019-2021 (Idaho Power, 2022)
Based on Solar Industry Research Data from Solar Energy Industries Association (Solar Energy Industries Association, 2021)

Analysis was basedon renewable energy purchasesneededto close theprojected gap towardachievementof a60percent reduction in GHG emissions (SBT) and 100percent clean electricity countywide by 2035.
An offsetthrough procurement of utility-scale renewablesof between 24,000 MT CO2eand 141,000 MT CO2e is needed to help achieve the 2030SBT and 2035cleanenergy goal. The amountwill depend uponthe levelof execution of high-impact strategiesand the performance achieved.The county and cities canpurchase clean electricity through a utility service provider toachieve approximately 78 percent of the SBT emissionsreductions.
To maintain the 100 percent clean electricity goal, offsets will be needed until Idaho Power is able to meet its proposedgoal of 100 percent clean energy by 2045.
The gap toward achievement of clean energy goals and the SBTtarget is dependent upon how successful IPCO is atmeeting their commitment to short-term, medium-term, and long-termemissions reduction targets.Thecost estimate is basedon current courseand bestin-class scenario through 2030 and 2035. Cost estimates are also dependenton the offset option selected.The priceof $1/100 kWh for Idaho’s Green Power Program was used to develop high-level cost estimates.


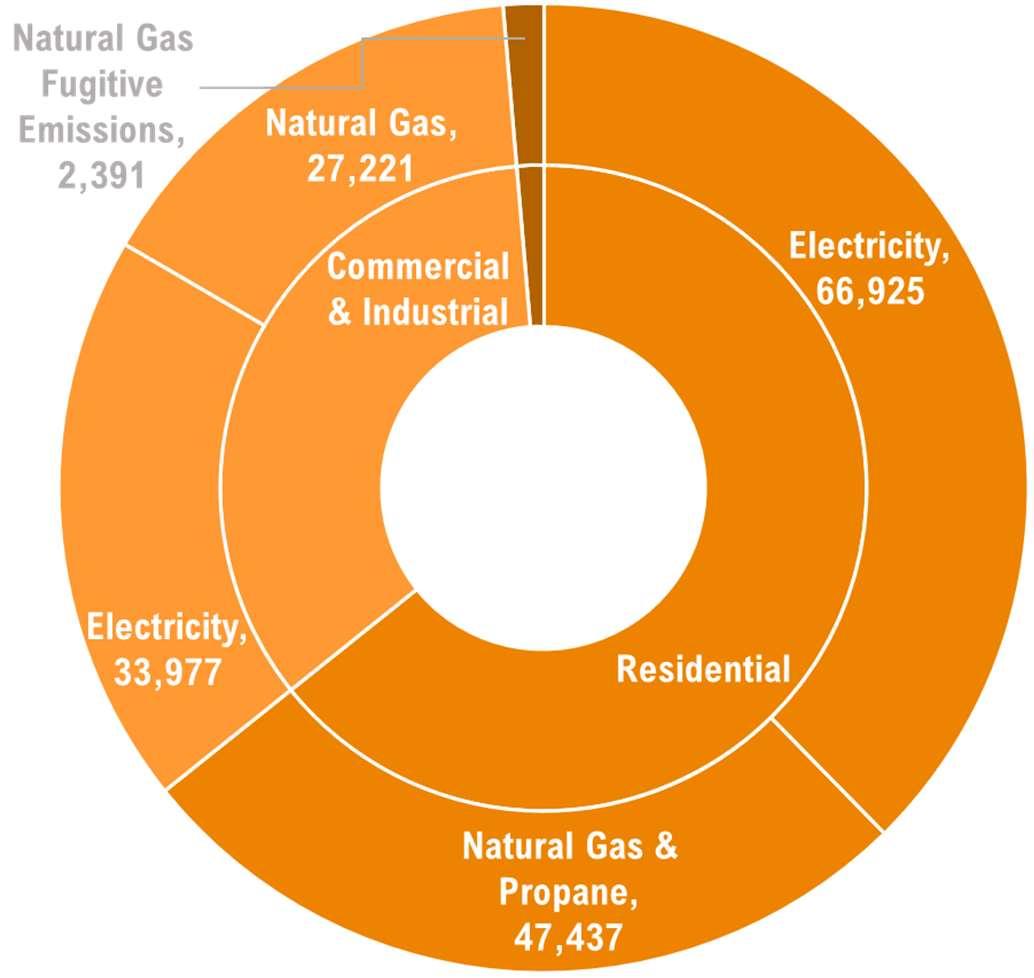
In 2018, buildingswere responsiblefor 52 percentof GHG emissions, 34 percent from residentialbuildings and 18 percent from commercialbuildings. Emissions are generated fromfossil fuels burned on-sitefor heating,hot waterand cooking, as wellas electricity delivered tobuildings.Emissions from leaks in the natural gas distribution system were considered fugitive emissions.
Residentialbuildings generated 65 percent of building sector emissions;commercialand industrialbuildings generated 35 percent.
Residential,commercialand industrialbuilding electricity consumption generated 57 percent of building sector emissions; naturalgas generated 43 percent.
Strategies inthe ENERGYSUPPLY section address emissions from electricity consumption through a shift to clean energy resources.
The chartabove illustratestherangeof impact for BUILDINGS strategies in 2030 as compared to the BAU forecast. The top bar shows the projected Scope 1and 2BAU building sector emissions in 2030 if no actions are taken. The bars next to each strategy show therangeof potential impactfor eachstrategy.
Analysis identified existing residentialand commercialbuilding retrofits as thehighest impactopportunity for reducing GHG emissionsfrom thebuilding sector. The model projected amaximum impactof all BUILDINGS strategiesof 24 percent of 2030 BAU building emissions.A barrier to greater building emissionsreductions is the timeneededto plan and implement building retrofitprojects.
The range of potential impact from ENERGY SUPPLY strategies is also shown. The projected impactpotentialof BUILDING and ENERGY SUPPLY strategies combined is a 75 percent reduction in building emissions from the 2030 BAU projection.

Analysis was basedon adoption of themost current commercial and residential International Energy Conservation Code(IECC) shortly after release.Building code is set by the Idaho State
Legislature. Blaine County has agrandfathered residentialgreenbuildingcode, BUILDSMART, that has been in place since 2011. The performance path for thiscode is basedon building sizeas shownbelow.
The Stateof Idaho adopted the 2018 IECCwith provisions thatresult in aHERS scoreof 68 for residentialconstruction ascomparedto the 2018IECC’smoreenergy efficientHERS score requirement of 61. Blaine County has maintainedthe 2012 IECC Residential Provisions withthe county’s BUILDSMART amendments (excluding state amendments to the 2018 IECC).
current state code is more rigorous for residentialprojects that are less than 2,800 square feet (SF). Blaine County’s BUILDSMART code is more rigorousfor largerhomes. The 2021IECC requires aHERS scoreof 54. If adoptedby the State of Idaho, the BUILDSMARTcodewould only be morerigorous for residentialprojects greater than 5,800 SF.
Basedon data from the Blaine County Assessor’s Office, 24percent of homesare largerthan 2,800 SFand represent 49 percent of the totalresidential buildingarea;four percentofhomesare larger than 5,800 SF and represent 13 percentof total residential building area.

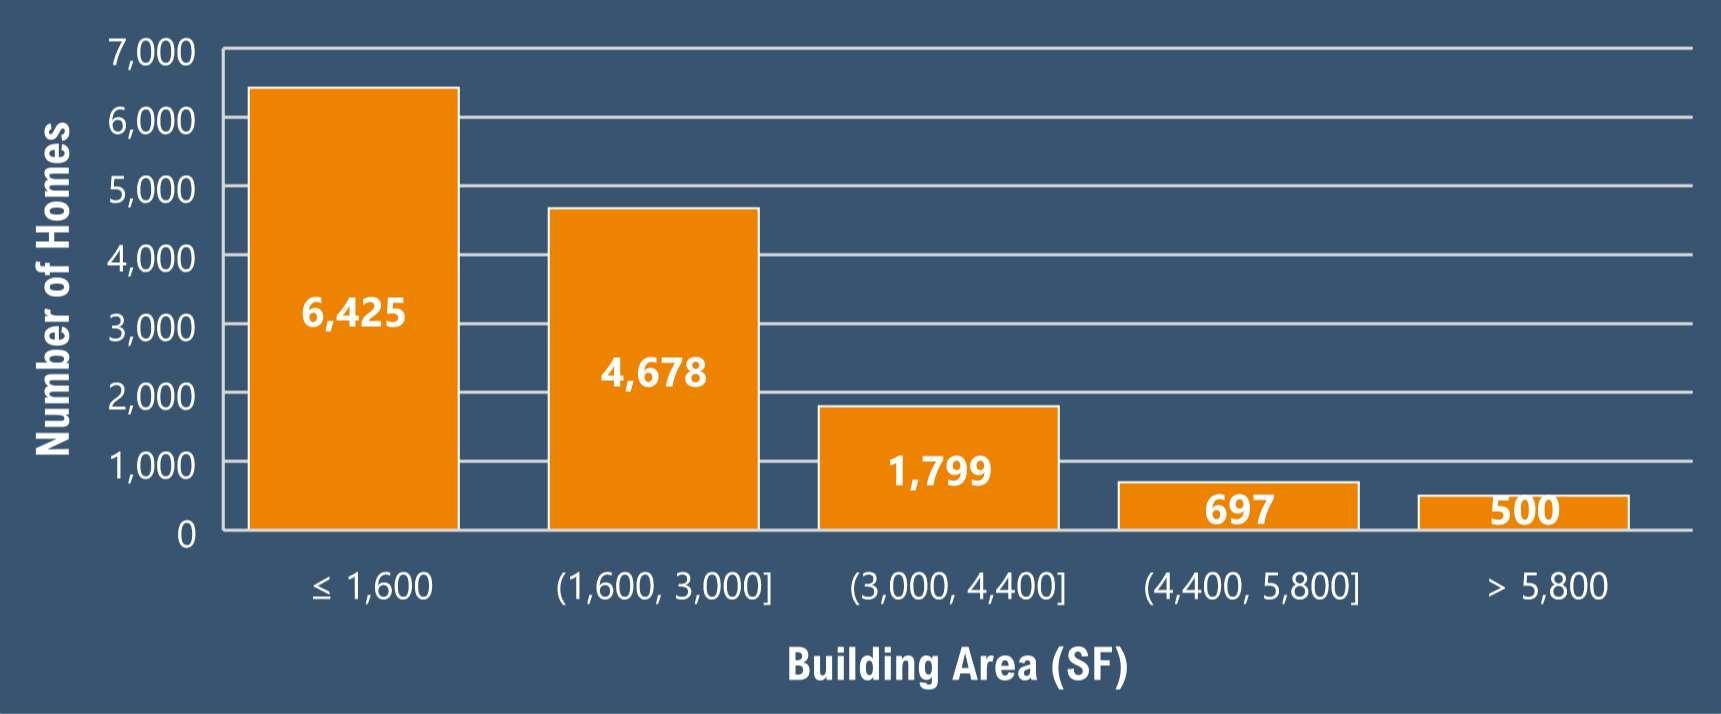
Since larger homes makeupa significant portion of the residentialarea, further analysis is neededto review trends in building stockand


projected home sizes to inform code changes that will have the greatestimpacton reducing residential energy use.

GHG reduction benefits fromcodeadoptionsor above-code effortsarereflected in strategy B4: Low-CarbonCommercialNew Construction.
No savingsare assumed.
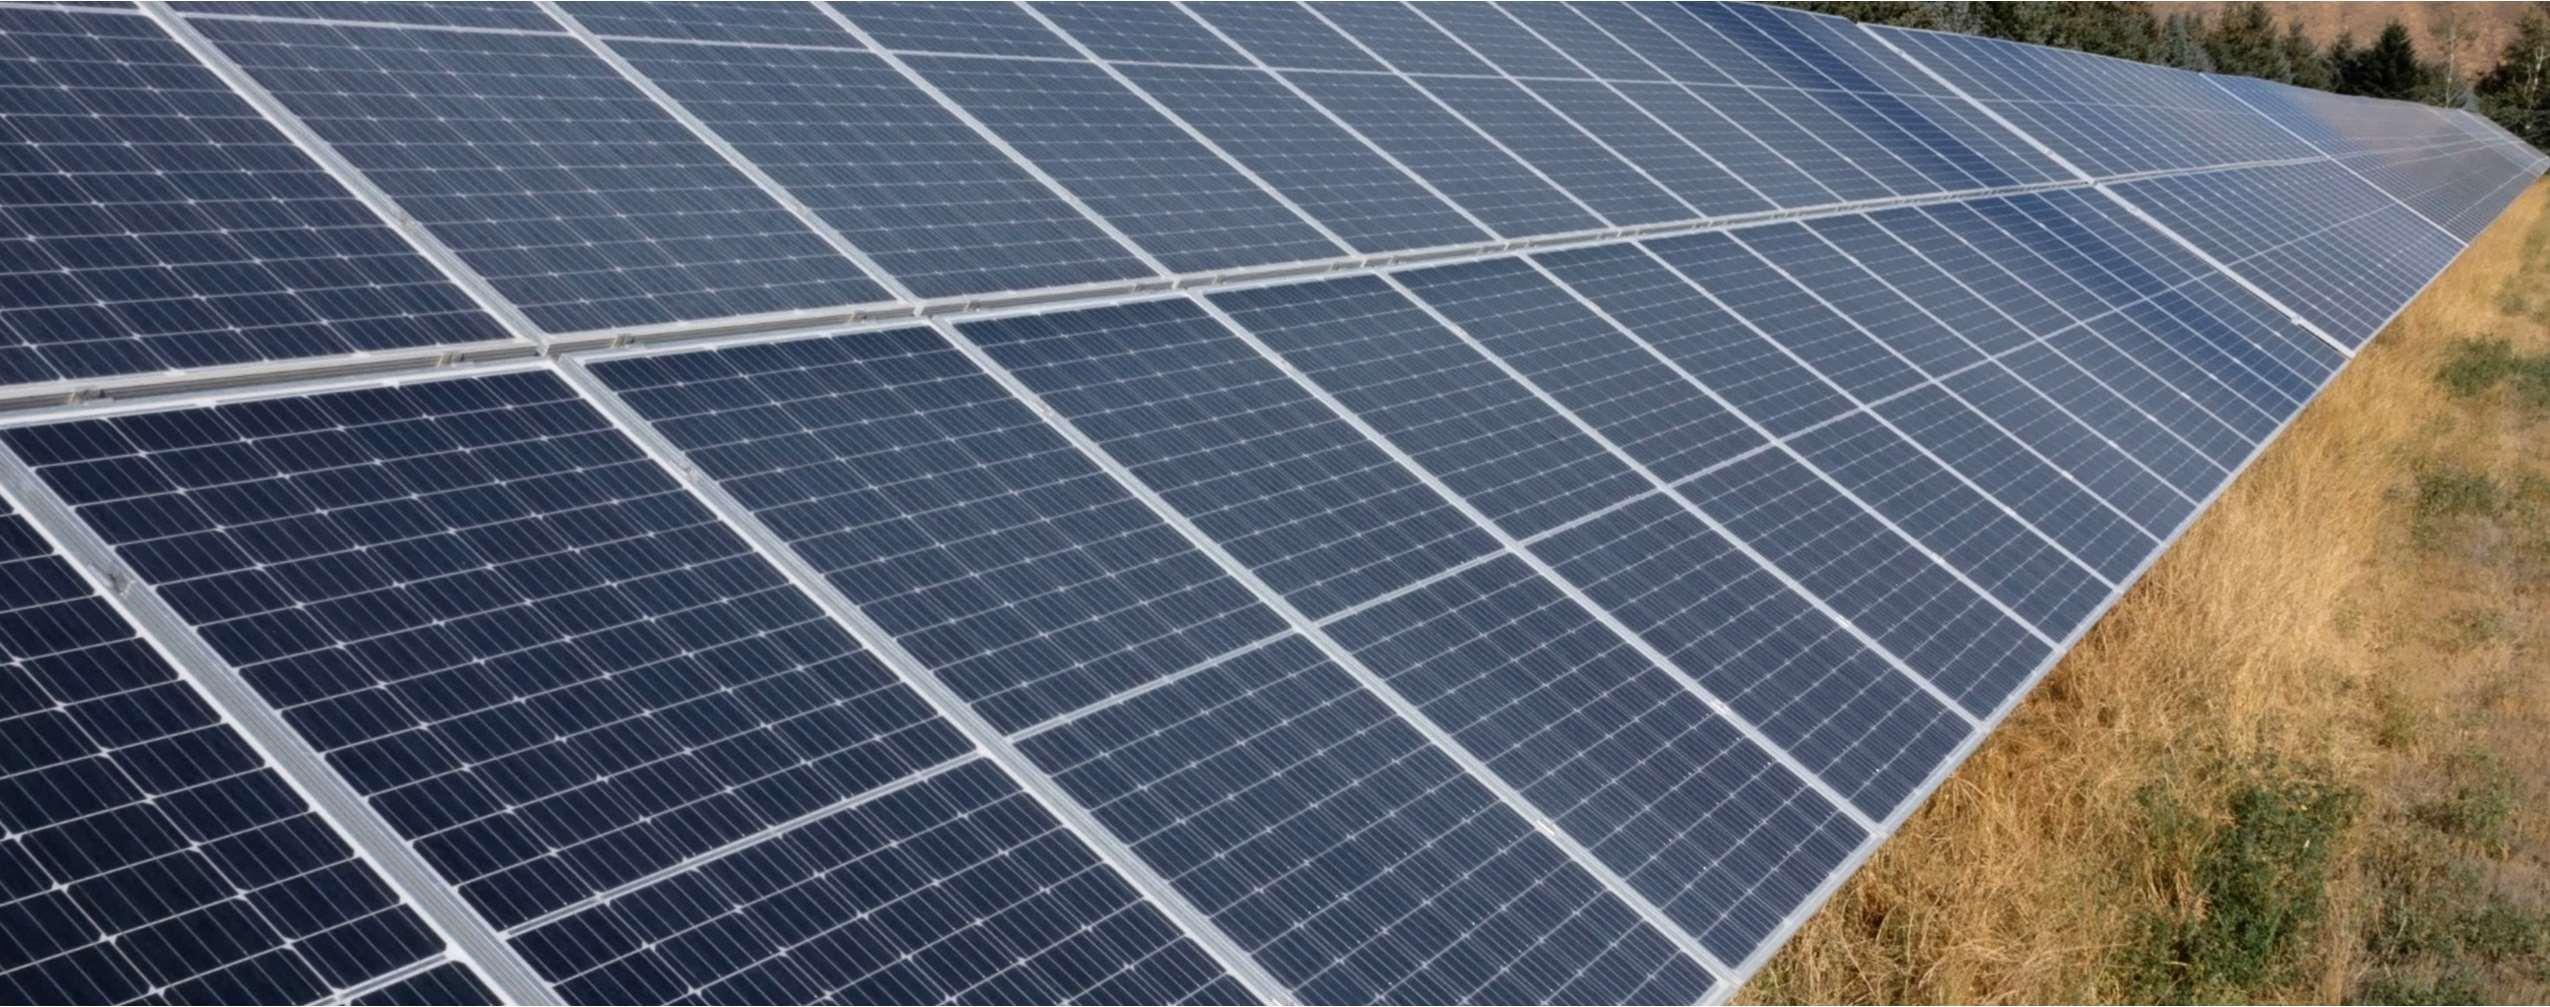
 RooftopSolarProject
ImageCourtesyofJohnReuter, BluebirdSolar
METRIC:
1%areall-electricby2030
TARGET: 11,713MTCO2ereduction COSTESTIMATE: Projectedaccumulativesavingsin2030: $2.6–$3.2Million
Analysis was basedon building stockdatafrom the Blaine County Assessor’s Officeand the emissionsreductions potentialfrom improving energy efficiency and electrifying building systems in existing commercial, industrial and municipal building.
The range of impactreflects current andbestin-class implementation outcomesfor energy efficiency, building electrification, and ENERGY SUPPLY strategies.
Commercial, industrial, municipal building area 9,287,401 SF Blaine County Assessor’s data
Current building EUI 99 kBtu / SF Assessor’s and utility data
Annual electricity savings from retrofits 1.77% / YR Max. 40%
Annual natural gas savings from retrofits 0% / YR
Percent of natural gas uses switch to electric 0%
Annual electricity savings from retrofits 2.34% / YR Max. 40%
Annual natural gas savings from retrofits 1.94% / YR
Percent of natural gas uses switch to electric 80% commercial; 50% industrial
IPCO commercial incentive program performance data (pg. 9). (Idaho Power, 2021). EPA Lead by Example Guide (EPA, 2009)
Natural gas efficiency programs in Idaho (American Council for an EnergyEfficient Economy, 2022)
Existing building electrification negligible.
Best energy efficiency programs by state (MA pg. 17). (American Council for an Energy-Efficient Economy, 2022)
Best energy efficiency programs by state (CA pg. 20). (American Council for an Energy-Efficient Economy, 2022)
Study of electrification potential by 2050 (National Renewable Energy Laboratory, 2017).
Businesses in the county are projectedto spend about $19 million in 2030 on electricity and natural gas for facilities. By upgrading building systems to improve energy efficiency and transitioning to cleanelectricity, thesecosts couldbe reducedby $2.6to $3.2 million. The simple payback for theseprojects varies by project type as shown in the tablebelow (Nock & Wheelock, 2010).
Cost savings from electrification strategies has been shown to be strongly influenced by utility rate structureswithgreater benefits from a favorable time-of-use rate (Group 14 Engineering, 2020). Participating in Idaho Public Utility Commission cases thataddress IPCO rate structuresmay be an essential tactic for increasing building electrification.

RETROCOMMISSIONING 10–20% 4 MO–2.4 YR $0.30
ENERGY SERVICE COMPANY CONTRACT 20–40% 3–12 years $2.50
INTEGRATED DESIGN 30–60% 7–12 years $2.50 NET ZERO ENERGY 50–90% 8–20 years Variable
1 Saving more than 50% of existingenergyusage requires innovative design and changesin behavior.
2 Cost per square foot (PSF) varieswidelydue to the difference in energyintensityby building use. When analyzing a range of building uses, the payback period is generallymore consistent and more informative than the cost PSF.


METRIC: 1%ofexistingSFmeetsIECC2018efficiencystandards;20%reduceEUI by20%;and11%areall-electricby2030
TARGET: 5,701MTCO2ereduction
COSTESTIMATE: Projectedaccumulativesavingsin2030: $1.6–$4.5Million
Analysis was basedon building stockdatafrom the Blaine County Assessor’s Officeand the emissionsreductions potentialfrom improving energy efficiency and electrifying building systems in existing commercial, industrial and municipal building.
The range of impactreflects current andbestin-class implementation outcomesfor energy efficiency, building electrification, and ENERGY SUPPLY strategies.
Resident building area 31,096,019 SF Blaine County Assessor’s data
Residential building EUI 54 kBtu / SF Assessor’s and utility data
Annual electricity savings from retrofits 0.69% / YR IPCO residential incentive program performance data (pg. 9). (Idaho Power, 2021)
Annual natural gas savings from retrofits 0% / YR Natural gas efficiency programs in Idaho (American Council for an EnergyEfficient Economy, 2022)
Percent of natural gas uses switch to electric 0% Existing building electrification negligible.
Annual electricity savings from retrofits 2.34% / YR
Annual natural gas savings from retrofits 1.94% / YR
Percent of natural gas uses switch to electric 80% residential use by 2050
Best energy efficiency programs by state (MA pg. 17). (American Council for an Energy-Efficient Economy, 2022)
Best energy efficiency programs by state (CA pg. 20). (American Council for an Energy-Efficient Economy, 2022)
Study of electrification potential by 2050 (National Renewable Energy Laboratory, 2017).
Home owners and rentersin Blaine County are projected to spend about $28 million in 2030 on electricity,natural gas, and propane. By upgrading building systems to use less energy and transition to clean electricity, thesecosts can be reducedby $1.6 to $4.5 million.
The costand savingsfor residential energy efficiency projects varies basedon size and existing conditions. Projects can rangefrom doit-yourself(DIY) home improvementsto deep energy retrofits. Deep energy retrofits and electrification projectscan result in long
LOWER WATER HEATING TEMPERATURE
INSULATE HOT WATER PIPES
INSULATE HOT WATER TANK
INSTALL EXTERIOR STORM WINDOWS
payback periods.However, theseprojects provide other benefits.High-efficiency homes improve healthandcomfort andenhance resilience to extremeweather events.
The U.S. Department of Energy (DOE) provides a list of simpleand low-cost home efficiency projects, along with associated costs and savings as shown in thetable below (Minos, 2021). Theseprojects have a low upfront cost and shortpaybackperiodandcan improve the efficiency of a home by asmuchas 25 percent.
Set water heater to 120°F $0 $12-$30 / YR for each 10°F reduction
Install insulation on exposed hot water pipes $10-$15 $8-$12 / YR
Add insulation jacket to older water tank with poor insulation $30 $20-$45
Add low-emissivity storm windows outside existing inefficient windows
$60-$200 per window 10-25% annual energy cost
Seal around windows and doors with caulk and weatherstripping $3-$30
In a recent American Council for an EnergyEfficientEconomy (ACEEE) report, deep retrofit packagesweredeveloped to update older housing stock to high-efficiency,all-electric homes. The report found that site energy use can be reducedby 74–79 percentfor cold weather homesbuiltbefore 1970. The retrofit package – full-envelope upgrades, lighting replacements,and heat pump spaceand water heating – was estimatedto cost $53,000 per homeand provide annualenergy savingsof $1,000 to $1,400, resulting in an extended payback (Amann,Srivastava, & Henner, 2021).
5-10% annual energy cost
For homes with high-efficiency envelopes,a switch to all-electricheatpumps for space and waterheatingwas estimated to cost $20,400 and to increase annualutility costs by $350. Replacing natural gas equipment at end-of-life withheat pumpscan mitigate the cost. A favorable time-of-use electric ratepairedwith a $4,600 equipment rebatecan result in a 15-year netpresent value that is equalto naturalgas equipment (Group 14, 2020). Basedon this study, home electrificationis likely to have an extendedpaybackor require investment from the homeowner.


Air source heat pumps for heating and cooling, induction cooktop.
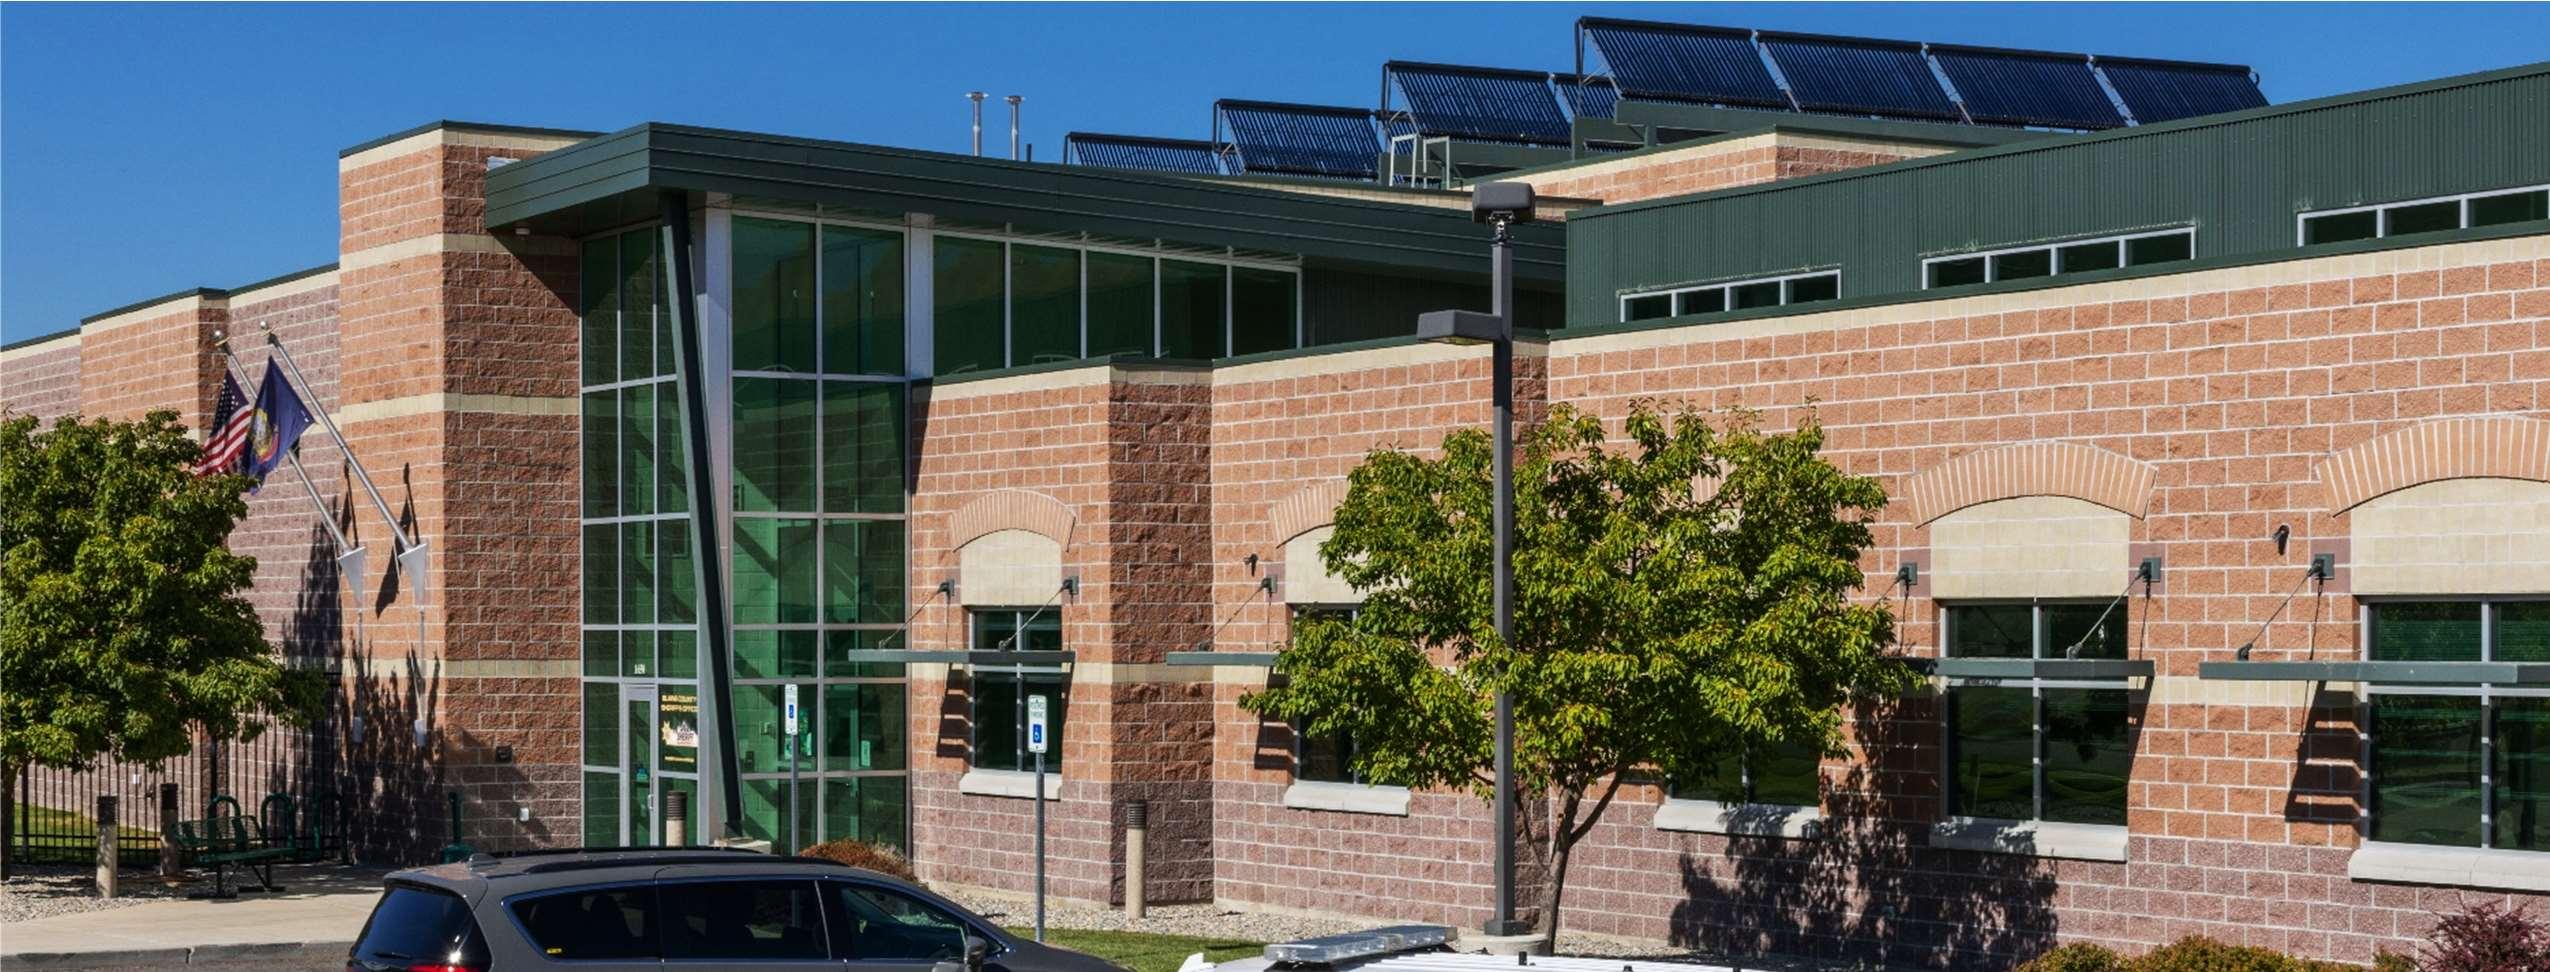
23.8% modeled energy cost savings from energy measures: high-efficiency insulation values, efficient lighting fixtures and occupancy sensors, energy recovery units on exhaust air, and highefficiency HVAC system with heat recovery and condensing boiler for apparatus bay radiant floor system.
Solar- and EV-ready systems will facilitate costeffective solar and EV charging installation.
Building design allocated space for energy storage to facilitate installation.
Efficient systems, fixtures, and controls led to a 26% energy cost savings and 40% reduction in indoor water use.
Secure bike storage encourages car-free commuting.
METRIC: 100%newconstructionmeets2018IECCandareall-electric TARGET: 1,680MTCO2ereduction COSTESTIMATE: Projectedsavingsin2030: $350,000
Analysis was basedon building stockdatafrom the Blaine County Assessor’s Officeand employment trends to estimate the emissions reductions potential was from high-efficiency and electric building systems in commercial and municipal newconstruction. Analysis does not include industrialbuildings as the energy
efficiency and electrification potential is variable dependingonbuilding use.
The range of impactreflects current andbestin-class implementation outcomesfor energy efficiency, building electrification, and ENERGY SUPPLY strategies.
Commercial growth rate 2% / YR Average employment trends (Data Commons, 2022)
Current building stock EUI 99 kBtu / SF Average EUI of current commercial building stock
Average new construction EUI3 61.8 kBtu / SF 2018 IECC weighted average (Pacific Northwest National Laboratory, 2018)
Percent of natural gas uses switch to electric 0% Existing building electrification negligible
Average new construction EUI 24.7 kBtu / SF Net Zero EUI for small and medium office buildings (ASHRAE, 2019)
Percent of natural gas uses switch to electric 100% Key feature of net-zero commercial construction
High-efficiency and all-electric newconstruction could save up to $350,000 in utility costs in 2030. Modeling studiesof small, commercial buildings show a lowerup-front costthan conventionalconstruction mainly due tothe
avoidedcostof natural gas infrastructure.An increase in annual utility costsof less than 10 percent is estimated. Favorable time-of-use utility rates canresult in a 15-year net present value equal to conventional construction. (Group 14, 2020)
BAU forecast assumesnewbuildingsmatch the average EUI of existing building stock (99 kBtu/SF). The lower EUI isbased on adoption of the 2018IECC.
METRIC: 100%newconstructionmeets2018IECCandareall-electric TARGET: 1,810MTCO2ereduction COSTESTIMATE: Favorable15-yearnetpresentvalue.
Analysis was basedon population growth projections and building stockdatafrom the Blaine County Assessor’s Office and population growth projections of low-to zero-carbon emissionsfrom fueluse. Newresidential construction practices include energy efficiency
and electric technologies forheating and cooling, hot water, andcooking.
The range of impactreflects current andbestin-class implementation outcomesfor energy efficiency, building electrification, and ENERGY SUPPLY strategies.
Growth rate 0.99% / YR Population growth rate projections
Current building stock EUI 54 kBtu / SF Average EUI of current residential building stock
Average new construction EUI3 54 kBtu / SF No change because residential code hasn’t changed since 2016.
Percent of natural gas uses switch to electric 0% Existing building electrification negligible
Average new construction EUI 15.3 kBtu / SF
Estimated energy efficiency reductions of 50% for net zero homes, ACEEE guidelines (Nadel, Programs to Promote Zero-Energy New Homes and Buildings, 2020) and modeled allelectric buildings (Group 14, 2020)
Percent of natural gas uses switch to electric 100% Key feature of net-zero commercial construction
All-electric,new single-family residential construction would resultin a small increase in utility costs under thecurrentrate structure.
Basedon modeled all-electric, single-family homes, theupfront cost of new construction is
25percent less thantraditionalconstruction practicesmainly due to eliminatednaturalgas infrastructurecosts. The increasedannual utility costs are estimatedatapproximately $350. However, the 15-yearnetpresent value is lower than standardconstruction. Favorable time-ofuse ratescan lower these costs evenfurther.


In 2018, on-road transportation represented 40percent of GHG emissions in Blaine County. These emissions are generated fromgasoline and dieselfuels used in vehicles traveling on roads inthe county. Gasoline vehicles contributed over 70percent to the totalonroadtransportation emissions total.
According to the U.S.Census Bureau, 84 percentofhouseholds inBlaine County have twoor more vehicles availableand the average commute was 18minutes in 2020, which was less than the averagecommute for the state. In addition, 73percentof people commutingtowork drove alone, 13 percent workedfrom home, and 14 percent utilized other formsoftransportation or carpooled. (U.SCensus Bureau, 2022)
TheCenter for Neighborhood Technology (CNT)Housingand Transportation Affordability Index reportsthat the average annualtransportation costs in Blaine County is 27percent of household income, or $14,410. Transportation costs areconsidered affordable if they are 15 percent or less of household income(CNT, 2022).
Indicators such as high transportationcosts, number of vehicles per household,and large percentof light-duty vehicles highlight an opportunity to encourage EV adoption.
Location efficiency directlycorrelates with annual vehiclemiles traveled (CNT, 2022).
Blaine County’s location efficiency metric reported by CNT is very low, meaning neighborhoods have low access to jobs, are auto-dependent, have limitedaccess to public transportation, and are predominantly lowdensity with limitedwalkability. The cities have slightly higher scores.Ketchum scores the highest (scaleof 1 – 10): Job Access is 2.8, All Transit Performance Score is 4.7, and Compact Neighborhood is 3.3.
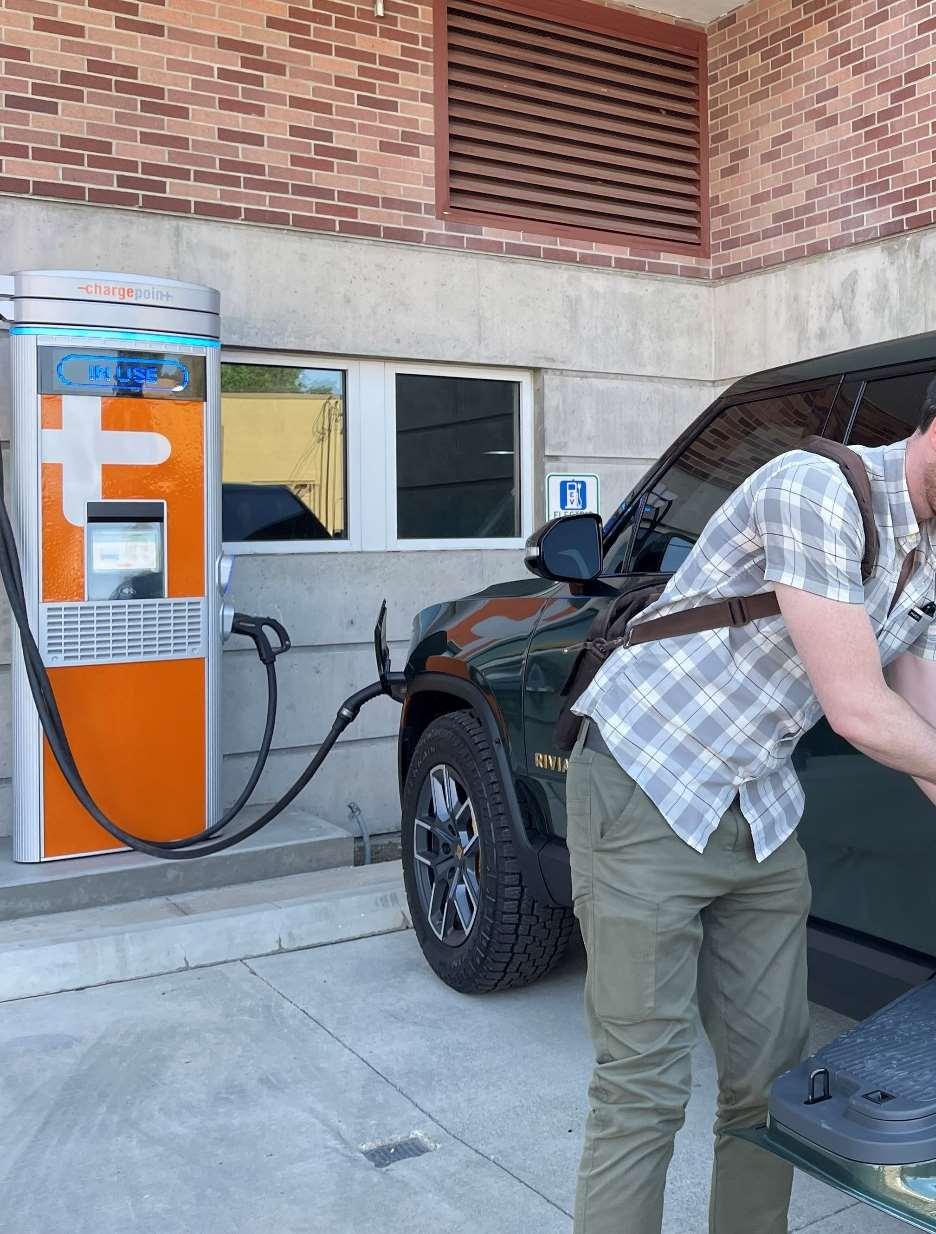
@ecobadlandzRivianR1Tchargingat BlaineCounty’sDCFastCharger
The chartabove illustratestherangeof impact for TRANSPORTATION strategies. Thetop bar shows the projectedScope 1and 2 BAU transportation emissions in 2030 if no actions aretaken.Thebars next to each strategy show the rangeof potential impactfor each strategy. Strategy T3– Transition to Clean Municipal Fleets and Equipment – isnot displayed in the chart becausemunicipal fleet vehiclemiles traveled(VMT) were consideredpart of the total VMT evaluated under strategy T1. However, analysisof municipalfleet impacts is captured in this section.
Analysis identifiedEV adoption as the highest impactopportunity for reducing GHG emissions in the transportation sector. The analysis projecteda maximum impactof all TRANSPORTATION strategies of 22 percent of 2030BAU transportation emissions. Barriers to greater transportation emissions reductionsare the timeand resources neededto implement
programs, technological developments,and consumer behavior and awareness.
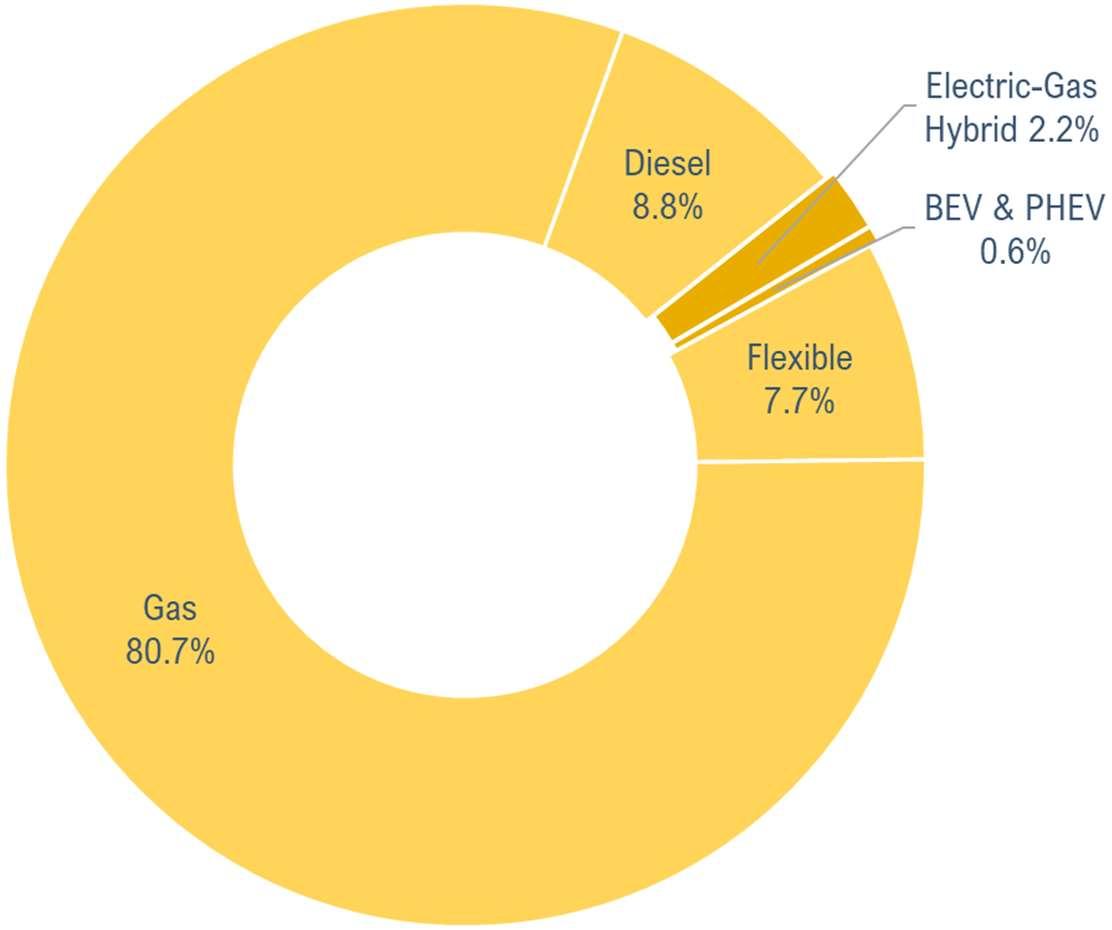
As of February 2022, 29,411 vehicleswere registered in Blaine County. Battery electric vehicles(BEV) and plug-inhybrid electric vehicles(PHEV) represented 0.6 percent of registered vehicles. Light duty vehicles represent 90 percentof registered vehicles (Idaho Transportation Department, 2022).

Analysis was basedon historicalVMTdata and annualtrends in Idaho. The current course assumed no change inbehavior. The best-inclass scenario evaluatedkey factors that influence changes in driving, including distance to downtown and population density.A calculatedmetric was used to estimate changes in drivingwhenone of these factorschanges. The analysis assumedthat as population density increaseswith intentionaldevelopment the distanceto downtown for households decreases. An assumption wasmade that planned growthwill benefit existingresidents adjacent to thedevelopment, so the benefit is applied toall VMTwithin the city.
Increased development density and resulting reductions inVMTwere estimatedto begin in 2025due to the time neededtoamend zoning codes and planning activities.
It is acknowledged that amulti-facetedVMT approach(e.g., enacting aCompleteStreets policy, improvingpublic transportation, encouragingwork from home)may improve the impactof aVMT strategy,but theanalysis focused solely on the best-in-class scenario of population density improvements.
An example of intentional development is to direct growth in the Areas of City Impact (ACI).
ACI’s are compact urban areas that feature housing in close proximity to infrastructure, jobs, and services.
This performance target was revised fromthe recommendedtarget, tenpercent reduction of VMTby 2030, based on the analysis of the bestin-class scenario. The fourpercent target is achievable ifthe county updates its zoning code and activelyengages in increasing development density no later than 2024. Additional strategies will need to be pursuedto furtherreduceVMT.
reduction in
percent expected reduction in
Blaine County 2018 GHG Inventory (Blaine County, 2021)
State of Idaho historical VMT per capita (Eno Center for Transportation, 2022)
Historical best-in-class performance for population density increases by 2030 (Brownstone, 2008). Change in driving by key factors (Florida, 2017).
This analysis assumed nonetcost to development designed to decrease VMT. In summary,the relationships between development density, construction cost, and
housingprices arehighly context-specific and inconclusive.Higher-density development saves land cost butmay increase construction cost.

Image Courtesy of GMD Development


 OriginalImageCourtesyofMountainRides


Analysis utilized an exponential vehicle adoption curve for both light-and heavy-duty vehiclesbased on historical trends in other markets. In 2022, 169 BEV and PHEV vehicles were registered in BlaineCounty. Analysis also assumes projected improvements infuel
efficiency for internal combustion engine vehicles(ICE).
The targetforthis strategy was simplifiedby eliminatingthe annual EVgrowthtargetwhile maintaining the 2030 target for VMT associated with increased electric vehicle adoption.
Percent light-duty vehicles that are EVs
Projected changes in fuel efficiency of ICE vehicles
0.6%
Light-duty: 2020: 25 mpg 2030: 30 mpg 2040: 35 mpg
Blaine County DMV registrations (Idaho Transportation, 2022)
Heavy-duty: 2020: 6 mpg 2030: 7 mpg 2040: 7.5 mpg
ICE vehicles fuel efficiency (U.S. Energy Information Administration, 2020)
Percent light-duty vehicles that are EVs 0.6% Blaine County DMV registrations (Idaho Transportation, 2022)
Percent light- and heavy-duty vehicles that are EVs
Total cost of ownership for EVs include purchase or leaseprice, tax credits, fuelor electricity rates, maintenance and insurance. While initialcosts may behigher, tax credits and low electricity and maintenancecosts make EVs less expensiveto own and operate thanan ICE
100% by 2050
Best-in-class goals for Denver and Los Angeles (Bui, Slowik & Lutsey, 2020) and multi-state memorandum of understanding (U.S. Department of Energy, 2021)
vehicle. EVs are reported to now pay for themselves infive to six years.(Pothen, 2022)
Cost comparisons vary based on area gasoline prices, priceof electricity, vehicleuse, charging behavior, andthe associated equipment and installation costs of charging equipment (Borlaug, Salisbury, Gerdes, & Muratori, 2020).


METRIC: 100%cleanfleetsby2030andequipmentby2035asfeasible TARGET: 1,977MTCO2e reduction COSTESTIMATE: Paybackbetween5to6years.
Analysis was basedon fossil fuel purchases for municipal fleets. In 2019, Blaine County and the cities of Bellevue,Hailey, and Ketchum utilized nearly 207,000 gallonsof fossil fuels topower municipal fleet and maintenanceequipment. Blaine County vehiclesrepresented 59percent of totalfuelusage.
In 2020 and 2021, fuel use for all jurisdictions dropped by 13 percent compared to 2019. The reason behind the significant change in fuel use
MODELING DATA
is unclear but may be dueto COVID-19 restrictions.Additional information is needed to determine thecause andwhether the reduction in fuel use is anticipatedto carry forward.
There were no EVs inthe municipal fleets in 2019.
If the jurisdictions can maintain the 13 percent reduction in fueluse through 2030, the GHG reductions targetof 1,977MT CO2e will be achieved.
Gallons of fuel 206,966 gal Municipal fleets fuel usage (Barker, 2022)
CURRENT COURSE Percent reduction in fuel use
BEST IN CLASS Annual percent expected reduction in fuel use
There anumberof resources that support municipal transition to electricfleets such as the ElectrificationCoalition, aprogram startedby ClimateMayors. ClimateMayors is abipartisan network of morethan 470U.S. mayors in 48 statesthat are demonstrating climate leadership through meaningful actions intheir
Assumes no change in fuel use
Calculated based on fuel use trends noted for all jurisdictions for 2020 and 2021 when compared to 2019.
communities. The Electrification Coalition founded anEV purchasing collaborative for local government through Sourcewell, and offers toolsand resources,including policy toolkitsand EVcost of ownership calculators. While upfront costs canbe as much as $10,000 morethan ICE vehicles, EVs pay for themselves within five to six years when the full costof ownership is considered.


Developacoalitionoflocal jurisdictionsforthepurposeof participatinginpublicutility commissioncases.
TheNationalCouncilonElectricityPolicyrecommendsthatlocalgovernmentsserve asthelocalvoicefortheircommunitiesbyengagingwithpublicutilitycommissions. Engagementcanhappenbehindthescenesthroughrelationshipbuildingortakeon amoreactiveformthroughfilingpubliccomment,participatinginproceedings,or participatingdirectlyasanintervener.Activeparticipationwillrequirelegaland technicalexpertisethatdoesnotcurrentlyexistonstaff.TheBlaineCountyClean EnergyCoalitionwasestablishedforthispurpose.MembersincludeBlaineCounty, Bellevue,HaileyandKetchum.
Installrenewableenergysystems,or purchasecleanenergythrougha utilityprogramorpowerpurchase agreement.
Municipalitiescaninvestinonsitecleanenergygeneration.Asecondoptionisto purchaserenewableenergycreditsorenterintoacleanenergypowerpurchase agreement.AnotheroptionistosubscribetoIPCO’sGreenPowerProgramorthe CleanEnergyYourWayprogramifapprovedbytheIdahoPublicUtilityCommission (IPUC).TheBlaineCountyCleanEnergyCoalitionsubmittedcommentsonIPCO’s applicationtoexpandcleanenergyoptionsthroughitsproposedCleanEnergyYour Wayprogram.TheCoalitioncommunicatedconcernedthatthecostforsmall,rural communitiestoparticipateinthesubscriptionprogrammaybeoutofreach.
Reducecostandregulatorybarriers andlaunchaneducationand outreachcampaigntoaccelerate solaradoption.
Landuse,zoning,andbuildingcodesandpermittingprocessesandfeescancreating barrierstosolarprojects.BlaineCountyandthecitiesofHaileyandKetchumworked togethertoidentifyandreducethesetypesofbarriersandgainaSolSmartSilver designationasaresultoftheseefforts.Inadditiontoaddressingcommonbarriersto makeiteasierandmoreaffordabletoinstallsolar,marketingcampaignshaveproven tobeeffective.TheSunValleyInstituteforResiliencelaunchedSolarizeBlaine,a20weekcampaignwhichledto36solarinstallations,247kilowattsofgenerating capacityand$900,000inlocalinvestment.
TheBlaineCountyCleanEnergyCoalitionalsosubmittedcommentstotheIPUC applicationfromIPCOonitsValueofDistributedEnergyResourcesStudyto supportcost-effectivesolarnetmeteringrates.TheCoalitionurgedIPUCtorequire thatquantifiableenvironmentalcostsandbenefitsbeincludedtoensureajustand reasonablecalculationofanexportcreditrate.
Utilizefranchiseagreementsorenter intoacooperativeagreementwith theutilitythatoutlinesexpectations ofcollaborativeeffortstoward achievementofcleanenergygoals.
InIdaho,citiesmayenterintofranchiseagreementthatgrantacorporationtheright toprovideapublicutilityservicetocustomerswithinthecity’sjurisdiction.An emergingtrendamonglocalgovernmentsistonegotiatespecificcommitmentsin supportofcleanenergygoalsinelectricutilityfranchiseagreements.In2021,theCity ofHaileyaddedaclauseinitselectricutilityfranchiseagreementthatledtoajoint cleanenergyandclimateprotectioncooperationagreementwithIPCO.TheCityof KetchumisfollowingHailey’sleadasitnegotiatesarenewalofitsfranchise agreementwithIPCO.
Developanenergybenchmarking anddisclosurepolicyformunicipal andcommercialbuildings.
Energybenchmarkinganddisclosurepolicyisamarketbasedtoolthatincreases buildingenergyperformancebyencouragingorrequiringreportingofbuilding energyuse.Thepolicyfollowsacommonbusinessprinciple–whatgetsmeasured, getsmanaged.Policiestypicallyincludethreeelements:arequirementtoenter energyusedataintotheENERGYSTARPortfolioManager;aperformancetarget measuredinenergyusepersquarefoot;andatimeframeinwhichunderperforming buildingsmustmeetthetarget.
Developandlaunchalocally brandedgreenbusinesscertification programorBetterBuildings challenge.
Greenbusinesscertificationprogramshelpbusinessestosaveenergy,conserve water,reducewaste,andcontributetowardarangeoflocalenvironmentalpriorities. Certifiedbusinessesarerecognizedfortheirachievements.Anonlinetoolmakesit easyforbusinessestomanagedata,trackprogress,andquantifysavings.Thetool aggregatesdatatoreportthecumulativeimpactthatcertifiedbusinesscontribute towardlocalgoals.TheNevadaGreenBusinessNetworklaunchedaprogram.In 2021,30certifiedgreenbusinessesprovidedacumulativeimpactof$109,165incost savingsandthesebusinessessaved276,355poundsCO2eemissions,638,987kWhof electricityand12,389thermsofnaturalgas.
CreateaPropertyAssessedClean Energyfinancingprogramtosupport residentialandcommercialenergy efficiencyandcleanenergyretrofits.
PropertyAssessedCleanEnergy(PACE)financingprogramsweredevelopedto accelerateinvestmentsinenergyefficiencyandcleanenergy.PACEprogramsare enabledin38statesandtheDistrictofColumbia.Injustoveradecade,$9.8Bhas beeninvestedinimprovingbuildingperformance.Loansarerepaidthrougha voluntarybenefitassessmentthatisrecordedontheproperty,similartoasewer assessment.Similartoataxassessment,thefinancingistreatedasanoperatingcost andtreatedasanoff-balancesheetliability.Theassessmenttransferstoanewowner ifthepropertyissold.Thismodelhasbeenshowntoreduceriskandlowerthe overallcostofcapital.
Partnertoincreaseutilizationof weatherizationprogramsand expandthelocalhomeauditorand weatherizationworkforce.
IPCO,IdahoDepartmentofHealthandWelfare,andtheSouthCentralCommunity ActionPartnershipdeliverweatherizationprogramstoqualifyinghomeownersin BlaineCounty.Weatherizationassistanceprogramshelplow-incomeresidentsand familiesconserveenergy,reduceutilitycosts,andimprovethecomfortoftheir homes.Theseprogramsalsocreatejobsandcontributetolocaleconomies.TheDOE reportsthatforevery$1spentonenergyefficiency,$2.23isreturnedtothelocal economy.Since2010,Idahohasreceived$27.1MMfromDOEthatwasusedto weatherize3,307homesand44,185SFofadditionalbuildingspace.
Createincentivestoencourage buildingelectrification,cleanenergy installations,andlow-carbonornetzeroenergybuildings.
Developacommunitybased education,outreachandmarketing campaigntoadvanceall-electricand low-carbonornet-zeroenergy buildings.
Arangeofincentivescanbeimplementedtoencourageadoptionofbuilding electrificationtechnologies,cleanenergysystems,andlow-carbonbuildings. Streamlinedpermitting,reducedfees,anddensitybonusesarecommonlydeployed incentives.Collaboratingwiththebuildingsectortoidentifymeaningfulincentivesis themosteffectiveapproachforpolicydesign.
Educationandoutreacharealsoeffectivestrategiesforacceleratingadoptionofnew buildinganddesignsystemsortechnologies.Campaignsandeducationalprograms bringindustryleadersandmemberstogethertostrengthenconnectionsandshare lessonslearned.Campaignsincreaseawareness,disseminateknowledgetoimprove localexpertise,anddemonstratethecost-benefitsbyshowcasingmarketleadersand exemplaryprojects.
Increasedensityinthecitiesand connectcitieswithtransitand multimodaltransportation infrastructure.
ManycommunitiesutilizeframeworkssuchasSmartGrowthandCompleteStreetsto managegrowth,reduceclimateimpactsrelatedtolanduse,andcreatehealthierand moreequitablecommunities.SmartGrowthandCompleteStreetsprinciplesare complimentary.Theseframeworksareapplieduniquelybyeachcommunity.The principlesseektoadvancearangeofpriorities,including:compactdevelopment,a rangeofhousingoptions,walkability,place-making,mobilityandtransportation alternatives,attractinvestment,andlandpreservation.
Mixedusedevelopmentcolocatesresidentialandnonresidentialusestoprovidea rangeofbenefitstocommunities.Thesedevelopmentsorzoningareashavebeen showntoimprovehousingaffordability,increasewalkability,improvehealth outcomes,andattractinvestment.Thesedevelopmentsprovidebetteraccesstojobs, servicesandamenities.Theyalsoincreasetaxrevenues.
Expandelectricvehiclecharging infrastructure.
AbarriertobroadadoptionofelectricvehiclesisthelackofEVcharging infrastructure.Thefederalgovernmentisinthemidstofmakinga$5Binvestmentin EVinfrastructure.EVinfrastructureplansincludearangeofpoliciesandincentivesto encouragelocalinvestmentinEVchargingstations.Manyjurisdictionsalsodevelop EVsitingplanstoguidepublicinvestmentsinEVchargingovertime.TheCityof HaileyimplementedanEV-andsolar-readyrebateprogramtoencourageinvestment ininfrastructurethatwillreducethecostforEVandsolarinstallationsatalaterdate.
Developandlaunchanelectric vehicleeducation,outreachand marketingcampaign.
Nationalcampaignsareencouragingadoptionofelectricvehicles,suchastheDrive ElectricCampaignandtheSierraClub’sElectricVehicleCampaign.Thesecampaigns buildcoalitionstobettersupportlocalgovernmentwithpolicyrecommendations andengagebusinessleadersinmakingthetransitiontoelectricvehicles.Astatewide coalitionhasemergedtosupportIdahomunicipalitiesandbusinessesinatransition toelectricvehicles.Existingcampaignsandcoalitionsofferamodelforsuccessand maylendsupportandprovideguidanceondevelopmentofalocalcampaign.
Developagreenfleetspolicyand program,includingavehicle replacementschedule.
Agreenfleetpolicyisacommonpracticeusedbycitiesandcountiesthatseekto improveairqualityandreducecarbonemissions.Policiesincludeanumberof objectives,including:reducingcarbonemissions,optimizingfleetsize,promoting carpooling,loweringlife-cyclecostsofvehicles,andoptimizingfuelusagethrough drivereducation.Manymunicipalitiesrelyontechnologytotrackandmanagefleet data,planforfleetreplacementschedulesandcosts,andreportoutcomessuchas loweremissions.NationalinitiativessuchastheElectrificationCoalitionprovide technicalassistanceandresourcestosupportlocalgovernmentefforts.The ElectrificationCoalitionalsoestablishedanationalEVpurchasingcollaborativeto helpdrivedownthecostofvehiclesandequipment.


Amann, J., Srivastava, R., & Henner, N. (2021). Pathways for Deep Energy Use Reductions and Decarbonization in Homes. Washington, DC: American Council for an Energy-Efficient Economy. Retrieved from aceee.org/research-report/b2103
American Council for an Energy-Efficient Economy. (2022). State Energy EfficiencyScorecard: 2021 Progress Report. ACEEE.
ASHRAE. (2019). Achieving Zero Energy: Advanced Energy Design Guide for Small to Medium Office Buildings. ASHRAE. Retrieved from https://aedg.ashrae.org/
Barker, L. (2022, February 17). personal communication. Blaine County. (2021). Blaine County Emissions Factors and Activity Data. ICLEI USA.
Blaine County. (2022). Blaine County Clean Energy & Green Building Task Force.
Blaine County. (2022, February 16). Document Center. Retrieved from Community Profile: https://www.co.blaine.id.us/DocumentCenter/View/1387 3/Chp-0-Community-Profile
Borlaug, B., Salisbury, S., Gerdes, M., & Muratori, M. (2020, July 15). Levelized Cost of Charging Electric Vehicles in the United States. Retrieved from Joule: https://www.cell.com/joule/pdfExtended/S25424351(20)30231-2
Carbonfund.org. (2022, May 12). Offset Your Life. Retrieved from Carbonfund.org: https://carbonfund.org/carbon-offsets/ CNT. (2022, May 12). H+T Fact Sheet. Retrieved from CNT: https://htaindex.cnt.org/factsheets/?lat=43.4743428&lng=113.9664446&focus=county&gid=621#fs
Data Commons. (2022, February 16). Place Explorer. Retrieved from Blaine County: https://datacommons.org/place/geoId/16013?utm_med ium=explore&mprop=count&popt=Person&hl=en
Eno Center for Transportation. (2022, May 13). VMT per capita. Retrieved from Eno: https://www.enotrans.org/wp-content/uploads/2019/06 /VMT-per-capita-by-state-1981-2017-1.pdf
Florida, R. (2017, April 6). What Drove the Driving Downturn? Retrieved from Bloomberg: https://www.bloomberg.com/news/articles/2017-0406/does-compact-development-reduce-driving Group 14. (2020). Electrification of Commercial and Residential Buildings. Community Energy, Inc. Retrieved from https://www.communityenergyinc.com/wpcontent/uploads/Building-Electrification-StudyGroup14-2020-11.09.pdf
Group 14 Engineering. (2020). Electrification of Commercial and Residential Buildings. Group14 Engineering, PBC.
Idaho Power. (2021, May). 2020 ESG Report. Retrieved from Idaho Power: https://docs.idahopower.com/pdfs/ AboutUs/sustainabilityReport/2020-ESG-report.pdf
Idaho Power. (2021). 2021 Integrated Resource Plan Appendix B: DSM Annual Report. Idaho Power. Retrieved from https://docs.idahopower.com/pdfs/AboutUs/Planningfo rFuture/irp/2021/2020_IRP_AppB_DSM_WEB.pdf
Idaho Power. (2021, December). Integrated Resource Plan. Retrieved from Idaho Power: https://docs.idahopower.com/pdfs/AboutUs/Planningfo rFuture/irp/2021/2021%20IRP_WEB.pdf
Idaho Power. (2022, May 22). Our Energy Sources. Retrieved from Idaho Power: https://www.idahopower. com/energy-environment/energy/energy-sources/ Idaho Power. (2022, February 24). personal communication.
Idaho Transportation Department. (2022, February 9). Blaine County Vehicle Registration Data.
Interagency Working Group on Social Cost of Greenhouse Gases, United States Government. (2016). Technical Support Document: Technical Update of the Social Cost of Carbon for Regulatory Impact Analysis Under Executive Order 12866. US Environmental Protection Agency. Retrieved from https://www.epa.gov/sites/production/files/201612/documents/sc_co2_tsd_august_2016.pdf
Intermountain Gas Company. (2022, May 12). What Renewable Natural Gas Means for You. Retrieved from Intermountain Gas Company: https://www.intgas.com/ rates-services/renewable-natural-gas/ Minos, S. (2021, April 15). No Fooling - Energy Saving Do-It-Yourself Projects Can Be Easy and Affordable. Retrieved from energy saver: https://www.energy.gov/ energysaver/articles/no-fooling-energy-saving-do-ityourself-projects-can-be-easy-and-affordable Nadel, S. (2020). Programs to Promote Zero-Energy New Homes and Buildings. American Council for an Energy-Efficient Economy. Retrieved from https://www.aceee.org/sites/default/files/pdfs/zeb_topic _brief_final_9-29-20.pdf
Nadel, S. (2020, September 30). Zero-energy Buildings are Focus of Growing Number of Energy Efficiency Programs. Retrieved from American Council for an Energy-Efficient Economy: https://www.aceee.org/blogpost/2020/09/zero-energy-buildings-are-focusgrowing-number-energy-efficiency-programs
National Renewable Energy Laboratory. (2017). Electrification & Decarbonization: Exploring U.S. Energy Use and Greenhouse Gas Emissions in Scenarios with Widespread Electrification and Power Sector Decarbonization. Golden, CO: National Renewable Energy Laboratory. Retrieved from https://www.nrel.gov/docs/fy17osti/68214.pdf
Nock, L., & Wheelock, C. (2010). Energy Efficiency Retrofits for Commercial and Public Buildings. Pike Research. Retrieved from https://paceworx.com/wpcontent/uploads/srm/pdf/whitepapers/Energy_Efficienc y_Retrofits_Jul10.pdf
Office of Energy Efficiency & Renewable Energy. (2022, February 8). Buildings. Retrieved from DOE Zero Energy Ready Home Program Requirements: https://www.energy.gov/eere/buildings/doe-zeroenergy-ready-home-program-requirements
Office of Energy Efficiency and Renewable Energy. (2022, February 8). Status of State Energy Code Adoption. Retrieved from Idaho: https://www.energycodes.gov/status/states/idaho
Pacific Northwest National Laboratory. (2013). CostEffectiveness Analysis of the 2009 and 2012 Residential Provisions - Technical Support Document. US Department of Energy. Retrieved from https://www.pnnl.gov/main/publications/external/techni cal_reports/PNNL-22068.pdf
Pacific Northwest National Laboratory. (2013). Energy and Energy Cost Savings Analysis of the IECC for Commercial Buildings. US Department of Energy. Retrieved from https://publicservice.vermont.gov/sites/ dps/files/documents/Energy_Efficiency/code_update/Co mm%20PNNL-22760.pdf
Pacific Northwest National Laboratory. (2015). 2015 IECC: Energy Savings Analysis. US Department of Energy. Retrieved from https://www.energycodes.gov/sites/default/files/202107/2015_IECC_FinalDeterminationAnalysis.pdf
Pacific Northwest National Laboratory. (2015). Energy and Energy Cost Savings of the 2015 IECC for Commercial Buildings. US Department of Energy. Retrieved from https://www.pnnl.gov/main/publications/external/techni cal_reports/PNNL-24269.pdf
Pacific Northwest National Laboratory. (2018). Energy and Energy Cost Savings Analysis of the 2018 IECC for Commercial Buildings. US Department of Energy. Retrieved from https://www.pnnl.gov/main/publications /external/technical_reports/PNNL-28125.pdf
Pacific Northwest National Laboratory. (2019). Energy Savings Analysis: 2018 IECC for Residential Buildings. US
Department of Energy. Retrieved from https://www.energycodes.gov/sites/default/files/202107/EERE-2018-BT-DET-0014-0008.pdf
Pacific Northwest National Laboratory. (2021). Preliminary Energy Savings Analysis: 2021 IECC Residential Buildings. US Department of Energy. Retrieved from https://www.energycodes.gov/sites/default/files/202107/2021_IECC_PreliminaryDetermination_TSD.pdf
Pothen, J. (2022, July 14). Inside Clean Energy: Some EVs Now Pay for Themselves in a Year. Retrieved from https://insideclimatenews.org/news/14072022/insideclean-energy-electric-vehicles-gas-prices/ Rennert, K., Prest, B. C., Pizer, W. A., Newell, R. G., Anthoff, D., Kingdon, C., . . . Errickson, F. (2021). The Social Cost of Carbon: Advances in Long-term Probabilistic Projections of Population, GDP, Emissions, and Discount Rates. BPEA Conference Draft. Retrieved from https://www.brookings.edu/bpea-articles/thesocial-cost-of-carbon/
Solar Energy Industries Association. (2021, December 14). Solar Industry Research Data. Retrieved from Solar Energy Industries Association: https://www.seia.org/solar-industry-research-data U.S. Energy Information Administration. (2020). Transportation. Washington D.C.: US EIA.
U.S. Energy Information Administration. (2022, January 31). Energy Prices by Sector and Source. U.S. Environmental Protection Agency, State Clean Energy and Climate Program. (2009). Clean Energy Lead by Example Guide: Strategies, Resources, and Action Steps for State Programs. Retrieved from https://www.epa.gov/sites/default/files/2015-08/ documents/state_lead_by_example_guide_full_report.pdf
U.S. Energy Information Administration. (2021). Retrieved from Annual Energy Outlook 2021: https://www.eia.gov/outlooks/aeo/data/browser/#/?id= 3-AEO2021®ion=1-8&cases=ref2021&start= 2019&end=2050&f=A&sourcekey=0
U.S. Census Bureau. (2022, May 12). Means of Transportation to Work by Selected Characteristics. Retrieved from U.S. Census Bureau: https://data.census.gov/cedsci/table?q=Blaine%20Coun ty&g=1600000US0854330&tid=ACSST5Y2020.S0802
5B CAN is BlaineCounty’s Sustainability & Climate Program. 5B CAN is co-funded by Blaine County andthe City of Ketchum with support from theCity of Hailey. 5B CAN engages the cities as well as the community: nonprofits, businesses, and residents. It is a call to action. It embodies our aspirations for a sustainable and resilient community – onethat tackles thechallenge of climate change and elevates the quality of life for all residents andvisitors today and well into the future.

BLAINE COUNTY, 206 SOUTH 1ST AVENUE, HAILEY, ID 83333 | https://www.co.blaine.id.us CITY OF KETCHUM, 191 5th STREET WEST, KETCHUM, ID 83340 | https://www.ketchumidaho.org

