Page W4 · Richmond Review
Friday, March 8, 2013
City ofCity Richmond of Richmond
FiveFive YearYear Financial Financial PlanPlan
City ofCity Richmond of Richmond
FiveFive YearYear Financial Financial PlanPlan
www.richmond.ca www.richmond.ca
The average Canadian spends 41 per cent of their income on taxes. Of this, just 11 per cent goes to property taxes. Further, slightly less than half of the property taxes you pay go the City. The remainder is collected on behalf of the Province of BC (for school taxes), Translink for public transit and transportation services, the Metro Vancouver regional district, the BC Assessment authority and others. Ultimately, the City receives about four cents of every tax dollar you pay. The City is not allowed to budget for a deficit. Thus, the portion of property taxes raised by the City each year is based on the amount of revenue required to end up with a balanced budget with no deficit.
2011 Average Household Tax and Distribution*
Income spent on non-tax items 59%
2013 Utility Budget The City’s 2013 Utility Budget funds services for water supply, sewage collection and treatment, draining, diking, garbage disposal, recycling, flood protection, grease management and environmental protection. The City’s total utility budget for 2013 is about $90 million. The bulk of this budget, 45 per cent, is comprised of service fees set by Metro Vancouver regional district for provision of water supply and sewage treatment and disposal. Currently, the region is investing billions of dollars in ensuring our water supply and sewage treatment meet high public health and environmental standards. This has caused the City’s utility costs to increase at an accelerated rate.
The 5 Year Financial Plan is based upon the 2013 Operating, Capital and Utility Budgets, as approved by Council. The remaining four years of the plan are estimates based on Council Policies, economic forecasts for BC and the City’s internal plans. Each year, this rolling plan is reviewed and updated. The Community Charter requires that Council adopt a 5 Year Financial Plan each year prior to the adoption on or before May 15 of each year and prior to the adoption of the annual Property Tax Bylaw. Council approved the 5 Year Financial Plan for 2013-2017 on February 25.
Copies of the 5 Year Financial Plan and the 2013 Operating, Capital and Utility Budgets are available: • Via the City website at www.richmond.ca (City Hall > Finance, Taxes & Budgets > Budgets & Financial Reporting > 5 Year Financial Plan) • Via email request to finance@richmond.ca • Via printed copy, available at Richmond City Hall - Information Counter, 6911 No. 3 Road or by calling 604-276-4000
The average daily cost for most single family residences for City utility services remains at $3.66 a day.
Fuel and Energy Taxes 4%
2013 Net Utility Bill Breakdown
Long Term Financial Management Strategy
Estimates: based on an average single-family residence
The Long Term Financial Management Strategy approved by Council is designed to ensure that the City has the financial means to provide for the current and future needs of the community.
COST PER YEAR
9%
Income Taxes 32% Sales Taxes 15%
The purpose of the 5 Year Financial Plan is to provide a budgetary framework for the City to plan the management of its resources, revenues and expenditures in order to best serve the community. It is meant to ensure the City has the capacity to meet the financial challenges of today and in the future and to maintain appropriate levels of civic services.
This year, the City is introducing two enhanced recycling and waste disposal programs to improve service for residents and support our commitment to divert 70 per cent of waste from landfills by 2015. This includes a new Large Item Pick Up program and a new Green Cart program for recycling food scraps and yard trimmings.
Income spent on taxes 41%
Property Taxes (incl. School Taxes etc.) 11%
www.richmond.ca www.richmond.ca
Why do we prepare 5 Year Financial Plan?
Follow the money trail
Other Taxes Profits Taxes 9%
Richmond Review · Page W1
Friday, March 8, 2013
Social Security, Medical, Hospital Taxes 20%
Property Taxes make up 11% of the taxes paid by Richmond Residents with half going towards CIty services. *Source: Fraser Institute
COST PER DAY
Water
$577.95
$1.58
Sewer
$385.38
$1.06
Garbage, recycling & environmental programs
$251.40
$0.69
Dikes & drainage
$120.31
$0.33
$1,335.04
$3.66
Total cost
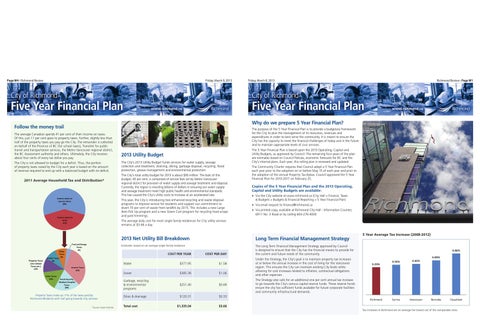
Under the Strategy, the City’s goal is to maintain property tax increases at or below the annual increase in the cost of living for the Vancouver region. This ensures the City can maintain existing City levels while allowing for cost increases related to inflation, contractual obligations and other expenses.
5 Year Average Tax Increase (2008-2012)
4.86%
3.25%
3.55%
3.65%
Surrey
Vancouver
4.06%
The Strategy also calls for an additional one per cent annual tax increase to go towards the City’s various capital reserve funds. These reserve funds ensure the city has sufficient funds available for future corporate facilities and community infrastructural demands. Richmond
Burnaby
Coquitlam
Tax increases in Richmond are on average the lowest out of the comparable cities.