


www.biogas-india.com
Edition 22
new tool for Anaerobic Digestion (AD) plant: Cell count and determinations of Microorganisms P-16 Biogas and its value chain for waste management: feedstock logistics
Dairy
Magazine |
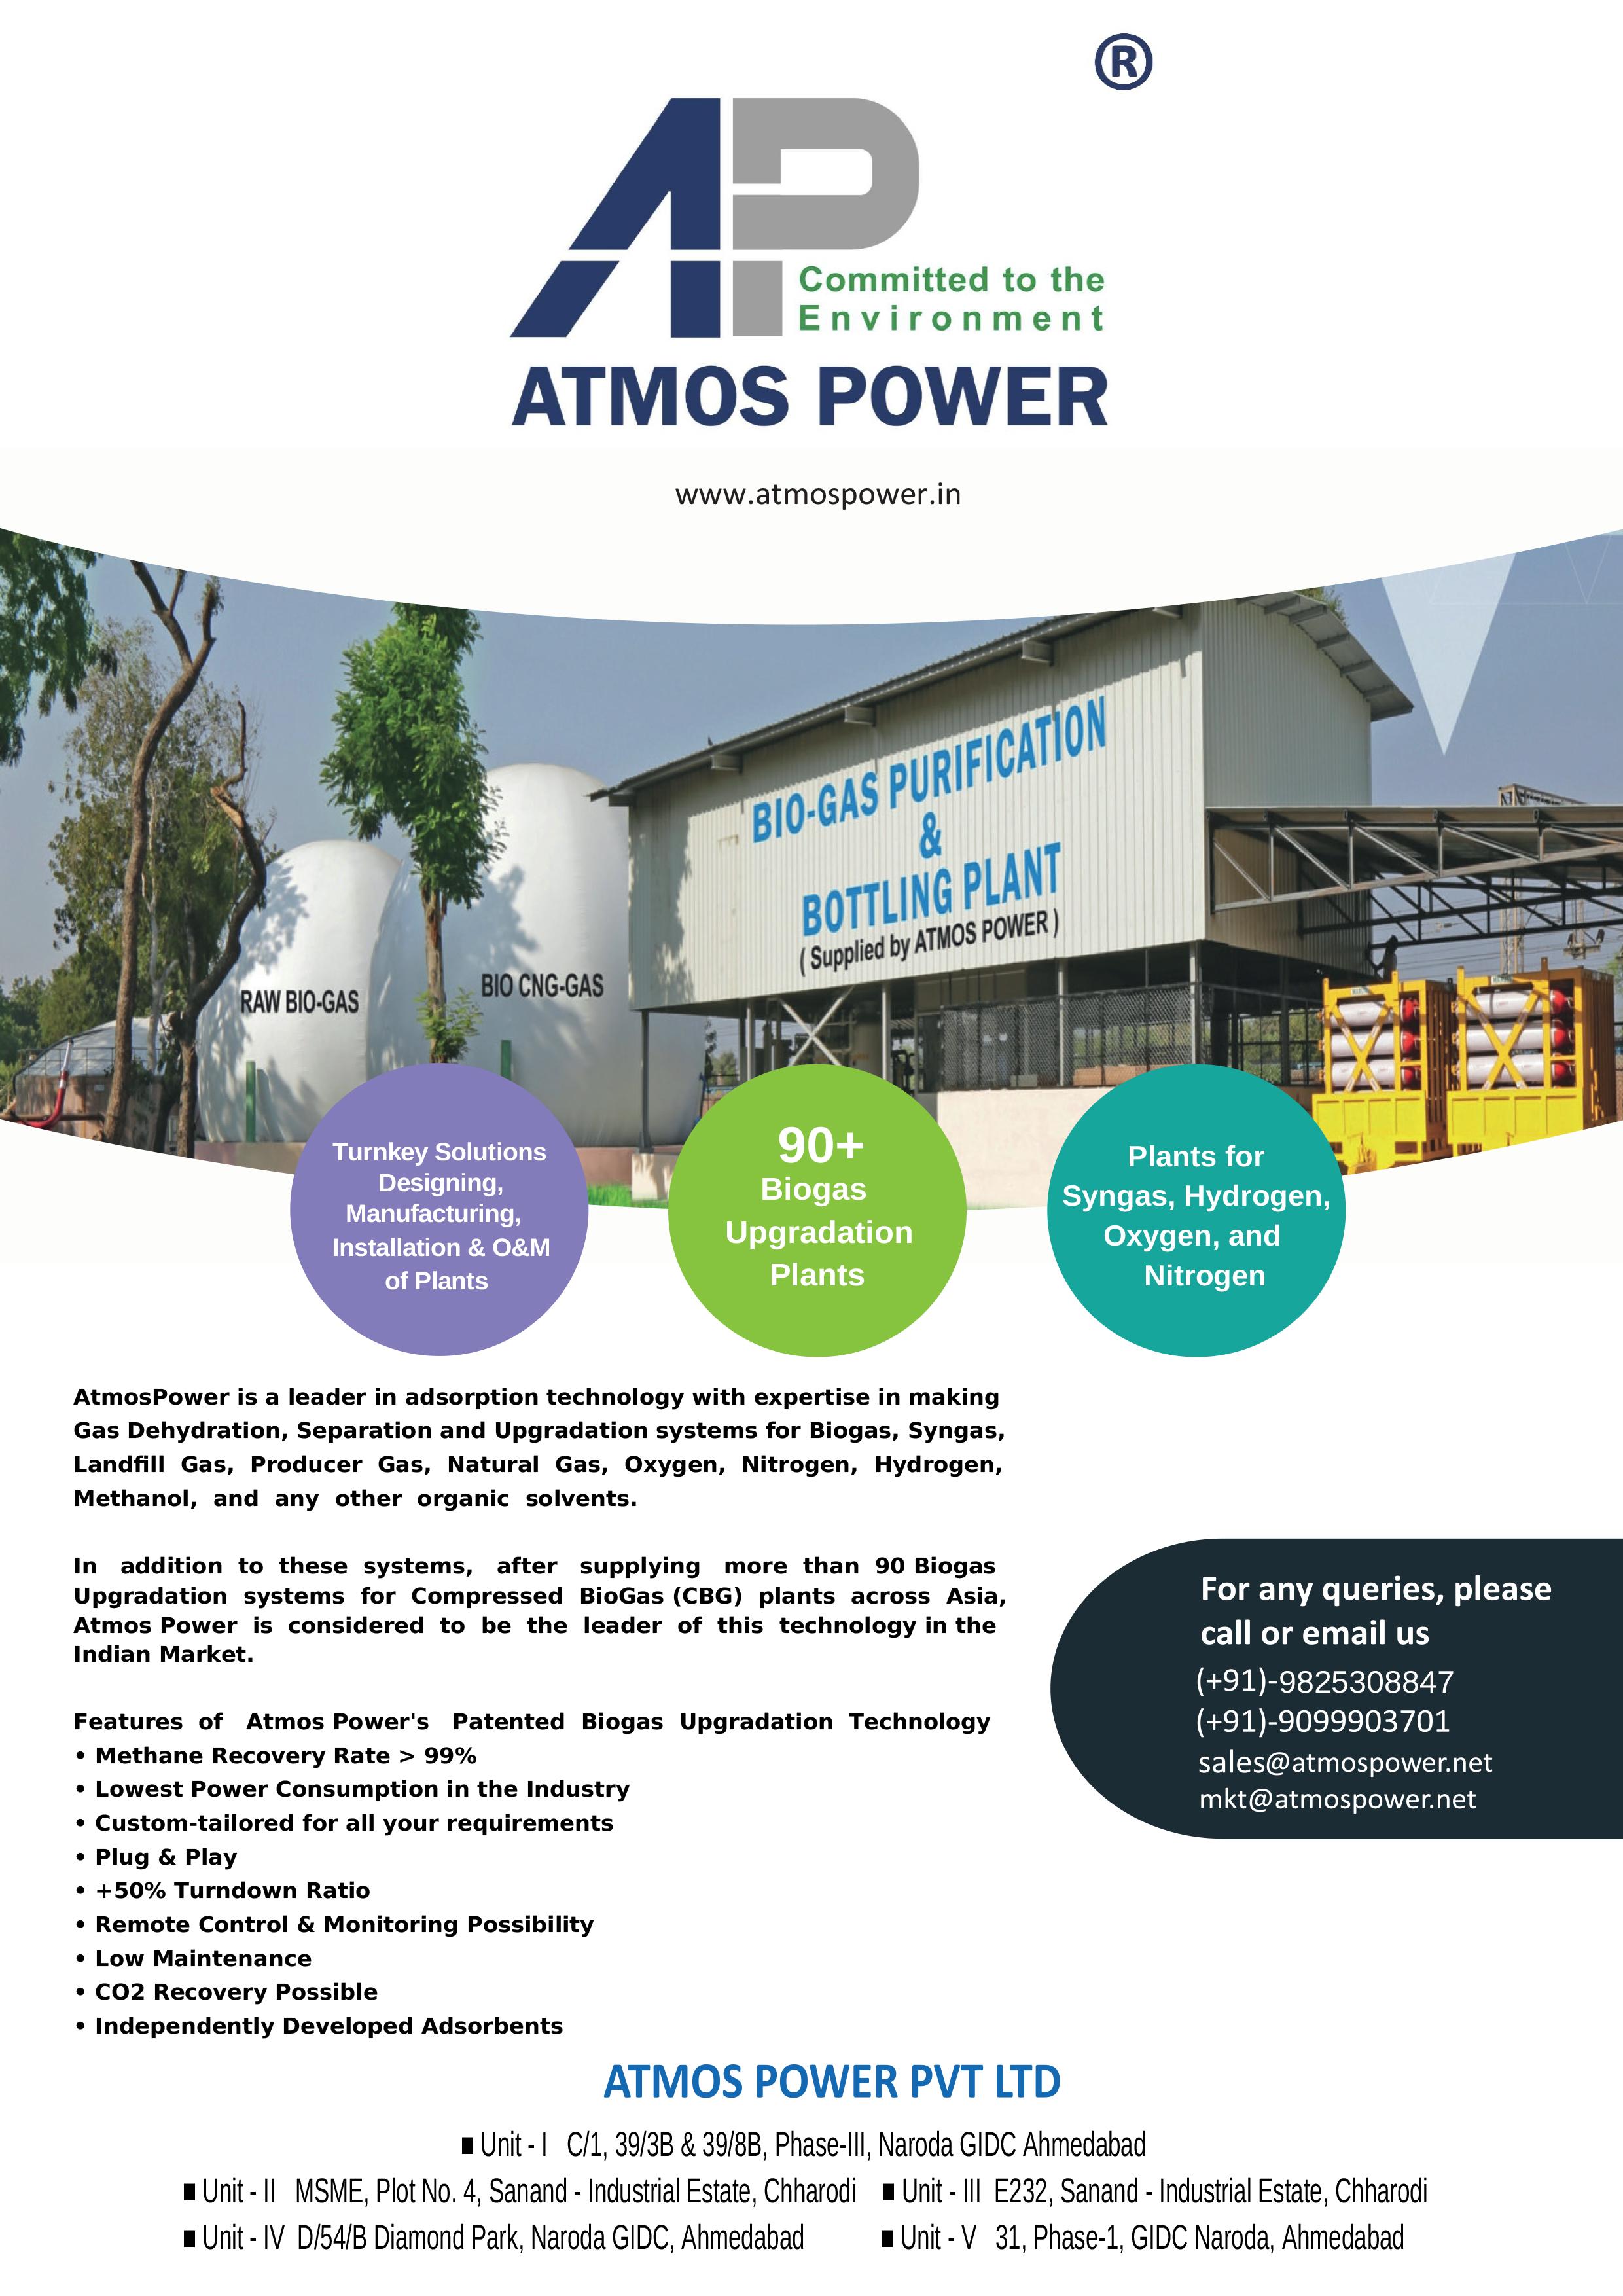
Title Sponsor: Atmos Power Pvt. Ltd.
A
P-22 Waste to Wealth –Generation of Bio-Energy from Obnoxious Sludges in a
P-12


 Editors Savita Boral Abhijeet Mukherjee Designer Komal Raghav Administrator Vishal Kanchan Production Co-ordinator Kavita Tanwar
About

The “Indian Biogas Association” (IBA) is the first nationwide and professional biogas association for operators, manufacturers and planners of biogas plants, and representatives from public policy, science and research in India. The association was established in 2011 and revamped in 2015 to promote a greener future through biogas. The motto of the association is “propagating biogas in a sustainable way”.
Dear Reader,
We wish you a very happy, healthy, and prosperous 2023!
The Biogas Fraternity's tireless work to reinstate the MNRE CFA program paid off in the final quarter of 2022. It is a big boost for the industry, especially for the SATAT scheme, which has an ambitious target to achieve and will motivate the new project developers to come up with CBG plants. It also witnessed the introduction of the BIS standards for the biogas and CBG industries, along with an amendment to the Energy Conservation Bill 2022, which is expected to support the growth of the biogas and CBG industries. For more information, please check the ‘IBA News’ section.
Based on the feedback received from our members, we would like to inform you that IBA is coming up with a scaledup version of the Bio-Energy Pavilion at the REI Expo in Greater Noida from October 4 to 6, 2023. For more information, please stay tuned to https://biogas-india.com/bio-energy-pavilion-2023/.
In continuation of our earlier edition, we have several interesting and informative articles for you. You can learn about the feedstock logistics, which are a lifeline for any Biogas/ CBG plant, the potential of green hydrogen from bio-methane, the potential of biogas in the wastewater treatment plants, the microbial classification of Biogas fermenters by methanogenic archaea and hydrolytic bacteria in anaerobic digestion, a case study on bioenergy from dairy waste, the need for green energy (focused on Biogas/CBG), and the importance of periodical lab testing of the substrates for smooth operations of the Biogas/CBG plants.


/biogasindia
As always, we do our best to keep our readers updated by providing them with the latest happenings in the sector. Please let us know if there is a specific topic you would like us to explore. Please share your thoughts with us at info@ biogas-India.com.
Wish you a Happy digesting and a greener future!
Dr. A. R. Shukla President Indian Biogas Association
Biogas Magazine | Edition 22 | 3
/indianBiogasAssociation “


Biogas Magazine | Edition 22 | 4 CONTENTS Inside 16 30 A new tool for Anaerobic Digestion AD plants: Cell count and determinations of Microorganisms National Corner 08 IBA news 12 Waste to Wealth – Generation of Bio-Energy from Obnoxious Sludges in a Dairy 22 Biogas and its value chain for waste management: feedstock logistics 26 Essence of lab testing in biogas 39

Biogas Magazine | Edition 22 | 5 International Corner 16 A new tool for Anaerobic Digestion AD plants: Cell count and determinations of Microorganisms 28 The hype about hydrogen – wonderful or insane? Philosophy Corner 36 My Behavior is All ... I can Change 28 Published By 12 The hype about hydrogen – wonderful or insane? Waste to Wealth – Generation of Bio-Energy from Obnoxious Sludges in a Dairy
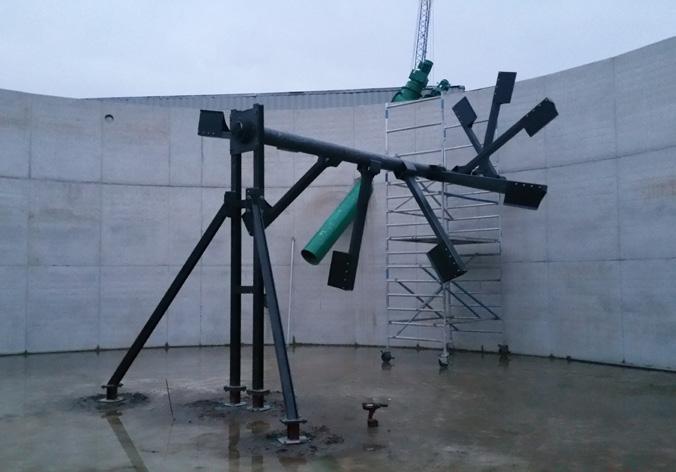
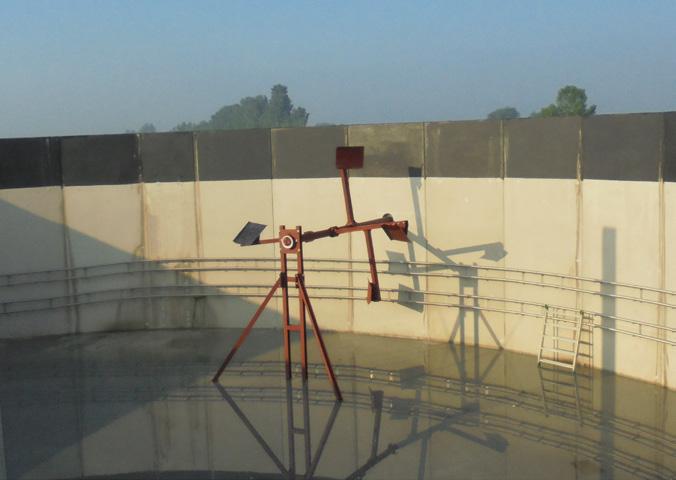
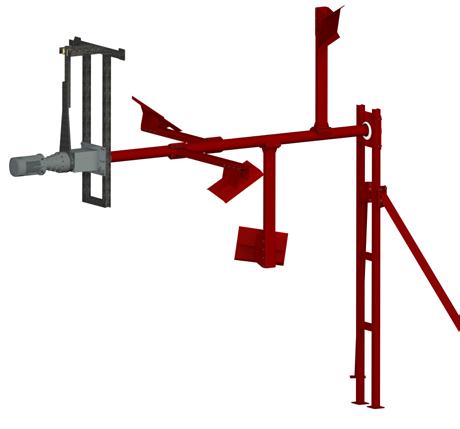
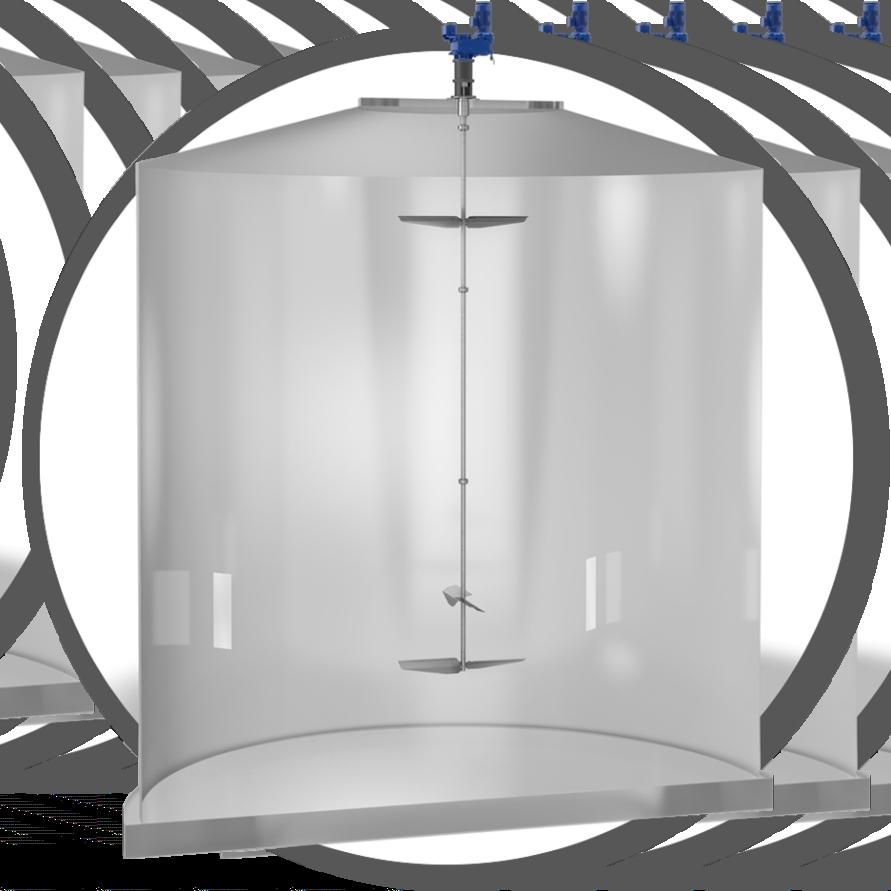
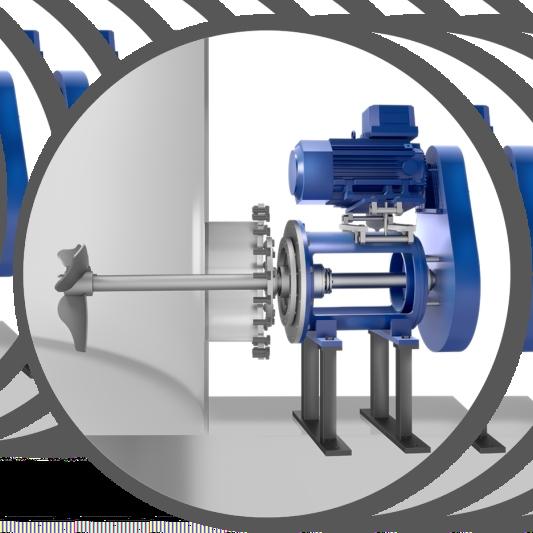
Steverding Agitator Technology is an expert in agitators. High technology is expected today at all levels of power generation. Steverding Agitator Technology can boast more than 20 years of experience in the manufacture of agitators. The continuous optimization and analysis of our products together with constant technical innovation show best results. Today, we are partners and system component suppliers of leading biomass facility manufactures in Germany, France, United Kingdom, Lithuania and many other countries.


Steverding Agitator Technology • Gerhart-Hauptmann-Str. 41 • 48703 Stadtlohn • Germany
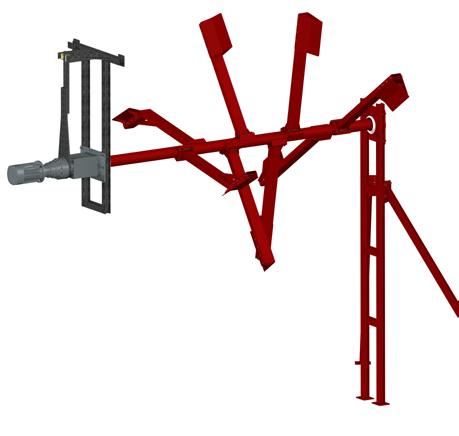
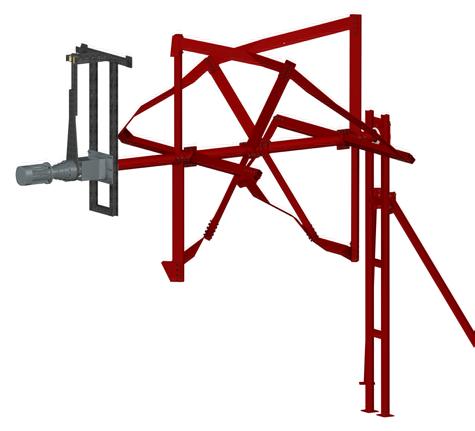
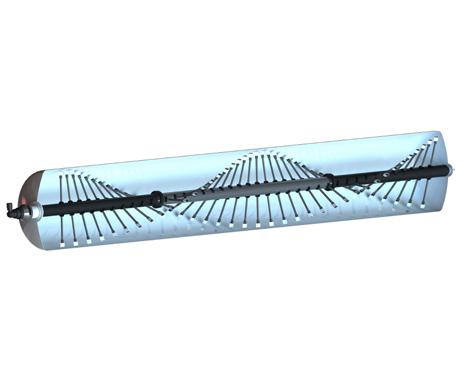
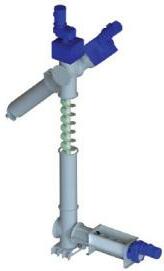
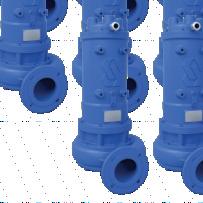
Spiralo® Long shaft agitators Vertical agitators Plug-flow agitators Hydromixer Schwanko Steverding Agitator Technology @ Gerhart-Hauptmann-Str. 41, 48703 Stadtlohn, Germany info@rt-st.com +49 2563 - 2088820 www.rt-st.com Contact person India Jörg Grondke Tel.: +49 17664751630 Mail: joerg.grondke@hrgsolutions.de Impressions:
This is our current range of agitators from Steverding Agitator Technology:
Biogas to Power and Biogas Upgrading Systems
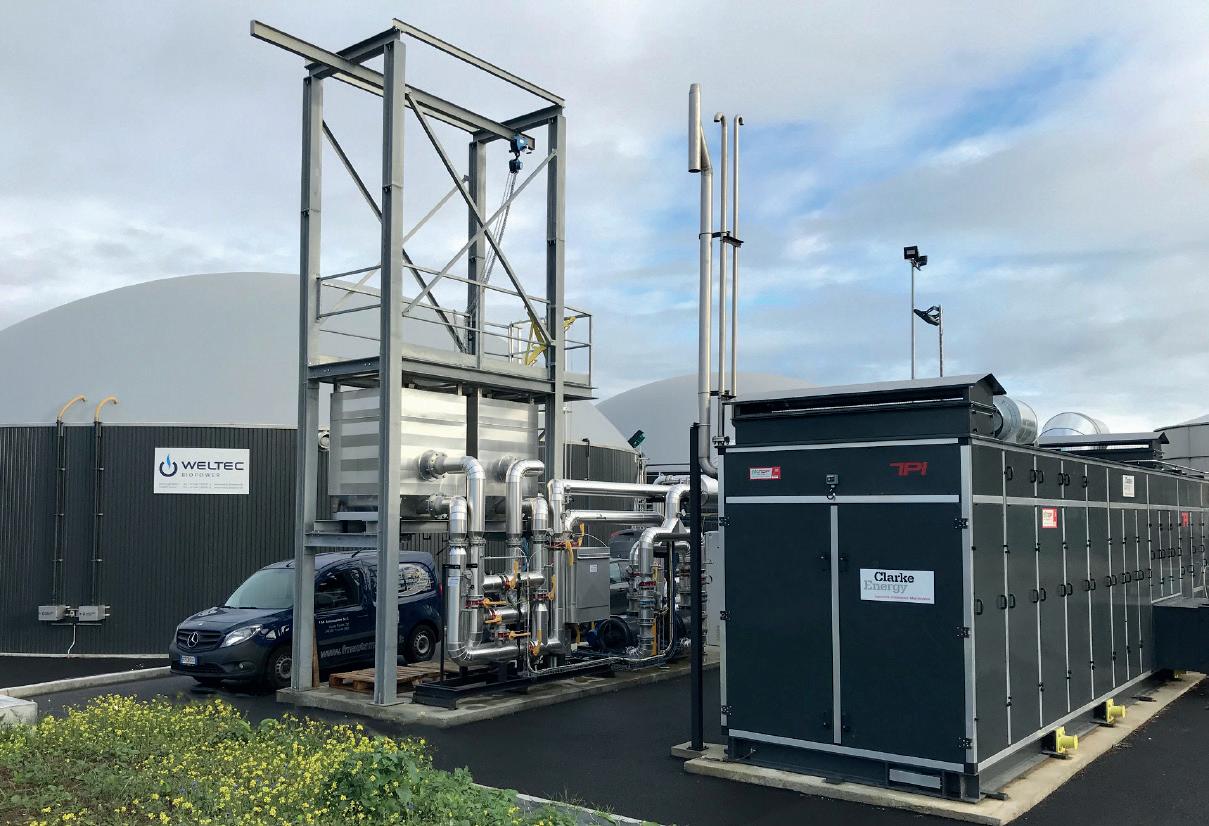
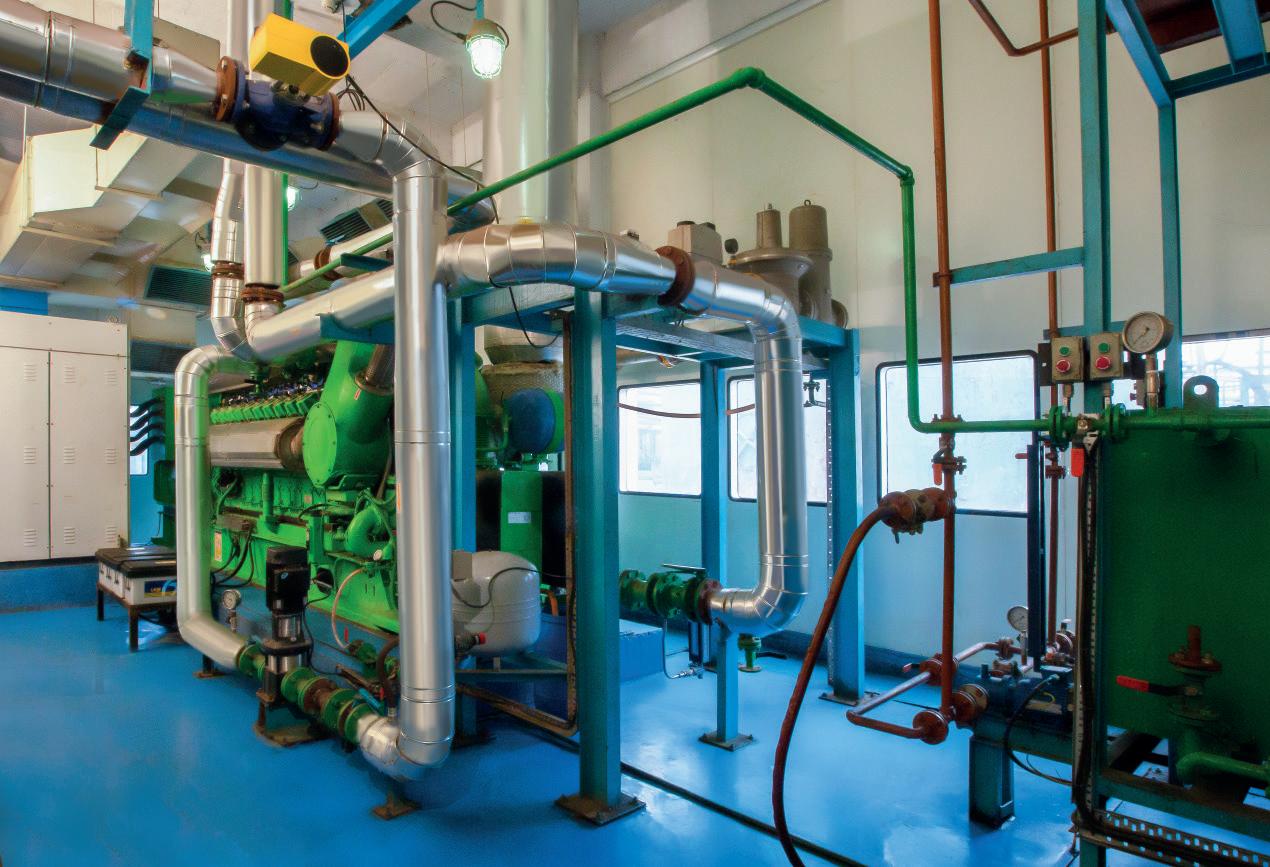
Biogas to Power
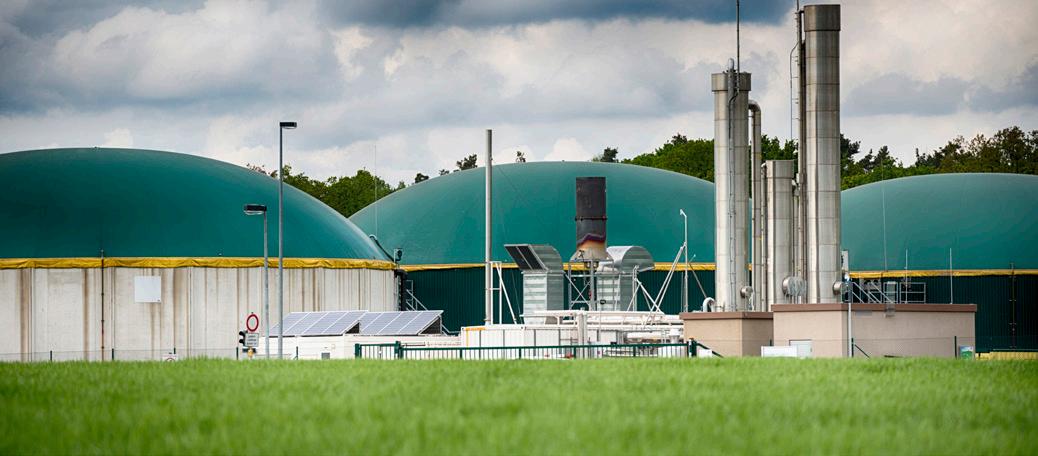
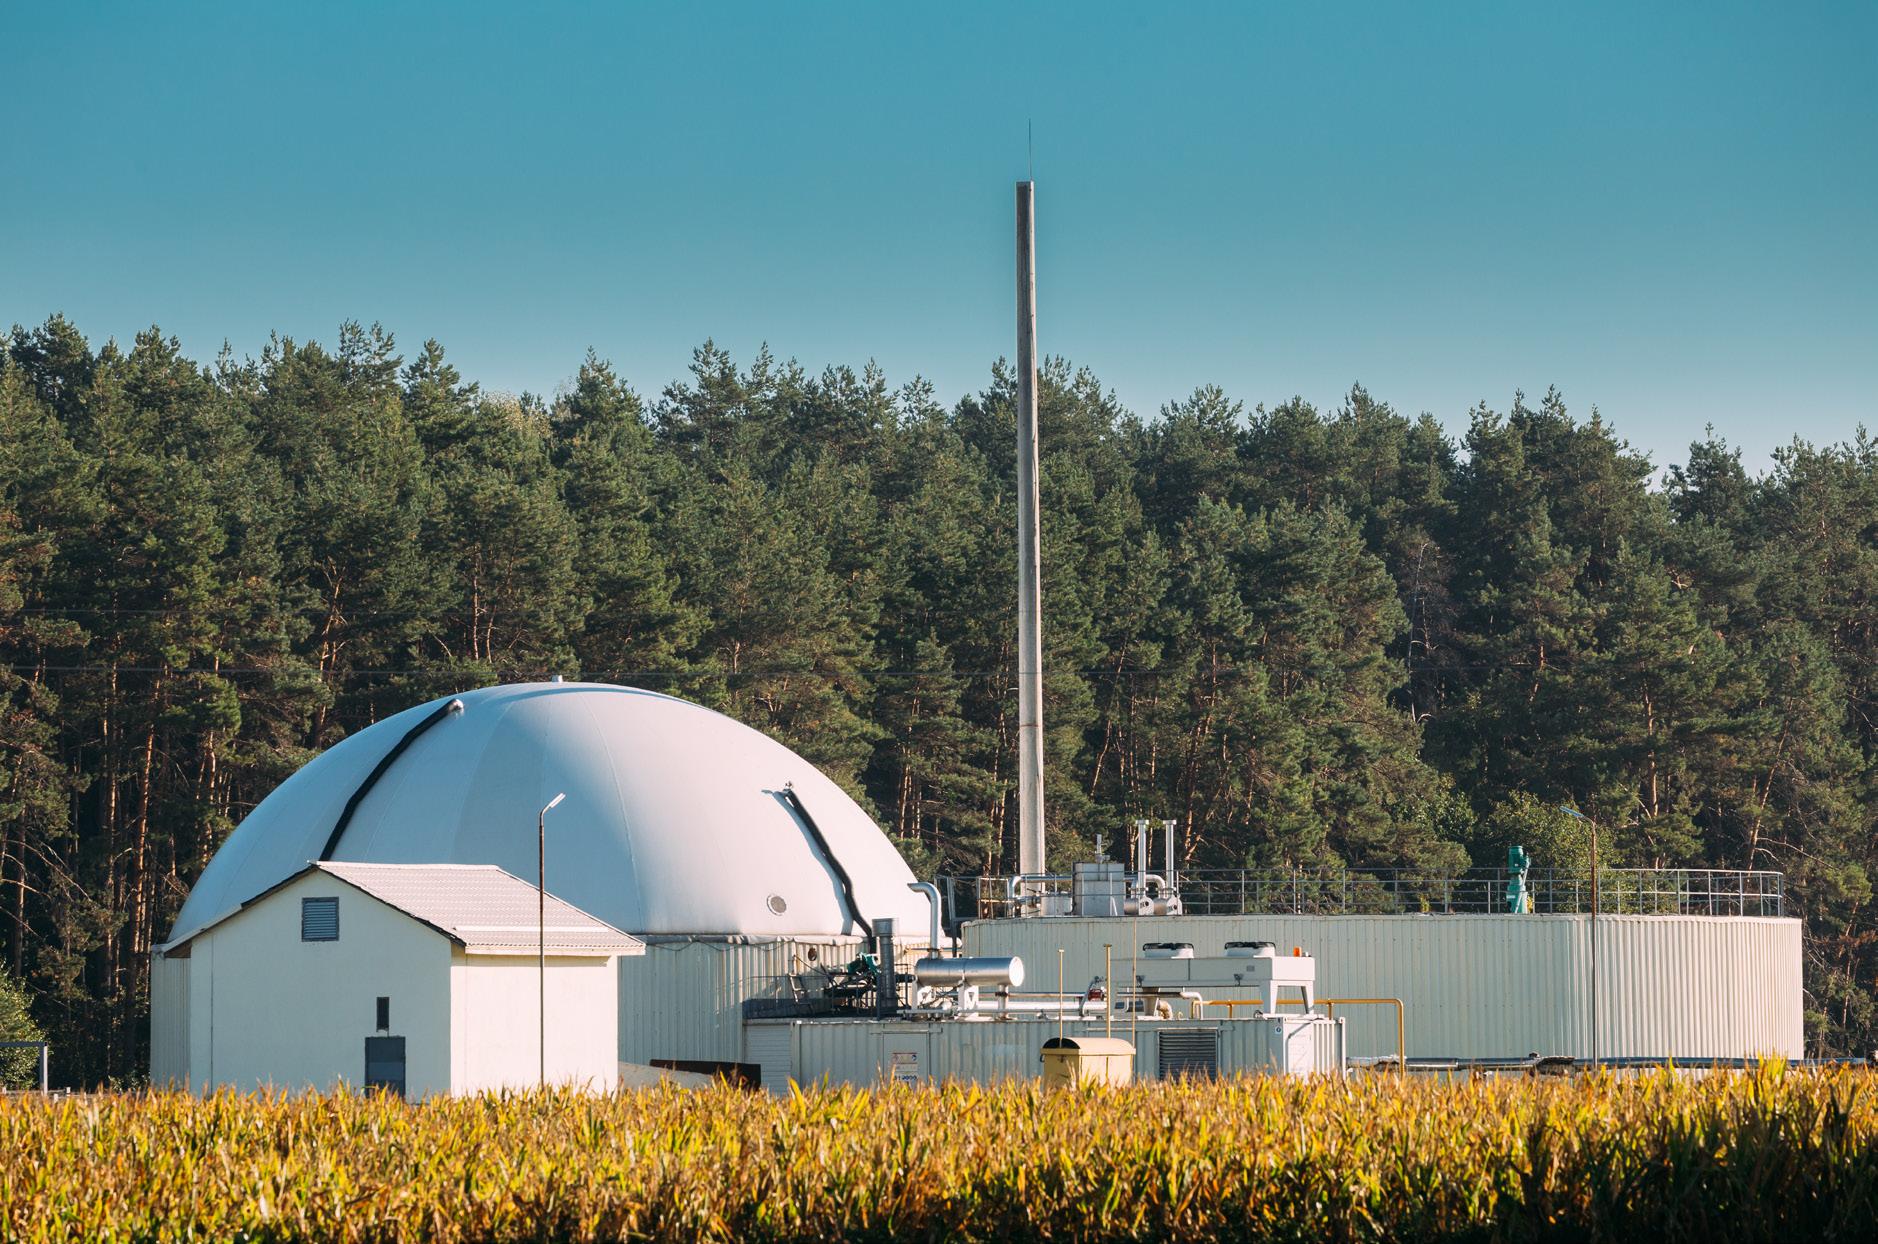
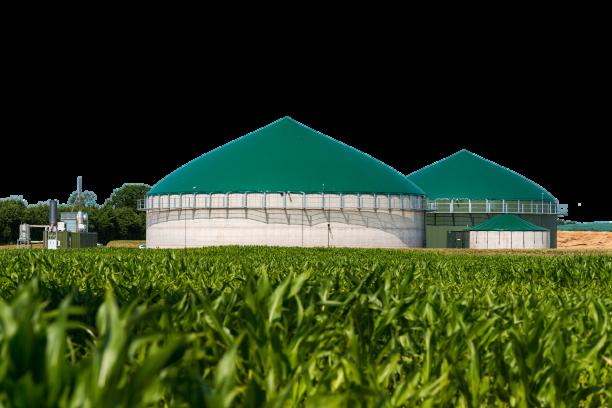
Disposal and treatment of biological waste represent a major challenge for the waste industry. For a wide range of organic substances from agriculture, foodstuff of feed industries, anaerobic digestion is a superior alternative to composting. Biogas – a mixture of both methane and carbon dioxide – is created during anaerobic digestion and serves as a high-energy renewable fuel that can be used as a substitute for fossil fuels. Biogas-fuelled gas engines improve waste management while maximising the use of an economical energy supply.
Biogas Upgrading (Membrane gas separation technology)
Biogas upgrading is the process of the separation of methane from the carbon dioxide and other gases from biogas.
The concentrated biogas – close to 100% methane is called ‘biomethane’ or ‘renewable natural gas’ (RNG). This gas can be used as a vehicle fuel or injected into the gas distribution network. Biogas upgrading can be used in parallel to gas engines where power and heat are required on site.
Find out more | Contact
Clarke Energy India Private Limited Shivkiran, Plot No. 160, CTS No. 632, Lane No. 4, Dahanukar Colony, Kothrud, Pune 411038, India
Tel. 020-30241777 Email. india@clarke-energy.com www.clarke-energy.com
Biogas Magazine | Edition 22 | 7
Why Clarke Energy for biogas to power and biogas upgrading solutions? + Local long-established presence and footprint in India + Local team of field service engineers + Unparalleled international biogas experience on varying applications and process technologies + Proven, best-in-class technology + Quality engineering + Combination of biogas CHP and biogas upgrading support
IBA’s commitment towards leapfrogging the prospect in the biogas/bio-CNG industry
- Period: October - December, 2022
IBA organized a webinar about the CFA scheme
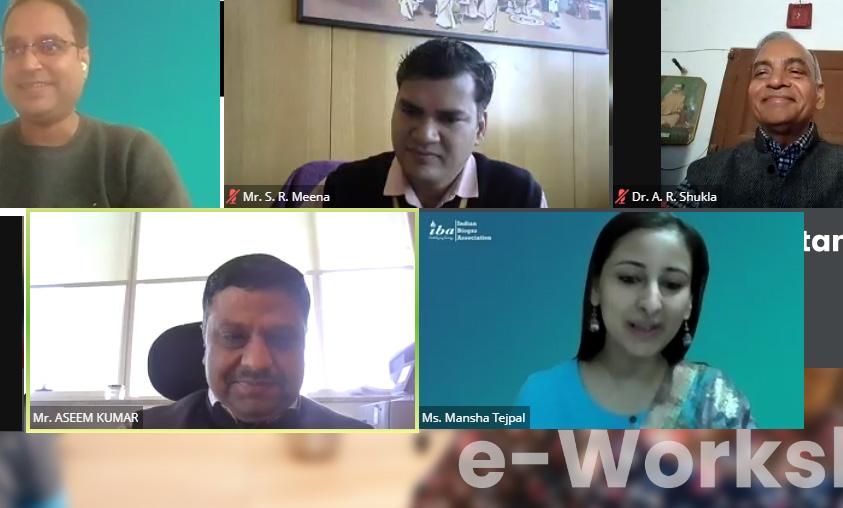
On November 23, 2022, IBA organized a webinar to get insights into the "Central Financial Assistance" (CFA) for the Biogas/CBG program, where MNRE officials presented the scheme to the stakeholders and resolved their queries related to the upcoming projects and existing Biogas/CBG projects. Mr. Aseem Kumar (director) and Mr. S. R. Meena (scientist) from MNRE participated in the webinar. The webinar witnessed participation from over 500 stakeholders.
Formulation of Indian Standards on Biogas
IBA, as a committee member, in coordination with other participatory members in the Standard Development Committee, finalized the document titled "Development of Indian Biogas Standards on Design, Material of Construction, Production, Purification, Energy Generation, Cooking Gas, and Bottling. All members of the standards committee were present for a series of discussions, which were presided over by MNRE's joint secretary. The document, upon its finalization, was submitted to BIS for its onward review.
Thereafter, several meetings were called upon by the Bureau of Indian Standards (BIS) to discuss the standardization draft for biogas plants, followed by its revision as deemed fit. The draft report was thoroughly discussed and unanimously agreed upon by all the members of the BIS committee. The "Biogas Standards Committee" held its final meeting in December to publicize the standard draft and solicit public input. Once this stage of receiving comments from the public and its incorporation is accomplished, the standards will be up for adoption and compliance.
Biogas Magazine | Edition 22 | 8
Training workshop for financial institutions
Even though the biogas/CBG industry is included in the priority lending sector, they still face financial support challenges because a majority of enthusiasts, including experts, potential business owners, environmentalists, NGOs, financial institutions, etc., are yet to fully understand the potential of biogas and all of its related aspects. As a result, there remains knowledge asymmetry in the biogas/CBG sectors on several fronts.
Within this context, it is cru-
cial to routinely carry out appropriate capacity-building exercises to ensure that industry stakeholders are adequately aware of financial institutions' perspectives and vice versa. At GAIL Training institute, Noida, IBA, and its partner groups conducted a workshop for financial institutions to address officials from some of the major Financial Institutions on November 11 and 12, 2022.
The training's objective was to improve participants' un-
derstanding of the crucial components of prospective biogas/CBG projects. The training aided in fostering the trust and quick decision-making that shall prove essential for effective capital infusion into the biogas/bioCNG sector.
Abhijeet Mukherjee Program Director Indian Biogas Association

Biogas Magazine | Edition 22 | 9

Biogas Magazine | Edition 22 | 11
Waste to Wealth – Generation of Bio-Energy from Obnoxious Sludges in a Dairy
Since 1970, India's milk production has grown by an average of nearly 4% per year, and in 2006 it became the largest milk producing country in the world. Milk production in the country has grown at a compound annual growth rate of about 6.2 percent to reach 209.96 million metric tonnes in 2020–21 from 146.31 million metric tonnes in 2014–15. The dairy and animal husbandry sectors contribute around 4.2% of India's GDP. It is a primary source of income for about 7 crore rural families (Economic Survey 20-21).
The dairy industry produces a wide range of products, including sterile and pasteurised milk, yogurt, ice cream, butter, cheese, and milk powder, using various processes such as pasteurization, coagulation, filtration, centrifuga-
tion, and chilling. As difficult as storing and transporting dairy products is, so is dealing with or treating waste generated by these industries. Dairy effluents vary significantly, both in quantity and quality, based on dairy factory characteristics.
Dairy processing effluent is distinguished by high concentrations of organics and nutrients, and a pH varying from 4 to 12. Such a large variation in the pH is attributed to the use of acid and alkaline detergents and sanitizers for washing. The residues of milk and milk by-products in the waste stream result in higher nutrient and organic contents than those normally present in domestic wastewater. Suspended solids are derived from coagulated milk, cheese curds, or flavouring ingredients.
The effluent from various pro-
cessing units with high solid content is chemically processed through the dissolved air flotation (DAF) system in wastewater treatment processes, producing high organic solids content sludge with a very foul odour and high volatility. The former is produced after chemical and DAF treatment of raw wastewater during primary treatment. The latter is stabilised sludge from secondary biological degradation, which can be aerobic, anaerobic, or a combination of both. This article is about the management of by-product sludge generated from the effluent treatment plant of the dairy industry.
About the Project Site:
The sludge treatment plant is situated in the vicinity of the dairy campus, which is located at the centre of the city
Biogas Magazine | Edition 22 | 12
within the residential zone, which concerns the critical situation for the surrounding environment.
Wastewater treatment processes in the dairy processing sector mainly consist of the Dissolved Air Floatation (DAF) technique to remove fats, oils, and greases, and traditional aerobic secondary treatment such as bio-towers and activated sludge aeration to remove organic material and suspended solids. Conventional biological and chemical processes for wastewater treatment cause high sludge generation and disposal problems (sludge disposal could cost up to 50% of the operation cost).
Sludge that is generated can be mainly classified into two types:
- chemically treated FAT sludge (light grey colour) from the DAF unit.
- activated sludge that has been biochemically treated (light to dark brown color)
Prior to Project Scenario:
The usual practice before installing the project was to dump the generated sludge on drying beds. This resulted in a strong odour that was affecting the air quality in the surrounding area. As it was completely organic sludge, increase in time to disposal leads to decaying of waste & further more bad odor issues. There were no monitoring, as well as no such maintenance
of records for disposal. Such unscientific practises caused foul odours in public areas, as well as bacterial propagation, infection, and contamination of the surrounding area, to name a few of the major issues, aside from aesthetic nuisance.
Dairy is situated in the middle of a residential zone; therefore, pungent smells due to fat sludge cause odour issues, and there were a lot of complaints regarding that. Furthermore, dairy had previously received numerous government notices regarding odour issues.
Risks and Challenges
One of the most difficult challenges was stabilising the FAT sludge, which was heavily laden with oil and grease and began to smell foul immediately after storage. Because the dairy industry was located in a densely populated area, the most difficult commercial challenge was managing effective fat sludge stabilisation and disposal rather than the payback or benefit returns on the CAPEX investment. No subsidy from the government was availed for this project. Previously, due to smell issues, ETP operators would spread bleaching powder over the DAF unit, which resisted the bad, foul smell, but the addition of bleaching powder would disrupt further biological treatment in ETP. Due to this problem, an assignment was given for
designing, building, commissioning, operating, and maintaining an all-in-one self-sustainable sludge management plant to set an example.
Unique features of a sludge management plant
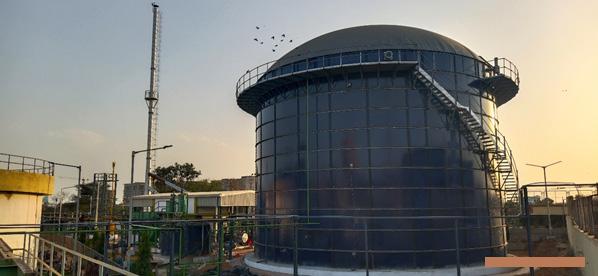
Sludge Digester was built as a thermophilic reactor out of a cutting-edge glass-fused steel (GFS) bolted tank. Since the effect of FAT sludge on digester material of construction, i.e., steel plates, was not known, it was decided to adopt GFS, which offers the highest safety against corrosiveness.
The sludge digester was designed to handle not only the FAT sludge generated from dairy but also the aerobic sludge generated by the existing ETP system. Since anaerobic digestion was to run in a thermophilic condition, a temperature control facility used a hot water generator with biogas as a fuel and an external heat exchanger, both controlled by means of PLC SCADA programming. The temperature was maintained between 50 to 55°C (Thermophilic Condition).
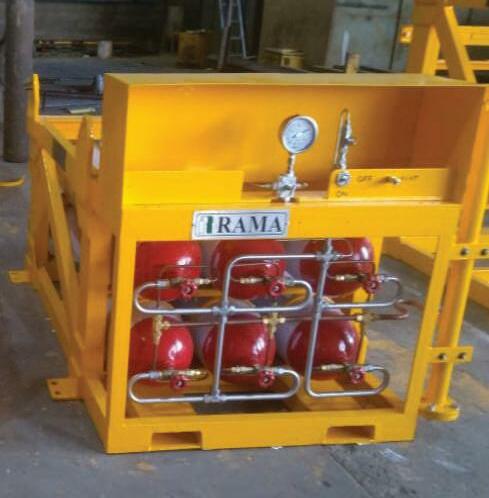
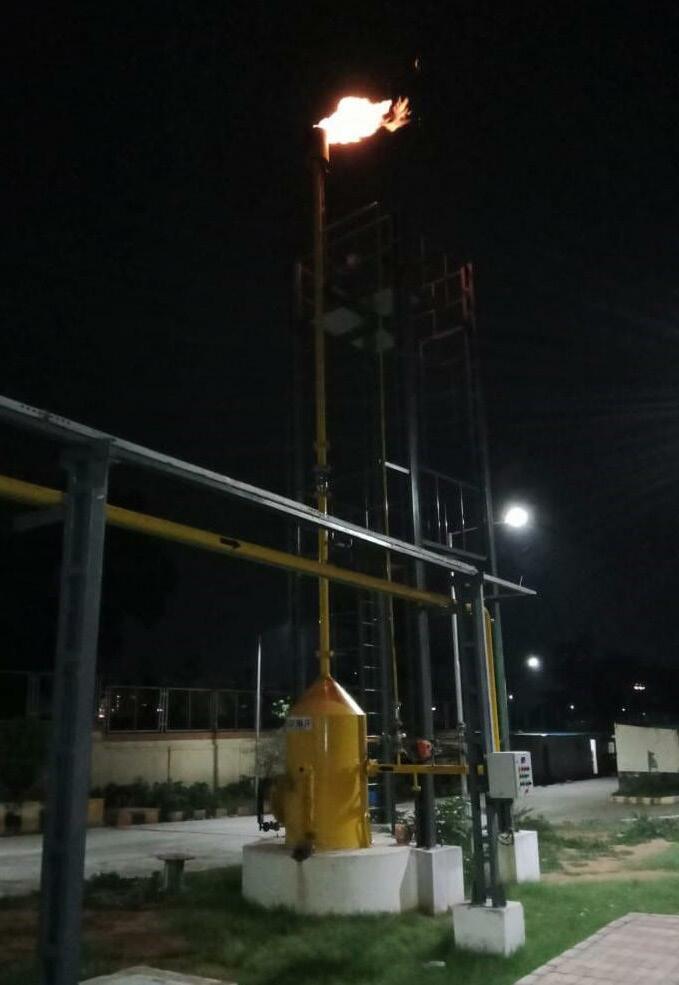
Biogas flaring system
The energy requirement for heat generation is fully met by its own biogas generation. i.e., biogas generated by the digester is directly fed to hot water generators. Another unique feature of the plant is its mixing process inside the CSTR (Continuously Stirred
Biogas Magazine | Edition 22 | 13
Tank Reactor). The mixing process is done by using high pressure systems that recirculate their own effluent from digesters.
The CSTR Digester is provided with a membrane-covered cum gas holder to store the generated biogas before sending it to a hot water generator or other uses. The digester was also outfitted with a settling arrangement for any washout that may occur from time to time, allowing the active sludge/digestate to be trapped and recycled back into the digester if necessary.
Less space required: the entire plant is planned and built on an area of about 5,000 square feet. Old ETP digester besides the new sludge management plant.
Benefits
● Environmental Benefits
Unscientific dumping in drying beds creates huge problems for the environment in terms of foul smell or odor, bacterial propagation, infection, and contamination of the surrounding environment, to name a few of the major problems that were prevented with the help of the anaerobic digestion (AD) treatment provided to the fat sludge. At present, this plant is achieving more than 90% reduction in the volatile solids (organic content) of the sludge generated. This VS reduction leads to generation of biogas which is utilized for the plant's own energy needs.
The smell nuisance, which was earlier harming the adjacent residential colonies, was completely prevented. The introduction of AD treatment led to the successful and sustainable running of dairy industry plants within urban areas. The outlet water quality of the system could be closer to the ETP inlet requirements. This treated water was used for gardening and washing purposes in the dairy campus since it contains lots of nutrients.
● Social Benefits
While social factors became important before the project began, there is widespread concern about the foul odour caused by FAT sludge. Numerous government notices and complaints were filed in re-

sponse to these issues, which threatened the dairy industry's existence and could have impacted dairy workers and their families.
After project commencement, there has not been a single complaint regarding the FAT sludge smell issue or any unhygienic condition of operation. Further, the down-stream Effluent Treatment Plant is also functioning smoothly due to the significant reduction in COD and O&G load.
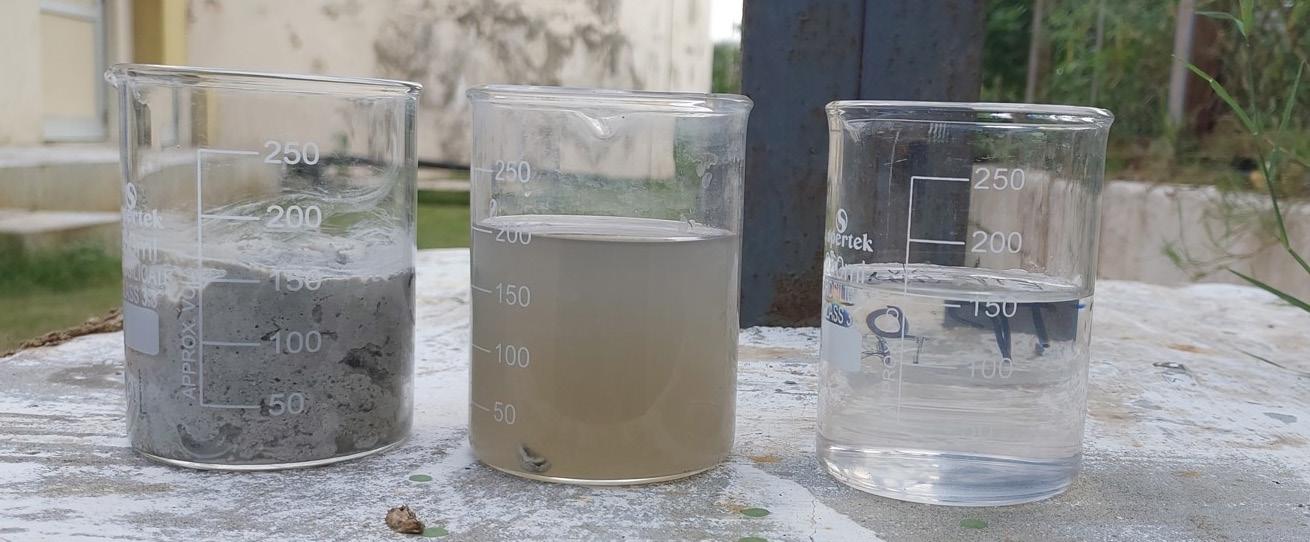
**As mentioned in the below image: the Sample of Fat Sludge (Left), Digester Outlet water (Centre) & Final Treated Water Outlet (Right).
Biogas Magazine | Edition 22 | 14
Harshal Parbat Sr. Executive – Clean Energy LARS Enviro Pvt. Ltd.
Dr. Ramesh Daryapurkar CEO LARS Enviro Pvt. Ltd.

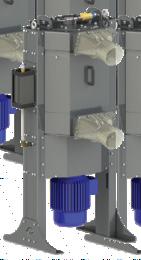
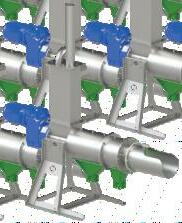
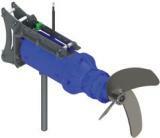

SAVECO ® A WAMGROUP Brand
Screw Press Separators
to 30% separated solids Self adjusting counter-pressure SINT® engineering polymer screw
SEPCOM
Up
power consumption Wide power spectrum 3 blade propeller
Submersible Agitators Low
movable
consumption
5 meters
External Motor Agitators Adjustable &
support Low power
Shaft length up to
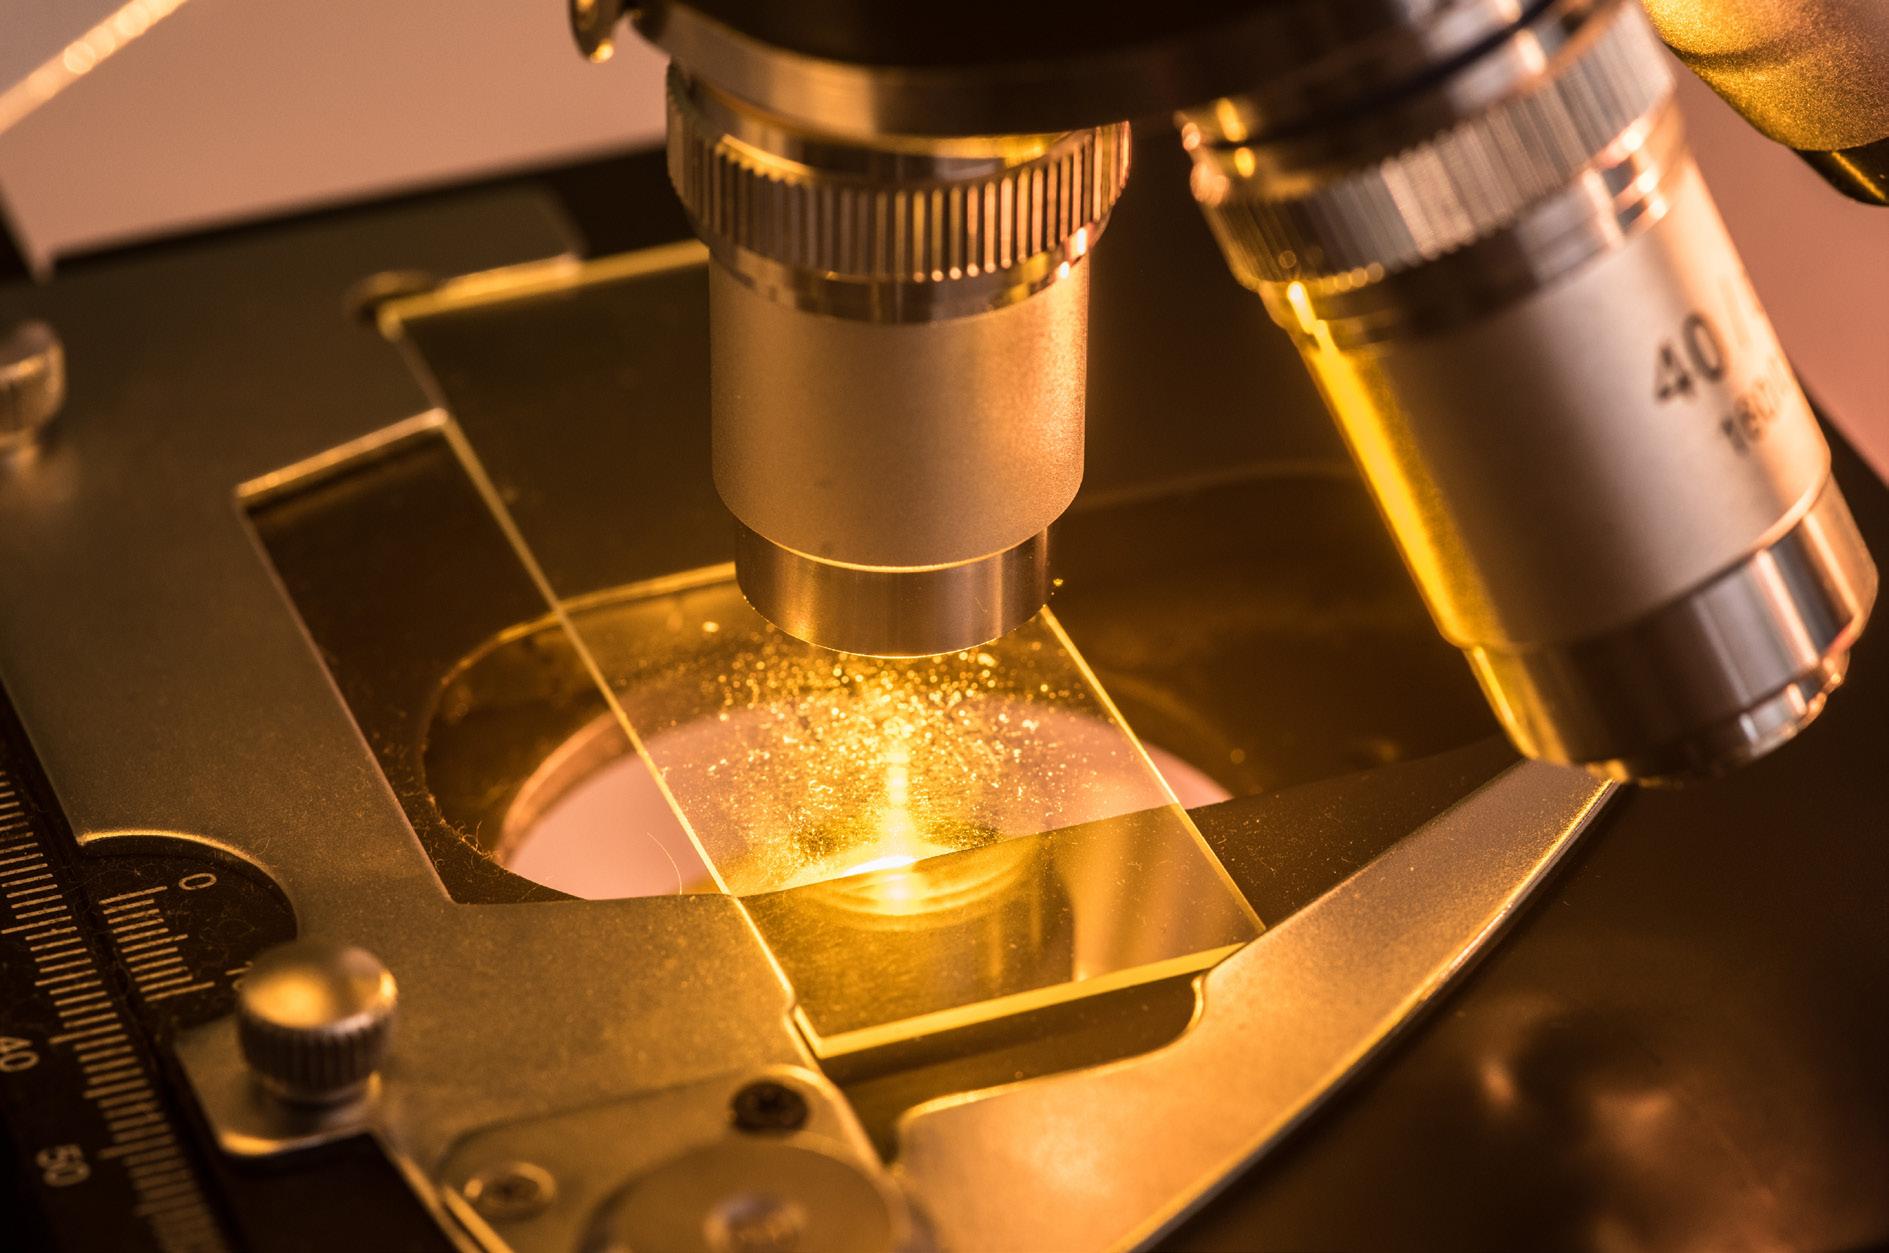
A new tool for Anaerobic Digestion
AD plants: Cell count and determinations of Microorganisms
Biogas/biomethane plants have increasing importance for green energy and to combat climate change. Process design and applied technologies are improving. AD is a complex biological process, process controls must be implemented and can also be revolutionized: One example is the application of a laboratory technology called “Microbial Classification of Biogas Fermenters by Methanogenic Archaea and Hydrolytic Bacteria” in a full-scale biogas plant.
The concentrations of DNA of bacteria and methanogenic archaea were determined using qPCRs targeting the 16S rDNA gene. The DNA concen-
trations were calculated using standard curves of diluted plasmid DNA. DNA analysis was performed by a reputable laboratory - directly without any previous enrichment. Total microbial DNA was isolated from the samples and used for two independent universal amplification reactions for the detection of bacteria and archaea (methanogenic bacteria). DNA profiles represented a specific DNA sequence and could be assigned to a bacterial species.
The Shannon-Index (a measure of microbial diversity) was calculated for each bacterial profile. For each bacterial profile, the Shannon-Index (a measure of microbial diversity) was calculated. Low
index-values indicate that the composition of a microbial community might not be optimal, caused, for example, by a lack or excess of macronutrients. The identified methanogenic Archaea could be assigned to four different families: Methanobacteriaceae, Methanomicrobiaceae, Methanosaetaceae, and Methanosarcinaceae. For each of these families, the relative abundance (percentage) was calculated.
The single families were distinguished by their chemical pathway to produce methane: acetoclastic, hydrogenotrophic, or both. Identified hydrolytic and acetogenic bacteria were assigned to the groups like Clostridia,
Biogas Magazine | Edition 22 | 16
Bacteroides, and syntrophic bacteria. Syntrophic bacteria are, e.g., Hydrogenispora ethanolica or Sporotomaculum syntrophicum (classification according to publications). Additionally, the percentage of the genus Ruminobacillus was established, as in literature, it is reported to have a positive impact on the viscosity of the substrate. Ruminobacillus should be present if Triticale silage is an input for the biogas/biomethane plant. The remaining bacteria (other) either did not classify as belonging to any of these groups or could not be identified. That notwithstanding, their percentage is provided as well. Results were communicated after only one week –this provides quick feedback and a helpful orientation for biological assistance and how to improve biogas plant performance.
Finally, this leads to an estimate of the total number of bacteria and Archaea.
With several years of experience to run this analysis, many scientific papers published in the meantime established optimum targets for the Shannon Index for Bacteria and Archaea, DNA copies/g of Bacteria, Syntrophs and Archaea makes this valuable instrument easily applicable for daily practical use.
In practical applications this tool has proven:
1. Increasing numbers of bac-
teria, especially hydrogenotrophic Archea as the result of the introduction of chelate-based trace elements. The shift in the microbiological community demonstrated an increase in methane generation due to the methane production from CO2 and H2.
Adding bioavailable trace elements – or in certain cases also macronutrients – gives the present bacteria and Archaea all ingredients to increase their population sizes. Greater population equates with higher efficiency – due to a quicker conversion of carbon to methane - this increases indirectly the Hydraulic Retention Time HRT.
AD plants become much more flexible while the biology gains in resilience. Frequent input changes can be tackled with fewer process problems. For certain input materials, new hydrolysis bacteria are needed. Their reproduction is linked to macro- and micronutrient consumption. If only one of them is missing (Liebig law), then indigestion of the new material is the unwanted outcome. This is very often linked to foaming and or acidosis events.
2. Inhibition from Iron Chloride used for internal chemical desulfurization. Bacteria destruction by hydrochloric acid present and formed has been demonstrated. Efficient substitution of Iron Chloride with an Iron Oxide blend has been proven with analysis before and after its introduc-
tion: Shannon Index and the number of hydrogenotrophic Archaea increased significantly.
a. During the release of Iron from Ferrous or Ferric Chloride, hydrochloric acid is produced. Hydrochloric acid is a very strong acid and corrosive. It penetrates every microorganism’s cell membrane and damages the present microbiome.
b.In the literature, several research papers describe this strong inhibition. With the Microbial Classification of Biogas Fermenters by Methanogenic Archaea and Hydrolytic Bacteria, this inhibition can be documented, which lends support to the use of Iron Oxid blends as a biology booster with the side effect of internal chemical desulfurization.
3. Nitrogen excess – ammonia (NH3 ) inhibition. Also, in those cases, cell counting and determination of species offer a lot of answers and help to run a biogas plant successfully. The different main families of Archaea Methanobacteriaceae, Methanomicrobiaceae, Methanosaetaceae, and Methanosarcinaceae have variable tolerance against free ammonia i.e., NH3. An increase of ammonia level in the digester will lead to changes in the abundance of the different families.
a. Measured changes in the abundance of present families show that already after
Biogas Magazine | Edition 22 | 17
a few weeks an adaptation of the biogas plant is possible, the more bioavailable trace elements are present the quicker these important changes are measurable.
b. Obviously, the inhibition of Ammonia is a function of the temperature inside the digester. The form of nitrogen changes between NH3 and NH4+ in the function of the temperature and pH value.
c. Self-heating biogas plants (= temperature increases during hot summers) are important to keep under control. Trace element needs are a function of the present bacteria and Archaea. Acetoclastic Archaea and hydrogenotrophic “methane bacteria” need different trace elements. For the pathway the predominant elements in their enzymes are different. For example, for methane production from CO2 and H2, the role of Nickel is essential.
i.) In simple words – the higher the digester temperature the higher the needed level of bioavailable Nickel.
ii.) Under thermophilic conditions, hydrolysis is quicker and stronger- this means more bacteria and more VFA
(Volatile Fatty Acids). More food (VFA) means that more Archaea are present. In several practical analysis, the relationship between bioavailable trace elements,the number and species of hydrolysis bacteria and methane-producing Archaea has been documented. The key to long-lasting success is the availability of macro and micronutrients. Chelates are the easiest and quickest way to assure the highest bacterial growth.
4. Acetoclastic and hydrogenotrophic pathways have different energy needs. Methane production from CO2 and H2 needs much less energy. Comparing different biogas plants with similar input – for example with silages- huge differences in process efficiency can be observed.
a.Knowing the predominant pathway- detecting the most abundant Archaea families explains why certain biogas plants need more input than others .
process is more efficient.
5. Regular analyses show that the present microbiome can change in a few weeks – external conditions like temperature and input materials are strongly influencing the present bacteria and Archaea. This innovative laboratory tool can be successfully applied to improve efficiency of the AD process.
Here is an example of how results are communicated.
Background on Microbial Analysis of Biogas Plants
In biogas plants, bacteria digest organic substrates to C1 compounds like methane and carbon dioxide, and other reagents. This occurs in several steps: the long-chained carbon substances are digested until acetic acid, hydrogen, and CO2 are formed. Mainly from these three reagents methane is formed.
Organic substrates contain polysaccharides, lipids, and proteins, which at first are transformed by certain bacteria into sugars, fatty acids, and amino acids. This chemical reaction is called hydrolysis. In the next step, i.e.acidogenesis, other bacteria digest these substances into Family of methanogenic Archaea Percentage Bacteria groups Percentage
Methanobacteriaceae
Methanomicrobiaceae
b. The presence of syntrophic bacteria (Hydrogen producing hydrolysis bacteria) and the percentage of the total number of bacteria give a strong indication that the biogas
Biogas Magazine | Edition 22 | 18
14.1 Clostridia 14.2
43.6 Bacteroidia 42.8
Methanosarcinaceae 37.9 Syntrophic* 36.2
Methanosaetaceae n.d. Ruminobacillus 1.9 Others 4.4 Others 4.9
* Classification according to publications
Characteristic Number Value
Shannon-Index Bacteria 2.87
Shannon-Index Archaea 1.73
10^x DNA copies/g Bacteria 11.38
10^x DNA copies/g Syntrophs 7.65
10^x DNA copies/g Archaea 10.08
BGA Category 4
organic acids and alcohols, which release hydrogen and CO2. Further decomposition of the organic acids and alcohols releases hydrogen and CO2, and ends with acetic acid (acetogenesis). There are two possible chemical reactions to form methane: the hydrogenotrophic methanogenesis directly processes hydrogen and CO2 to methane. During acetoclastic methanogenesis acetic acid is reduced to methane under CO2 formation. All these reactions - from hydrolysis to methanogenesis - only occur, if bacteria metabolize the respective building blocks into products. Thus, a successful and continuous methane formation requires an interplay of many differently specialized microorgan-
isms, too. Knowledge about the present microorganisms may significantly contribute to understanding and solving the cause of problems behind sub-standard methane generation.
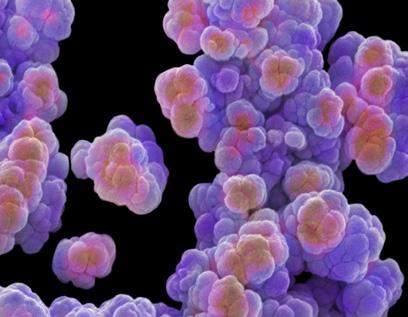
Methanogenic Bacteria
Methanogenic bacteria (Archaea, methanogens) are a good example: the table shows a grouping of methanogens found in biogas plants according to their families and respective possible routes of
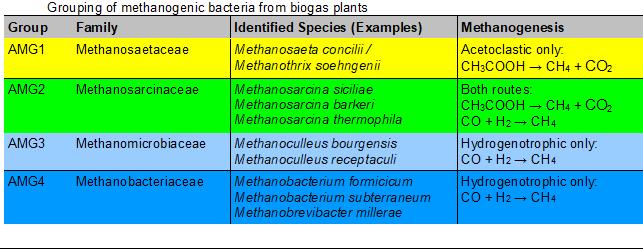
methane formation. In fermenters with only hydrogenotrophic methanogens (AMG3 and 4) the acetic acid, which occurs as a digestion product, has to be processed differently than in fermenters, in which this is done by methanogens of group 1 AMG1 and/or AMG2. Other process conditions, like e.g. the nitrogen content, have an impact on the composition of methanogens in a biogas fermenter.
Anaerobic Digestion Plants still have a huge potential for process improvements. Cell count and determination of microorganisms is an innovative tool and assures important process efficiency increases.
Biogas Magazine | Edition 22 | 19
Agronomist Guenther StockerCEO Eta GaS


Biogas and its value chain for waste management: feedstock logistics
Biogas, one of the most convenient, traditional and efficient energy carriers produced in nature via anaerobic digestion (AD), has gained attention since the last few decades around the major parts of the world to meet the increasing demands for heat, electricity and transportation fuel while reducing the environmental impact. AD is one of the best options for sustainable management of massively generated biomass due to its ability to convert organic matter into combus-
tible methane gas as a major product and biofertilizer as a value-added by-product. AD feedstock can be obtained from various sources such as agriculture, industry and communities provided they contain a substantial amount of organic matter. However, certain properties of biomass such as its natural dispersal, highly-variable and unstable nature make its utilization somewhat difficult. The maximum amount of biogas production could be determined by the constant supply of
feedstock needed to achieve national goals based on cost, quality, quantity, availability, and accessibility. The AD feedstock supply chain or logistics system is a complex arrangement of operations required to convert biomass into usable energy form up until the point of actual conversion (Figure 1). Each operation inside the logistics system incurs a cost while influencing the feedstock quality. In general, the phrase feedstock logistics system refers to the harvesting/ col-

Biogas Magazine | Edition 22 | 22
Figure 1: Major components of feedstock logistics
lection, pre-processing, handling and transportation and storage of the feedstock to be used as a raw material at the specific production site (AD Plant) (Figure 2). The overall objective of AD feedstock logistics research is to minimize the supplied cost, improve or preserve the feedstock quality, and increase feedstock access to manage biogas plants sustainably and efficiently.
Feedstock harvesting and collection
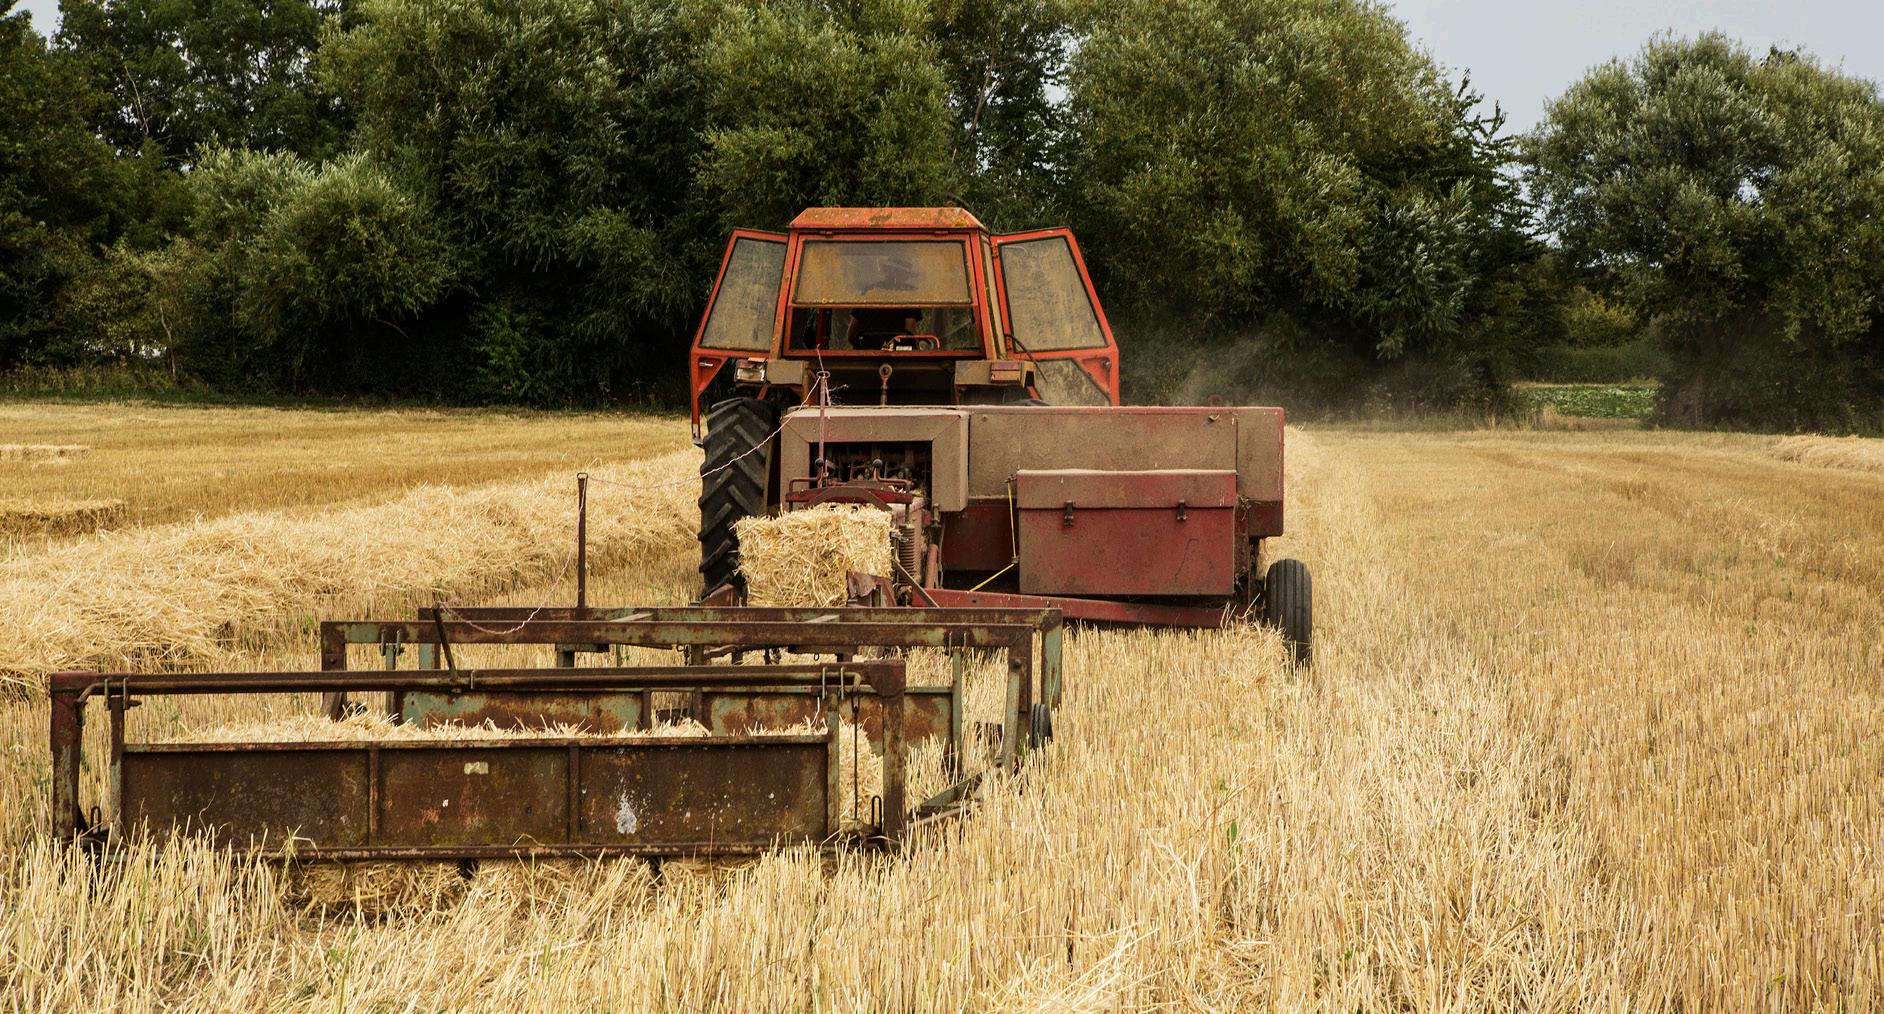
Harvesting is the act of collecting a harvested crop from a field, and is highly dependent on feedstock type such as single-pass harvest system (single type of feedstock) or multi-pass harvest system (multiple type of feedstocks). The collection process entails transporting gathered biomass to a centralized location such as a field side stack or landing deck. In a herbaceous supply system, baling and collection normally occurs after some field drying, whereas for a woody system, collection occurs immediately after harvesting.
Feedstock pre-processing
In general, pre-processing a feedstock entails reducing the size or comminution of biomass to allow for easy transportation from the source of origin to the biogas plant. In case of lignocellulosic feedstock, pre-processing and size reduction may include the pretreatment step to deal with the recalcitrant nature of
the lignocellulosic structure. Moreover, comminution of non-lignocellulosic feedstock such as MSW, sewage sludge, industrial waste/ effluent, aquatic waste, etc., is essential for the separation of unwanted/ non-biodegradable waste. This process makes the logistic system expensive for both types of feedstocks but increases the quality and uniformity of the biomass in order to decrease transportation, handling and conversion costs later in the supply chain.
Feedstock handling and transportation
The type of feedstock, size of the transportation vehicles
and biogas plant influence the needs for transport infrastructure, meaning access and suitability of the roads that are mainly used. Huge transport vehicles are desirable from an economic and least energy consumption standpoint, despite the fact that the weight of large vehicles can cause severe soil devastation in agricultural areas during harvesting of feedstock. It is recommended to have as low a pressure as possible in order to save fuel and reduce soil damage on the field.
Feedstock storage
In addition to compensat-
Biogas Magazine | Edition 22 | 23
Figure 2: Detailed steps of feedstock logistics Feedstock L ogistics Lignocellulosic Feedstock L ogistics Storage Site Bale Handling Stacking Upg rading (Optional) Storage Biogas Production Site Storage Site Road Transport Non-Lignocellulosic Feedstock L ogistics Fi eld Harv est and Collection Collection from waste Generating Sites Road Transport Segregation Storage Processing (Optional) Road Transport Biogas Production Site Road Transport
ing for seasonal fluctuations in feedstock supply, it permits the mixing of different co-substrates for continuous feeding of the digester. The feedstock used determines the type of storage facilities, like bunker silos for solid feedstock such as maize silage, which are frequently covered with plastic sheets to minimize the exposed face, and storage tanks for liquid or semi-solid feedstock, which are frequently used for slurries, sludge, and wastewater. Decentralized storage of feedstock at several smaller storage facilities may be a viable alternative for very large biogas plants or for plants where very large transport distances are involved. On one hand,this allows the use of larger trucks for efficient transport between the biogas plant and the storage facility, and on the other hand, the use of lighter agricultural field vehicles that do not cause soil compaction.
Challenges of feedstock logistics
a) Cost of the feedstock depends on various factors such as biomass type, location, yield/production, weather, harvesting systems, collection methods, preprocessing, storage and transportation distance. However, the foremost challenges are associated with collection and distribution of the feedstock, which further affect the realizable
potential;
b) Feedstock collection methods vary greatly between developed and developing countries. Generally, in developed countries the harvesting and collection processes of feedstock are integrated, mechanized and highly efficient but, may also require significant investment on associated sensitive and expensive equipment;
c) Lignocellulosic feedstock such as agricultural wastes are practiced to be burnt after harvest or ploughed back into the fields in order to improve the soil quality or suppress the weed growth. These practices are the main cause of environmental pollution and wastage of a potential feedstock for the bioenergy production;
d) The scattered location of the feedstock affects the harvest and collection, which makes the supply process inefficient and uneconomical. Transportation of the low energy density feedstock is often expensive in terms of cost as well as energy requirements. Therefore, pre-processing the biomass into bales, bundles, chips, etc., and reduction in the moisture content is recommended to increase the energy density and to decrease the transportation costs for process efficiency;
e) Seasonal availability largely
affects the feedstock supply for biogas production plants for example, the harvesting season of straws and perennial energy crops is for a relatively short period but their availability is required throughout the year for continuous operation of biogas plants;
f) Collection, segregation and storage methods of non-lignocellulosic feedstock such as MSW, sewage sludge, and industrial wastes represent the physical constraints. All these types of feedstocks are collected in mixed form i.e., biodegradable (organic matter) along with non-biodegradable (metals, plastics, hazardous matter, etc.) material. Therefore, the segregation of biodegradable material from non-biodegradable portion of waste is an important step, which otherwise raises the capital cost.
How to improve feedstock logistics?
It has been observed that the present AD feedstock supply chain system needs to incorporate the ability to reduce the dependency on a single resource location, minimize the supply risk, improve transport efficiency access remote biomass feedstock resource and a couple of other strategies in the future to enhance the system performance or to create a robust tradable AD feedstock market. There are
Biogas Magazine | Edition 22 | 24
few strategies, which could help in improving the overall feedstock supply chain system economically.
Integration of mechanized harvesting
Harvesting is a very first step for feedstock supply, which is commonly performed in a labor-based harvesting system. However, it has been reported in many cases that if harvesting of the supply chain is integrated with the well-equipped machines, it will definitely reduce the cost due to one-time investment on the procurement and pre-processing of the feedstock for size reduction.
Co-digestion
feedstock strategy
The mixing co-digestion of different feedstocks is advantageous to achieve the balanced operational parameters of AD processes such as C/N ratio, pH, volatile solids, etc. This type of blending, usually termed as co-digestion in AD processes especially, when agricultural wastes are mixed with each other to balance the operational parameters, gives a way to reduce the access cost and enhance the availability. Hence, blending of multiple feedstocks plays a vital role in reducing the access costs and volume of different wastes simultaneously.
Incorporation
of geographical information systems (GIS) for site selection
Inclusion of the geographic information system (GIS), a digitized approach that captures, stores, manages, retrieves, analyzes and displays the spatial or geographical information, i.e., the distance between the feedstock source and the biogas plant, plays a vital role in calculating the viability of the supply for a particular feedstock.
Inclusion of government policies and support
The governmental policies and support for waste management may be included for a multi-level vigilance like central level for setting strategies and creating national plans, and regional and local levels for designing, implementing policies, organizing tools for waste collection, treatment and disposal. A good net-

work of raw material producers (biomass), bio-refineries, storage facilities, blending stations, and end users could only be possible with social awareness to distinguish biodegradable and non-biodegradable waste generated in homes or society. In this direction, governmental support and awareness policies should be implemented.
Further, considering the economical and agricultural benefits, maintenance of digestate from storage to the handling and transportation may also be prioritized along with the feedstocks. Advanced technologies are required at the strategic, tactical, and operational levels to improve the AD feedstock supply chain system for biogas biorefineries in the future.
Biogas Magazine | Edition 22 | 25
Dr. Meenu Hans Research Associate SSE-NIBE
Dr. Sachin Kumar Deputy Director SSE-NIBE
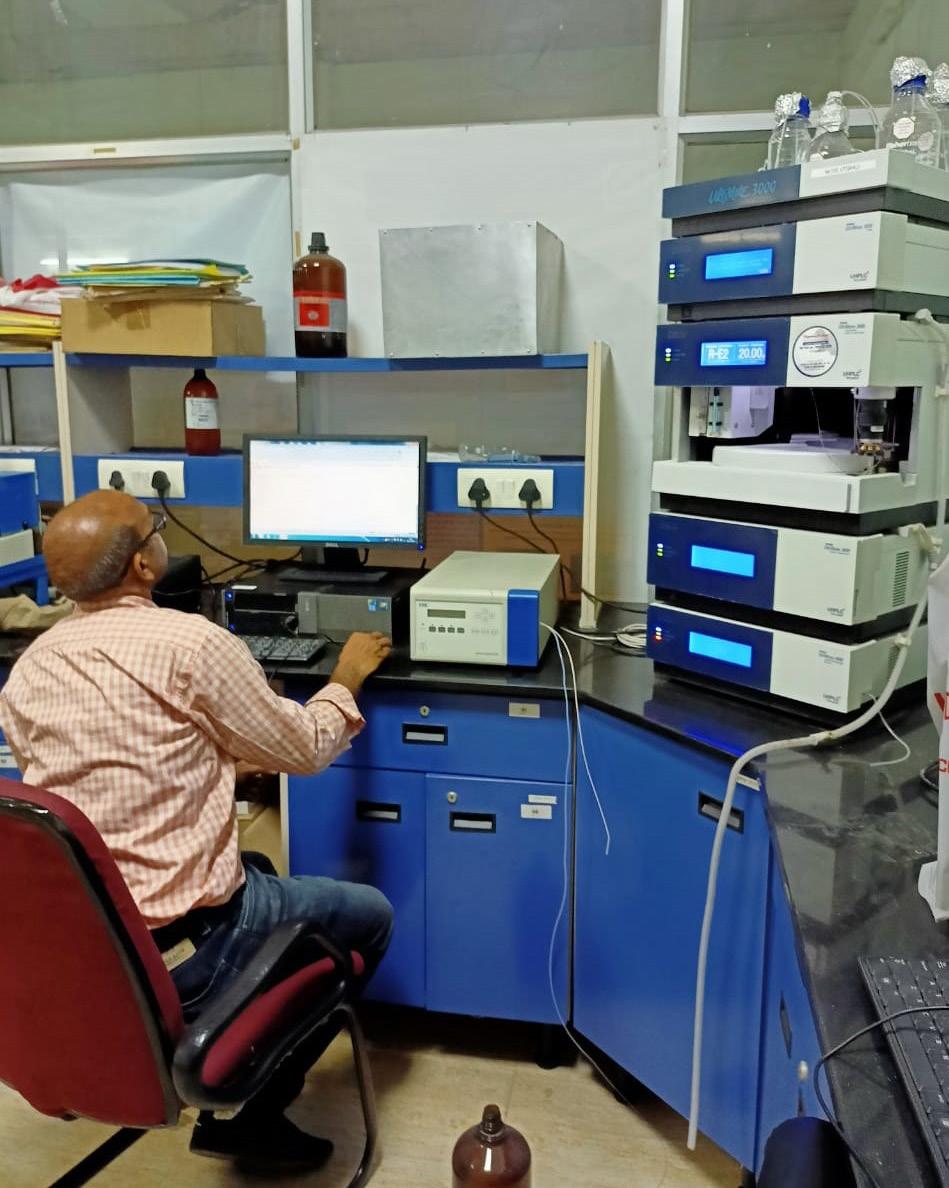
Essence of Lab Testing in Biogas
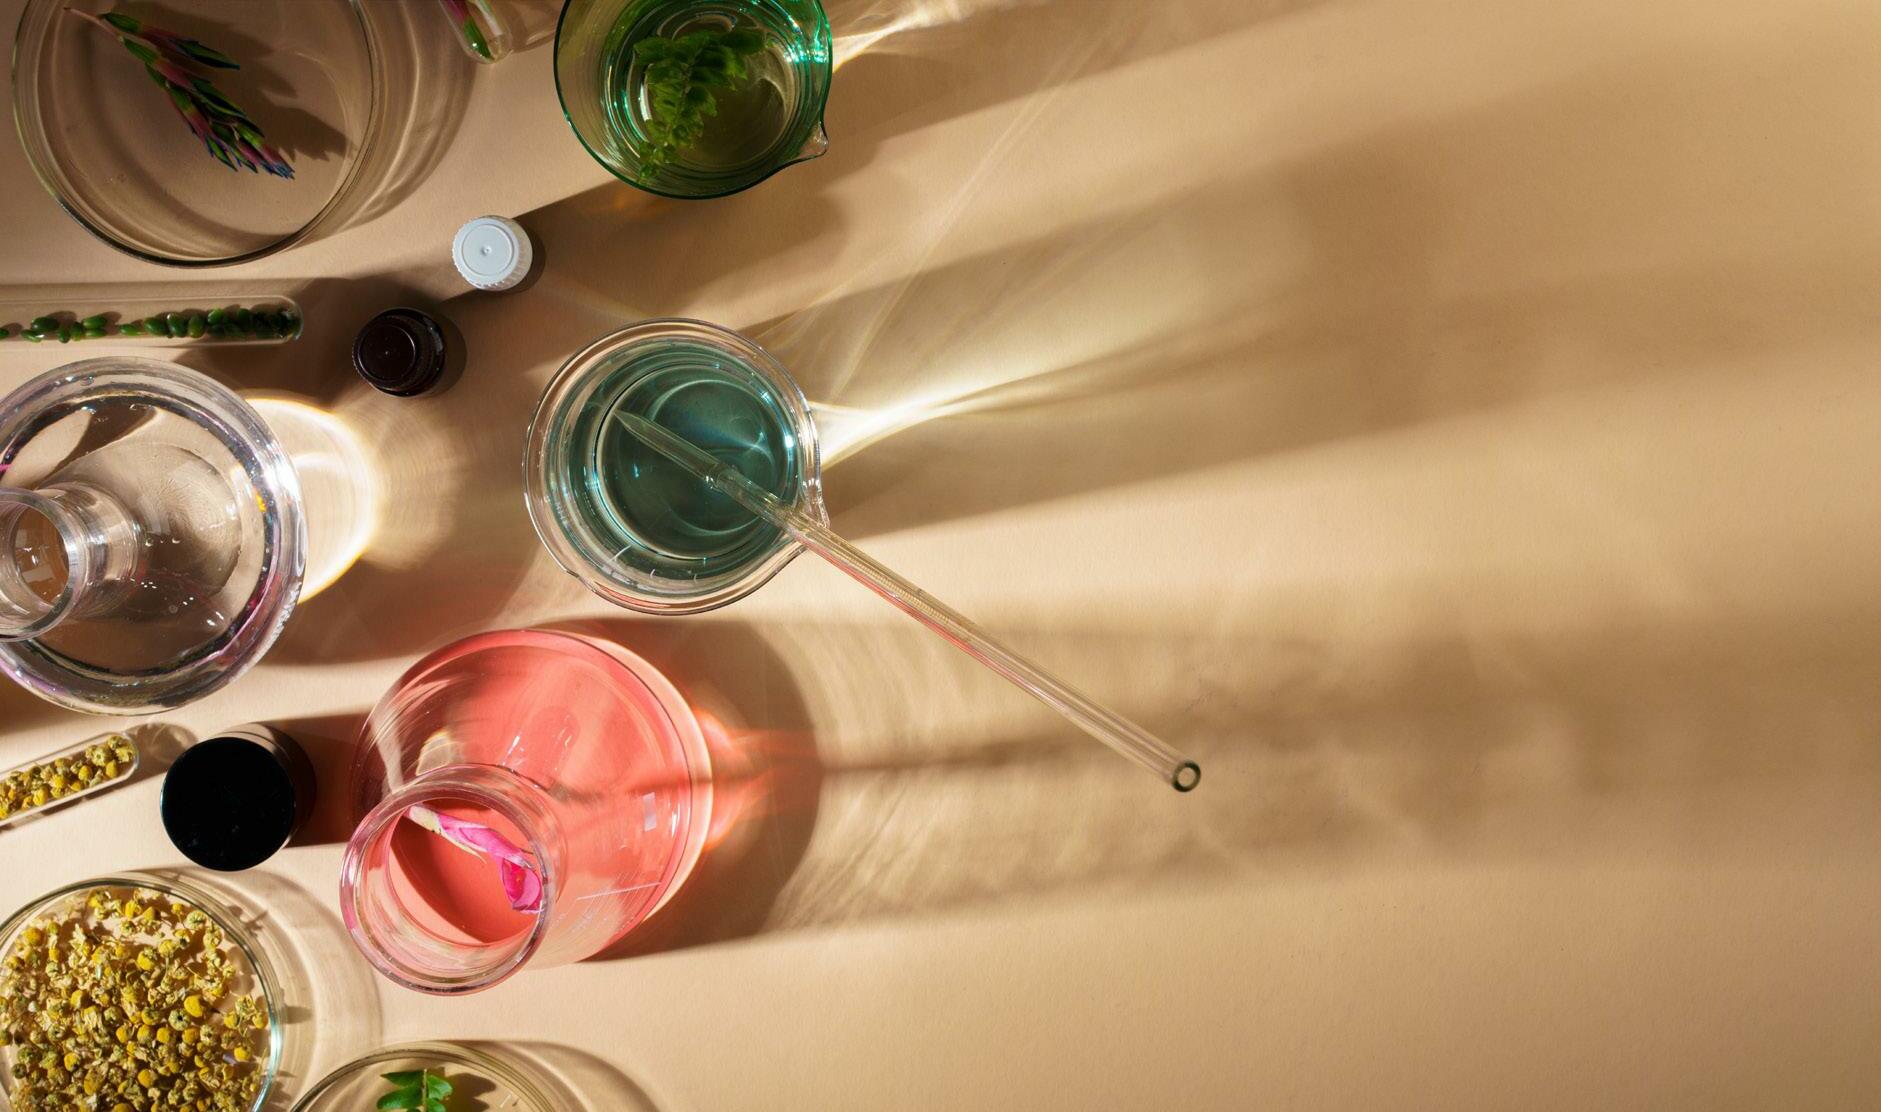
The biogas sector is the most promising among renewable energy technologies available today primarily because of its three-pronged advantages: scientific management of waste (agricultural, industrial, and municipal); production of clean energy in the form of methane (that can be used as fuel in homes, vehicles, and industries), and generation of high-quality organic manure as a by-product. All of this requires a running biogas plant.
Biogas plants need to be intelligently designed, keeping in mind the substrate’s properties and resulting gas composition. Further to this, there can be various inhibitors inherent to particular substrates that can disturb the delicate balance of the
anaerobic digestion process. That is why correct information is needed about the biogas generation potential of a substrate and the composition (methane content) of biogas produced. Knowledge of potential substrate inhibitors, such as the fact that a high-protein substrate can cause ammonia toxicity, acidic substrates require buffers to stabilize pH, and some feedstock can contain heavy metals at toxic concentrations, is needed. This information is critical to tackling any problem that may arise during the plant's operation. Similarly, at first sight, one may expect that merely daily feeding the plant will be enough for biogas generation, but that is hardly the case. To function properly, a biogas plant requires strict mainte-
nance of pH and temperature in a narrow range to allow the microbial population’s optimal functioning. Diving deeper into the anaerobic digestion process, we find that there are several parameters affecting the stability of the anaerobic digestion process. The inhibitory effects of ammonia, sulfide, and fatty acids need to be countered, while a balance between the acidity and alkalinity of the system also needs to be maintained.
Additionally, it's crucial to understand the features of digestate in terms of the nutrients they contain, including their levels of organic carbon, nitrogen, phosphorous, and potassium, as well as the effluent's polluting potential in terms of its COD and BOD.
Biogas Magazine | Edition 22 | 26
This article will describe the various tests that are recommended for the three stages of a biogas plant: start-up, gas production, and digestate.
The start-up
Prior to start-up, the biogas plant BMP, or biochemical methane potential test, needs to be performed along with the estimation of dry matter (total solids) and organic dry matter (volatile solids). pH, density, and sieve analysis are among other tests that help in digester design and also allow smooth operation by determining the daily input quantity required for the plant-based upon the feedstock’s characteristics.
Biogas Magazine | Edition 22 | 27
S. No. Test Frequency Feedstock tests 1. Dry matter/Total solids weekly 2. Organic Dry Matter/ Volatile solids weekly 3. pH weekly 4. Elemental analysis CHNS once 5. C/N once Biogas substrate tests 6. DM 15 days 7. ODM 15 days 8. VFA 15 days 9. NH4-N 15 days 10. H2S 15 days 11. FOS/TAC 15 days 12. pH 15 days Digestate tests 13. N, P, K
Gas production/steady state


The steady state of the digester is the state when the digester is functioning optimally and the intended output of gas is achieved. This phase may seem typical, but depending upon variations in the quality of the input feedstock, which is either procured daily or fed from a storage system, slight changes in the chemistry take place. Although the digester can easily buffer some changes, it is extremely sensitive to others, and therefore it is imperative that samples from a running biogas plant be periodically tested for these parameters. Temperature and pH are again the critical parameters here, along with the ammonium concentration, sulphide
concentration, and FOS/TAC ratio, among others.
Digestate

The biogas plant digester has a fixed volume designed based on the daily feedstock received and a retention time of e.g., 25 to 35 days, depending on the feedstock being used. The digester receives a certain quantity of feedstock daily, and the same quantity of digested feedstock comes out daily. This is called the digestate. Digestate is rich in partially digested organic material and is now recognized by the government of India as fermented organic manure,
with its specifications laid out. The FOM, therefore, needs to be tested for meeting the specified standards, viz., dry matter, nitrogen, phosphorus, potassium content, organic carbon content, pH, and conductivity, among others.
The table above gives a rough idea of how frequently the tests should be performed, along with the optimum range of the results.
Biogas Magazine | Edition 22 | 28
Dr. Rohit Srivastava Research Analyst Indian Biogas Association
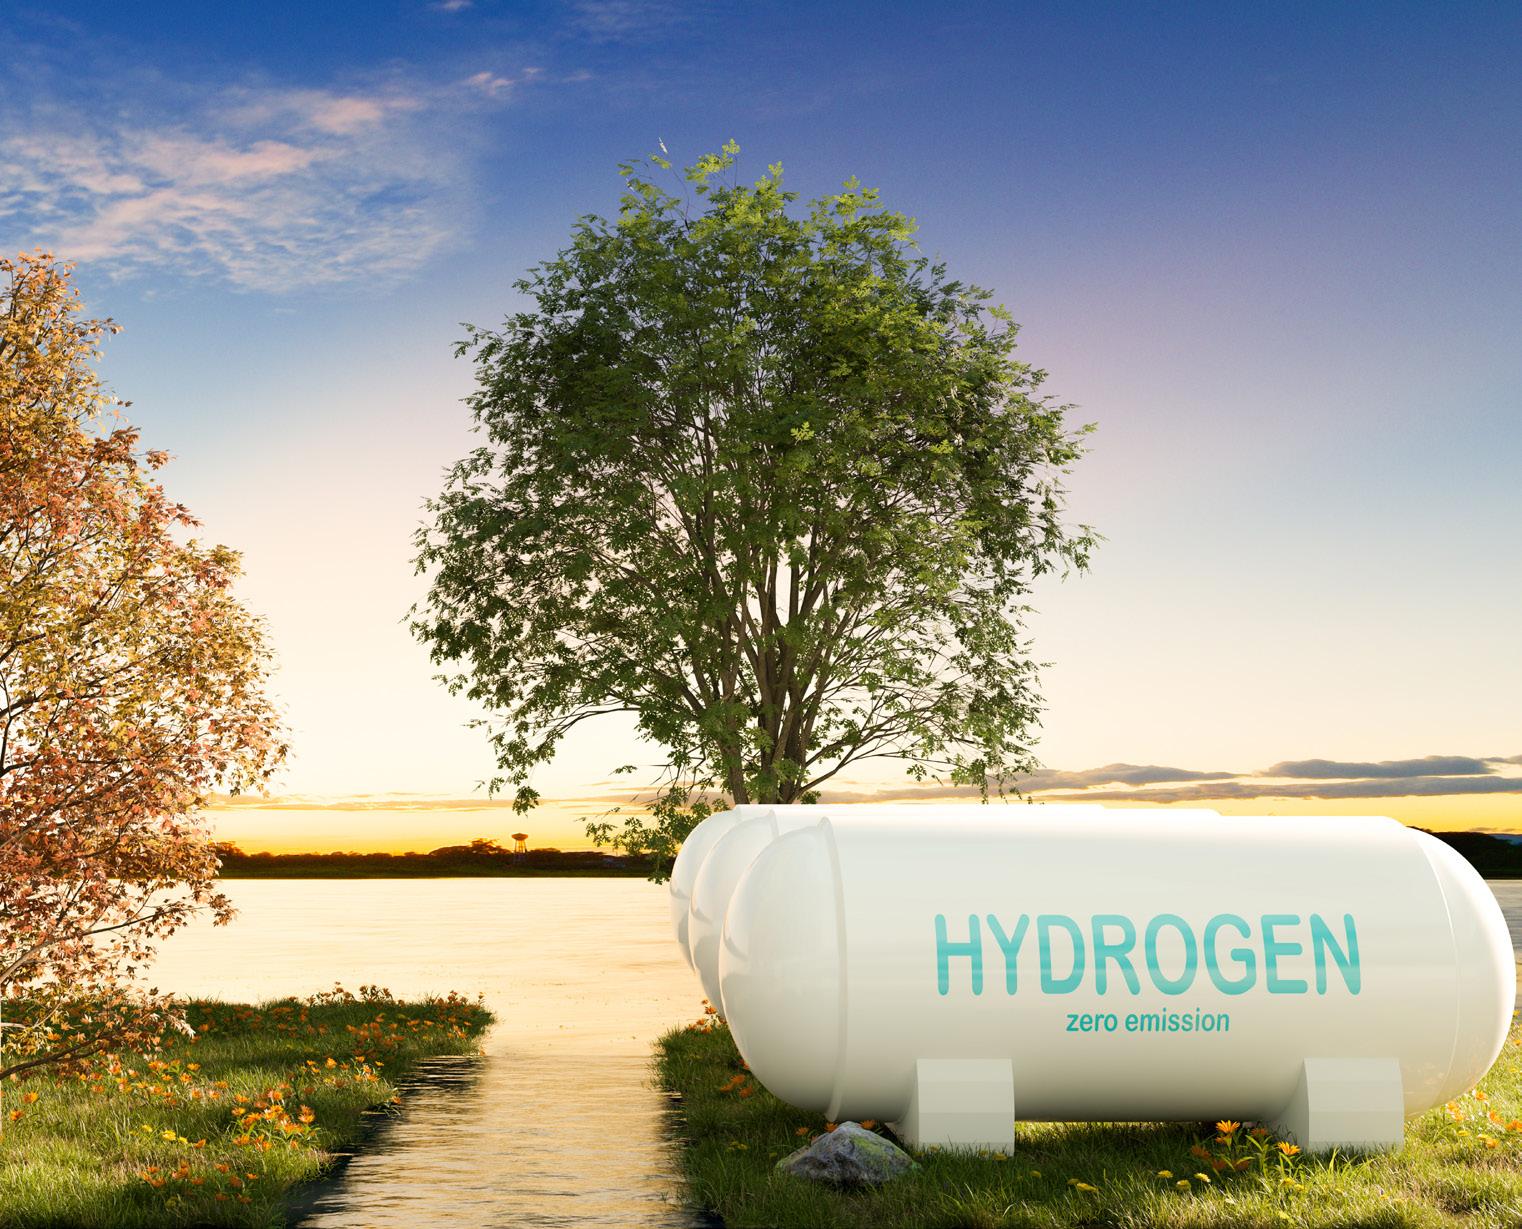
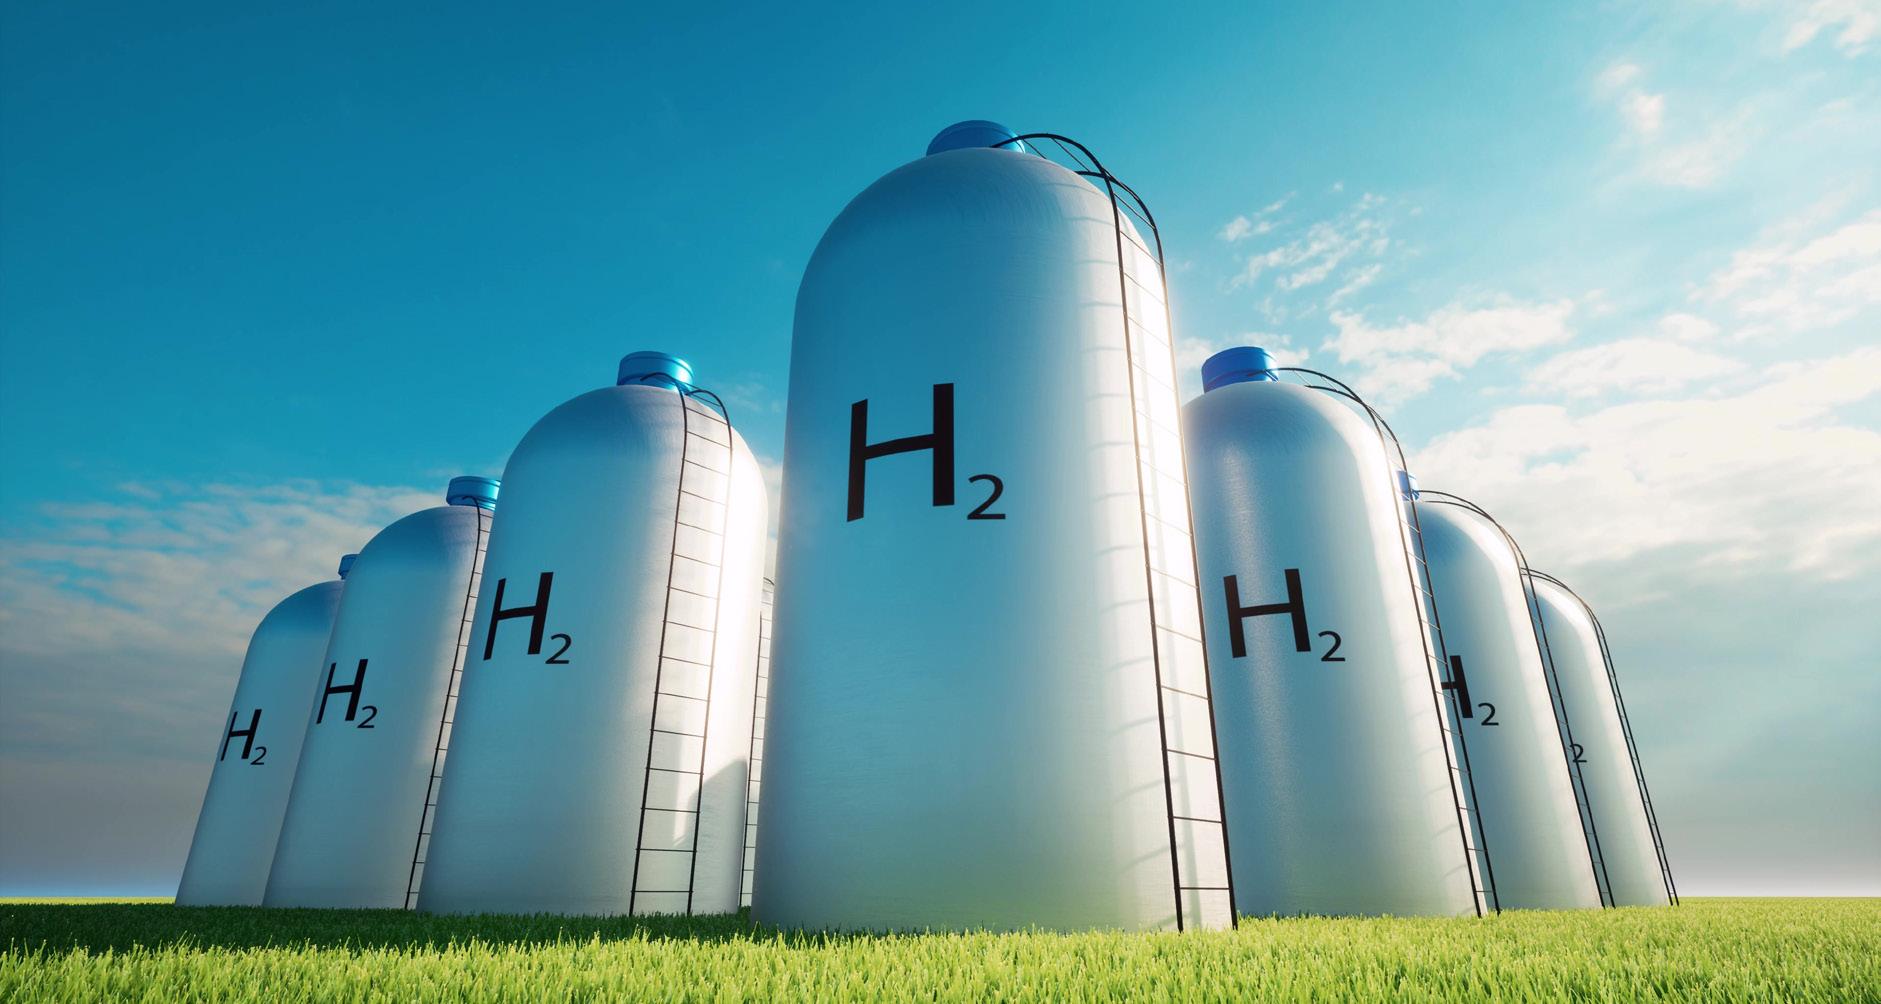
The hype about hydrogen –wonderful or insane?
A key to achieving climate targets is decarbonising the heaviest users: the gas grid, the transport sector and even the steel and chemical industries. Hydrogen promises all of this and induces enormous planning, also by Germany's government. For critics, its National Hydrogen Strategy is mainly an import strategy – with unknown consequences. The downsides are already known, such as the exorbitant costs for infrastructure construction or the meagre overall efficiency!- By Christian Dany
“By early 2021, more than 30 countries had published hydrogen roadmaps and announced more than 200 major projects along the value added chain. The impressive number of hydrogen projects currently in the pipeline worldwide can significantly contribute to achieving global climate targets. If all the 228 projects announced today are realised, the total investment in hydrogen would reach 300 billion (bn) US dollars by 2030.” This is the optimistic tone of an article by the Hydrogen Council. The initiative's membership list of 109 companies sounds like a
“Who's Who” of global corporations: from Airbus to Mitsubishi and from Shell to Uniper. Around the globe a race has broken out for “green” hydrogen, the proclaimed energy carrier of the future, which is set to enable transport, steel and chemicals to become clean.
World's largest single project planned in the Netherlands
The Netherlands is planning the largest single project in the world: North H2 is the name of a mega offshore wind farm in the North Sea near Groningen, which will
produce 800,000 tonnes of hydrogen (H2) per year with its electricity. According to figures from business magazine “Wirtschaftswoche”, Australia and Europe are the world's regions with the largest planned electrolysis capacity, boasting over 20 gigawatts (GW) each. They are followed by Asia (5.5 GW) and the Middle East (4.3 GW).
Following the Trump era, no gigantic plans for hydrogen are (as yet) known from the USA. The European Union is promoting development of the hydrogen economy in conjunction with intercon-
Biogas Magazine | Edition 22 | 29
nection of the energy system (sector coupling) up to 2027 in the shape of the 750 billion euro “Next Generation EU” development package. In Europe Germany – of course –has set up the largest national hydrogen programme worth 9 billion euros.
Hydrogen is supposed to solve energy problems – and not for the first time – although it is anything but suited to being a source of energy. Although it is the most common chemical element in the universe, on planet Earth it is practically only ever found bound in molecules. It thus first has to be produced in an energy-intensive way: by steam reforming, in which hydrogen is extracted from hydrocarbon chains, or by “water splitting” using electrolysis. With the recent hype about hydrogen, a separate “colour theory” has emerged, depending on the type of energy input and the process.
“The future belongs to green hydrogen alone”-Germany's former Minister for Research Anja Karliczek
The EU Commission has already announced certification for the CO2 emissions associated with the types of hydrogen. “The future belongs to green hydrogen alone,” says former Federal Research Minister Anja Karliczek, citing the preferences. “In the National Hydrogen Strategy we should think green, global and great,” is her appeal to all. According
to the motto “Shipping the sunshine”, green hydrogen could be produced in regions with plenty of wind, sun and water and exported from there to meet the world's energy needs.
Thus somewhat slighting the bio-energy sector, whose trademark colour has actually been green. However, biogenic hydrogen is left out of this play of colours: H2 could also be produced via thermochemical biomass gasification or biogas reforming – with the latter even being significantly cheaper than with electrolysis.
The efficiency of the powerto-gas process, which is favoured by climate policy, is often given as 80%. But this value is a peak. Losses of a quarter to a third can be expected, especially under fluctuating operating conditions of the electrolyser with solar and wind power. However, the entire processing chain has to be considered here. Although hydrogen has a significant energy density in terms of mass, at 33 kilowatt hours per kilogram (kWh/kg), it has an extremely high volume per weight. Under standard conditions, it weighs 90 grams per cubic metre (g/m³) and is thus 15 times lighter than air. 10 kilowatt hours (kWh) of electricity are thus converted during electrolysis to around 7 kWh of hydrogen gas, which must be first compressed or liquefied by cooling it down to minus 253 degrees Celsius.
Refuelling and storage – not made simple!
In the transport sector, which in Germany has 92 hydrogen filling stations, a pressure of 700 bar for refuelling cars has become established. But it's the logistics chain that is the big problem here. As reported by the newspaper “Die Welt”, petrol pumps for hydrogen cost around one million euros per system, while a pump for petrol or diesel would be around 30,000 euros. Converting liquefied hydrogen into gas at different pressure levels up to a vehicle's tank is hugely complex and costly.
The plan is therefore to process hydrogen further into various power-to-gas and power-to-liquid fuels. However, these “electricity-based fuels” have yet to be developed to market maturity involving billions in funding from the German government. The end result is that they stifle overall efficiency even further.
Hydrogen is very volatile. It diffuses through certain materials, which can lead to problems with storage and transport. The storage concepts of stationary and mobile compressed gas and liquid hydrogen (LH2) storage facilities and large caverns have thus been extended to include indirect H2 storage: Besides methanol, some liquid organic hydrogen carriers (LOHC) are suitable here. In LOHC systems, hydrogen is chemically bound to an unsaturated compound
Biogas Magazine | Edition 22 | 30
through a chemical reaction. This is called hydrogenation.
In principle, the loading and unloading of a non-explosive carrier fluid should provide for efficient and safe hydrogen logistics. The best-known LOHC system is based on the hydrogenation of toluene to methylcyclohexane. As Reinhold Wurster from the German Hydrogen and Fuel Cell Association explained at a forum of the association CARMEN, all H2 carrier concepts require energy-intensive hydrogen separation at the point of end use, so costing about 30% of the energy contained, post-purification and compression. “Depending on the application, they can make sense or are inferior to transport by pipeline or liquid hydrogen delivery,” he says. When it comes to where H2 will be economical first, Wurster sees the greatest revenue potential in the mobility sector.
“You quickly reach the conclusion why the hydrogen economy did not exist before, why it's struggling today and why it will probably never arrive in the future: It's basically a huge energy-loss game. And we don't have any energy to lose, but have to see that we use the energy we gain wisely,” says Dr Ulf Bossel. The Swiss mechanical engineer develops fuel cells himself.
“If anything, green hydrogen should be used as a chemical feedstock– it's unsuitable
as an energy carrier”-Dr Ulf Bossel
With his energy balance analysis of a hydrogen economy, he puts the often unfounded promises from proponents of H2 into perspective: “At the end of the conversion and distribution chain, it is only 20 to 25 percent of the electrical energy originally used that remains.” Bossel's analysis provided the basis for newspaper “Die Zeit”, which investigated, as it put it, the myth of hydrogen in its major dossier “Die Mär vom Wasserstoff”. That was already in 2004, but even if 30 percent energy now remains thanks to leaps in efficiency, there is no fundamental change in what is wasted here. “If anything, green hydrogen should be used as a chemical feedstock,” says Bossel. “It's unsuitable as an energy carrier because the electricity required to generate it could be used directly with far greater efficiency.”
The “energy story” of hydrogen can be read as one of major research projects and financial budgets (see box). To date however, hydrogen technology has hardly progressed beyond publicly financed projects. Nevertheless, the high-tech nation of Germany is now tackling the issue in a big way with the National Hydrogen Strategy (NWS), which is intended to give Germany a pioneering role in a global market worth billions. It comprises 38 measures. The central goal is the market ramp-
up of hydrogen technologies in order to decarbonise areas with the help of renewable energies that are difficult to supply directly with electricity such as production processes and heavy goods, ship and air transport.
And the NWS doesn't think small, but big: Besides the existing programmes for living labs and so-called hydrogen regions, 7 billion euros of funding is to be made available for ramping up the market. Another 2 billion euros will be added for international partnerships. Gigantic projects within large industrial consortia are already in the pipeline. The aspect of foreign trade can be reduced to a common denominator: exporting technologies, importing hydrogen. It is true that the NWS talks about CO2-free hydrogen. Imported green hydrogen is given priority over blue hydrogen, mainly due to concerns about the acceptance of CO2 storage with CCS technology.
The German government foresees a hydrogen demand of around 100 terawatt hours (TWh) by 2030. Of this only 14 TWh is to be covered by green H2 production within the country, with the sizeable remainder being imported. Because many countries in Europe do not want to develop a hydrogen economy themselves, people are turning their eyes beyond this continent, namely to Africa, especially to North Africa, the
Biogas Magazine | Edition 22 | 31
Middle East, Australia and South America. The German government has already concluded a partnership agreement with Morocco. The first industrial plant for green hydrogen in Africa is to be built near the city of Ouarzazate. Here the German government has also co-financed the biggest solar thermal power plant on Earth.
Desertec 2.0?
All of this brings back memories of the Desertec project, which was a resounding failure. German politicians and corporations aimed to produce solar power on a grand scale in the desert and transfer it to Europe. While the reasons for its failure are many, one above all stands out: The host wasn't consulted about the bill! In the meantime many solar parks have been built in North Africa and the Middle East. But for the time being these countries want to use the clean electricity themselves.
The new plans for hydrogen are also criticised for not taking sufficient account of the own needs of the supplying countries. The nasty word “neo-colonialism” is doing the rounds. It also fell at a webinar of the Greens' parliamentary group in the Bundestag. Ingrid Nestle, spokesperson for energy economics for the Green party, could imagine diverting water from electrolysis for hydrogen production for the local population. How
generous of her!
Nestle is hitting a sore spot with the issue of water: It takes 9 to 10 litres of water to produce 1 kilogram of hydrogen with electrolysis. There's not enough fresh water in the Earth's Sunbelt for this, so seawater has to be desalinated. The possible sites are thus concentrated on the coast, but this is pretty convenient for the recipient countries.
Seawater desalination not without environmental consequences
Seawater desalination is already a no-go for conservationists and marine biologists. There are 16,000 plants worldwide, which leave behind 140 million (m) cubic metres of brine every day. This saline solution, now polluted with chemicals and dissolved metals, is mostly pumped back into the sea, where it damages the ecosystems. To cover the hydrogen demand of a worldwide energy transition, the number of desalination plants would need to be multiplied many times over. But this would only be ecologically justifiable if gigantic brine lakes were created for evaporation. This in turn would render the cost of the hydrogen economy exorbitant.
“In some studies the costs for the provision of water only play a minor role,” says Alexander Scholz of the Wuppertal Institute for Climate,
Environment and Energy at a webinar organised by the CHP Info Centre. In a meta-study his institute joined forces with DIW Econ to examine the “advantages and disadvantages of hydrogen production in Germany compared to importing hydrogen”. The key findings: Transport by ship is estimated to be three times more expensive than by pipeline due to the energy-intensive liquefaction of hydrogen. Sea transport only pays off from approx. 4,000 kilometres. Preference should therefore be given to candidates for export within the radius of pipeline solutions. At 16 cents/kWh, the production costs of green hydrogen are currently around twice as high as for blue hydrogen and about three times higher than for grey.
Domestic or imported H2?
Scholz and his co-authors are not expecting significant cost reductions for electrolysers until after 2030. The authors warn against focusing just on the costs of provision. The disadvantages of importing such as dependency and supply risks should not be neglected here. While imports could lead to “rebound effects” in the supplying countries, i.e. to increased dependence on fossil fuels, opportunities for making the electricity market more flexible and for sector coupling would remain unexploited in Germany. It should be borne in mind that a future high demand would raise
Biogas Magazine | Edition 22 | 32
trading prices and cancel out the locational advantages of countries like Morocco. A strong domestic market is important in order to exploit economic effects: Depending on the extent of domestic demand coverage from 0 to 90 percent, the gross value added would be between 2 and 30 billion euros per year. 20,000 to 800,000 extra jobs could be created by 2050. Priority should be given to expansion “at home” because domestic H2 can be competitive.
In addition to the focus on imports, the preference for green H2 also comes in for criticism. The EU Parliament's Industry Committee recently decided to recognise low-CO2 hydrogen as a medium-term bridging technology. What's meant here is blue hydrogen. Norway already offers blue hydrogen in this country, because it has both natural gas to produce H2 and huge caverns under the North Sea. It should be possible to safely store the CO2 two kilometres (km) deep under the seabed.
Enervis for “multicoloured hydrogen”
Management consultancy Enervis is putting yet another colour into the mix: Multicoloured, electricity market-based hydrogen is better suited to building a hydrogen economy swiftly, affordably and, in the long term, in a climate-friendly way. This was the outcome of a study
commissioned by the Mining, Chemical and Energy Workers' Union. “Multicoloured” means that electrolysis simply operates with electricity from the grid, which also includes gas, coal and nuclear power. Plants could be built close to the point of consumption, transport costs would be eliminated and the electrolysers could be better utilised. Through the expansion of renewables, multicoloured would become green by itself over the years. An important factor for this option would be abolition of the surcharge of the Renewable Energy Sources Act (EEG), which has to date only been regulated for green hydrogen.
The German Chemical Industry Association calls for openness to technology for the supply of hydrogen, at least for a lengthy transition period. The chemical, steel and gas industries are already busy preparing for the age of

hydrogen. The gas industry is eager to store solar and wind power in the form of hydrogen in its gas network. The organisation for sector marketing is now no longer called “Initiative Zukunft Erdgas” (“Initiative for the Future of Natural Gas”", but “Future for Gas”). It aims to stand for natural and “green” gas, i.e. biogas and hydrogen, in equal measure.
H2 instead of CH4
For the gas industry, entering the hydrogen economy represents one of the greatest challenges in its history as the entire gas infrastructure with its grid of 500,000 km is to become “H2-ready”; i.e., able to accommodate and distribute 100 percent hydrogen. An important player here is the German Technical and Scientific Association for Gas and Water (DVGW). It will not only adapt the rules and regulations to hydrogen, but is also going to massively invest
Biogas Magazine | Edition 22 | 33
in the areas of research, certification, education/further training and communication over the next five years. In addition to the grid, the gas storage tanks and all possible gas terminal equipment must also become H2-ready – from condensing boilers to combined heat and power plants.
Today, the DVGW regulations already allow up to 10 percent (%) H2 in the network.
The DVGW is busy working on a 20% blending level with natural gas. A completely new set of regulations for 100% hydrogen is also set to be created. The heating industry is marching in step: While existing gas heaters can cope with 10% H2, the new generation should be able to manage as much as 20%. The gas industry plans to essentially upgrade the existing gas network for hydrogen instead of building new pipelines. The mainstay is to be the “H2 backbone”. The plan is to complete this 100%-hydrogen long-distance pipeline grid by 2040 at the latest, proceeding from the H2 starter grid in the Ruhr region. Supply via the gas distribution networks is to grow in line with the three development stages of the H2 backbone and the local generation options.
As part of the H2vorOrt project, 34 gas companies have worked with the DVGW to develop a transformation path for an infrastructure all the way to the consumer. As H2vorOrt project manager Florian
Feller from Erdgas Schwaben explains, expansion of the climate-neutral gas supply will be geared to local conditions: “There will be regions that are set to switch to 100% H2, and others where the feed-in of biomethane or synthetic methane is the right choice for a climate-neutral supply at that location. In both cases the early blending of hydrogen is important for reducing CO2.”
“We wouldn't even get a comparable infrastructure in the ground by 2050”- Florian Fellner
The DVGW had put the costs for the theoretical, separate construction of a hydrogen grid equivalent to the gas distribution grid in Germany at 270 billion euros. “We wouldn't even get such a comparable infrastructure in the ground by 2050,” muses Feller. In contrast, establishing H2 readiness in the existing distribution grids is far cheaper and much faster, with costs running into the low double-digit billions range.
“Most pipelines in the distribution grid are made of plas-
tic, which is suitable for up to 100% H2. With steel pipes, it depends on the type of steel, but the sorts used in the distribution grid are normally not critical,” explains Feller. He advocates not increasing the blending rates in line with H2-ready expansion arbitrarily: “20% blending shouldn't be followed by an intermediate stage of 50% or 60% but by a switch to the supply of pure hydrogen straight away. This will avoid another marketplace ‘changeover’ involving the costly adaptation of terminals.”
The target status for 2050 envisages climate neutrality being achieved through grid sections with 100 percent H2, methane in pure form or with blends of methane and 20% H2. “Most of the project partners assume that there will be conducive co-existence in different grid sections,” says Feller.
...to be continued in next edition of Biogas magazine
**This article is based on the situation as per the year 2021**
Biogas Magazine | Edition 22 | 34
Christian Dany Freelance Journalist
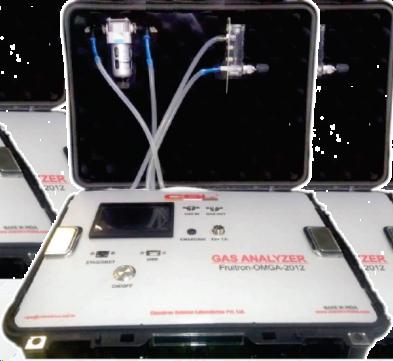
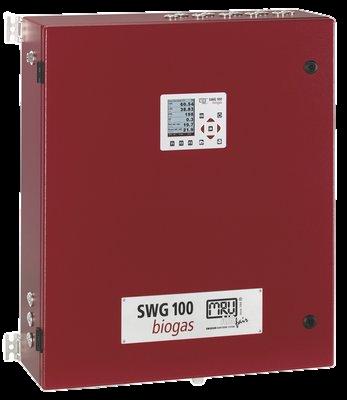
Up to 10 sites sample gas switching and NDIR for CH4, CO2 and long-life O2 measurement


monitoring

TECHMARK Comprehensive range of biogas, biomethane, offgas and landfill gas analysers www.mru.eu TECHMARK ENGINEERS & CONSULTANTS 1020 - 1023 Ansal Tower, 38 Nehru Place, New Delhi - 110019 Tel 011 46570392 - 94 sales@techmark.co.in Mobile : 7011389878 www.techmark.co.in Handheld analyzer Semi-Continuous analyzer Continuous online analyzer for hazardous area Continuous online analyzer OPTIMA Biogas SWG 100 BIO - Ex SWG 100 Biogas SWG 100 BIOcompact Biogas measurement: CH4, CO2, O2, H2S Ambient air measurement: CH4 (LEL), H2S Simultaneous measurement of flow rate and biogas Built - in Condensate separator with water-stop filter SD card, Mini-USB and Bluetooth for data transfer to Smartphone, Tablet or PC Longlife battery with standard USB charger.
half hour measurement for up to
and
safety
2 sampling points II 3G Ex nA nC IIC T3 Gc certification for
Every
NDIR for CH4, CO2
long-life O2, measurement Choice of H2S sensors for different measuring ranges Gas sampling from large pressure range gas ± 200 mbar 4... 20mA analog and RS 485 digital data transfer Analyzer
features with monitored fan ventilation
Gas sampling from large pressure range gas ± 200 mbar Regulated sample gas pump with sample gas flow monitoring With gas cooler for precise gas analysis NDIR for CH4, CO2, and long-life O2 measurement Very high H2S measurement using dilution method monitoring in hazardous area zone 2
Very high H2S measurement using dilution method Gas sampling from large pressure range gas ± 200 mbar With gas cooler for precise gas analysis Analyzer safety features with monitored fan ventilation CONTACT US FOR DEMONSTRATION
My Behavior is All ... I can Change
Expensive Water and.....Still......Free Air
4.2. Sustainable human life in harmony with nature, ecosystems, and agriculture
To secure our genes, and those of nature Research could focus on human adaptation to change. And securing our know-how for future generations. Then we'd require our own planet. Also in command and aware of what we need to take to, find in space, or adapt to in order to create "Planet B" as quickly as possible.
1. About Facts
Facts never change, although they always change, as part of the food cycle, still fed with the energy from the sun, but our "waste" is less fed back.
2. About Opinions and Focus
Opinions are facts, but the fact is that while opinions change, facts don't. Climate change seems to be true! Let's prove that humanity can control the temperature!
3. Change Begins with the Individual
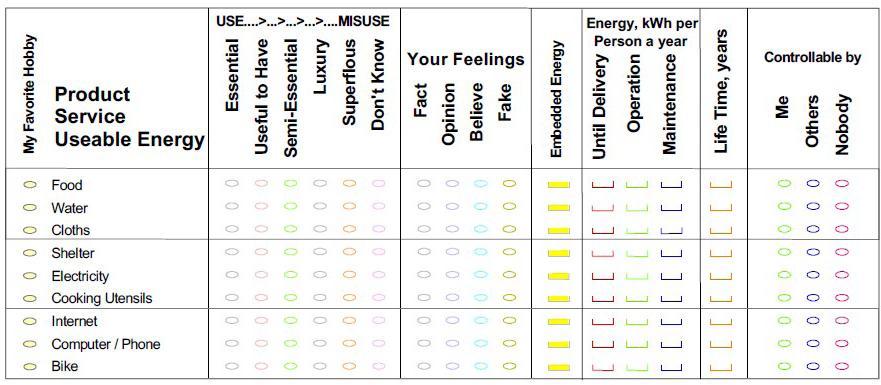
All change is caused by energy, its use, and misuse. Sustainability, as well as being equal, free, fair, and just, starts with food—a 1000 kWh per person per year.
The definition of the word "definition," per definition of "definition," does not exist, and thus, mathematically, the unit of 1 for sustainability is 1 earth, 1 world, 1 population, 8 billion people or the food for them, plus water, clothes, shelter, and something useful to do.
Food ~2000 kWh per Person a year, incl. 50 % "wasted" World average energy ~ 22000 kWh / Person.year (2014), California ~ 60000 kWh/Person.year (World Bank).
4. Let me suggest something useful to do or two life purposes and goals:

4.1. Sustainable human life in space as soon as possible
5. Since my behavior is all I can change; I need to see my impact on every transaction
Since all, good and bad, are caused by energy, the EPE (Energy Population Equivalent) should appear in kWh per Person a Year on every transaction.
6. Every product or service has a specific lifetime, as well as a specific amount of energy input for a certain number of people
If the raw energy input is 100 for a life of 10 years for 10 people, the EPE is 100/10/10 = 1 kWh/P.year. If another project/product/service needs 70 kWh for a life time of 5 years and 10 people, the EPE is 70/5/10 = 1.4 kWh/P.
Biogas Magazine | Edition 22 | 36
1000 kwh Food per year 1000m2 1000m2 ? Luxury= Y*1000m Unfortunate Unequable Unfree Just Or Unjust Or Fortunate Fair? Free Equal Just For tunate
Should’nt we grow or secure our own food to ensure our freedom because my behavior is all i can change
year. On this basis, we can objectively compare products. So, producers have to learn to think carefully about the real life time and the real raw energy invested into their products/services/energy.
7. Of course, we also have to look into the energy needed for operation, maintenance, and repair per year over the lifetime
In many cases, people have influence over or control over this, and they could also decide to stop the operation at any time, isn't it? Or look for better alternatives.
8. The product with the least raw energy input over its lifetime should win the competition, and its cost could be increased.
In our economic system, it is not much different, except that the money values are not reproducible, vary over time and place, and depend on so many unpredictable price/cost changes and factors.
9. If we were to start triple bookkeeping, double bookkeeping already exists, and add energy parallel to the money, we all would be able to quickly assess our energy impacts
Energy is still the cause of global warming, and CO2, CH4, landscape change, lack of water, etc. only speed it up. Our approach is not as difficult as trying to monitor
Growth
Words
Time Concentration
Fer
Too
the food-web of our ecosystems. They don't have any form of currency to compete, apart from the competition for energy. Our ecosystems are always working optimally, unless we humans take water, nutrients, or organics away, or change global or local air quality.
From nature alone, 8 billion people cannot survive/live/ eat. VAT (Value Added Tax) or GCT (General Consumption Tax) exist. So, the first step is to pay an energy tax. The blockchain will ensure accountability and transparency, as well as the base for rights and duties for equal, free, fair, and just If our basic needs would be satisfied, people could start contributing directly to our goals, instead of misusing data / information, complaining, stealing, accusing and invent-
ing fake facts.
Sustainability is about humans, still animals, and its No. 1 and No. 2 are still part of the food cycle, which is known as natural, ecological, recycling, or reuse; however, more and more "waste" is destroyed by using a lot of energy.
We, unfortunately, only learn from negative information. So, let us respect and utilise criticism. If a problem is very clearly formulated, we can more easily work on a solution. Let's start carrying more individual responsibility!
10. What is still missing is a market mechanism to control or direct energy use.
10.1 Introduce an Energy Tax, similar to VAT or GCT, to
Biogas Magazine | Edition 22 | 37
Worse Worse
Better
Now?
Optimum Balanced Equilibrium
Clean Poor Dead Sterile Nice Nature Good Best or Worst Ecological
tilizing Composting Nutrient Rich Trace Elements Agriculture Nature Good or Bad Ecological Bio-Industr y
Dirt y Fer tilizer Polluted Toxic Inhibited Resource Dead Worst or Best Rich Nutrients *Temperature* water, pH
are confusing without One reproducible Indicator and One numerical Reference
raise awareness and carry personal responsibility
10.2 Return the tax to all below average consumers, proportional to the amount below average
Money is still the driving force for economic growth, while hopefully securing minimal income, so that people no longer have to complain, steal, manipulate, lie, etc. and can start contributing straightforward path to a better world.
11. Since the early 1970s, nobody has been successful in controlling global warming. Is there any thinking that worked both inside and outside the box?
Our methodology in keywords: We are talking about facts and a free market economy, driven by energy minimization, individual freedom, safeguarding basic needs, transparency, accountability, rights, and duties!
12. Our Conclusion / Summary
1. Agree: Energy (kWh, raw) is the cause of everything.
2. Create Awareness: Show Energy in Every Transaction.
3. Carry Responsibility: Pay Energy Tax.
4. Reward: Return the energy tax to all, who consume less than average.
This will not only make people take responsibility for their behavior, but hold them accountable (blockchain) and make industries, authorities and farmers minimize their energy use for products, services, and energy. Still, with a clear and joint indicator/goal everyone can focus.
And the Greenest Energy is the Energy we don't MISUSE!
Biogas Magazine | Edition 22 | 38
Johan Verink Environmental Engineer (Retd.) Inventor of AOPR
Checklist for Prioritizing Resource and Energy Use for Finding a Way towards a more Sustainable Life


HARVESTING YOUR RENEWABLES

Biogas Engineering India Pv t. Ltd. is a subsidiar y company of Biogas E n g i n e e r i n g I n c . U S A , w h i c h i s a n e n g i n e e r i n g , p ro c u re m e n t a n d c o n s t r u c t i o n ( E P C ) c o m p a n y . W e a r e a n e x p e r t i n u p g r a d i n g Biogas/Land fill gas to Compressed BioGas (CBG), utilize gas for Heat & Power Generation and waste gas for Carbon Capture.

Biogas Magazine | Edition 22 | 40
Specialization
CBG CBG
CBG
