Toward an Understanding of Discrimination When Multiple Channels Exist
UChicago Scholar: John List
RESEARCH BRIEF • MAY 2025
Separation of Church and State Curricula? Examining Public and Religious Private School Textbooks
Based on BFI Working Paper No. 2025-63, “Separation of Church and State Curricula? Examining Public and Religious Private School Textbooks,” by Anjali
Adukia and Emileigh Harrison, UChicago Harris School of Public Policy
Public school textbooks from Texas and California contain similar content, while religious school textbooks have less female representation, feature lighter-skinned individuals, and portray topics like evolution and religion differently. All collections rarely include LGBTQIA+ discussion, portray females in more positive but less active or powerful contexts than males, and depict the US founding era and slavery in similar contexts.
Education plays a vital role in shaping our collective memory and understanding of the world. Recognizing this influence, political and religious actors have long sought to shape school curricula to reflect their values and ideologies. In the United States, school choice programs such as charter schools and voucher initiatives have expanded parents’
ability to select educational environments that align with their values or religious beliefs. Despite the growing prevalence of these programs and the public investment they attract, we lack comprehensive evidence on how curricular content differs across schools. Motivated by this gap, in this paper, the authors examine popular textbooks used across a variety of educational settings in the United States.
The authors examine state-adopted public school textbooks in California and Texas, two states that serve the largest student populations in the in the United States and often represent polar political landscapes, as well as curricular materials often adopted in religious private schools and home school contexts. Using computational social science
methods, including artificial intelligence tools, they analyze the content of these textbooks to assess what topics are covered, which individuals and groups are highlighted, and how those groups and values are portrayed. Their analysis focuses on textbooks in the foundational subjects of Reading, Science, and Social Studies, specifically those intended for third and fifth grade students. They find the following:
• There are meaningful parallels between the California and Texas public school collections, while the religious school textbooks differ notably. Compared to public school textbooks, religious school textbooks have less female representation, feature lighter-skinned individuals, and portray topics like evolution and religion differently.
• The authors also uncover important similarities between religious school and public school textbooks. For example, each collection portrays females in contexts that are more positive but less active and powerful than males, discusses Christianity
more than other religions, rarely discusses historical or famous individuals who are Asian, Indigenous, or Latine, who were born outside of the North America and Europe, or who identify as lesbian, gay, or bisexual, and depicts the US founding era and slavery in similar contexts.
What we teach our children matters. Amid an increase in educational gag orders and statewide changes in the content standards of public school curriculum, this work shines a light on what messages children are receiving both from formal curricula inside the traditional public school system and from informal and non-traditional curricula outside the public school system, messages which could have long-term implications for children’s beliefs and decision-making.
READ THE WORKING PAPER
NO. 2025-63 · MAY 2025
Separation of Church and State Curricula? Examining Public and Religious Private School Textbooks bfi.uchicago.edu/working-papers/separation-of-churchand-state-curricula-examining-public-and-religious-privateschool-textbooks
Assistant Professor, Harris School of Public Policy
Postdoctoral Scholar, Inclusive Economy Lab at the Harris School of Public Policy
ABOUT OUR SCHOLARS
Anjali Adukia
Emileigh Harrison
RESEARCH BRIEF • MAY 2025
Intuit QuickBooks Small Business Index: A New Employment Series for the US, Canada, and the UK
Based on BFI Working Paper No. 2023-84, “Intuit QuickBooks Small Business Index: A New Employment Series for the US, Canada, and the UK,” by Ufuk Akcigit, University of Chicago; Raman Singh Chhina, University of Chicago; Seyit M. Cilasun, TED University; Javier Miranda, Friedrich-Schiller University; Eren Ocakverdi, Independent Researcher; and Nicolas Serrano-Velarde, Bocconi University
In partnership with Intuit, the authors created the Intuit QuickBooks Small Business Index, a new data source covering monthly small business employment and hiring in the United States, Canada, and the U.K.
Small businesses play an outsized role in job creation, innovation, and economic growth. According to the most recent data from the US Bureau of Labor Statistics and the US Census Bureau, about 80% of all workplaces in the United States consist of small businesses with fewer than ten employees. Such companies have fewer internal resources, making them more fragile and sensitive to macroeconomic conditions. Despite the importance of small businesses,
Figure 1 ·
real-time data about their performance are hard to produce. In this paper, the authors attempt to fill this gap by providing a new and unique index on the smallest of small businesses in the United States, Canada, and the U.K.
The authors collaborated with Intuit, creator of the popular accounting software QuickBooks, to create the Intuit QuickBooks Small Business Index. Each
Note: This figure shows job creation patterns by industry in the United States. The gray area shows an out-of-sample projection for the period after the second quarter of 2022. As you can see, small businesses in the Accommodation and Food sector experienced the largest employment declines during the COVID-19 pandemic, followed by Arts and Entertainment and Wholesale. These sectors also experienced the largest recoveries. The sectors in which small businesses were least affected are Professional Services and Finance, followed by Construction and Manufacturing.
Note: This figure shows job creation patterns by industry in the United States. The gray area shows an out-of-sample projection for the period after the second quarter of 2022. As you can see, small businesses in the Accommodation and Food sector experienced the largest employment declines during the COVID-19 pandemic, followed by Arts and Entertainment and Wholesale. These sectors also experienced the largest recoveries. The sectors in which small businesses were least a ected are Professional Services and Finance, followed by Construction and Manufacturing.
month, Intuit’s analytics team provides the authors with aggregated and anonymized employment data from their QuickBooks Online Payroll subscribers. The authors use external data to normalize the data so that the Index reflects the broader population of small businesses rather than the QuickBooks customer base.
The end product is a dashboard showing monthly stats on employment and employment growth rates for small businesses (for the United States and Canada), and small business job vacancies and growth rates (in the case of the U.K.). The Index offers many insights, which the authors preview in their accompanying paper:
• Small businesses in the Accommodation and Food industry experienced the largest declines in employment during the COVID-19 pandemic, followed by those in the Arts and Entertainment and Wholesale sectors. These industries also experienced the largest recoveries. The least affected sectors were Professional Services and Finance, followed by Construction and Manufacturing.
• In late 2022, employment decreased in small businesses across all industries, with the smallest declines in Agriculture, Mining, and Utilities, followed by Education and Professional Services. The largest declines were in Information, Transportation, and Leisure.
• Small business activity experienced sharper declines in the Midwest, New England, and the Great Lakes regions during the COVID-19 pandemic. Least affected were the South, and the Rocky Mountain area. All areas appear to be negatively impacted in late 2022, with the New England region experiencing the smallest declines.
The Intuit QuickBooks Small Business Index provides data about the small business economy in near realtime, making it a valuable resource to both researchers and policymakers alike. The primary purpose of this research release is to provide information on the methodology used to create the Index, and the authors encourage further researchers to utilize the publicly available data for their own work.
READ THE WORKING PAPER
NO. 2023-84 · JUNE 2023
Intuit QuickBooks Small Business Index: A New Employment Series for the US, Canada, and the U.K. bfi.uchicago.edu/working-paper/intuit-quickbooks-smallbusiness-index-a-new-employment-series-for-the-uscanada-and-the-uk
OUR SCHOLAR
Ufuk Akcigit
Arnold C. Harberger Professor in Economics and the College, Kenneth C. Griffin Department of Economics
ABOUT
Written by Abby Hiller
Designed by Maia Rabenold
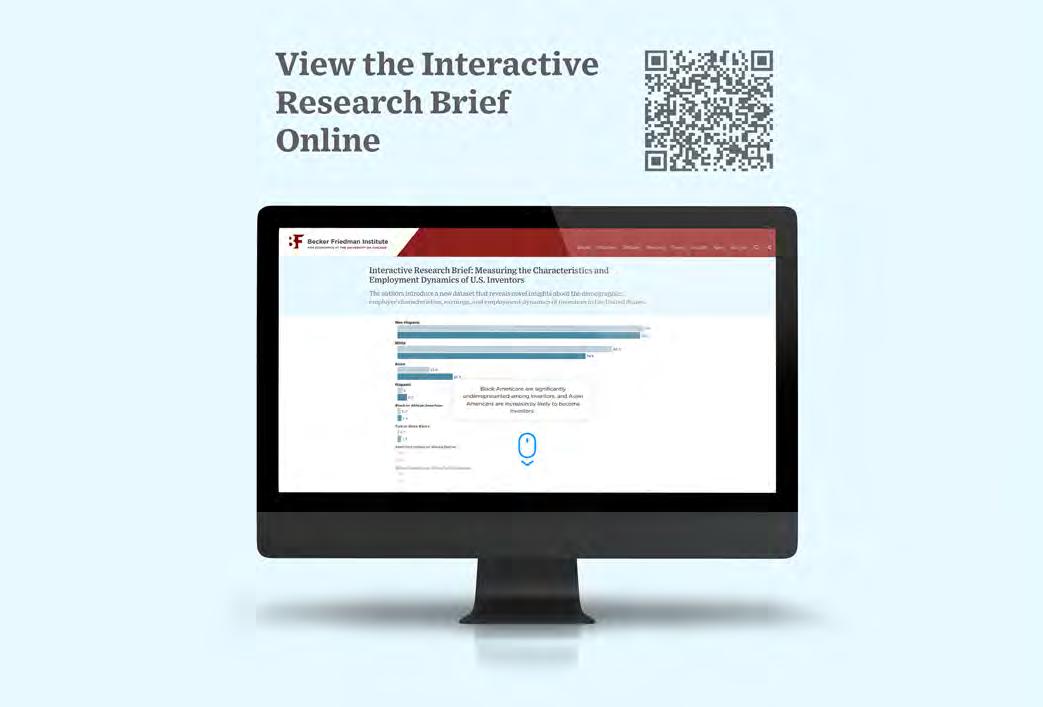
Measuring the Characteristics and Employment Dynamics of US Inventors
Based on the paper, “Measuring the Characteristics and Employment Dynamics of US Inventors,” by Ufuk Akcigit, University of Chicago; and Nathan Goldschlag, Economic Innovation Group
The authors introduce a new dataset that reveals novel insights about the demographics, employer characteristics, earnings, and employment dynamics of inventors in the United States.
Innovation is a key driver of economic growth, and understanding the conditions that lead people to invent new technologies can help reduce inequality between groups as well as help spur growth overall. This paper aims to facilitate such efforts through the introduction of a new dataset that links1 data from the Census Bureau to information on inventors who received patents between 2000 and 2016. The end result is a dataset covering demographic characteristics and employment histories for over 760,000 inventors, from which the authors draw the following insights
concerning inventors’ demographics, employers, earnings, and employment trajectories.
Demographics:
• Females are underrepresented among inventors, especially on a citation weighted basis. Females account for less than 12% of inventors, a share that is rising and tends to be higher among young inventors. The share of citations accounted for by female inventors lags behind their share of the inventor population.
• Over 30% of inventors are foreign born, and China and India account for an increasing share of foreignborn inventors, rising from 25% to 40% between 2000 and 2016.
• Inventors are getting older. The average age of inventors rose from 43 to 46 between 2000 and 2016. The share of young inventors fell through 2011, but began to rise thereafter.
• Black Americans are significantly underrepresented among inventors, accounting for less than 2%. Asian inventors are increasingly common, rising from 13% to
1 Available to researchers with approved access via the Federal Statistical Research Data Center (FSRDC) system. Additional information about linkage process available in the paper, “Measuring the Characteristics and Employment Dynamics of US Inventors,” by Ufuk Akcigit and Nathan Goldschlag.
between 2000 and 2016.
• Representation of different demographic groups varies significantly by sector. Female inventors have greater representation in the Health Care and Social Assistance and Education sectors, and foreign-born inventors are more common in the Information, Education, and Professional/Scientific Services sectors. The share of young inventors is highest in the Information sector.
Employers:
• Inventors tend to work at older, larger firms. Over 68% of inventors work in firms over 20 years old, and almost 63% work in large firms with at least 1000 employees. The share of inventors on patent grants with the largest assignees between 1980 and 2018 rose from about 34% to 47% percent.
• Inventors, especially the most productive, are much less likely to work at young firms over time. The share of inventors working at firms fewer than five years old fell by almost half between 2000 and 2016, from 15% to under 8%. This share fell the most among super star inventors, defined as those with the most impactful patents.
• Inventors at young and medium-size firms tend to have the highest impact patents, and inventors at older, smaller firms tend to have the lowest impact patents.
Earnings:
• Inventor earnings are highly skewed, especially super star inventors. About 63% of all inventors (and 88% of super star inventors) are among the top 10% of earners. Almost 8% of inventors (and 19% of super star inventors) are in the top 1%.
• Inventor earnings are closely tied to inventive productivity. Inventors in the top 10% of the inventor earnings distribution tend to receive considerably more citations than inventors in the bottom 10%.
Employment:
• Inventors are less likely to switch jobs over time. The hire and separation rates for inventors fell from about 6% and 7% respectively in 2000 to 4% in 2016.
• Inventors, especially super star inventors, are less likely to start a firm over time. The probability a that super star inventor becomes an entrepreneur fell by 57% between 2000 and 2016.
• Inventors are increasingly geographically concentrated and less likely to change employment across state lines. The share of inventors working in the 20 largest 4 counties by inventor count rose from 39% to over 47% between 2000 and 2016. The share of inventors switching employment across state lines fell from a peak of 4.6% in 2006 to 2.6% in 2016.
The findings offer a glimpse at the types of insights made possible through the data introduced here. These data will be made available to researchers with approved access via the Federal Statistical Research Data Center (FSRDC) system, drastically expanding the types of analyses possible regarding the role of individuals in the inventive process.
Measuring the Characteristics and Employment Dynamics of U.S. Inventors link.springer.com/article/10.1007/s10887-025-09251-9
RESEARCH BRIEF • MAY 2025
The Effect of Medicaid on Crime: Evidence from the Oregon Health Insurance Experiment
Based on BFI Working Paper No. 2024-158, “The Effect of Medicaid on Crime: Evidence from the Oregon Health Insurance Experiment,” by Katherine Baicker, University of Chicago; Amy Finkelstein, MIT; and Sarah Miller, University of Michigan
Random access to Medicaid health insurance coverage does not reduce the likelihood of criminal charges or convictions.
Those involved with the criminal justice system have disproportionately high rates of mental illness and substance-use disorders, prompting speculation that health insurance, by improving treatment of these conditions, could reduce crime. This study draws on the 2008 Oregon Health Insurance Experiment to provide new evidence on the impact of Medicaid coverage on criminal justice involvement.
In 2008, the state of Oregon used a random lottery to allocate 10,000 available enrollment spots in one of its Medicaid programs. Lowincome adults selected by the lottery were 25 percentage points more likely to enroll in Medicaid than those who signed up but were not selected. Researchers linked all study participants to individual-level administrative records from the Oregon Judicial Information Network, which includes data on criminal cases, charges, and convictions from 2007 to 2010, providing, to their knowledge, the first
experimental evidence on the relationship between Medicaid and crime. They find the following:
• Medicaid coverage has no statistically significant impact on criminal charges or convictions.
• These null effects persist even among high-risk groups, such as individuals with prior criminal records or a history of mental health conditions. This contrasts with earlier quasi-experimental studies, many of which focused on narrower highrisk populations and found reductions in crime. One interpretation is that crimereducing effects of Medicaid for high-risk subgroups may not generalize to the broader Medicaid-eligible population.
These results suggest that the impact of Medicaid coverage on criminal justice involvement may be more limited than
previously believed. Importantly, criminal charges and convictions are just one metric for evaluating the benefits of health insurance. Medicaid eligibility and coverage have been linked to a range of positive outcomes, including better access to and increased use of medical care, improved physical and mental health, and enhanced economic security. Nonetheless, for policymakers seeking to reduce criminal behavior specifically, this study suggests that expanding health insurance coverage may not be an effective strategy.
READ THE WORKING PAPER
NO. 2024-158 · DECEMBER 2024
The Effect of Medicaid on Crime: Evidence from the Oregon Health Insurance Experiment bfi.uchicago.edu/working-papers/the-effect-of-medicaidon-crime-evidence-from-the-oregon-health-insuranceexperiment
ABOUT OUR SCHOLAR
Katherine
Baicker Provost, University of Chicago and Emmett Dedmon Professor, Harris School of Public Policy
Non-User Utility and Market Power: The Case of Smartphones
Based on BFI Working Paper No. 2025-52, “Non-User Utility and Market Power: The Case of Smartphones,” by Leonardo Bursztyn, University of Chicago; Rafael Jiménez-Durán, Bocconi University; Aaron Leonard, University of Chicago; Filip Milojević, University of Chicago; and Christopher Roth, University of Cologne
Among US college students, most iPhone and Android users would prefer that messages to Android devices no longer appear as green bubbles on iPhones, and iPhone users have a significant willingness to pay to prevent their messages from appearing as green bubbles on other iPhones. Students are also substantially more likely to choose an Android over an iPhone when green bubbles are expected to be removed. These results suggest that firms can enhance their market power by decreasing the utility of competing products’ users, harming both consumers and non-consumers.
A traditional way to increase demand for a product is to make it more useful. But what about making the competition less useful? Take smartphones, for example. In addition to adding features that boost the iPhone’s utility, Apple has been accused of increasing the disutility of not owning an iPhone. Specifically, messages exchanged between iPhones and Android devices appear as green bubbles, in contrast to the blue bubbles used for iPhone-to-iPhone communication, prominently distinguishing iPhone users from non-users. Do these tactics harm consumers?
Figure 1 · Respondents that Prefer a Software Giving Blue Bubbles For Everyone Respondents that Prefer a Software Giving Blue Bubbles For Everyone
In this paper, the authors examine this question using the smartphone market as a case study. They begin by surveying college students about green bubble stigma and find the following:
• Over 90% of respondents believe green bubbles stigmatize Android users, often associating them with lower social status and attractiveness.
• A large majority of Android users (79%) said they would want a hypothetical software change that removes the green bubble distinction, making all messages appear as blue bubbles on iPhones.
• Strikingly, most iPhone users (66%) also favor such a change.
• Most respondents believe removing green bubbles would improve the perceived quality of Androids while leaving perceptions of iPhones largely unchanged.
Building on these results, the authors set out to quantify the welfare effects of the green bubble feature through an incentivized deactivation experiment designed to isolate demand for this specific product attribute. The experiment reveals the following:
• US college iPhone users, on average, require a payment of $49 to have their messages appear as green instead of blue bubbles on other iPhones for four weeks.
Note:
• The authors benchmark the effect size against other iPhone features and find that the median valuation of blue bubbles corresponds to 50% and 26% of the median valuation of iMessage and the phone camera, respectively. These estimates show that respondents place a high value on avoiding green bubbles, highlighting the economic significance of the welfare cost.
Next, the authors assess how green bubbles influence the relative demand for iPhones versus Androids through an additional incentivized experiment. Respondents are asked to choose between iPhones and Androids in two contingent scenarios: one where green bubbles are banned, and one where they remain. The experiment reveals the following:
• Respondents are 7.3 percentage points more likely to choose the Android option when green bubbles are expected to be removed. This is a sizable effect, representing a 46% increase in the share of respondents choosing Android from a baseline of 15.8% when green bubbles remain.
Finally, the authors present a series of case studies on product features that diminish non-user utility. They show that this phenomenon is widespread across industries and illustrate how companies can strategically strengthen their market power:
• Dating apps employ features such as notifications about missed connections, nudging users to stay active to avoid losing potential matches.
• Social media platforms like Instagram foster a fear of missing out (FOMO) through features like ephemeral content (e.g., stories that disappear after 24 hours) and push notifications (e.g., “Your friend just posted for the first time in a while”).
READ THE WORKING PAPER
NO. 2025-52 · APRIL 2025
Non-User Utility and Market Power: The Case of Smartphones bfi.uchicago.edu/working-papers/non-user-utility-andmarket-power-the-case-of-smartphones
Respondents Choosing the Google Pixel 9 Option over the iPhone 16 Option
Figure 2 · Respondents Choosing the Google Pixel 9 Option over the iPhone 16 Option
These findings reveal that firms can shape consumer demand not only by enhancing user utility but also by diminishing non-user utility. This practice raises critical competition policy concerns, as it suggests that firms may deliberately erode non-user utility to strengthen their dominance, harming both consumers and nonconsumers. Crucially, when there is no outside option without the product, it is not possible to distinguish— based on choice and price data alone—cases where user utility increases from cases where non-user utility falls. In light of the growing importance of digital products, developing antitrust measures against the strategic erosion of non-user utility will become an increasingly important task for regulators.
ABOUT OUR SCHOLARS
Leonardo Bursztyn
The Saieh Family Professor of Economics, Kenneth C. Griffin Department of Economics
Aaron Leonard PhD Student, Kenneth C. Griffin Department of Economics
Filip Milojević
Research Professional, Normal Lab, University of Chicago
Written by Abby Hiller • Designed by Maia Rabenold
Note: This figure shows the percentage of respondents who chose the Google Pixel 9 (plus a $150 incentive to o set the price di erence) over the iPhone 16, contingent on whether the iPhone's green bubble messaging status remains unchanged. Error bars represent 95% confidence intervals.
Green Bubbles Remain
Note: This figure shows the percentage of respondents who chose the Google Pixel 9 (plus a $150 incentive to offset the price difference) over the iPhone 16, contingent on whether the iPhone’s green bubble messaging status remains unchanged. Error bars represent 95% confidence intervals.
RESEARCH BRIEF • APRIL 2025
Evaluating Recent Crackdowns on Disability Benefits: Effects on Income and Health Care Use in Australia
Based on BFI Working Paper No. 2025-60, “Evaluating Recent Crackdowns on Disability Benefits: Effects on Income and Health Care Use in Australia,” by Manasi Deshpande, Greg Kaplan, and Tobias Leigh-Wood, University of Chicago
For those removed from disability rolls, family support matters: those living alone experience a drop in income and an increase in antipsychotic medication usage, while those living with family do not.
To counter increased enrollment in disability insurance (DI) programs in recent decades, many developed countries, including the Netherlands, Sweden, the UK, Germany, and Australia, implemented reforms to limit access to DI and to remove existing beneficiaries. Similar reforms have been proposed in other countries, including the United States.
While research has shed some light on the effects of such reforms on work participation, a full assessment requires analysis of effects on household income and overall well-being. This work addresses that gap by estimating the effects of DI crackdowns on a wide range of recipient outcomes, including household income and health care usage. The authors employ data from the Australian Disability Support Pension (DSP), a means-tested program with no work history requirement, which tightened its medical criteria in 2012 due to rising enrollment. In 2014, these stricter standards were also applied to existing DSP recipients through medical reviews, specifically targeting younger individuals who initially received DSP after January 1, 2008, and who turned 35 after July 1, 2014.
1 · Responses to Disability
By linking DSP recipients to family members using newly available administrative data, the authors analyze the impacts on household income, which includes the recipients’ own earnings, government benefits, and
those of their family members, as well as health care usage, such as medical visits and prescription drug consumption. They find the following:
• On average, the removal of DSP does not significantly impact household income; in some cases, it even results in a net positive outcome. Recipients manage to recover approximately 55% of their lost benefits by accessing other government programs, and recover about 35% by increasing their work hours, typically in low-skilled positions. Family members also contribute to income recovery, with parents of recipients replacing 35% of lost DSP benefits and spouses replacing 15%.
• However, family structure is key. For the 43% of individuals living with family, income increases as their family members offset the DSP loss through higher earnings. In contrast, the 57% of individuals living alone do not benefit from family support, do not increase their own earnings, and experience a reduction in household income, relying heavily on other government programs to replace about twothirds of their lost DSP benefits.
• Additionally, DSP removal is associated with a significant increase in prescriptions for mental health drugs, particularly antipsychotics, especially for men and individuals living alone. Specifically, the likelihood of receiving a mental health
prescription rises by 23 percentage points, with a similar increase for antipsychotic prescriptions.
The authors suggest three possible mechanisms for the increase in mental health drug prescriptions: an income effect (greater drug use can increase productivity or make work easier), an incentive effect (to the extent that disability benefits discourage treatment, removal could reduce disincentives to seek treatment), and a stress effect (where the stress of losing income prompts increased medication use). The evidence leans toward the stress effect.
Bottom line: DI crackdowns may have very different effects depending on what kind of informal safety net recipients have access to. For those with family support, family members may be able to make up the lost income and mitigate the effects on the recipients. But for those without an informal safety net, the effects are potentially quite negative. As for encouraging work among those capable of work, again, those living with family members worked modestly more and mostly in low-skilled occupations, while those living alone did not work more and turned to mental health drugs to cope with the income loss. For policymakers, the message here is that focusing on average effects may lead to a misunderstanding of overall welfare implications, since average effects may mask a wide range of actual effects—from very positive to very negative.
READ THE WORKING PAPER
NO. 2025-60 · APRIL 2025
Evaluating Recent Crackdowns on Disability Benefits: Effects on Income and Health Care Use in Australia
Associate Professor, Kenneth C. Griffin Department of Economics
Greg Kaplan
Alvin H. Baum Professor, Kenneth C. Griffin Department of Economics
Tobias Leigh-Wood
BFI Predoctoral Research Professional and Incoming PhD Student
Written by David Fettig
• Designed by Maia Rabenold
RESEARCH BRIEF •
FEBRUARY 2025
Toward an Understanding of Discrimination When Multiple Channels Exist
Based on BFI Working Paper No. 2025-18, “Toward an Understanding of Discrimination When Multiple Channels Exist,” by Majid Ahmadi, Georgia Institute of Technology; Gwen-Jirō Clochard, University of Osaka; Jeff Lachman, University of Chicago; and John A. List, University of Chicago
This work offers insights into the influence of racial discrimination on drafting (hiring) professional baseball players; importantly, the authors discuss at length how their employed methodology can be generalized to other markets.
Gary Becker’s 1957 book-length monograph, The Economics of Discrimination, was one of the first economic treatments of discrimination in the marketplace, giving impetus for a new field of economic research. Among its many contributions, Becker’s work provided a theoretical framework to quantify non-pecuniary motives in discriminatory behavior within labor markets. Until then, such motives were the provenance of sociology, psychology, and anthropology. What could economics possibly have to say about issues not relating to money?
Plenty, as Becker revealed not only in his book but throughout his influential career, as he explored the many applications of economic analysis to human behavior. On discrimination in hiring, Becker identified three potential biases: managerial, coworker, and customer. Economists have since investigated these biases, both theoretically and empirically, to determine their influence on hiring. However, five decades of measuring and identifying discriminatory hiring patterns have not resolved all quantitative challenges. For example, limited data mean that researchers must rely on aggregated measures that hide effects related to the biases of managers, employees, and customers. As Becker described, to thoroughly parse the role of
Figure 1 · Index of Fan Bias and Share of African-American Players Drafted Index of Fan Bias and Share of African-American Players Drafted
Note: This figure reveals a clear relationship between fan bias and the racial composition of drafted players. There is a negative correlation between the team bias index and the proportion of African American players drafted. The X-axis corresponds to the composite index of fan bias computed with reactions to posts related to the Black Lives Matter movement. The Y-axis corresponds to the share of African American players drafted during the study period (2008-20). The gray line is the regression line. β = −0.036, p = 0.03. See working paper for more details.
Note: This figure reveals a clear relationship between fan bias and the racial composition of drafted players. There is a negative correlation between the team bias index and the proportion of African American players drafted. The X-axis corresponds to the composite index of fan bias computed with reactions to posts related to the Black Lives Matter movement. The Y-axis corresponds to the share of African American players drafted during the study period (200820). The red line is the regression line. β = −0.036, p = 0.03. See working paper for more details.
discrimination in hiring, we need to consider those distinct discriminatory preferences.
This paper addresses that gap by introducing a theoretical framework that shows that to disentangle managerial and customer biases, one’s data must possess certain features:
1. an objective metric for assessing worker quality,
2. detailed information regarding the composition of hiring decision-makers, and
3. a measure of customer bias magnitude.
It turns out that an ideal setting for this investigation is Major League Baseball’s (MLB) annual draft, which is how MLB assigns amateur players (whether high school, college, or amateur baseball clubs) to its professional teams. This setting adheres to an external validity litmus test for data developed by one of this paper’s co-authors, UChicago’s John A. List (see “In defense of external validity”). Based on List’s rationale from his 2020 paper, the authors conclude that it is nearly impossible to find a more appropriate setting that allows for rigorous testing of the above framework.
The authors examine drafting (or hiring) decisions made by MLB teams from 2008 to 2019, when about 12,000 players were drafted, including scouting evaluations and detailed information about each scout, including racial background. (Baseball scouts evaluate players for MLB teams, including on location during games and at training facilities; think of them as a traveling HR department.) Publicly available data on thousands of players—drafted and undrafted—allow the authors to construct the first key metric necessary to distinguish sources of discrimination: an objective measure of player quality. In other words, all players deemed high quality should be drafted, regardless of race or other discriminatory factors.
To fulfill the second dataset described above—the racial composition of hiring managers—the authors also collect comprehensive data on all MLB scouting directors, including their racial backgrounds. These data allow the authors to assess whether scouting directors exhibit a propensity to recruit players of their own race.
Finally, to measure customer (fan) bias, the authors study a naturally occurring event, the Black Lives Matter (BLM) movement in June and July 2020, during which all MLB teams posted messages on social media. The authors then perform a textual analysis of responses to such postings to create an index of fan bias. Further, the authors analyze stadium attendance data from 2008-2019, examining its correlation with the racial composition of the team. Thus, armed with data addressing worker quality, manager discrimination, and customer bias, the authors apply these empirical insights to their models to find the following:
• There is no significant association between race and the likelihood of a player being drafted. When controlling for prospect quality, African American
In defense of external validity
To test their theoretical insights (models) against reality (empirics), economists and other social scientists employ data. These data are often limiting in their explanatory value as they necessarily represent a fraction of a possible dataset. In the present case, for example, to include every piece of data regarding every hiring decision in an economy over time would be impossible, not to mention unwieldy. The trick, rather, is to gather data from a particular subset that delivers strong findings from which we can extrapolate to the rest of the world.
This is more than an academic exercise, as the point of most social science is to impact policymaking. And if we are going to affect policymaking—that is, directly impact people’s lives—we want to ensure that our data are valid beyond our subset; that is, our data should be externally valid. For some, such validity is a humbug. For these skeptics of empirical economics, even the slightest doubt about validity renders a study moot.
In “Non Est Disputandum De Generalizability? A Glimpse into the External Validity Trial,” a satirical (and, rare to say for an economics paper, entertaining) defense of external validity, UChicago’s John A. List argues that it is possible to pass an external validity test. Indeed, unique empirical settings—in our case here, MLB hiring practices—are not always a distraction from reality; rather, when that uniqueness allows for relevant testing that no other setting can achieve, then a level of “perfection” is possible whereby we can confidently generalize (and scale) to the rest of the world.
Speaking of scaling, this little article only begins to describe List’s longer argument for the validity of empirical research, and the reader is encouraged to visit the full paper via the link above. That said, in sum, here are List’s four tenets of empiricism necessary to address external validity:
1. Theory and empiricism are symbiotic: theory provides a structure for thinking about the world, empirical work tests whether that structure is approximately correct and informs future theories.
2. One swallow does not make a summer: each study moves priors by an amount corresponding to its quality and the strength of priors.
3. To explain differences in observed choices across settings, ask if preferences, constraints, or beliefs have changed.
4. Uniqueness of a setting can be a key strength, not a weakness, if it isolates a particular channel or causal mechanism effectively.
players exhibit a slightly higher draft probability compared to their White counterparts.
• Player compensation is generally consistent across racial groups. However, controlling for player quality, there is some evidence suggesting that
Asian and White players receive lower signing bonuses compared to their peers.
• That said, patterns of discrimination loom deep within the data. There is a strong correlation between the drafting of African American players and customer bias during the early rounds of the draft: fan bias is associated with whether a player of a certain race is drafted early. This fan bias correlation, however, is reduced in the later rounds. Collectively, these findings suggest that MLB clubs are likely considering customer preferences when selecting players who will attract significant scrutiny and public attention.
• Conditional on player quality, scouting directors demonstrate a bias toward players of their own race, with these players 38 percent more likely
to be drafted later (during rounds 26-40). This suggests that when the stakes are lower and public scrutiny is reduced, scouting directors are more inclined to express their personal preferences, which is supported by the low probability that these players will reach the major leagues.1
• Finally, and related to the above finding, these revealed biased preferences carry economic costs: Teams draft lower-valued players when fan bias increases. While such customer bias bears significant opportunity costs (measured as reduced number of wins per season), the financial impact of managerial bias is limited, though, as these players are long shots to reach the majors.
Bottom line: The authors’ novel theoretical and empirical combination provides a framework for analysis of discrimination in economic settings where multiple sources of bias interact simultaneously, including biases hiding within aggregate measures. Likewise, and importantly, the authors’ results plausibly generalize to other markets; that is, this work adheres to List’s external validity test.
For scholars, this means caution when examining data for discrimination using establishment level data, as they run a risk when mining findings from aggregate data. When there is tension in biased preferences between management and customers, key aggregates can underestimate, or mask, key biases.
For policymakers, understanding the exact channels of bias is key to developing effective and scalable interventions, and this work offers a framework for modeling and estimating relevant sources of discrimination.
1See Majid Ahmadi, Nathan Durst, Jeff Lachman, John A. List, Mason List, Noah List, and Atom T. Vayalinkal (2023) “Nothing Propinks Like Propinquity: Using Machine Learning to Estimate the Effects of Spatial Proximity in the Major League Baseball Draft,” for a discussion of drafting decisions based on a player’s proximity to a scout’s home.
READ THE WORKING PAPER NO. 2025-18 · JANUARY 2025 Toward an Understanding of Discrimination When Multiple Channels Exist bfi.uchicago.edu/working-papers/toward-an-understandingof-discrimination-when-multiple-channels-exist
Distinguished Service Professor of Economics, Kenneth C. Griffin Department of Economics
Written by David Fettig • Designed by Maia Rabenold
The Transformation of Manufacturing and the Decline in US Employment
Kerwin Kofi Charles, Indra K. Nooyi Dean & Frederic D. Wolfe Professor of Economics, Policy, and Management, Yale University; Erik Hurst, Frank P. and Marianne R. Diassi Distinguished Service Professor of Economics and John E. Jeuck Faculty Fellow, Chicago Booth; Mariel Schwartz, UChicago Ph.D. Student in Economics
Employment rates and hours worked for prime-age men declined dramatically since 2000. Sectoral changes in manufacturing explain much of this decline, with primeage workers with less education feeling the brunt of these sectoral changes. Negative social effects, like increased drug use, hamper a region’s ability to recover.
In December 2017 the unemployment rate was 4.1 percent, far below its peak of 10 percent in October 2009 in the depths of the Great Recession, and nearly equaling the 3.9 percent in December 2000. From this reading of the data, the labor market had made tremendous gains to return to its pre-crisis strength. However, those headline unemployment numbers mask a precipitous decline in employment among prime-age working men linked to the decline in manufacturing, with negative effects that extend beyond the health of labor markets to the wellbeing of communities and their citizens.
Between 2000 and 2017, employment rates for men aged 21 to 55 fell by 4.6 percentage points, and hours worked per year fell by over 180 hours (employment
effects for women are also negative but less dramatic). These declines in employment began prior to the Great Recession while the economy was growing, and only worsened after 2007.
To put this decrease in perspective, the secular (or long-term) decline in annual hours worked for prime-age men from 2000 to 2017 is as large as the cyclical decline in annual hours worked during the 1982 recession. In other words, while the economy cycled through ups and downs between 2000 and 2017, prime-age working men endured a sort of shadow downturn, a 17-year decline in employment.
Using a variety of data sources and empirical approaches, the authors reveal the connection between this decrease in hours worked and the decline in manufacturing. Perhaps most sobering is the authors’ conclusion that those manufacturing jobs are not coming back. The increased pace of decline in manufacturing employment since 2000—when output actually increased by about 5 percent—reveals that improvements in productivity
Figure 1
Total Number of Manufacturing Establishments in the US (1977-2017)
are driving the decline in employment. Fewer workers are needed to produce more, and this won’t change. Therefore, efforts to rescue jobs through trade policy are misdirected, the authors’ show.
Beyond the labor market, the authors find further negative effects stemming from the decline in manufacturing employment. The authors’ novel research supports the emerging view that labor market conditions can impact different dimensions of health: In this case, loss of manufacturing jobs are associated with higher rates of prescription opioid abuse and overdose deaths. Further, those negative social effects can prevent the economic recovery of these regions as possible employers may be reluctant to locate where a large number of potential workers frequently fail drug tests.
Finally, the authors investigate why these sectoral changes seem so intractable. Industries have evolved for decades and workers have either moved, taken new jobs or otherwise adapted. However, many workers today in these communities seem trapped in place, opting to drop out of the workforce and otherwise make ends meet.