NATIONAL MARKET REPORT Q1 2022
BESPOKE REAL ESTATE ® TAILORED FOR $10M+. TAILORED FOR YOU. $112M+ Top Recent Bespoke Transaction $10B+ Total $10M+ Transactions $27M+ Average Sales Price
Industries change. Markets evolve. Great companies innovate.
Luxury real estate should be no exception.
Yet, the traditional brokerage model has not evolved in decades—and as a client, you’ve noticed.
Recognizing the need for change, Bespoke Real Estate launched in 2014 as the first and only firm to solely represent homes above $10 million with a revolutionary direct-to-client model.
Since our inception, we have facilitated over $9 billion in $10M+ sales. We have been unwavering in our mission to deliver the most tailored, uncompromising, result and relationship-driven experience for you, our clients.
Contact us to learn more about The Bespoke Method, our unique client-first advantages, and to list with the $10M+ experts.
HAMPTONS | MANHATTAN | SOUTH FLORIDA
The allure of a luxury price point is just the beginning; discover the competitive advantages of our data-driven platform and the unprecedented value afforded to you.
TAILORED FOR $10M +
As the first and only firm to focus solely on selling homes above $10 million, Bespoke delivers unmatched expertise.
REVOLUTIONARY DIRECT-TO-CLIENT MODEL
With no independent agents and no franchises, Bespoke delivers the capabilities of our entire company directly to our clients—without the dilution of resources found within traditional brokerages.
POWERED BY BESPOKE
LUXURY MARKETING
Bespoke’s sister company, known for representing the worldʼs most prestigious brands, builds compelling campaigns for our clientsʼ properties.
WEALTH INTELLIGENCE
Bespoke’s Data Division uses the most exclusive wealth intelligence in the industry. With the removal of independent agents and internal competition, Bespoke controls, collects, and utilizes all incoming data and information to market and sell our clientsʼ properties.
THE BESPOKE METHOD
The Bespoke Method delivers the industryʼs most pinpoint-accurate UHNW-targeted marketing, driving powerful results for you.
IMMERSIVE INSIGHT
As the sole curator of national $10M+ market reports, we ensure that the Bespoke client is the most informed.
PERPETUALLY EXPANDING NETWORK
Bespoke’s curated roster of the worldʼs most influential UHNWIs acts as an ever-expanding advisory for our brand and the most qualified network for our clientsʼ offerings.
RESULTS
Bespoke has facilitated over $9B in $10M+ transactions for our clients and amassed a $2B+ portfolio of the worldʼs finest offerings, with an average sales price of $27M+.
Weʼre on a mission to make the industry better for you. For decades there were no other options—Now you have Bespoke.
WHAT SETS US APART

© 2022, Bespoke Real Estate LLC (“Bespoke”), a licensed Real Estate Broker. All rights reserved. No party should act in reliance on this brochure. All transactional data and statistics are powered by Bespoke. BESPOKE DISCLAIMS ANY AND ALL WARRANTIES, EXPRESS OR IMPLIED, INCLUDING, BUT NOT LIMITED TO, WARRANTIES AS TO THE RELIABILITY, ACCURACY OR CURRENCY OF ANY INFORMATION, IMAGES AND/OR OTHER CONTENT HEREIN. Bespoke fully supports and complies with the Fair Housing Act, Equal Housing Opportunity Act and related state and local laws that prohibit discrimination.
BESPOKE VALUES INNOVATION, INTEGRITY, INSIGHT, AND IMPECCABLE DELIVERY.
Bespoke’s mission is to perpetually elevate industry standards by purposefully breaking rules and innovating new ways to bring value to our clients.
TABLE OF CONTENTS 02 INTRODUCTION 09 EXECUTIVE SUMMARY
THE HAMPTONS Q1 2022 $10M + MARKET REPORT 36 MANHATTAN Q1 2022 $10M + MARKET REPORT 50 SOUTH FLORIDA Q1 2022 $10M + MARKET REPORT
Q1 2022 $10M + NATIONAL MARKET REPORT
INVITATION
10
64
66
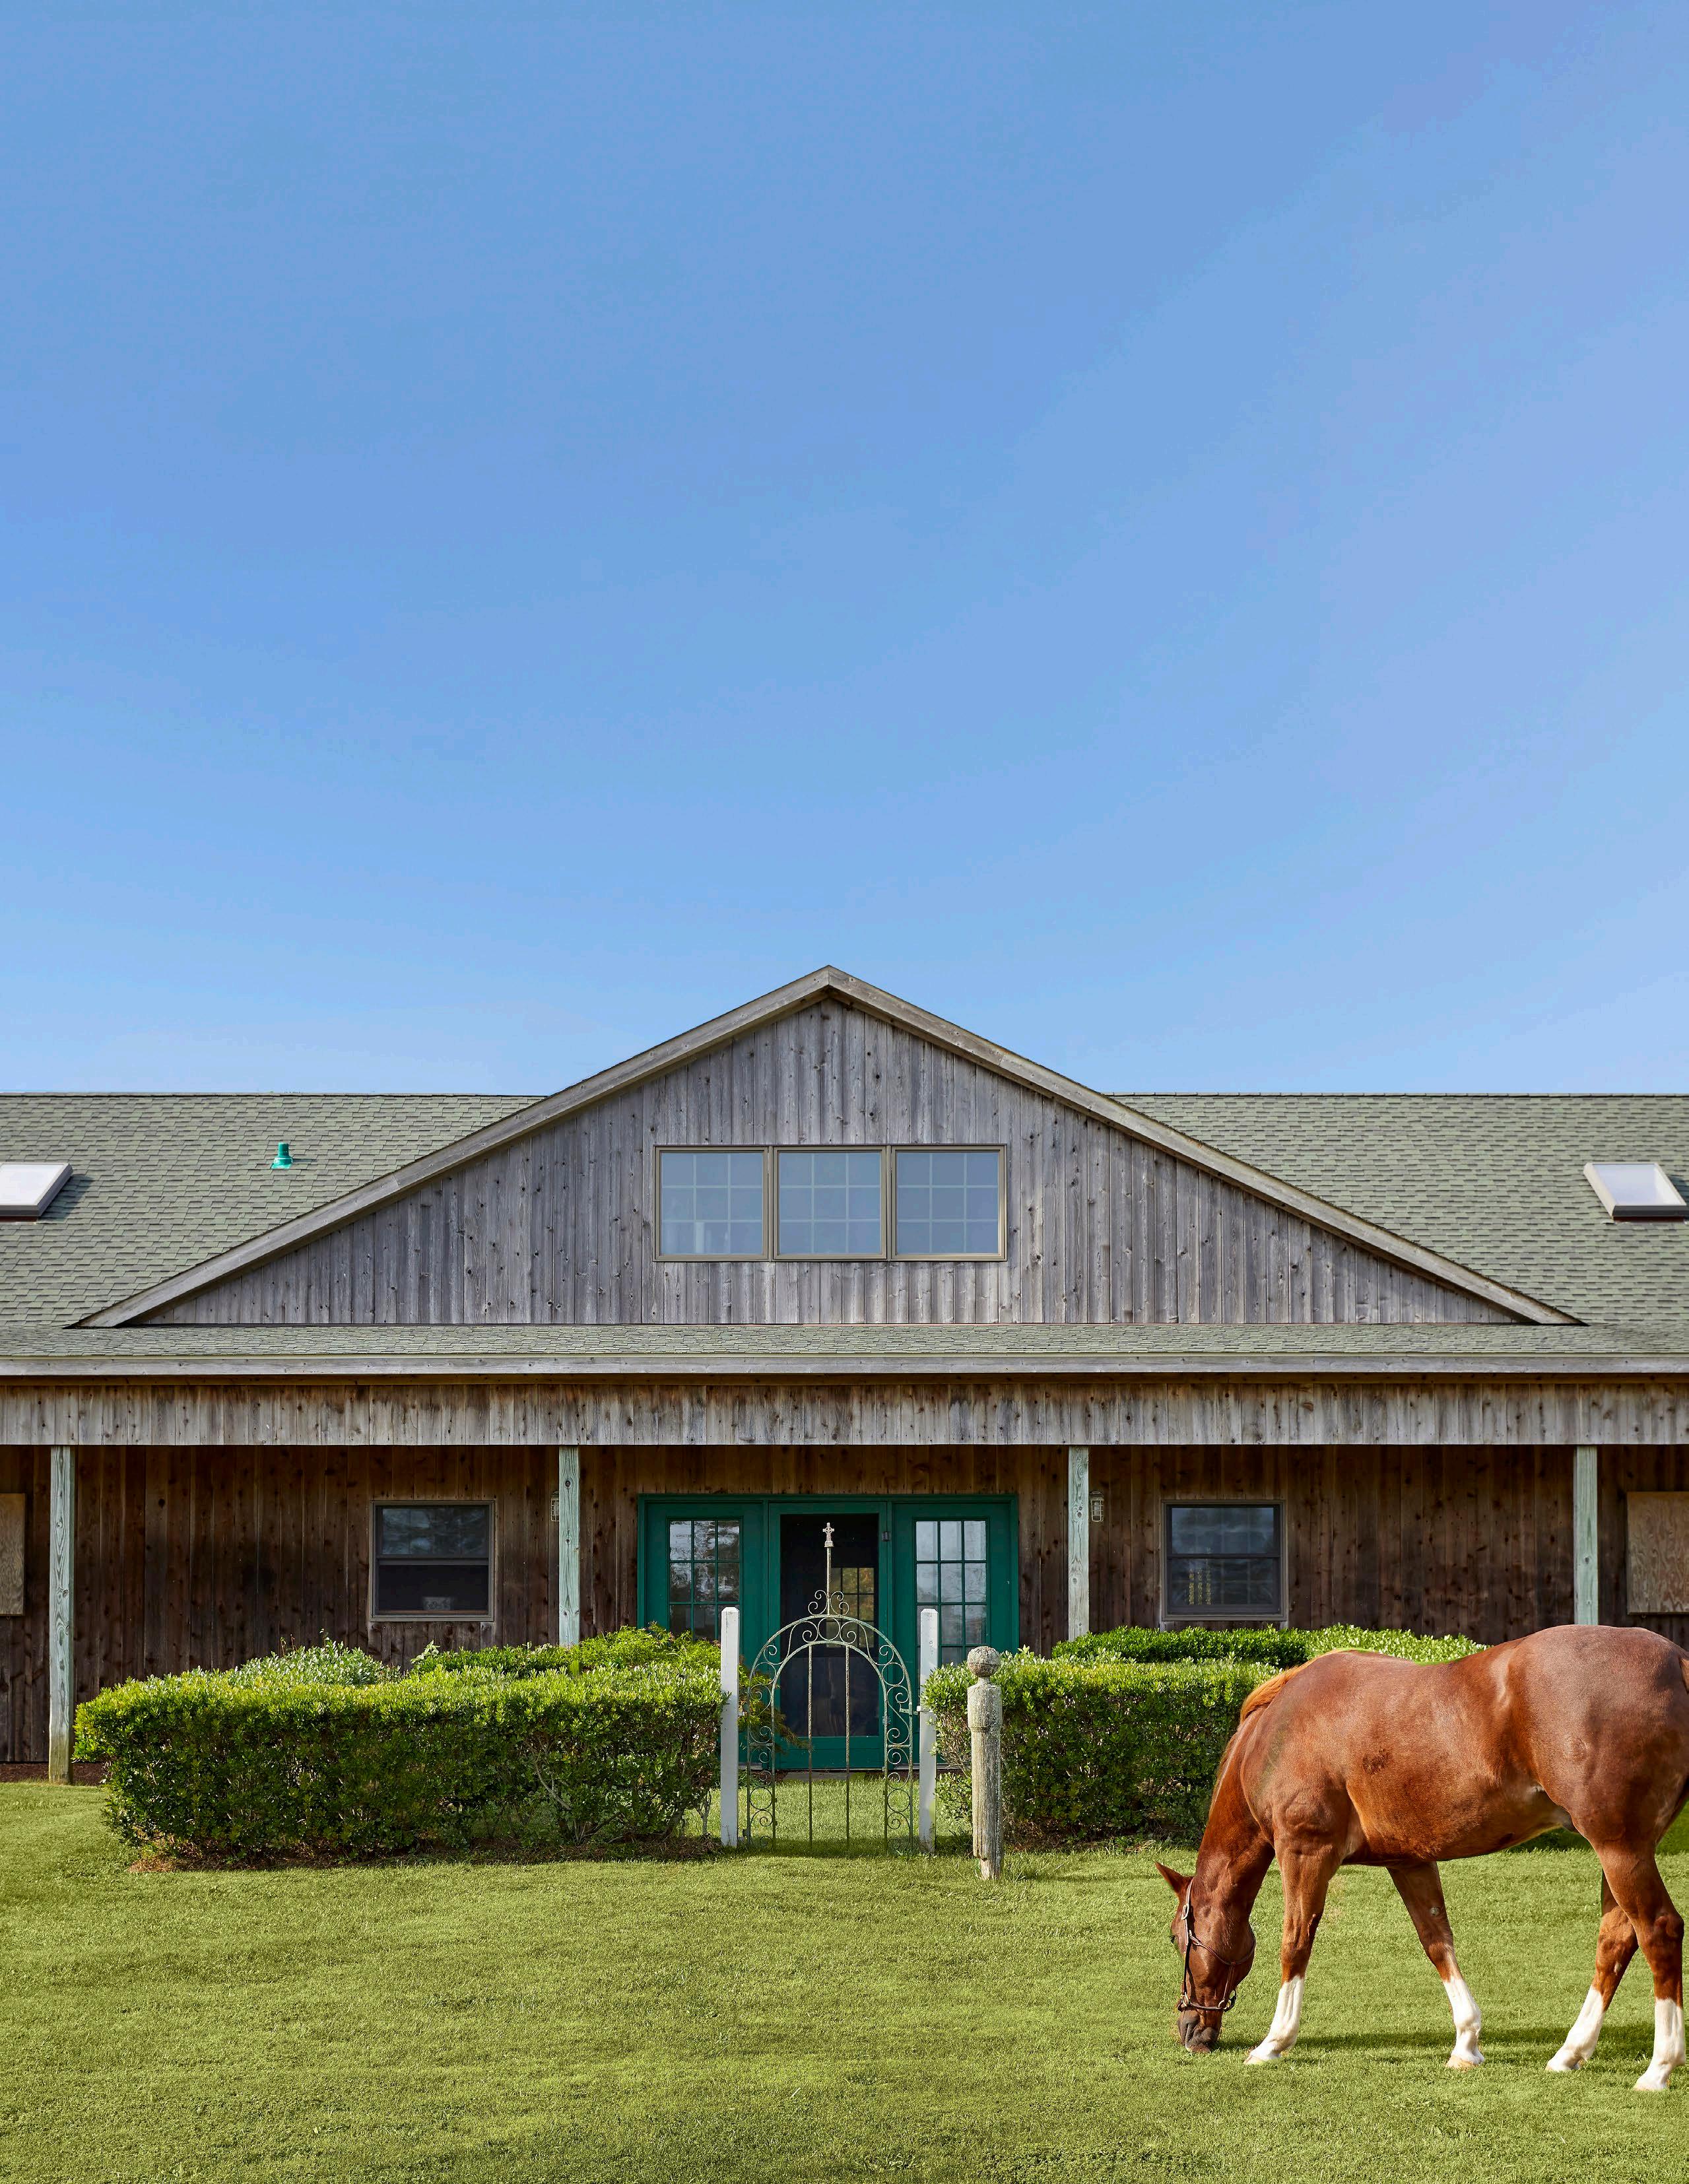
Kilmore Farm, Wainscott, NY
Equestrian Compound with Development Capabilities
18.55 Acres+/- | 2,270 SF+/- | 3 Beds | 2F/1H Baths
Bespoke Exclusive: $15.95M
8 | LUXURY MARKET INSIGHT
EXECUTIVE SUMMARY
As thought leaders in ultra-luxury real estate, we are proud to present our very first National Market Report, the only report exclusively dedicated to the $10 million+ residential real estate market.
Over the last two and a half years, there have been profound, historic changes that have shifted markets across the nation. At each junction point, we at Bespoke have reported how these diverse changes have impacted our local markets of the Hamptons, New York City, and South Florida. However this year, as we delved into our analysis of 2022’s first quarter performance, we saw a grander picture reflected in the whole country, and felt compelled to fill the gap as the first report dedicated to exclusively covering the U.S.’s $10 million+ residential real estate market.
At a macro level, the massive increase in the first quarter of 2022 compared to 2021 can be understood as a serendipitous symbiosis of two crucial factors: high inflation and low interest rates. Backtracking to 2020, the economy did technically experience a brief recession with high unemployment, but it lasted only two months—the shortest in U.S. history. Even as the country came out of it, the recession’s impact was just long enough to bring interest rates to the floor by early 2021. Low interest rates, among other factors, led to much of last year’s $10 million+ real estate success, particularly towards the year’s end.
It is in this climate that we entered 2022, which incentivized both camps of $10 million+ homeowners: those trading in debt and those trading in cash. For the debt buyer, low interest rates saved them millions of dollars on $10 million+ properties (while interest rates started to creep up for the average consumer in Q1, UHNWIs’ transactional histories tend to enable them to secure discretionary rates). On top of that, increasing inflation means that the value of a fixed-price loan made in Q1 2022 will shrink as the dollar decreases in value over time, while the value of the actual
home rises. For the cash buyer, inflation means their cash is losing value over time, and there are few better inflation hedges than a real estate investment.
The micro markets paint the details of this story. Across all states that had $10 million+ sales, there was a 41 percent increase in the number of homes sold compared to Q1 2021, from 346 to 488. Washington state had a 150 percent increase in trades, New York state had 105 percent, and Colorado had 57 percent. Looking at our alpha real estate markets, Hamptons trade volume doubled, from $242 million to $483 million. New York City went from 34 trades in Q1 2021 to 79 in Q1 2022 Florida bucked the typical trend of higher later-year performance across national markets, and in Q1 2022, surpassed quantity and volume of both Q1 and Q4 2021, with 144 trades, or $2.4 billion in sales in a single quarter.
In addition to the macro-economic trends the market’s facing, there’s an added, though much simpler, explanation for continued demand in the market: lack of supply. While there are increases in sales, there is not a proportional increase in new inventory. Take South Florida: in Q1 of 2021, turn-key sales made up about 64 percent of all trades, while new construction constituted about 24 percent; in Q1 2022, the proportions were about the same. In other words, the increase in trades is not because so many more ultra-luxury homes were being built that much faster. Rather, the demand for them was so high that homeowners found last year, and as it turns out, early 2022, the perfect time to sell.
Join us as we delve into the state of the national real estate market last quarter.
HOPE YOU ENJOY.
Cody Vichinsky President, Bespoke Companies
Q1 2022 $10M + NATIONAL MARKET REPORT
| 9
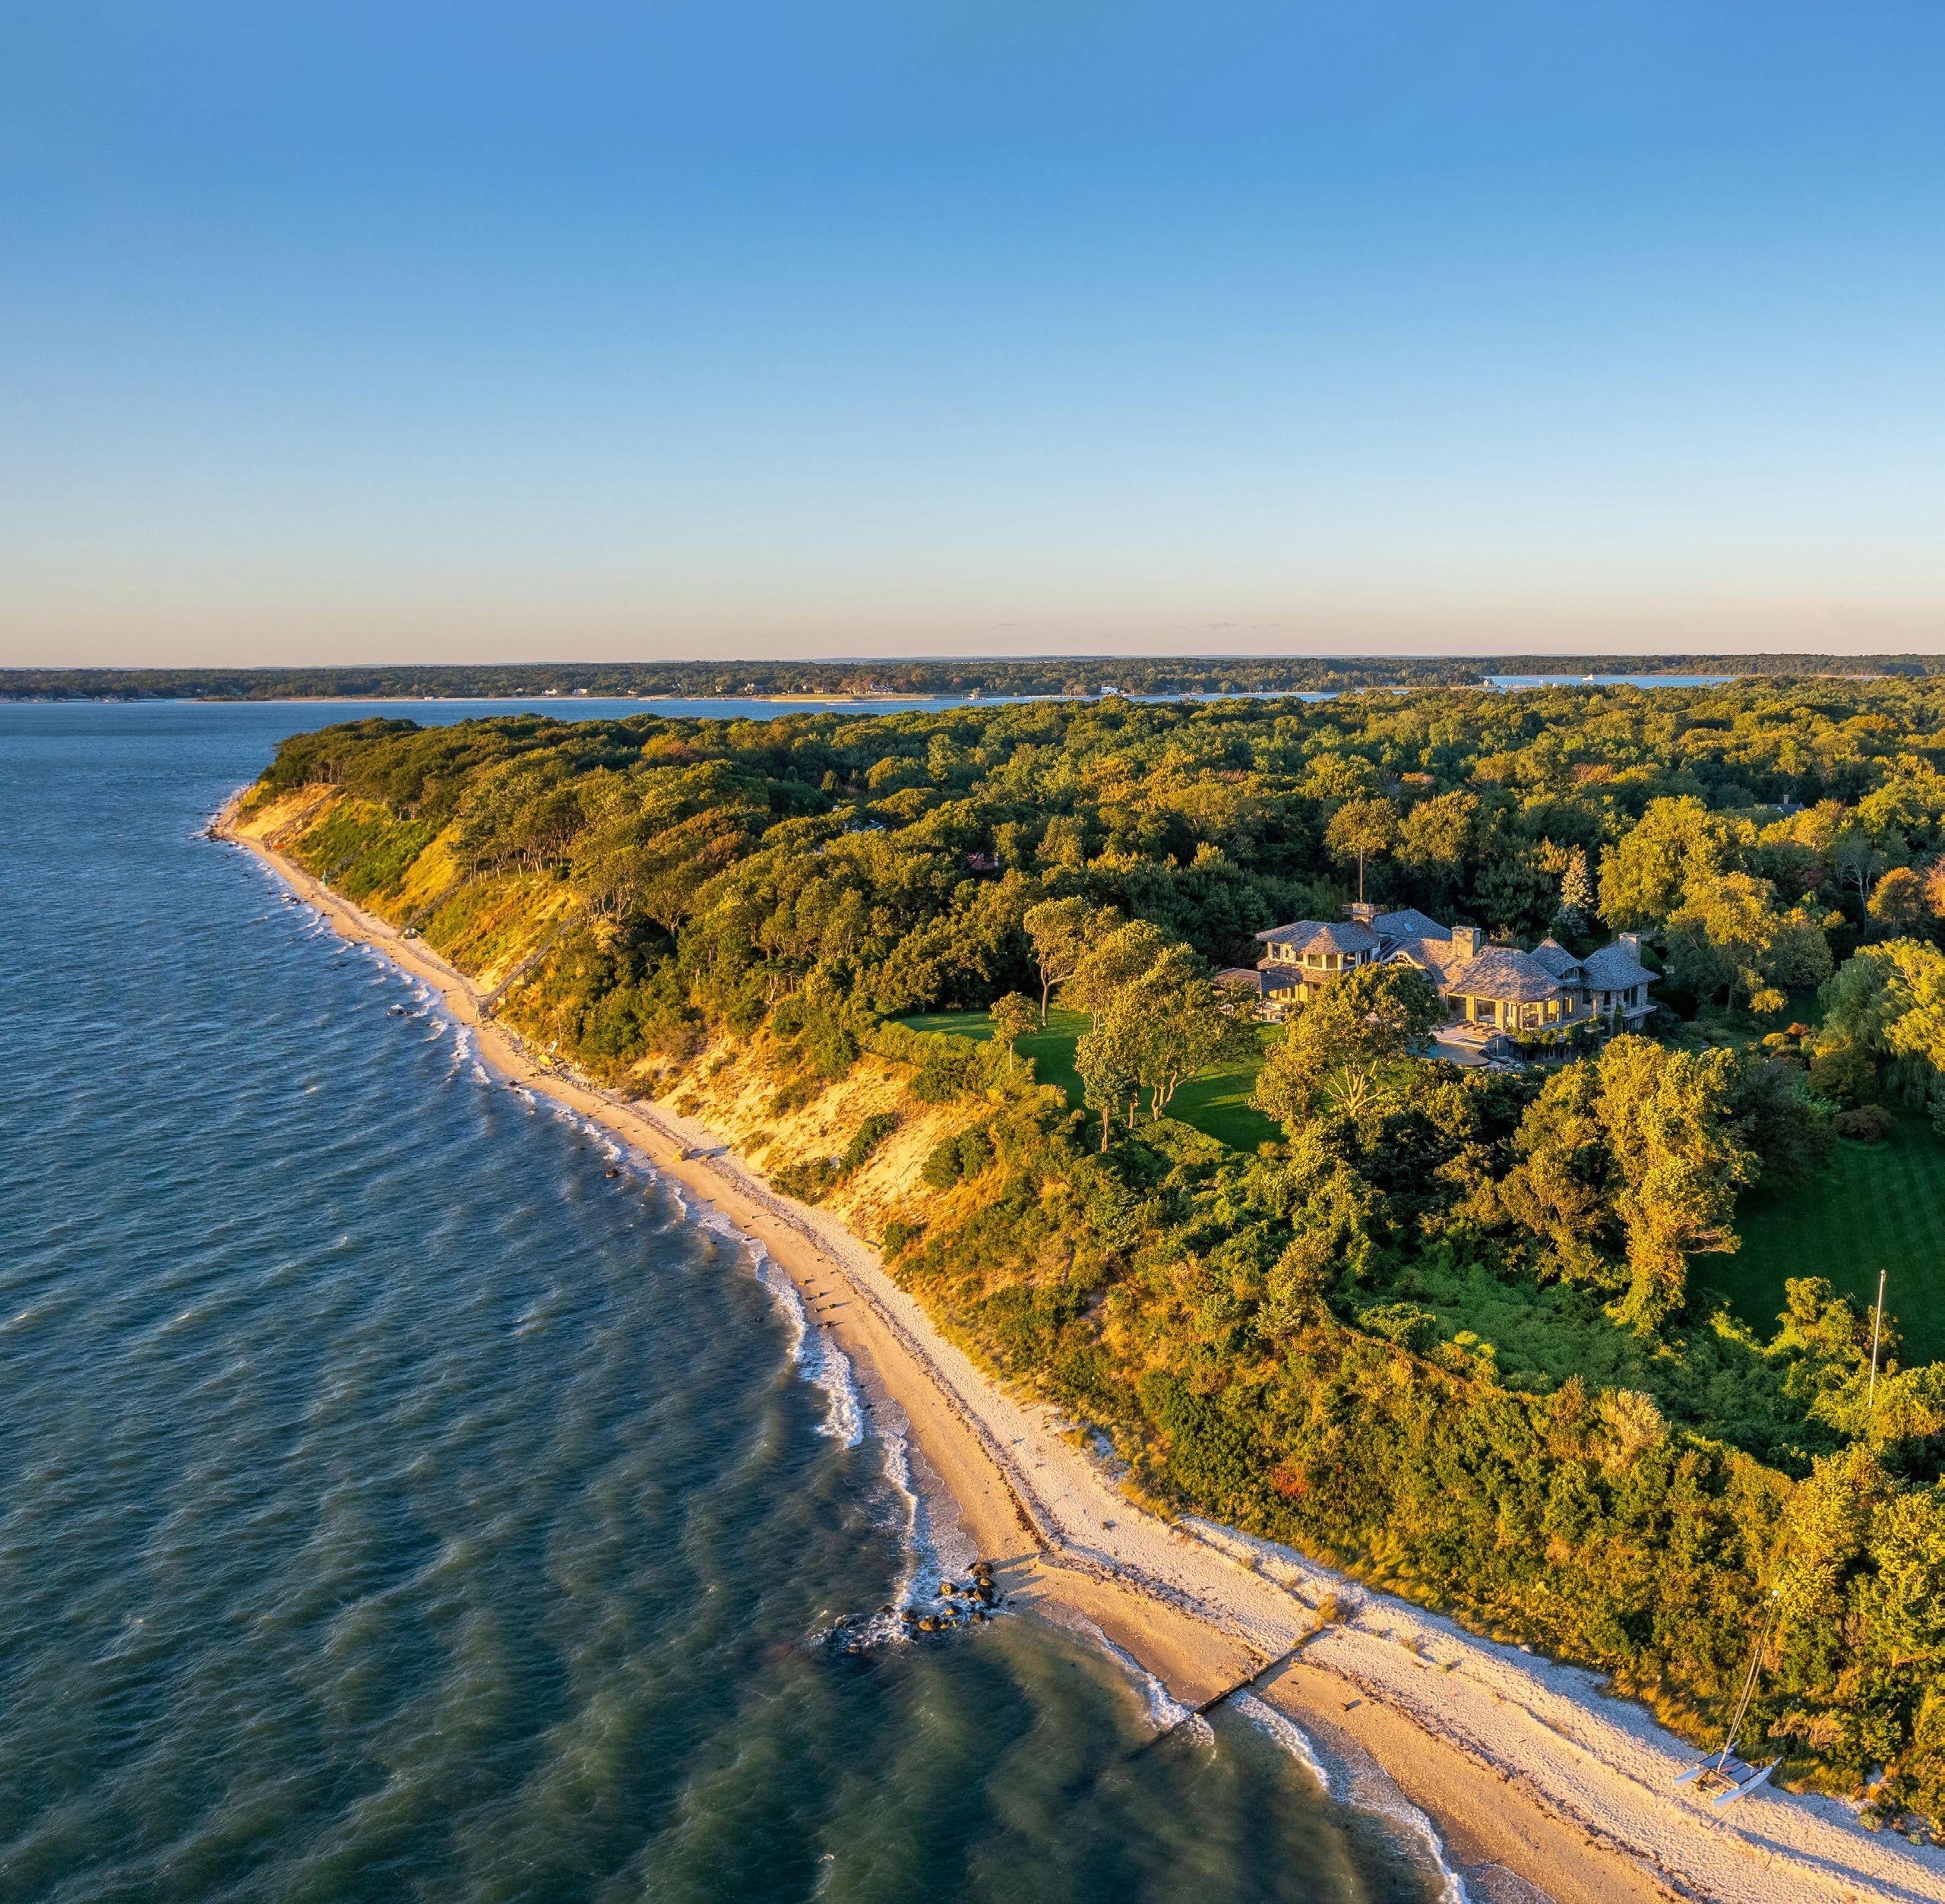
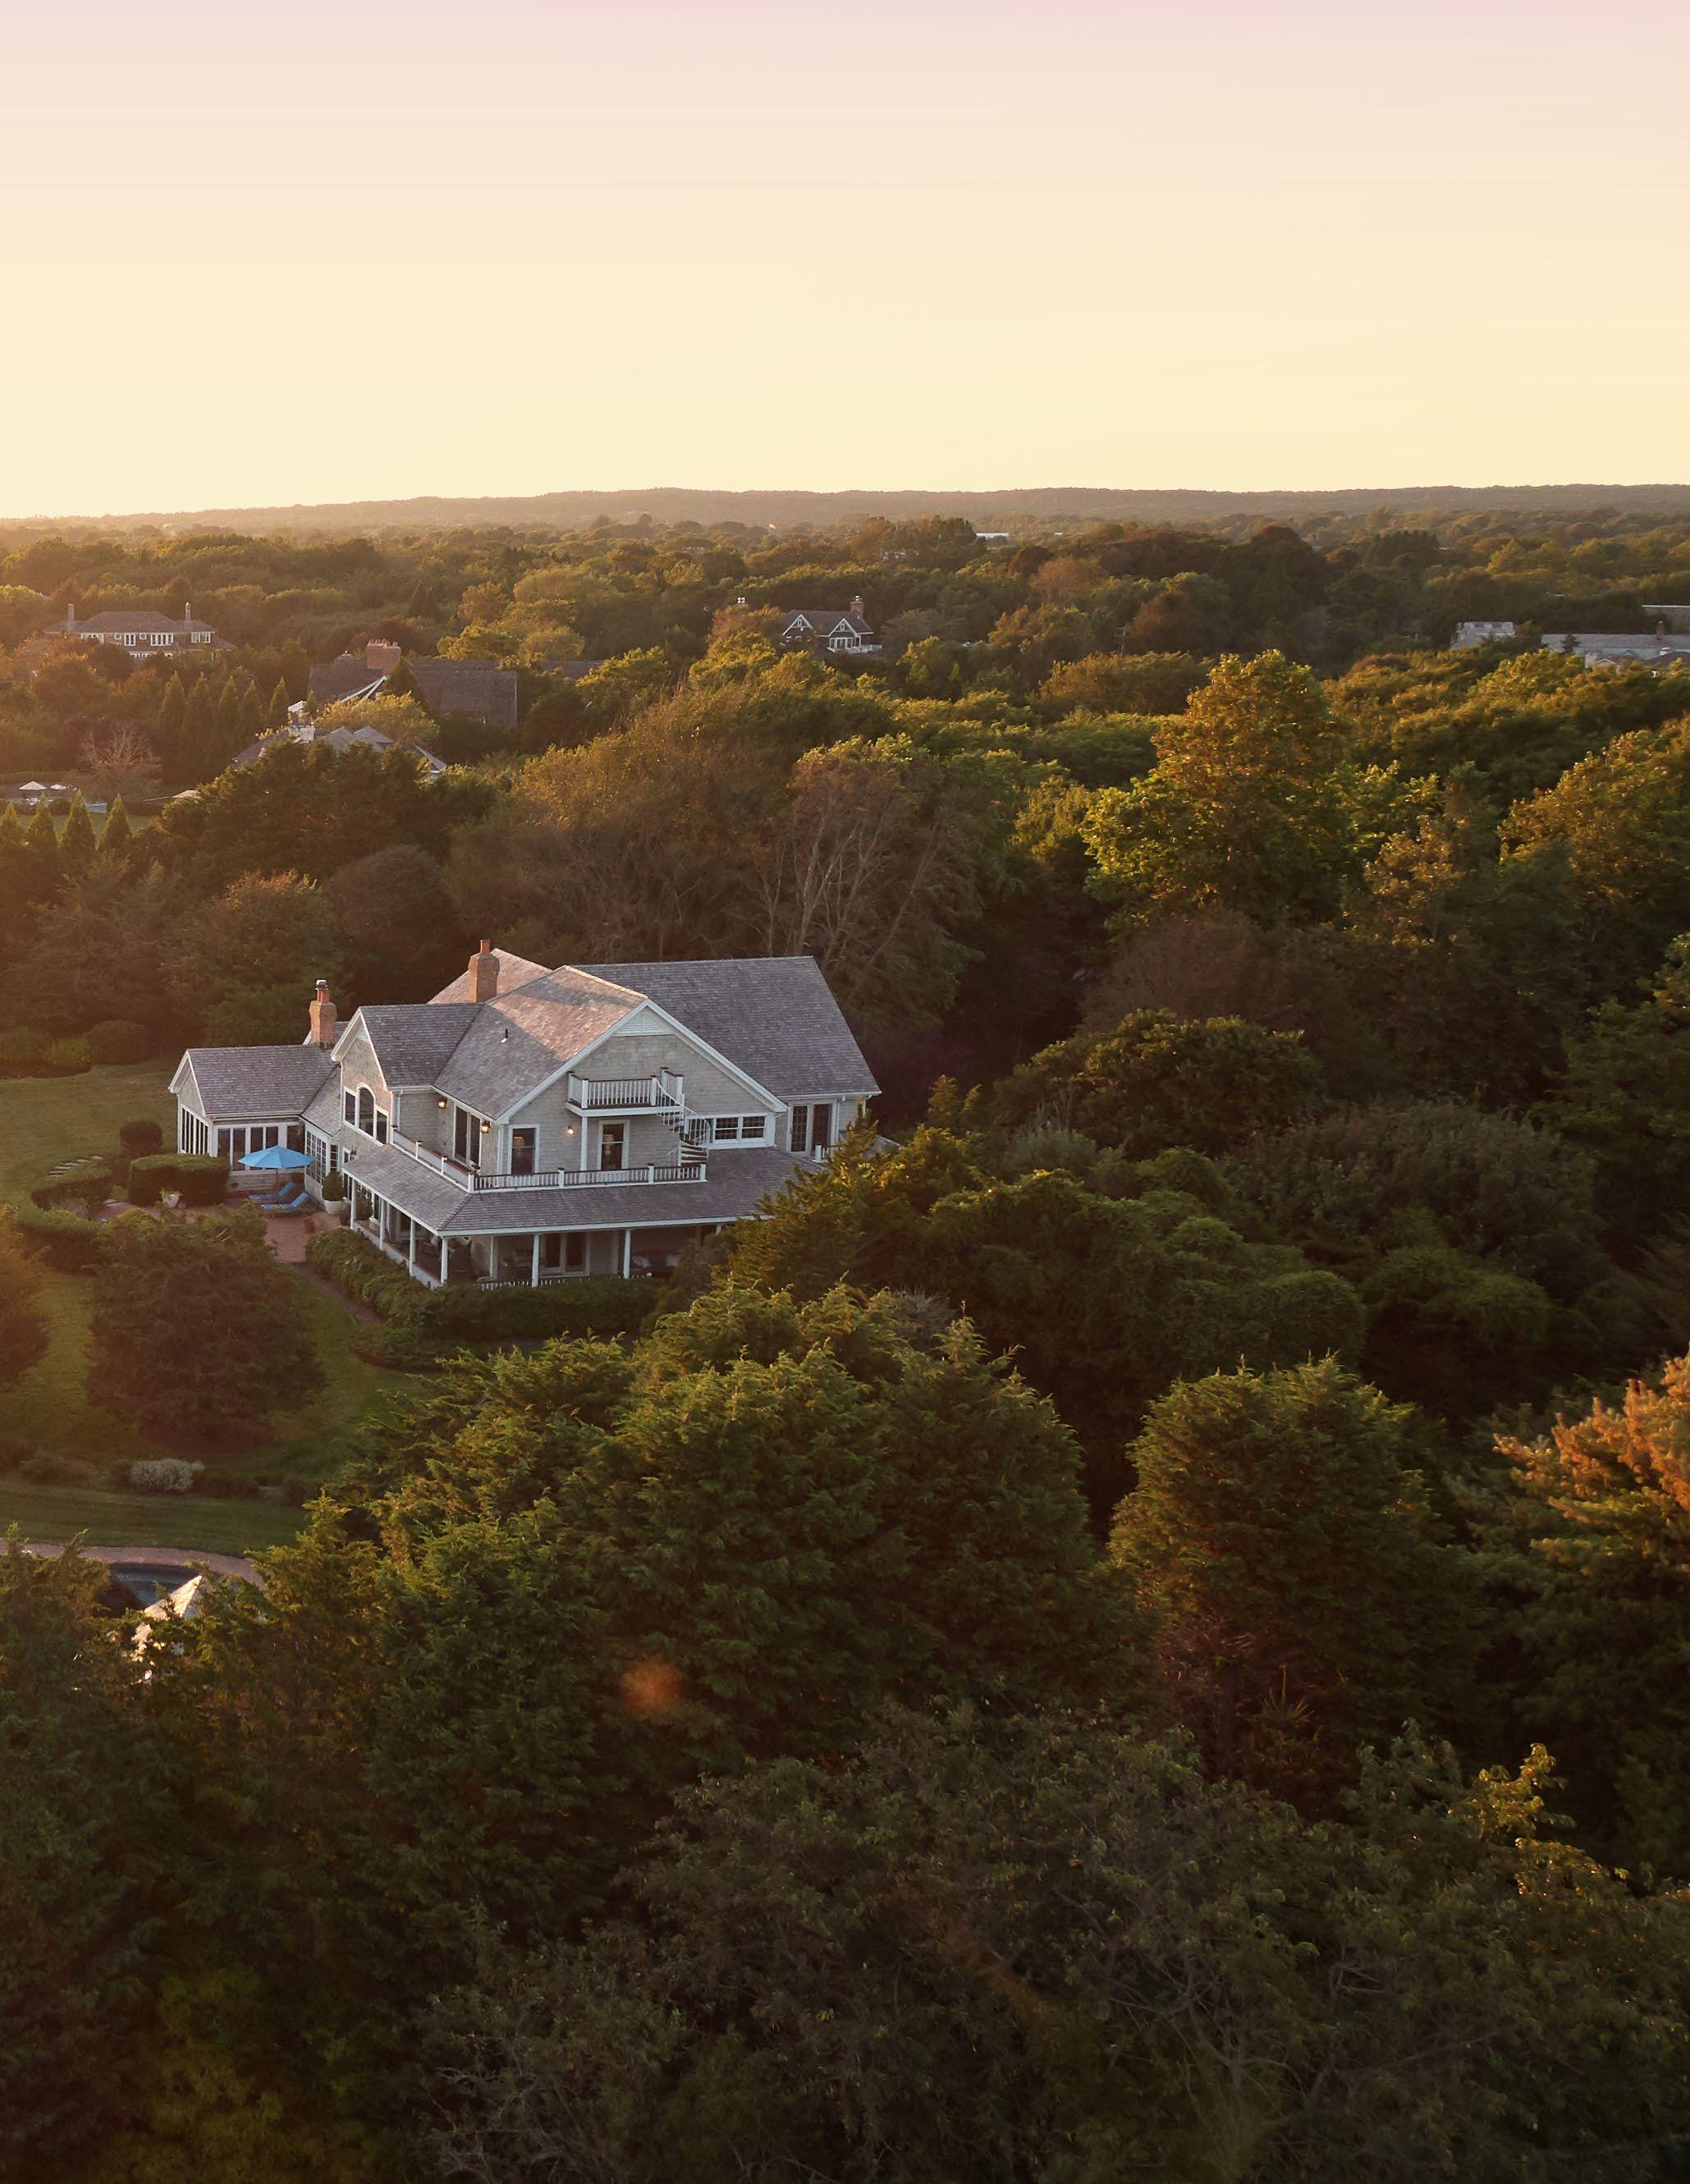
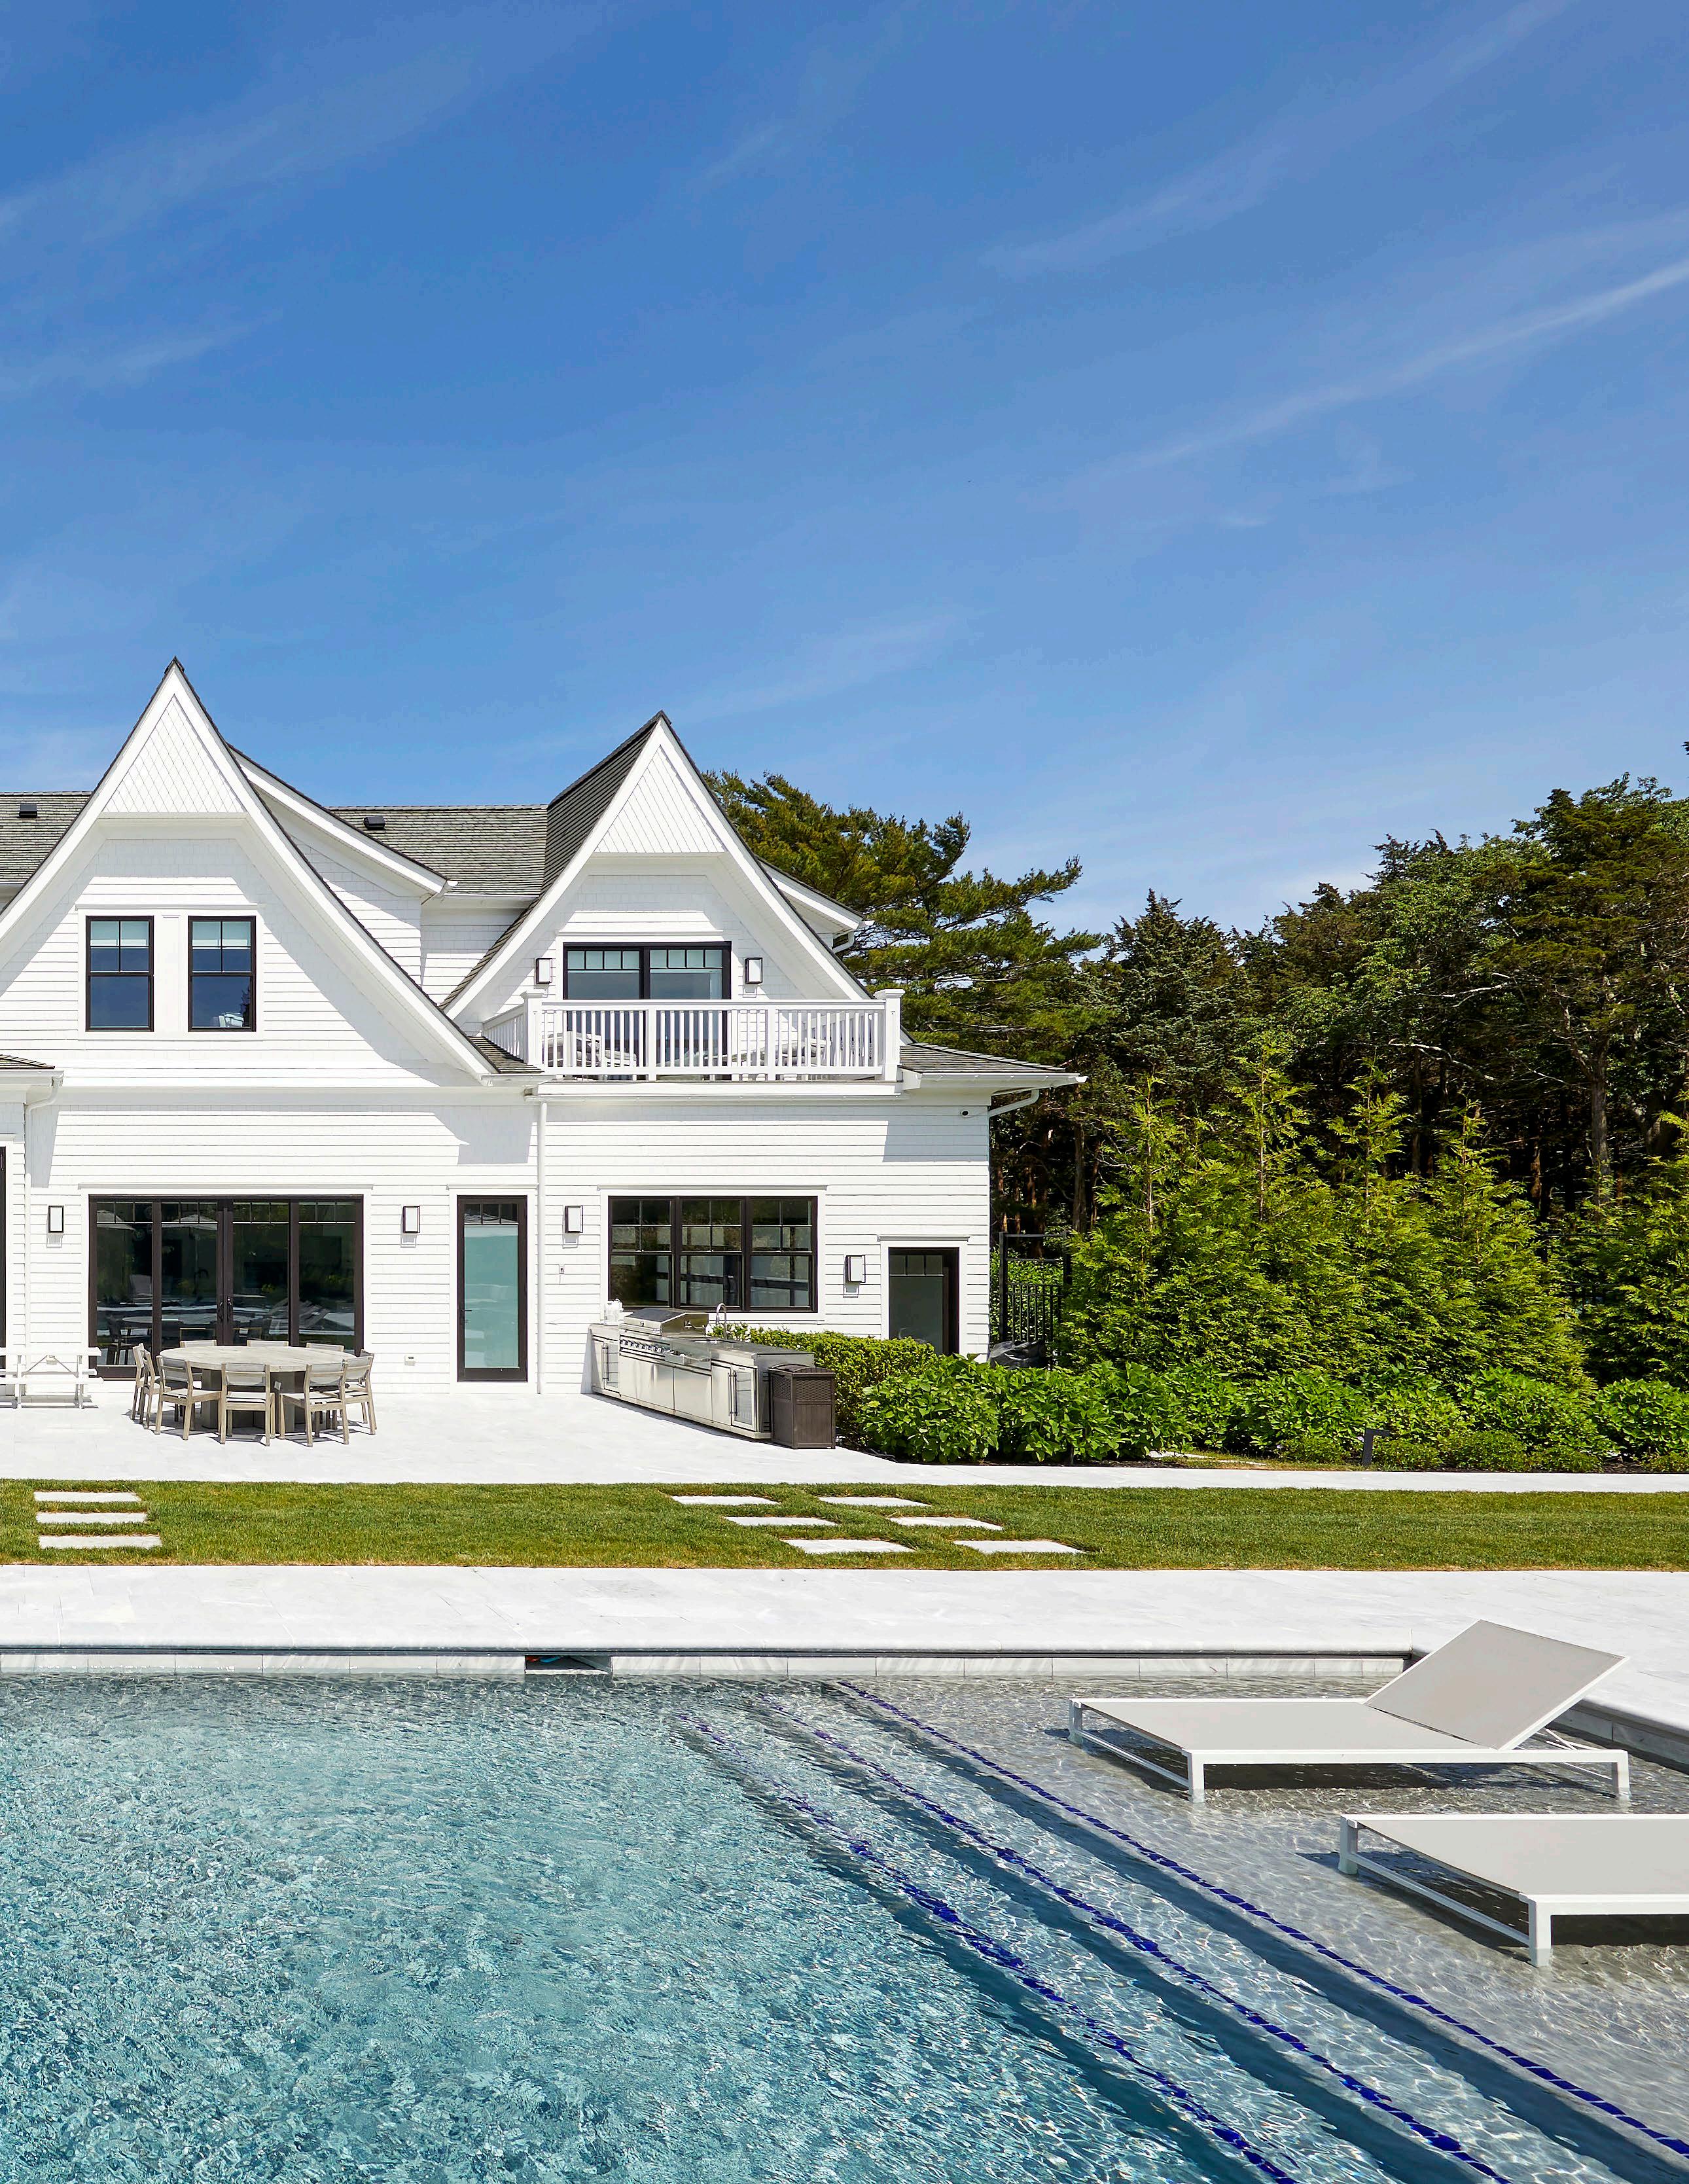
THE HAMPTONS $10M+ MARKET
10 | LUXURY MARKET INSIGHT
Historic, Double Waterfront Estate 8 Acres +/- | 15,521 SF+/- | 11 Beds | 12F/4H Baths Bespoke Exclusive :
BESPOKEREALESTATE.COM | 11
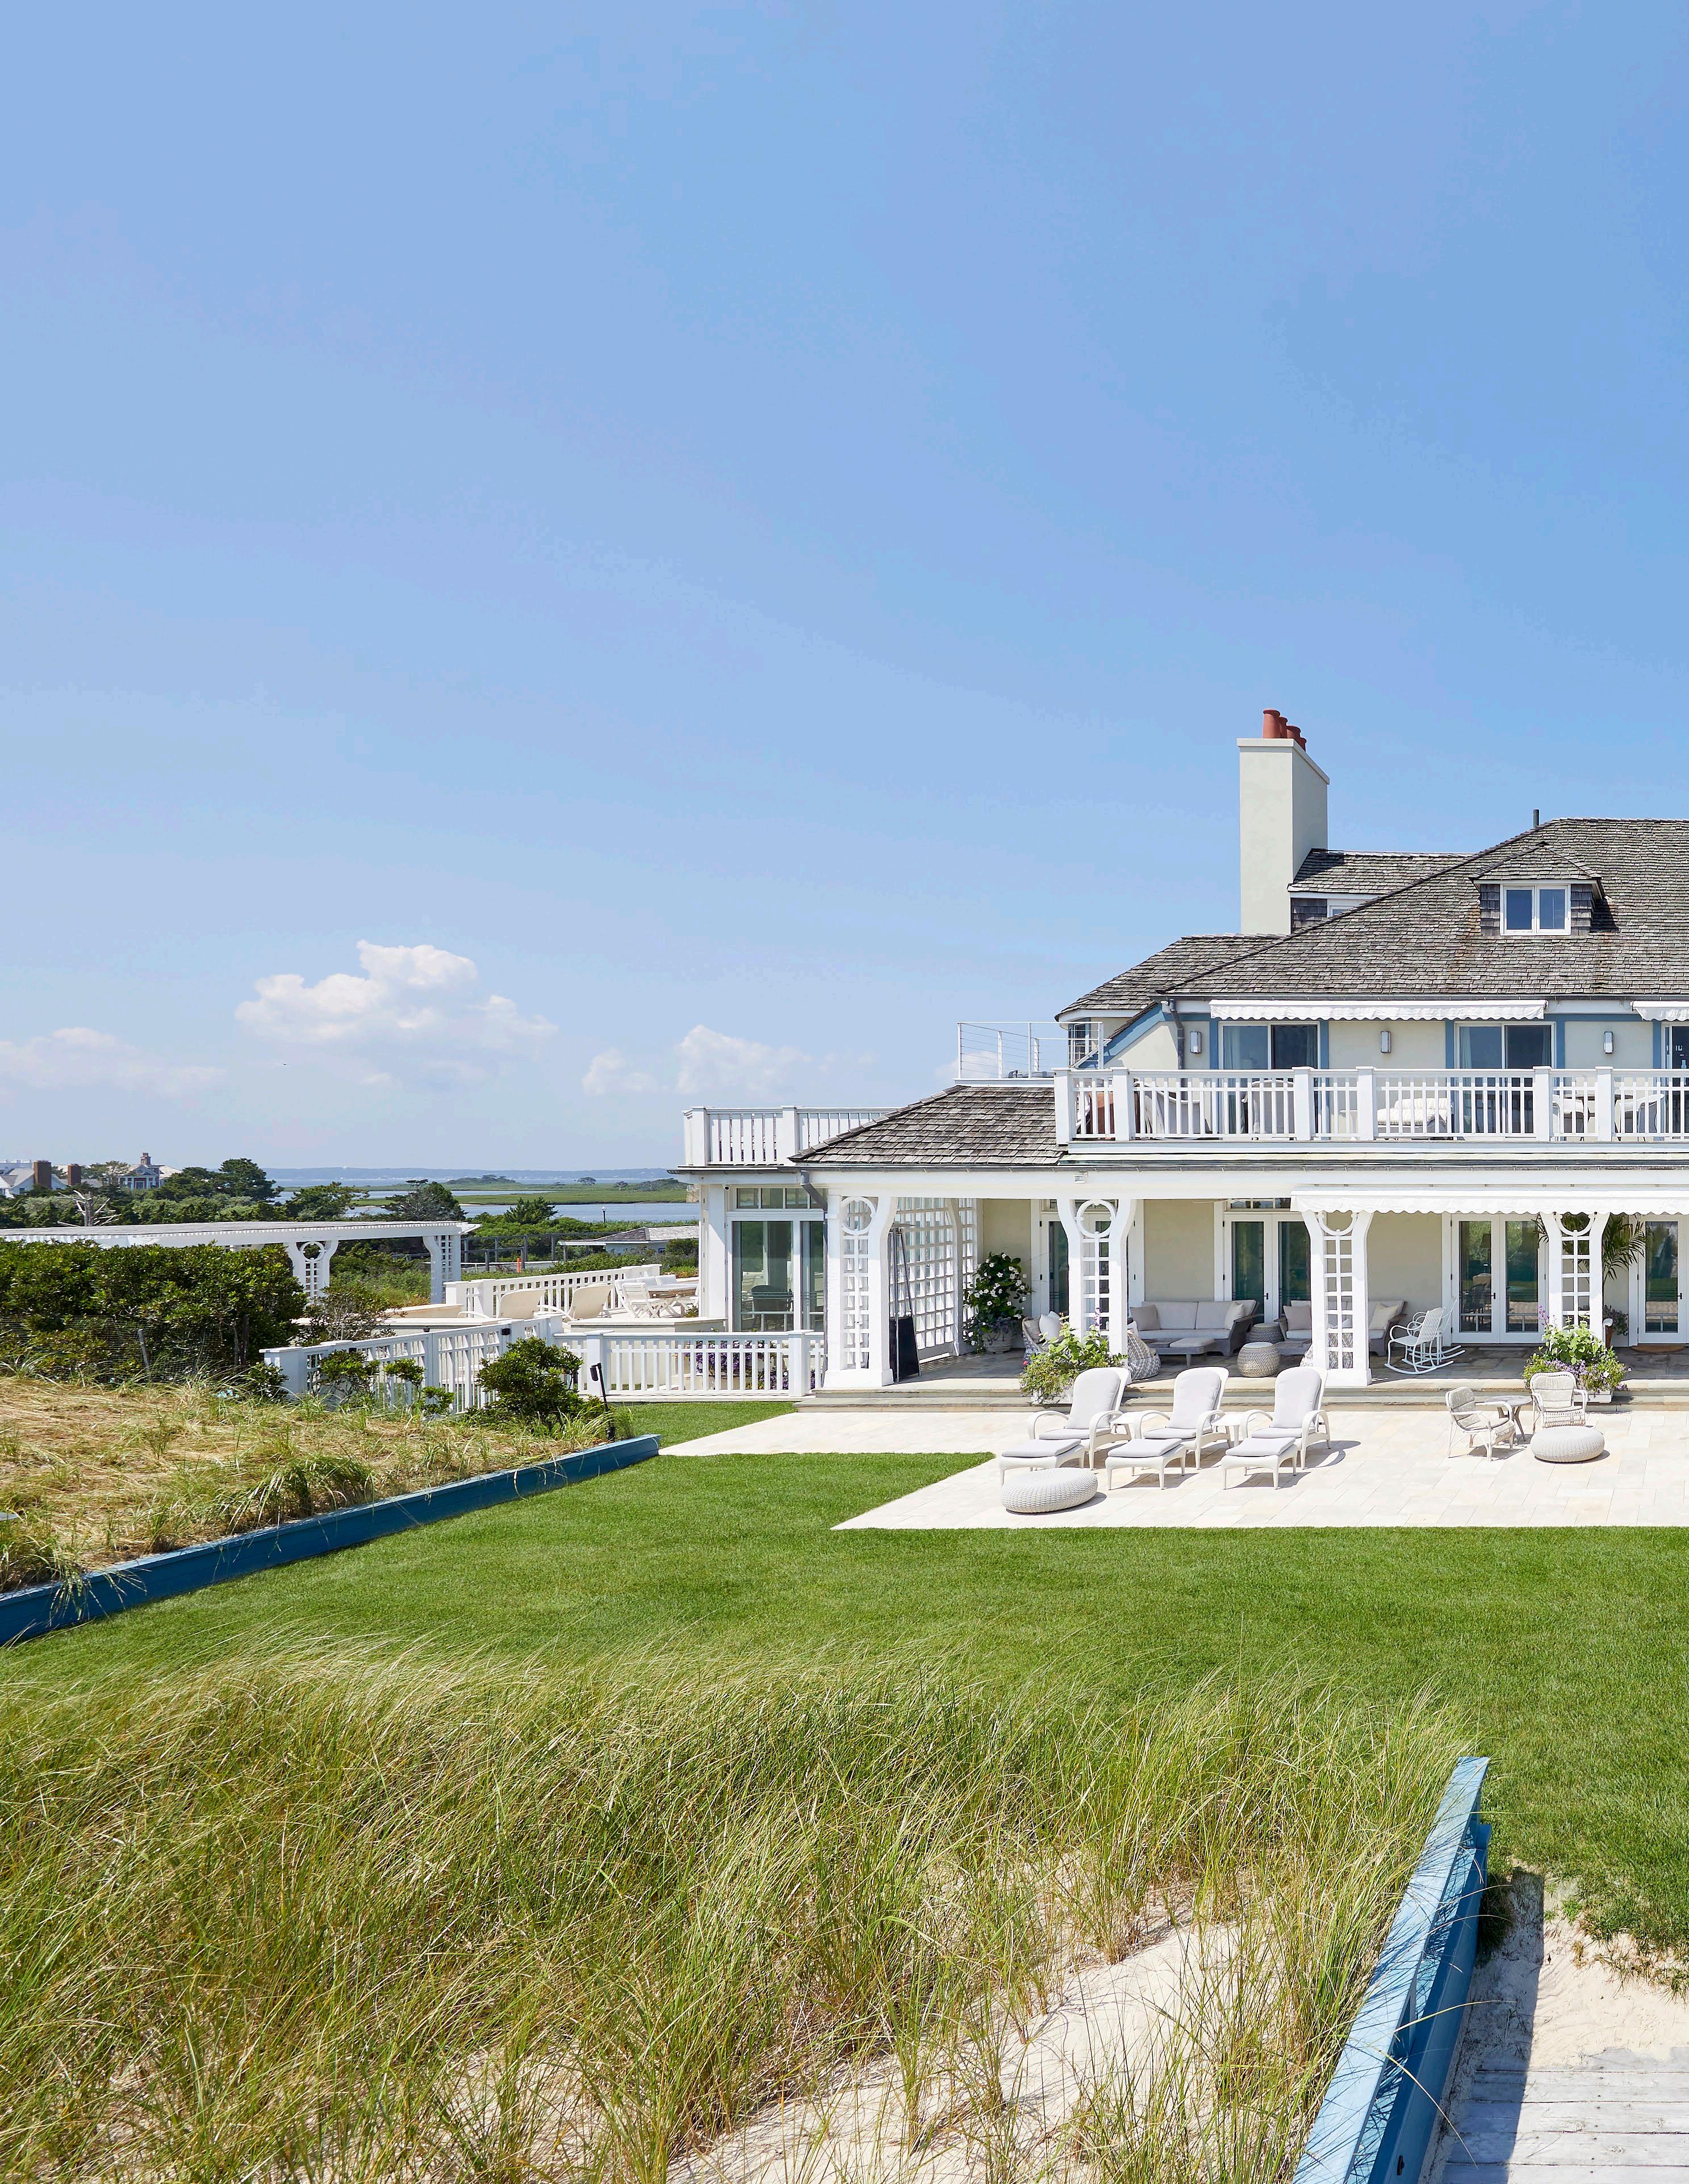
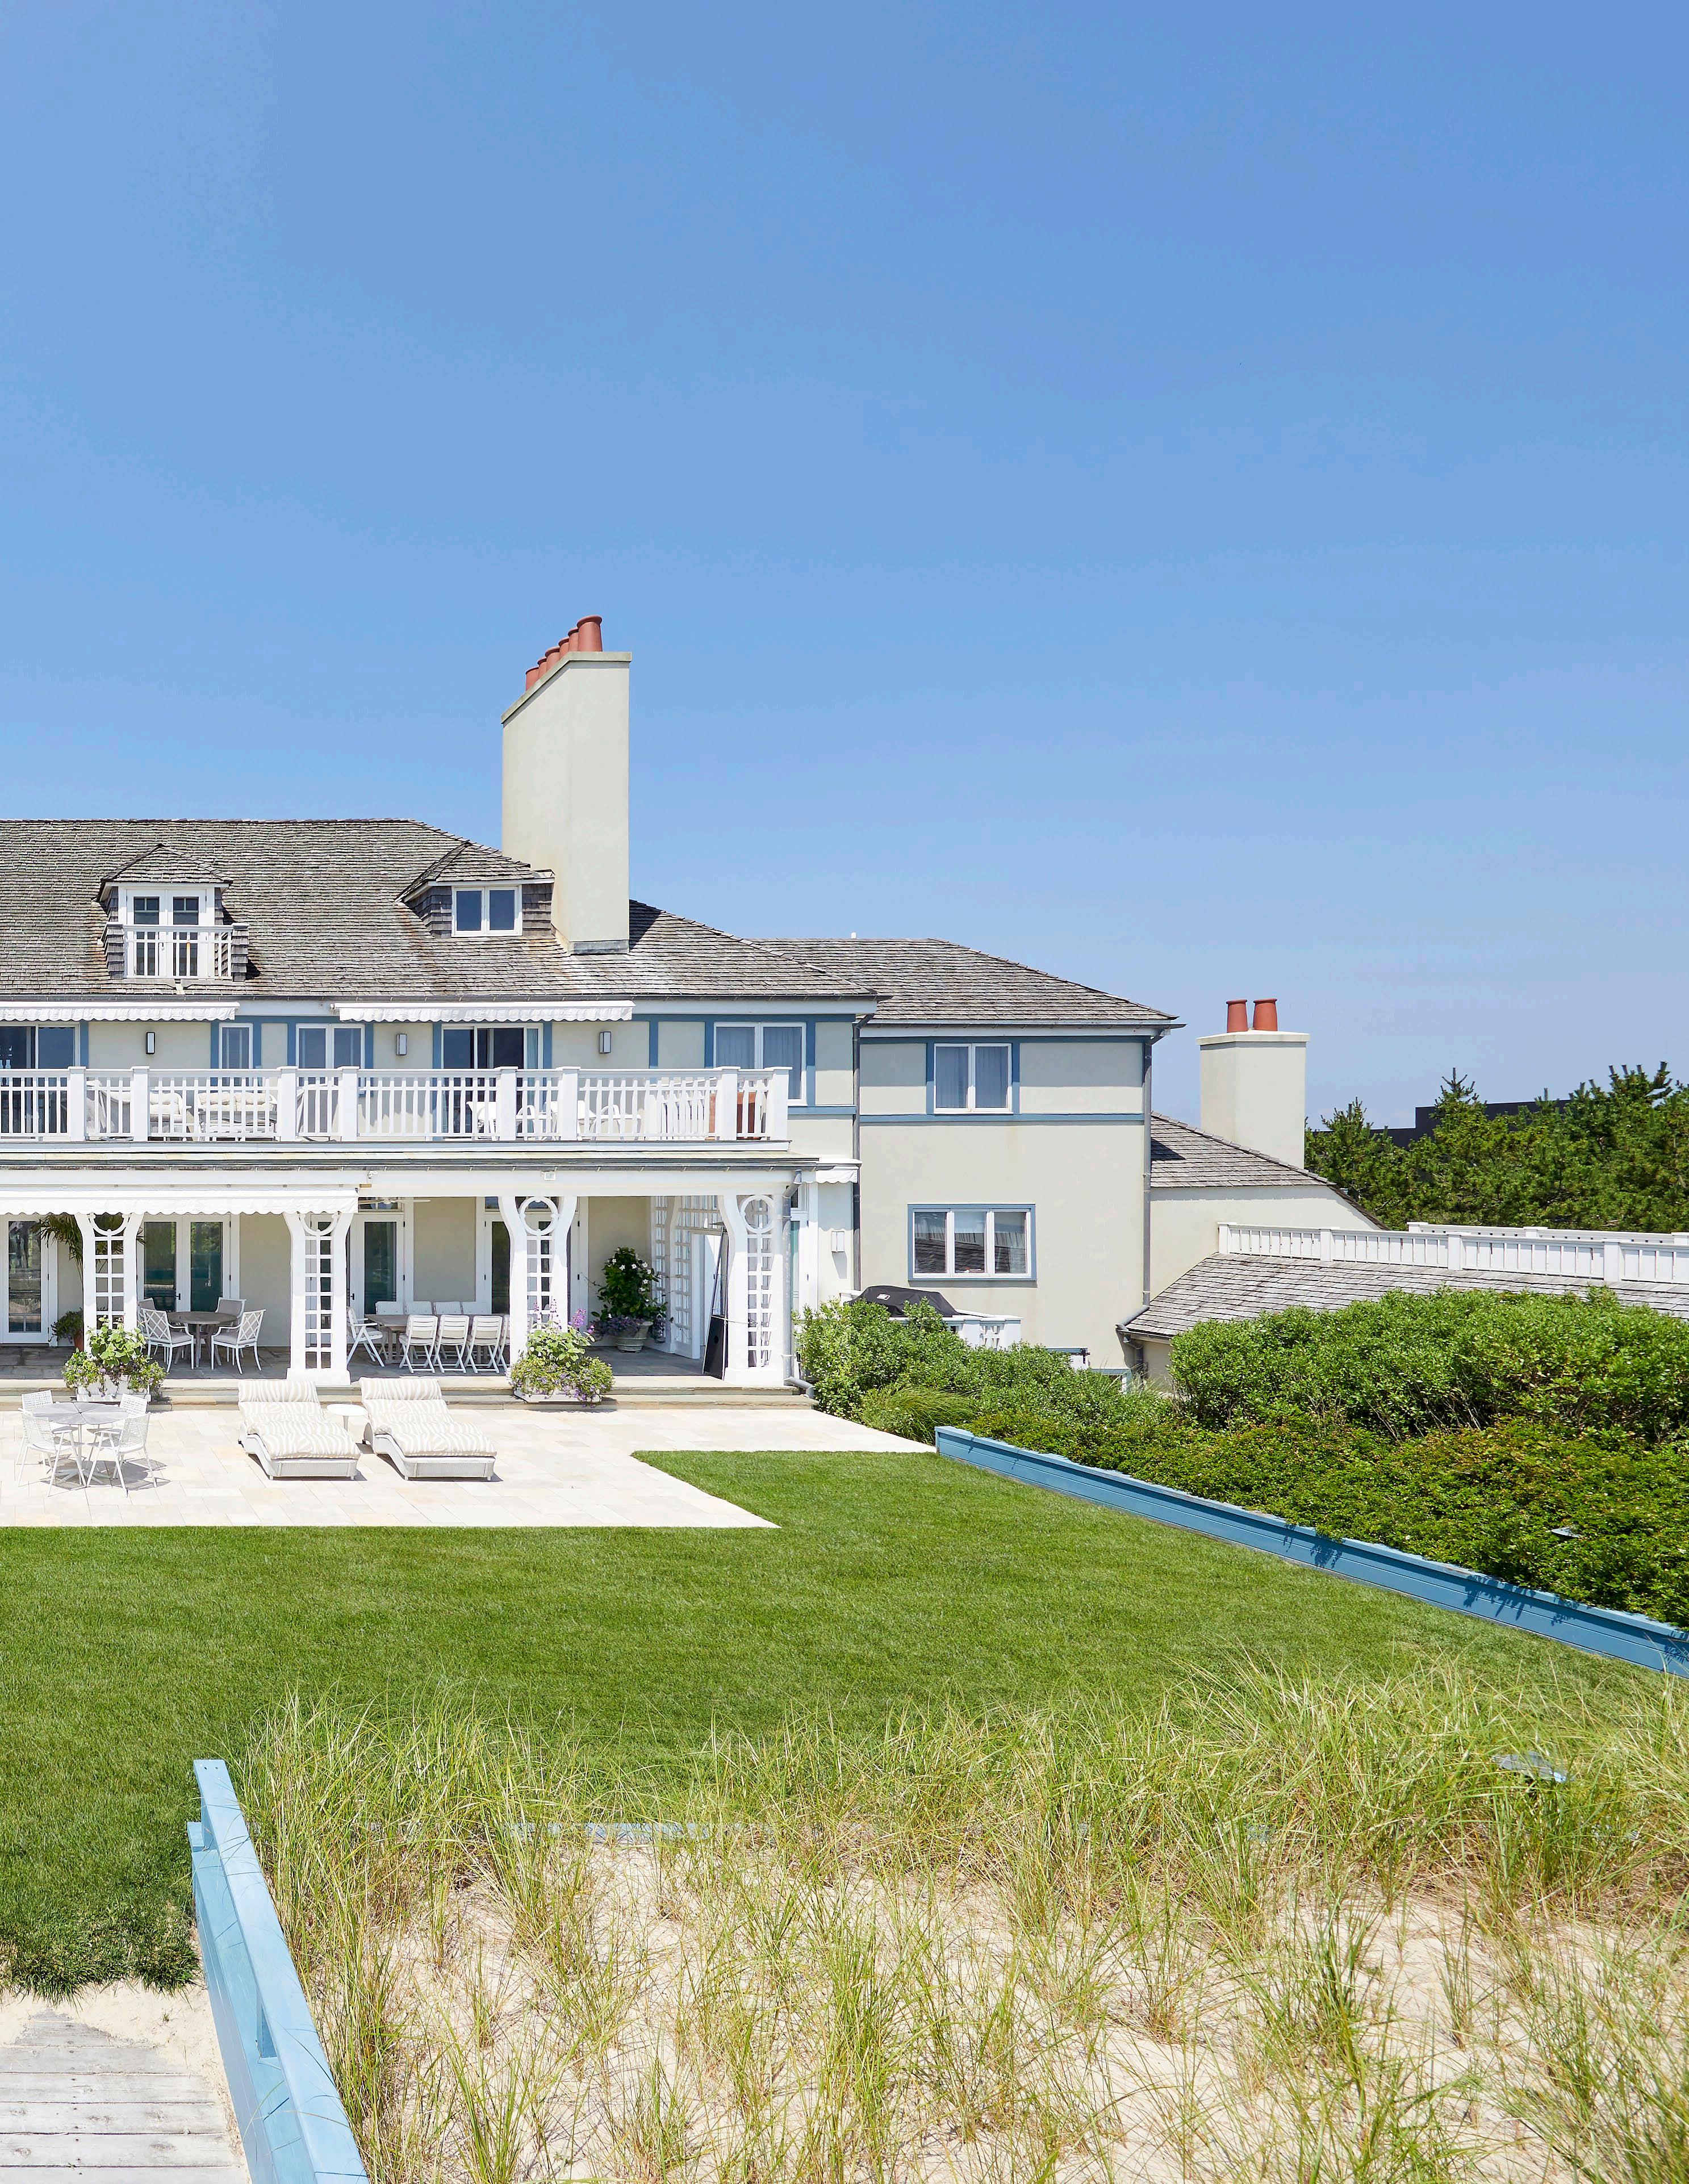
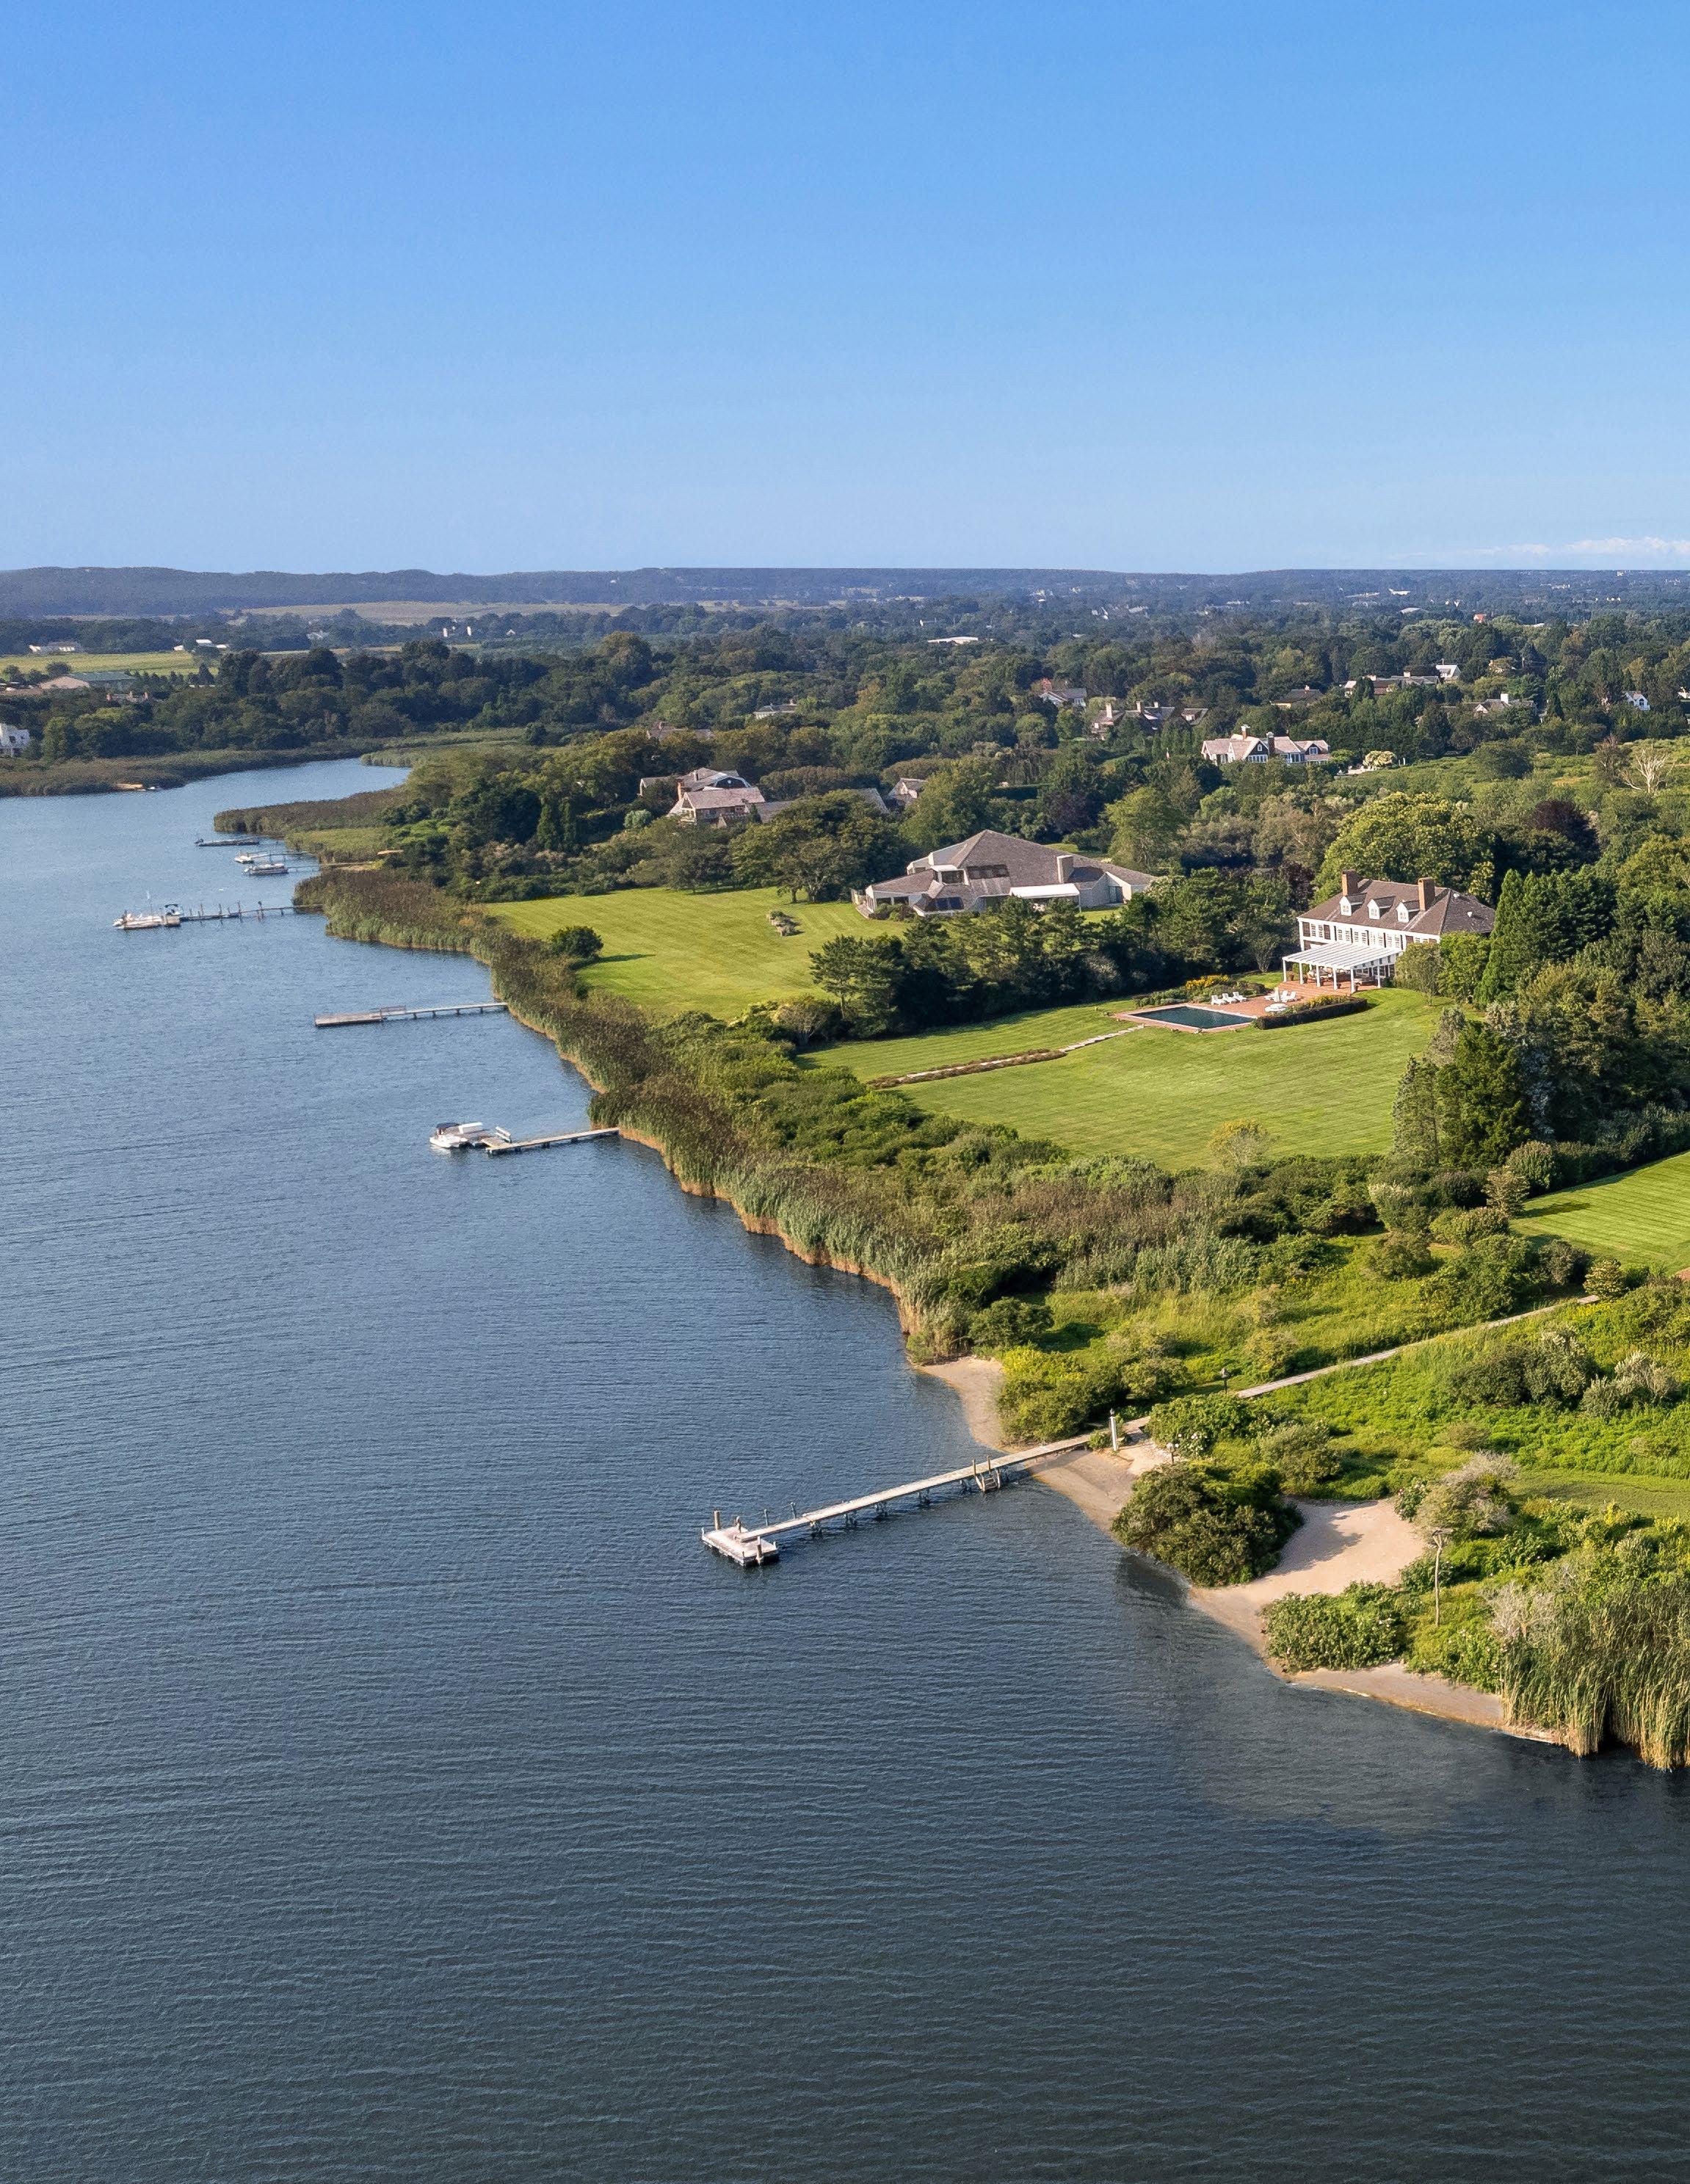
Mylestone at Meadow Lane, Southampton, NY. Unrivaled
$175M
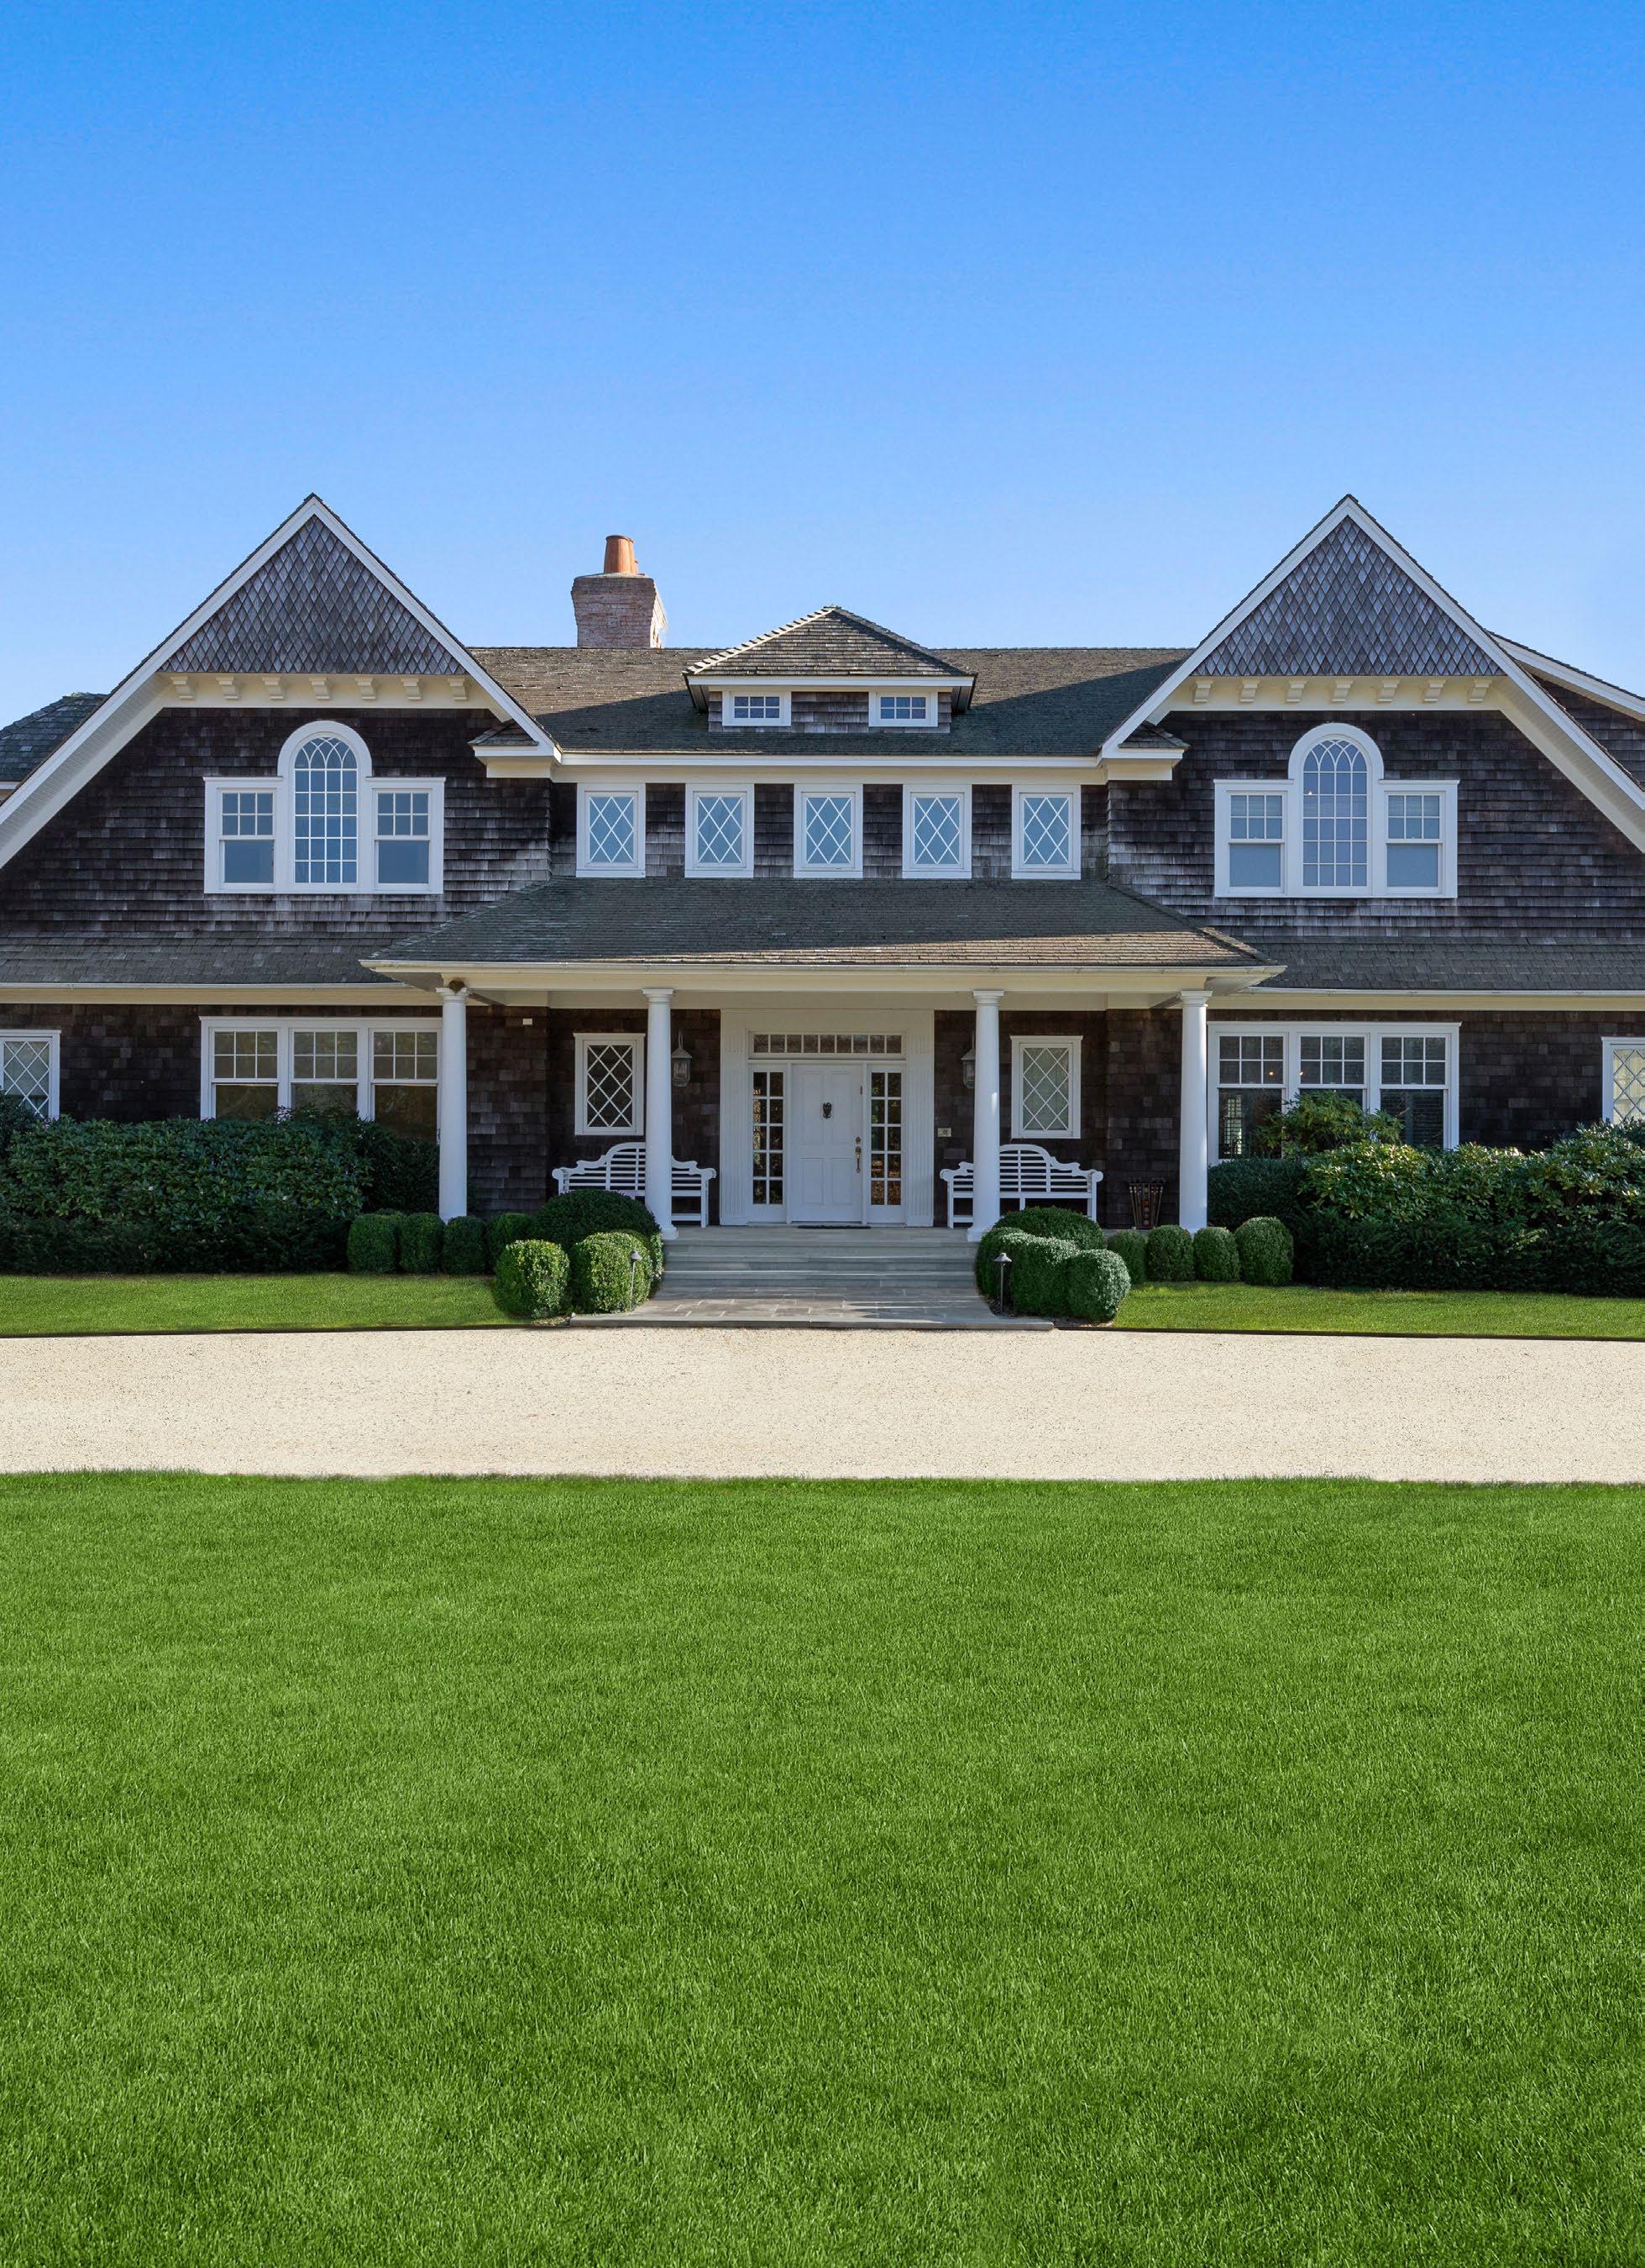
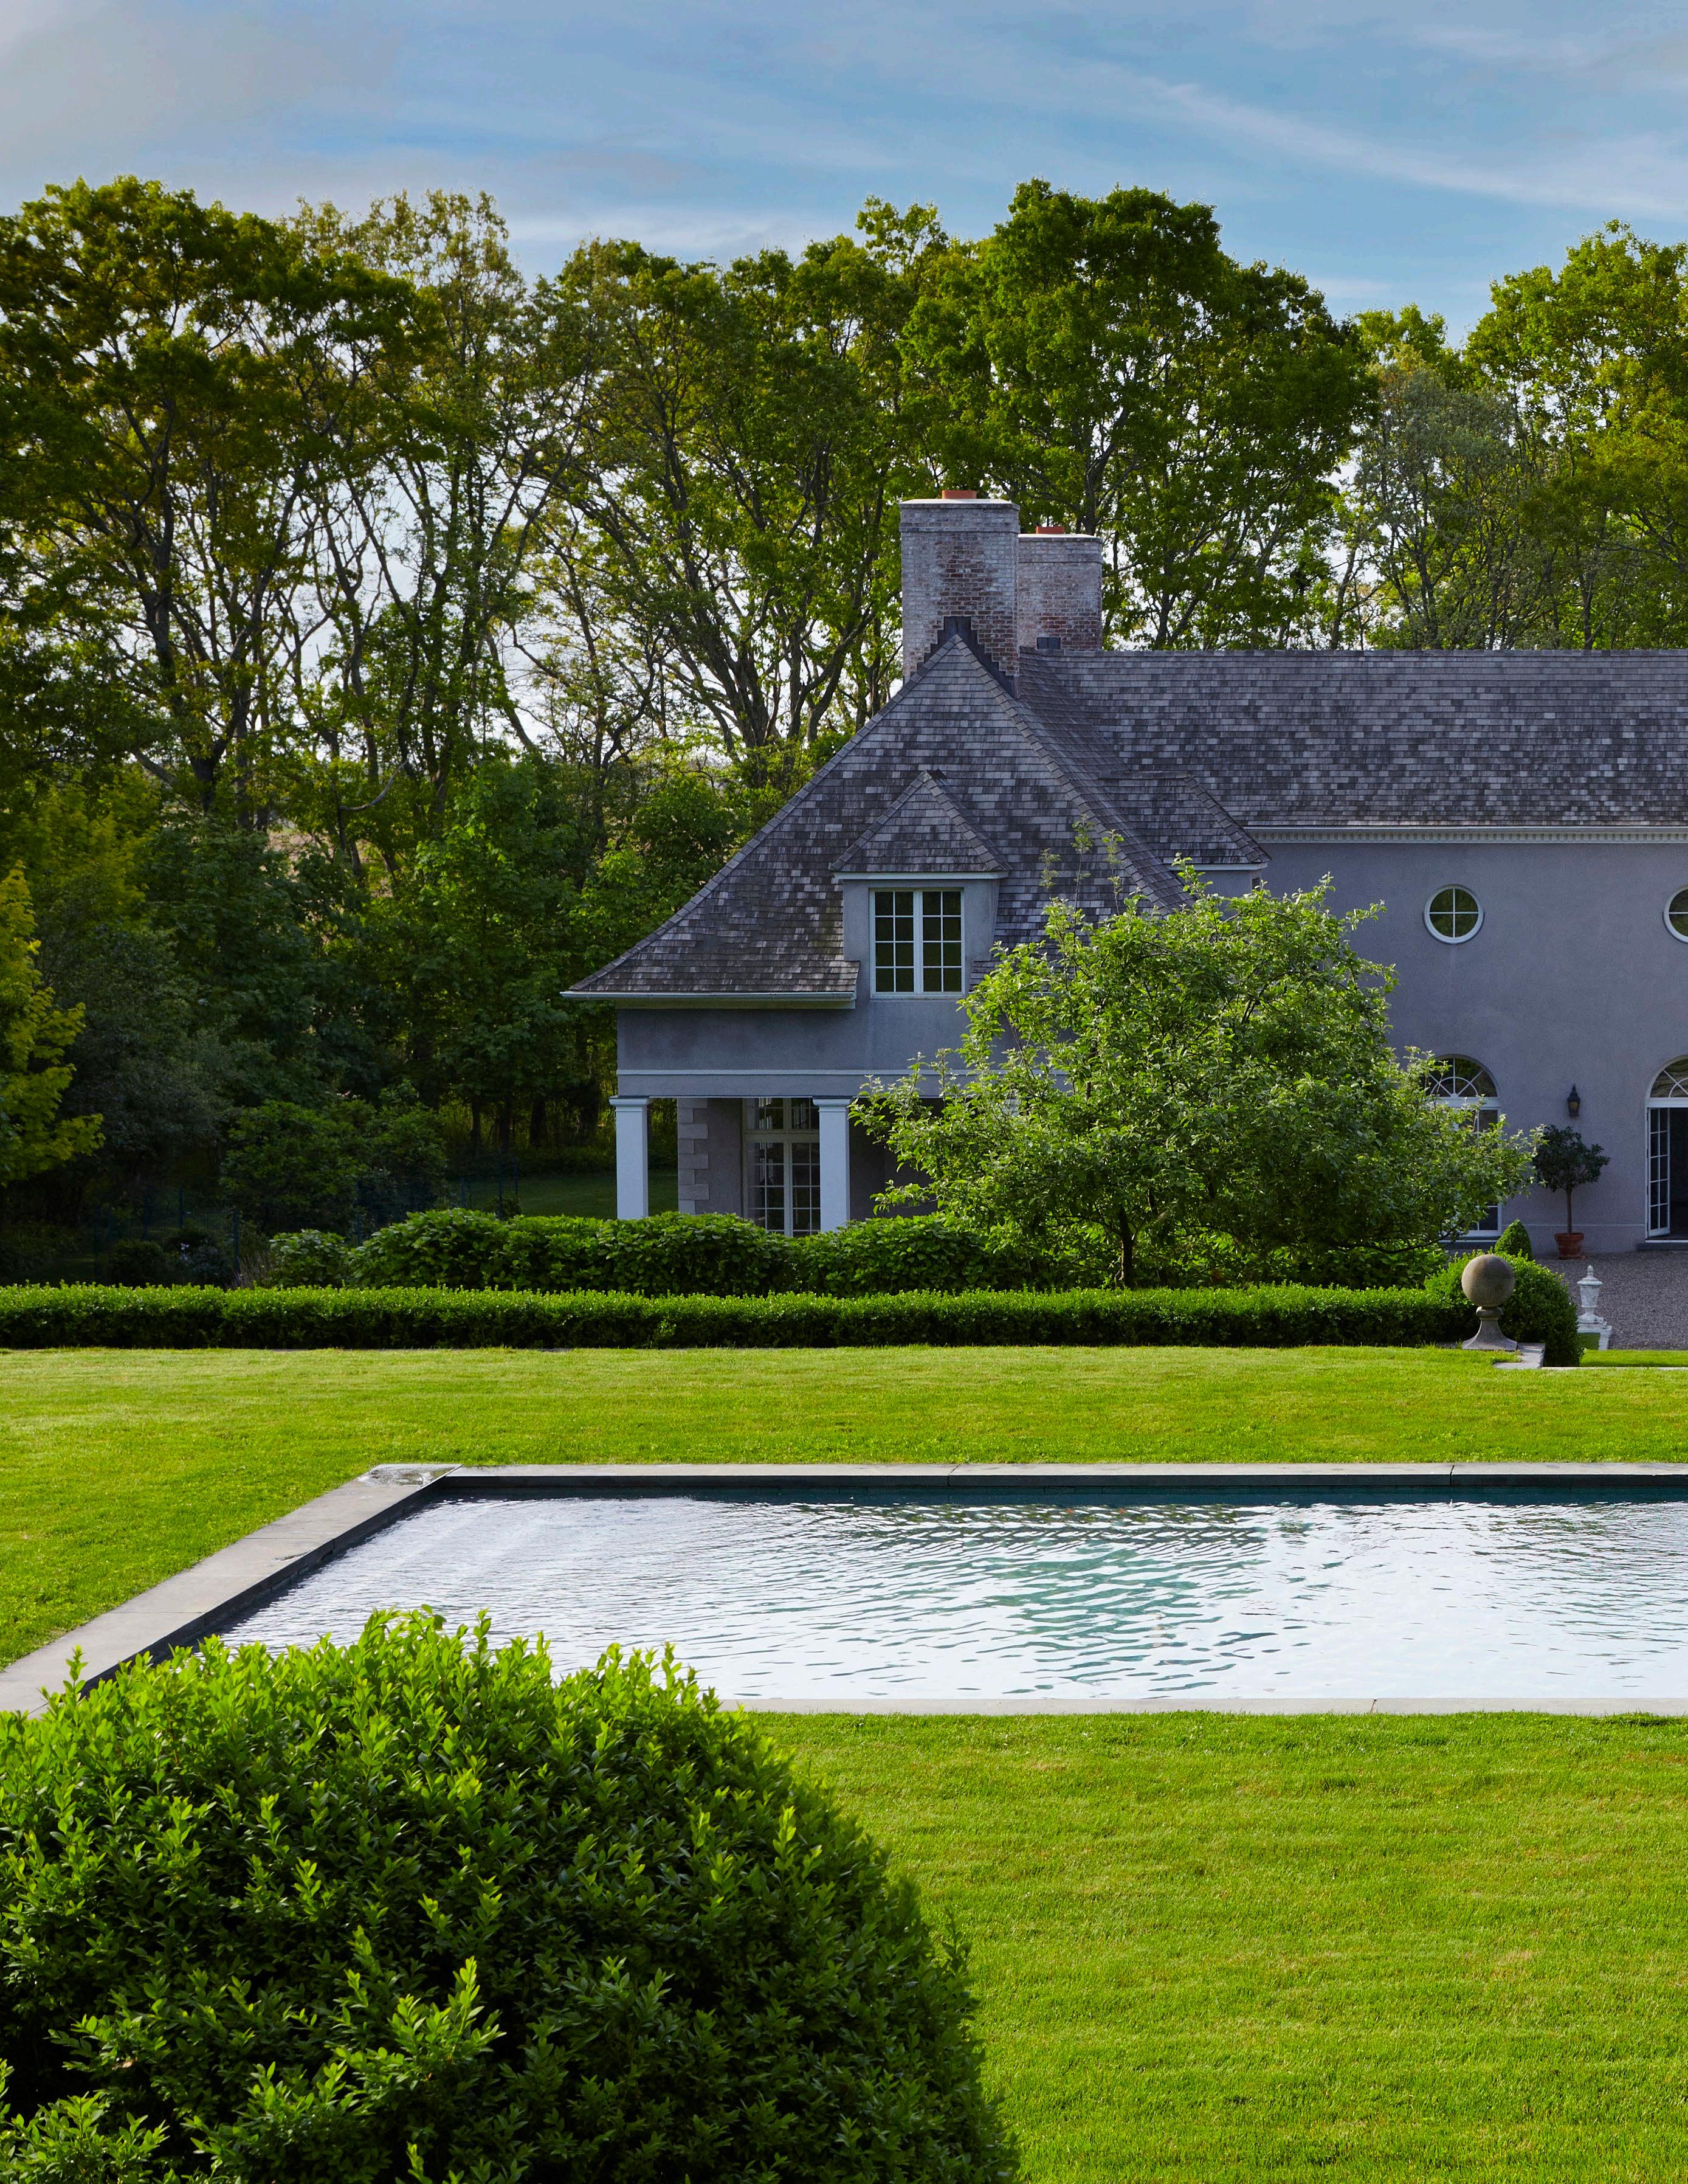
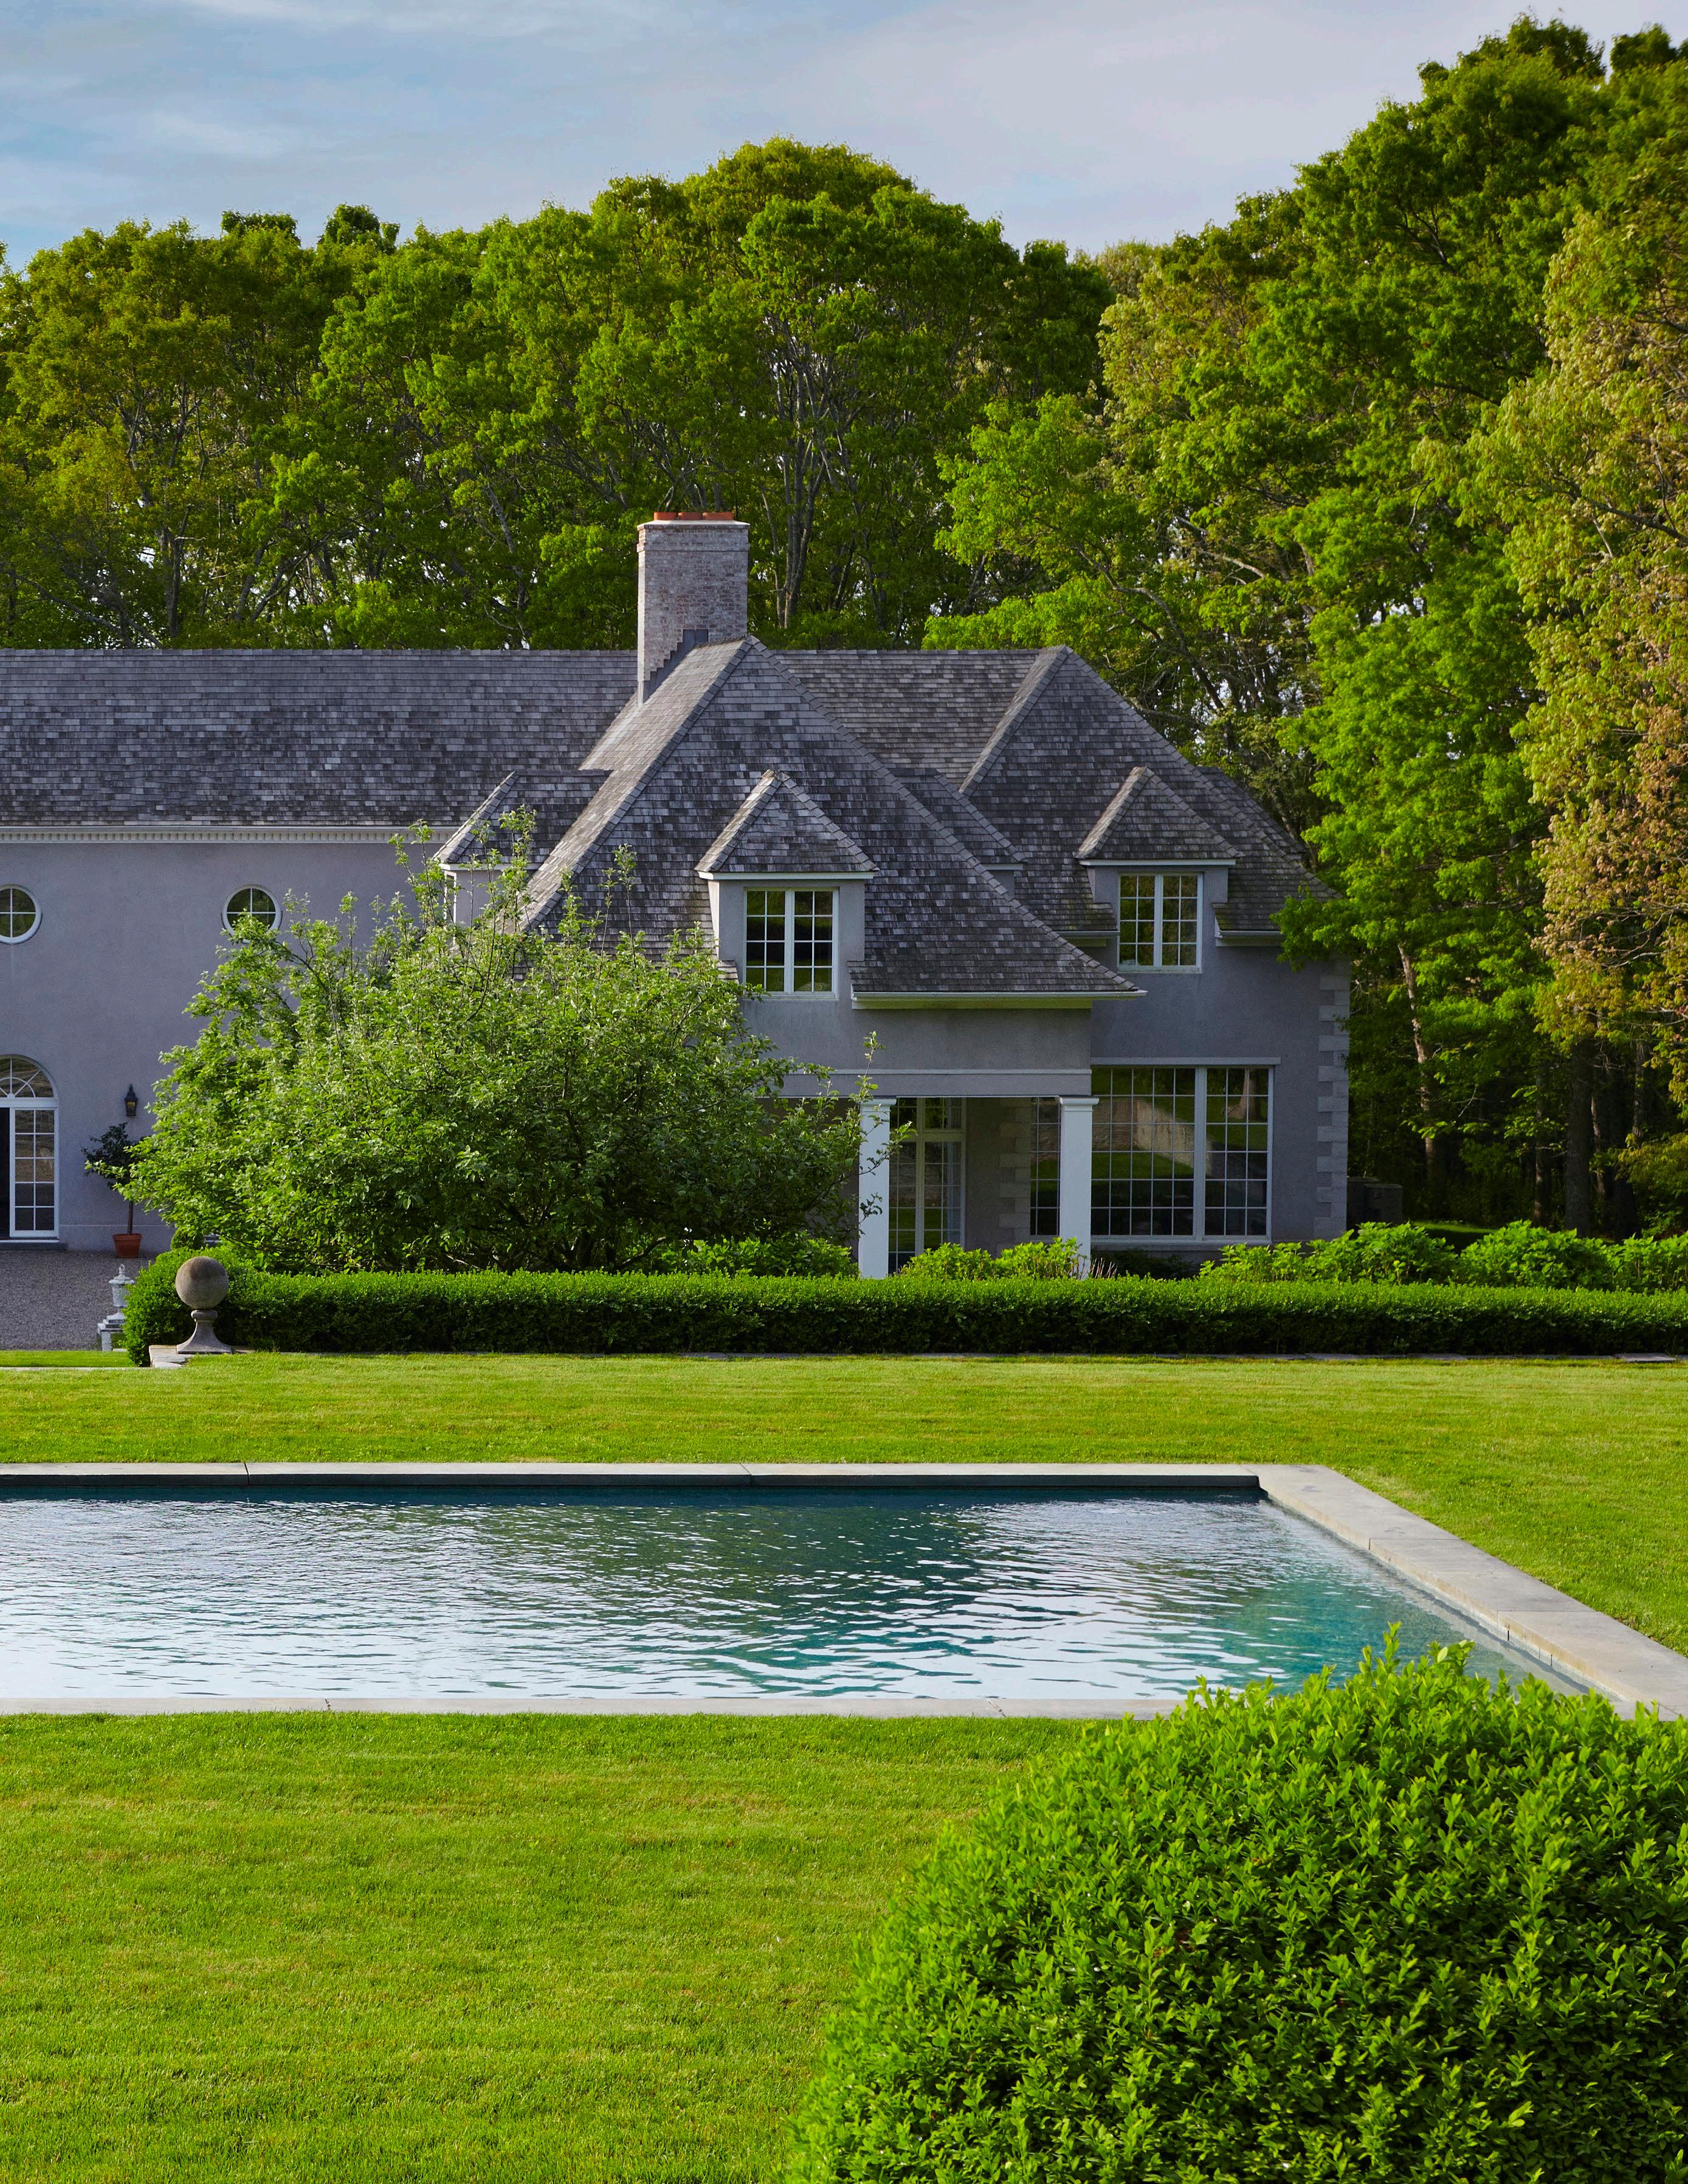
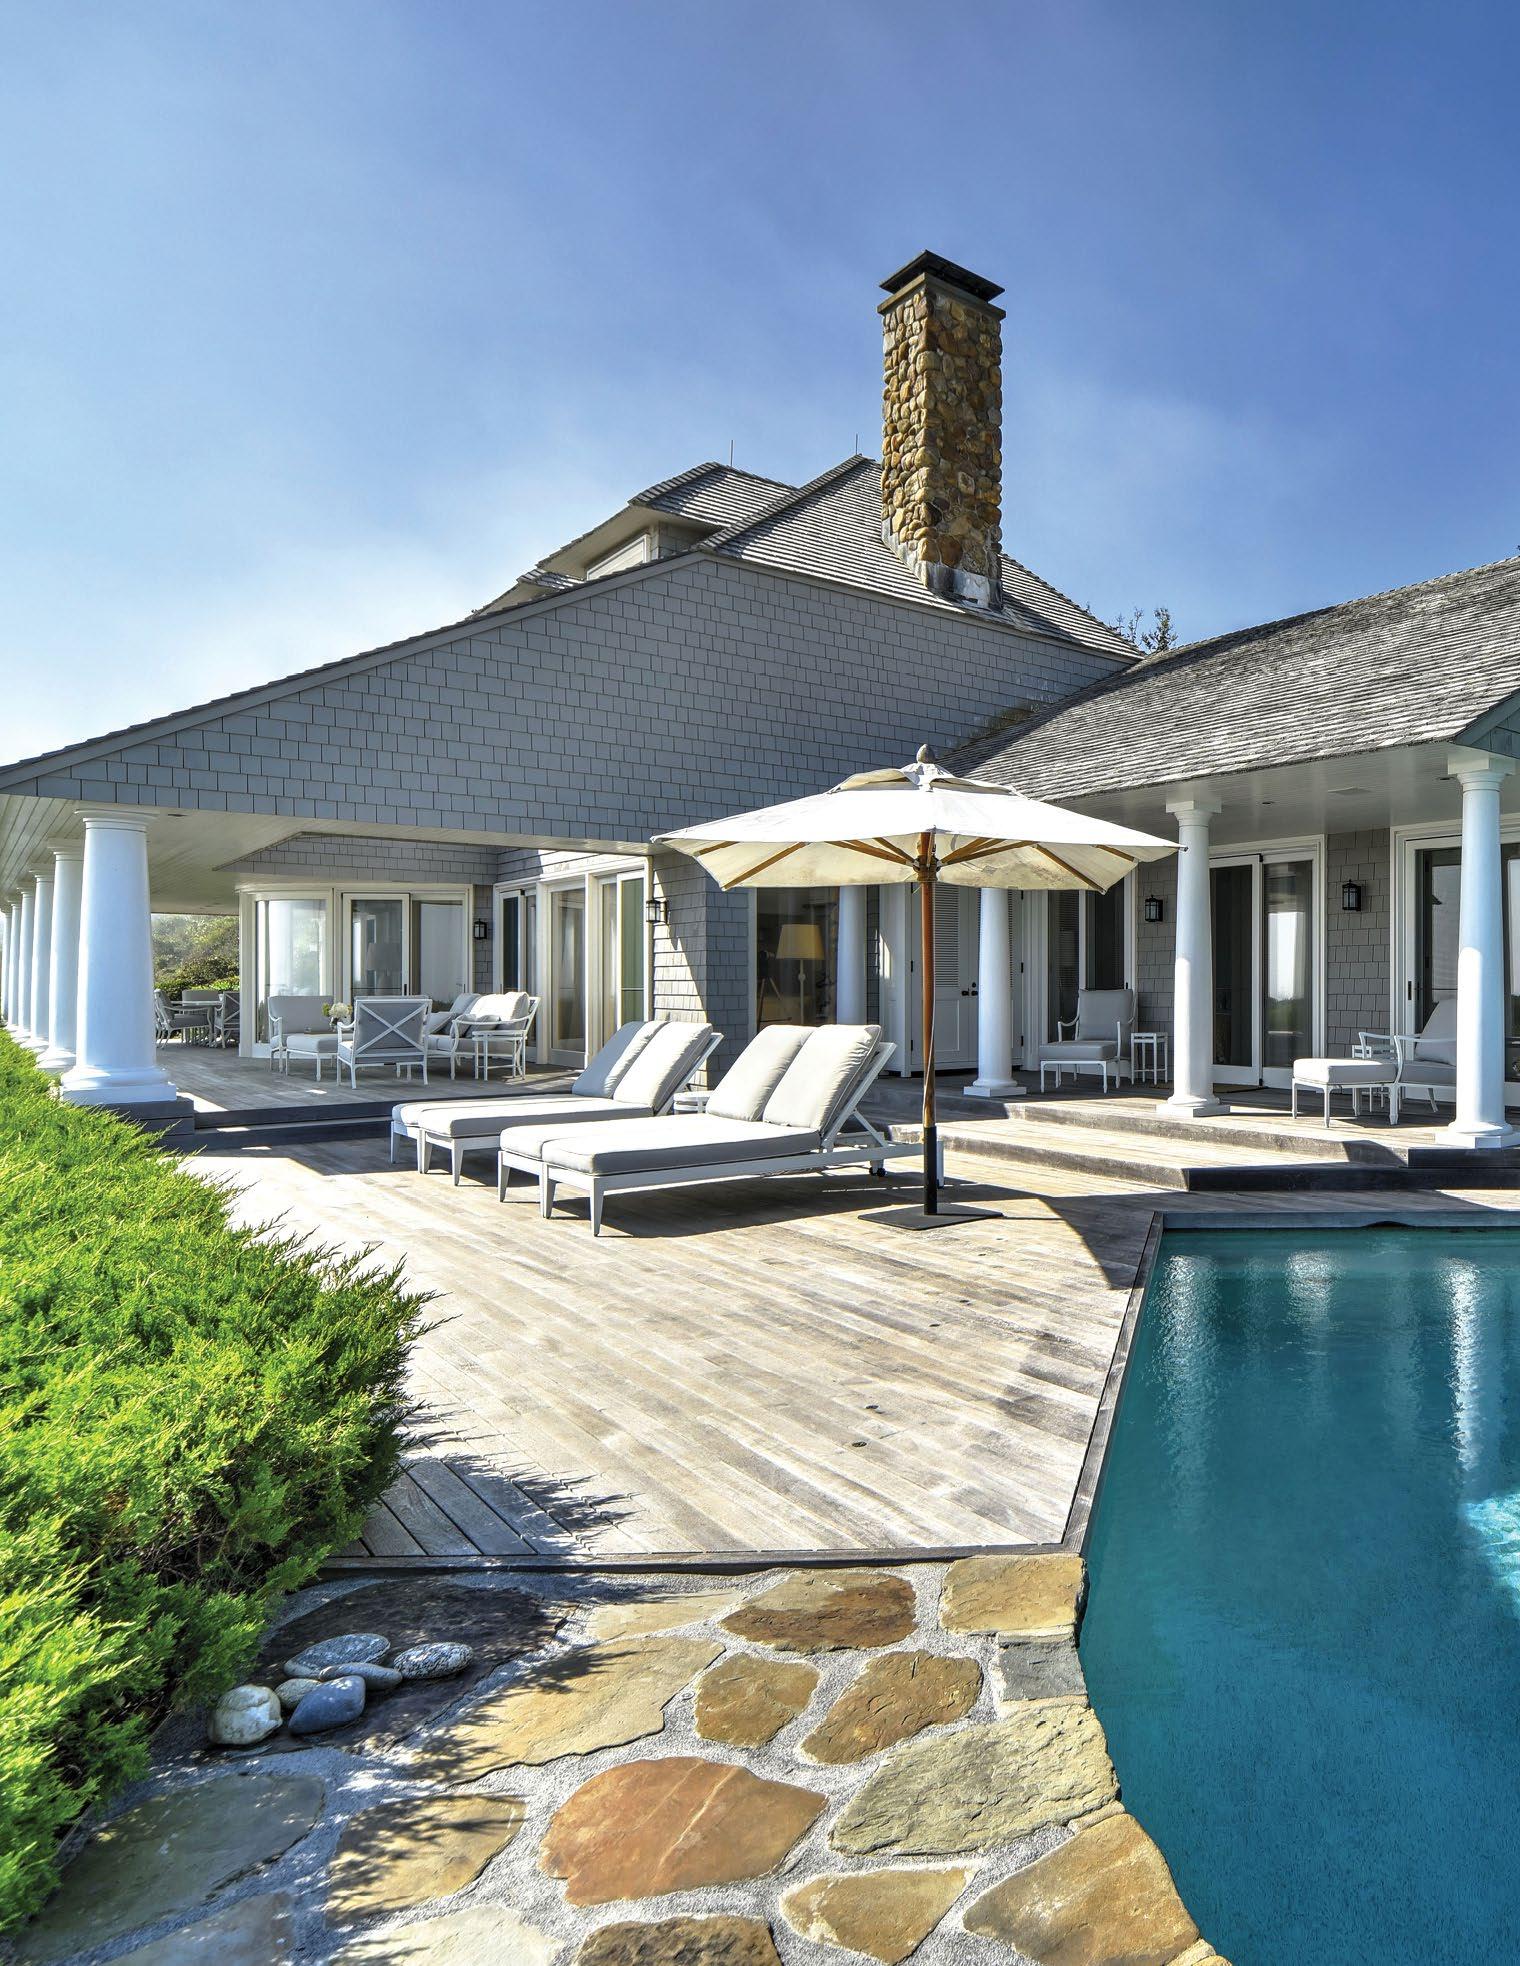
105 Jobs Lane, Bridgehampton, NY Private Estate | 1.4 Acres+/11,061 SF+/- | 5 Beds | 7F/3H Baths Bespoke Exclusive: $11.995M 12 | LUXURY MARKET INSIGHT
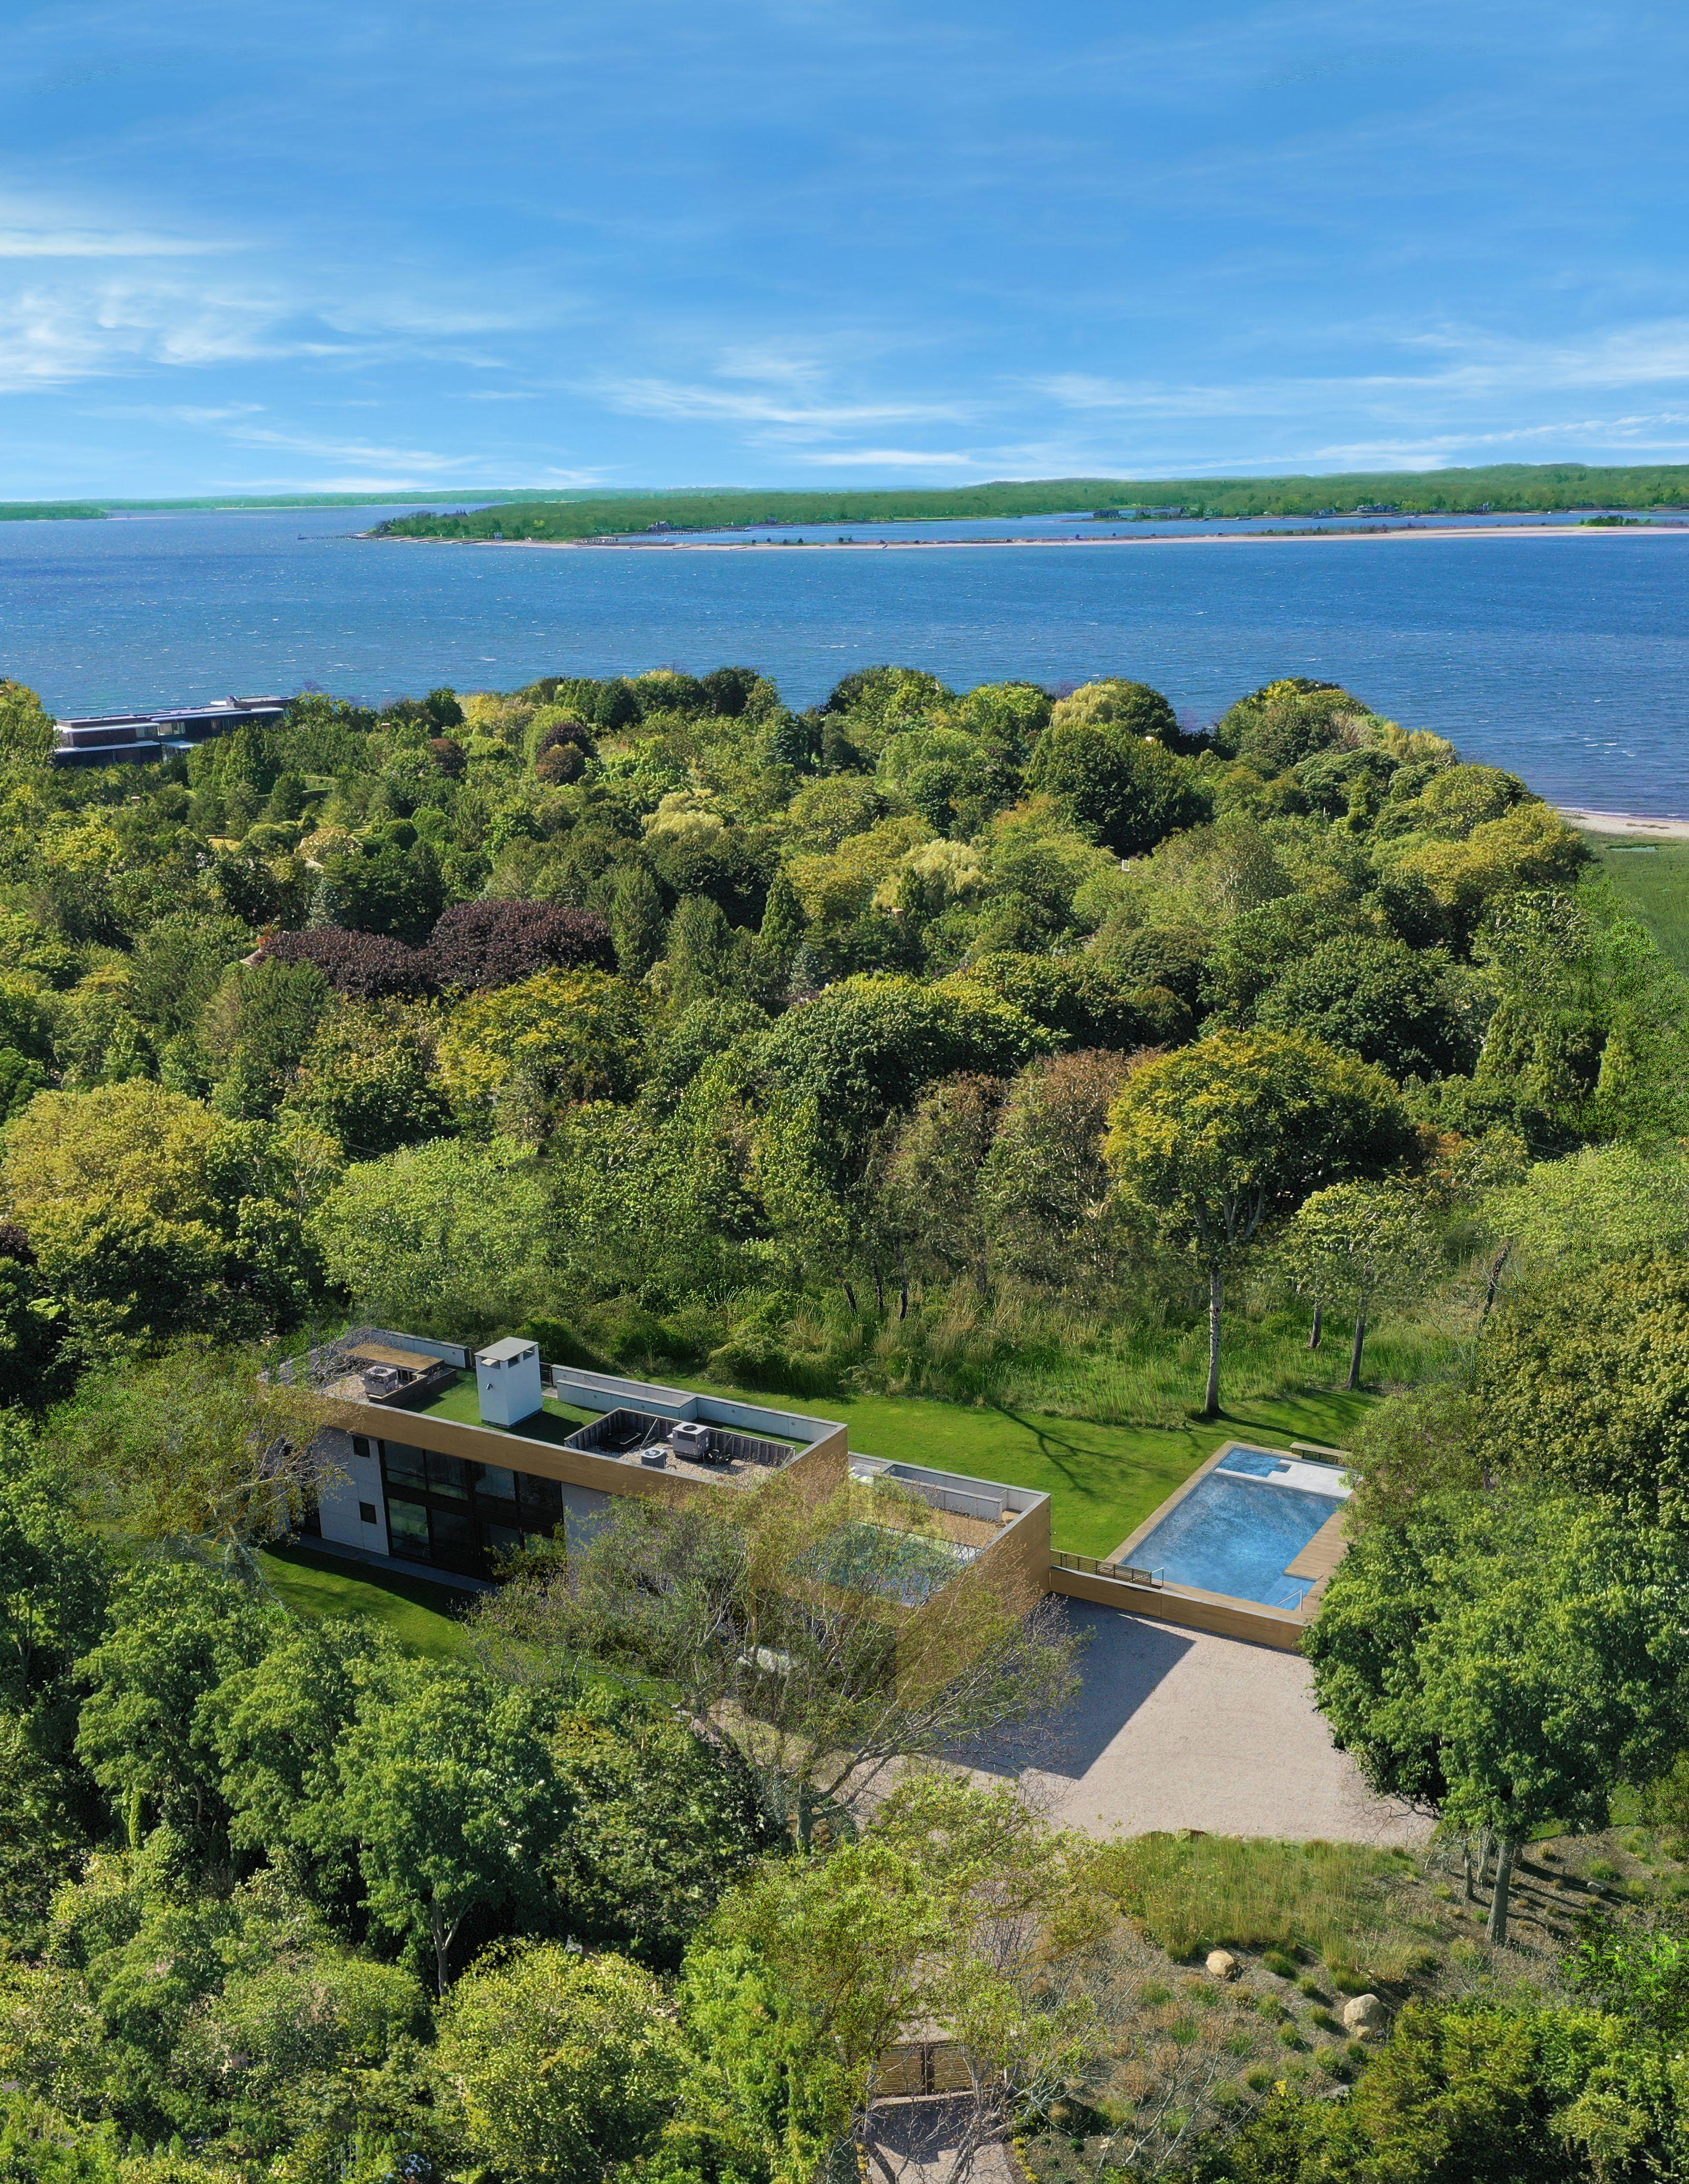
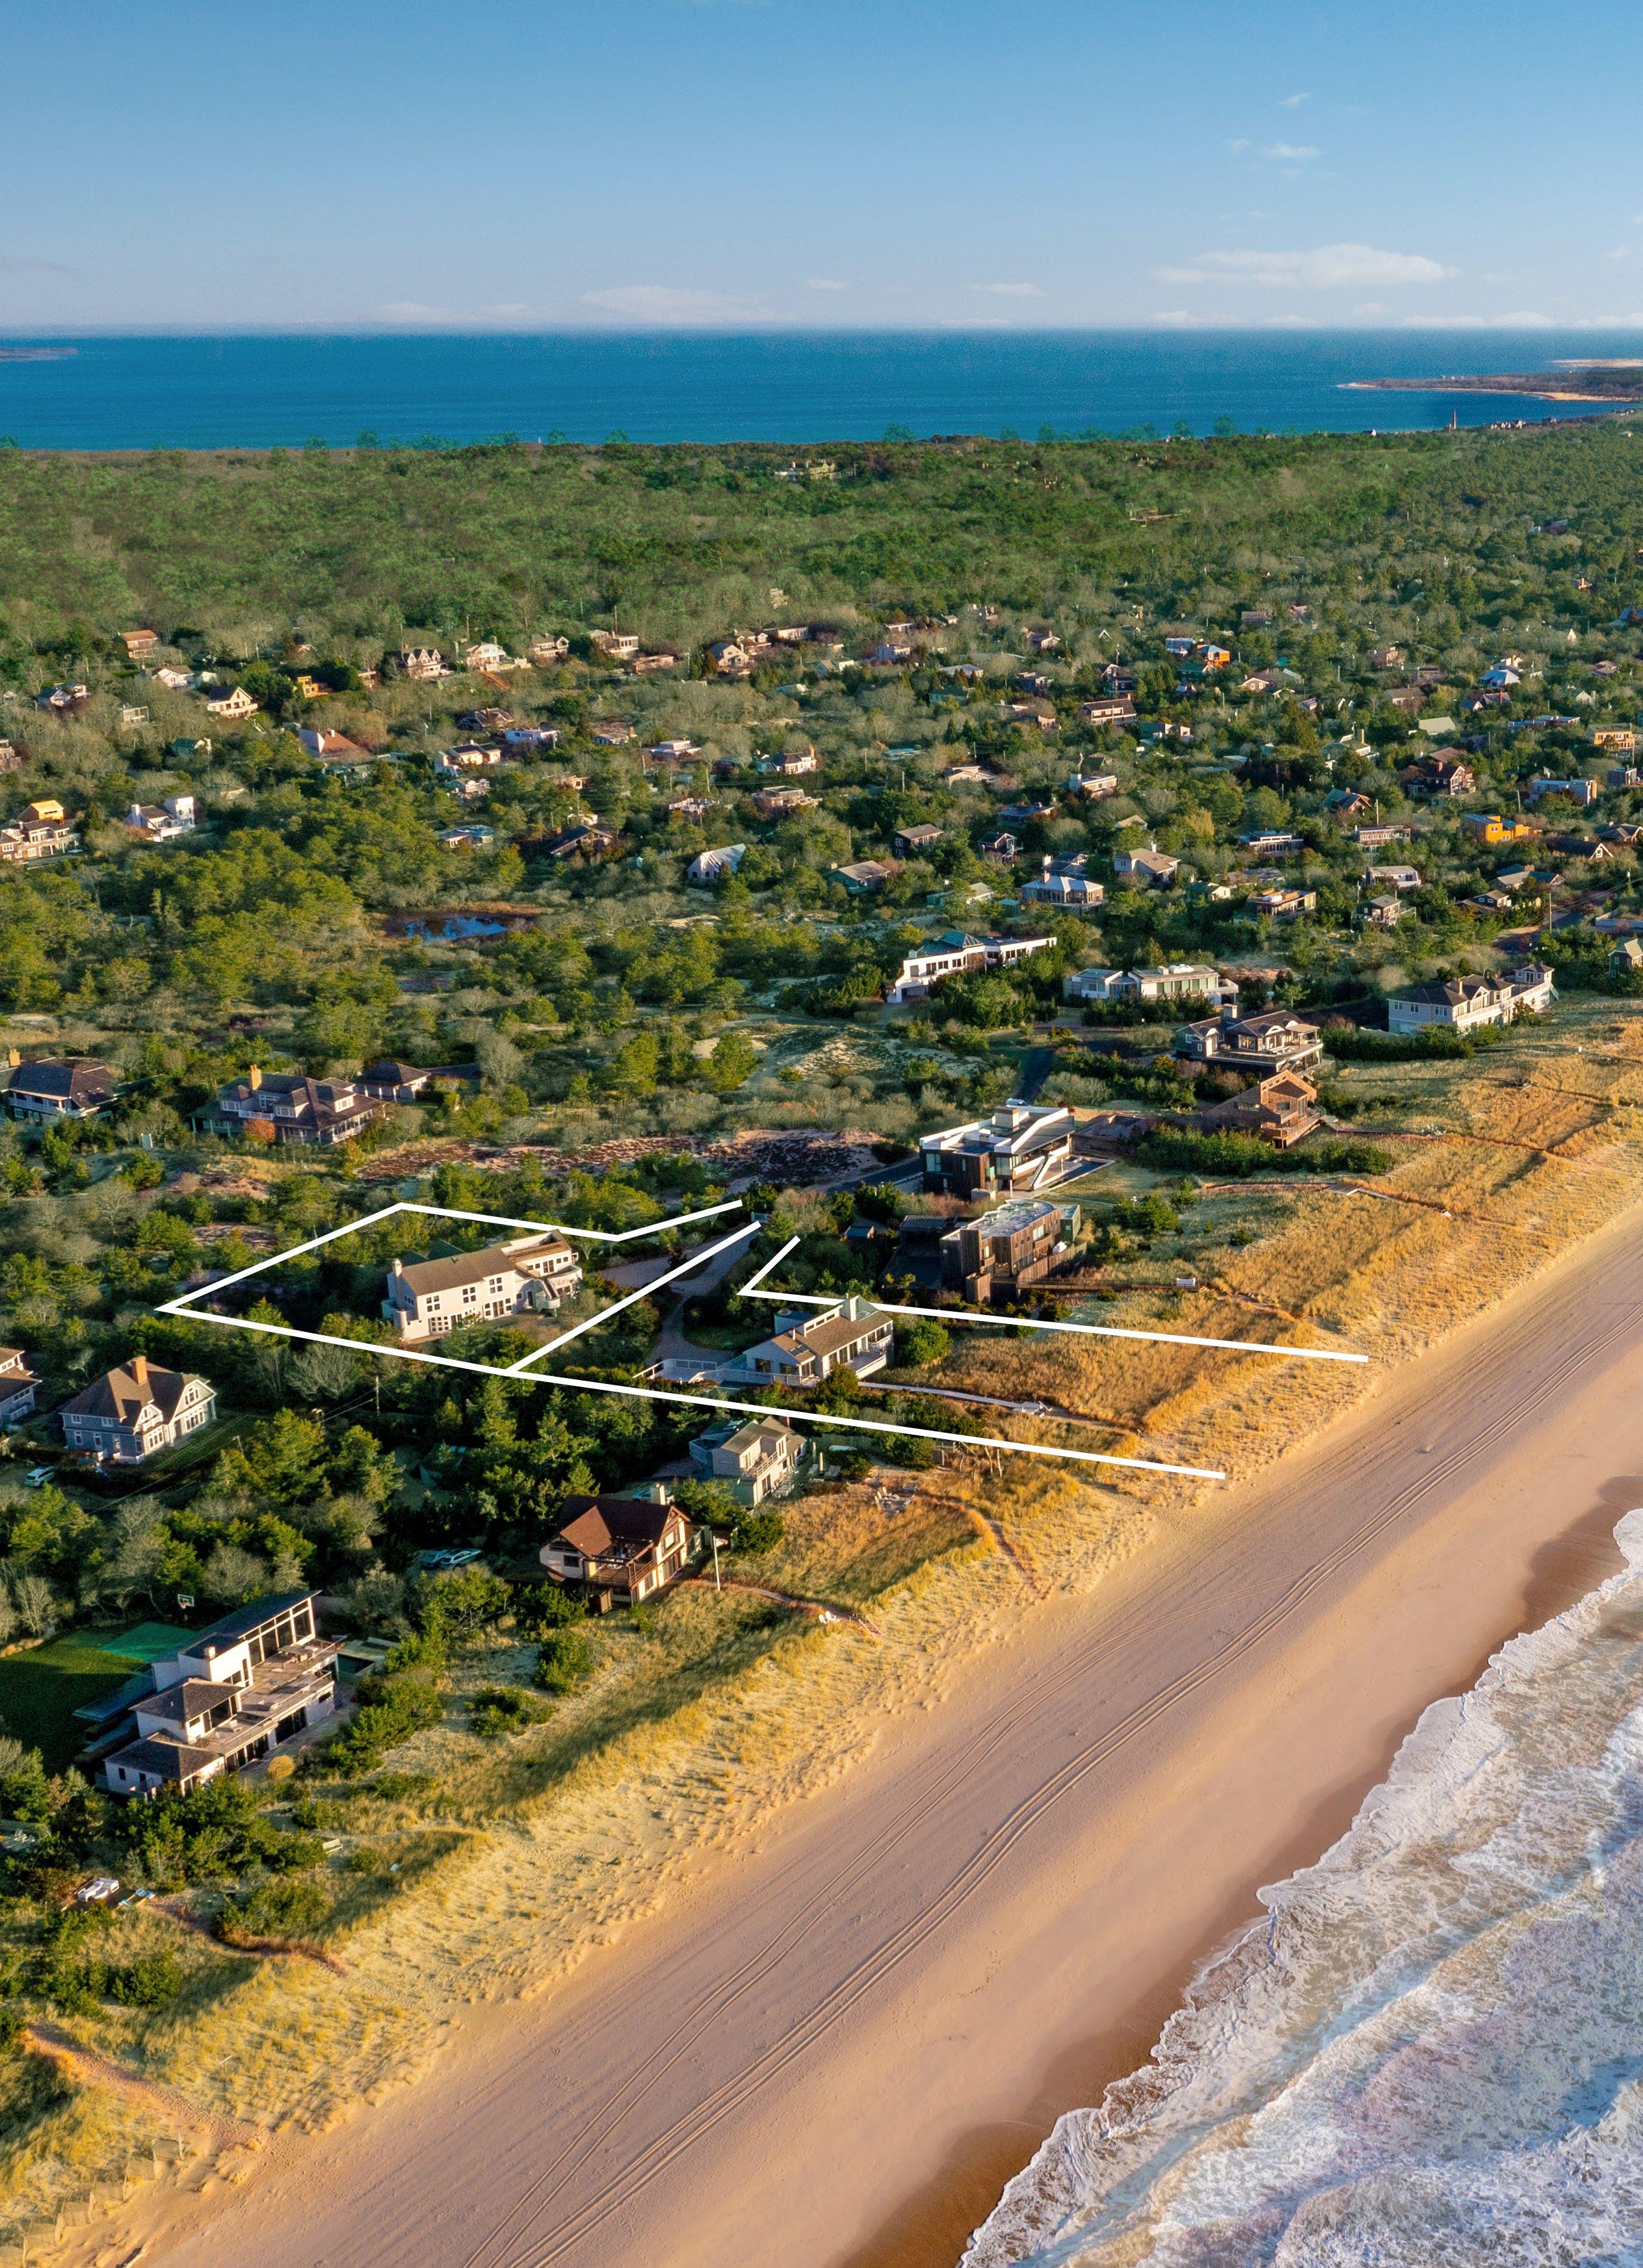
In Q1 2022, Bespoke facilitated over $132M in listing sales, comprising 27.5% of the total $10M+ market. 15 Seaponack Drive, Sag Harbor, NY Modern Ultra-Private Estate | 2.4 Acres+/7,500 SF+/- | 6 Beds | 5F/1H Baths Bespoke Exclusive: $10.995M BESPOKEREALESTATE.COM | 13
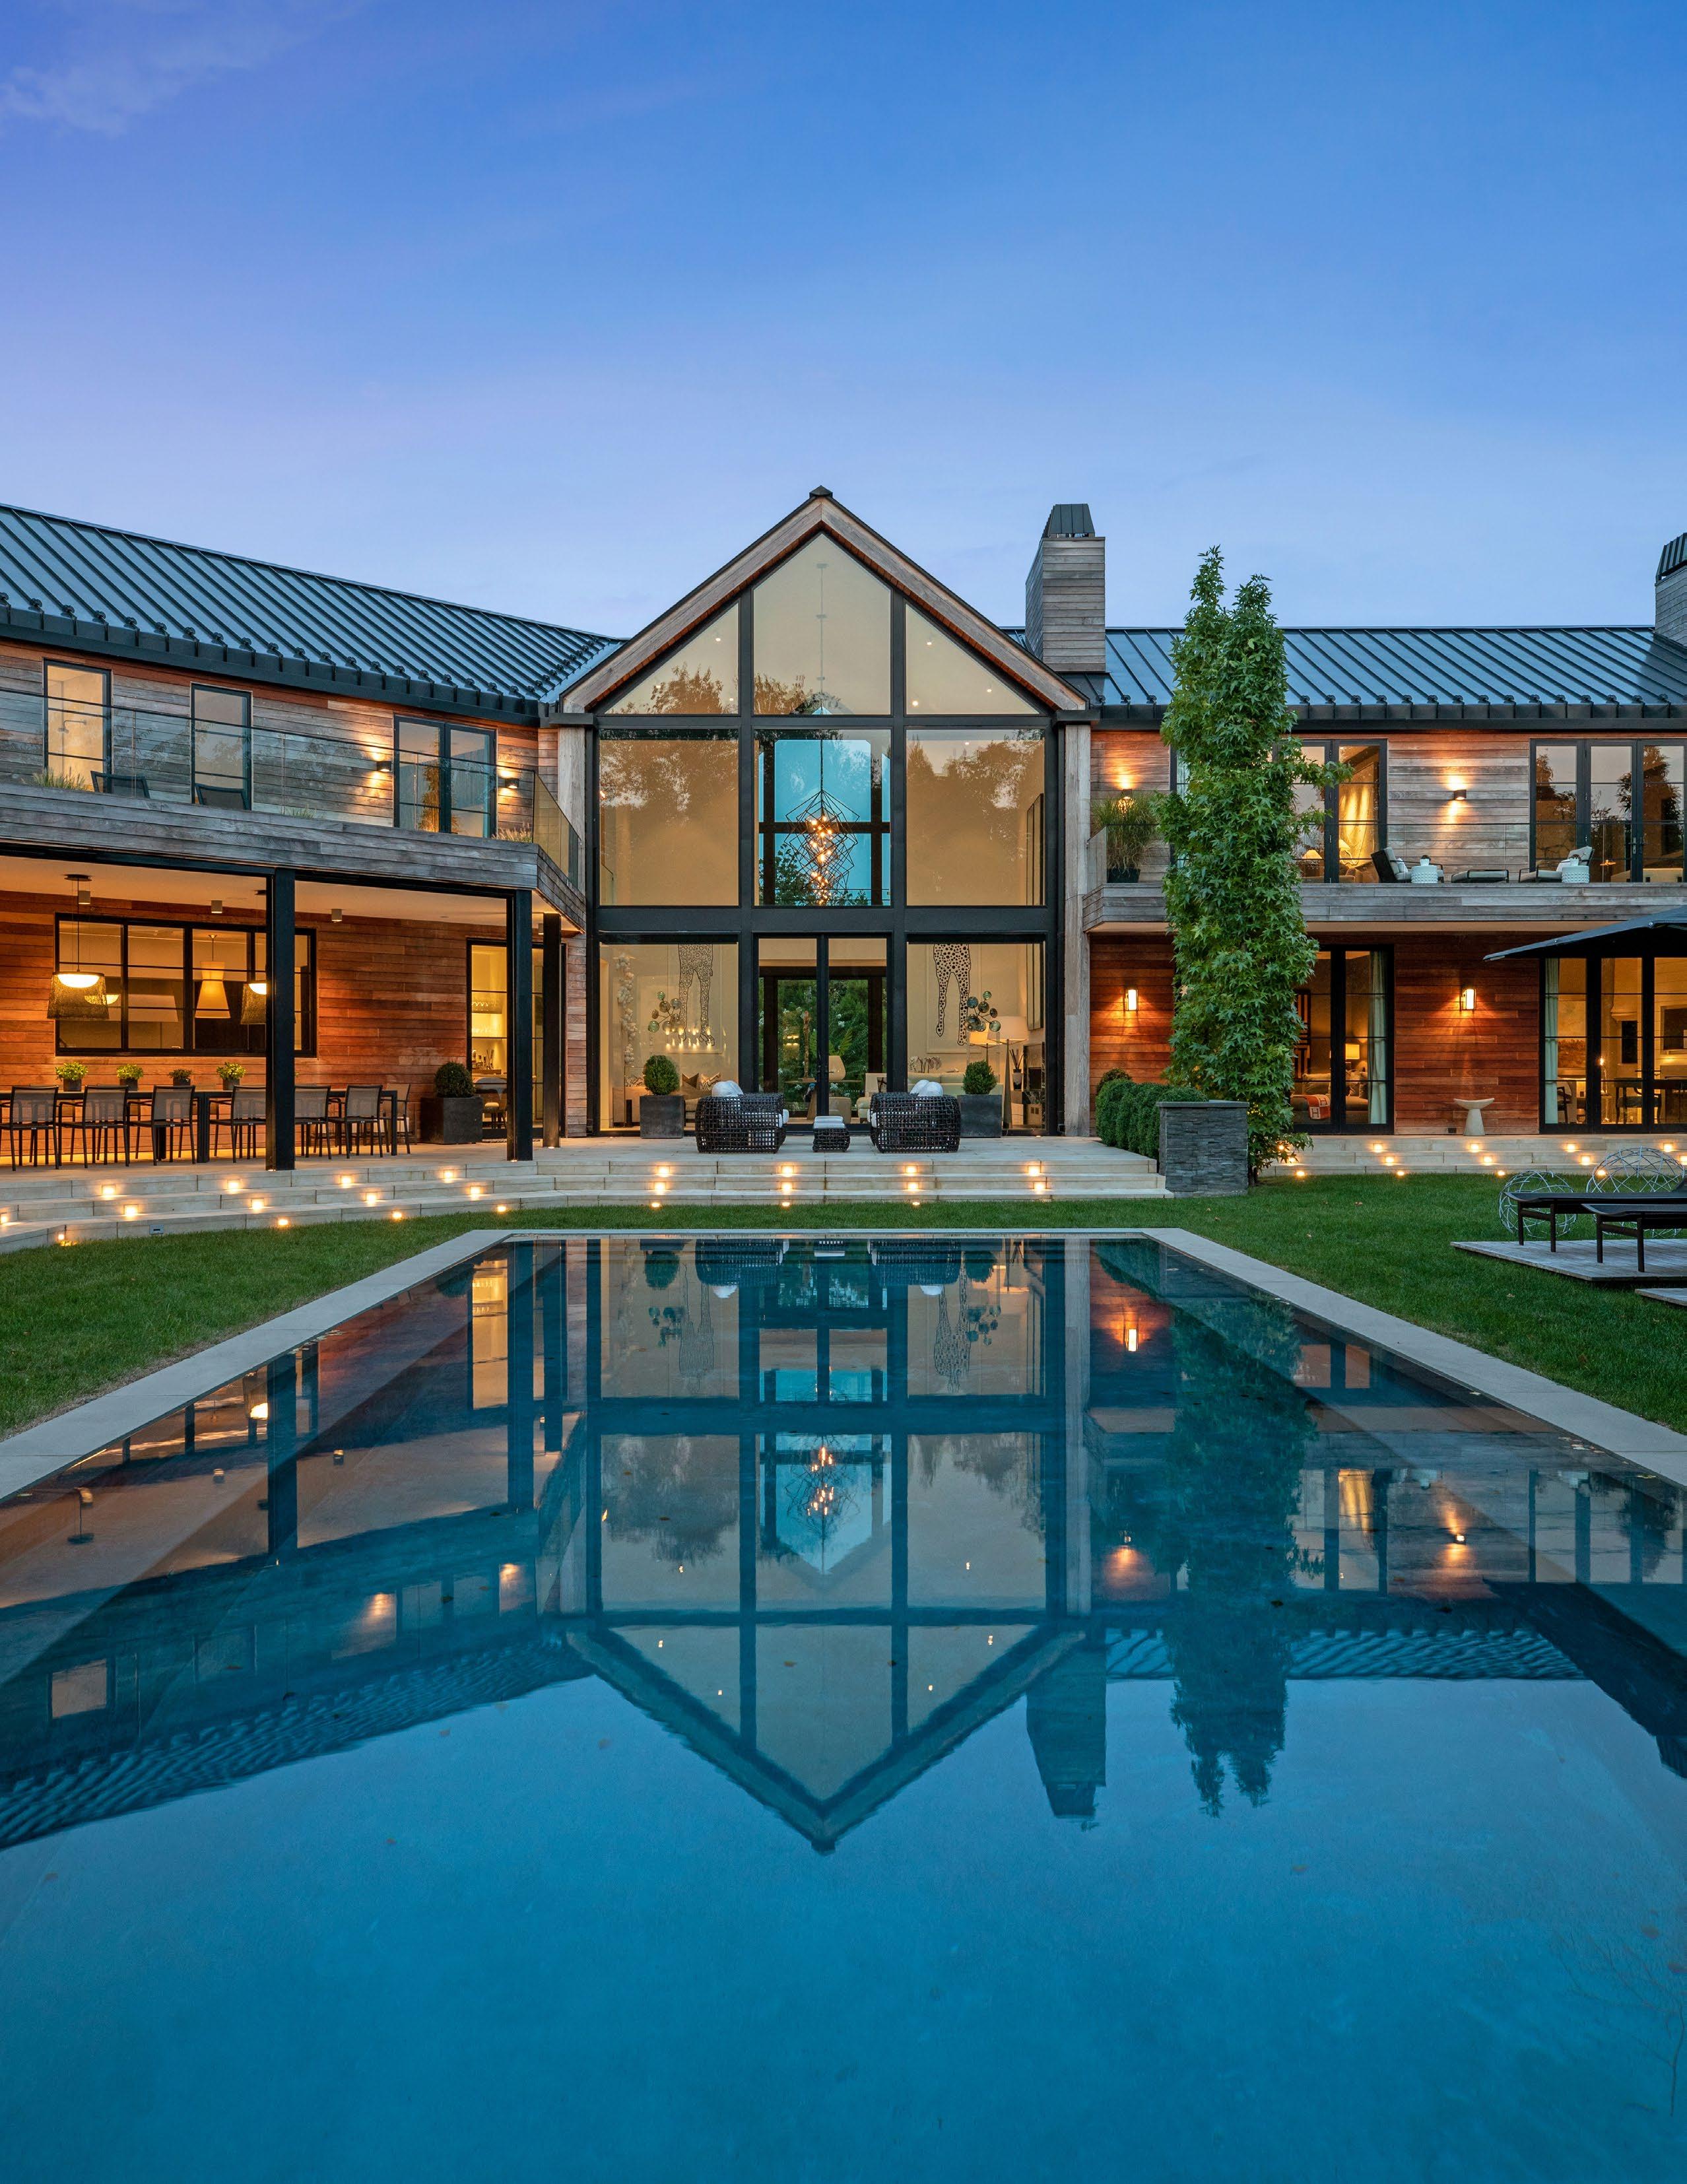
& 672 Noyac Path, Water Mill, NY
Elegant Compound | 4.6 Acres+/10,000 SF+/- | 7 Beds | 5F/1H Baths
Bespoke Exclusive: $16.75M
662
14 | LUXURY MARKET INSIGHT
BESPOKEREALESTATE.COM | 15
↑
15 TRADES
26 TRADES
The number of first quarter trades rose 73%, from 15 in 2021 to 26 in 2022.
Q1 2022 $10M + HAMPTONS MARKET REPORT 41
Total $10M+ Trades for Q1 2021 & 2022
2021 2022
73.33%
16 | LUXURY MARKET INSIGHT
The data shown below includes the 9 locations surveyed within the Hamptons $10M+ real estate market for Q1 2021 & 2022
1
0
1
4
*Includes
$10M + TOTAL HAMPTONS SALES BY LOCATION
Westhampton-Hampton Bays *WEST OF THE CANAL
TRADES IN 2021 2 TRADES IN 2022 4 SAG HARBOR 0 TRADES IN 2021 4 TRADES IN 2022 4 WAINSCOTT
2
TRADES IN 2021
TRADES IN 2022 1 SOUTHAMPTON 2 TRADES IN 2021 5 TRADES IN 2022 7 BRIDGEHAMPTON 4 TRADES IN 2021 3 TRADES IN 2022 7 EAST HAMPTON
TRADES IN 2021
TRADES IN 2022 4 WATER MILL 2 TRADES IN 2021 4 TRADES IN 2022 6 SAGAPONACK 2 TRADES IN 2021 1 TRADES IN 2022 3 AMAGANSETT/MONTAUK
1
3
TRADES IN 2021
TRADES IN 2022 5 Q1 2022 TRADES Q1 2021 TRADES
263 Olivers Cove Lane, Water Mill, NY. Waterfront Estate Overlooking Mecox Bay 4.6 Acres+/- | 7,957 SF+/- | 7 Beds | 9F/1H Baths Bespoke Exclusive: $35M Sales of waterfront homes grew 150%, with $77.3M more transacted in Q1 2022 than Q1 2021. 18 | LUXURY MARKET INSIGHT
BESPOKEREALESTATE.COM | 19
216 Old Montauk Highway, Montauk, NY. Oceanfront Retreat | 1.5 Acres+/3,000 SF+/- | 3 Beds | 3F/1H Baths Bespoke Co-Exclusive: $22.5M 20 | LUXURY MARKET INSIGHT
271 & 266 Marine Blvd, Amagansett, NY.
Oceanfront Compound | 1.79 Acres+/8,756 SF+/- | 11 Beds | 10F/2H Baths
Bespoke Co-Exclusive: $34.995M
BESPOKEREALESTATE.COM | 21
$725M+
Sales volume nearly doubled between Q1 2022 and Q1 2021, growing 99.54%.
Q1 2022 $10M + HAMPTONS MARKET REPORT
Total $10M+ Trade Volume for
&
Q1 2021
2022
2021 2022 $242M + $483M + ↑ 99.54% 22 | LUXURY MARKET INSIGHT
$10M + TOTAL HAMPTONS SALES BY PRICE POINT
The data shown illustrates the total sales quantity and volume within the ultra-luxury real estate market surveyed within the Hamptons for Q1 2021 & 2022
$10M - $20M $152M Q1 2021 $272M Q2 2022 32 $30M - $40M $0 Q1 2021 $32M Q2 2022 1 $20M - $30M $90M Q1 2021 $45M Q2 2022 6 $40M + $0 Q1 2021 $135M Q2 2022 2 Q1 2022 TRADES Q1 2021 TRADES
Water Mill was one of the greatest performers in Q1 2022, having sales quantity and volume doubling year over year.
439
Cobb Road, Water Mill, NY.
Estate | 2 Acres+/12,500 SF+/- | 9 Beds | 8F/3H Baths
Exclusive: $18.995M
Contemporary
Bespoke
24 | LUXURY MARKET INSIGHT
289 Parsonage Lane & Reserve, Sagaponack, NY.
Turn-Key Estate | 12.5 Acres+/-
12,795 SF+/- | 6 Beds | 6F/3H Baths
Bespoke Exclusive: $33M
BESPOKEREALESTATE.COM | 25

Southampton trade volume grew by $33.9M between Q1 2022 and Q1 2021, a 106% increase.
26 | LUXURY MARKET INSIGHT
20 Channel Pond Court, Southampton, NY. Estate with Deeded Ocean Access | 2.55 Acres+/5,085 SF+/- | 5 Beds | 3F/1H Baths Bespoke Exclusive: $12.99M BESPOKEREALESTATE.COM | 27
In Q1 2022, Bespoke facilitated 30% of all $10M+ oceanfront trades. 165 Surfside Drive, Bridgehampton, NY. Contemporary Oceanfront Living 1.3 Acres+/- | 4,000 SF+/- | 5 Beds | 5 Baths Bespoke Exclusive: $26.995M 28 | LUXURY MARKET INSIGHT
Water Mill North, NY. Turn-Key Estate | 5.68 Acres+/6,000 SF+/- | 6 Beds | 7F/1H Baths Bespoke Exclusive: $11M BESPOKEREALESTATE.COM | 29
BY SETTING Q1 2021 Q1 2022 LISTINGS VOLUME LISTINGS VOLUME OCEANFRONT 2 $30,995,000 3 $166,500,000 WATERFRONT 4 $65,295,000 10 $142,600,000 INLAND 9 $145,880,000 13 $174,130,000 TOTAL 15 $242,170,000 26 $483,230,000 BY VINTAGE NEW CONSTRUCTION 4 $75,435,000 8 $160,895,000 LAND/TEARDOWN 4 $65,345,000 4 $128,250,000 TURN-KEY 7 $101,390,000 14 $194,085,000 TOTAL 15 $242,170,000 26 $483,230,000 BY PRICE POINT $10M - $20M 11 $152,275,000 21 $271,730,000 $20M - $30M 4 $89,895,000 2 $45,000,000 $30M - $40M 0 $0 1 $32,000,000 $40M+ 0 $0 2 $134,500,000 TOTAL 15 $242,170,000 26 $483,230,000 Q1 2022 HAMPTONS $10M+ MARKET 30 | LUXURY MARKET INSIGHT
LISTINGS VOLUME LISTINGS VOLUME WEST OF THE CANAL 2 $23,350,000 2 $27,200,000 SOUTHAMPTON 2 $31,950,000 5 $65,850,000 WATER MILL 2 $29,995,000 4 $59,035,000 SAG HARBOR 0 $0 4 $55,650,000 BRIDGEHAMPTON 4 $74,435,000 3 $36,595,000 SAGAPONACK 2 $34,945,000 1 $50,000,000 WAINSCOTT 1 $18,500,000 0 $0 EAST HAMPTON 1 $18,000,000 3 $117,250,000 AMAGANSETT/MONTAUK 1 $10,995,000 4 $71,650,000 TOTAL 15 $242,170,000 26 $483,230,000 BY LOCATION Q1 2021 Q1 2022 BESPOKEREALESTATE.COM | 31
32 | LUXURY MARKET INSIGHT
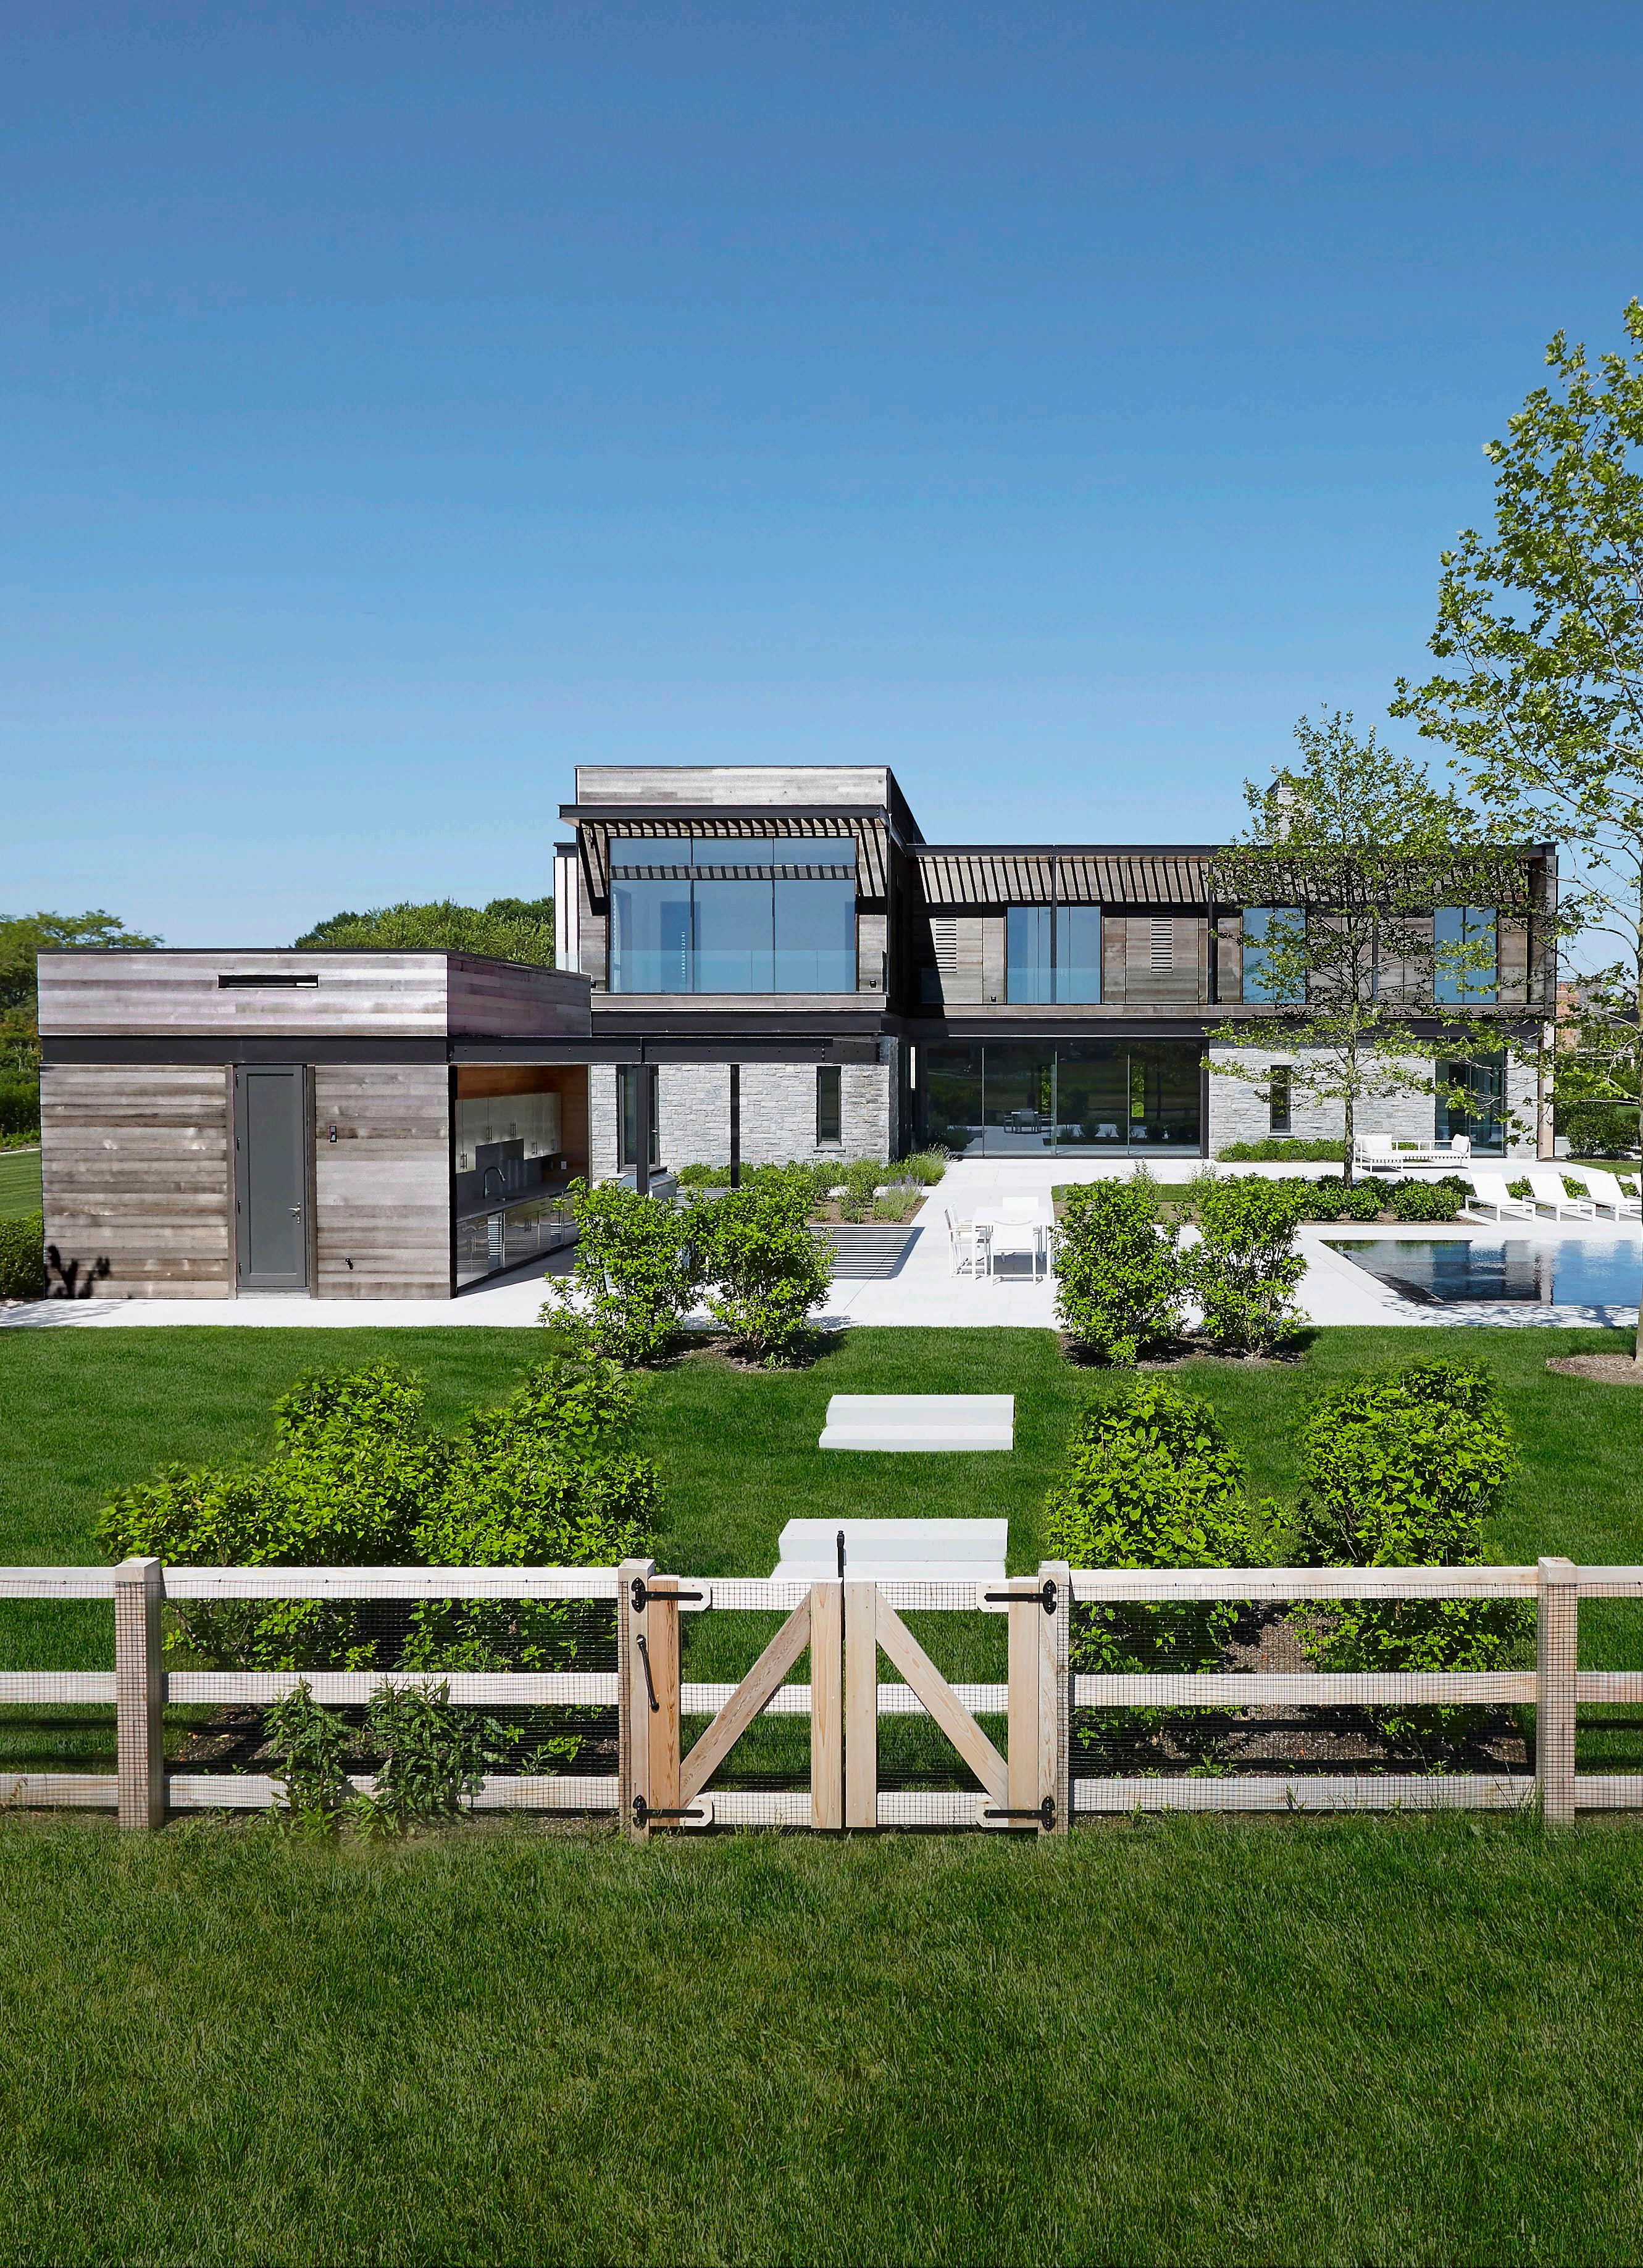
2 East Drive, Sag Harbor, NY. New Construction | 2.5 Acres+/11,126 SF+/- | 8 Beds | 10F/1H Baths Bespoke Exclusive: $10.995M BESPOKEREALESTATE.COM | 33
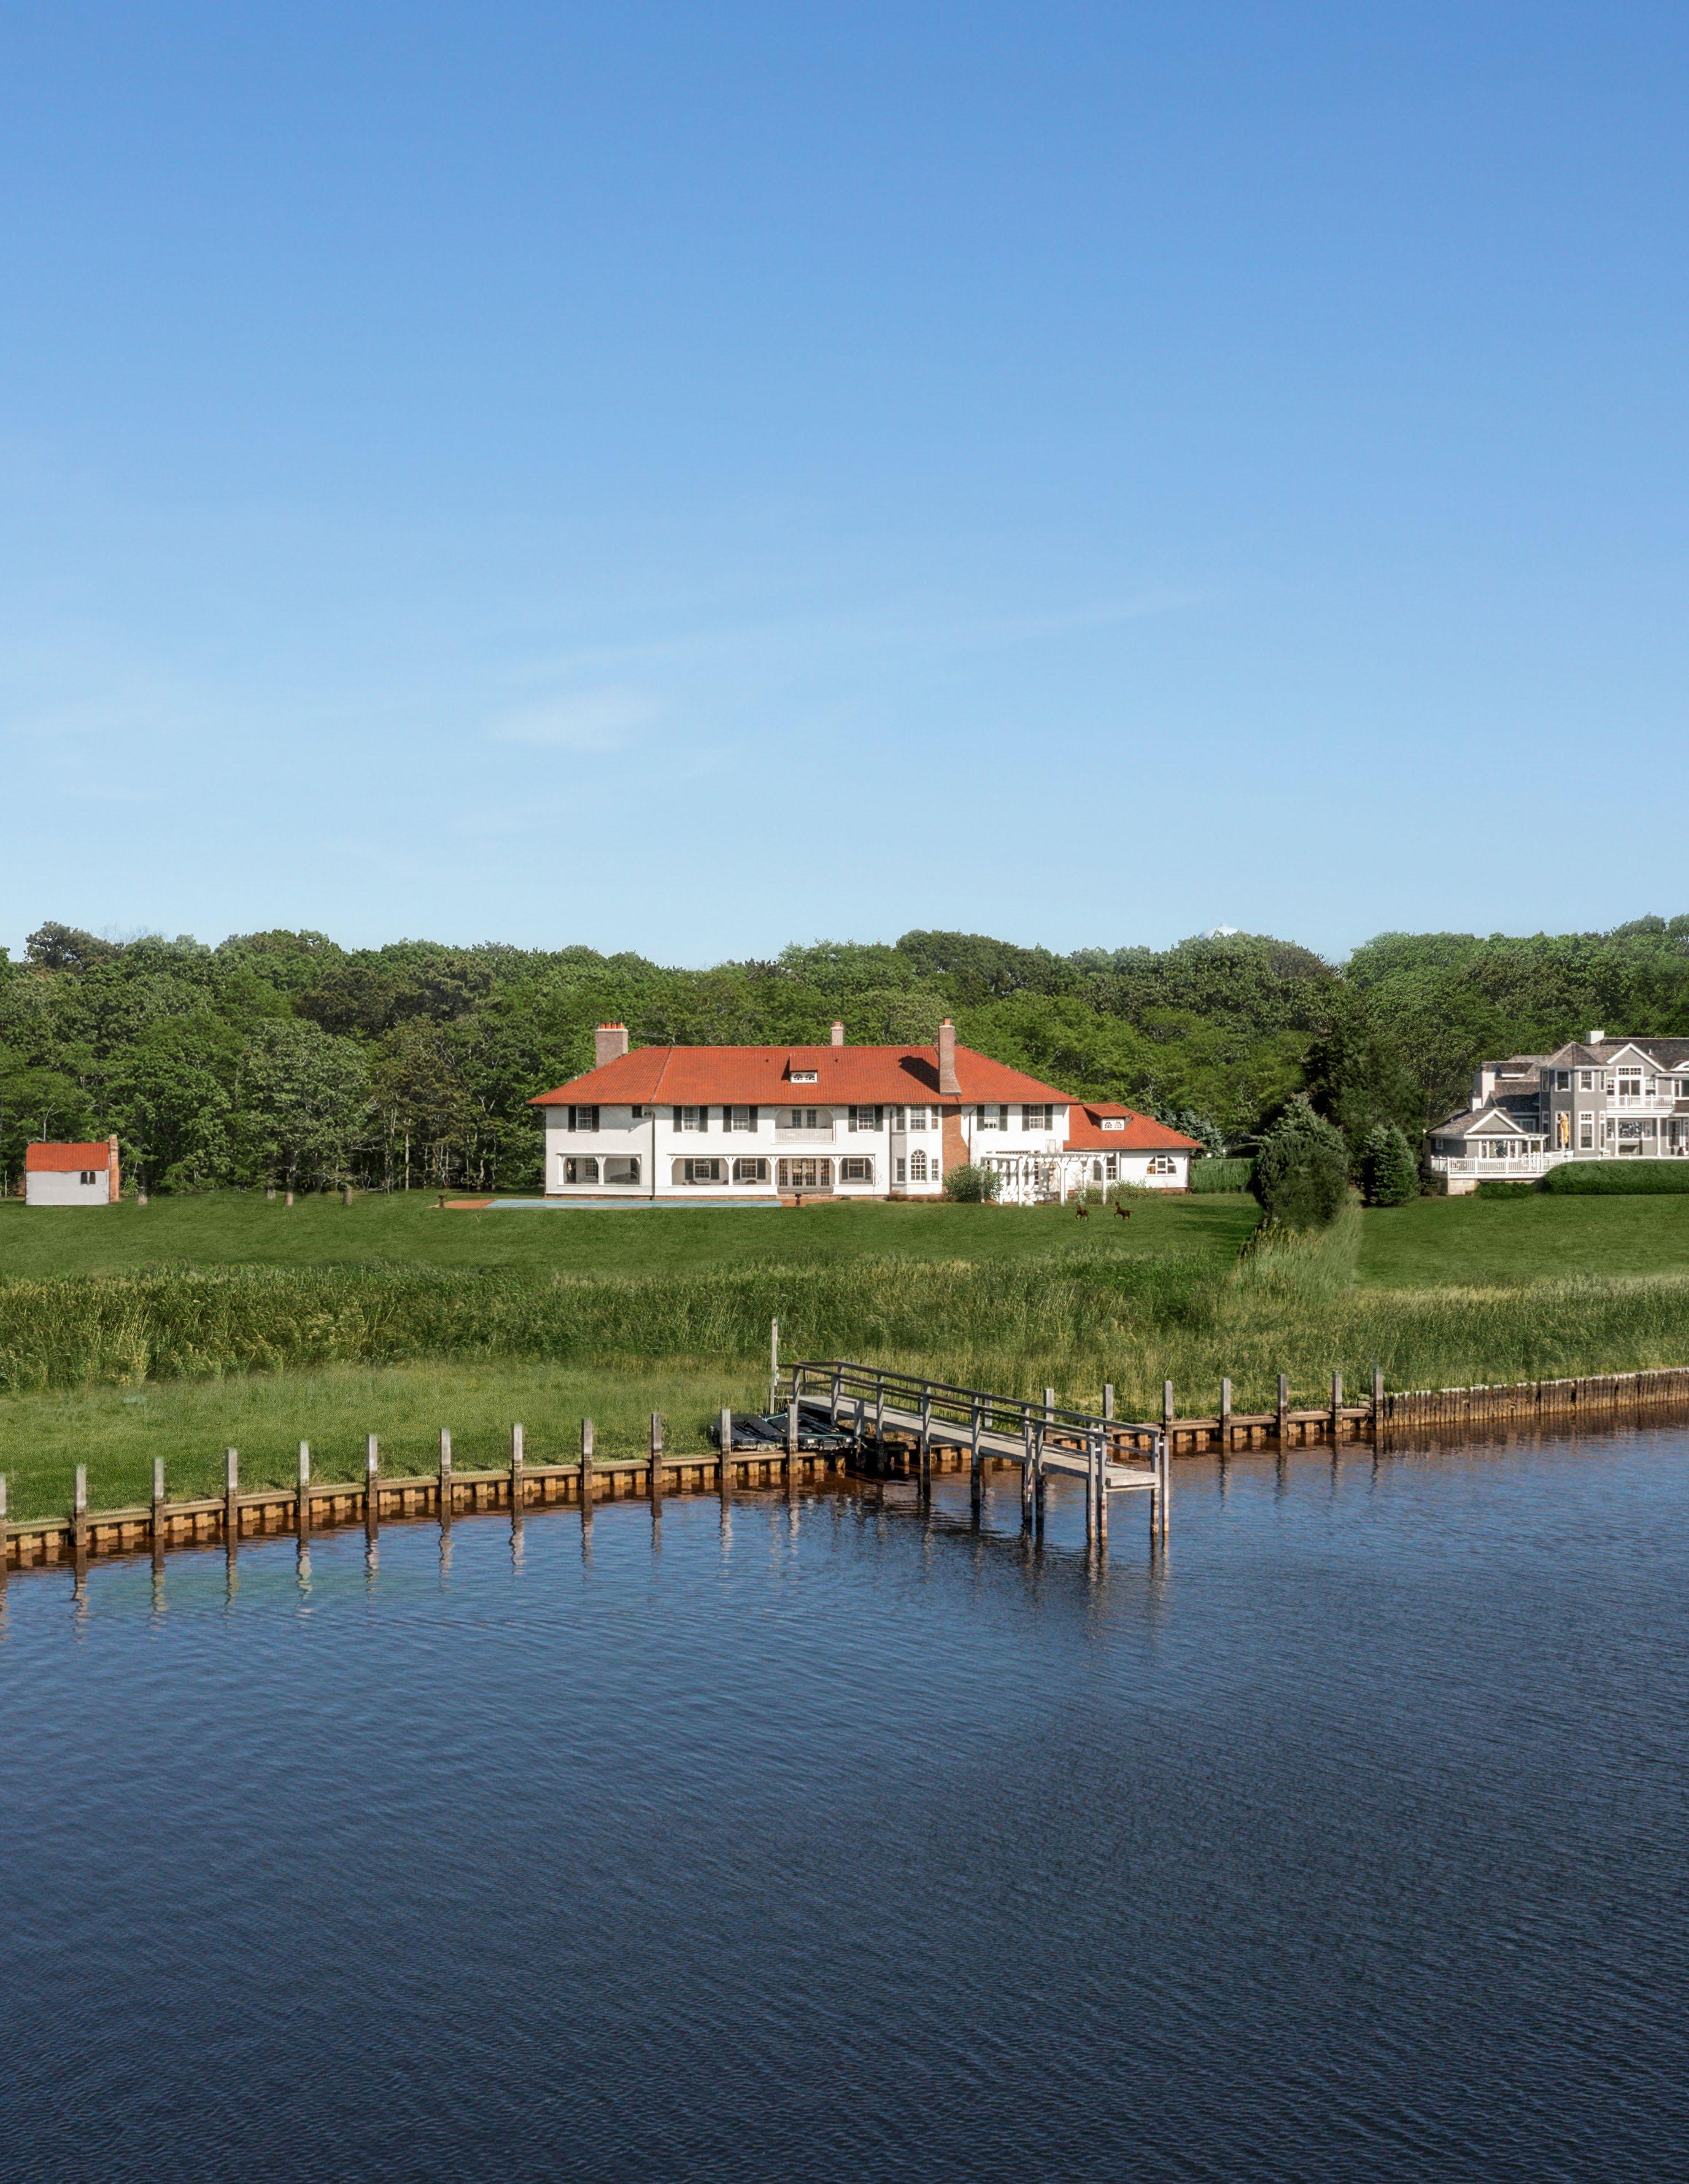
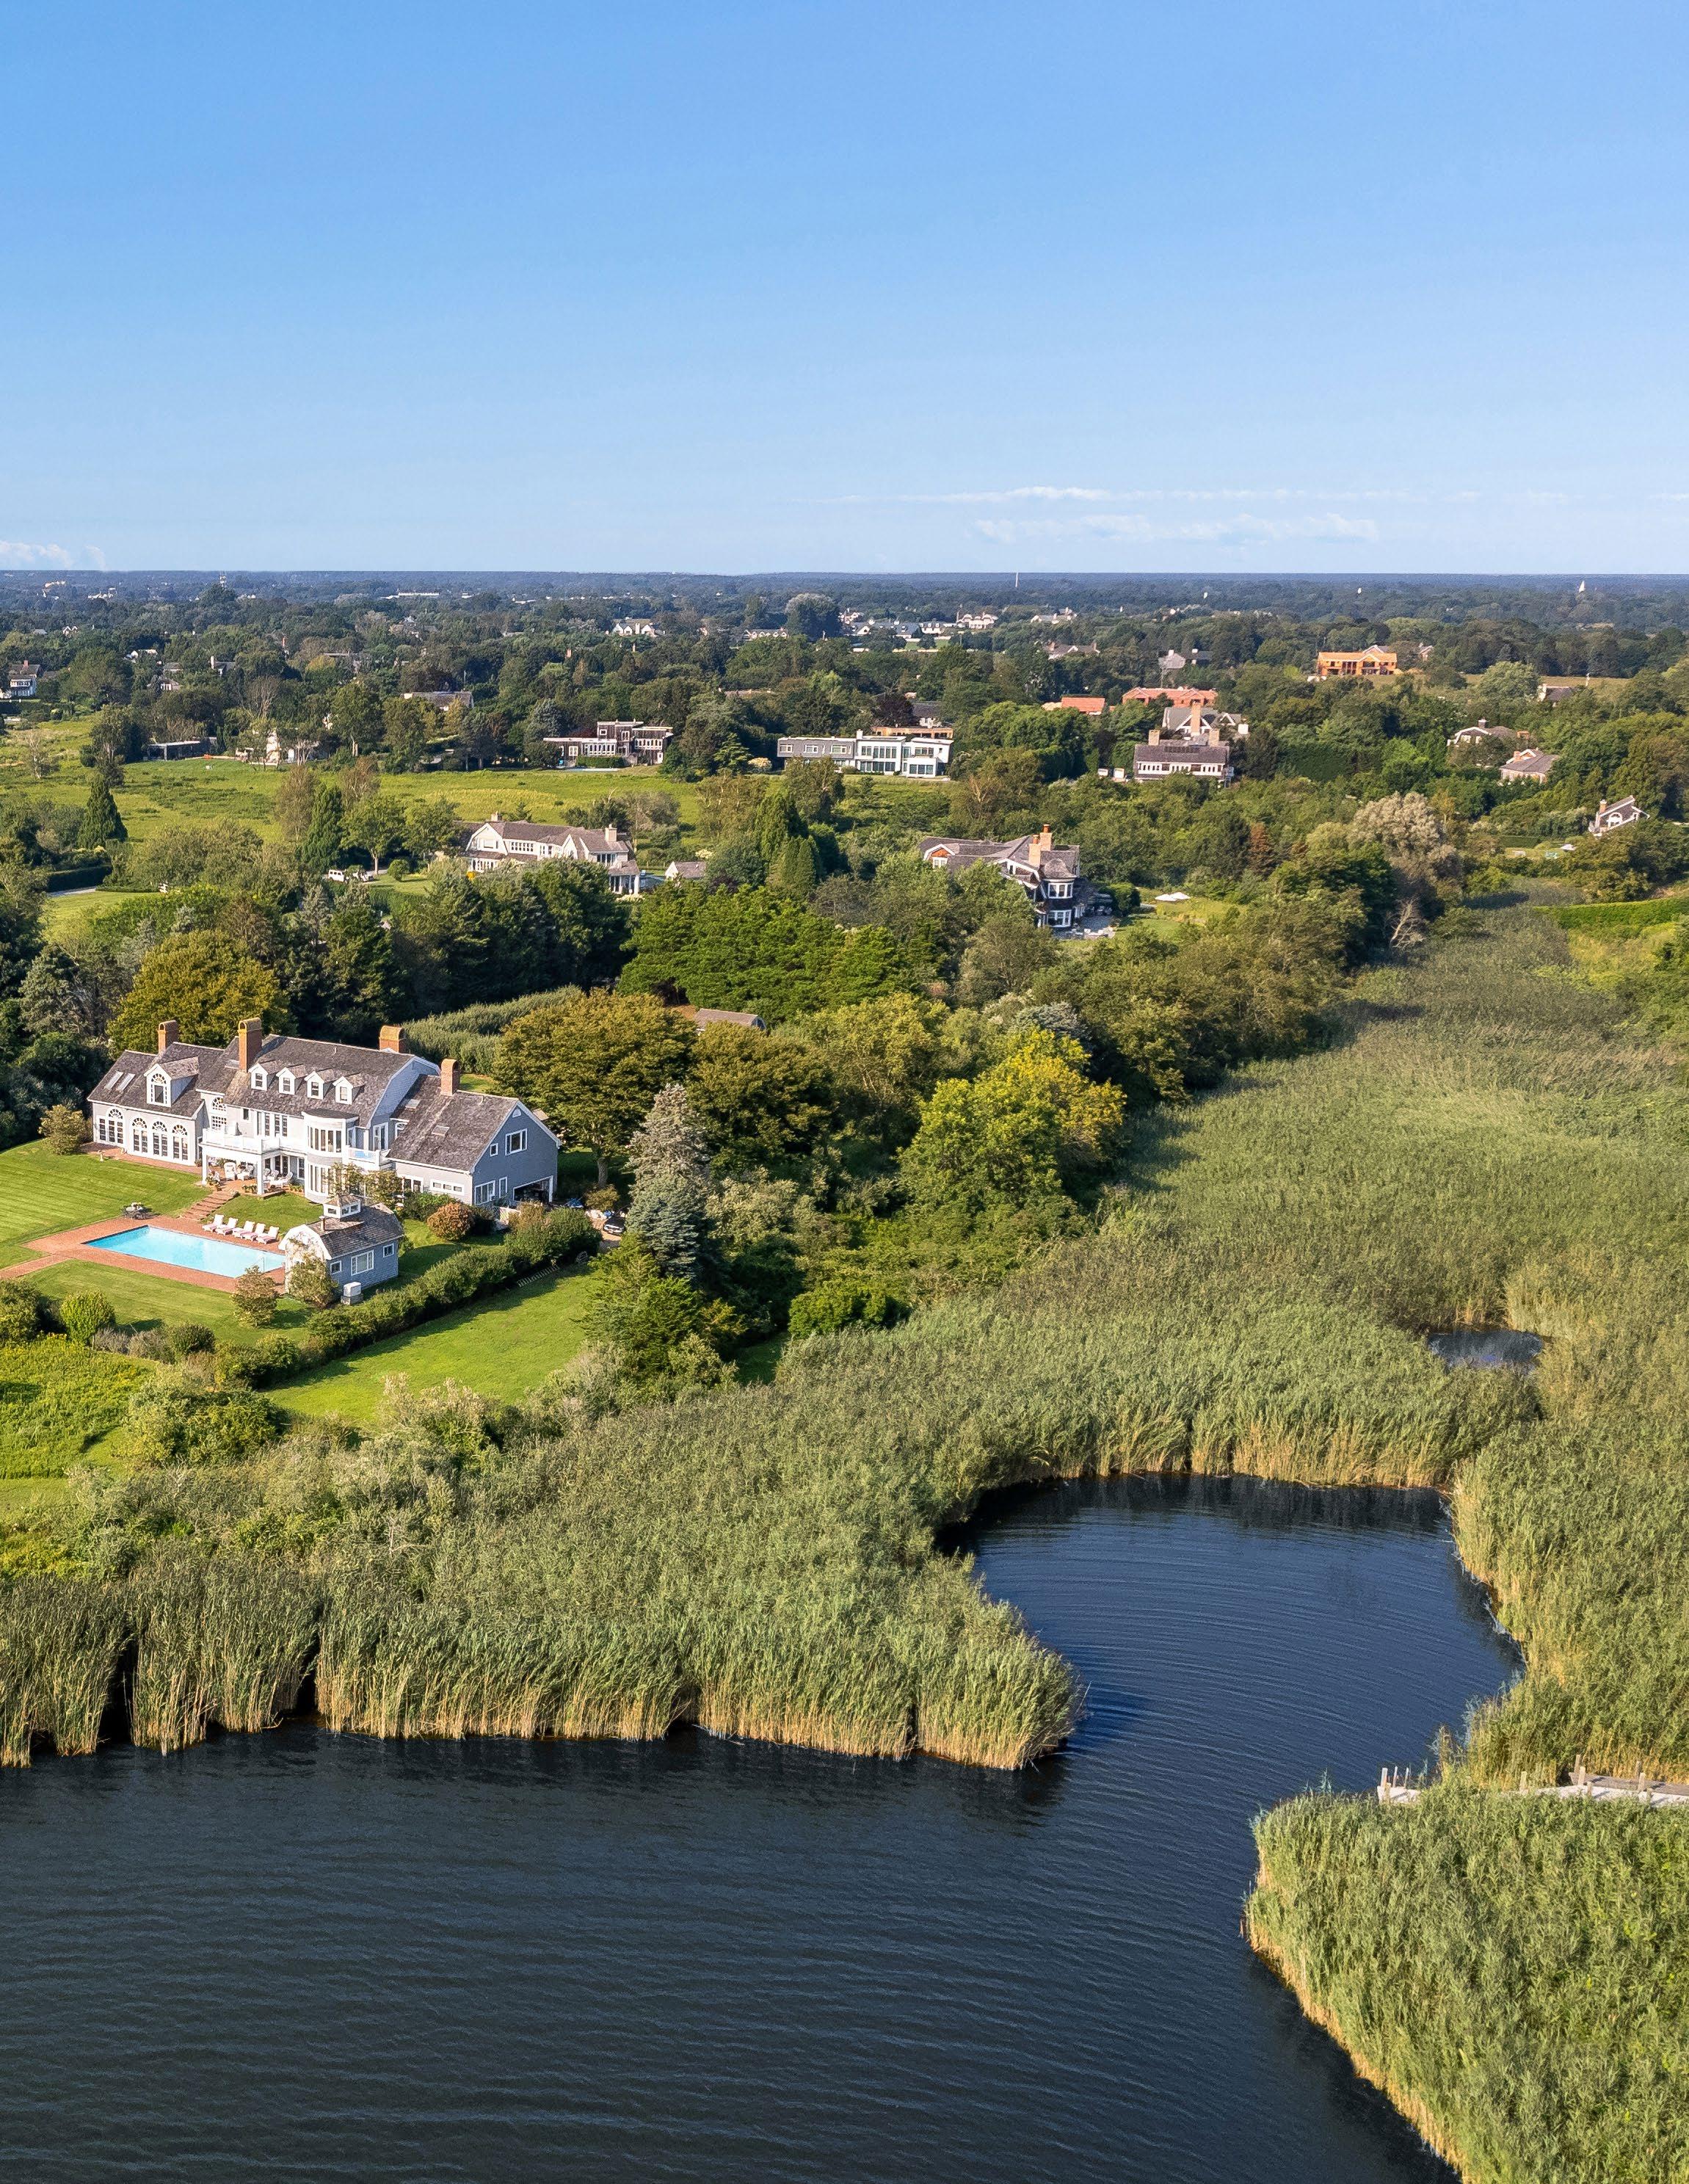
Meadowcroft, Quiogue, NY.
Historic Waterfront Mansion | 6.91 Acres+/7,680 SF+/- | 8 Beds | 7F/1H Baths
Bespoke Exclusive: $11.995M
34 | LUXURY MARKET INSIGHT
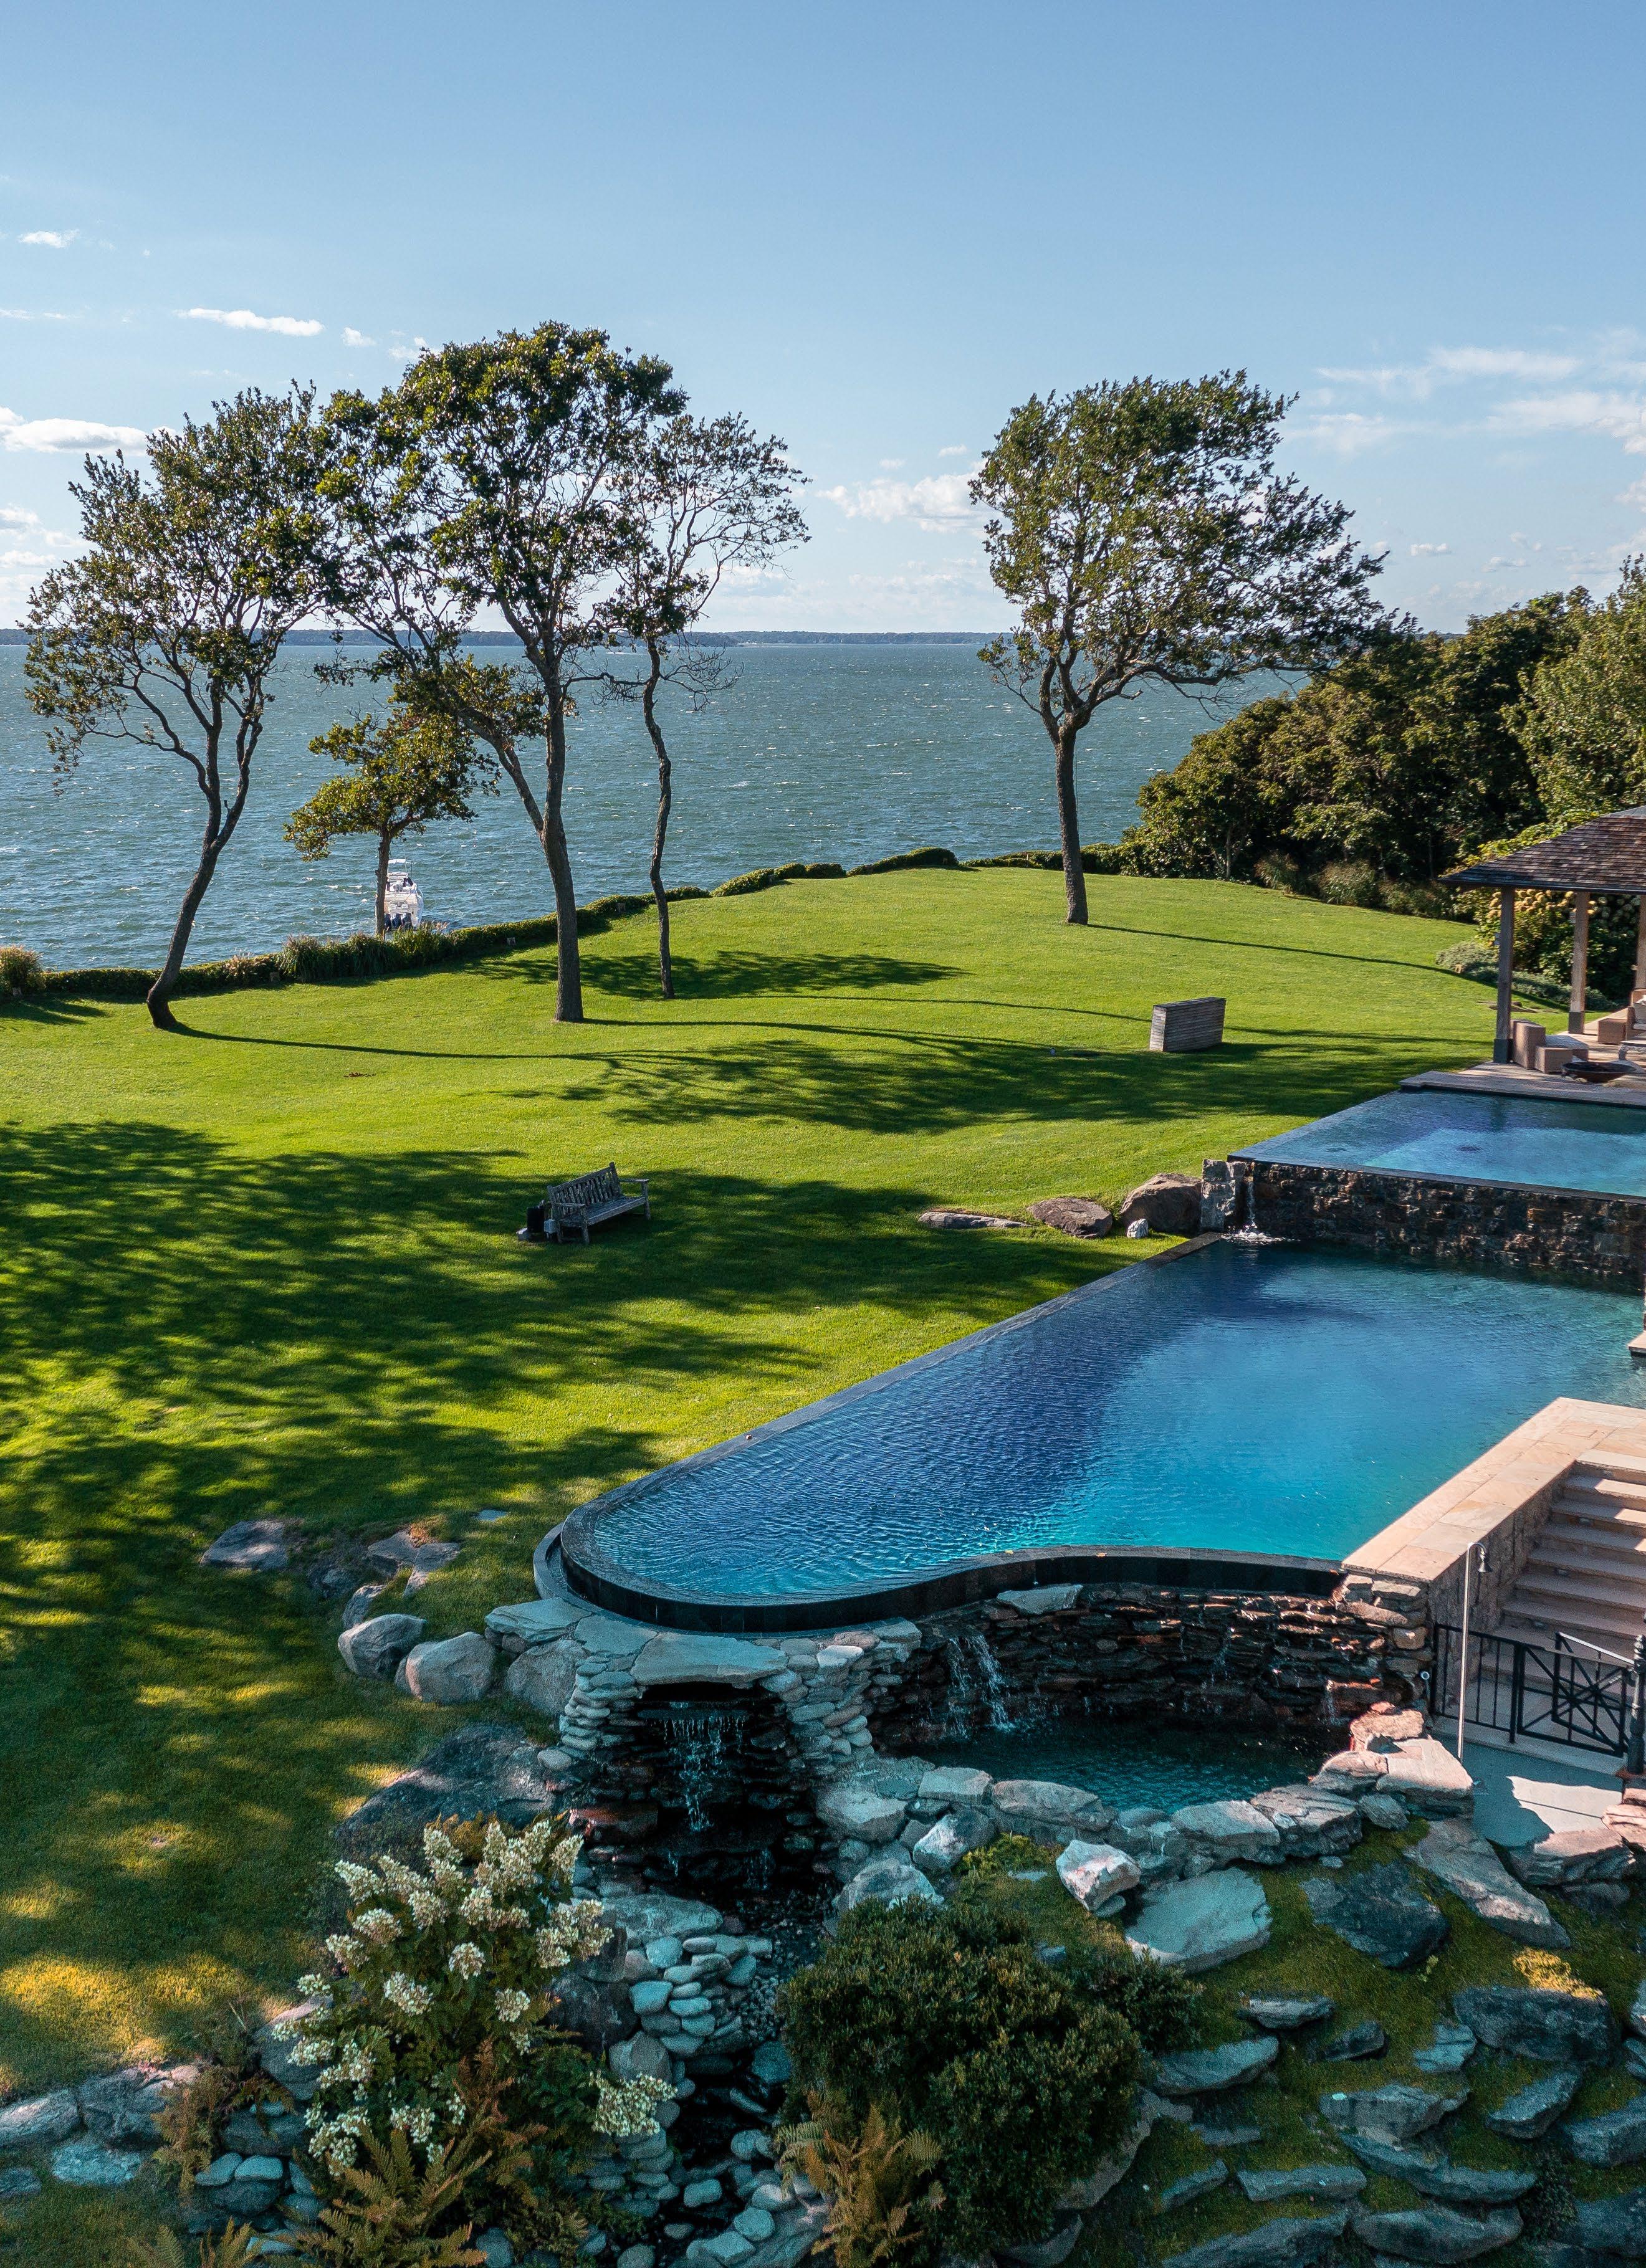
6 Bay View Court, North Haven, NY.
Waterfront Compound | 6.5 Acres+/12,000 SF+/- | 6 Beds | 6F/2H Baths
Bespoke Exclusive: $49M
BESPOKEREALESTATE.COM | 35
MANHATTAN $10M+ MARKET
36 | LUXURY MARKET INSIGHT
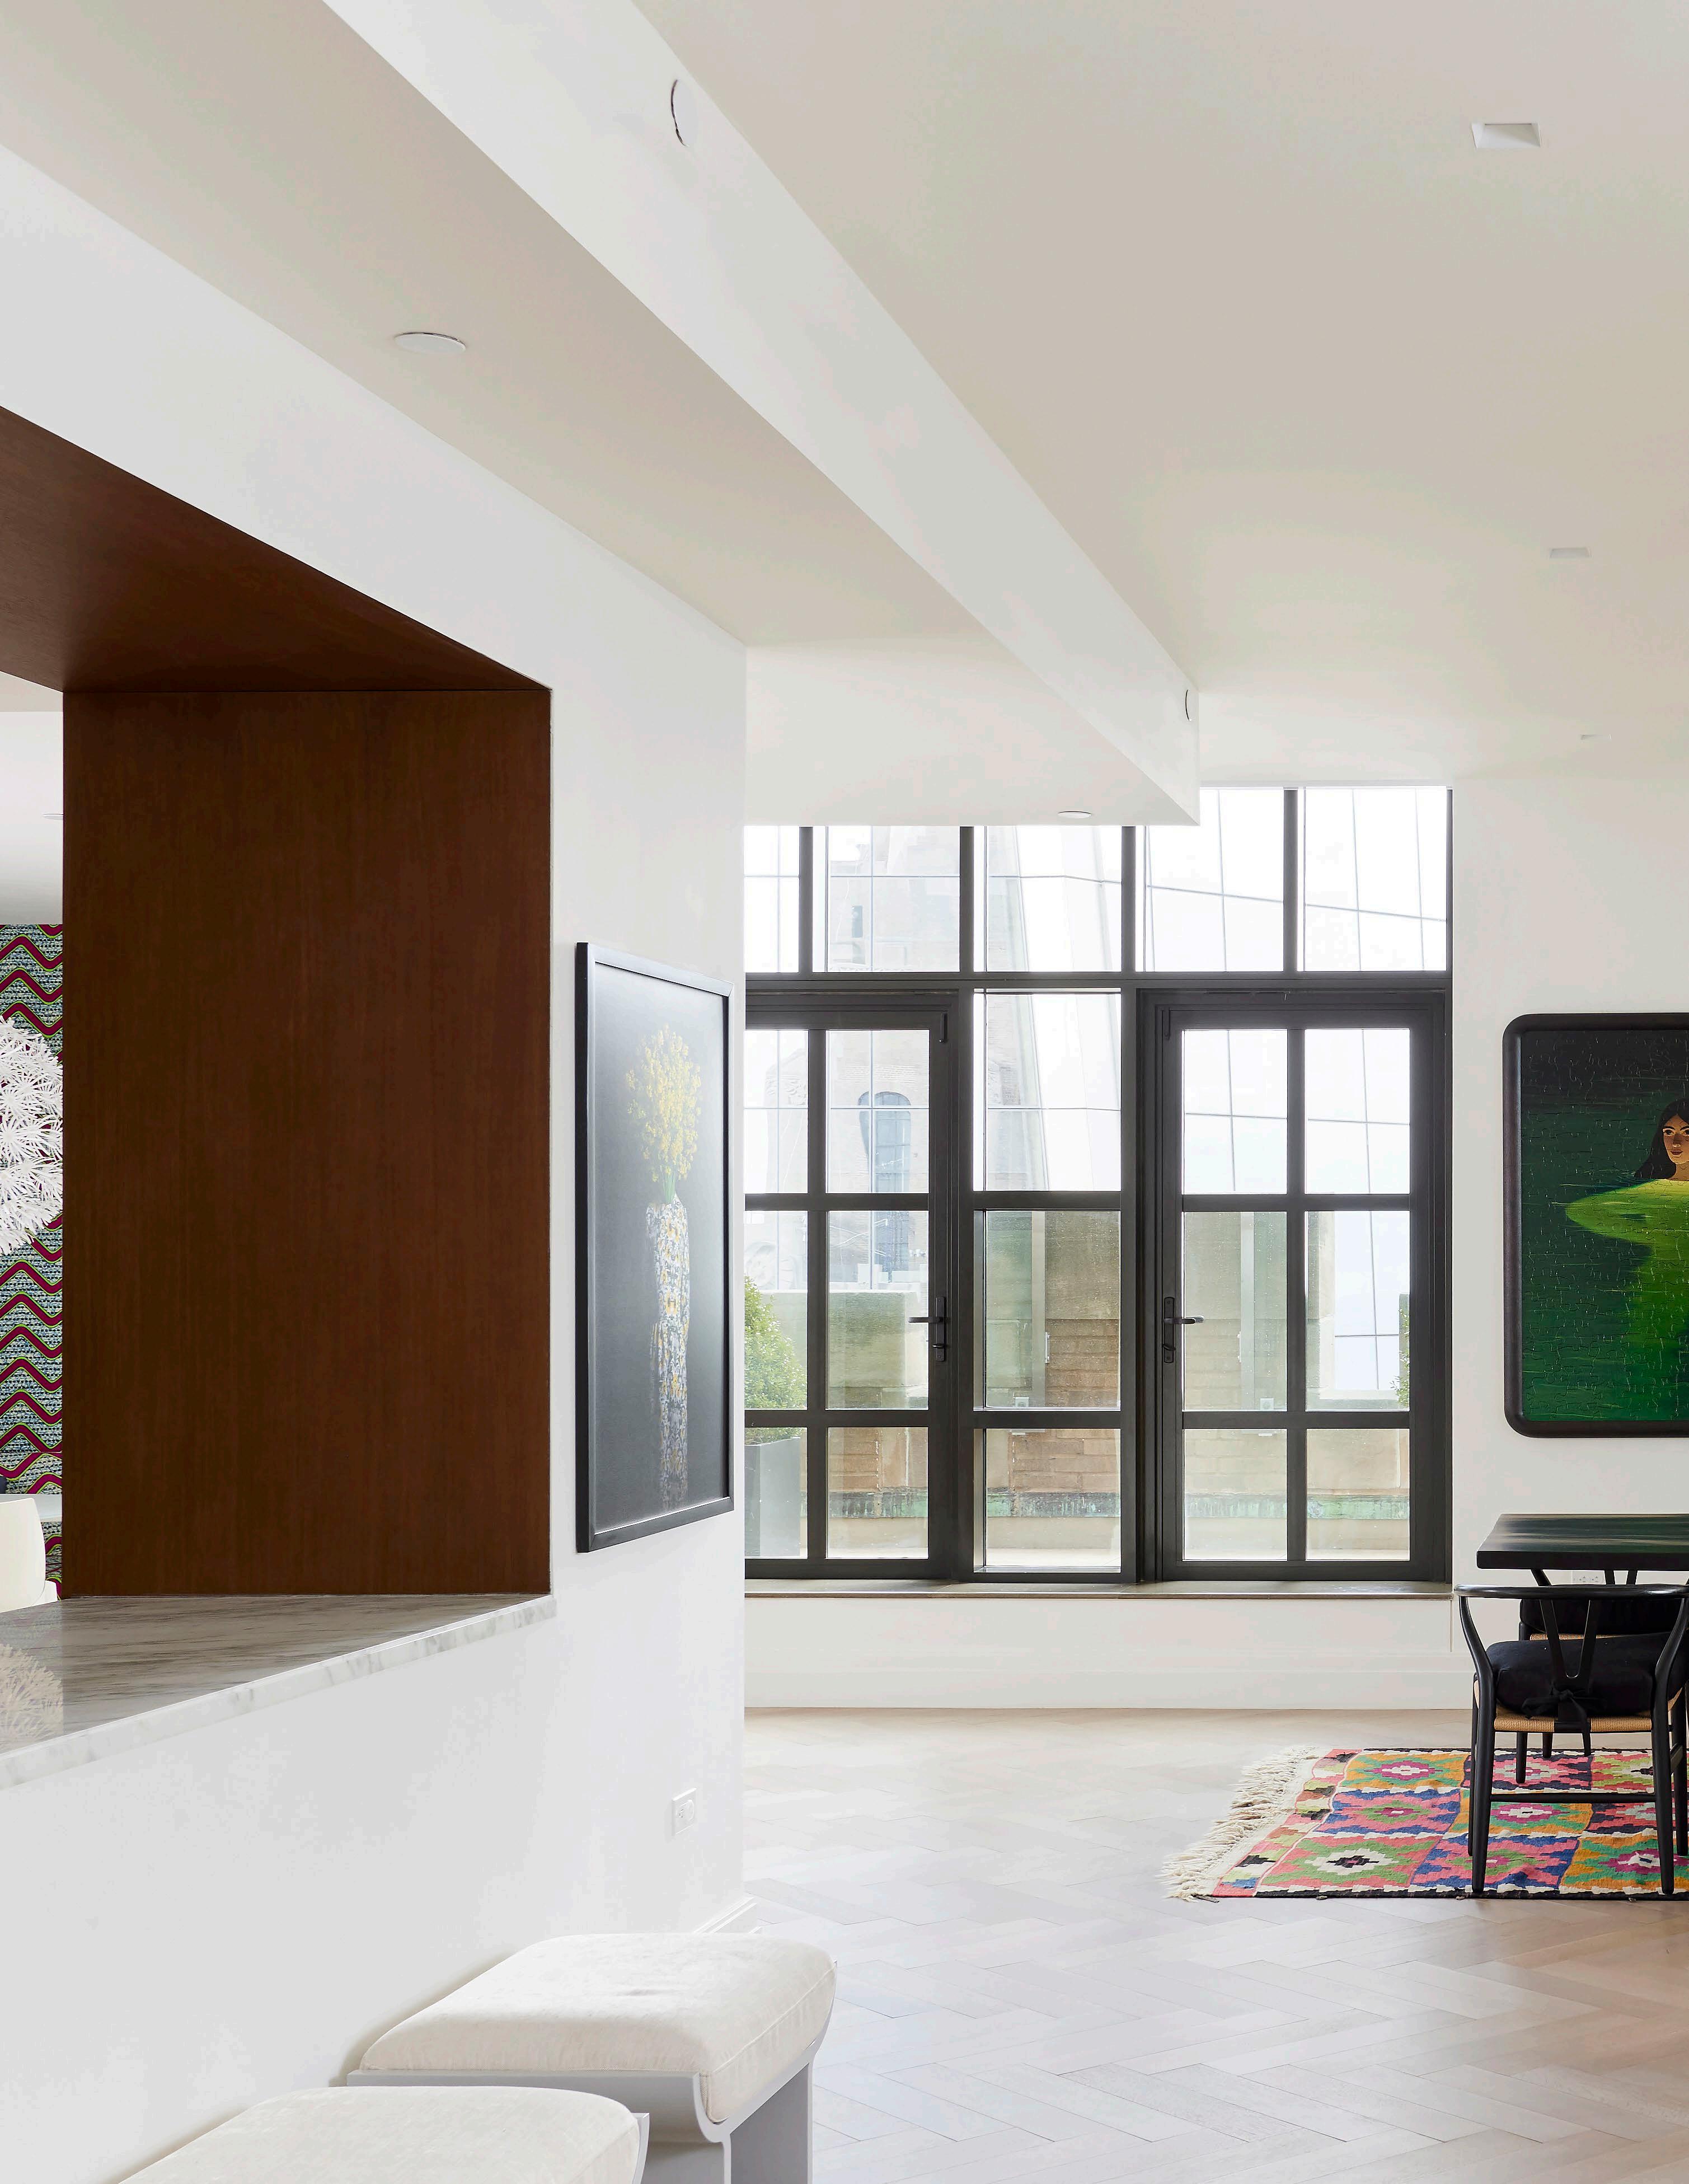
100 Barclay Street, PHB, Tribeca, NY Modern Tribeca Penthouse 5,023 SF+/- | 5 Beds | 5F/1H Baths Bespoke Exclusive: $13.495M BESPOKEREALESTATE.COM | 37
34 TRADES
79 TRADES ↑
The number of first quarter trades rose 132% from 34 in 2021 to 79 in 2022.
Q1 2022 $10M + MANHATTAN MARKET REPORT
2021 2022 Total $10M+ Trades for Q1 2021 & 2022
112
132.4%
38 | LUXURY MARKET INSIGHT
The data shown below includes the 6 of 7 total locations surveyed within the Manhattan $10M+ real estate market for Q1 2021 & 2022
$10M + TOTAL MANHATTAN SALES BY LOCATION
DOWNTOWN EAST 4 TRADES IN 2021 6 TRADES IN 2022 10 MIDTOWN WEST 3 TRADES IN 2021 4 TRADES IN 2022 7 DOWNTOWN WEST 12 TRADES IN 2021 25 TRADES IN 2022 37 UPPER EAST SIDE 10 TRADES IN 2021 30 TRADES IN 2022 40 MIDTOWN EAST 2 TRADES IN 2021 3 TRADES IN 2022 5 UPPER WEST SIDE 3 TRADES IN 2021 11 TRADES IN 2022 14 Q1 2022 TRADES Q1 2021 TRADES BESPOKEREALESTATE.COM | 39

Sales quantity of single family homes grew 140% between Q1 2021 and Q1 2022, from 25 to 60.
40 | LUXURY MARKET INSIGHT
137 Duane Street 3A, Tribeca, NY Turn-Key Loft 5,498 SF+/- | 3 Beds | 4F/1H Baths Bespoke Exclusive: $13.118M BESPOKEREALESTATE.COM | 41
$2B+
First quarter sales volume grew by 63.9% between 2021 and 2022.
Q1 2022 $10M + MANHATTAN MARKET REPORT
Total $10M+ Trade Volume for Q1 2021 & 2022 2021 2022 $713M + $1.2B + ↑ 63.9%
42 | LUXURY MARKET INSIGHT
$10M + TOTAL MANHATTAN SALES BY PRICE POINT
The data shown illustrates the total sales quantity and volume within the ultra-luxury real estate market surveyed within Manhattan for Q1 2021 & 2022
$10M - $20M $315M Q1 2021 $1B Q2 2022 95 $30M - $40M $37M Q1 2021 $100M Q2 2022 4 $20M - $30M $194M Q1 2021 $73M Q2 2022 11 $40M+ $167M Q1 2021 $56M Q2 2022 3 Q1 2022 TRADES Q1 2021 TRADES BESPOKEREALESTATE.COM | 43
44 | LUXURY MARKET INSIGHT
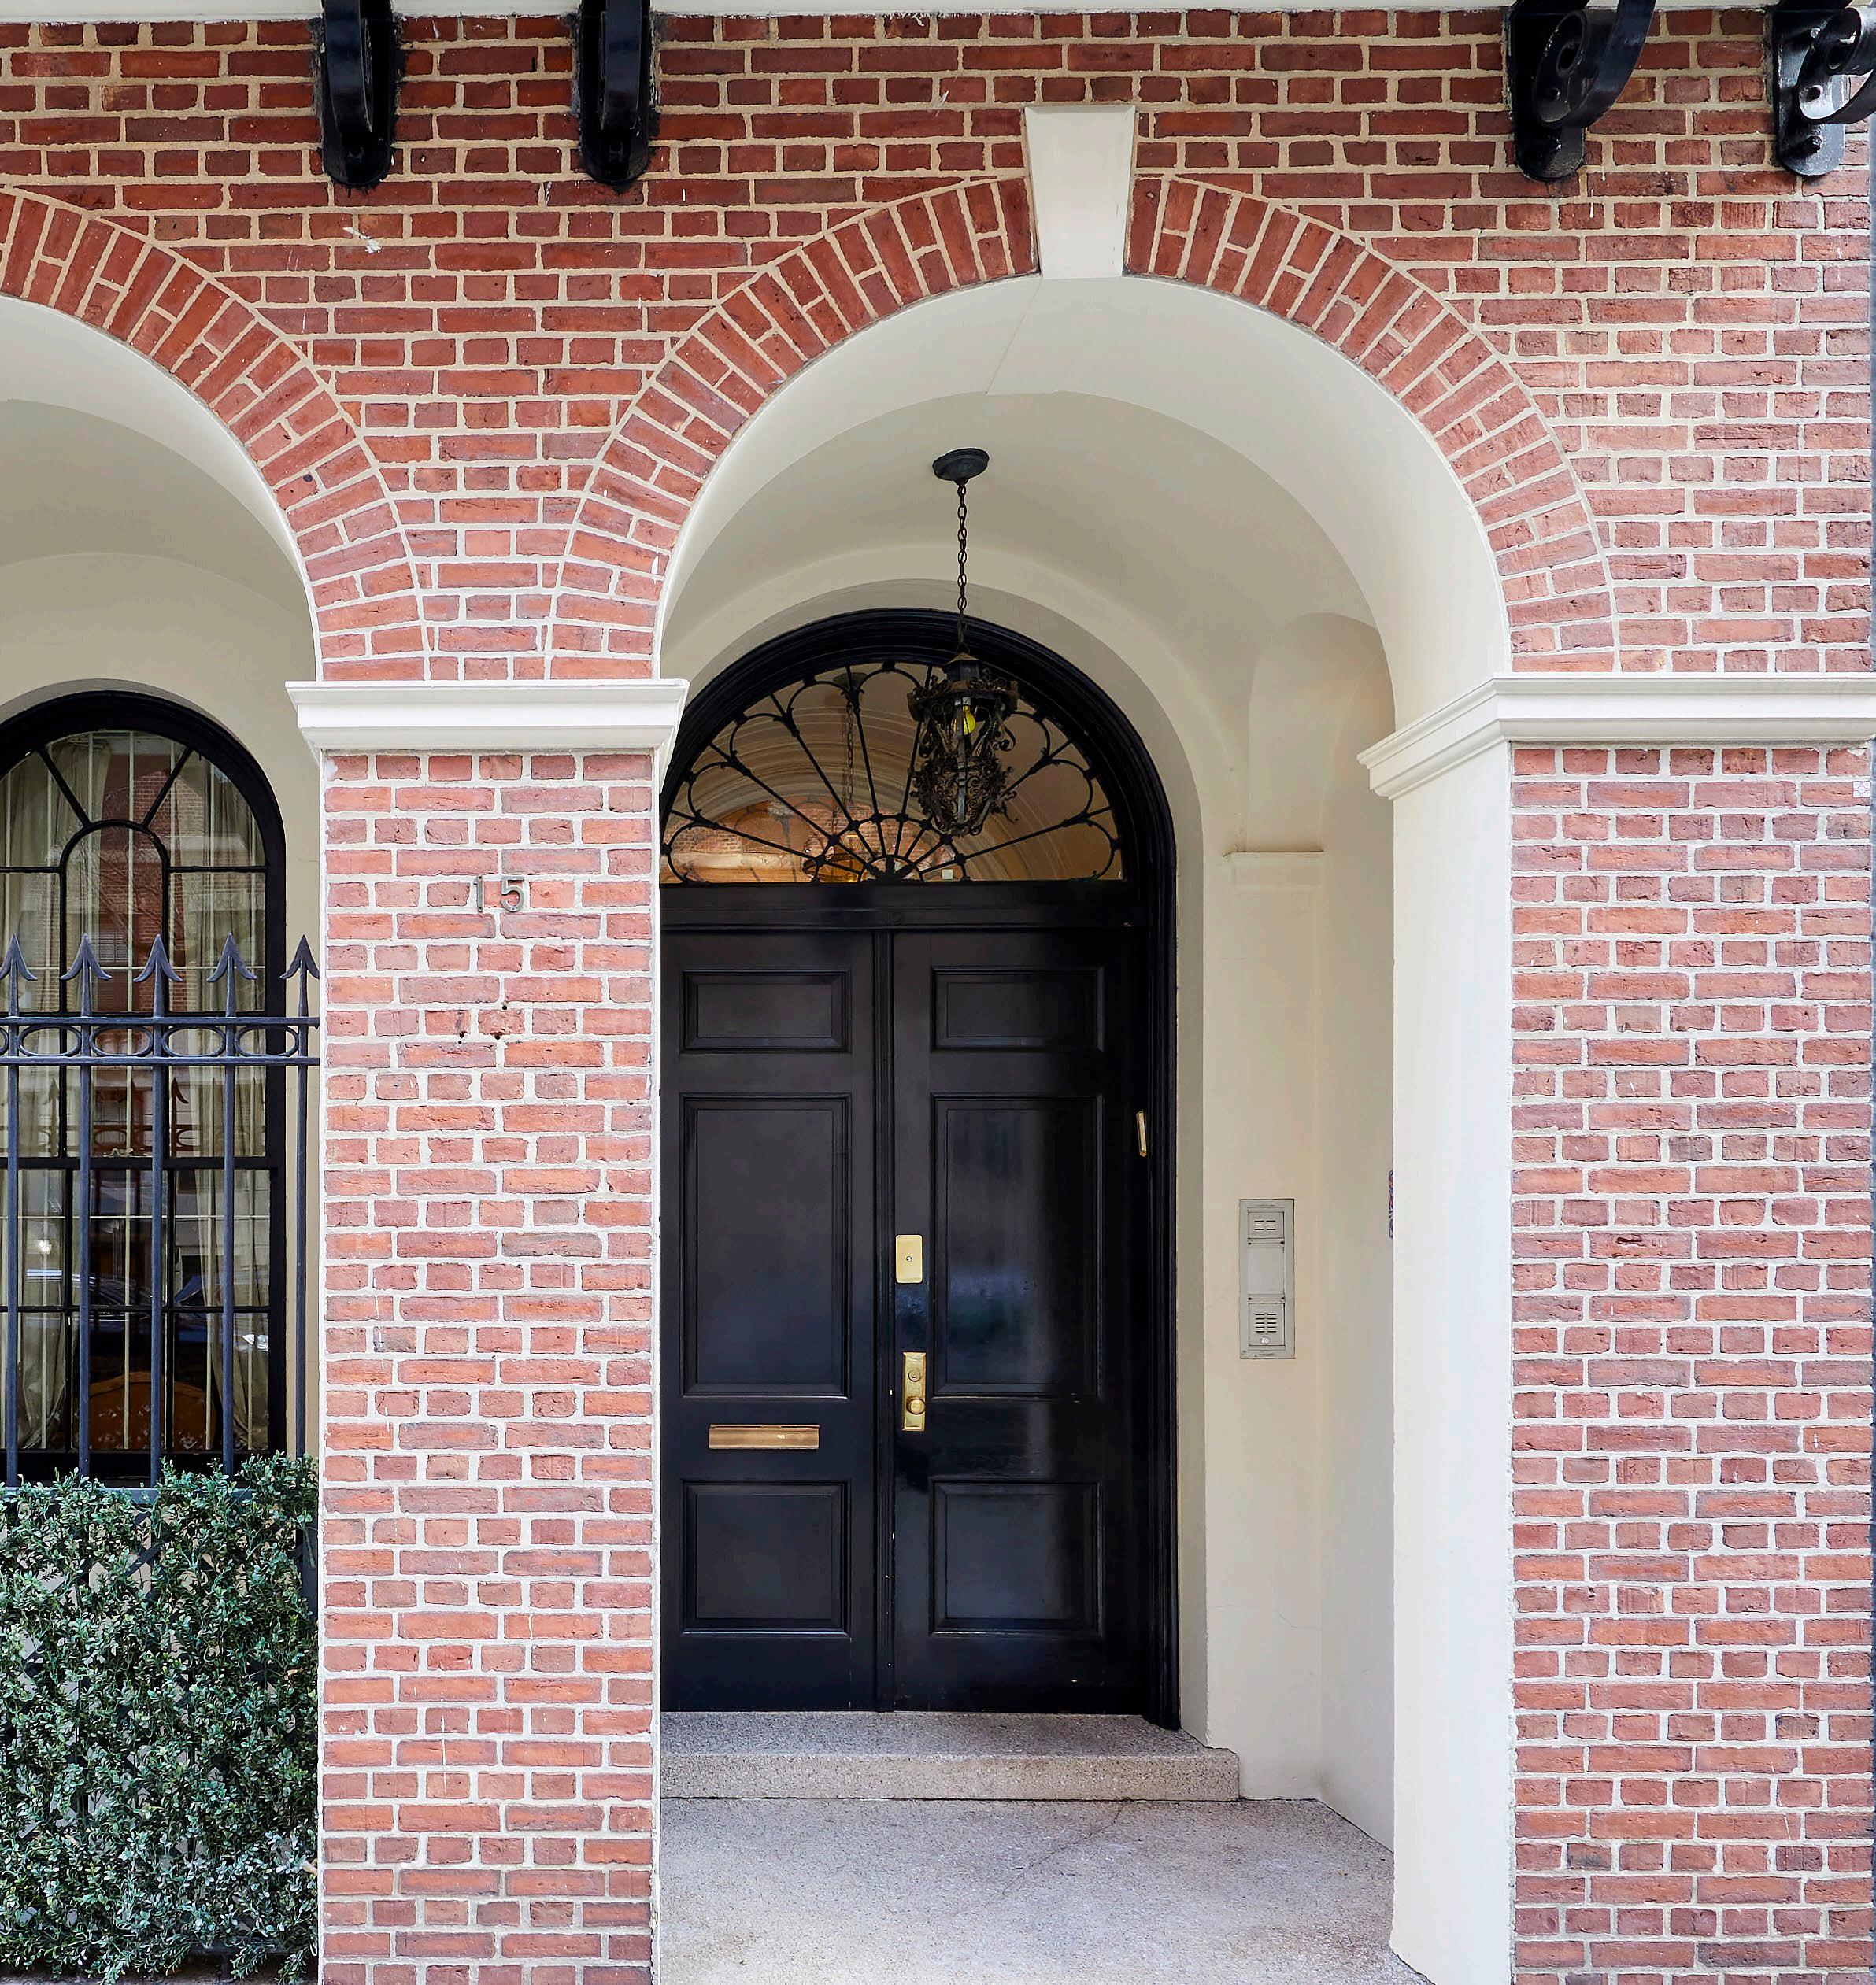
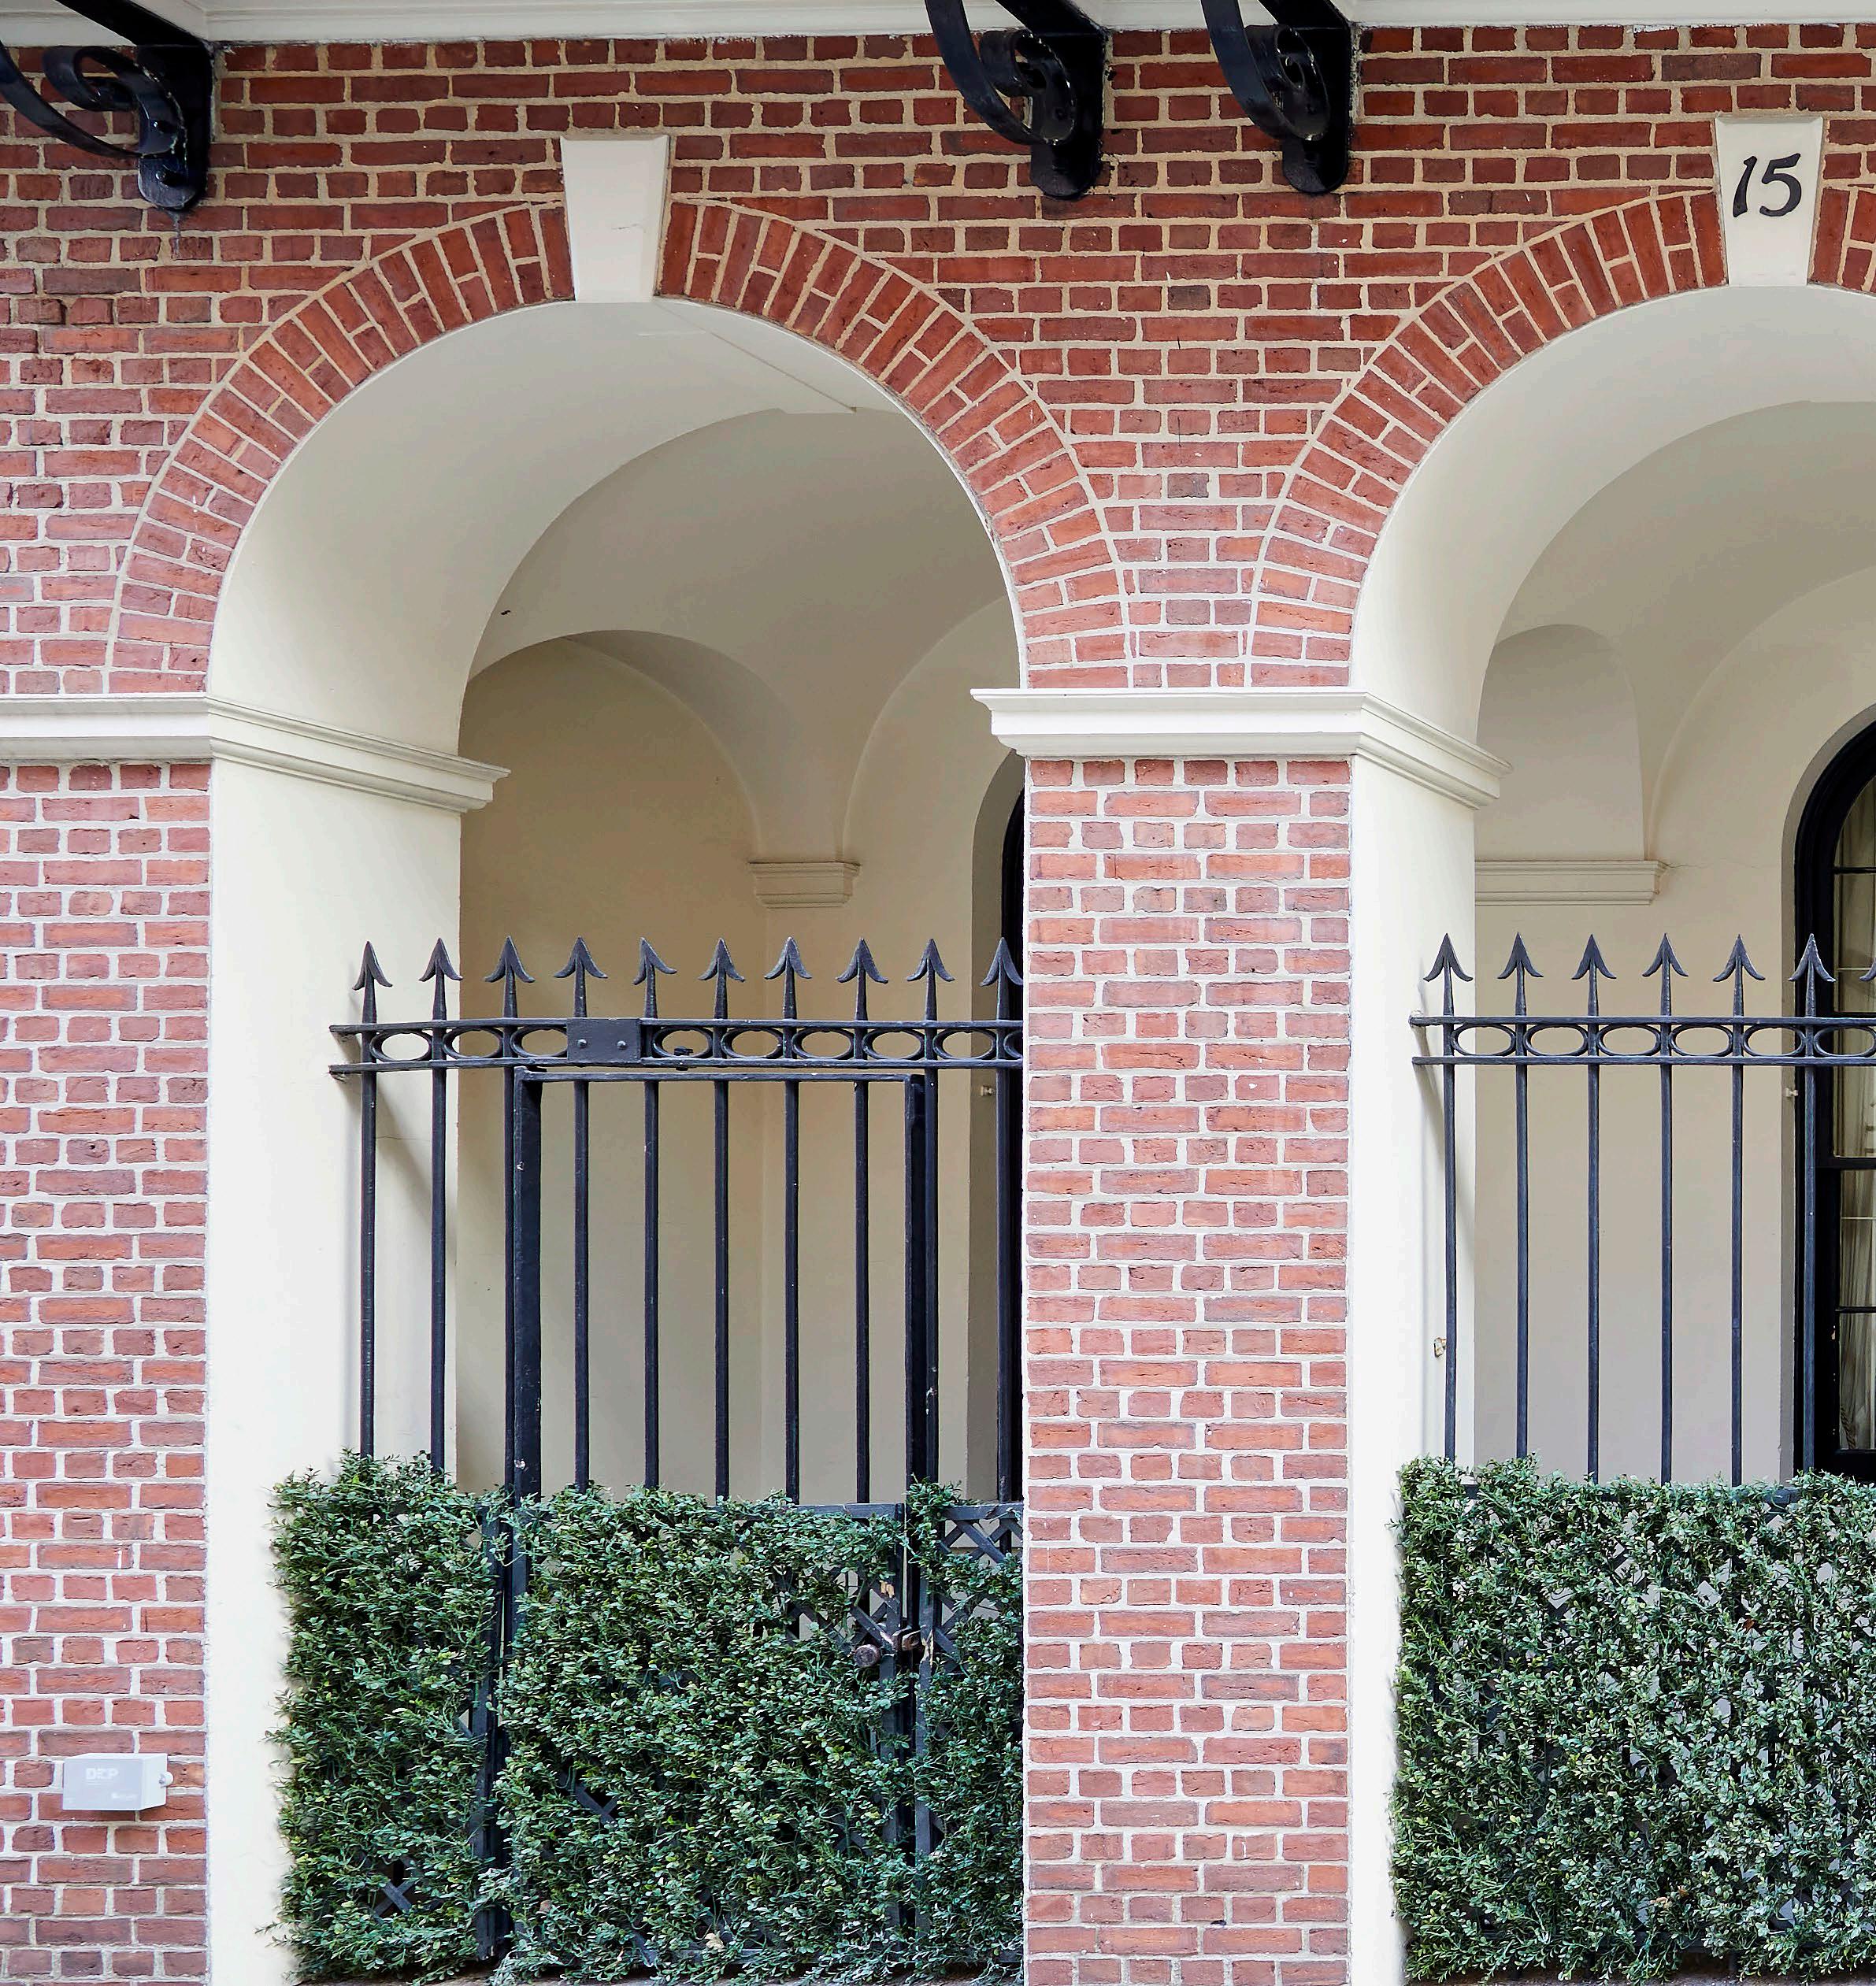
15 East 88th Street, Upper East Side, NY Historic Mansion 9,610 SF+/- | 7 Beds | 7F/2H Baths Bespoke Exclusive: $28.8M BESPOKEREALESTATE.COM | 45
BY TYPE Q1 2021 Q1 2022 LISTINGS VOLUME LISTINGS VOLUME SINGLE FAMILY 25 $419,168,173 60 $837,026,315 TOWNHOUSE 9 $293,992,500 19 $331,657,290 TOTAL 34 $713,160,673 79 $1,168,683,605 BY VINTAGE NEW CONSTRUCTION 6 $92,212,500 26 $332,001,315 TURN-KEY 28 $620,948,173 53 $836,682,290 TOTAL 34 $713,160,673 79 $1,168,683,605 BY PRICE POINT $10M - $20M 23 $315,110,673 72 $939,833,605 $20M - $30M 8 $194,250,000 3 $72,950,000 $30M - $40M 1 $36,800,000 3 $99,900,000 $40M+ 2 $167,000,000 1 $56,000,000 TOTAL 34 $713,160,673 79 $1,168,683,605 Q1 2022 MANHATTAN $10M+ MARKET 46 | LUXURY MARKET INSIGHT
LISTINGS VOLUME LISTINGS VOLUME DOWNTOWN EAST 4 $57,450,000 6 $102,115,305 DOWNTOWN WEST 12 $216,541,500 25 $325,734,675 MIDTOWN EAST 2 $39,333,298 3 $41,000,000 MIDTOWN WEST 3 $38,965,875 4 $54,383,831 UPPER EAST SIDE 10 $305,625,000 30 $486,584,583 UPPER WEST SIDE 3 $56,245,000 11 $158,865,211 TOTAL 34 $713,160,673 79 $1,168,683,605 BY LOCATION Q1 2021 Q1 2022 BESPOKEREALESTATE.COM | 47

1 W 72nd Street #82-84, New York, NY Historic Central Park West Residence 6,000 SF+/- | 5 Beds | 9 Baths Bespoke Co-Exclusive: $20M 48 | LUXURY MARKET INSIGHT

The Upper West Side continues to lead sales growth, nearly tripling sales volume from $56.3M in Q1 2021 to $156.9M in Q1 2022.
BESPOKEREALESTATE.COM | 49

SOUTH FLORIDA
$10M+ MARKET
50 | LUXURY MARKET INSIGHT

Waldorf Astoria Miami, Miami, FL. Bespoke Exclusive Collection Price Upon Request BESPOKEREALESTATE.COM | 51
89 TRADES
94 TRADES
The number of first quarter trades rose 5.6%, from 89 in 2021 to 94 in 2022.
Q1 2022 $10M + SOUTH FLORIDA MARKET REPORT
2021 2022 Total $10M+ Trades for Q1 2021 & 2022
183
↑ 5.6%
52 | LUXURY MARKET INSIGHT
The data shown illustrates the total sales quantity and volume within the ultraluxury real estate market surveyed within South Florida for Q1 2021 & 2022
$10M + TOTAL SOUTH FLORIDA SALES BY LOCATION
PALM BEACH COUNTY 26 TRADES IN 2021 38 TRADES IN 2022 64 MIAMI-DADE COUNTY 63 TRADES IN 2021 56 TRADES IN 2022 119 Q1 2022 TRADES Q1 2021 TRADES BESPOKEREALESTATE.COM | 53
54 | LUXURY MARKET INSIGHT
121 Nurmi Drive, Fort Lauderdale, FL Modern New Construction 6,447 SF+/- | 3 Beds | 4F/2H Baths Bespoke Exclusive: $9.775M
of Q1 2022 sales volume fell in the $10 to $20 million range. BESPOKEREALESTATE.COM | 55
48%
$3.3B+
The number of first quarter trades declined 3.5% between 2021 and 2022.
Q1 2022 $10M + SOUTH FLORIDA MARKET REPORT
Total $10M+ Trade Volume for Q1 2021 & 2022 2021 2022 $1.7B + $1.6B + ↓ 3.5%
56 | LUXURY MARKET INSIGHT
The data shown illustrates the total sales quantity and volume within the ultra-luxury real estate market surveyed within South Florida or Q1 2021 & 2022
$10M + TOTAL SOUTH FLORIDA SALES BY PRICE POINT
$10M - $20M $906M Q1 2021 $775M Q2 2022 134 $30M - $40M $38M Q1 2021 $269M Q2 2022 9 $20M - $30M $419M Q1 2021 $413M Q2 2022 32 $40M + $311M Q1 2021 $158M Q2 2022 8 Q1 2022 TRADES Q1 2021 TRADES BESPOKEREALESTATE.COM | 57
The average sales price in Q1 2022 was $17.2 million.
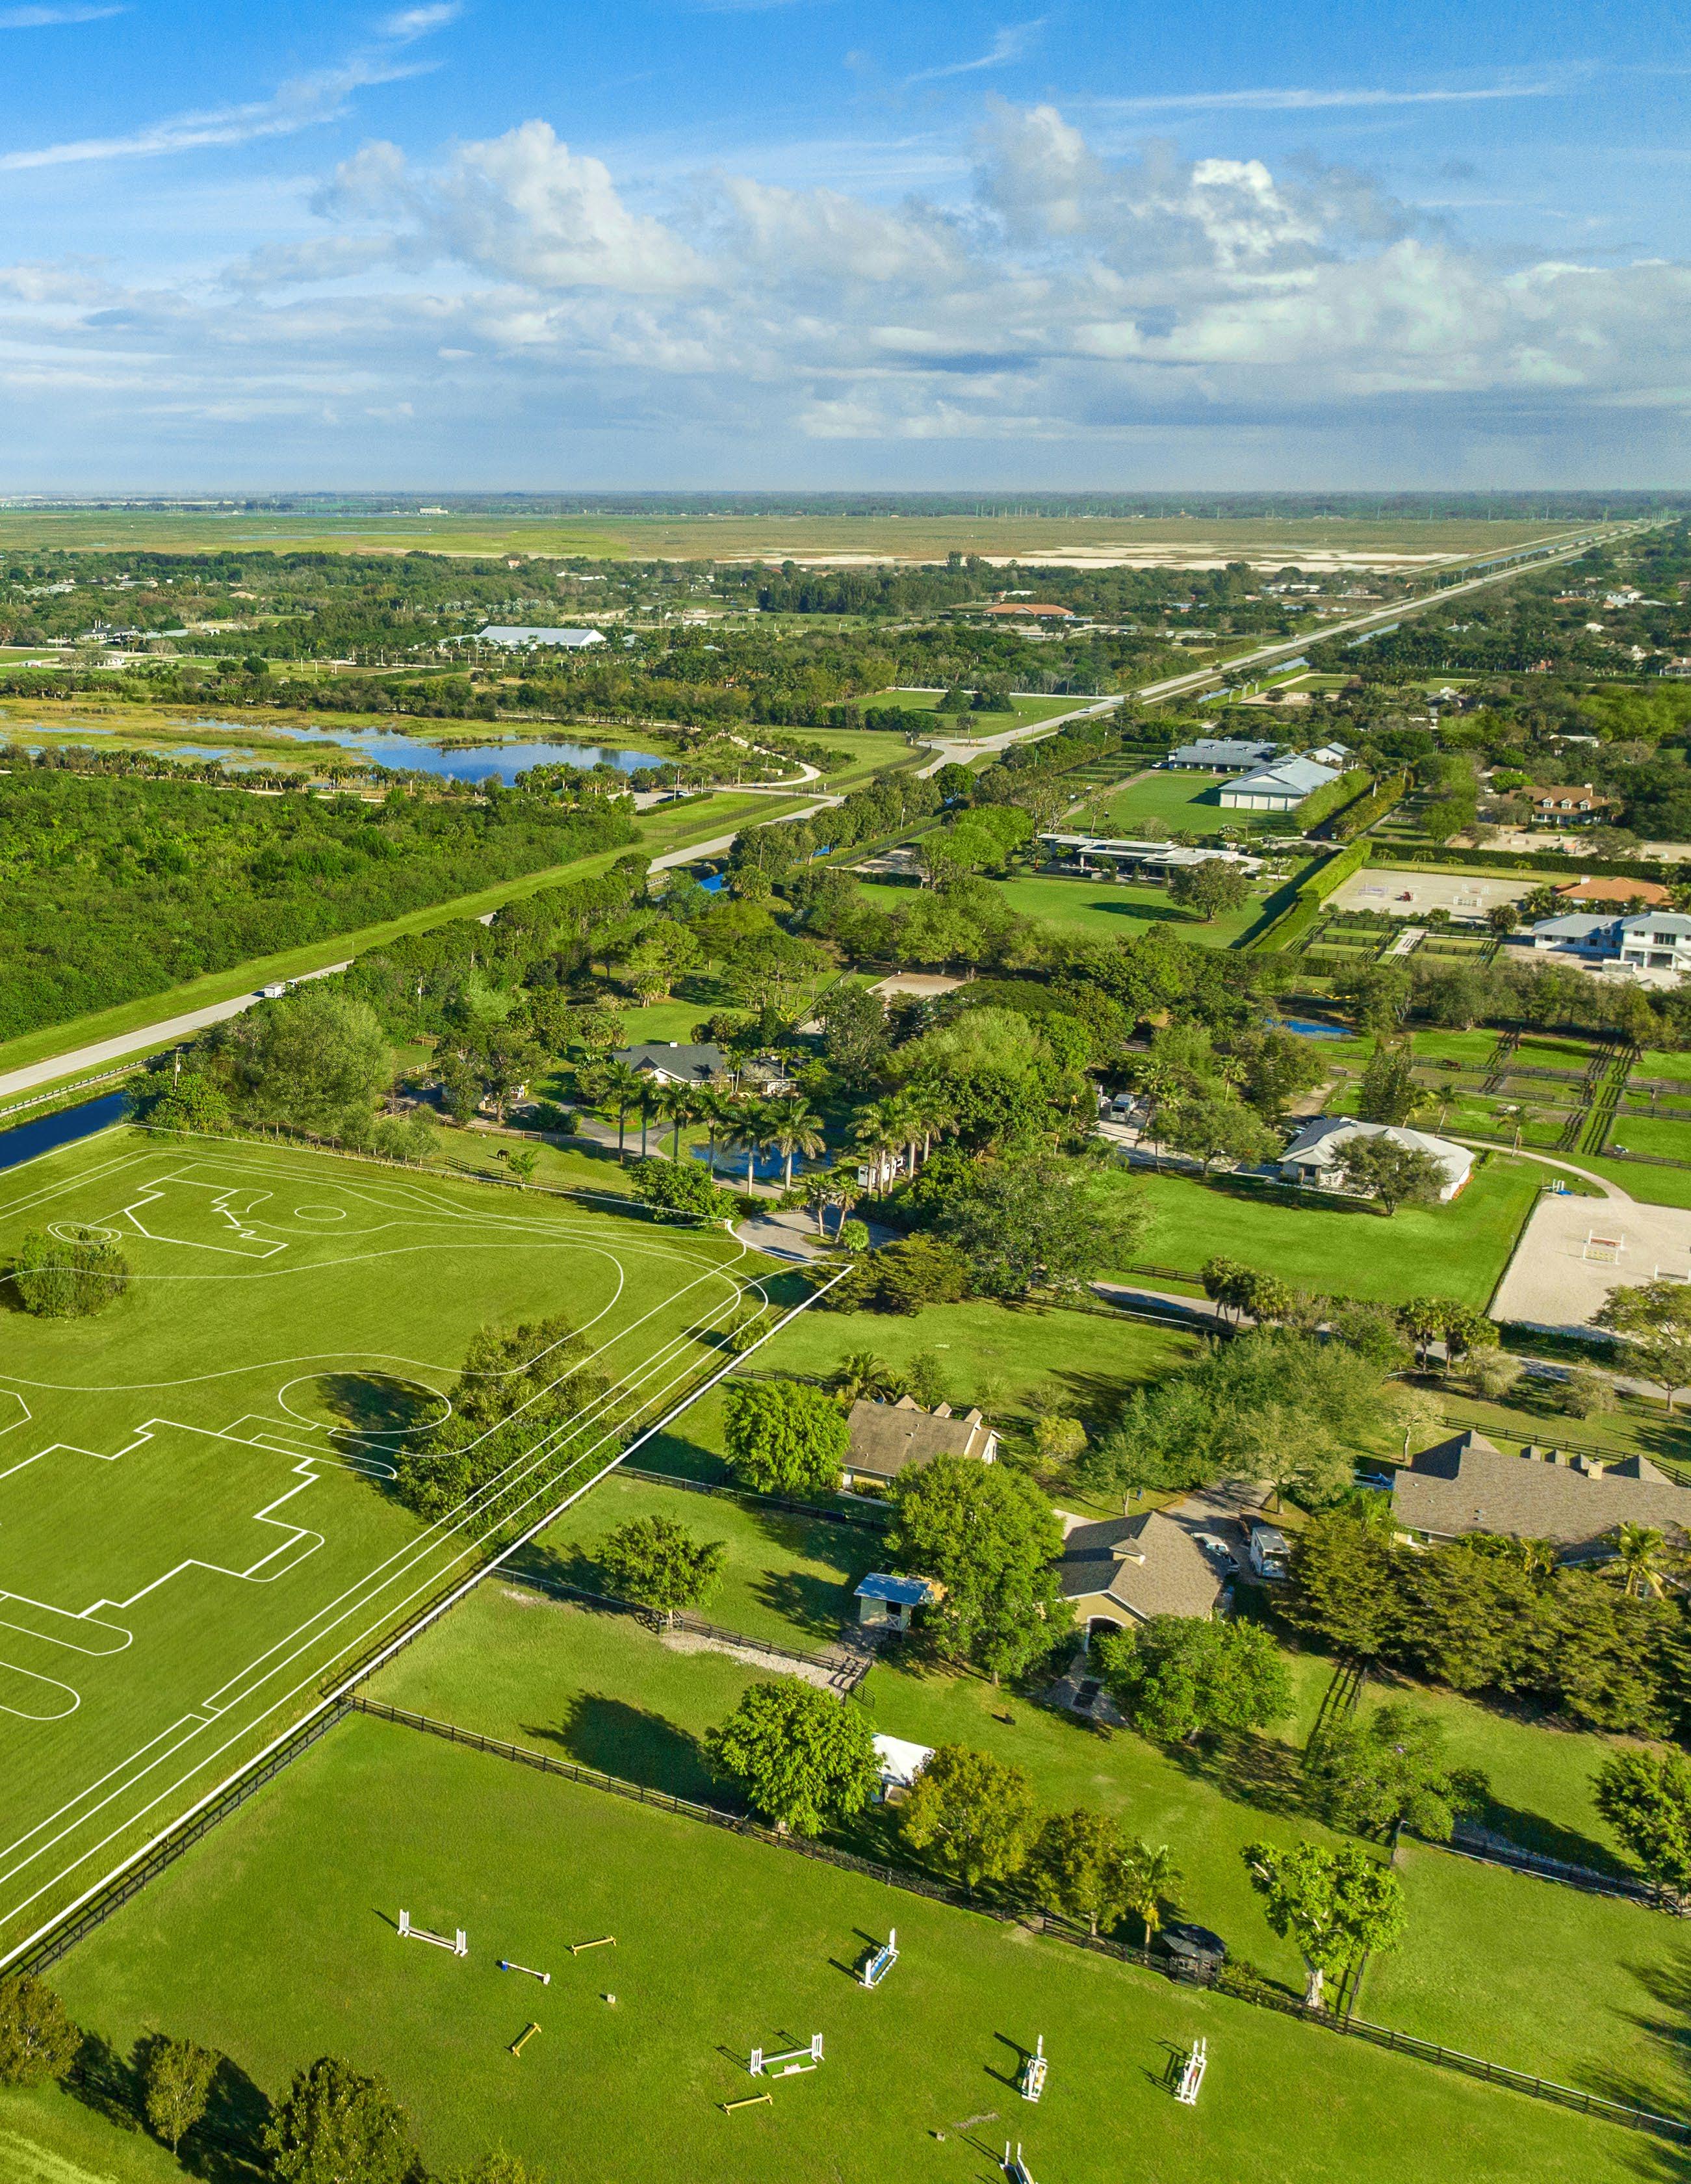
ENVIRONMENTAL PRESERVE 365 ACRES+/-
BRIDLE PATH (4)GRASS PADDOCKS 30’X50’
SAND RING 132’ X 230’
GAZEBO
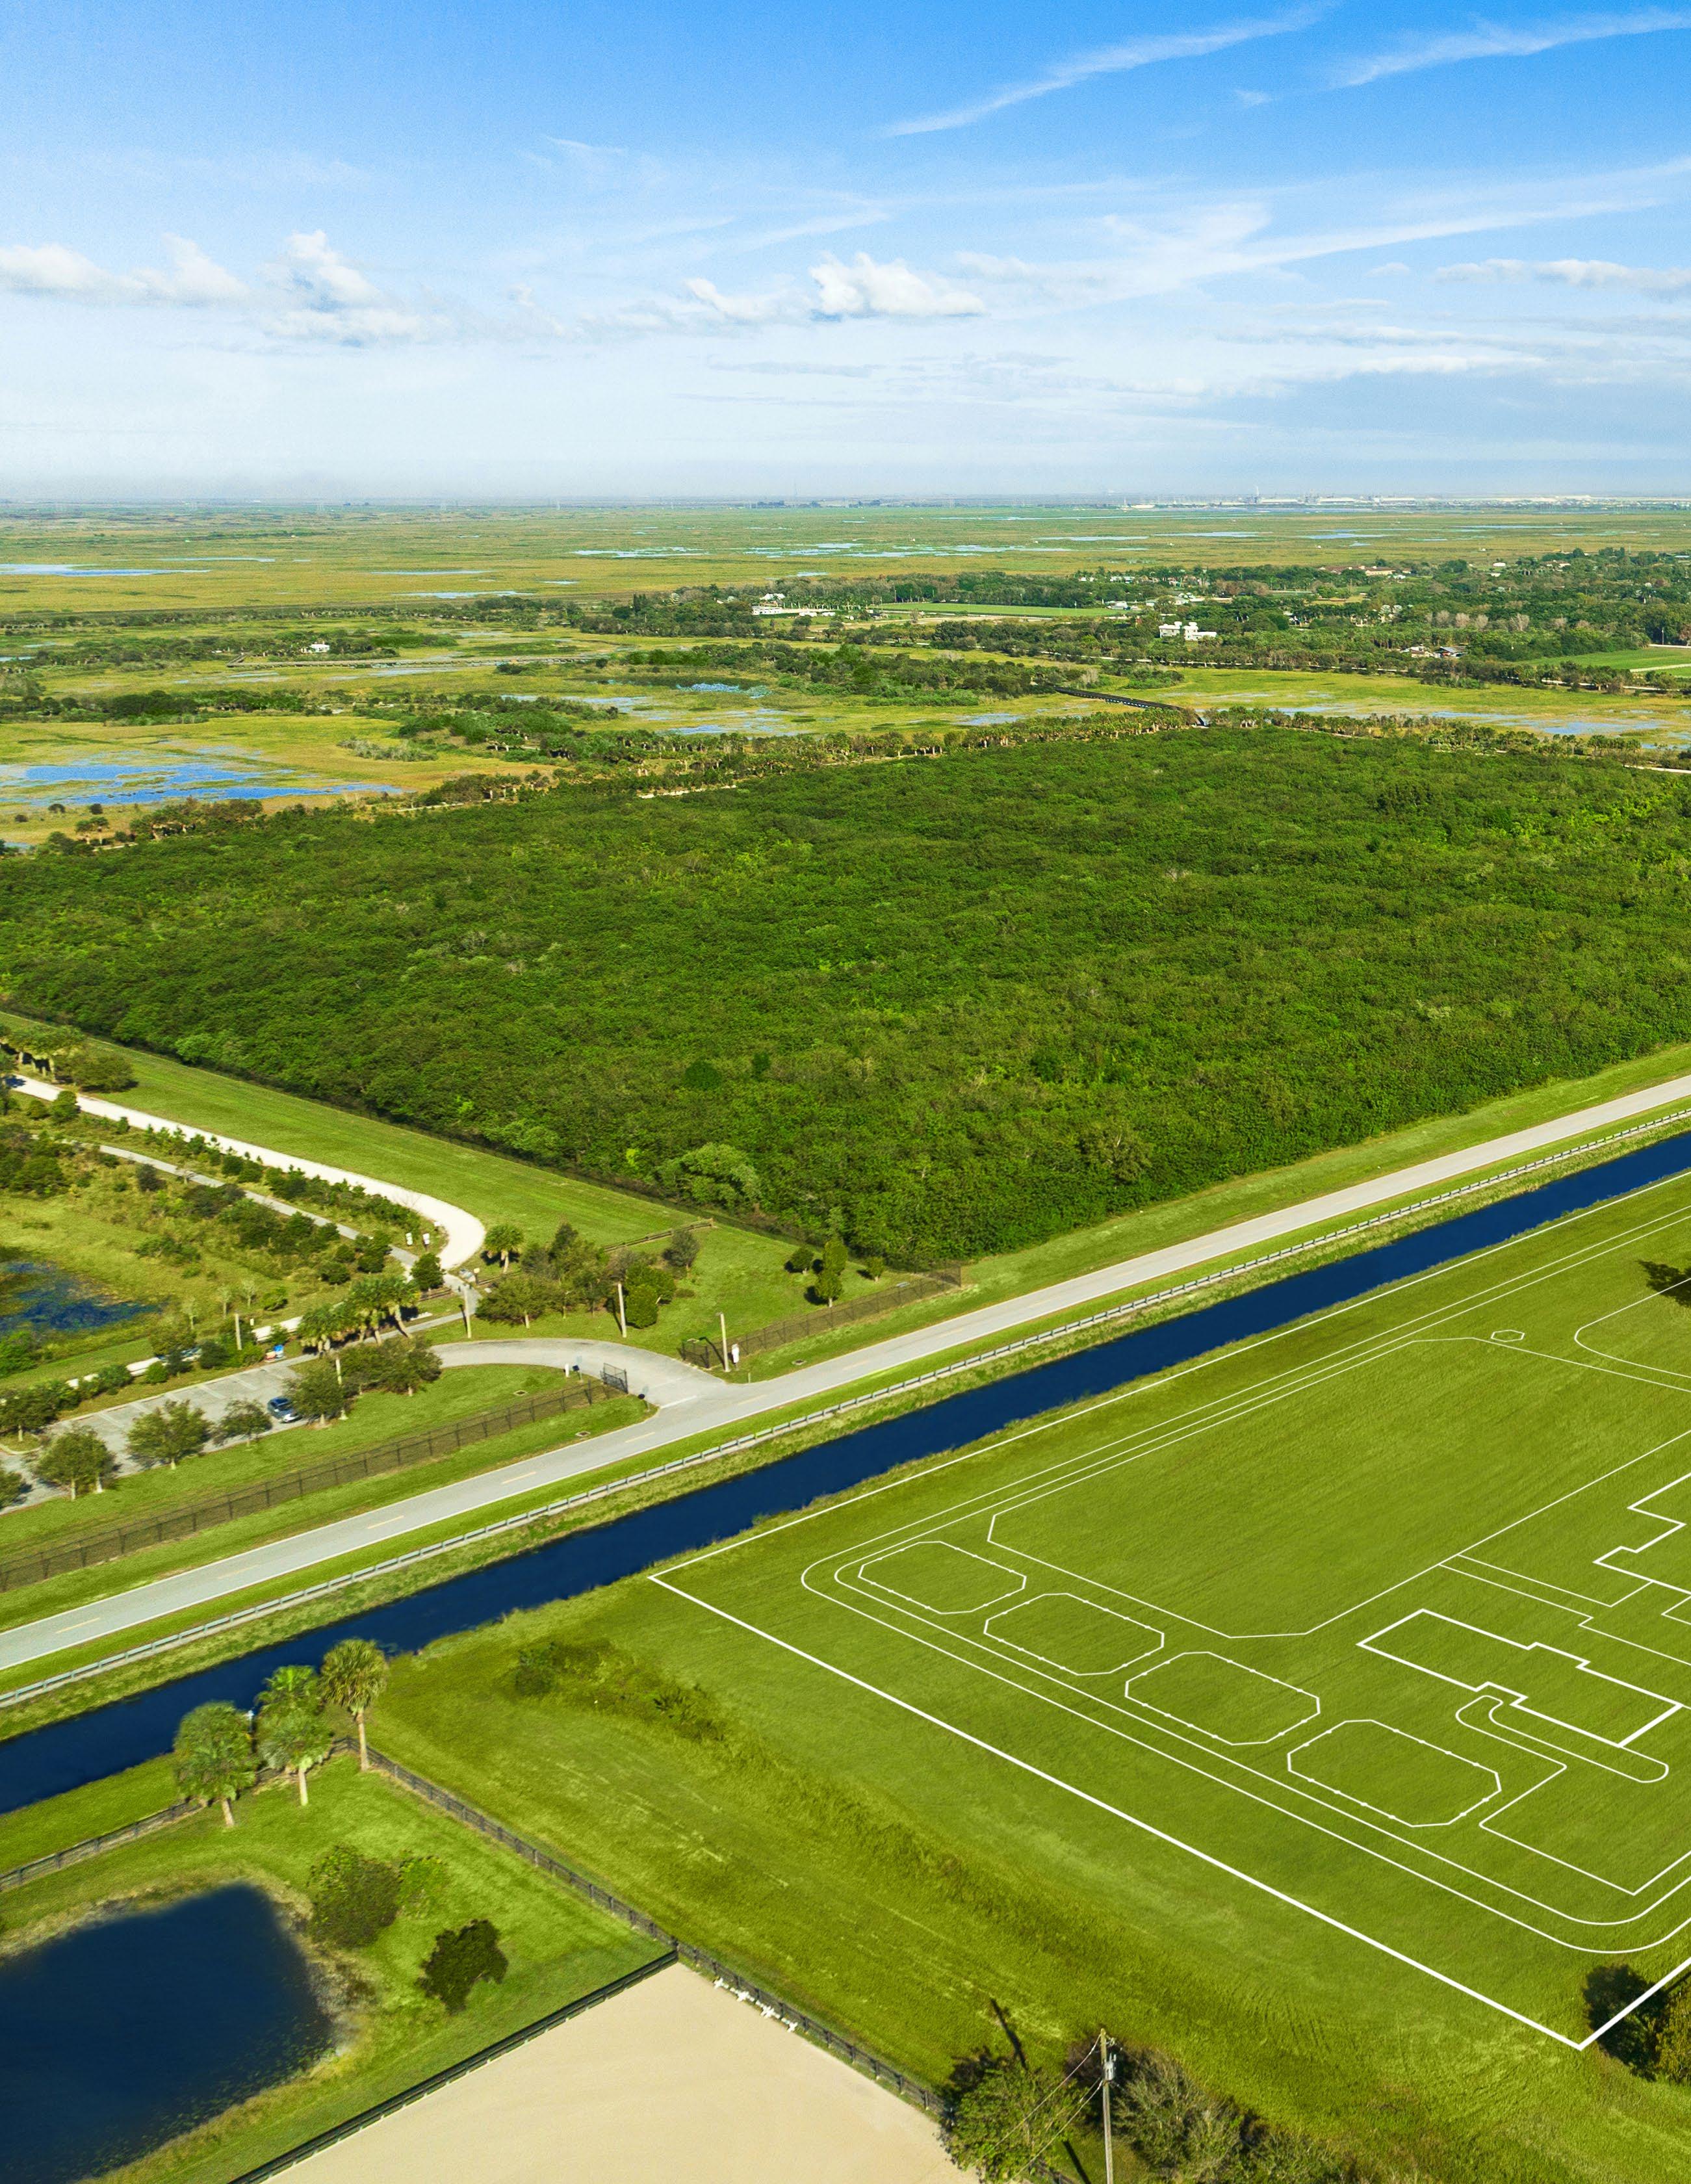
GROOMS RESIDENCE 2,605 SF+/-
WATERWAY
58 | LUXURY MARKET INSIGHT
MAIN RESIDENCE
8,088 SF+/-
RESIDENCE
10 STALL STABLE
9,022 SF+/-
COVERED WALKER 55’ DIAMETER
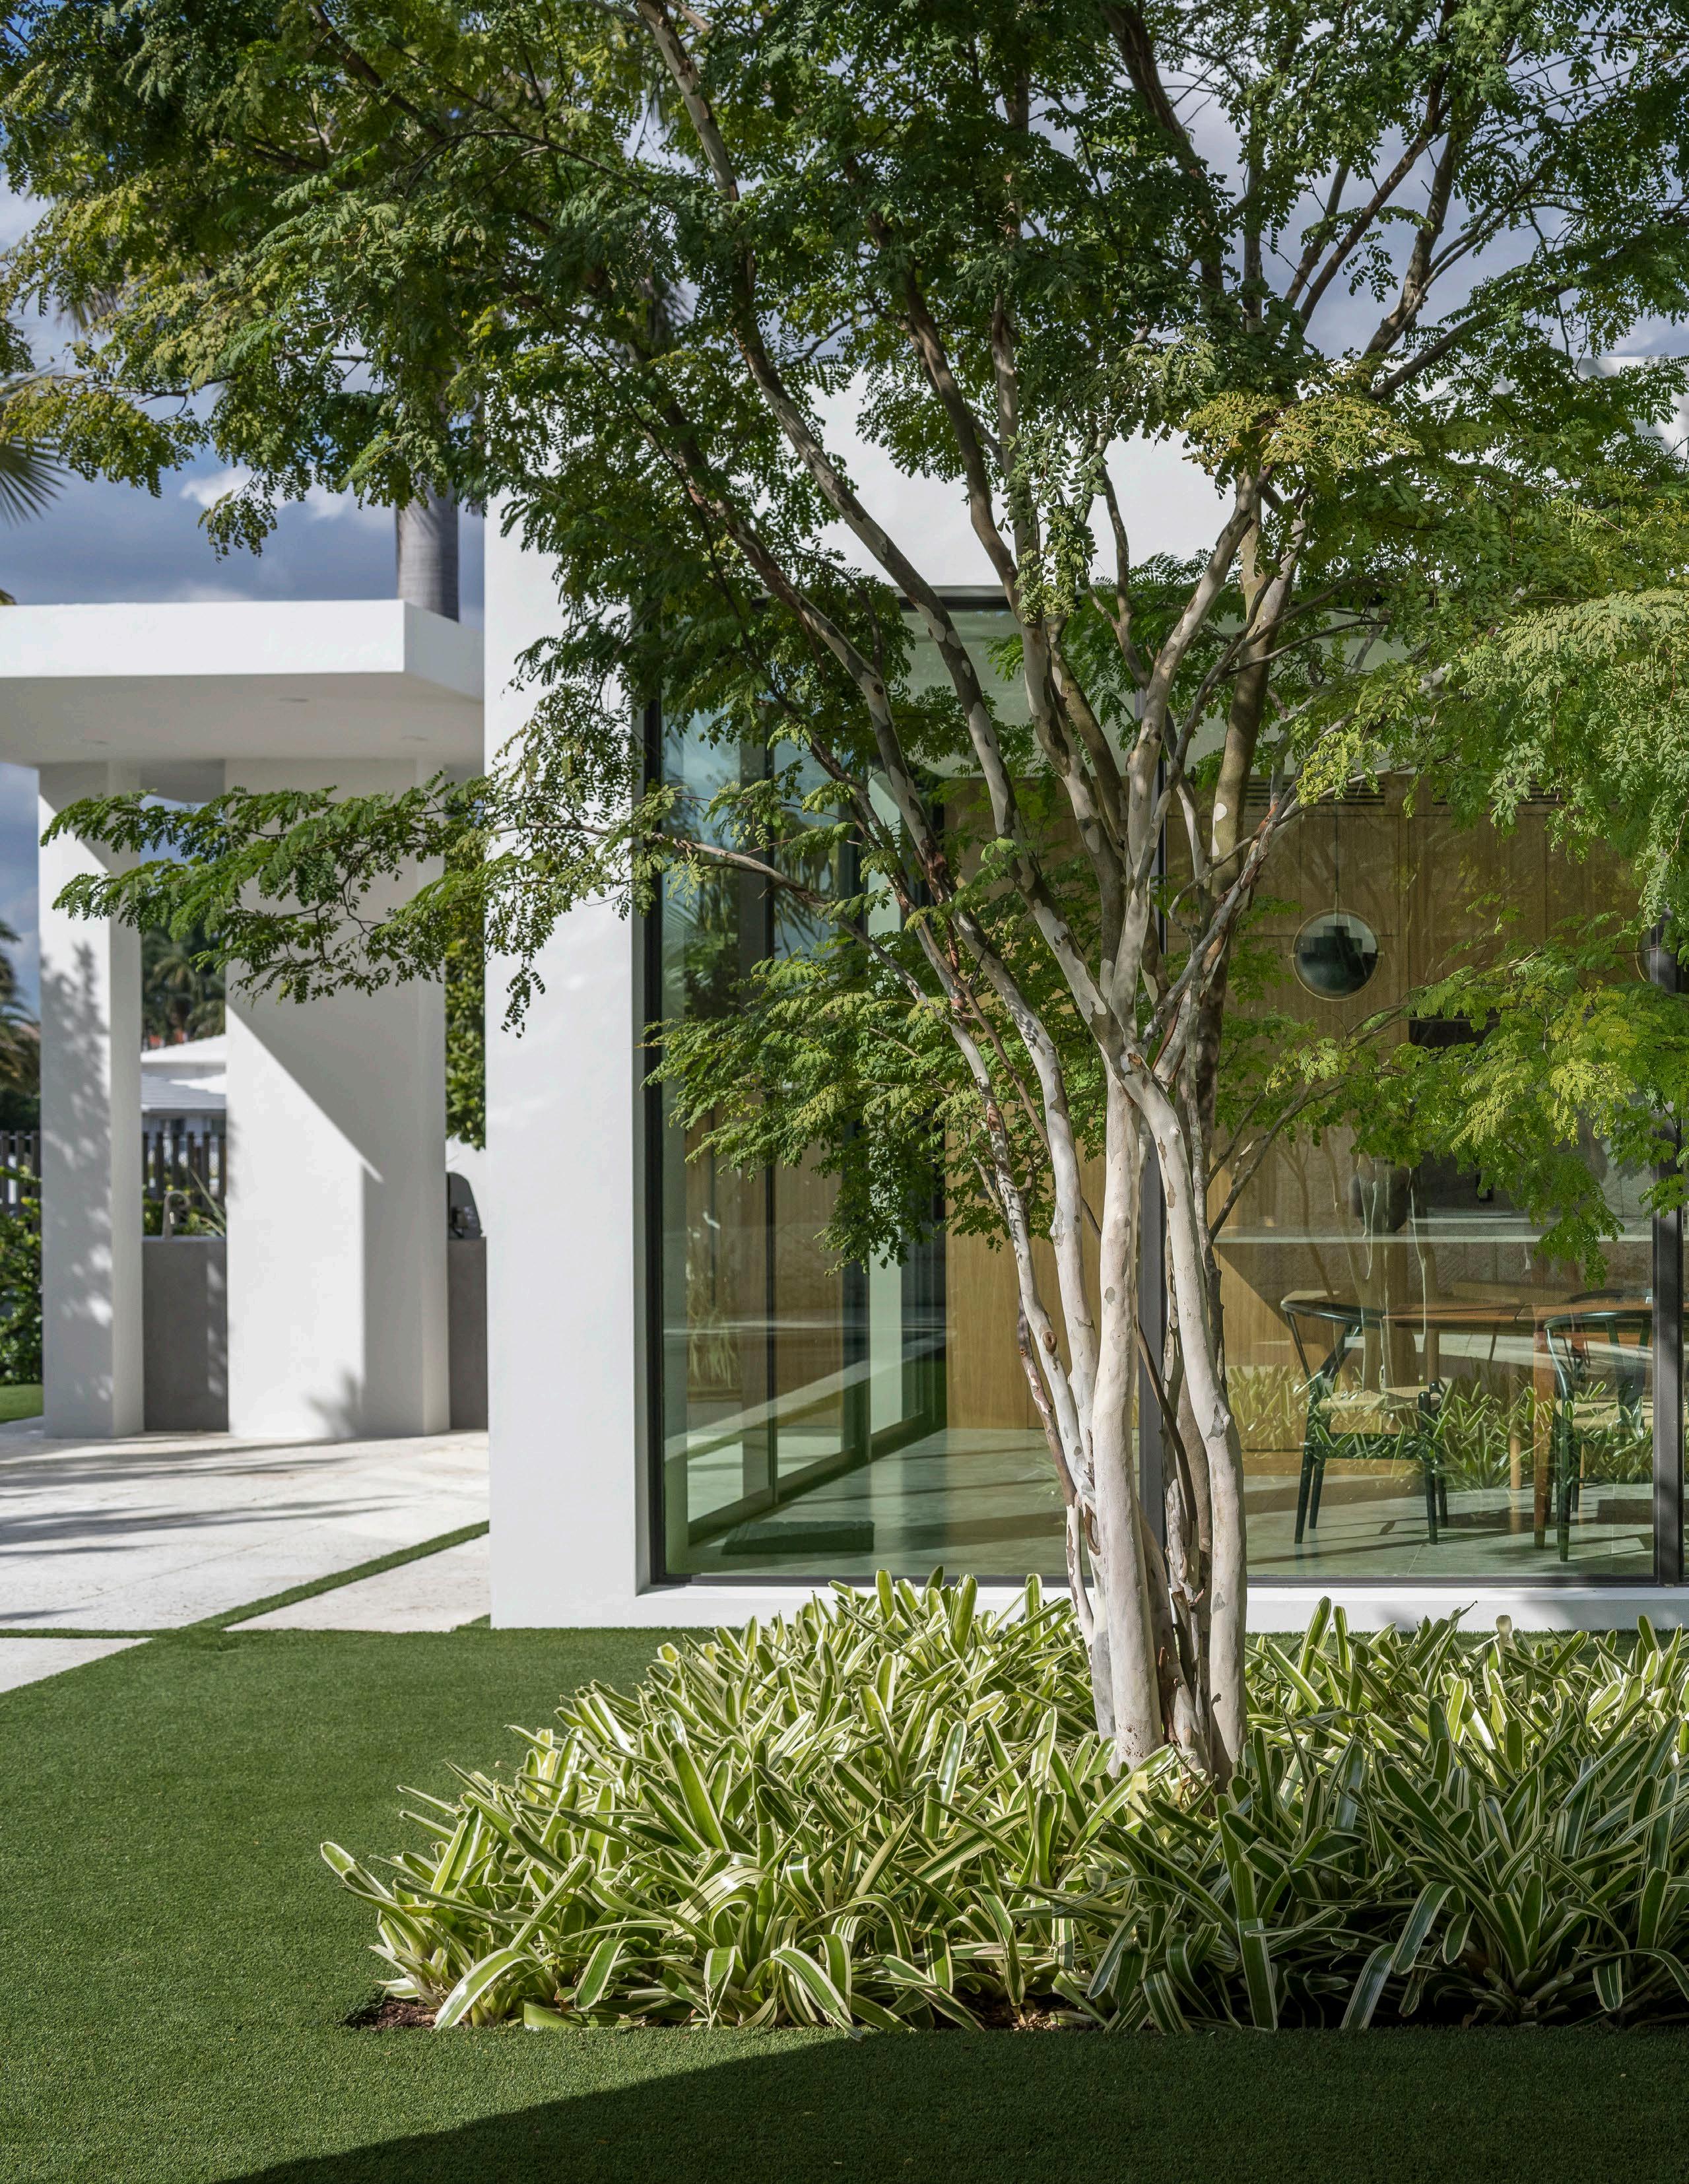
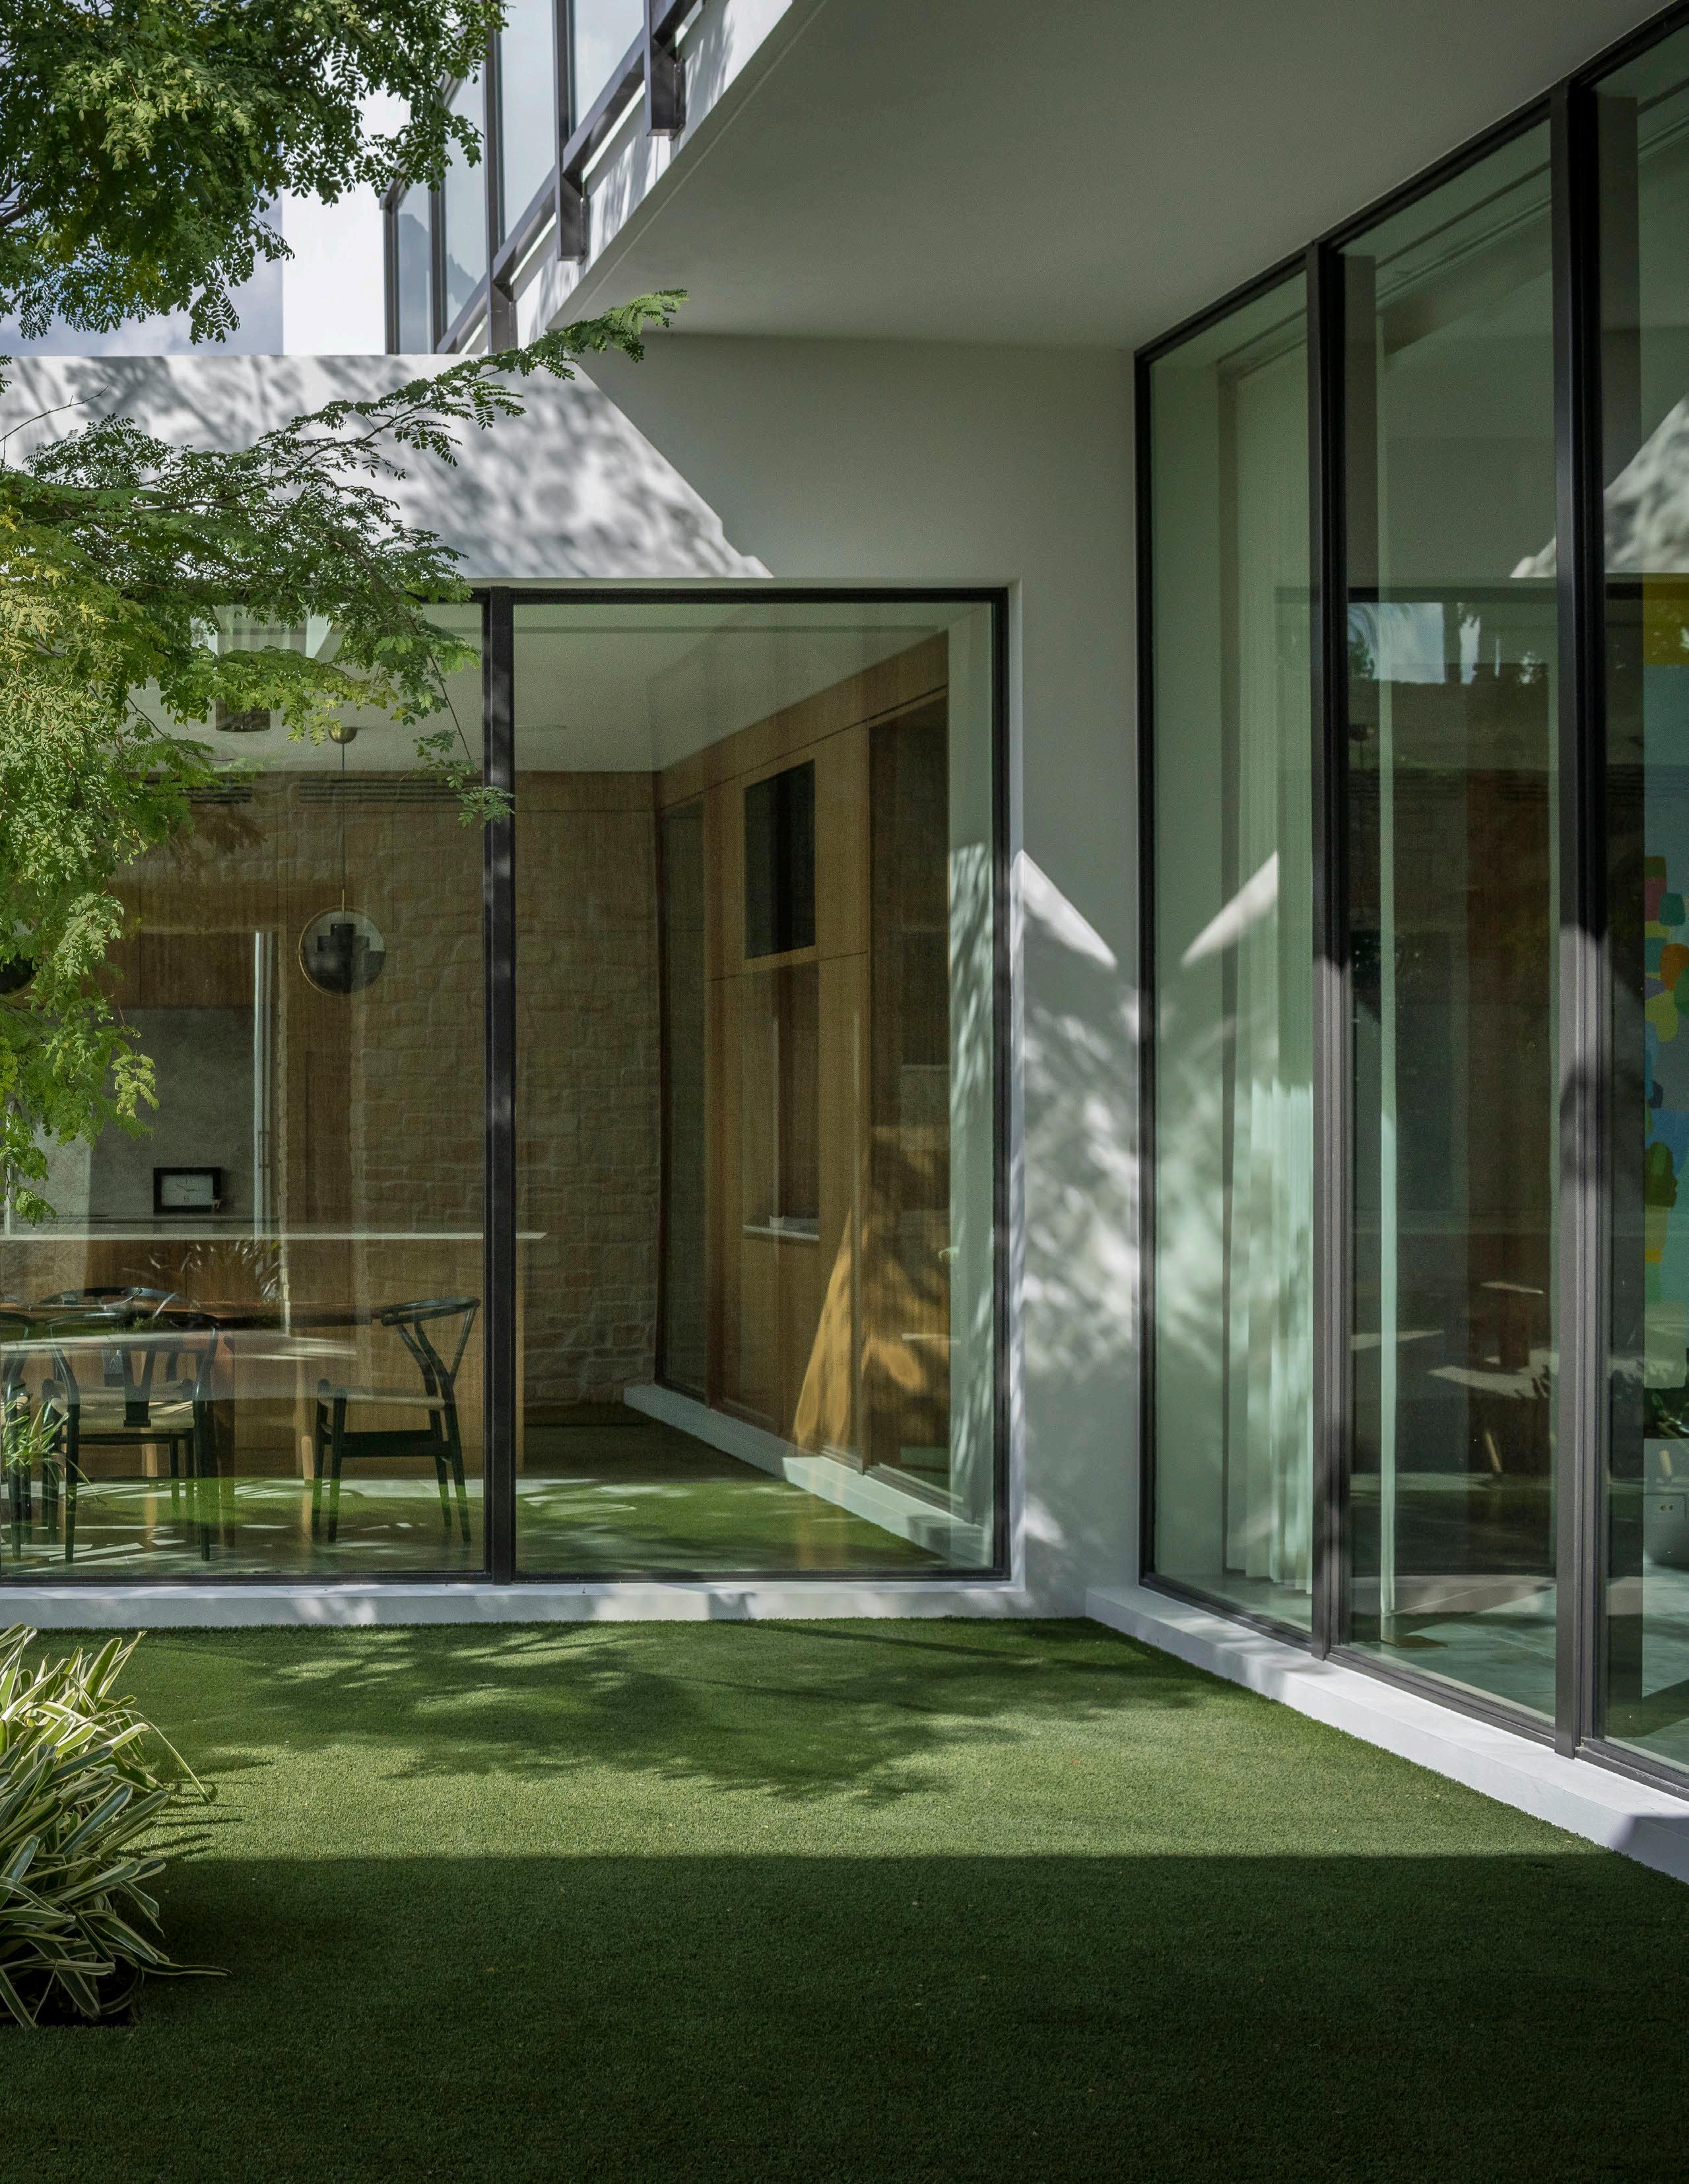
15756 Ocean Breeze Lane, Wellington, FL
Pre-Completion Equestrian Compound
5.05 Acres+/- | 16,354 SF+/- | 10 Beds | 8F/1H Baths
Bespoke Co-Exclusive: $11M
POND
BESPOKEREALESTATE.COM | 59
Q1 2022
+ MARKET BY SETTING Q1 2021 Q1 2022 LISTINGS VOLUME LISTINGS VOLUME OCEANFRONT 21 $478,469,000 33 $586,871,994 WATERFRONT 59 $1,034,255,000 45 $769,348,825 INLAND 9 $160,888,959 16 $258,769,075 TOTAL 89 $1,673,612,959 94 $1,614,989,894 BY VINTAGE NEW CONSTRUCTION 22 $369,830,000 18 $359,328,275 LAND/TEARDOWN 10 $153,045,000 17 $395,130,750 TURN-KEY 57 $1,150,737,959 59 $860,530,869 TOTAL 89 $1,673,612,959 94 $1,614,989,894 BY TYPE SINGLE FAMILY 20 $278,830,000 41 $649,527,694 TOWNHOUSE 69 $1,394,782,959 53 $965,462,200 TOTAL 89 $1,673,612,959 94 $1,614,989,894 60 | LUXURY MARKET INSIGHT
SO. FLORIDA $10M
LISTINGS VOLUME LISTINGS VOLUME PALM BEACH COUNTY 26 $654,409,959 38 $668,735,294 MIAMI-DADE COUNTY 63 $1,019,203,000 56 $946,254,600 TOTAL 89 $1,673,612,959 94 $1,614,989,894 BY LOCATION Q1 2021 Q1 2022 BY PRICE POINT $10M - $20M 65 $905,977,959 69 $775,135,200 $20M - $30M 18 $418,735,000 14 $412,719,594 $30M - $40M 1 $37,500,000 8 $268,772,600 $40M+ 5 $311,400,000 3 $158,362,500 TOTAL 89 $1,673,612,959 94 $1,614,989,894 BESPOKEREALESTATE.COM | 61
62 | LUXURY MARKET INSIGHT

2000 S. Ocean Drive, Hallandale Beach, FL An Elevated Escape 6,781 SF+/- | 5 Beds | 6F/1H Baths Bespoke Exclusive: $10M
properties comprised 36% of total sales volume in Q1 2022. BESPOKEREALESTATE.COM | 63
Oceanfront
Q1 2022
MARKET 2021 LISTINGS 2021 LISTINGS QUANTITY % 2021 VOLUME 2022 VOLUME VOLUME % ARIZONA 3 4 33.33% $51,000,000 $49,450,000 -3.13% CALIFORNIA 122 165 35.25% $2,034,942,976 $2,832,622,060 39.2% COLORADO 19 30 57.89% $290,900,751 $565,895,000 94.53% CONNECTICUT 4 2 -50.00% $79,878,720 $22,445,000 -71.9% DC 0 2 – $0 $21,000,000 –FLORIDA 107 144 34.58% $1,849,288,309 $2,366,664,794 27.98% HAWAII 15 16 6.67% $231,331,000 $257,430,000 11.28% IDAHO 1 0 – $12,000,000 $0 –MASSACHUSETTS 6 5 -16.67% $81,050,000 $52,950,000 -34.67% MONTANA 0 1 – $0 $12,900,000 –64 | LUXURY MARKET INSIGHT
NATIONAL $10M+
2021 LISTINGS 2021 LISTINGS QUANTITY % 2021 VOLUME 2022 VOLUME VOLUME % NEVADA 3 3 0.00% $46,850,000 $41,400,000 -11.63% NEW JERSEY 2 1 -50.00% $20,300,000 $11,500,000 -43.35% NEW YORK 51 105 105.88% $943,788,468 $1,651,913,605 75.03% RHODE ISLAND 1 0 – $10,000,000 $0 –SOUTH CAROLINA 0 1 – $0 $14,000,000 –TENNESSEE 2 0 – $29,000,000 $0 –TEXAS 1 1 0.00% $21,500,000 $10,800,000 -49.77% UTAH 7 2 -71.43% $89,761,819 $40,100,000 -53.33% WASHINGTON 2 5 150.00% $28,550,000 $55,880,000 95.73% WISCONSIN 0 1 – $0 $36,000,000 –TOTAL 346 488 41.04% $5,820,142,043 $8,042,950,459 38.19% BESPOKEREALESTATE.COM | 65
UNLOCK THE BESPOKE EXPERIENCE
Experience the change that Bespoke represents—and discover the results.
Over $8B in $10M+ Transactions.
INVITATION
Our client-centric brand breaks the rules and redefines industry standards; we believed you deserved better, so we built a data-driven platform that delivers unprecedented access to the most sophisticated resources and precisely pairs the world’s finest offerings with their most qualified buyers.
We would be grateful for the opportunity to be of value.
BESPOKEREALESTATE.COM
PROMISE
Purposefully work to over-deliver
Data-Driven. Tailored for $10M+ BESPOKEREALESTATE.COM
